Article

Regional Embeddedness of Green Economic Systems: Evidence from Mandatory Environmental Disclosures in EU Corporate Sustainability Reports


1
Department of Strategic Management and Enterprise Policy, Faculty of Economics and Business, University of Maribor, 2000 Maribor, Slovenia
2
Department of Business Law, Faculty of Economics and Business, University of Maribor, 2000 Maribor, Slovenia
*
Authors to whom correspondence should be addressed.
Sustainability 2026, 18(12), 6025; https://doi.org/10.3390/su18126025
Submission received: 29 May 2026 / Revised: 4 June 2026 / Accepted: 10 June 2026 / Published: 12 June 2026
(This article belongs to the Special Issue Green Economic Systems and Regional Sustainability Transitions)

Abstract

In recent years, non-financial reporting has become a central regulatory instrument for integrating environmental considerations into corporate accountability frameworks in the European Union. This study examines regional variation in mandatory environmental disclosures contained in corporate sustainability reports prepared under the Non-Financial Reporting Directive (NFRD) and the Corporate Sustainability Reporting Directive (CSRD). The analysis adopts a regional perspective, assuming that more economically developed regions are associated with greater environmental pressures and therefore exhibit more comprehensive environmental reporting practices. Regions are classified at the NUTS 2 level using GDP per capita in purchasing power standards (PPSs), enabling a systematic comparison between more and less developed regions across the EU. The empirical analysis relies exclusively on publicly available corporate sustainability reports and is deliberately limited to legally mandated environmental disclosures. A structured qualitative content analysis is applied to 20 companies operating across multiple EU Member States, with firms assigned to regions based on the location of their registered headquarters. The results provide exploratory evidence of a positive association between regional economic development (GDP per capita at the NUTS 2 level) and the comprehensiveness of mandatory environmental disclosures. The results provide empirically grounded insights into the strengths and limitations of mandatory sustainability reporting as a governance mechanism and contribute to ongoing debates on the capacity of the CSRD to enhance sustainability-oriented corporate accountability across diverse regional contexts within the EU.

1. Introduction

Non-financial reporting has become a central regulatory instrument for integrating environmental considerations into corporate accountability frameworks within the European Union (EU). The progressive materialisation of physical and transition climate-related risks, combined with escalating institutional investor expectations for standardised sustainability transparency [1], has repositioned mandatory environmental disclosure from a peripheral compliance exercise to a core mechanism of sustainable corporate governance [2,3]. The EU is regarded as the main initiator and has been at the regulatory vanguard of this transformation, systematically expanding the scope, granularity, and enforceability of mandatory non-financial reporting through successive legislative instruments of increasing ambition. The fundamental question this study addresses is whether the resulting mandatory environmental disclosures reflect the actual regional economic and environmental conditions in which firms operate, or whether they converge toward uniform, compliance-driven practices under harmonised EU regulation, independent of the regional context in which firms are embedded [4,5,6].
The first EU legislation to require certain companies to report non-financial information was the NFRD [7]. The NFRD established the first binding EU framework for approximately 11,700 large public interest entities, requiring disclosure of environmental matters (greenhouse gas emissions, energy consumption, water use, waste management, and biodiversity impacts) alongside social and governance information. However, following the NFRD’s shortcomings, the CSRD was subsequently adopted, providing greater detail on the information companies are required to report. The CSRD extends mandatory obligations to over 50,000 undertakings [8]. Note that subsequent EU Omnibus simplification initiatives, launched by the European Commission on 26 February 2025, proposed significant amendments to the CSRD framework. These initiatives include a narrower scope of application and postponement of certain reporting obligations for later reporting waves. These developments are outside the temporal scope of the present study and do not affect the FY2023 reporting framework analysed herein. The CSRD introduces numerous changes, including the introduction of ESRS standards as prescriptive topic-specific standards. The CSRD also introduces limited assurance by statutory auditors, requires machine-readable XBRL reporting, and operationalises double materiality (obliging firms to assess both the financial impact of environmental issues on the company and the company’s impact on the environment and society) [6,9,10]. Čufar et al. [2] and Primec [3] analyse the transformative governance implications of this legislative trajectory, emphasising the gap between compliance-oriented and substantively transformative sustainability reporting. Primec, Tičar, and Pastirk [11] extend this analysis to directors’ personal liability under the CSRD and the Corporate Sustainability Due Diligence Directive (CSDDD). This represents a governance dimension of particular relevance for firms in regions with weaker sustainability reporting cultures and less developed institutional support for ESG compliance [11,12].
Despite numerous efforts toward harmonisation and consistent reporting, extensive evidence and existing literature show that uniform legal requirements do not necessarily produce convergent reporting practice [13,14,15]. Previous research indicates that the level of sustainability reporting differs between firms in developed and less developed institutional contexts [16,17], between sectors subject to intensive environmental regulation and those with lower direct environmental footprints [18,19], and between firms adopting comprehensive GRI-aligned frameworks and those reporting under IFRS only or proprietary reporting systems. A robust theoretical explanation for this variation, one that accommodates the regional institutional context of firms and the independent role of sector-specific regulatory architecture, has remained elusive in the existing literature [20,21,22].
This study addresses three specific gaps. First, while cross-country comparisons of sustainability reporting are well established [15,22], systematic analysis at the sub-national NUTS 2 regional level remains rare despite growing evidence that regional institutional capacity is a powerful moderator of corporate environmental behaviour [23]. Second, the interaction between regional embeddedness and sector-specific regulatory architecture (encompassing the EU ETS, EU CO2 fleet standards, and financial sector climate stress-testing requirements) has received limited empirical attention as an independent moderator [13,18]. Third, the methodological challenge of cross-sector comparability in content analysis has not been operationalised in a sector-adjusted scoring framework applicable to mixed sector samples [24,25].
Against this background, the study provides a structured qualitative content analysis of the annual reports and sustainability reports of 20 EU companies spanning 2 regional clusters and 10 industrial sectors. The central research question is: Is regional economic development at the NUTS 2 level (as measured by GDP per capita) associated with the comprehensiveness of mandatory environmental disclosures, and how does sector-specific regulatory architecture moderate this relationship? Based on this research question, three contributions follow. The first NUTS 2-level cross-regional qualitative comparison of mandatory environmental disclosures, drawing directly on primary corporate report evidence. Second, a sector-adjusted five-category disclosure scoring rubric applicable to future large-scale CSRD monitoring studies. Third, policy-relevant findings on asymmetric CSRD compliance pressures and the strategic coordination of sectoral regulatory frameworks with ESRS data points. The paper proceeds as follows. Section 2 reviews the theoretical background and relevant literature. Section 3 describes the research design, sample, and content analysis methodology. Section 4 presents the empirical findings. Section 5 discusses their implications. Section 6 concludes [5,6,13].

2. Theoretical Basis and Legal Background

2.1. The EU Mandatory Disclosure Architecture

The EU’s mandatory non-financial reporting architecture has evolved through successive legislative interventions of increasing ambition and specificity [2,5]. The NFRD represented the first EU legislation requiring companies to report non-financial information [7]. However, its implementation gave companies substantial flexibility in choosing a reporting framework (such as GRI Standards, TCFD recommendations, UN SDGs, national codes, or proprietary frameworks) [20,21]. This created substantial differences and heterogeneity in reporting content and limited inter-firm comparability [3,26]. Barker and Eccles [27] argue that the absence of a single authoritative standard-setter for non-financial information has led to a range of incomparable disclosure practices. Due to these differences, reporting such information across individual companies was difficult to compare and challenging. This represents precisely the structural problem that the CSRD’s ESRS mandate is designed to resolve through prescriptive standardisation [2].
The CSRD represents a measure that ensured a qualitative shift in regulatory ambition [28]. With the introduction of the ESRS standards, the CSRD introduced a clear structure for reporting non-financial information. The ESRS consists of numerous granular and topic-specific standards addressing Climate Change (E1), Pollution (E2), Water and Marine Resources (E3), Biodiversity and Ecosystems (E4), and Resource Use and Circular Economy (E5), alongside social (S1–S4) and governance (G1) topics. From the perspective of reporting non-financial information, the CSRD thus moved from framework-based flexibility toward prescriptive standardisation [24]. The CSRD also introduces the double materiality principle, which requires firms to assess both the financial materiality of sustainability issues for the company and the impact materiality of the company’s activities on the environment and society [9]. Pizzi et al. [13] characterise this trajectory as a movement from de jure harmonisation and uniform legal requirements toward de facto standardisation in actual reporting practice, cautioning that the two do not automatically converge. Dragomir et al. [10] document the nascent and highly variable state of double materiality practice among early CSRD adopters. Bossut et al. [29] identify materiality assessment as the central interpretive challenge. The boundary between material and non-material sustainability information is inherently firm and sector-specific, introducing a structural source of variation that uniform regulatory standards cannot fully eliminate [29].
Baumüller and Grbenic [5] analyse the transition from the NFRD to the CSRD and find that the more demanding requirements will generate asymmetric compliance pressures across EU jurisdictions and firm size classes. Breijer et al. [14] situate this shift within the broader mandatory versus voluntary disclosure literature, finding that mandatory regimes increase comprehensiveness (as companies are required to report data and its content, but may also incentivise boilerplate compliance language that undermines substantive information quality). Fragidis and Papafloratos [30] analyse the implications of ESRS standardisation for information architecture. Their results indicate that the XBRL digital reporting mandate will substantially improve cross-firm comparability and public data accessibility, capabilities entirely absent from the current document-by-document reporting regime analysed in this study. The EU Taxonomy Regulation [31] complements the CSRD by establishing a classification system for sustainable economic activities, creating an additional layer of mandatory disclosure that further narrows firms’ reporting discretion. Čufar et al. [2] and Primec [3,11] provide the legal governance dimension, analysing the CSRD’s implications for transformative corporate governance and directors’ personal liability under the new EU legislative framework [2,3,11].

2.2. Regional Embeddedness and Corporate Environmental Disclosure

The concept of regional embeddedness, the anchoring of economic action in localised social, institutional, and relational structures, was developed in economic sociology by Granovetter [32]. In the sustainability transition literature, regional embeddedness encompasses regional innovation systems, local stakeholder networks, territorial governance arrangements, and the density of institutional infrastructure, all of which shape firm-level environmental strategy and reporting practices [19,23]. Geels [33] demonstrates that sociotechnical transitions toward sustainability are fundamentally shaped by regional institutional contexts, with multi-level dynamics determining whether sustainability innovations emerge and diffuse within specific territorial systems. Marquis and Lounsbury [34] provide complementary evidence that community-level institutional logics generate systematic variation in corporate environmental practices that cannot be explained by firm-level characteristics alone [33].
Empirical research consistently documents a positive association between regional economic development and the comprehensiveness of corporate environmental disclosure [17,19]. On the demand side, Eccles and Klimenko [1] document a marked shift in institutional investor expectations toward comprehensive and standardised sustainability disclosures. Such expectations are most strongly reflected in Western European and North American financial centres. Flammer [35] demonstrates positive investor reactions to corporate social responsibility. This is shown and linked primarily to developed capital markets, creating a reputational incentive for disclosure comprehensiveness that is structurally weaker in markets with lower ESG investor penetration. Chang et al. [36] document that the ESG and CSR value premium is highest in markets with stronger institutional investor presence. This highlights a direct link between the financial incentive for disclosure comprehensiveness and economic development. The theoretical underpinning for this demand-side mechanism draws on stakeholder theory [37], which predicts that firms facing more powerful and sustainability-oriented stakeholder coalitions will disclose more comprehensively. On the supply side, Miles and Ringham [25] find that environmental capacity management, which correlates with both firm size and regional institutional context, determines the breadth of disclosure category coverage. Andrades et al. [23] document analogous institutional pressure dynamics in the university sector, finding that regional contexts drive substantial variation in sustainability reporting adoption. Ng et al. [17] identify systematic ESG reporting disparities between firms in emerging and developed institutional environments, consistent with the regional embeddedness prediction [17].
Path dependency in disclosure trajectories reinforces interregional divergence over time. North [38] establishes that institutional frameworks evolve incrementally, with existing institutional arrangements constraining the range of feasible change and generating lock-in effects that persist across decades. This is reflected primarily in the fact that companies embedded in regions with established sustainability reporting cultures benefit from peer learning, industry association initiatives, and the normalising influence of leading reporters [19,24]. Guix et al. [39] show how changes in institutional logics shape the evolution of sustainability reporting frameworks. Zrnić et al. [19] review recent trends in reporting and identify regional institutional context as a key determinant of reporting trajectory. The theoretical implication is that, absent deliberate policy intervention, the CSRD’s uniform requirements risk amplifying rather than compressing existing inter-regional divergence. This concern was explicitly raised by Borghesi et al. [40] in their analysis of the need for a reformed ESG framework, acknowledging sectoral and regional heterogeneity. Breijer et al. [14] further confirm that mandatory disclosure regimes increase comprehensiveness but may amplify rather than reduce pre-existing inter-regional disparities if firms in less developed regions lack the organisational capacity for substantive compliance [14].

2.3. Sector-Specific Regulatory Architecture as a Theoretical Moderator

The regional embeddedness hypothesis established in this study requires qualification by the independent explanatory role of sector-specific regulatory architecture [13,18]. Several EU regulatory frameworks impose disclosure obligations that are materially more demanding than the baseline NFRD requirements. These obligations apply uniformly across all Member States, regardless of regional development level, constituting what institutional theory identifies as the highest-intensity coercive isomorphic pressures [26]. DiMaggio and Powell [26] established that coercive isomorphism, stemming from political influence and the need for legitimacy, leads to the homogenisation of organisational practices regardless of the firm’s national or regional context. This mechanism is intensified when the coercive pressure originates in supranational regulation, as in the case of EU-wide mandatory disclosure frameworks [41]. Boggini [42] documents how the CSRD and the EU cyber legal framework create layered reporting obligations for large undertakings, illustrating the growing complexity of sector-specific regulatory architecture that firms must navigate alongside the general CSRD framework.
Menicucci [18] demonstrates that sector-specific obligations for the banking sector, such as Pillar 3, SFDR, and ECB climate risk disclosures, are in some dimensions more comprehensive than the forthcoming CSRD requirements for general reporting. For financial institutions, the EU Taxonomy Regulation [31] additionally mandates the disclosure of the proportion of taxonomy-aligned activities in lending and investment portfolios, creating a layer of granular quantitative reporting requirements that applies uniformly across all Member States irrespective of regional economic development. Stubbs and Higgins [43] find that sector-specific regulatory pressures are perceived by stakeholders as more effective drivers of disclosure quality than cross-sector principles-based mandates. This increases long-term pressure on companies to engage in comprehensive reporting. The theoretical implication is that sector-level regulatory architecture operates as a partial substitute for regional institutional endowment. Where sector-specific EU-wide pressure is intensive and comprehensive, firms in less developed regions can achieve disclosure comprehensiveness levels comparable with those of firms in more developed regions. Where sector-specific pressure is absent or weak, the regional embeddedness differential operates unconstrained, generating large gaps in water, biodiversity, and Scope 3 reporting. This substitution effect has direct implications for the design of CSRD implementation and the targeting of capacity-building support [5,14,29].

2.4. Qualitative Content Analysis of Corporate Reports as a Research Method

A structured qualitative content analysis of corporate annual reports and sustainability reports was used to conduct the study. The method is well established in sustainability accounting and management research as the primary method for systematically examining corporate environmental disclosures [44,45,46]. The method involves systematically applying a predetermined analytical framework to the textual and numerical content of corporate documents. This ensures reproducible cross-firm comparison while preserving sensitivity to context and sector-specific disclosure logics. The authors establish explicit coding rules, inter-rater reliability assessment, and transparent procedures for handling ambiguous cases as the methodological foundations of rigorous content analysis [45]. Kohlbacher [44] specifically emphasises the suitability of using content analysis in case study research. Stemler [46] reviews applications across social science disciplines. Bell et al. [47] situate content analysis within ‘qualitative dominant mixed methods’ research designs.
In the context of studying sustainability reporting, qualitative content analysis has been used to examine GRI-aligned disclosures [21], TCFD implementation quality [45], the evolution of reporting frameworks [22,39,48], and the reporting boundary of sustainability entities [25]. Isaksson and Steimle [21] critically assess what GRI reporting reveals about corporate sustainability practice, emphasising that disclosure comprehensiveness and substantive environmental performance are positively but imperfectly correlated. Bose [48] traces the evolution of ESG reporting frameworks. The study highlights the importance of the shift in sustainability reporting from voluntary to mandatory disclosure as the primary driver of increased comprehensiveness over the past two decades. Mio et al. [24] provide a comprehensive methodological treatment of sustainability reporting research, identifying the management of cross-sector materiality as the central challenge in comparative content analysis studies [9,24,25]. A methodological caveat of central importance is that content analysis measures the comprehensiveness of disclosed information rather than the quality of underlying environmental performance. Depoers et al. [49] document that voluntary and mandatory disclosures diverge systematically, with firms strategically managing their disclosed GHG data, and Hummel and Schlick [50] demonstrate that the relationship between sustainability performance and disclosure is positive but imperfect, mediated by legitimacy concerns. These findings reinforce the interpretive caution applied throughout this study: high disclosure scores reflect comprehensive reporting practice, not necessarily superior environmental outcomes [49,50].

3. Research Methodology and Research Sample Used

3.1. Research Design

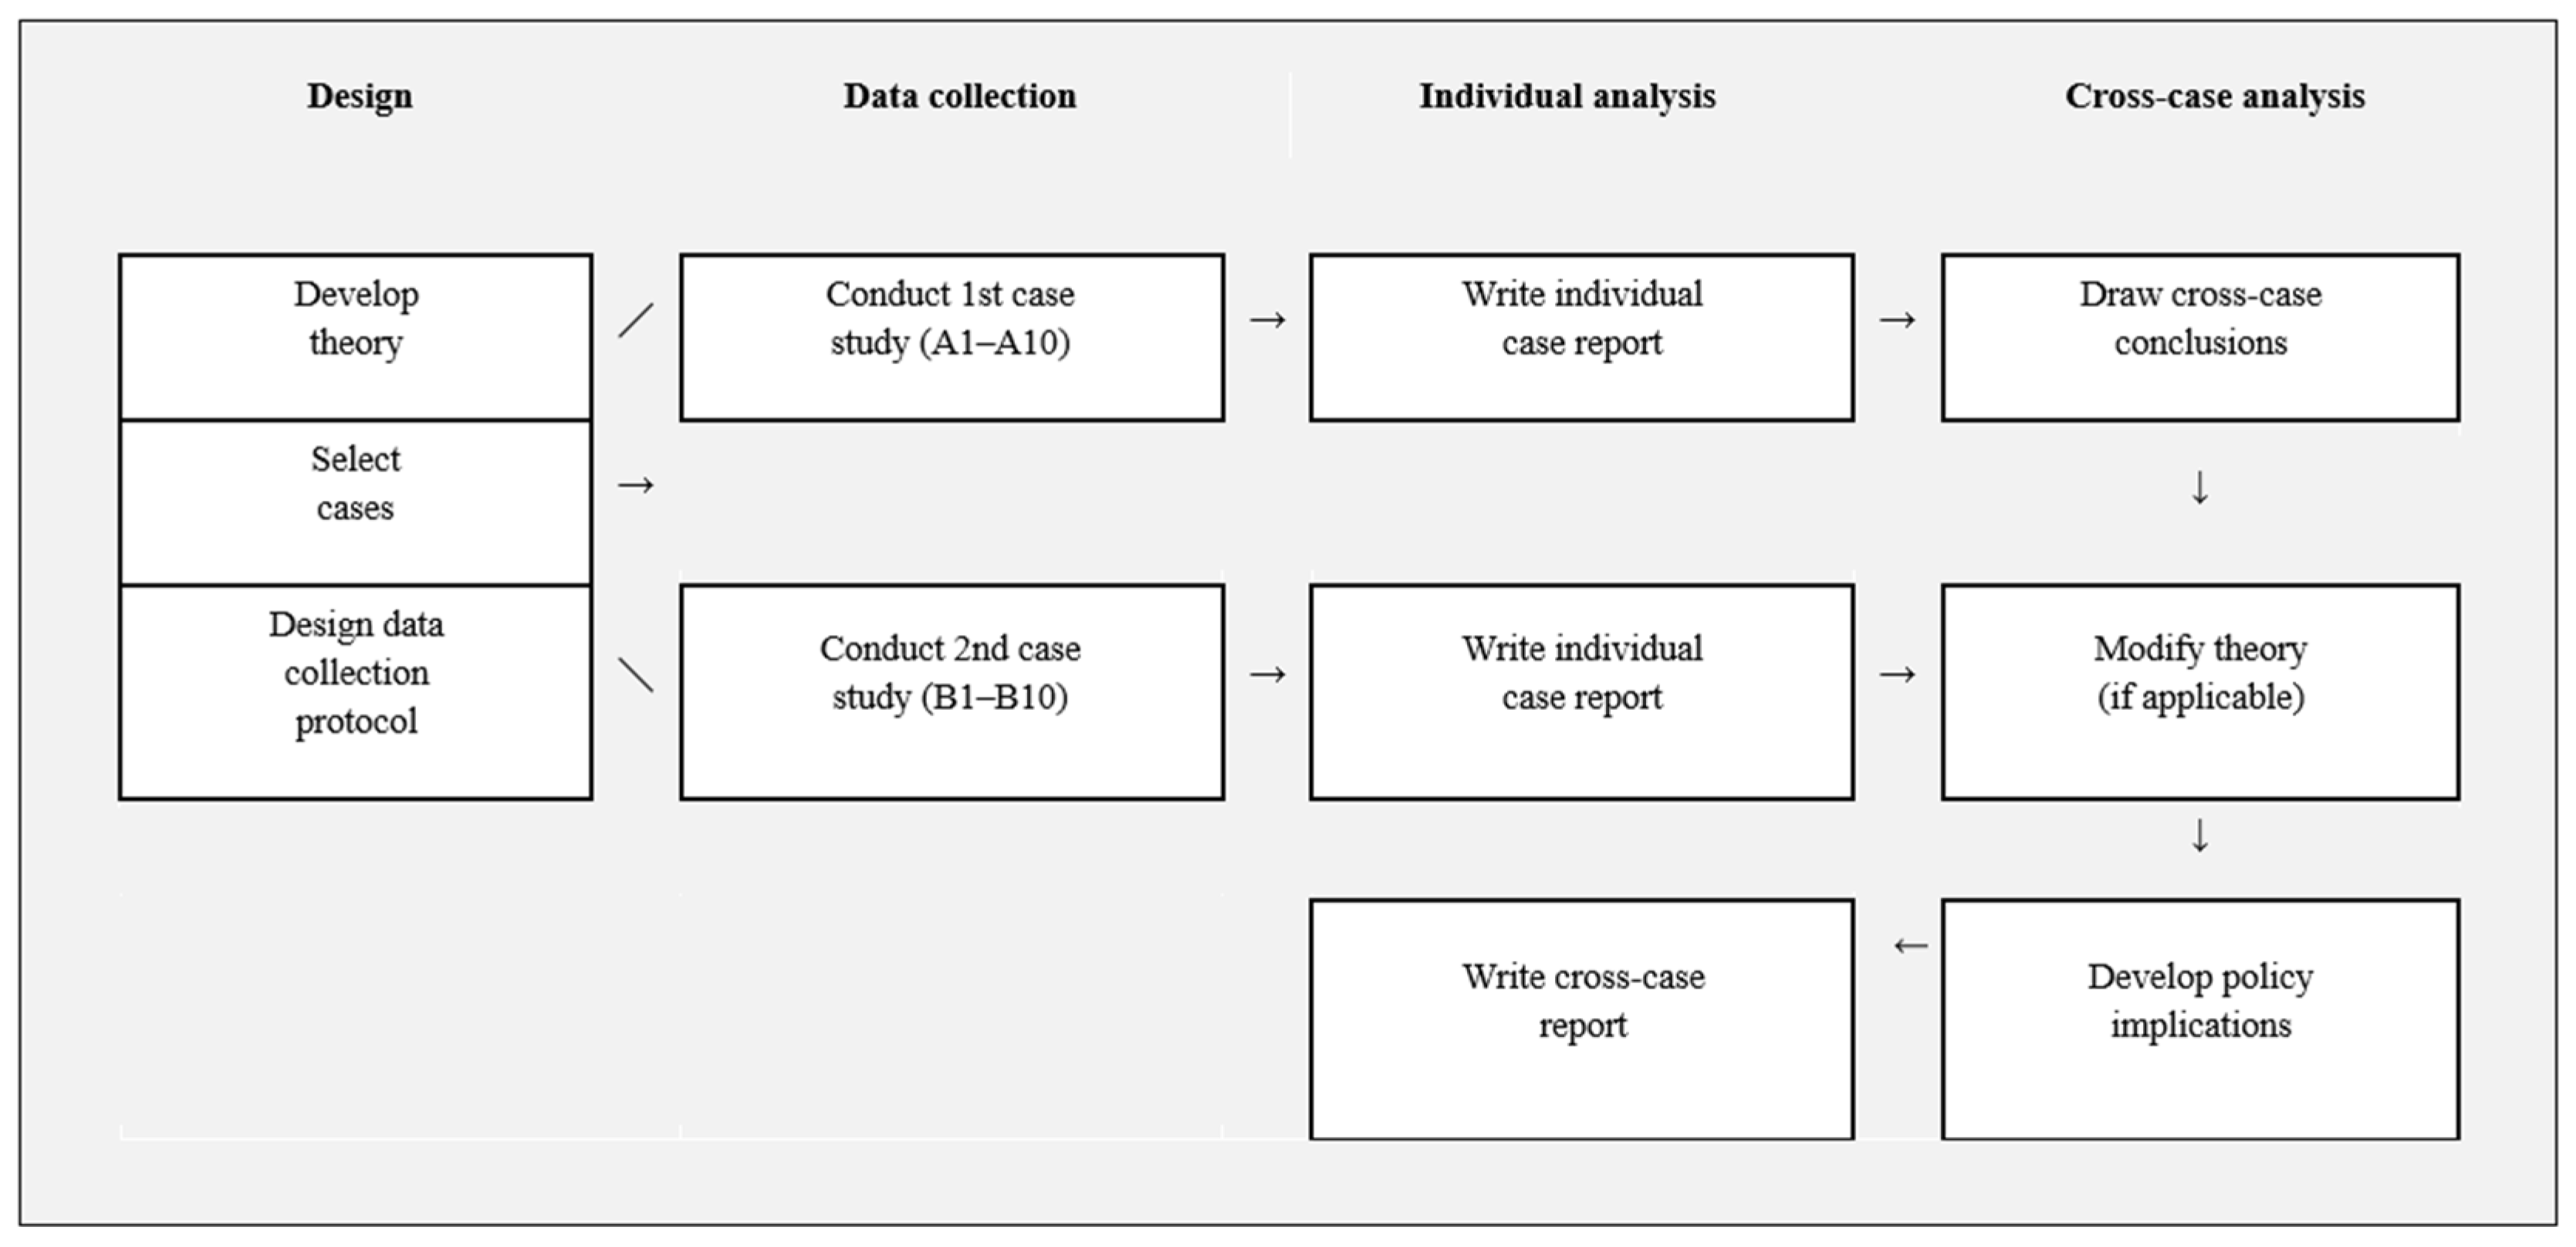
The study was prepared using a structured comparative case study design [47,51]. This combined qualitative content analysis of corporate reports with a disclosure scoring framework. This approach enables systematic cross-firm and cross-regional comparison while preserving the contextual richness necessary for sector-specific interpretation. In the study, cross-case comparison provides the basis for pattern matching and theoretical elaboration, consistent with Yin’s [51] multiple-case, holistic case study approach. Bell et al. [47] situate this within the tradition of dominant qualitative mixed-methods research. In the latter, the numerical scores derived from qualitative document coding serve as a systematic basis for cross-case comparison rather than as targets of statistical inference. [44,45,46]. Figure 1 presents the overall multiple-case study design, adapted from Yin [51], illustrating the sequential logic from theory development and case selection through individual case analysis to cross-case conclusions and policy implications.
The research design is primarily abductive in its logic: the analysis begins with empirical observations from qualitative content analysis, which are then interpreted against existing theoretical frameworks (regional embeddedness [32] and institutional theory [41]), generating refined theoretical propositions rather than deductively testing pre-specified hypotheses. This approach is consistent with the methodological framework of Yin [51] and Bell et al. [47].

3.2. Analytical Framework

The five disclosure categories analysed in this study are directly aligned with the mandatory environmental reporting requirements of the NFRD and the ESRS topic standards enacted under the CSRD. The precise ESRS mapping is as follows [30]:
  • ESRS E1 addresses Climate Change and covers greenhouse gas emissions.
  • ESRS E2 addresses Pollution.
  • ESRS E3 covers Water and Marine Resources.
  • ESRS E4 addresses Biodiversity and Ecosystems.
  • ESRS E5 covers Resource Use and Circular Economy, including waste generation and management.
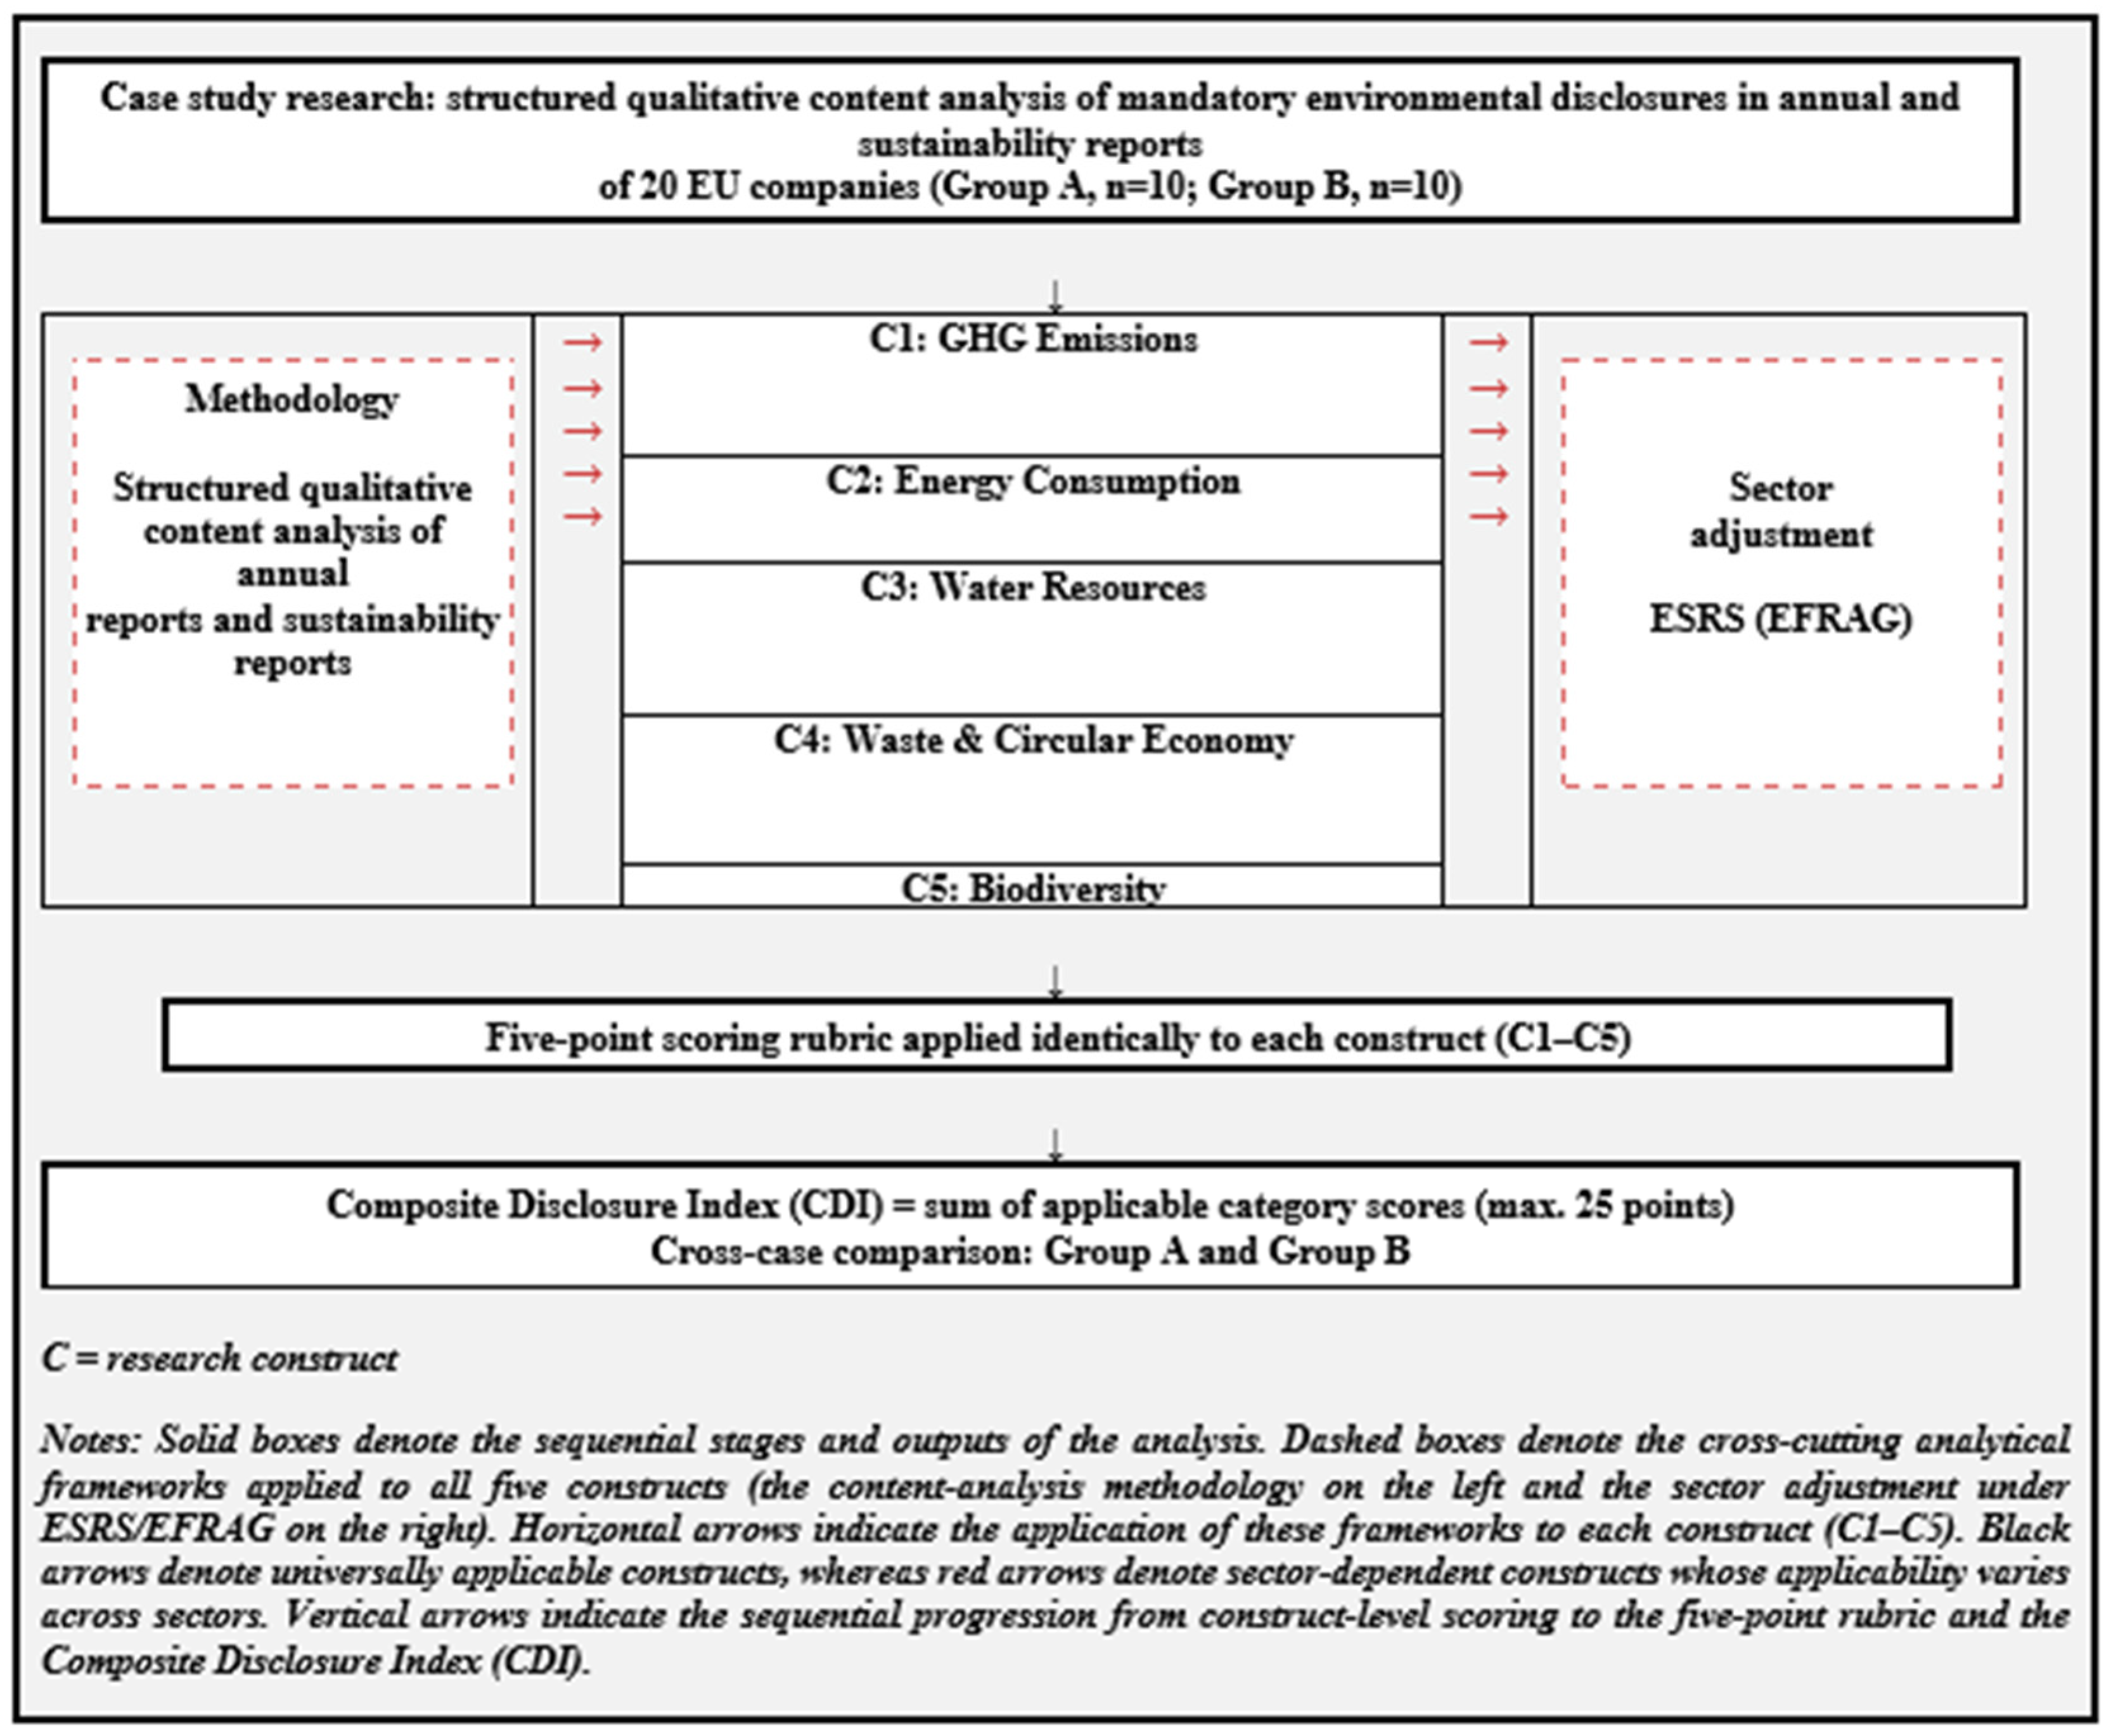
The five analytical categories in this study are therefore: (1) GHG Emissions, corresponding to ESRS E1 (Climate Change); (2) Energy Consumption, corresponding to the energy use dimension embedded within ESRS E1 and the cross cutting resource efficiency objective; (3) Water Resources, corresponding to ESRS E3; (4) Waste and Circular Economy, corresponding to ESRS E5; and (5) Biodiversity, corresponding to ESRS E4. This mapping ensures that the scoring framework is directly applicable to the CSRD and is consistent with the information architecture of the ESRS as analysed by Fragidis and Papafloratos [30]. Each category is measured on a scale from 0 to 5, based on five key categories, designed to reflect progressive levels of disclosure sophistication (corresponding to the implicit hierarchy from NFRD minimum requirements to the CSRD/ESRS standard of quantified and targeted reporting [6,20,21,22]). Environmental disclosures were scored on an indicative five-point scale assessing disclosure depth, quantitative specificity, methodological transparency, comparability, and external reliability. The criteria were applied with sectoral proportionality and allowed for functionally equivalent standards, frameworks, assurance practices, or measurement approaches. For each environmental topic, a score of 1 indicated only general qualitative references, while a score of 2 reflected limited quantitative disclosure, such as total figures without meaningful breakdown. A score of 3 was assigned where the company provided more detailed quantitative information, including relevant breakdowns, selected indicators, or partial alignment with recognised reporting categories. A score of 4 reflected advanced disclosure, including topic-specific targets, risk assessment, recognised tools or frameworks, or evidence of systematic management. A score of 5 was reserved for comprehensive, methodologically transparent and externally supported disclosure, including full topic coverage, quantified targets, and alignment with ESRS or equivalent recognised frameworks. This scoring logic was applied to GHG emissions and energy disclosures under ESRS E1, water disclosures under ESRS E3, biodiversity disclosures under ESRS E4, and waste and circular-economy disclosures under ESRS E5. For financial sector firms (banking, insurance, reinsurance), the Water and Waste categories are excluded as non-material under the EFRAG double materiality logic; scores are rescaled proportionally to the 25-point scale (see the sector applicability adjustment below). The composite disclosure index is the sum of the five applicable category scores. The maximum number of points is 25 for firms where all five categories are applicable. The uniform weighting of all five categories reflects the CSRD’s treatment of the five ESRS environmental topic standards as coequal mandatory reporting domains. No category is privileged in the composite index. The rubric was developed prior to data collection and applied consistently across all firms and all documents without post hoc adjustment. Cross-sector qualitative content analysis faces the structural challenge that certain disclosure categories are materially irrelevant for specific sectors. This risk and concern in the use of content analysis are highlighted in numerous studies, which identify it as a central limitation of uniform scoring frameworks in prior sustainability reporting research [24,25]. For financial institutions (banking, insurance, reinsurance), direct operational water withdrawal and waste generation are negligible relative to financed and insured activities. Consequently, assessing their disclosures from this perspective would lead to misleading cross-sector comparisons. Therefore, in the study, sector applicability adjustment was carried out on the basis of the double materiality logic of the ESRS and EFRAG [9]. The latter emphasises that material sustainability topics differ fundamentally between financial and industrial entities. For financial sector firms, the water and waste categories are excluded from the composite index; the adjusted index is calculated over the three remaining applicable categories (GHG, Energy, Biodiversity; maximum 15 points) and rescaled proportionally to the 25-point scale to enable cross-group mean comparisons. Figure 2 presents the complete research design, integrating the multiple-case study framework with the qualitative content analysis methodology. The design is structured around five research constructs (C1–C5), each corresponding to one of the five ESRS-aligned environmental disclosure categories. The constructs are drawn from the mandatory reporting requirements of the NFRD and the forthcoming CSRD, ensuring direct alignment with the regulatory framework under investigation [2,6].

3.3. Sample Construction

The sample was constructed through purposive theoretical sampling [47,51]. The selection of France and Germany (Group A) and Poland (Group B) was deliberate, following the maximum variation sampling logic of Patton [52]: FR10 and DE21 anchor the EU’s upper regional development range (165–180% of EU-27 GDP/cap), while the Polish NUTS 2 regions span 50–105%, enabling variation both across and within groups. This design is methodologically appropriate for detecting whether regional embeddedness effects exist. It was selected with the aim of maximising variation across three dimensions:
(1)
regional development level, operationalised as NUTS 2 GDP per capita in purchasing power standards as a percentage of the EU 27 average;
(2)
industrial sector, with the aim of ensuring the full range of sector-specific regulatory contexts relevant to mandatory environmental disclosure for the study, and
(3)
mandatory reporting framework, to include firms subject to NFRD/DPEF, GRI Standards, IFRS financial statements, and proprietary frameworks.
For the selection of an appropriate sample for the study, it was necessary for companies to: (i) be headquartered in an EU NUTS 2 region with available Eurostat GDP per capita data; (ii) be subject to NFRD or equivalent mandatory non-financial reporting obligations for the FY2023 reporting year; and (iii) have at least one publicly available sustainability relevant document covering FY2023 or the most recent preceding reporting period. The empirical sample comprised twenty companies divided into two regional groups. Group A included ten undertakings from highly developed Western European NUTS 2 regions: five French companies from Île-de-France, covering the automotive, financial services, energy/utilities, heavy industry, and technology/IT sectors, and five German companies from Oberbayern, covering the automotive, financial services, pharmaceuticals, chemicals/materials, and reinsurance sectors. Group B included ten Polish undertakings from less developed Central and Eastern European NUTS 2 regions, namely Śląskie, Mazowieckie, Dolnośląskie, Łódzkie, and Podkarpackie. These companies covered energy/utilities, mining/extraction, steel/heavy industry, industrial recycling, retail/distribution, manufacturing, automotive components, food/agriculture, and financial services. The sample was therefore structured to compare sustainability-related disclosure practices between highly developed Western European regions and less developed Central European regions, while maintaining sectoral diversity across both groups.
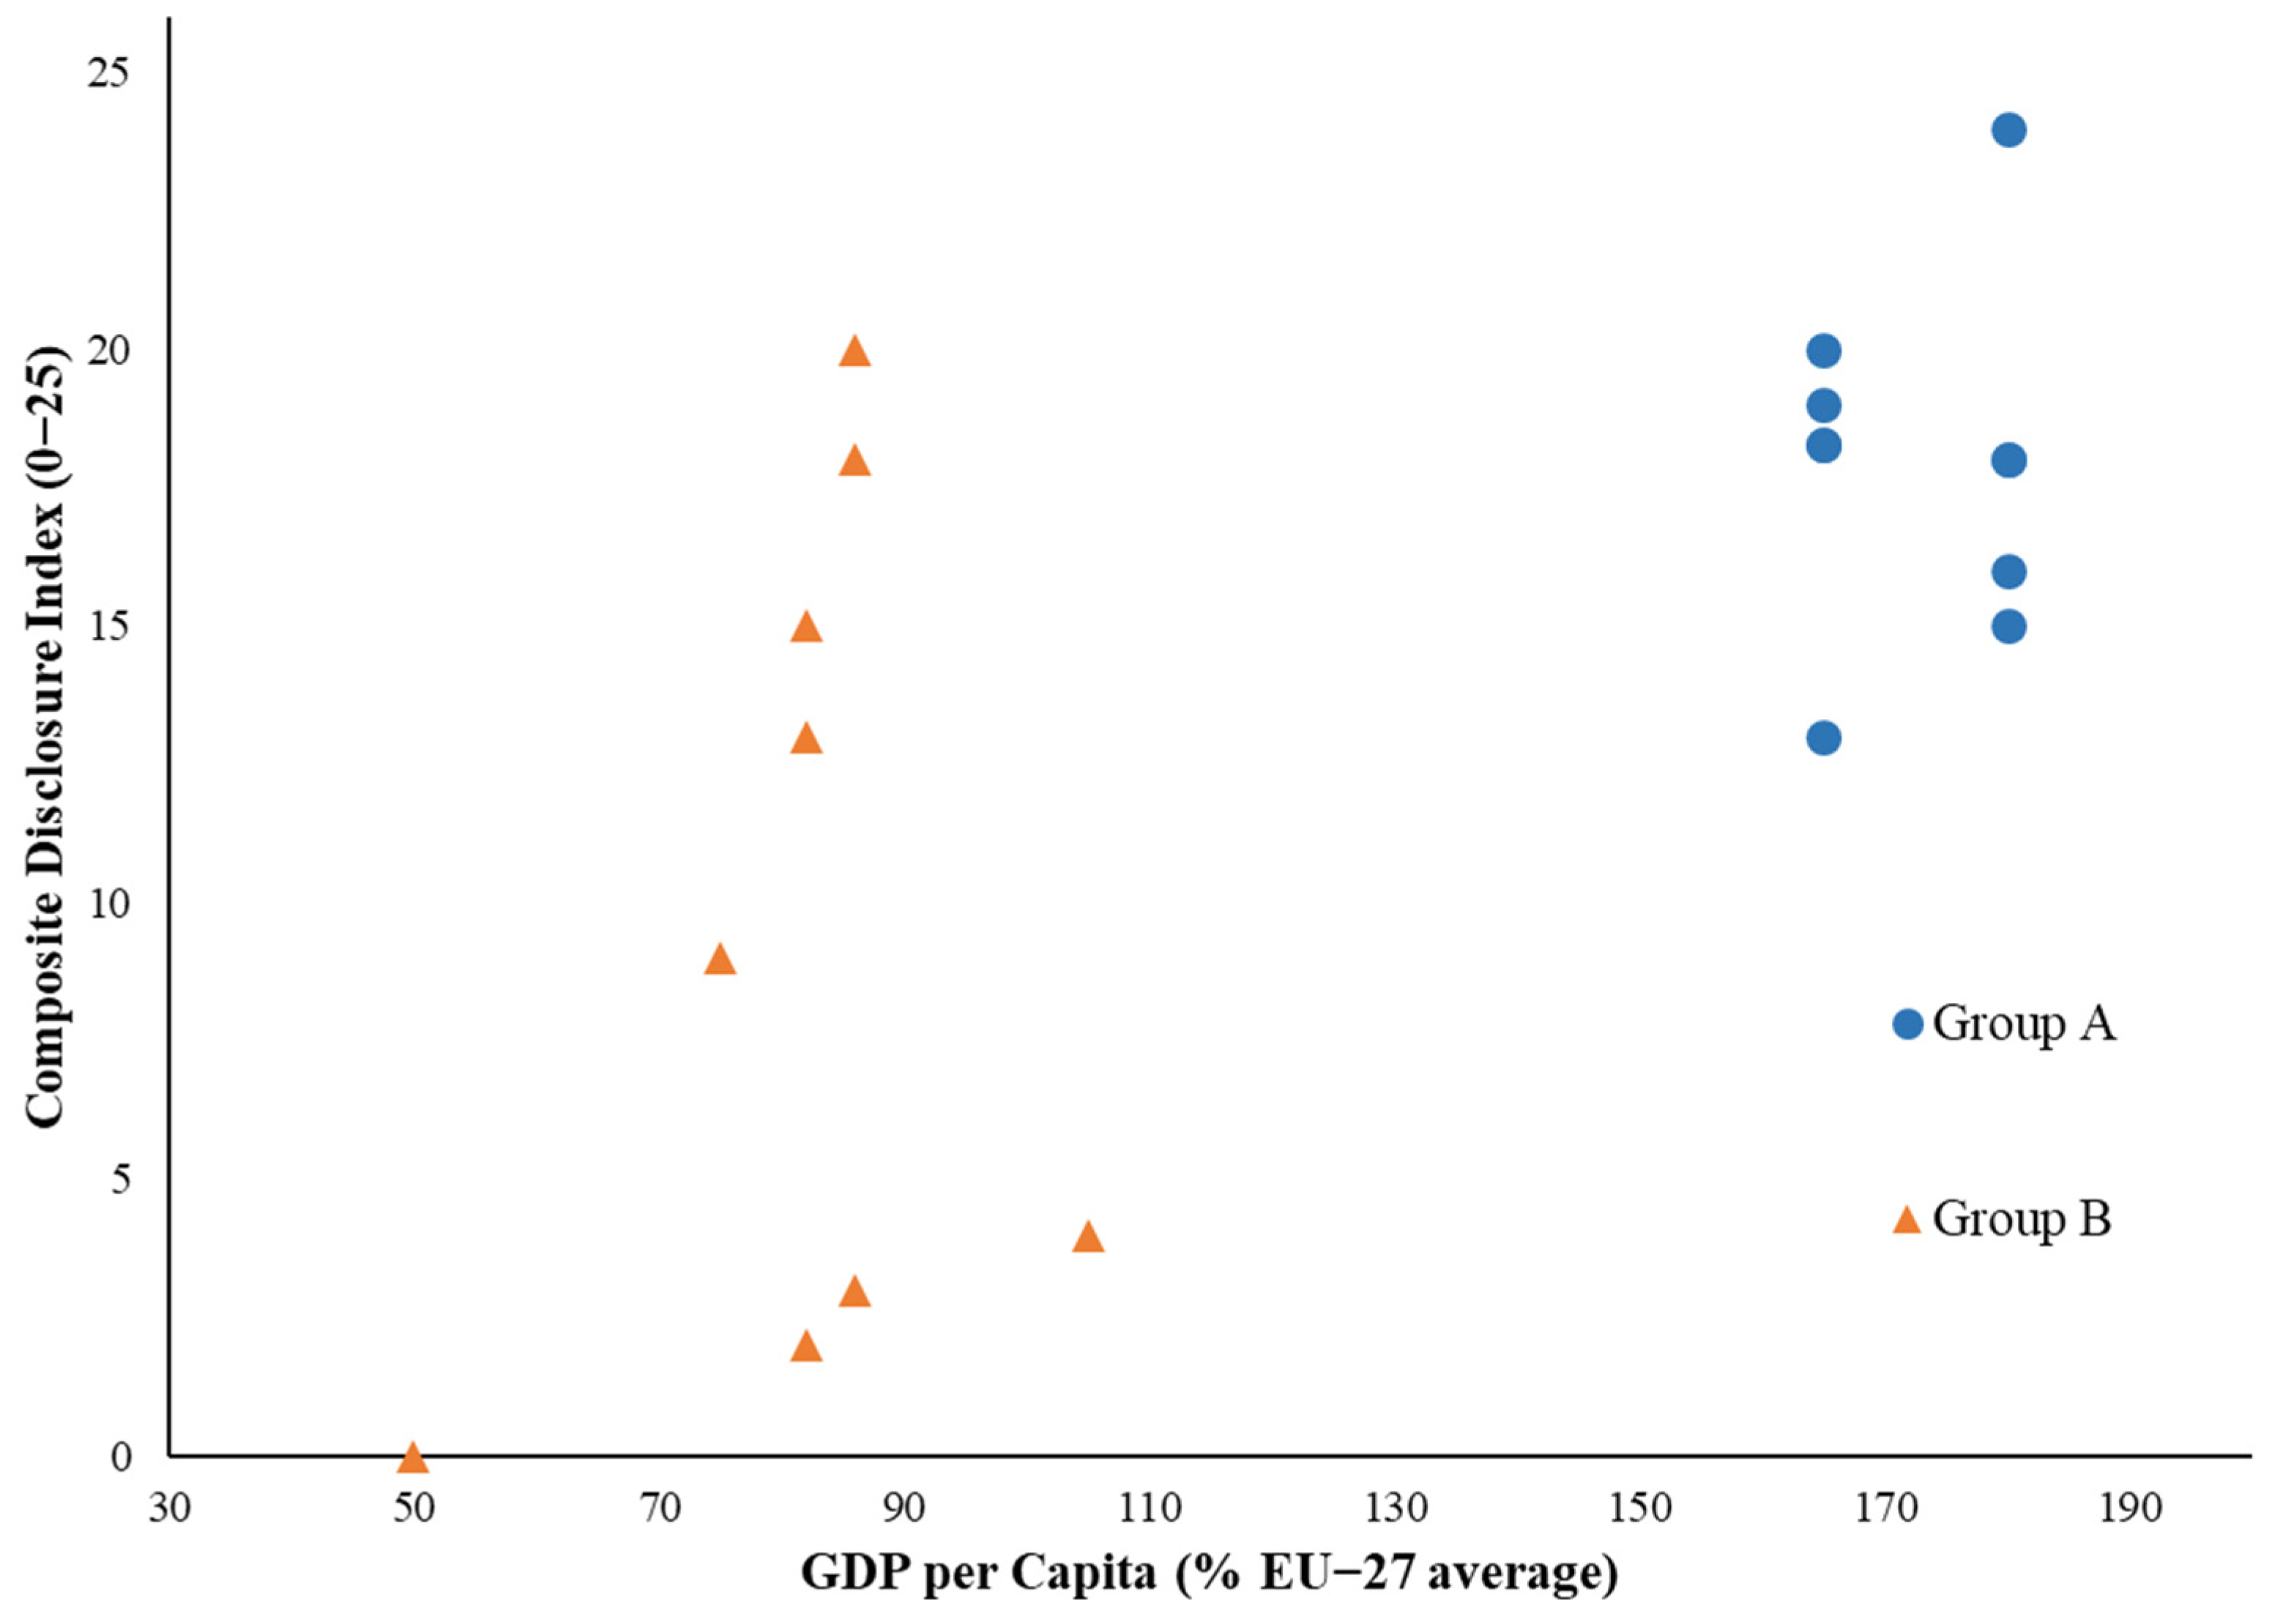
The regional classification consisted of two groups: Group A and Group B. Group A (n = 10) comprises firms headquartered in Île-de-France (FR10, GDP/cap approximately 180% of the EU-27 average) or Oberbayern (DE21, approximately 165%). These are two of the EU’s most economically developed NUTS 2 regions, characterised by sophisticated capital markets, institutional sustainability ecosystems, and intensive sustainability reporting cultures. Group B (n = 10) comprises firms in Polish NUTS 2 regions: Śląskie (PL22, approximately 86%), Dolnośląskie (PL51, approximately 82%), Łódzkie (PL71, approximately 70 to 80%), Podkarpackie (PL82, approximately 50%), and Mazowieckie (PL92, approximately 105%). Boryszew Capital Group (PL92, approximately 105% of GDP/cap) occupies an A/B boundary position given the near-EU-average GDP/cap of its headquarters region. It should be noted that the Group A/Group B contrast reflects not only NUTS 2 GDP per capita variation but also country-level institutional differences, including national sustainability reporting traditions, regulatory enforcement quality, and capital market maturity (France and Germany vs. Poland). These country-level factors cannot be fully disentangled from the regional embeddedness mechanism in the present study design and are explicitly acknowledged as a limitation in Section 5.
All data were collected exclusively from publicly available corporate documents, including annual reports, integrated annual reports, sustainability reports, non-financial statements, and universal registration documents. These documents are consistent with the study’s focus on the mandatory disclosure that regulated entities are legally required to make publicly accessible [2,6]. Where a company published both an integrated report and a separate GRI-aligned sustainability report, the more comprehensive and granular document was selected as the primary source. Each primary document was coded using the five-category analytical framework and the scoring rubric. Coding was conducted at the document level, drawing on the full text of the analysed document, including quantitative data tables, narrative sections, GRI Content Indices, verification statements, and appendices. Each category was assigned a single score representing the highest level of disclosure evidenced in the document. To further strengthen the internal validity of the coding procedure, the primary researcher independently re-coded the complete sample of 20 documents in a second coding period (T2), conducted at least 4 weeks after the initial coding round (T1). This temporal separation was designed to minimise memory effects and ensure that T2 scores reflected independent re-engagement with the source documents rather than recall of prior judgements, consistent with the test–retest protocol recommended by Krippendorff [45]. Where T1 and T2 scores diverged by more than one point on the 0–5 scale for any category-firm pair, the primary researcher conducted a structured re-review of the relevant source document sections and assigned a final adjudicated score. The test–retest procedure confirmed overall coding consistency across both rounds, with all discrepancies of >1 point resolved through structured re-review of the source documents. The final scores used in the analysis reflect these adjudicated values where applicable [45].

4. Research Results

4.1. Composite Disclosure Index: Overview and Inter-Group Pattern

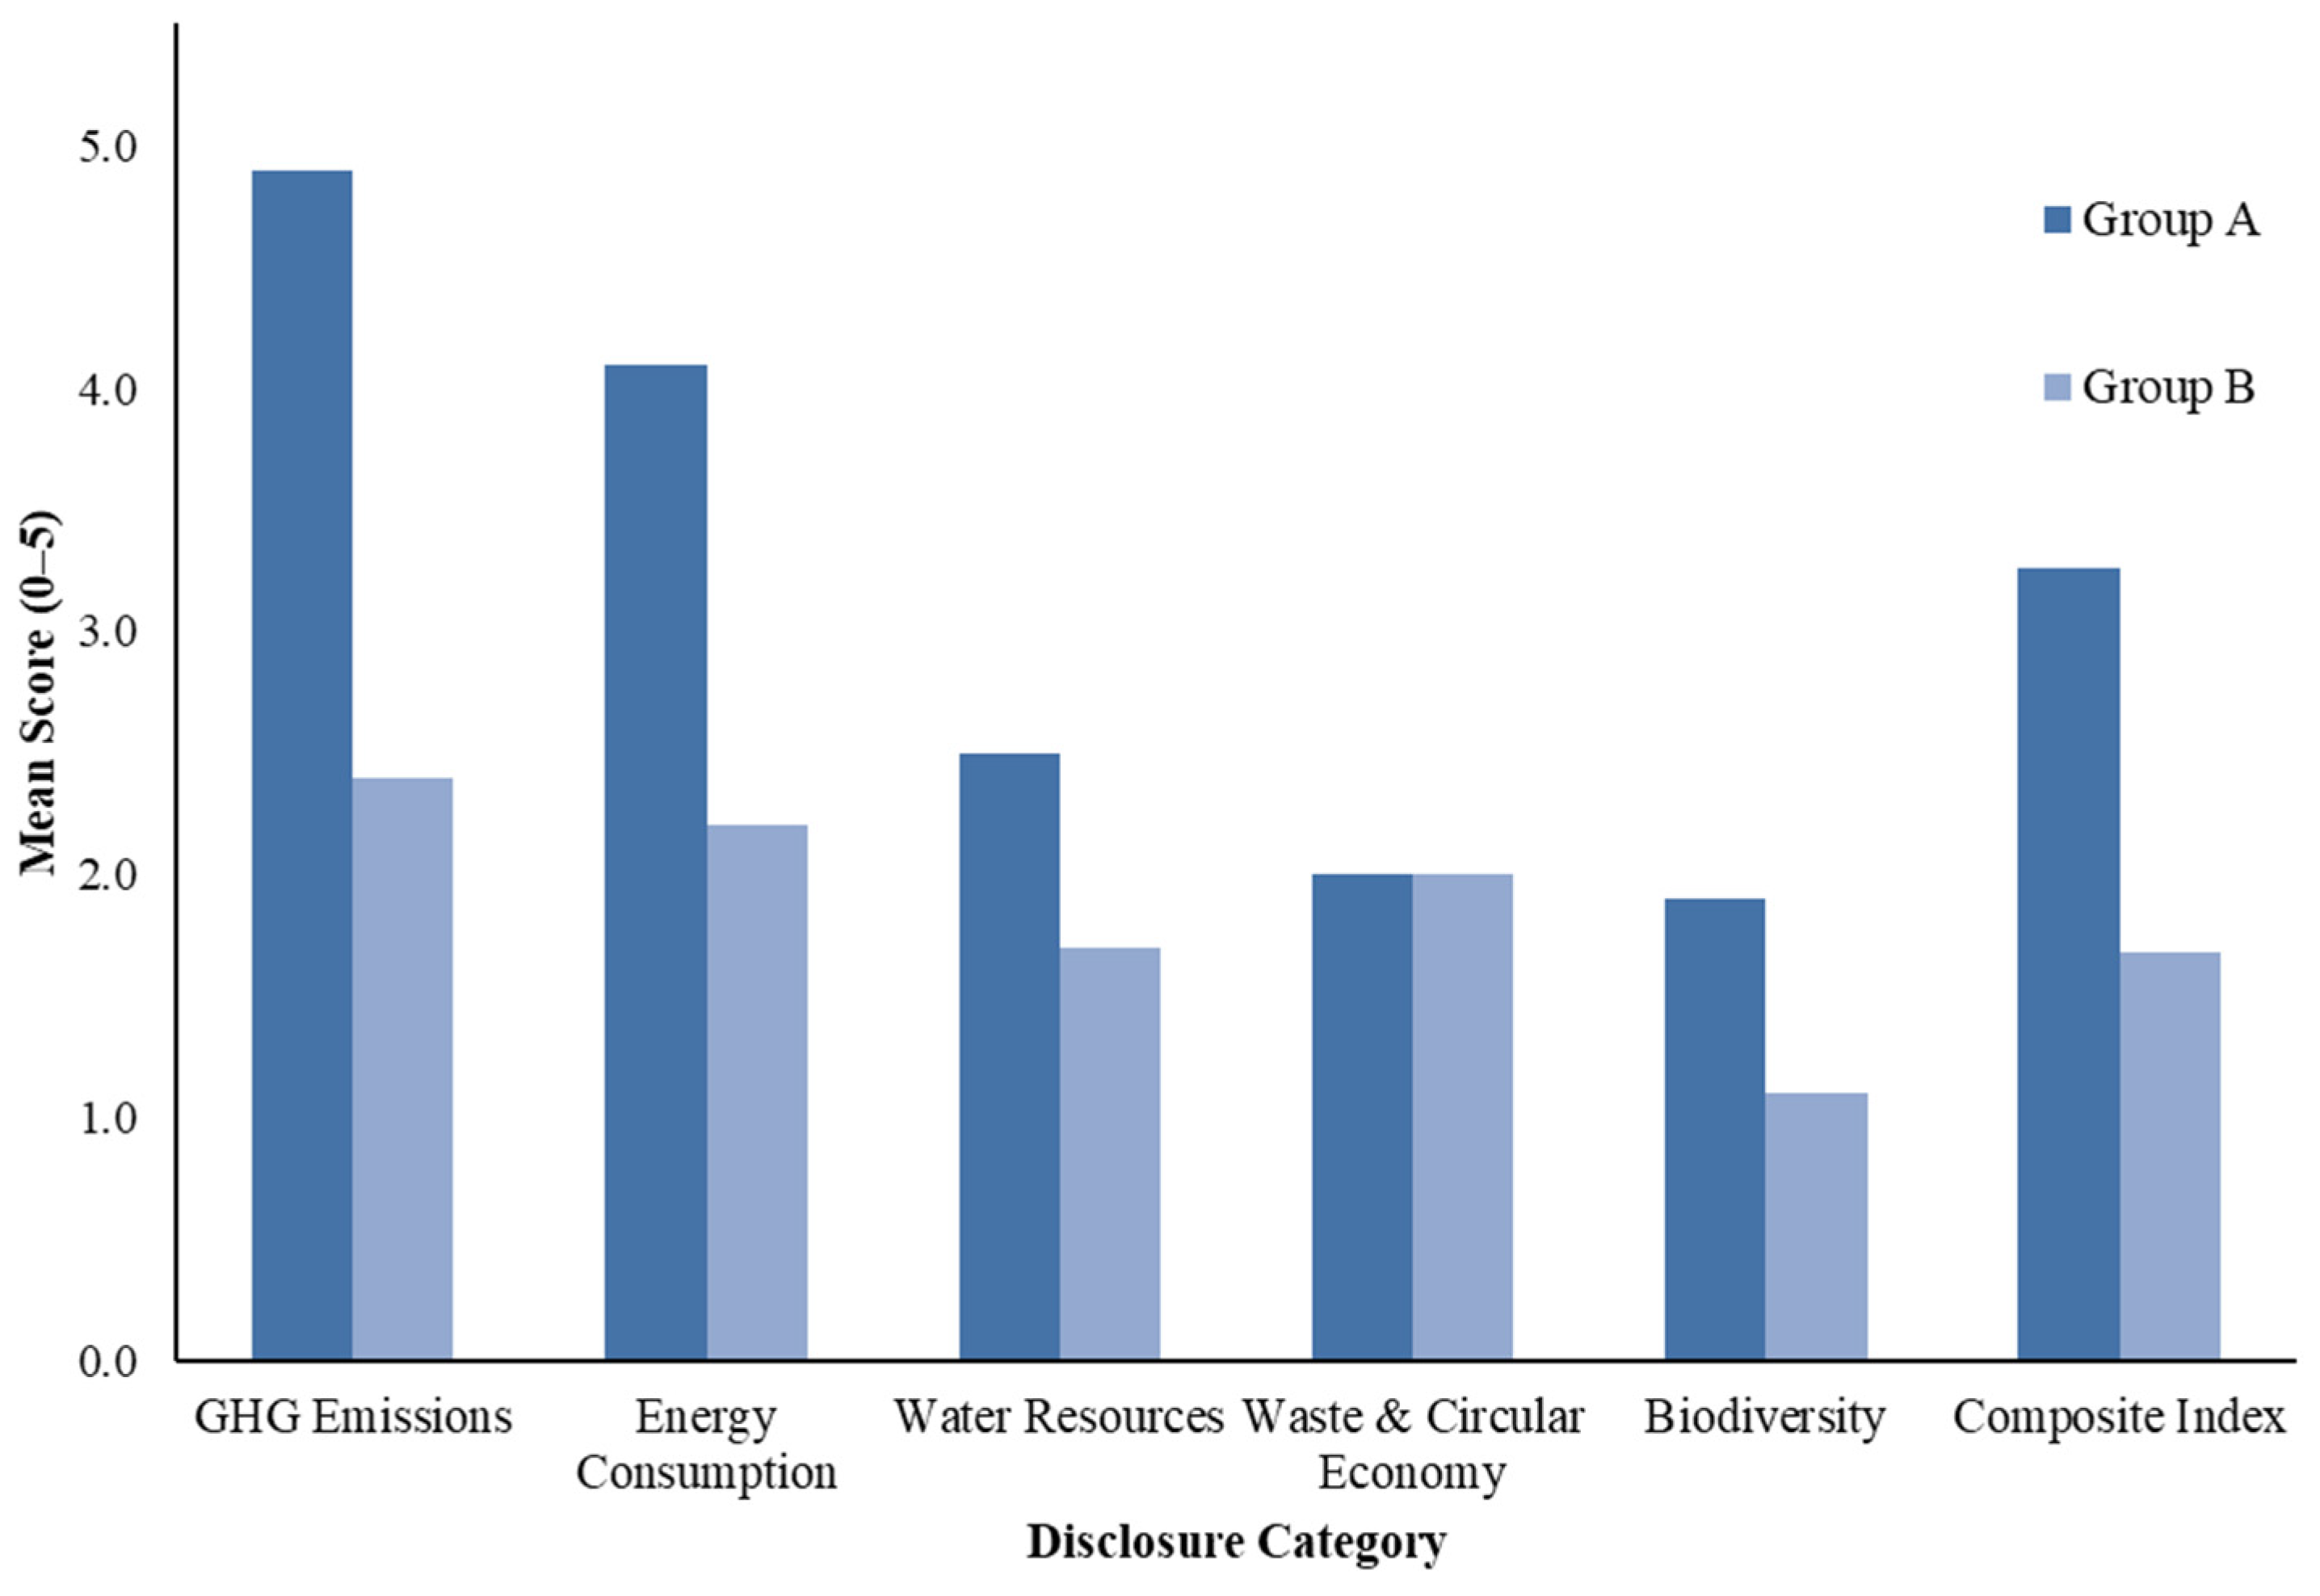
Figure 3 presents the composite disclosure index scores for all twenty entities across the five analytical categories. The qualitative content analysis reveals a pronounced and consistent inter-regional differential. Group A firms achieve a mean composite disclosure index of 16.3 (range: 13 to 24), reflecting a cluster of firms achieving high to very high levels of disclosure comprehensiveness across all five categories. Group B firms achieve a mean of 8.4 (range: 0 to 20), with considerably greater within-group variation. The range spans from 0/25 (reflecting the complete absence of structured environmental disclosures in the management report analysed) to 20/25 (the highest Group B score, driven by sector-specific regulatory architecture rather than regional institutional endowment). Given the small sample size (n = 20) and the ordinal nature of the scoring instrument, this result is presented as a descriptive indicator of association rather than a causal test. Given the small sample size (n = 20) and the purposive, non-probabilistic sampling design, the study deliberately refrains from inferential statistical analysis. The findings are presented as purely exploratory and descriptive pattern observations consistent with the regional embeddedness hypothesis. Figure 4 presents the composite disclosure index relative to GDP per capita.

4.2. Greenhouse Gas Emissions

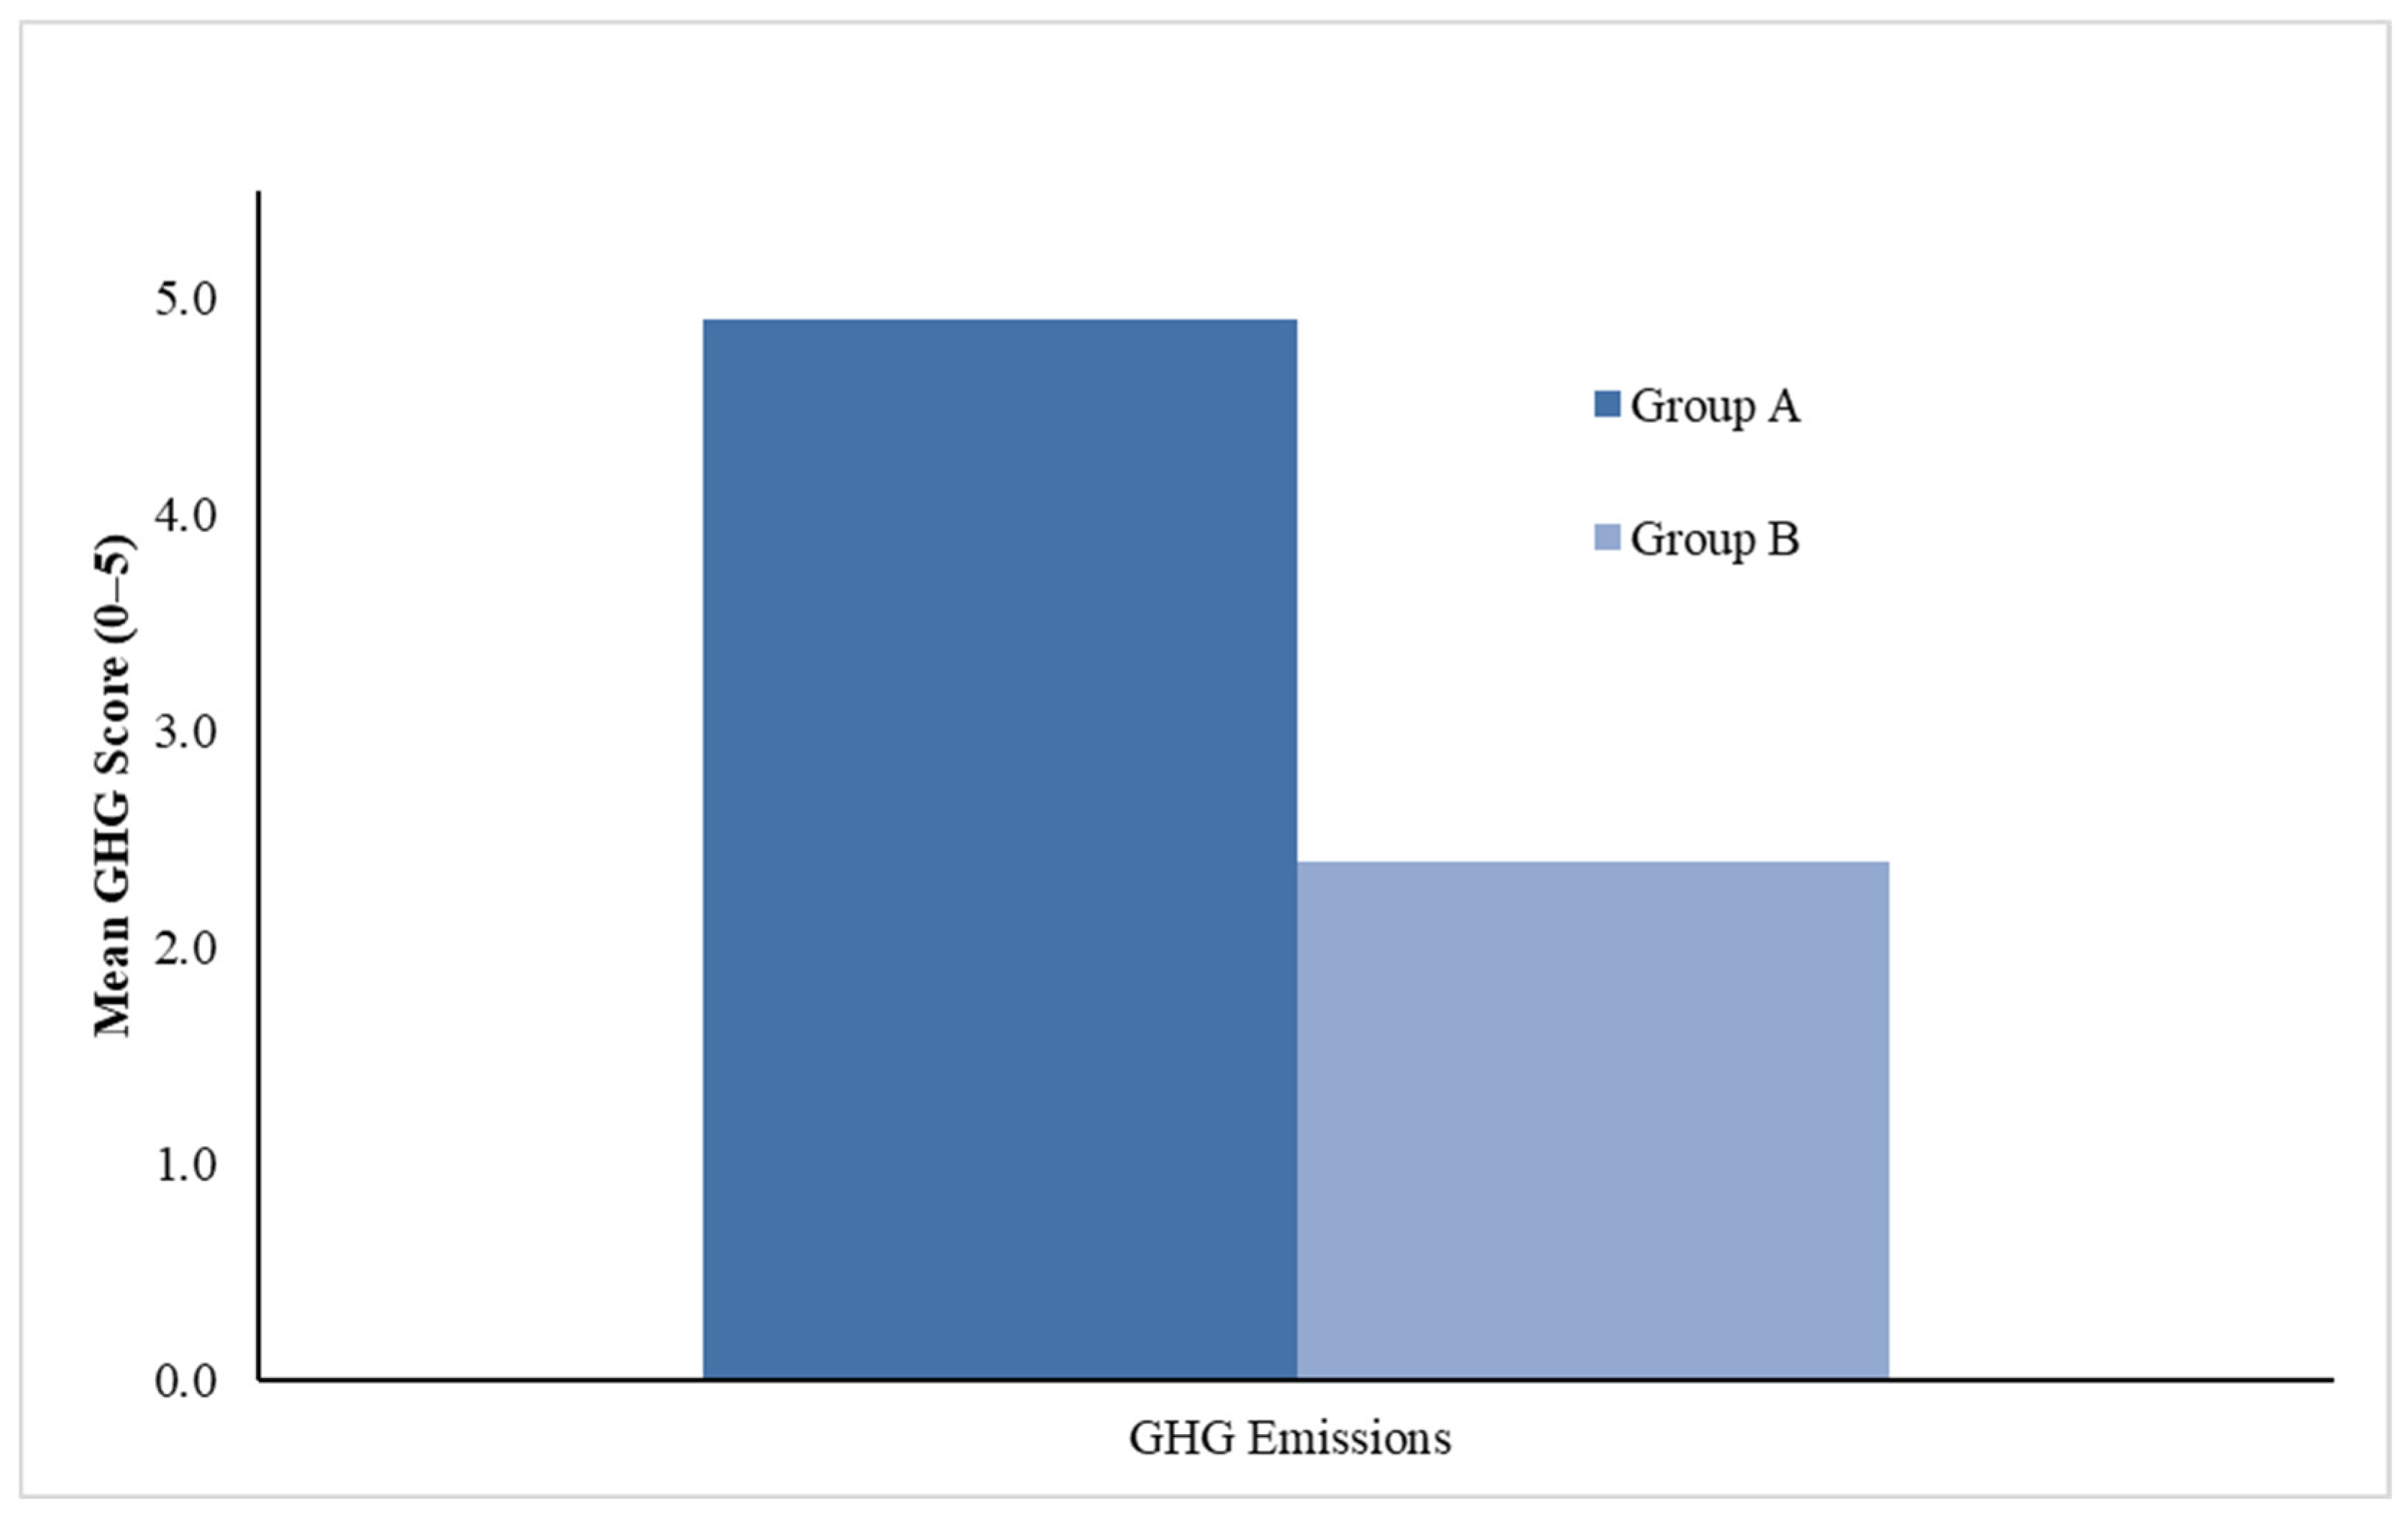
The qualitative content analysis of GHG disclosures reveals the sharpest inter-group contrast of any category. Group A achieves a mean GHG score of 4.9/5. The overwhelming majority of Group A firms attain the maximum score of 5/5. This reflects the simultaneous presence of full Scope 1, 2, and 3 quantification, externally verified reduction targets, CDP disclosure, and alignment with an international framework. The automotive sector within Group A exhibits a structurally distinctive pattern. Scope 3 Category 11 emissions (use of sold vehicles) account for over 96% of total value chain GHG emissions, with product-level emissions exceeding operational Scope 1 and 2 emissions by several hundred [13]. Group B presents a markedly different picture, with GHG scores ranging from 0/5 to 5/5 and a mean of 2.4/5. The content analysis reveals that the highest Group B GHG score is driven not by voluntary framework adoption but by mandatory third-party verification requirements under the EU Emissions Trading System (EU ETS) and the EU Monitoring, Reporting and Verification (MRV) framework. Their approach imposes independently confirmed Scope 1 data regardless of the entity’s voluntary sustainability reporting ambition. Where EU ETS obligations are absent, Group B GHG disclosures are largely limited to partial Scope 1 and 2 data, without Scope 3 disaggregation, SBTi validation, or external verification, yielding scores in the 3/5 range. The lowest Group B GHG scores (1/5 and 0/5) reflect limitations at the source level. For some of the investigated entities, GHG data solely in the form of EU ETS emission allowance accounting entries under IAS 38, without any structured Scope 1/2/3 reporting [16,53]. This source-level gap is itself a substantive finding, further documented in Section 4.5. Figure 5 presents the results of GHG emission disclosure [6,30].

4.3. Energy Consumption

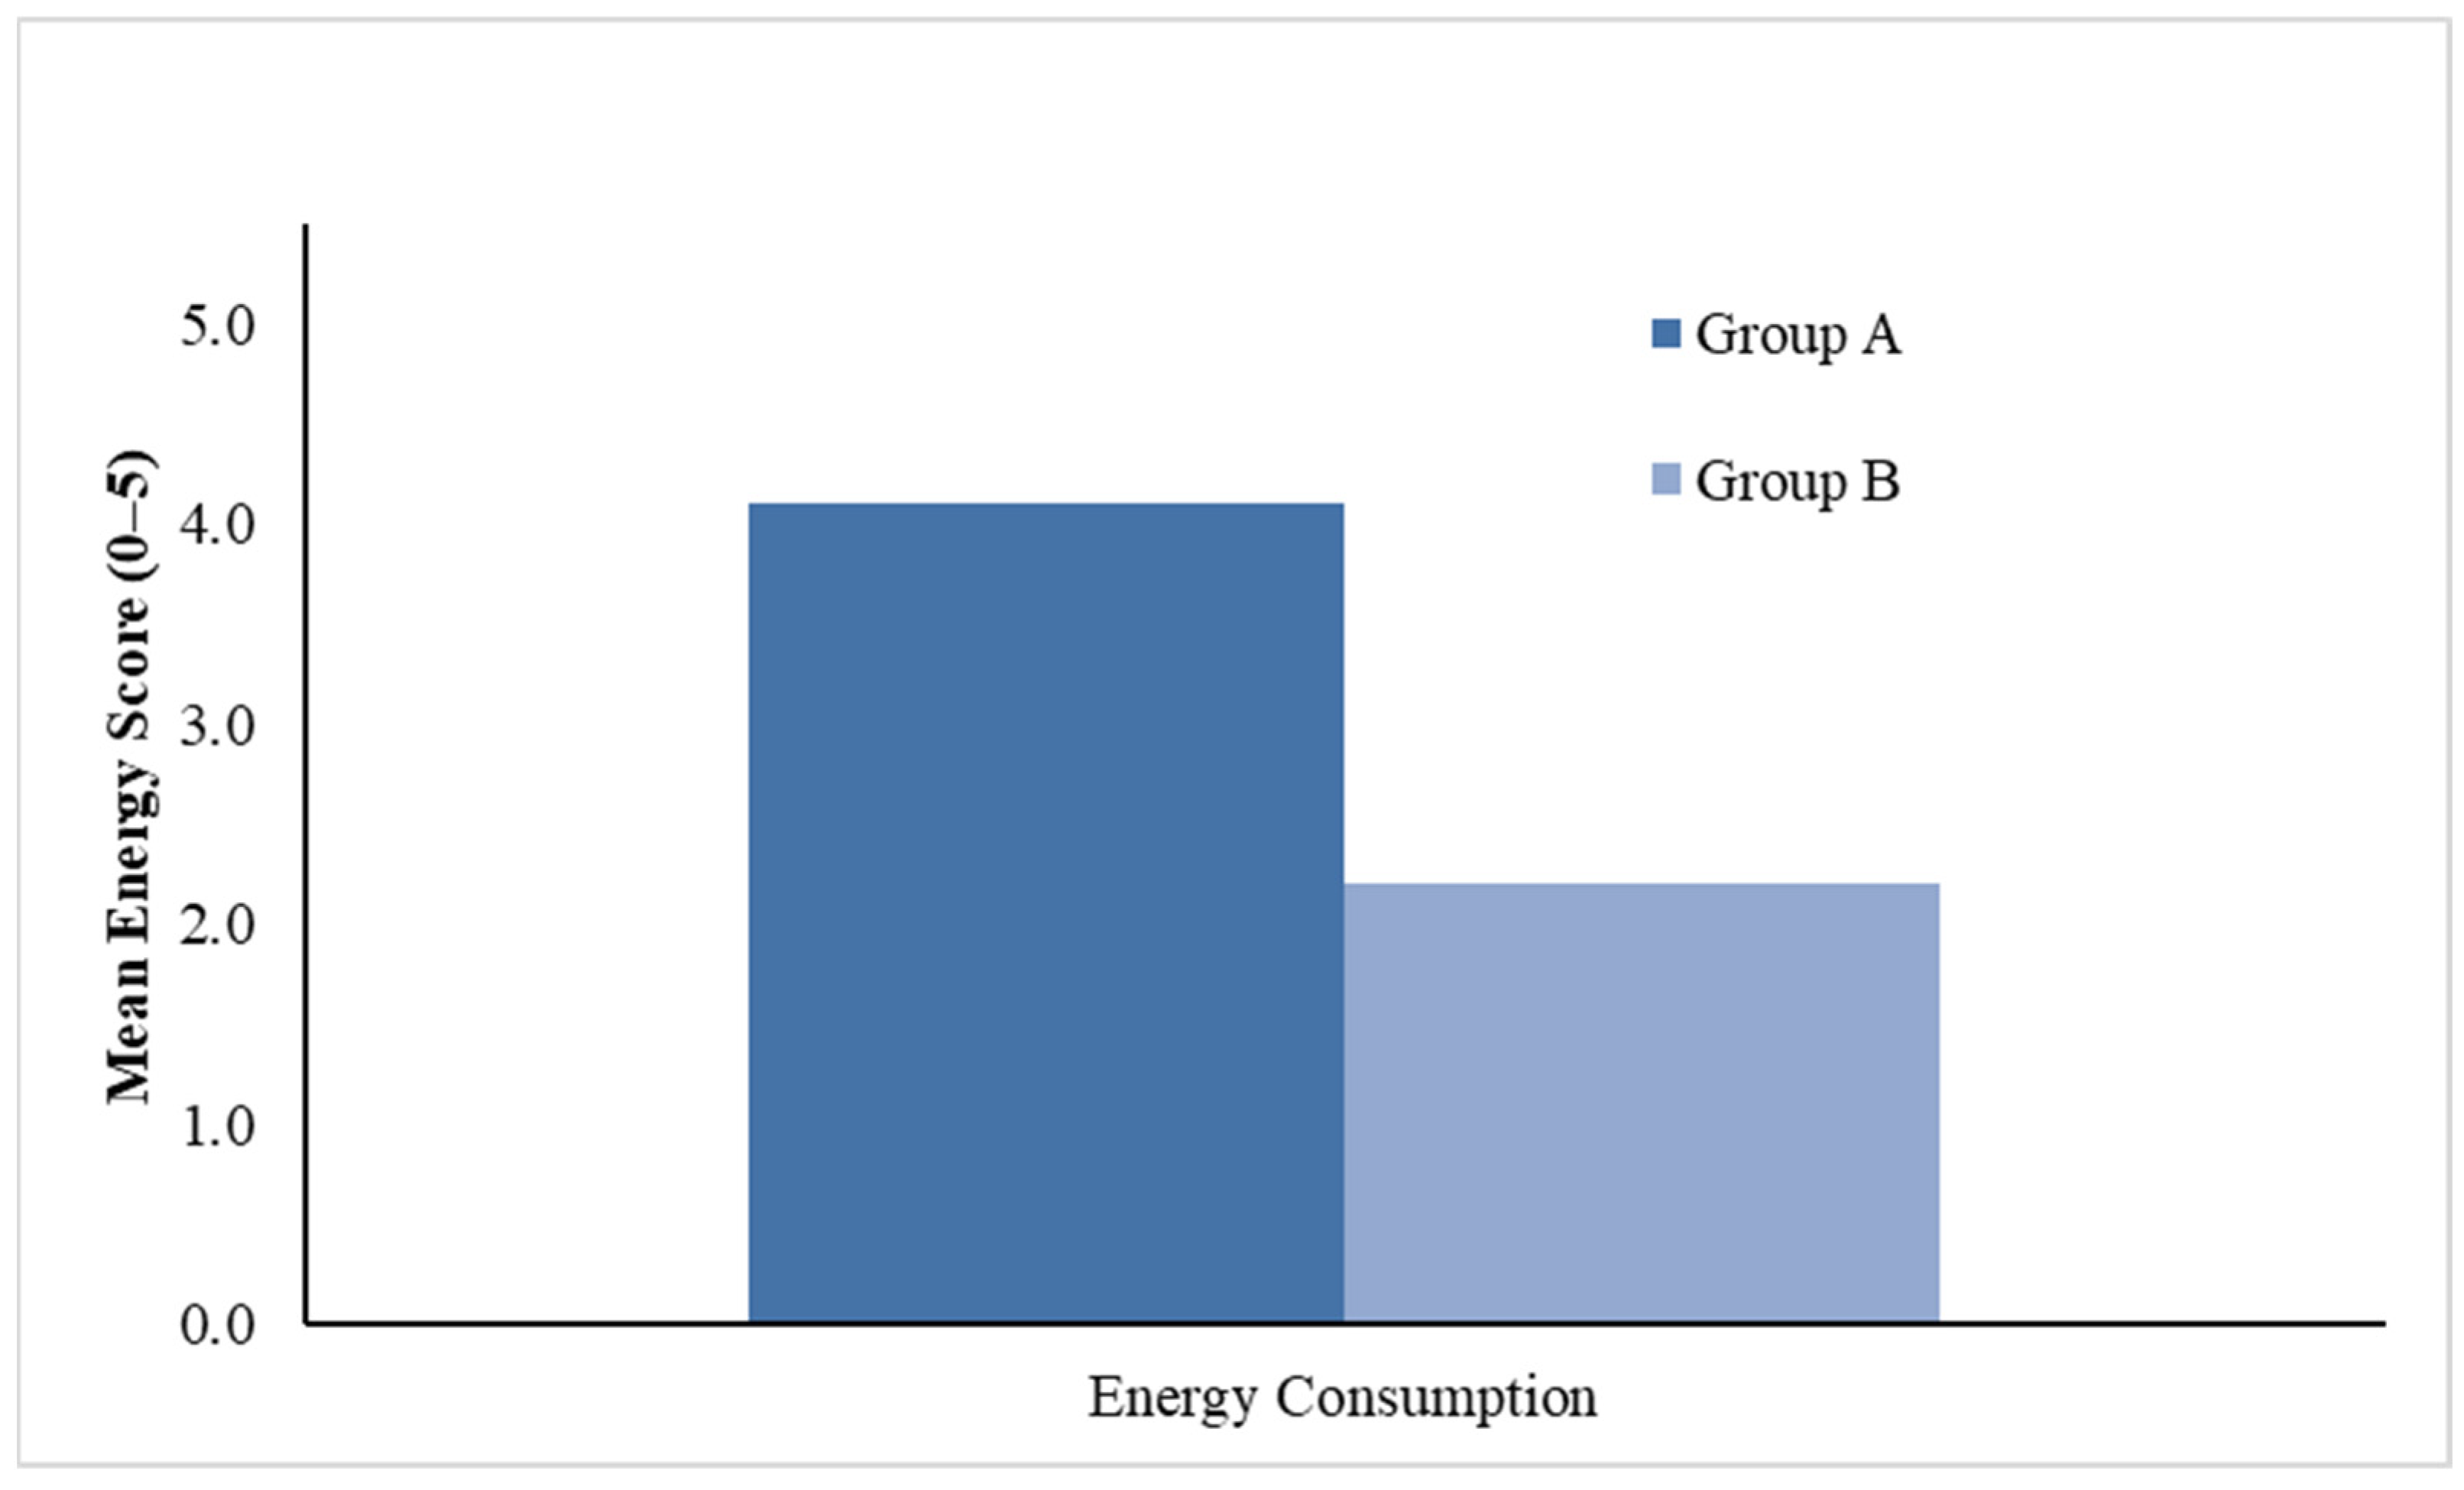
The content analysis of energy disclosures follows a broadly similar inter-group pattern to GHG, with Group A achieving a mean of 4.1/5 and Group B 2.2/5. All Group A firms achieve scores of 4/5 or 5/5, reflecting comprehensive quantification of total energy consumption by type, renewable electricity shares, verified energy intensity metrics, and ISO 50001 [54] certification at production sites. The highest Group A energy scores reflect 100% renewable electricity achieved at all operational sites. A verified energy-intensity reduction trajectory is documented across all Group A industrial entities, with reported intensities declining consistently on a per-unit-of-output basis [22]. Group B energy scores range from 0/5 to 4/5, with the highest Group B scores achieved by energy sector and heavy industry entities that report total energy consumption in gigajoules, renewable capacity installed in megawatts, and multi-year investment programmes targeting significant expansion of renewable generation capacity by 2030. Renewable electricity shares in Group B range from below 15% to approximately 23%, with strategic targets set but not yet achieved for the majority of entities. ISO 50001 certification is present in approximately half of Group A industrial firms and only one Group B entity, reflecting the differential in energy management system maturity between the two regional clusters. Three Group B entities score 0/5 or 1/5, reflecting IFRS source level limitations or the absence of structured energy KPIs in the analysed documents. Figure 6 presents the results of the energy consumption disclosure [16].

4.4. Water Resources, Waste and Circular Economy, and Biodiversity

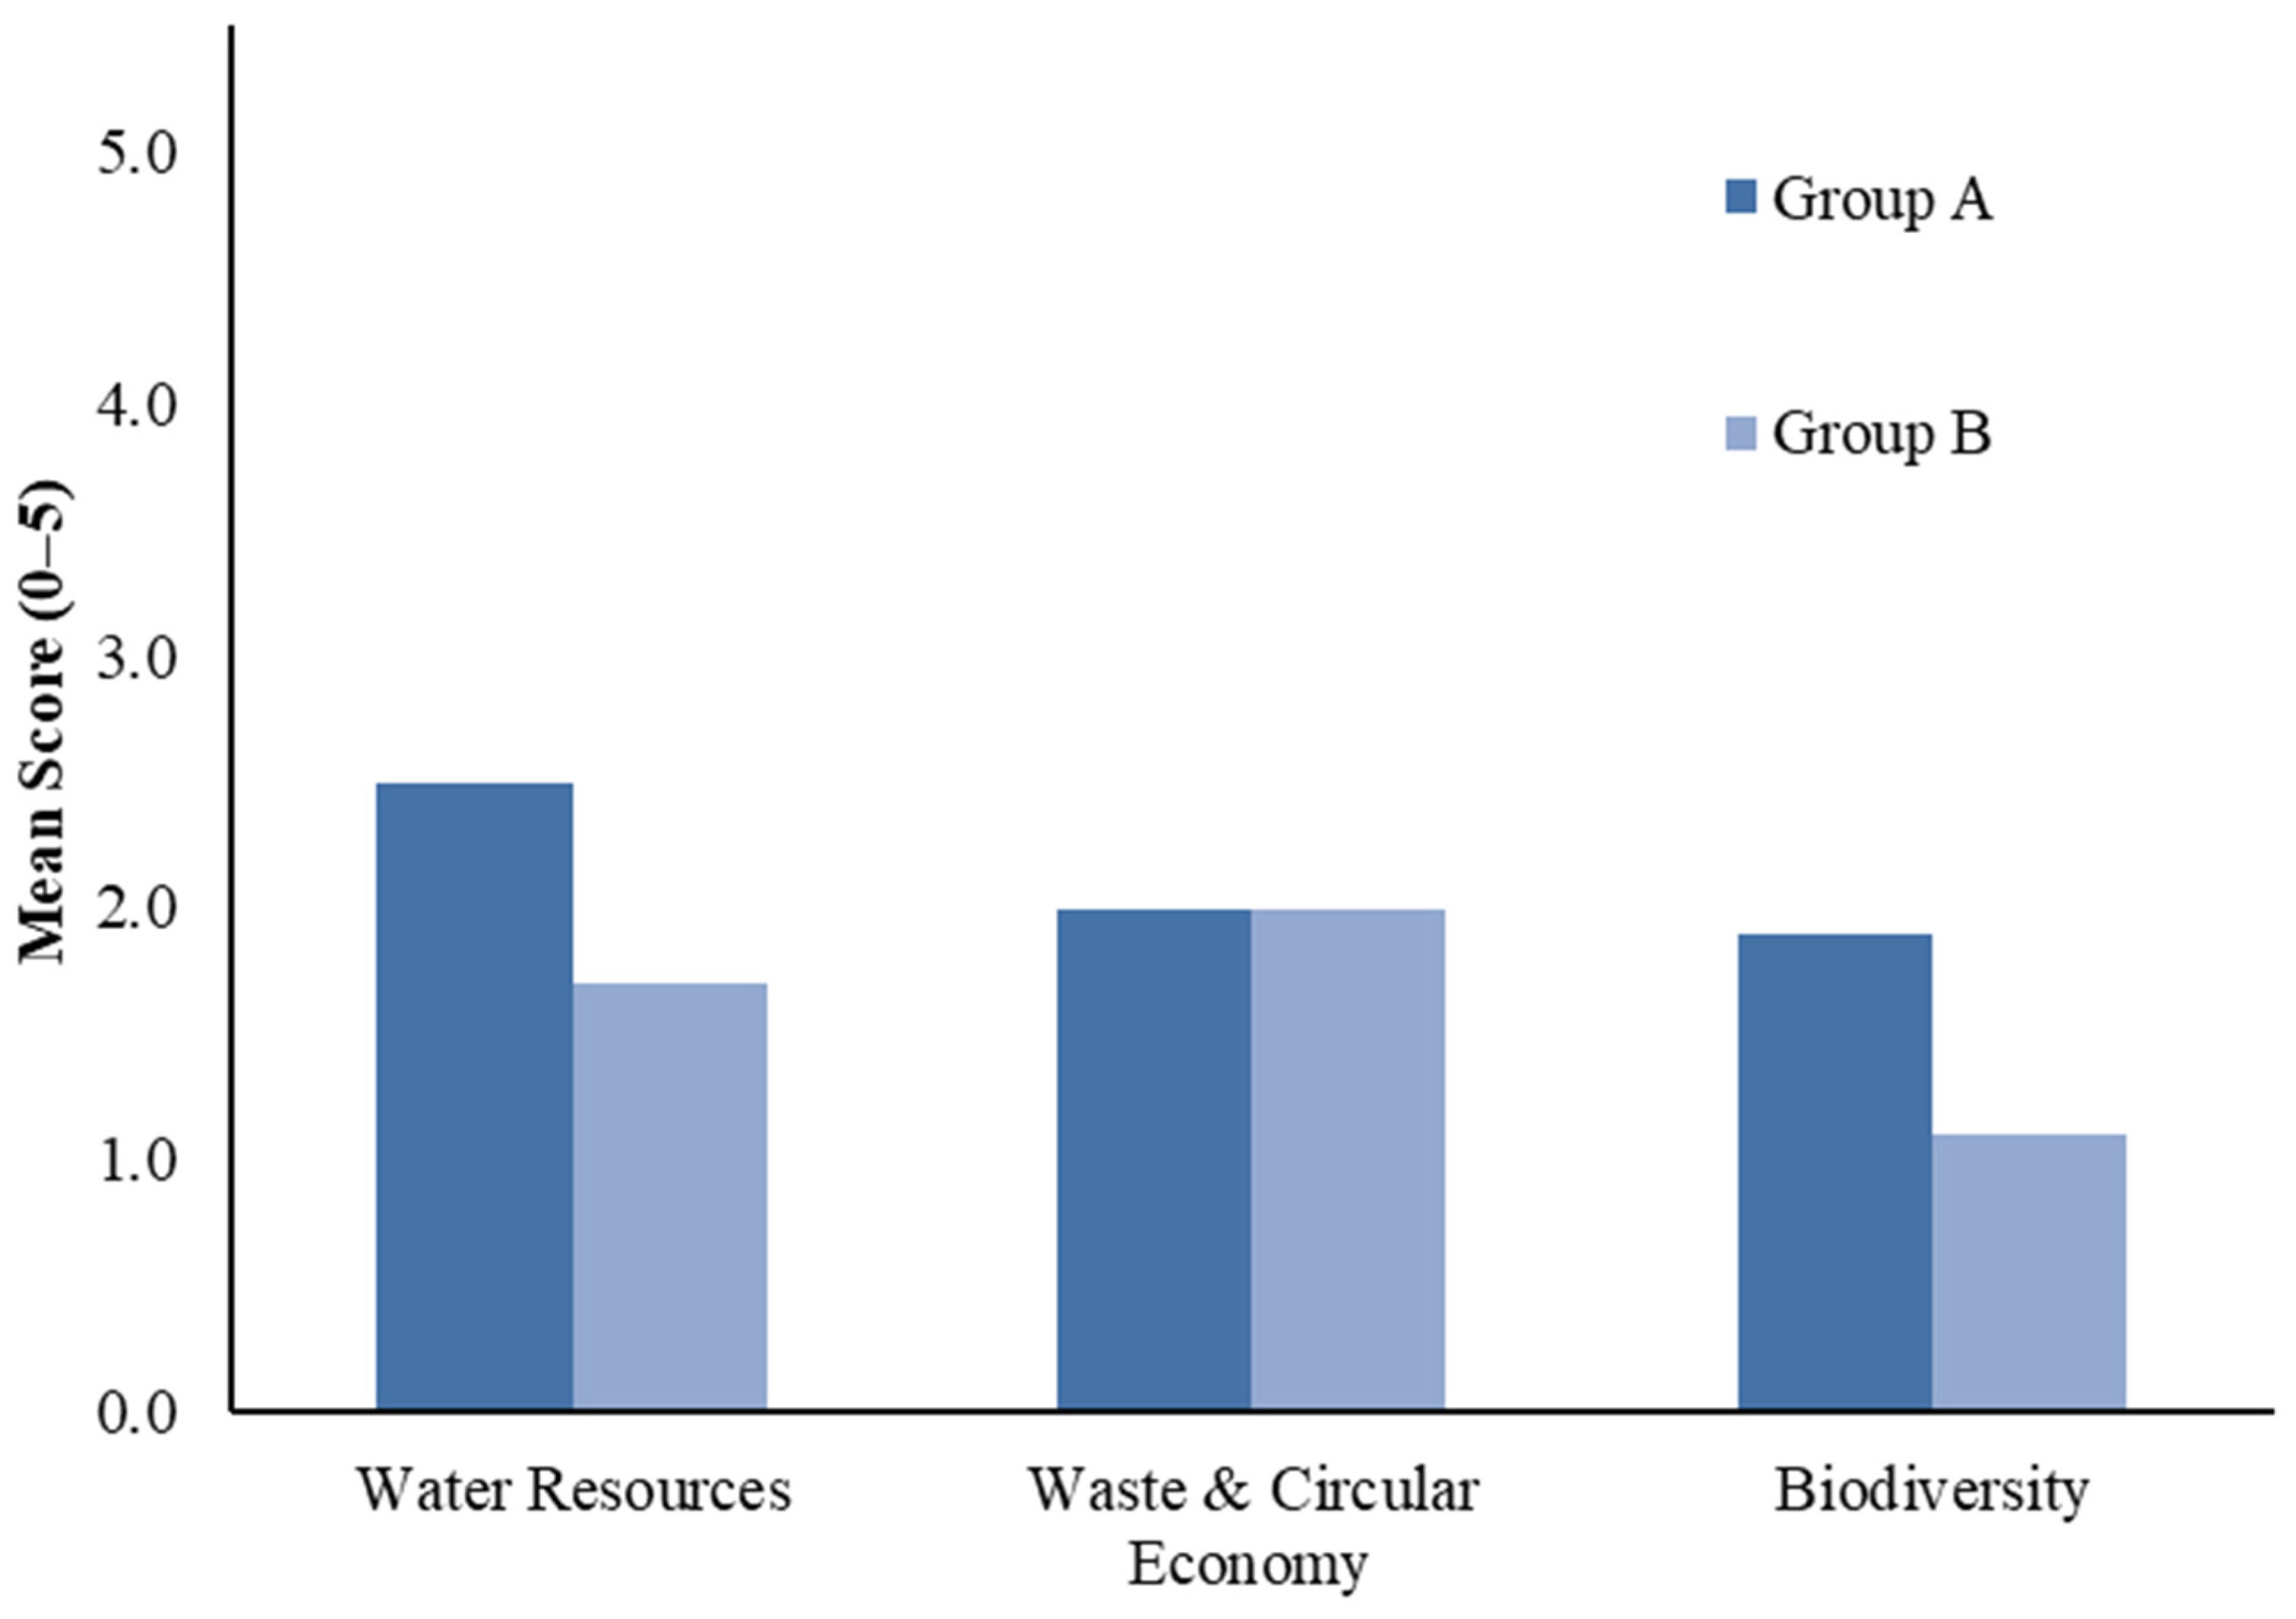
The qualitative content analysis of water disclosures (ESRS E3) reveals the second largest inter-group contrast after GHG. Group A firms achieve a mean of 2.5/5 and Group B 1.7/5. The highest Group A water scores reflect comprehensive water management programmes with closed-loop recycling targets, quantified withdrawal data, water-stress area assessments using the WRI Aqueduct tool, CDP water ratings, and ISAE 3000 [55]-verified data. Group B water disclosures are more heterogeneous. The highest Group B water score of 4/5 is achieved by an energy sector entity for which the divestment of a major water-intensive subsidiary made water withdrawal reduction a central element of the corporate transformation narrative (including a WRI Aqueduct risk assessment confirming low to moderately low water risk in the entity’s operating geography and a long-term withdrawal reduction target driven by the renewable energy transition programme). Several Group B entities, including a mining company whose operations are among the most water-intensive in the entire sample, report no water data whatsoever, reflecting source-level limitations rather than the absence of water management practices [25].
The waste and circular economy category (ESRS E5) produces the study’s most significant finding. Contrary to the pattern observed across all other categories, there is no meaningful qualitative difference between Group A and Group B (both groups achieving a mean score of 2.0/5). This result is driven by exceptional Group B performance in this specific category, where the highest waste score in the entire sample (5/5) is achieved by a Group B industrial recycling entity, and two further Group B firms, in steel and energy, achieve 4/5. The content analysis confirms that for these entities, waste data are commercially central, recycling rate is a core business metric, operationally material, combustion by-products represent a significant revenue stream and are regulatorily required. This demonstrates the sectoral materiality mechanism operating fully independently of regional embeddedness: where waste disclosure is driven by business model logic and sector-specific regulation (Group B firms match or exceed the Group A mean) [24,25,29].
Biodiversity (ESRS E4) represents the weakest category across the entire sample, with Group A achieving a mean of 1.9/5 and Group B 1.1/5. No firm in either group achieves 5/5 under the standard scoring rubric, reflecting the nascent state of biodiversity quantification frameworks and the absence of mandatory third-party verification for biodiversity claims in the current regulatory regime. The highest scores in Group A are associated with TNFD framework adoption, formal Fund for Nature Regeneration commitments, CDP Forests ratings, and quantified site-level biodiversity targets. In Group B, biodiversity disclosure is characterised by qualitative narrative references to green zones, site rehabilitation programmes, and circular-economy contributions, without formal alignment with TNFD or SBTN. Several Group B entities, including those with the largest direct land use impacts in the sample, report no biodiversity information whatsoever in the documents analysed, reflecting source-level limitations in some cases and genuine reporting absence in others. Figure 7 presents the mean disclosure scores for Water, Waste and Circular Economy, and Biodiversity between Group A and Group B [24,40].

4.5. Sector-Specific Regulatory Architecture as a Moderating Variable

The content analysis identifies a within-group B divergence that is analytically central to the study’s theoretical contribution. The two highest scoring Group B entities are both Polish energy utilities operating in the same national regulatory environment, listed on the Warsaw Stock Exchange, and subject to identical EU ETS Phase 4 obligations and GRI/ESRS/EU Taxonomy reporting requirements. Despite this structural similarity, their composite disclosure index scores diverge by 11 points. The content analysis of their respective primary documents reveals that this divergence is primarily explained by differences in document completeness. One entity published a comprehensive, standalone Non-Financial Report 2023 aligned with GRI Standards, ESRS, and EU Taxonomy. The other entity’s publicly accessible document was only the short version of its Integrated Report, which covers GHG and energy disclosures partially but omits water quantification and biodiversity entirely [6,15,30]. This within-sector comparison demonstrates the study’s key methodological finding. EU ETS sector membership is a necessary but not sufficient condition for achieving high disclosure scores. The decisive moderating factor is the completeness and public accessibility of the corporate document. This finding directly motivates the CSRD’s ESAP infrastructure and reinforces the methodological distinction between source-level limitations and genuine non-disclosure established in Section 3.2. More broadly, this evidence confirms that sector-specific regulatory architecture, encompassing EU ETS verification obligations, WSE ESG reporting guidelines, and EU Taxonomy disclosure requirements, can substitute for regional institutional endowment in driving disclosure comprehensiveness, but only when the resulting disclosures are made publicly accessible in comprehensive, structured documents [2,13,41].

5. Further Discussion

The qualitative content analysis of annual and sustainability reports provides exploratory evidence broadly consistent with the regional embeddedness hypothesis. Group A firms exhibit systematically more comprehensive mandatory environmental disclosures than Group B firms headquartered in less developed Central European regions. This finding holds across four of five disclosure categories and is most pronounced in the dimensions that require the greatest institutional and organisational investment (especially Scope 3 GHG reporting, third-party verification, SBTi climate target adoption, and TCFD framework alignment). The demand side mechanism [9,11] is evidenced by the universal adoption of CDP disclosure and SBTi targets across Group A instruments, primarily driven by institutional investor pressure concentrated in Western European capital markets. The supply-side mechanism [1,35] is reflected in the universal ISO 14001 [56] and ISO 50001 certifications, TCFD-aligned reporting, and an independent ISAE 3000 assurance engagement observed across Group A’s annual and sustainability reports [41].
Two empirical observations from the qualitative document analysis qualify the simple monotonic prediction of the regional embeddedness research question. First, the highest-scoring Group B entity achieves a composite index equal to that of the highest-scoring automotive sector entity in Group A, despite being headquartered in a Polish NUTS 2 region with a GDP per capita approximately 86% of the EU average. The content analysis of this entity’s Non-Financial Report 2023 attributes this result unambiguously to sector-specific regulatory architecture. Mandatory EU ETS third-party verification covering 97.8% of Scope 1 GHG emissions, GRI Standards and ESRS obligations imposed by Warsaw Stock Exchange ESG guidelines, and EU Taxonomy reporting requirements combine to generate a disclosure profile that exceeds most Group B entities by a large margin. The within-group B comparison documented in Section 4.5 further refines this finding. A second Group B energy utility, facing identical EU ETS and WSE obligations, achieves only 9/25 because only the short version of its Integrated Report was publicly accessible. The results confirm that EU ETS sector membership is necessary but not sufficient, and that document completeness and public accessibility are equally decisive determinants of observable disclosure quality [6,30].
Second, the waste and circular economy category (ESRS E5) shows no meaningful inter-group qualitative difference. The content analysis confirms that for several Group B industrial entities, waste data are commercially central, recycling rate is a core business performance metric, operationally material, and subject to sector-specific reporting incentives. These sectoral drivers generate waste disclosure comprehensiveness in Group B that equals or exceeds that of most Group A industrial firms, independent of regional embeddedness effects. This finding illustrates the sectoral materiality mechanism at its clearest: where business model logic and sector-specific regulation converge to make a disclosure category commercially salient, the regional embeddedness differential is effectively neutralised [24,25,29,40]. These qualifications are consistent with a theoretical model in which regional embeddedness and sector-specific regulatory architecture operate as independent but partially substitutable drivers of the comprehensiveness of mandatory environmental disclosure. Where sector-specific EU-wide regulatory pressure is intensive, it can effectively compensate for weaker regional institutional endowment and elevate Group B disclosure comprehensiveness toward Group A levels. Where sector-specific pressure is absent or weak, the regional embeddedness differential operates unconstrained, generating the large gaps in water, biodiversity, and Scope 3 reporting documented in Section 4 [13,18,41].
The qualitative findings carry four direct implications for the ongoing CSRD implementation trajectory [6]. First, the persistent inter-regional disclosure gap indicates that the CSRD’s substantially more demanding requirements will generate pronounced asymmetric compliance pressures across EU regions. Group B firms, currently characterised by lower disclosure comprehensiveness, less developed sustainability reporting infrastructure, and limited access to independent ESG assurance providers, face disproportionate implementation costs in meeting the granular ESRS data requirements, double materiality assessment obligations, and mandatory limited assurance engagements [5,10]. The gap between compliance-oriented and transformative sustainability reporting, most acute in institutional environments with weaker reporting cultures [2], is precisely the condition documented through qualitative content analysis across the majority of Group B entities. Primec et al. [11] further identify directors’ personal liability under the CSRD and the Corporate Sustainability Due Diligence Directive as an additional governance dimension of particular relevance for entities in regions with weaker sustainability governance infrastructure [11].
Second, the source-level limitation finding is a substantive empirical discovery rather than merely a methodological limitation. It documents that mandatory environmental disclosures are legally required but not systematically accessible to the public in a structured, searchable form under the current NFRD regime. The CSRD’s European Single Access Point (ESAP) mandatory repository and XBRL digital reporting format are specifically designed to address this accessibility gap, and the present study’s evidence provides direct empirical grounding for the urgency of this regulatory infrastructure [6,30]. Fragidis and Papafloratos [30] analyse the ESRS information architecture and conclude that XBRL tagging will transform mandatory sustainability data from document-embedded text into machine-readable, systematically comparable datasets [30].
Third, the qualitative evidence on sector-specific regulatory architecture as an independent disclosure driver suggests that policymakers should explicitly leverage existing sectoral frameworks as disclosure infrastructure coordinated with ESRS data points, rather than treating them as parallel and uncoordinated systems. Pizzi et al. [13] document that de facto standardisation is more readily achievable at the sector level than across sectors under uniform principles-based mandates. The waste category finding illustrates that, where sectoral regulatory and commercial logic already drive comprehensive disclosure, the CSRD’s mandate adds assurance and framework alignment requirements without requiring the development of underlying reporting capacity from scratch. This targeted coordination approach could substantially accelerate disclosure convergence in less developed EU regions [5,6,40].
Fourth, the qualitative analysis of financed emissions disclosures among Group A financial sector entities documents a persistent cross-sector analytical challenge in the CSRD’s application. Group A financial institutions report portfolio-level GHG data under the PCAF methodology that are structurally incommensurable with the direct operational emissions reported by Group A and Group B industrial entities. This non-comparability is embedded in the ESRS E1 design and has direct implications for the usefulness of cross-sector analytical comparisons, a challenge that regulators, standard setters, and researchers must explicitly acknowledge rather than obscure through apparent methodological uniformity [18,20,57].
Several limitations should be acknowledged. The sample of twenty firms, while purposively constructed to maximise theoretical variation, precludes any generalisation beyond the specific firms and regional contexts studied. The findings constitute pattern observations from qualitative content analysis of specific documents rather than statistically generalisable findings. The cross-sectional single-year design (FY2023) cannot establish whether the inter-regional disclosure gap is narrowing, stable, or widening. Longitudinal replication across the 2023 to 2028 CSRD implementation period is essential [10,14]. The reliance on publicly available documents introduces a systematic downward bias for Group B entities that maintain separate, non-public sustainability reports. The geographic scope limits generalisability. Broader comparisons are needed to test whether the regional embeddedness finding extends beyond this specific contrast [17,19]. A further limitation concerns country-level confounding: the Group A (France, Germany)/Group B (Poland) contrast reflects not only NUTS 2 GDP per capita differences but also national institutional factors, including reporting culture, supervisory enforcement quality, and capital market development, which cannot be fully disentangled from the regional embeddedness mechanism in the present cross-national design. Sensitivity analysis confirms that the inter-group differential (Group A mean 16.3 vs. Group B mean 8.4) is robust, whether financial sector firms are included using the adjusted index or excluded from the cross-group comparison entirely.

6. Conclusions

This study has applied structured qualitative content analysis to the annual reports, sustainability reports, non-financial statements, and universal registration documents of twenty EU companies. The study compared firms from highly developed Western European NUTS 2 regions (Île-de-France FR10; Oberbayern DE21) with firms from less developed Central European regions, predominantly in Poland. Across five NFRD/ESRS-aligned disclosure categories and a composite disclosure index (0 to 25), the analysis documents a pronounced, multidimensional inter-regional differential consistent with the regional embeddedness research question. The findings are consistent with the theoretical mechanisms of regional embeddedness [32] and institutional theory [41], as well as with the empirical literature documenting systematic ESG reporting disparities between firms in developed and less developed institutional environments [17,19,23].
Two critical qualifications emerge from the qualitative evidence. First, sector-specific regulatory architecture constitutes an independent moderating variable. The highest-scoring Group B entity achieves 20/25 (driven by mandatory EU ETS verification, WSE ESG reporting guidelines, and GRI, ESRS, and EU Taxonomy obligations), which can bridge a substantial portion of the regional embeddedness disclosure gap. Second, the within-group B sectoral comparison refines this finding. EU ETS sector membership is necessary but not sufficient. Document completeness and public accessibility are equally decisive. A Group B energy entity facing identical regulatory obligations achieves only 9/25 because only the short version of its integrated report was publicly accessible. This establishes that improving public document accessibility through the CSRD’s ESAP mandate is not merely a technical reform but a substantive governance intervention that directly affects what investors, regulators, and researchers can observe about mandatory environmental disclosure practice [6,30].
Two practical contributions emerge. First, the source-level limitation analysis provides direct empirical grounding for the urgency of the CSRD’s ESAP infrastructure and motivates systematic tracking of document accessibility as a distinct CSRD implementation metric alongside disclosure content quality [6,9,24,25,30]. Second, the waste category finding, which shows no intergroup qualitative difference despite the pronounced differential in all other categories, demonstrates that sectoral materiality can substitute for regional institutional endowment when regulatory and commercial incentives are sufficiently strong [5,6,13,40].
The policy implications are clear. The CSRD’s uniform requirements will generate asymmetric compliance pressures across EU regions unless explicitly accompanied by capacity-building support for firms in less developed NUTS 2 regions and by the deliberate coordination of existing sectoral regulatory frameworks with ESRS data points. The strategic utility of this coordination is demonstrated by the empirical evidence. Where sectoral regulation is intensive and comprehensive reporting requirements are imposed by multiple overlapping frameworks, the regional development gap in disclosure comprehensiveness can be substantially closed. Future research should pursue longitudinal replication across the 2023 to 2028 CSRD implementation timeline [10,14], geographic extension to Nordic, Southern European, and broader Visegrad EU regions to test generalisability [17,19], larger sample studies enabling systematic quantitative analysis of sector specific effects alongside regional institutional factors, and integration of mandatory disclosure comprehensiveness with firm financial performance [58] and directors’ accountability mechanisms [23,49,50] as complementary governance drivers of CSRD disclosure quality. The capacity of mandatory disclosure to bridge regional sustainability divides will ultimately depend on the coherence between regulatory design, institutional capacity building, and the public accessibility of structured sustainability information [6,30,59].

Author Contributions

Conceptualisation, M.Č., A.P. and J.B.; methodology, M.Č., A.P. and J.B.; resources, M.Č., A.P. and J.B.; writing—original draft preparation, M.Č., A.P. and J.B.; formal analysis, M.Č., A.P. and J.B.; writing—review and editing, M.Č., A.P. and J.B.; visualisation, M.Č., A.P. and J.B. All authors have read and agreed to the published version of the manuscript.

Funding

This research received no external funding.

Institutional Review Board Statement

Not applicable.

Informed Consent Statement

Not applicable.

Data Availability Statement

The original contributions presented in this study are included in the article. Further inquiries can be directed to the corresponding author.

Conflicts of Interest

The authors declare no conflicts of interest.

References

  1. Eccles, R.G.; Klimenko, S. The investor revolution. Harv. Bus. Rev. 2019, 97, 106–116. [Google Scholar]
  2. Čufar, M.; Belak, J.; Primec, A. Beyond compliance: Leveraging NFRD and CSRD for transformative CSR reporting and stakeholder empowerment in corporate governance. In Corporate Governance and CSR Strategies for Sustainability; IGI Global: Hershey, PA, USA, 2024; pp. 233–261. [Google Scholar]
  3. Primec, A. Catalyzing sustainable corporate governance: A legal examination of CSR reporting. In Corporate Governance and CSR Strategies for Sustainability; IGI Global: Hershey, PA, USA, 2024; pp. 100–130. [Google Scholar]
  4. Čufar, M.; Belak, J.; Primec, A. Exploring the Role of ESG Reporting in CSR-Driven Corporate Governance to Mitigate Risks and Uncertainty: An Analysis of Legal Reports. In Investigating Directors’ Accountability in Promoting Corporate Social Responsibility; IGI Global: Hershey, PA, USA, 2026; pp. 215–246. [Google Scholar]
  5. Baumüller, J.; Grbenic, S.O. Moving from non-financial to sustainability reporting: Analyzing the EU Commission’s proposal for a CSRD. Facta Univ. Ser. Econ. Organ. 2021, 18, 369–381. [Google Scholar] [CrossRef]
  6. European Commission. Directive (EU) 2022/2464 (CSRD); Publications Office of the European Union: Luxembourg, 2022. [Google Scholar]
  7. European Parliament and Council. Directive 2014/95/EU amending Directive 2013/34/EU as regards disclosure of non-financial and diversity information by certain large undertakings and groups (NFRD). Off. J. Eur. Union 2014, L 330, 1–9. [Google Scholar]
  8. EFRAG. Delegated Regulation (EU) 2023/2772; European Sustainability Reporting Standards (ESRS Set 1); EFRAG: Brussels, Belgium, 2023. [Google Scholar]
  9. EFRAG. Implementation Guidance on Double Materiality; EFRAG: Brussels, Belgium, 2023. [Google Scholar]
  10. Dragomir, V.D.; Dumitru, M.; Chersan, I.C.; Gorgan, C.; Păunescu, M. Double materiality disclosure as an emerging practice. Account. Eur. 2025, 22, 103–140. [Google Scholar] [CrossRef]
  11. Primec, A.; Tičar, B.; Pastirk, G. Corporate Social Responsibility of Companies and Directors in Light of New EU Legislation: CSRD, Due Diligence Directive, and Simplification Proposals. In Investigating Directors’ Accountability in Promoting CSR; IGI Global: Hershey, PA, USA, 2026; pp. 99–130. [Google Scholar]
  12. Primec, A.; Belak, J.; Čufar, M. Artificial Intelligence as an Emerging Risk Dimension in Corporate Sustainability Reporting: A Legal and Governance Perspective. Sustainability 2026, 18, 2278. [Google Scholar] [CrossRef]
  13. Pizzi, S.; Venturelli, A.; Caputo, F. Regulating sustainability reporting in Europe: De jure harmonisation or de facto standardisation? Account. Eur. 2025, 22, 51–75. [Google Scholar] [CrossRef]
  14. Breijer, R.; Erkens, M.H.; Orij, R.P.; Vergoossen, R.G.A. Mandatory versus voluntary non-financial reporting. Account. Forum 2025, 49, 303–335. [Google Scholar] [CrossRef]
  15. Stolowy, H.; Paugam, L. Sustainability reporting: Is convergence possible? Account. Eur. 2023, 20, 139–165. [Google Scholar]
  16. Indyk, M. Are companies prepared for sustainability reporting under ED IFRS S1 and S2? Evidence from Poland. Audit. Financ. 2022, 20, 641–654. [Google Scholar] [CrossRef]
  17. Ng, A.W.; Leung, T.C.H.; Yu, T.-W.; Cho, C.H.; Wut, T.M. Disparities in ESG reporting by emerging Chinese enterprises. Sustain. Account. Manag. Policy J. 2023, 14, 343–368. [Google Scholar]
  18. Menicucci, E. ESG regulations and concepts. In ESG Integration in the Banking Sector; Springer: Cham, Switzerland, 2025; pp. 5–26. [Google Scholar]
  19. Zrnić, A.; Pekanov Starčević, D.; Crnković, B. Recent Trends in Sustainability Reporting: Literature Review and Implications for Future Research. Ekon. Vjesn. 2020, 33, 271–283. [Google Scholar]
  20. Szabó, D.G.; Sørensen, K.E. Non-financial reporting, CSR frameworks and groups of undertakings. J. Corp. Law Stud. 2017, 17, 137–165. [Google Scholar] [CrossRef]
  21. Isaksson, R.; Steimle, U. What does GRI-reporting tell us about corporate sustainability? TQM J. 2009, 21, 168–181. [Google Scholar] [CrossRef]
  22. Fagbemi, B.T.; Saah, B.P.; Nduka, A.I.; Aloke, E.M. Evolution of ESG and sustainability reporting. J. Econ. Bus. Commer. 2025, 2, 297–305. [Google Scholar] [CrossRef]
  23. Andrades, J.; Martinez-Martinez, D.; Larrán, M. Sustainability reporting, institutional pressures and universities. Sustain. Account. Manag. Policy J. 2025, 16, 1045–1071. [Google Scholar]
  24. Mio, C.; Agostini, M.; Scarpa, F. Sustainability Reporting: Conception, International Approaches and Double Materiality in Action; Springer: Cham, Switzerland, 2024. [Google Scholar]
  25. Miles, S.; Ringham, K. The boundary of sustainability reporting: Evidence from the FTSE 100. Account. Audit. Account. J. 2020, 33, 357–390. [Google Scholar] [CrossRef]
  26. DiMaggio, P.J.; Powell, W.W. The iron cage revisited: Institutional isomorphism and collective rationality in organisational fields. Am. Sociol. Rev. 1983, 48, 147–160. [Google Scholar] [CrossRef]
  27. Barker, R.; Eccles, R.G. Should FASB and IASB be responsible for setting standards for nonfinancial information? Account. Bus. Res. 2018, 48, 497–514. [Google Scholar]
  28. Bovens, M. Analysing and assessing accountability: A conceptual framework. Eur. Law J. 2007, 13, 447–468. [Google Scholar] [CrossRef]
  29. Bossut, M.; Jürgens, I.; Pioch, T.; Schiemann, F.; Spandel, T.; Tietmeyer, R. What information is relevant for sustainability reporting? The concept of materiality and the EU CSRD. Policy Brief 2021, 7, 2021. [Google Scholar]
  30. Fragidis, G.; Papafloratos, T. An Information Architecture for the European Sustainability Reporting Standards (ESRS). Sustainability 2025, 17, 7675. [Google Scholar] [CrossRef]
  31. European Commission. Regulation (EU) 2020/852 on the establishment of a framework to facilitate sustainable investment (EU Taxonomy Regulation). Off. J. Eur. Union 2020, L 198, 13–43. [Google Scholar]
  32. Granovetter, M. Economic action and social structure: The problem of embeddedness. Am. J. Sociol. 1985, 91, 481–510. [Google Scholar] [CrossRef]
  33. Geels, F.W. Sociotechnical transitions to sustainability: A review of criticisms and elaborations of the multi-level perspective. Curr. Opin. Environ. Sustain. 2019, 39, 187–201. [Google Scholar] [CrossRef]
  34. Marquis, C.; Lounsbury, M. Vive La Résistance: Competing Logics and the Consolidation of U.S. Community Banking. Acad. Manag. J. 2007, 50, 799–820. [Google Scholar] [CrossRef]
  35. Flammer, C. Corporate social responsibility and shareholder reaction: The environmental awareness of investors. Acad. Manag. J. 2013, 56, 758–781. [Google Scholar] [CrossRef]
  36. Chang, K.; Fu, K.; Jin, Y.; Liem, P.F. Sustainable finance: ESG/CSR, firm value, and investment returns. Asia-Pac. J. Financ. Stud. 2022, 51, 325–371. [Google Scholar] [CrossRef]
  37. Freeman, R.E. Strategic Management: A Stakeholder Approach; Pitman: Boston, MA, USA, 1984. [Google Scholar]
  38. North, D.C. Institutions, Institutional Change and Economic Performance; Cambridge University Press: Cambridge, UK, 1990. [Google Scholar]
  39. Guix, M.; Sánchez, J.J.; Priego, M.J.; Font, X. Changing institutional logics behind sustainability reports: Hotel groups 2014, 2018, 2021. Tour. Manag. 2025, 106, 105031. [Google Scholar] [CrossRef]
  40. Borghesi, S.; Costantini, V.; D’Amato, A.; Dibattista, I.; Koundouri, P.; Li, Q.; Mazzarano, M.; Sterner, T.; Tiwari, M.M.; Vis, P.; et al. Reforming ESG: A European and Global South perspective. Environ. Dev. Econ. 2025, 30, 282–296. [Google Scholar] [CrossRef]
  41. Schillemans, T.; Bovens, M. The challenge of multiple accountability. In Accountable Governance: Problems and Promises; Routledge: London, UK, 2011; pp. 3–21. [Google Scholar]
  42. Boggini, C. Reporting cybersecurity to stakeholders: CSRD and EU cyber legal framework. Comput. Law Secur. Rev. 2024, 53, 105987. [Google Scholar] [CrossRef]
  43. Stubbs, W.; Higgins, C. Stakeholders’ perspectives on the role of regulatory reform in integrated reporting. J. Bus. Ethics 2018, 147, 489–508. [Google Scholar] [CrossRef]
  44. Kohlbacher, F. The use of qualitative content analysis in case study research. Forum Qual. Sozialforschung 2006, 7, 1–30. [Google Scholar]
  45. Krippendorff, K. Content Analysis: An Introduction to Its Methodology, 4th ed.; Sage Publications: Thousand Oaks, CA, USA, 2018. [Google Scholar]
  46. Stemler, S.E. Content Analysis. In Emerging Trends in the Social and Behavioral Sciences; Scott, R.A., Kosslyn, S.M., Eds.; John Wiley and Sons: Hoboken, NJ, USA, 2015; pp. 1–14. [Google Scholar] [CrossRef]
  47. Bell, E.; Harley, B.; Bryman, A. Business Research Methods, 6th ed.; Oxford University Press: Oxford, UK, 2022. [Google Scholar]
  48. Bose, S. Evolution of ESG reporting frameworks. In Values at Work; Springer: Cham, Switzerland, 2020; pp. 13–33. [Google Scholar]
  49. Depoers, F.; Jeanjean, T.; Jérôme, T. Voluntary disclosure of greenhouse gas emissions: Contrasting the carbon disclosure project and corporate reports. J. Bus. Ethics 2016, 134, 445–461. [Google Scholar] [CrossRef]
  50. Hummel, K.; Schlick, C. The relationship between sustainability performance and sustainability disclosure: Reconciling voluntary disclosure theory and legitimacy theory. J. Account. Public Policy 2016, 35, 455–476. [Google Scholar] [CrossRef]
  51. Yin, R.K. Case Study Research: Design and Methods, 4th ed.; Sage Publications: Thousand Oaks, CA, USA, 2009. [Google Scholar]
  52. Patton, M.Q. Qualitative Research and Evaluation Methods, 4th ed.; SAGE Publications: Thousand Oaks, CA, USA, 2015. [Google Scholar]
  53. Gaviria, D.A.; Martínez, E.M.; Polo, O.C.; Arcila, J.O. Accounting mechanism to measure the environmental impact of industries in the Aburrá Valley and its application of the general disclosure requirements related to financial information on sustainability (IFRS S1) and climate-related disclosures (IFRS S2). Rev. Gest. Soc. Ambient. 2023, 17, 1–16. [Google Scholar] [CrossRef]
  54. ISO 50001:2018; Energy Management Systems—Requirements with Guidance for Use. International Organization for Standardization: Geneva, Switzerland, 2018.
  55. ISAE 3000 (Revised); Assurance Engagements Other than Audits or Reviews of Historical Financial Information. International Auditing and Assurance Standards Board (IAASB): New York, NY, USA, 2013.
  56. ISO 14001:2015; Environmental Management Systems—Requirements with Guidance for Use. International Organization for Standardization: Geneva, Switzerland, 2015.
  57. De Micco, P.; Rinaldi, L.; Vitale, G.; Cupertino, S.; Maraghini, M.P. Challenges of sustainability reporting: Case of Estra. Meditari Account. Res. 2021, 29, 430–448. [Google Scholar] [CrossRef]
  58. Zhang, Q.; Ding, R.; Chen, D.; Zhang, X. The effects of mandatory ESG disclosure on price discovery efficiency around the world. Int. Rev. Financ. Anal. 2023, 89, 102811. [Google Scholar] [CrossRef]
  59. Elidrisy, A. Comparative review of ESG reporting standards: ESRS versus ISSB. Int. Multiling. J. Sci. Technol. 2024, 9, 7191–7198. [Google Scholar]
Figure 1. Multiple case study design.
Sustainability 18 06025 g001
Figure 2. Research design: qualitative content analysis of mandatory environmental disclosures within a multiple case study framework.
Sustainability 18 06025 g002
Figure 3. Mean Disclosure Score by Category.
Sustainability 18 06025 g003
Figure 4. GDP per Capita vs. Composite Disclosure Index.
Sustainability 18 06025 g004
Figure 5. GHG emissions disclosure results: Group A vs. Group B.
Sustainability 18 06025 g005
Figure 6. Energy consumption disclosure results.
Sustainability 18 06025 g006
Figure 7. Mean disclosure scores for Water, Waste and Circular Economy, and Biodiversity between Group A and Group B.
Sustainability 18 06025 g007
Disclaimer/Publisher’s Note: The statements, opinions and data contained in all publications are solely those of the individual author(s) and contributor(s) and not of MDPI and/or the editor(s). MDPI and/or the editor(s) disclaim responsibility for any injury to people or property resulting from any ideas, methods, instructions or products referred to in the content.