1. Introduction
Farmers’ specialized cooperatives represent core agricultural entities within China, serving as crucial conduits between smallholder farmers and contemporary agricultural practices. These cooperatives assume a vital role in the advancement of China’s rural revitalisation strategy. Following the implementation of the Law on Farmers’ Specialized Cooperatives of China in 2007, these cooperatives have gradually evolved towards a trajectory of development governed by the rule of law and standardised practices, whilst concurrently experiencing an increase in their industrial scale. At present, the total number of farmers’ specialized cooperatives in China has exceeded 2 million, with 15,000 federations having been established. The operations of these cooperatives extend across the entire agricultural production value chain, having cumulatively served and supported over 91 million smallholder farming households. It is evident that ordinary farmers constitute a significant proportion of cooperative members, accounting for more than 95 percent. This observation underscores the pivotal role that these cooperatives play in facilitating the integration of smallholders into the contemporary agricultural system. Following a period of considerable development, cooperatives have achieved near-universal coverage across the nation’s villages. They play an irreplaceable supporting role in integrating agricultural production resources, undertaking socialised agricultural services, stimulating the endogenous dynamism of rural industries, and promoting the scaled and standardised development of agriculture. Nevertheless, the rapid expansion of the industry has exposed significant practical challenges. It is evident that cooperatives often exhibit a propensity to prioritise quantity over quality. Regional development disparities are pronounced, operational efficiency varies considerably, organisational self-sustaining momentum is inadequate, and imbalances in spatial development patterns are becoming increasingly apparent. Furthermore, the implementation of identical policies engenders markedly disparate outcomes for cooperatives in the eastern, central and western regions, with some cooperatives degenerating into ‘shell cooperatives’ that struggle to perform their functions of linking and supporting farmers or driving industrial upgrading. In light of the aforementioned context, the scientific measurement of farmers’ specialized cooperatives’ development level, and the systematic identification of the intensity of multi-dimensional influencing factors, their patterns of interaction and coupling, and their driving mechanisms, is of significant theoretical value and practical significance for the promotion of the high-quality development of cooperatives.
The development level of China’s farmers’ specialized cooperatives is driven by multiple factors, with regional economic development, agricultural production efficiency, rural human capital and land resource allocation collectively determining their spatial development patterns and overall quality. From a theoretical perspective, existing studies primarily rely on traditional linear regression models for empirical analysis, focusing on the linear relationships of single or a few factors. This approach overlooks the complexity of the agricultural economic system and the interdependent characteristics of multidimensional factors, making it difficult to effectively identify the nonlinear effects, interactive coupling effects, and spatial heterogeneity of various factors, and thus unable to systematically reveal the underlying driving mechanisms of cooperative development. The Geodetector model effectively breaks through the linear constraints of traditional econometric models. It can precisely quantify the independent explanatory power of each influencing factor, the interactive enhancement effects among factors, and the patterns of spatial differentiation. It is highly suited to the complex development characteristics of cooperatives driven by the coupling of multiple factors and can effectively address the shortcomings of existing research methods and theoretical analyses. From a practical perspective, China exhibits significant disparities in provincial economic development, regional imbalances in agricultural production efficiency, uneven distribution of rural human capital, and prominent characteristics of land fragmentation and smallholder farming. The interaction of these multiple factors collectively shapes the current differentiated regional development patterns of cooperatives. A systematic analysis of the mechanisms and driving factors across these dimensions can precisely identify the practical bottlenecks hindering the high-quality development of cooperatives, thereby providing scientific evidence and theoretical support for local governments to formulate differentiated and targeted cooperative support policies.
Compared to existing research, the marginal innovations and research contributions of this paper are primarily reflected in three aspects. First, by constructing a five-dimensional comprehensive evaluation system encompassing standardized operation, operational performance, service scope, driving effect, industrial upgrading and using panel data from 30 Chinese provinces spanning 2015–2023, this study scientifically measures the comprehensive development level of farmers’ specialized cooperatives. This approach overcomes the limitations of existing research—which often relies on single-dimensional or single-performance metrics—and achieves a comprehensive, multidimensional quantitative assessment of cooperative development quality at the provincial level. Second, by introducing a geodetector model, this study systematically quantifies the independent explanatory power, pairwise interactive enhancement effects, and spatial heterogeneity of 11 core factors across four dimensions—regional economic development, agricultural production efficiency, rural human capital and land resource allocation. This approach overcomes the limitations of traditional linear models and deeply reveals the multidimensional, nonlinear, and coupled driving mechanisms of cooperative development. Third, adopting a macro-level perspective at the provincial level in China, this study systematically depicts the spatiotemporal evolution patterns of farmers’ specialized cooperatives and the spatial differentiation patterns driven by these factors. It accurately identifies the core constraints on cooperative development in different regions, providing solid empirical support for optimizing cooperative support policies and rationally allocating agricultural production resources across different regions, thereby effectively enhancing the relevance and practical guidance of the research conclusions.
The structure of the subsequent chapters of this paper is as follows: Part Two presents a literature review, which systematically reviews domestic and international research on the measurement of farmers’ specialized cooperatives’ development levels and their influencing factors, summarizes the shortcomings of existing research, and clarifies the research entry points and boundaries of this study. Part Three outlines the research design, which constructs an evaluation index system for cooperative development levels, elaborates on the core research methods, defines the connotations of variables, and explains data sources and preprocessing procedures. Part Four presents the empirical analysis, dissecting the temporal evolution patterns and spatial differentiation characteristics of the development levels of China’s farmers’ specialized cooperatives from 2015 to 2023. Part Five examines the driving mechanisms. Using a geographic detector model, it empirically tests the independent driving effects of various factors, their interactive coupling effects, and spatial driving differences, thereby systematically clarifying the multidimensional driving mechanisms of cooperative development. Part Six presents conclusions and recommendations, summarizing the core research findings and proposing targeted policy optimization suggestions. Part Seven provides a discussion, interpreting the underlying mechanisms based on the empirical results and analyzing the study’s limitations.
2. Literature Review
The level of cooperative development has long been a topic of academic concern. Scholars have established a relatively systematic research framework centered on cooperative development evaluation methods, measurement indicator systems, and key driving factors, providing important theoretical support and empirical evidence for understanding the patterns of cooperative development and optimizing supportive policies.
Regarding evaluation methodologies, a multidimensional and complementary analytical system has been constructed, covering economic, social, and ecological dimensions, from which five mainstream frameworks have evolved. The first paradigm is the financial performance framework. Lerman and Parliament (1991) pioneered a three-dimensional system encompassing efficiency, profitability, and leverage [
1], while Shamsuddin et al. (2018) further refined it by incorporating liquidity and member income indicators [
2]. The second paradigm is the multi-objective framework. Soboh et al. (2009) classified cooperative performance into economic and social dimensions and clarified corresponding evaluation logics [
3]. Martínez-López et al. (2023) further extended this framework by introducing organizational innovation variables to examine the heterogeneous effects of property rights reform [
4]. The third paradigm is the balanced scorecard framework. Targeting the operational characteristics of cooperatives, Estiasih (2021) constructed a mature four-dimensional evaluation system involving finance, customer service, internal operation processes, and organizational learning and growth, providing a reliable analytical tool for multi-angle comprehensive quality assessment of cooperatives [
5]. The fourth paradigm corresponds to the sustainability evaluation framework. Marcis et al. (2019) synthesized core sustainability indicators into a conceptual framework [
6], and Aboah et al. (2024) further expanded it by incorporating member, supply chain, and community dimensions [
7]. The fifth paradigm is the spatiotemporal evolution framework, which represents an emerging research perspective that breaks through the limitations of traditional static evaluation models. For example, Xu and Mai (2024) combined spatial econometric models and survival analysis methods to reveal the spatial agglomeration characteristics and dynamic evolutionary laws of cooperatives, and empirically confirmed the positive driving effect of organizational innovation [
8]. Consistent with this spatiotemporal research perspective, Zhang et al. (2024) constructed a cooperative sustainable management index and completed a macroscopic quantitative evaluation at the provincial scale across China [
9]. Bin et al. (2024) further explored the spatial distribution patterns and core driving factors of typical demonstration cooperatives based on empirical data from Hunan Province [
10].
In terms of indicator development, existing evaluation systems have gradually shifted from single financial indicator evaluation to comprehensive multi-dimensional assessment paradigms. standardized operation, operational performance, service scope, driving effect, industrial upgrading have been identified as five core evaluation dimensions in current research. In the dimension of standardized operation, Zhang and Hui (2014) took the compliance of profit distribution as a core indicator to characterize the governance risk of agricultural cooperatives [
11]. Li et al. (2024) further adopted the demonstration construction status of cooperatives to reflect the institutional recognition and standardized construction level of operating entities [
12]. Royer (2017) selected the retained fund ratio to evaluate the self-accumulation capacity and operational risk resistance of cooperatives [
13]. Ribašauskienė et al. (2019) applied the proportion of fiscal support to quantify the policy compliance and docking capacity of cooperative operations [
14]. In the dimension of operational performance, Wang et al. (2012) utilized per capita operating revenue to reflect the operating scale and profit level of cooperatives [
15]. Han et al. (2025) adopted distributable surplus indicators to assess operational efficiency and the welfare improvement effect on cooperative members [
16]. Surjaatmadja and Kusniawati (2020) took loan balance as a key index to characterize the financing capacity of cooperative organizations [
17]. Kenkel and Briggeman (2018) selected tax payment indicators to mirror the operational compliance and social contribution of cooperatives [
18]. In the dimension of service scope, Zhang and Wu (2023) measured the scale of agricultural productive services by analyzing the input centralization rate of cooperative operating resources [
19]. He and Chen (2024) adopted the output centralization level to reflect the market bargaining ability and marketization operation level of cooperatives [
20]. Lerman and Parliament (1991) proposed the industrial integration rate to characterize the industrial chain integration and value expansion capability of cooperative entities [
1]. In the dimension of driving effect, Gashaw and Kibret (2018) applied membership coverage rate to evaluate the social outreach and service coverage capacity of cooperatives [
21]. Grashuis and Su (2019) adopted the non-member influence ratio to quantify the external demonstration and driving effects of cooperatives [
22]. Wang et al. (2021) further quantified the economic driving effect of cooperatives on farmers’ income growth [
23]. In the dimension of industrial upgrading, Beverland (2007) took brand construction intensity to reflect the core market competitiveness of cooperative-driven agricultural industries [
24]. Kuan et al. (2024) selected product certification rate to measure the standardized development level of industrial operations [
25]. Harris et al. (1996) analyzed the proportion of processing entities to characterize the industrial value-added capacity of cooperative operations [
26]. Carini and Carpita (2014) adopted the service transformation ratio to evaluate the operational model innovation and industrial upgrading potential of cooperatives [
27].
Existing research on driving factors has demonstrated that the development of agricultural cooperatives is a complex process driven by the coupled interaction of multiple factors, among which four major categories of influencing dimensions have been widely documented. The first category concerns regional economic development. Ghiasy et al. (2009) verified that regional economic foundation serves as a core determinant shaping cooperative development [
28]. Egerstrom (2016) highlighted the essential role of market-oriented external driving forces in stimulating cooperative growth [
29]. Schmidt et al. (2015) further validated the correlation between urbanization progress and the agglomeration intensity of cooperative organizations [
30]. Paudel et al. (2022) provided empirical evidence for the long-term interactive relationship between economic development and cooperative evolution [
31]. Liang et al. (2024) revealed the significant spillover effects of regional economic fluctuations on cooperative operation [
32]. Sunarwibowo et al. (2025) stressed the critical supporting function of external capital injection [
33], while Jokka et al. (2026) further supplemented that market accessibility and credit availability act as key constraints for cooperative development in remote rural areas [
34]. The second category focuses on agricultural production efficiency. Multiple studies have confirmed the close association between production efficiency and cooperative sustainability. Kehinde et al. (2022) reported that standardized service provision by cooperatives effectively facilitates crop yield improvement [
35]. Xaba et al. (2020) argued that insufficient technical efficiency constitutes a major bottleneck restricting high-quality cooperative development [
36]. Liang et al. (2024) pointed out that agricultural product price volatility induces operational risks for cooperative entities [
32]. Wardhiani et al. (2023) emphasized the positive contributions of technical capacity accumulation and digital technology adoption [
37]. Anigbogu et al. (2015) validated the inherent correlation between agricultural input intensity and final yield performance [
38], and Zhu et al. (2024) further extended the research scope by highlighting the facilitating effect of eco-friendly technology adoption on sustainable cooperative operation [
39]. The third dimension emphasizes rural human capital. Human capital heterogeneity is regarded as a vital source of regional differences in cooperative development. Garnevska (2011) attributed unbalanced cooperative development to regional educational gaps [
40]. Ghiasy et al. (2009) underscored the supporting value of high-quality human capital for cooperative entrepreneurship [
28]. Idrisa et al. (2007) confirmed that educational attainment of female rural residents positively promotes cooperative construction [
41]. Nevertheless, Khan et al. (2016) and Buang et al. (2023) proposed non-significant empirical results regarding human capital effects [
42,
43], which differ from the findings of Mutiarni et al. (2023) [
44]. Subsequent studies further refined human capital research from the perspective of organizational governance. Jamaluddin et al. (2023) found that board human capital stock significantly improves cooperative governance performance [
45], and Aazami et al. (2011) highlighted the unique advantages of female management experience in optimizing operational decision-making [
46]. The fourth dimension relates to land resource allocation. Land resource allocation and transfer characteristics profoundly reshape the operational structure of rural cooperatives. Peng et al. (2021) demonstrated that rural land transfer promotes the structural optimization of cooperative production and operation systems [
47]. Xu et al. (2024) identified an inverted U-shaped relationship between land operation scale and cooperative development level [
48]. Zhang (2012) pointed out that land transfer activities generate market competition pressure on cooperative entities [
49]. Han et al. (2025) further revealed that surplus distribution mechanisms significantly affect farmers’ land transfer willingness and cooperative membership stability [
16].
In summary, existing domestic and international studies have yielded relatively abundant achievements concerning evaluation methodologies, measurement indicators, and driving mechanisms underlying the developmental performance of farmers’ specialized cooperatives. Despite these progressions, several research gaps remain in the current literature. Although diverse evaluation frameworks have been proposed, a unified and standardized evaluation criterion is still absent for cooperative performance assessment. Current indicator systems predominantly rely on macroscopic statistical data, while insufficient attention has been paid to micro-internal operational mechanisms that determine cooperative development. Furthermore, prior studies have largely neglected regional disparities and spatial heterogeneity in the evolutionary process of cooperatives. Against this research backdrop, the present study attempts to establish a systematic and unified multidimensional evaluation framework. This framework is expected to provide a refined theoretical basis and targeted policy implications for facilitating the high-quality and regionally balanced development of farmers’ cooperatives.
3. Materials and Methods
3.1. Study Area
This study takes the 30 provincial-level administrative regions of mainland China as its units of analysis (excluding the Tibet Autonomous Region, the Hong Kong Special Administrative Region, the Macao Special Administrative Region, and Taiwan) and uses data from 2015 to 2023 as the empirical sample. To investigate differences among regions with varying resource endowments, the study divides them into three major economic regions: the East, the Central, and the West. The Eastern region includes 11 provinces: Beijing, Tianjin, Hebei, Shandong, Jiangsu, Zhejiang, Shanghai, Fujian, Guangdong, Hainan, and Liaoning; the Central region includes 8 provinces: Shanxi, Anhui, Jiangxi, Henan, Hubei, Hunan, Heilongjiang, and Jilin; and the Western region includes 10 provinces: Inner Mongolia, Shaanxi, Ningxia, Gansu, Qinghai, Xinjiang, Sichuan, Chongqing, Yunnan, Guizhou, and Guangxi.
3.2. Data Sources
As there is currently no systematic statistical database specifically for farmers’ specialized cooperatives, the data in this study is divided into two parts: data on indicators for evaluating the development level of cooperatives and data on influencing factors, with detailed specifications presented in the following sections.
Data on indicators for evaluating the development level of cooperatives. The 18 indicators used in this paper to evaluate the development level of farmers’ specialized cooperatives are primarily sourced from China Rural Operation and Management Statistical Yearbook (2015–2018), China Rural Cooperative Economy Statistical Yearbook (2019–2023), and China Rural Policy and Reform Statistical Yearbook (2019–2023). The study covers the entire country in terms of data selection. However, since the aforementioned statistical sources do not provide cooperative-related data for the Tibet Autonomous Region, the Hong Kong Special Administrative Region, the Macao Special Administrative Region, and Taiwan, this study excludes these regions from the analysis. Consequently, the final dataset consists of panel data from 30 provinces (autonomous regions and municipalities) across China for the period 2015–2023.
Data on factors influencing the level of cooperative development. This paper establishes explanatory variables across four dimensions: regional economic development, agricultural production efficiency, rural human capital and land resource allocation. Eleven factors, including the urbanization rate, are selected as explanatory variables, and the level of cooperative development is used as the dependent variable for empirical analysis. The explanatory variable data consist of provincial-level panel data from 2015 to 2023, all sourced from the China Statistical Yearbook and China Rural Statistical Yearbook.
3.3. Research Methodology
3.3.1. Comprehensive Evaluation of the Development Level of Farmers’ Specialized Cooperatives
Based on previous research findings, this study develops a comprehensive evaluation system to quantify the developmental level of farmers’ specialized cooperatives from five dimensions, including Standardized Operation (B1), Operational Performance (B2), Service Scope (B3), Driving Effect (B4), and Industrial Upgrading (B5). Standardized Operation (B1) constitutes the institutional basis for the sustainable development of cooperatives and the protection of member interests. Four indicators are adopted to reflect this dimension, covering Normative Profit Repatriation Rate (B11), Demonstration Rate (B12), Public Welfare Funds and Risk Funds (B13), and Proportion of Cooperatives Receiving Fiscal Support Funds (B14) [
11,
12,
13,
14]. Operational Performance (B2) reflects resource allocation efficiency and market competitiveness across cooperative entities. The corresponding evaluation indicators include Average Operating Income per Cooperative (B21), Average Distributable Surplus per Cooperative (B22), Average Loan Balance per Cooperative (B23), and Average Tax Contribution per Cooperative (B24) [
15,
16,
17,
18]. The Service Scope (B3) dimension characterizes the capacity of cooperatives to serve smallholder farmers and drive local industrial progress. This dimension is measured by three core indicators, namely Unified Procurement Rate of Agricultural Supplies (B31), Unified Sales Ratio of Agricultural Products (B32), and Integration Rate of Production, Processing, and Sales (B33) [
1,
19,
20]. The Driving Effect (B4) dimension highlights the pivotal function of cooperatives in bridging smallholder farming with modern agricultural systems. Three indicators are applied to evaluate such driving capacity, including Farmers’ Membership Rate (B41), Driving Rate of Non-Members (B42), and Increase in Farmers’ Income (B43) [
21,
22,
23]. Industrial Upgrading (B5) determines the quality improvement and efficiency enhancement of cooperative operations while facilitating industrial chain extension and value chain promotion. The evaluation system incorporates four indicators for this dimension, which refer to Degree of Branding (B51), Certification Rate of Agricultural Products (B52), Proportion of Cooperatives Establishing Processing Entities (B53), and Proportion of Service Industry Cooperatives (B54) [
24,
25,
26,
27]. To achieve scientific and comparable evaluation results and eliminate dimensional differences among heterogeneous indicators, the extreme value normalization method is utilized for data standardization to unify all indicator magnitudes. The relevant calculation formulas are specified in the following section:
In the formula, is the indicator value for the -th indicator of the -th study unit; is the standardized indicator value; is the maximum value of the -th indicator for the -th study unit; is the minimum value of the -th indicator for the -th study unit.
The indicator weights are determined using the entropy method, with the calculation formula as follows:
In the formula,
represents the proportion of the
-th data point under the
-th indicator;
is the entropy value of the
-th indicator;
is the redundancy of information entropy;
is the weight of the
-th indicator, with the calculated weights shown in
Table 1. The development level of the cooperative is then evaluated using the following formula:
In the formula,
is the comprehensive evaluation index of the cooperative;
is the weight of the indicator
;
is the standardized value of the indicator; and
is the total number of evaluation indicators. Detailed data are provided in the
Appendix A.
3.3.2. Moran’s Index
Moran’s index comprises the global Moran index and the local Moran index. The global Moran index can be used to identify whether spatial correlation exists in a region as a whole. The local Moran index can be used to identify local clustering characteristics within a region. The formulas for the global Moran index and the local Moran index are as follows:
In the formula, represents the global Moran index, represents the local Moran index, denotes the number of study samples, and represent the cooperative development levels of province (city, district) and province (city, district) , respectively, denotes the mean cooperative development level for that year, is the spatial weight matrix, and denotes the standardized weight matrix. The local Moran I can classify the level of cooperative development in each region into four types. Specifically, when and , it is high–high clustering. When and , it is low–high clustering. When and , it is low–low clustering. When and , it is high–low clustering.
3.3.3. Kernel Density Model
To investigate the evolution of the development level of China’s farmers’ specialized cooperatives, this paper employs the Kernel Density Estimation (KDE) method. KDE is a robust nonparametric estimation method that describes the distribution of a random variable using a continuous curve by estimating the probability density. This paper uses a Gaussian kernel function to estimate and plot the kernel density curve of the development level of China’s farmers’ specialized cooperatives from 2015 to 2023. The calculation formula is:
where
is the kernel density function, n is the number of observations, namely the number of study units,
is the mean,
the kernel function, and
is the bandwidth.
3.3.4. Gini Coefficient Model
In order to meet the input requirements of the Geodetector Detector for discrete independent variables, the K-means clustering algorithm in SPSS software 26.0 was employed to discretize continuous explanatory variables. The Elbow Method was utilized as the primary criterion in determining the number of clusters (K). The K-means clustering process was repeated multiple times, with each iteration employing a distinct value of K. Consequently, the within-cluster sum of squares (WCSS) corresponding to each value of K was extracted and documented. Subsequently, a graph was plotted, the purpose of which was to demonstrate the variation in WCSS against K. It is evident from the examination of the sample data that when the parameter K was assigned a value of 5, the rate of decline in the curve diminished considerably. This specific value was determined to be the ‘inflection point’. Consequently, it was determined that K = 5 was the optimal number of clusters.
This study employs the Dagum Gini coefficient method. A higher value of the overall Gini coefficient (
) indicates greater overall disparity. It is decomposed into three components: intra-regional disparity (
), inter-regional disparity (
), and hyper-variability (
), which are used to analyze regional differences in the development levels of cooperatives. The formula is as follows:
In the equation, represents the number of provinces in each region, represents the number of regions into which the area is divided. represents the average level of cooperative development, represents the number of provinces within region , and represents the level of cooperative development in any given province.
3.3.5. Geographical Detector Model
Geographic detectors are used to analyze the spatial heterogeneity of environmental and socioeconomic data and reveal the underlying driving forces. In this paper, factor detectors and interaction detectors are employed to identify the primary driving factors of cooperative development levels and to explore the underlying mechanisms. Factor detectors are used for single-factor driving analysis, where the explanatory power of a factor (
) is used to determine the extent to which each variable factor contributes to changes in the dependent variable, thereby testing the extent to which a factor can explain the spatial differentiation of a geographic phenomenon. The calculation formula is:
where
represents the factor’s ability to explain the spatial heterogeneity of the dependent variable, i.e., the driving capacity of the factor on the level of cooperative development.
denotes the number of layers into which the data is stratified by the factor;
and
represent the total sample size of the dependent variable and the sample size in the th
layer, respectively; and
and
represent the total variance of the dependent variable and the variance in the th
layer, respectively.
The interaction detector is used for multi-factor interaction-driven analysis. It identifies interaction types between different factors through spatial overlay, compares the explanatory power of two factors acting independently with that of their interaction, and determines whether the explanatory power increases or decreases when the two factors act together, or whether the effects of the factors on the dependent variable are independent of each other. This method is used to assess whether multiple driving factors have an interactive driving effect on the development level of cooperatives. First, the spatial partitions of
and
are spatially overlaid to form a new spatial partition factor,
. Then, the explanatory power of
,
, and
is calculated separately. By comparing these three types of explanatory power, the interaction types between
and
are determined. Detailed information on interaction types and effects is listed in
Table 2.
4. Spatial-Temporal Evolution Characteristics of Cooperative Development Level
4.1. Temporal Evolution Characteristics of Cooperative Development Level
4.1.1. Overall Temporal Evolution Characteristics
As shown in
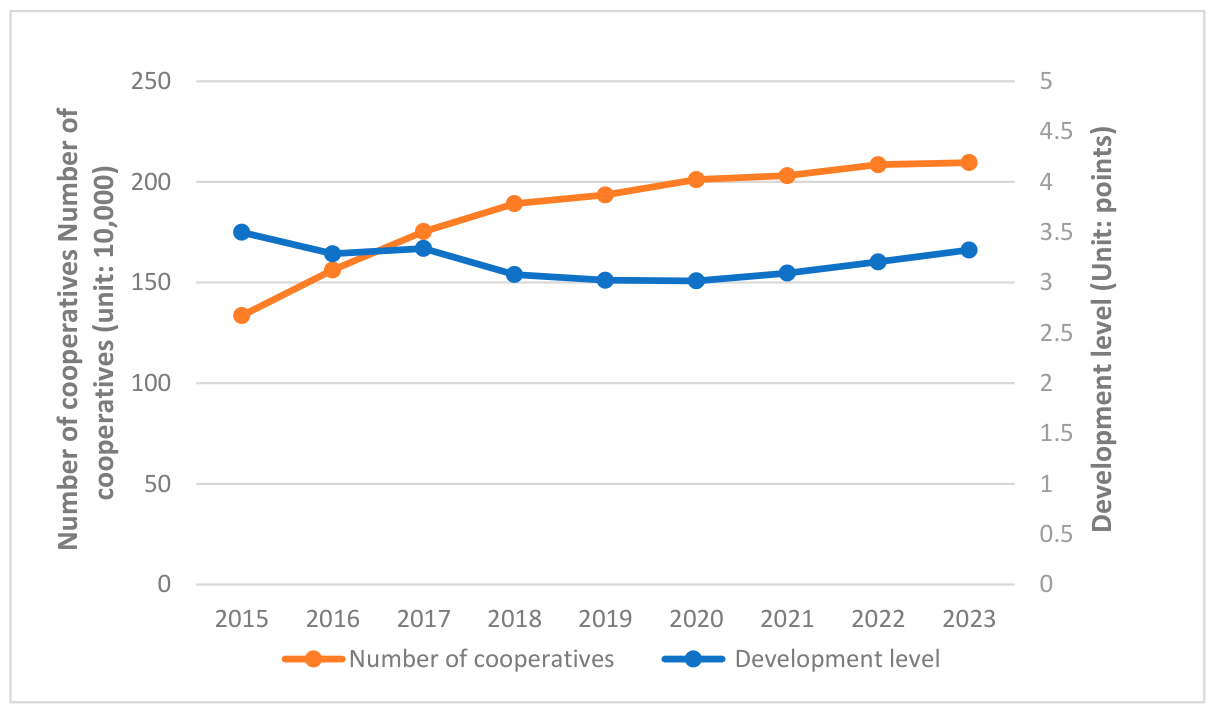
Figure 1, the development level of cooperatives in China from 2015 to 2023 exhibited a year-on-year decline, with the score decreasing from 3.499 in 2015 to 3.324 in 2023, a drop of 5.0%. The development level and number of cooperatives are presented in
Table 3.
During the same period, the number of cooperatives increased from 1,336,090 to 2,096,490. This indicates that the level of cooperative development has not improved in tandem with the increase in numbers. The root cause lies in the government’s long-standing policy of encouraging cooperative registration and simplifying entry barriers, with evaluations prioritizing quantity and scale over operational quality. This led to the emergence of a large number of shell cooperatives, dragging down the overall development level of cooperatives, which fell to its lowest point during the study period in 2018. To address this issue, starting in 2018, the state implemented the newly revised “Law on Farmers’ Specialized Cooperatives” and the “Model Articles of Association for Farmers’ Specialized Cooperatives.” In 2019, the Ministry of Agriculture and Rural Affairs issued the “Several Opinions on Carrying Out the Standardization and Improvement Campaign for Farmers’ Cooperatives,” focusing on strengthening the standardized operation of cooperatives. At the same time, multiple departments jointly launched a special campaign to clean up and rectify shell cooperatives, achieving tangible results. Since then, the overall development level of cooperatives has gradually rebounded.
4.1.2. Time-Series Characteristics of Each Dimension
According to
Table 4, the characteristics of the evolution of the cooperative development level in China from 2015 to 2023 are as follows.
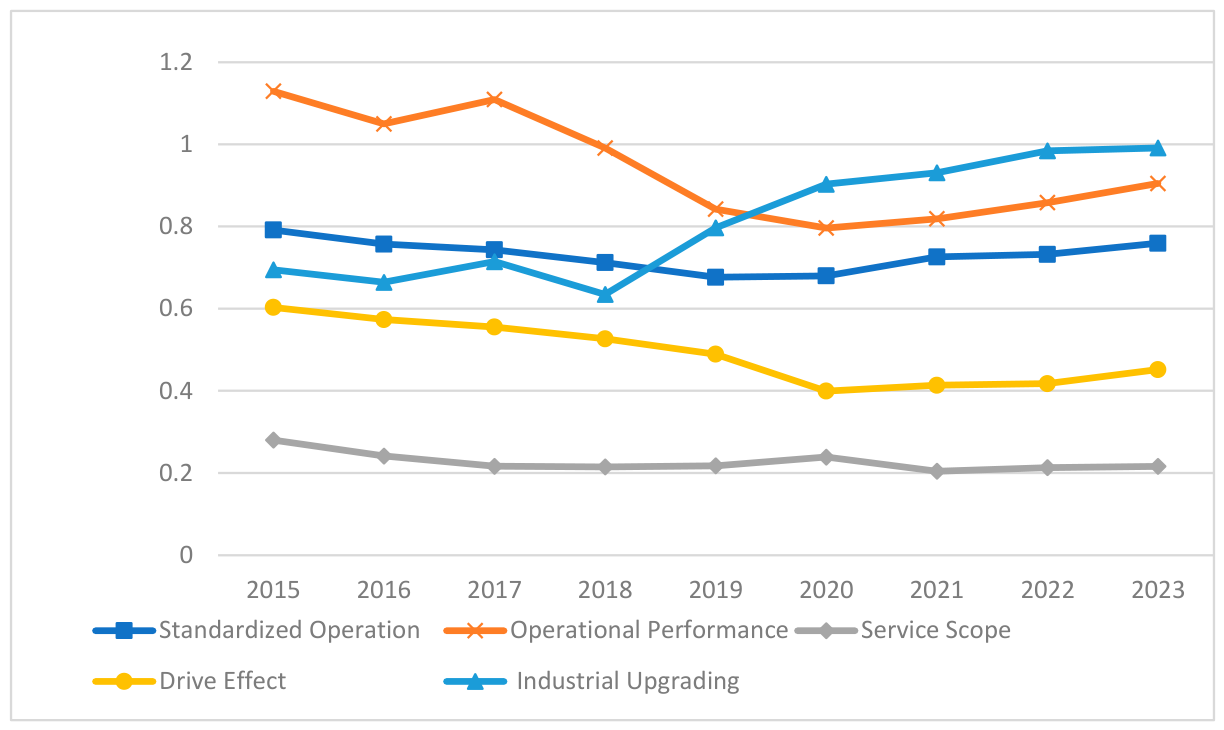
As shown in
Table 4 and
Figure 2, the trends in the various dimensions of the development of cooperatives in China between 2015 and 2023 are as follows:
- (1)
Standardized Operation and the Service Scope have developed steadily. Specifically, the former fell from 0.792 in 2015 to 0.759 in 2023, whilst the latter declined from 0.280 in 2015 to 0.216 in 2023.
- (2)
Both Operational Performance and the role in Driving Effect showed a downward trend. Specifically, the former fell from 1.129 points in 2015 to 0.905 points in 2023, while the latter fell from 0.603 points in 2015 to 0.452 points in 2023.
- (3)
The capacity for Industrial Upgrading improved. The Industrial Upgrading score rose from 0.695 in 2015 to 0.992 in 2023, emerging as a new driving force for enhancing the development level of China’s cooperatives. Between 2015 and 2023, the number of service sector cooperatives in China increased from 108,704 to 162,569, representing an average annual growth rate of 5.144%. The number of cooperatives establishing processing entities increased from 26,364 to 121,378, with an average annual growth rate of 21.09%. Overall, the industrial integration capacity of China’s cooperative sector has improved, and it is gradually undergoing a transformation and upgrading toward higher levels of development.
4.2. Spatial Evolution Characteristics of Cooperative Development Levels
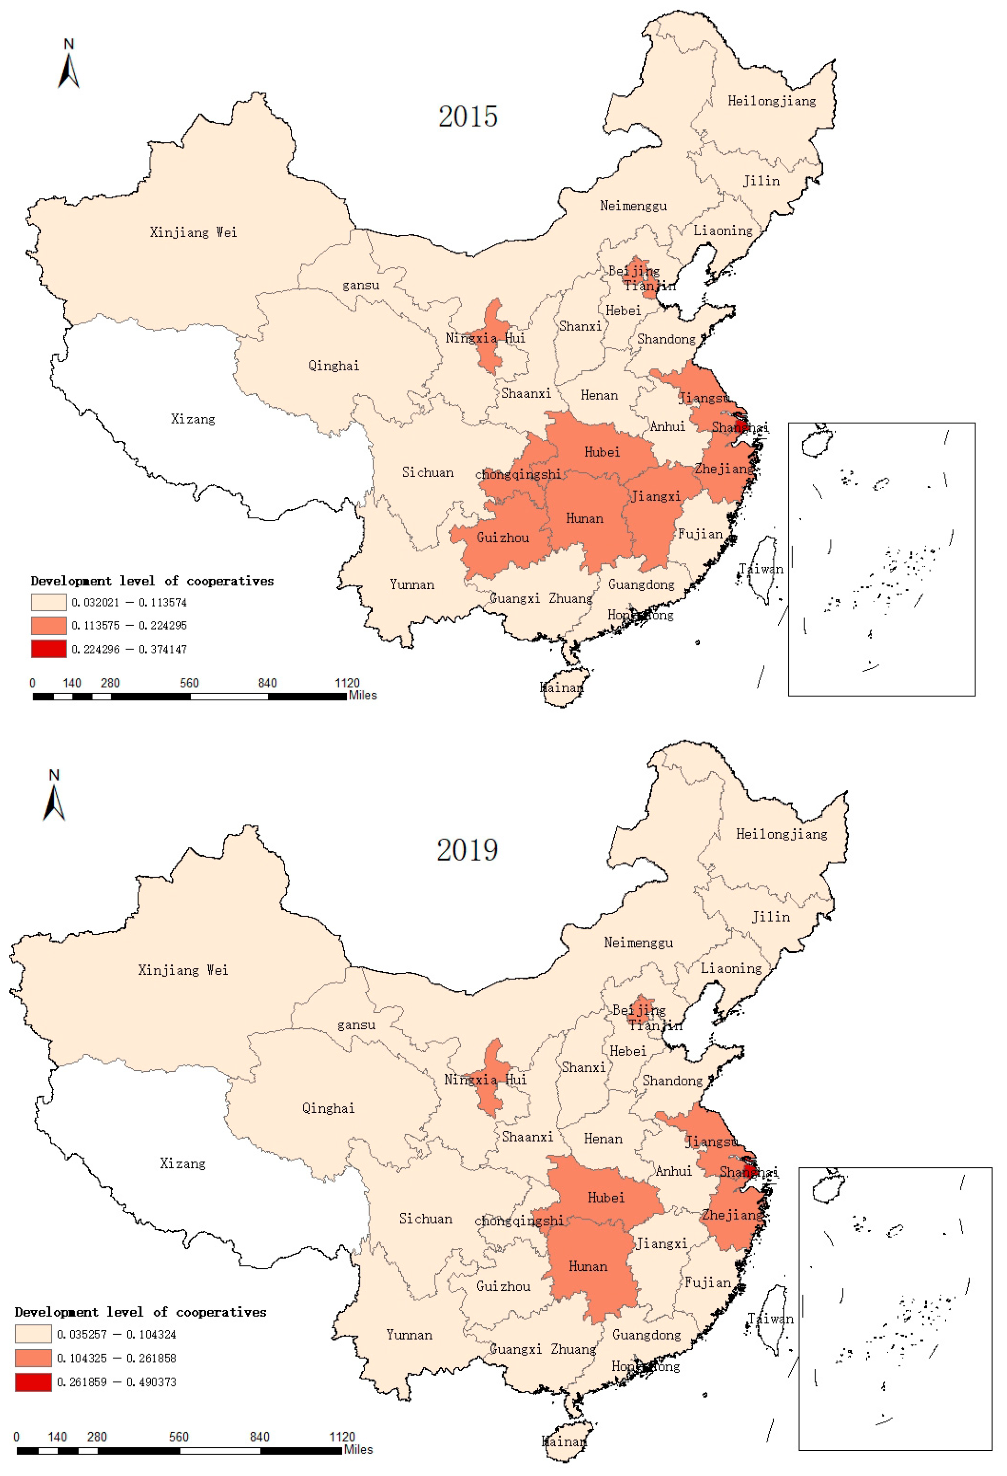
To illustrate the spatiotemporal evolution characteristics of the development level of cooperatives in China more clearly, this study employed the natural breaks method [
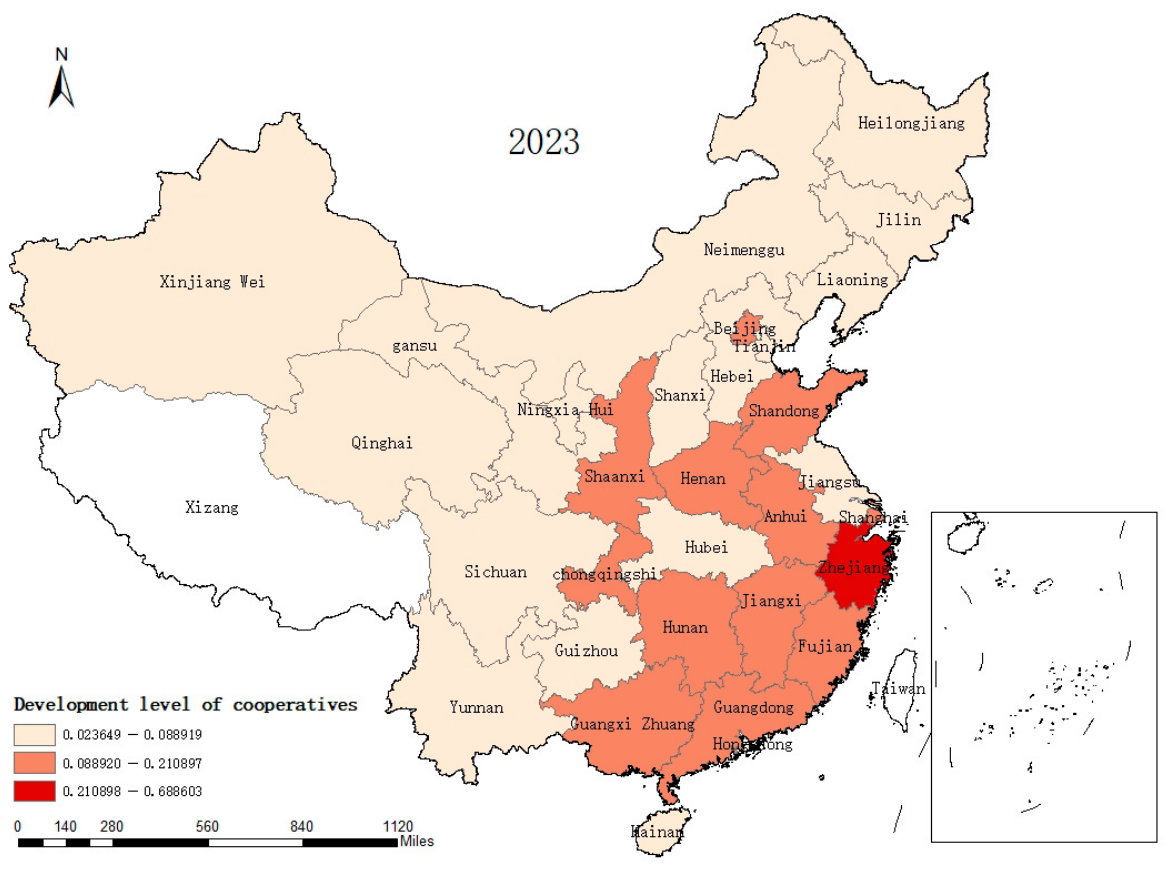
40] to classify the relative development levels of cooperatives into three tiers: high, medium, and low. Data from 2015, 2019, and 2023 were selected, and ArcGIS 10.7 software was used to visually analyze the development levels in each province (
Figure 3). The development levels of cooperatives in 2015, 2019 and 2023 were classified into three grades using the natural breakpoint method to illustrate the evolution of their spatial patterns.
In 2015, the spatial structure of the comprehensive development level of cooperatives exhibited a “pyramid-shaped” distribution pattern, with the number of provinces increasing progressively from high to medium to low levels. Specifically, the first tier comprised Shanghai in the eastern region, and the second tier comprised 10 provinces: Beijing, Tianjin, Jiangsu, and Zhejiang in the eastern region; Hubei, Hunan, and Jiangxi in the central region; Ningxia in the northwestern region; and Chongqing and Guizhou in the southwestern region. The remaining provinces were in the third tier, widely distributed across the northeast, northwest, and southwest, as well as parts of the eastern coastal areas and the central inland regions.
In 2019, the overall development level of cooperatives continued to follow the original “pyramid” distribution pattern. Compared with 2015, the number of provincial-level units at the medium level continued to decline, while the proportion of those at the low level rose significantly. Among these, the first tier comprises only Shanghai, a single eastern province or municipality, whose developmental advantage has been further consolidated; the second tier consists of six provinces—Beijing, Jiangsu, Zhejiang, Hubei, Hunan, and Ningxia—a reduction of four compared to 2015, primarily concentrated in the eastern coastal and core regions of the middle Yangtze River; and the third tier encompasses the remaining provinces, an increase of four compared to 2015, with provinces such as Tianjin, Jiangxi, Chongqing, and Guizhou—formerly in the second tier—having dropped to this tier. This reflects a further widening of regional disparities in the development of cooperatives in China, with the majority of provinces still at a low level of development.
In 2023, the development level of China’s farmers’ specialized cooperatives exhibited a typical “pyramid-shaped” spatial distribution pattern, with regional development gaps narrowing significantly compared to 2019 and spatial balance improving markedly. The first tier remained at one province, with Zhejiang replacing Shanghai. The number of provinces in the second tier increased from six to twelve, as a large number of provinces in central, western, and southwestern China moved up from the third tier to the second tier. Only Hubei and Ningxia dropped from the second tier back to the third tier. The number of provinces in the third tier decreased from 24 to 17. Overall, the group of provinces with moderate development continued to expand, while the number of provinces with low development levels decreased significantly. Regional development gaps have continued to narrow, and spatial development equity has significantly improved.
In summary, from 2015 to 2023, the development of China’s farmers’ specialized cooperatives continued to follow a pyramid-shaped spatial hierarchy, with distinct regional development patterns. The eastern region has long held a developmental advantage, with the core of high-level development shifting from Shanghai to Zhejiang; the central and southwestern regions demonstrated strong development resilience, with most provinces achieving tier upgrades in later years and the scale of medium-level development continuing to expand. Development in North China and Northwest China was marked by significant fluctuations, with some provinces slipping down the hierarchy and exhibiting insufficient stability. The Northeast remained in the low-level tier, with prominent developmental shortcomings. From a temporal perspective, regional disparities nationwide continued to widen from 2015 to 2019, the number of provinces at the intermediate level decreased, and inland provinces generally lagged behind. From 2019 to 2023, the spatial pattern improved significantly, with provinces in the central and western regions achieving rapid development and inter-provincial development gaps narrowing continuously. Overall, the level of spatial balance in China’s cooperative development has steadily improved, but the problem of lagging development in inland regions such as the Northeast and Northwest remains unresolved, and a pattern of regional differentiation in development persists.
4.3. Spatial Clustering Effects of Cooperative Development Levels
4.3.1. Global Spatial Autocorrelation
To investigate the spatial clustering of cooperative development levels in China, Moran’s I was used to assess the spatial correlation of the national cooperative development level, with the results presented in
Table 5. Moran’s I values for the national cooperative development level from 2015 to 2023 were all greater than 0 and passed the 1% significance test. This indicates a significant and positive global spatial autocorrelation in the development levels of cooperatives, meaning that their spatial distribution is not random. Rather, it reflects a clustering of areas with similar high or low values. This suggests that the development level of cooperatives in any given province is influenced not only by internal factors such as its economic and social conditions but also by the cooperative development status in neighboring provinces.
4.3.2. Local Spatial Autocorrelation Analysis
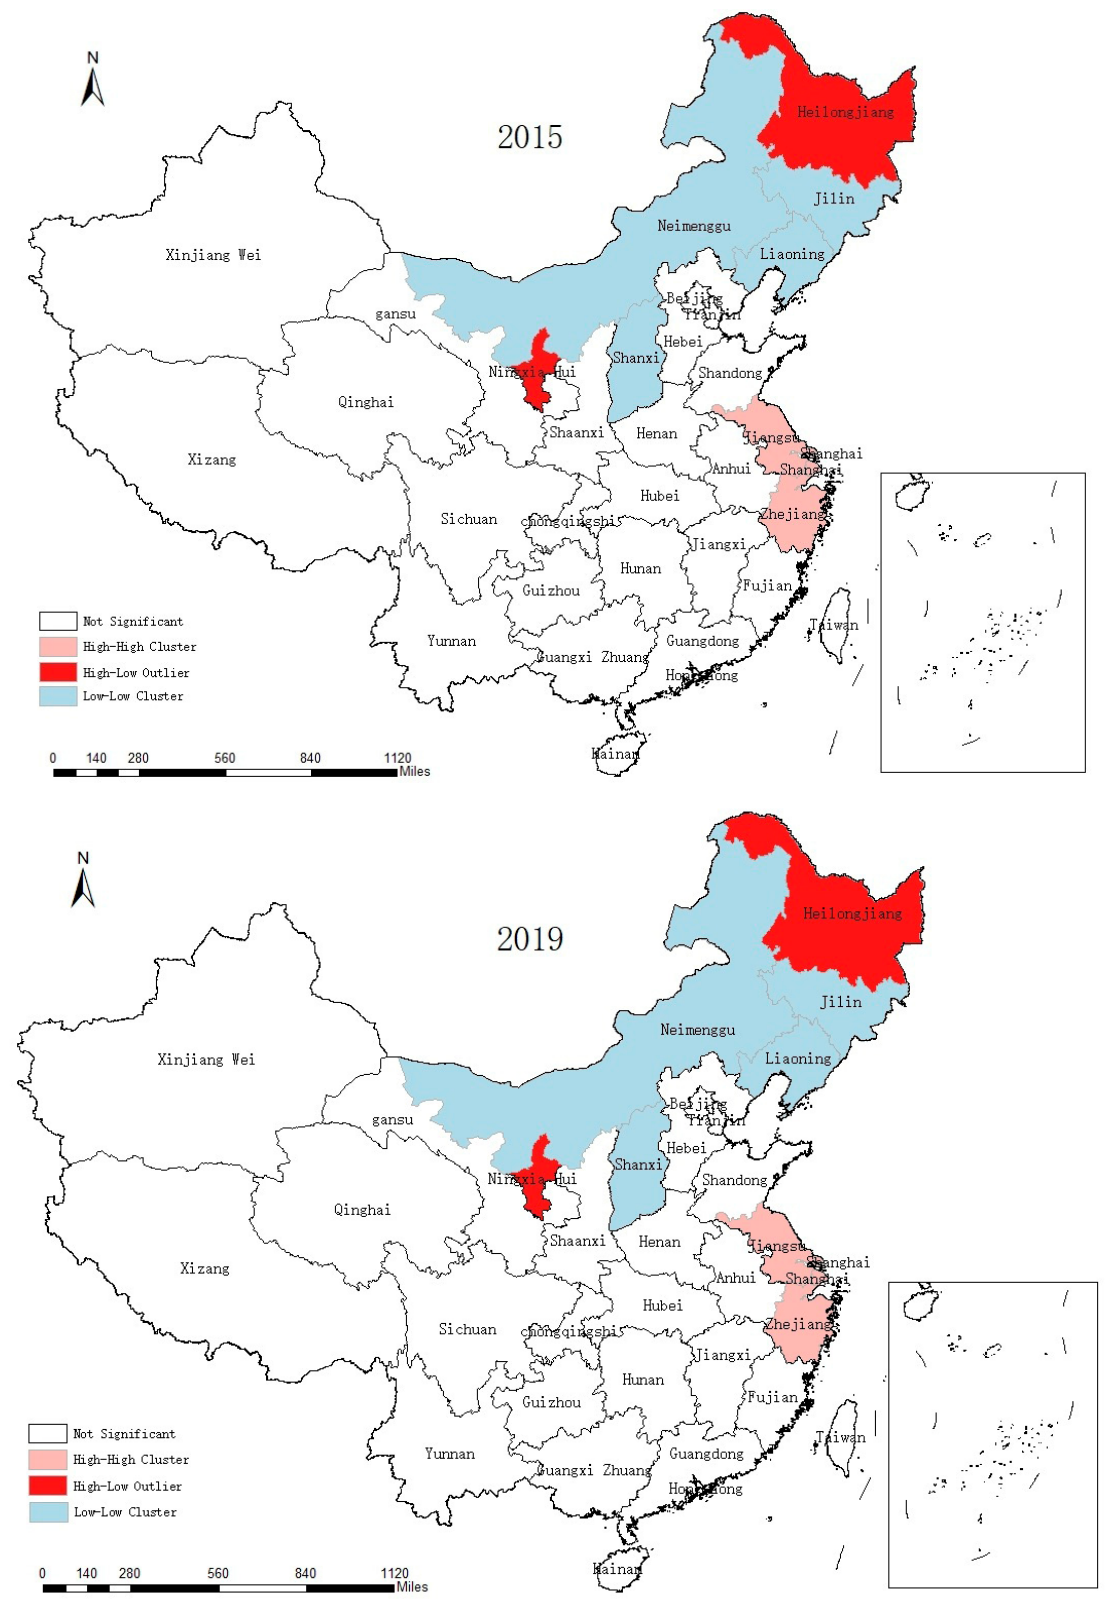
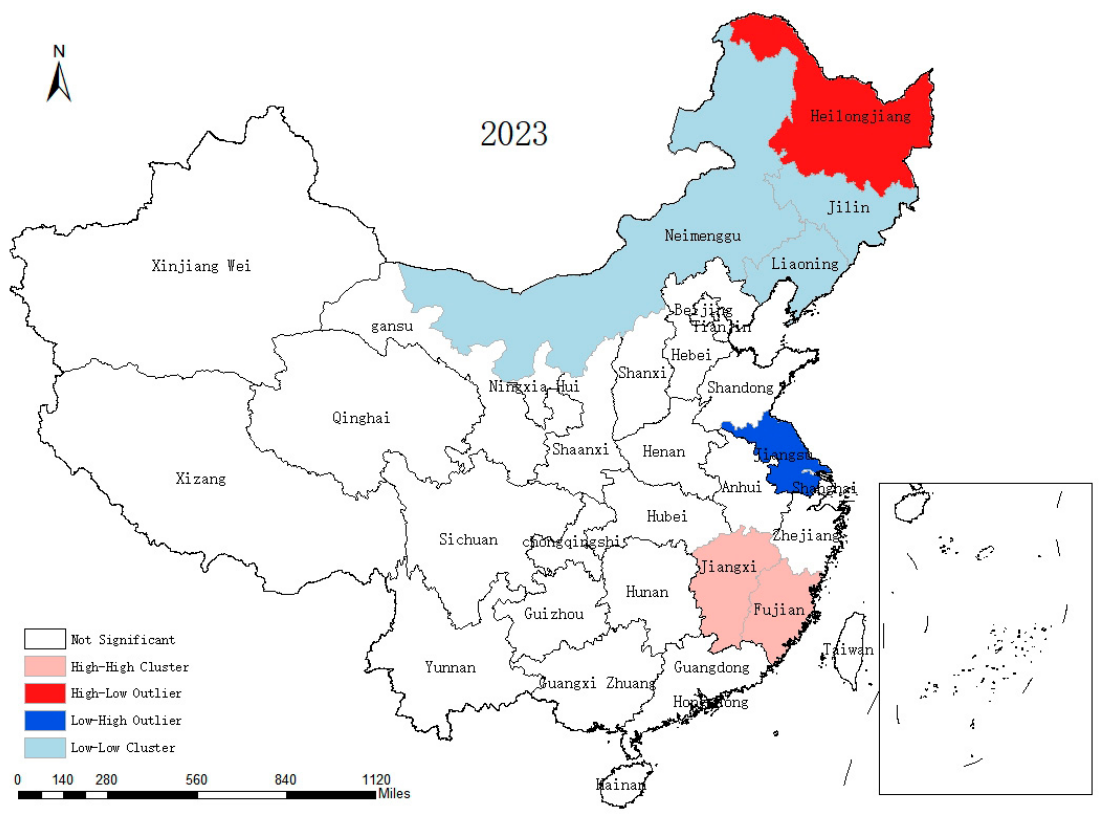
This study used the LISA cluster map to analyze the spatial correlation between the development levels of cooperatives in each province and those in neighboring provinces. Due to space limitations, only the results for 2015, 2019, and 2023 are presented.
Figure 4 illustrates the spatial correlation of the comprehensive development levels across provinces in these three years; overall, the pattern remained relatively stable throughout the nine-year period.
From the perspective of H-H type provinces, in 2015, three provinces—Jiangsu, Shanghai, and Zhejiang—fell into this category, indicating that these regions themselves had a relatively high level of cooperative development, and their neighboring provinces also exhibited a high level of development, forming a stable high-value agglomeration area. In 2019, this agglomeration pattern remained stable, with Jiangsu, Shanghai, and Zhejiang still exhibiting an H-H development trend. In 2023, the center of regional high-value agglomeration shifted, with Jiangsu, Shanghai, and Zhejiang exiting the H-H agglomeration group; Jiangxi and Fujian took their place, becoming emerging H-H agglomeration provinces.
From the perspective of L-L type provinces, in 2015, four provinces—Inner Mongolia, Jilin, Liaoning, and Shanxi—were classified as such. This meant that these regions themselves had a relatively low level of cooperative development, and their neighboring provinces also had low levels, forming a low-value agglomeration area. In 2019, this low-value agglomeration pattern remained stable, with Inner Mongolia, Jilin, Liaoning, and Shanxi still exhibiting an L-L development trend. By 2023, this low-value agglomeration pattern had somewhat converged. Shanxi dropped out of this category, while Inner Mongolia, Jilin, and Liaoning remained L-L type provinces, with the scope of low-value agglomeration stabilizing in the Northeast region.
From the perspective of H-L type provinces, in 2015 and 2019, two provinces—Ningxia and Heilongjiang—were classified as such, indicating that these regions themselves had a relatively high level of cooperative development, but their neighboring provinces had low levels, presenting a typical “high-value island” feature. By 2023, Ningxia had exited this category, leaving only Heilongjiang as an H-L province, and this pattern gradually converged compared to the previous period.
Regarding L-H type provinces, no such spatial clustering characteristics emerged between 2015 and 2019; it was not until 2023 that Jiangsu Province became the nation’s sole L-H type clustering region. This evolution of the spatial pattern indicates that as the development level of farmers’ specialized cooperatives in surrounding regions such as Shanghai and Zhejiang continued to rise, the relative lag in the development of cooperatives in Jiangsu gradually became more pronounced, further highlighting the development gap between regions and making regional development imbalances more evident at the spatial level.
In summary, the development levels of China’s farmers’ specialized cooperatives from 2015 to 2023 exhibited significant spatial autocorrelation, and the local agglomeration patterns displayed clear temporal evolution patterns. The high–high clustering core shifted spatially from the Yangtze River Delta region to the southeast, the distribution range of high-value clusters shifted, and the clustering layout underwent significant adjustments. The scope of low–low clustering gradually contracted and stabilized in the Northeast, and the trend of contiguous low-value regional clustering gradually weakened. The number of high–low “island-type” agglomerations continued to decrease, and interprovincial development imbalances eased somewhat. Low–high spatially heterogeneous agglomeration patterns emerged for the first time toward the end of the study period, clearly reflecting the widening internal development gaps within eastern coastal provinces. Overall, the local spatial agglomeration patterns of China’s cooperative development are undergoing dynamic reshaping, with spatial linkage structures continuously optimizing. However, regional development imbalances persist, and spatial heterogeneity is becoming increasingly pronounced.
4.3.3. Results on Cooperative Core Density
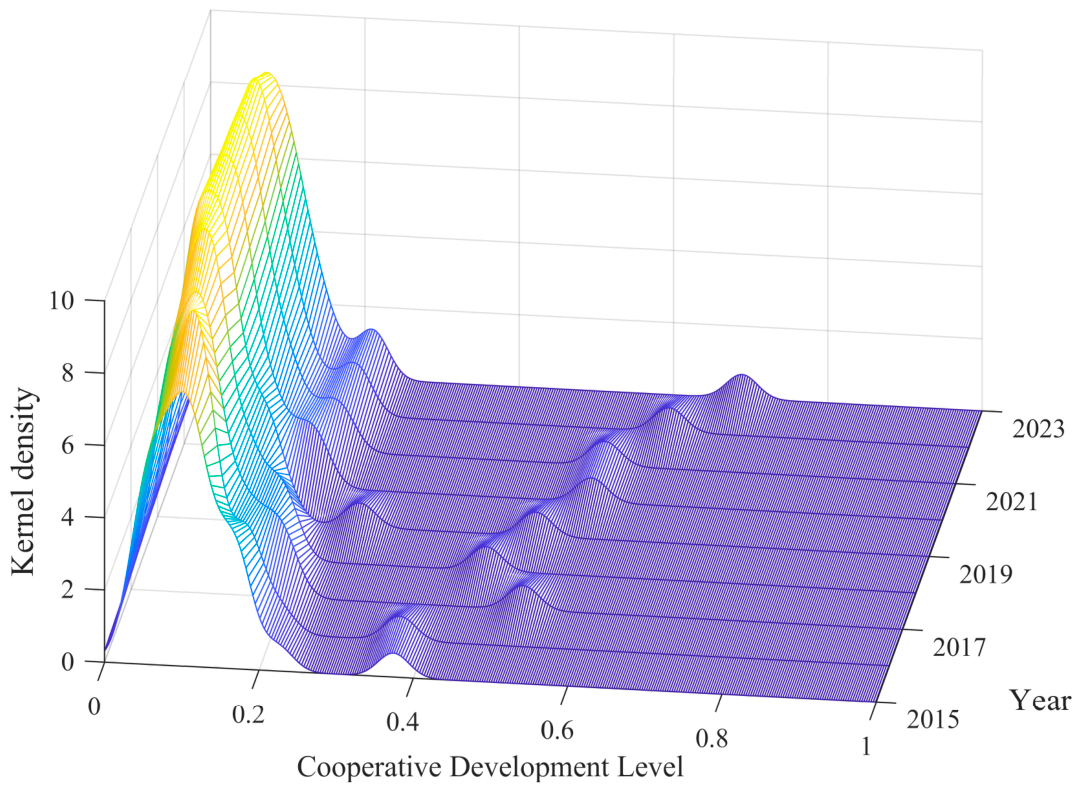
Based on the kernel density estimation results presented in
Figure 5, the distribution pattern and dynamic evolution of the development levels of farmers’ specialized cooperatives nationwide from 2015 to 2023 exhibit distinct phased characteristics. Overall, the kernel density curve consistently displays a pronounced unimodal distribution, with the main peak long concentrated in the low-level range (around 0–0.2) and the peak height remaining consistently high. This indicates that during the sample period, the development levels of cooperatives in most regions remained at a low level, with overall improvement proceeding slowly. In terms of temporal trends, the position of the curve’s main peak exhibited a slow rightward shift, indicating that the overall mean of cooperative development levels increased over time; simultaneously, the height of the main peak showed a downward trend, suggesting that the dispersion of cooperative development levels across regions widened, with regional disparities gradually becoming apparent. Furthermore, the right tail of the curve remains relatively flat and does not form a distinct multi-peaked structure, indicating that the diffusion effect of high-level cooperatives is not yet significant, and a gradient differentiation pattern in development levels has not yet formed. Overall, the development level of cooperatives during the study period exhibits evolutionary characteristics of low-level clustering, slow improvement, and widening disparities, and remains in a stage of transition from a low-level equilibrium to a high-level disequilibrium.
4.3.4. Gini Coefficient of Cooperative Development Levels
This study employs the Dagum Gini coefficient and its decomposition method, utilizing Matlab 2021 software to calculate and decompose the spatial disparities in the development levels of China’s farmer specialized cooperatives during the 2015–2023 period, and Stata 15 software to test the convergence mechanism. The specific calculation results are presented in
Table 6.
In terms of overall disparities, the overall gap in the development levels of farmers’ specialized cooperatives nationwide showed a continuous upward trend during the study period (2015–2023). The Dagum Gini coefficient rose from 0.283 in 2015 to 0.309 in 2023, with an average annual increase of 0.325%, indicating that the overall disparity in the development levels of farmers’ specialized cooperatives nationwide is gradually widening. In terms of phased changes, the period from 2015 to 2019 was a phase of rapid expansion, during which the overall Gini coefficient rose continuously for four consecutive years, climbing from 0.283 to 0.357. This may be attributed to the fact that during this phase, differences in cooperative development policies, resource endowments, and industrial foundations across regions gradually became more pronounced, leading to a rapid widening of the overall development gap nationwide; From 2019 to 2021, the overall Gini coefficient remained largely stable, suggesting that balanced regional development and supportive policies mitigated the widening of disparities to some extent; from 2021 to 2023, it rose significantly again, reaching 0.390 and surpassing previous levels, indicating that regional development divergence intensified once more, and the spatial imbalance in the development of farmers’ specialized cooperatives nationwide became increasingly pronounced. In terms of the development levels of farmers’ specialized cooperatives within each region, during the study period, the average Dagum Gini coefficients for the eastern, central, and western regions were 0.4192, 0.2533, and 0.1991, respectively. This indicates that internal disparities were greatest in the eastern region, followed by the central region, with the western region exhibiting the smallest disparities. Regarding the trends in cooperative development levels across regions, the changes in the Dagum Gini coefficients for the three regions exhibited distinct characteristics. From 2015 to 2023, the Gini coefficient in the eastern region fluctuated upward from 0.315 to 0.501, showing a continuous widening trend, as economic, locational, and resource disparities within the province led to an intensifying divergence in cooperative development; in the central region, the Gini coefficient fluctuated slightly within the range of 0.235–0.289, showing an overall trend of stability with a slight decline, indicating relatively balanced development and gradual changes in disparities within the region; and in the western region, the Gini coefficient remained at a low level of 0.175–0.220 over the long term, with minimal fluctuations. The internal structure remained stable over the nine-year period, making it the most balanced region among the three major regions. Overall, internal disparities in the Eastern region continued to widen, while intra-regional disparities in the Central and Western regions remained stable over the long term. In terms of inter-regional disparities, the gap between the Eastern and Western regions was the largest, followed by that between the Eastern and Central regions, while the gap between the Western and Central regions was the smallest. Furthermore, the Gini coefficients for cooperative development among the three regions exhibited divergent trends across different periods. From 2015 to 2023, the Gini coefficients for the East–West and East-Central regions rose steadily overall, while the West-Central Gini coefficient remained relatively low with stable fluctuations. From 2015 to 2019, the Gini coefficients across all three regions rose across the board, with the East, leveraging its resource advantages, widening the development gap with the Central and Western regions; from 2019 to 2021, the inter-regional Gini coefficients declined slightly, indicating that the national rural revitalization initiatives, regional balanced development efforts, and cooperative support policies for the Central and Western regions were yielding results. From 2021 to 2023, the inter-regional Gini coefficient rose again, with the development gap between the East and the central and western regions widening once more, revealing significant spatial differentiation. In terms of the sources of variation, inter-regional differences, hyper-variation density, and intra-regional differences jointly drove the overall variation, with the contribution pattern evolving dynamically over time. From 2015 to 2019, the contribution rates of all three factors remained within the 30–38% range, forming a tripartite equilibrium. From 2020 to 2021, the contribution rate of hype variation density surged to 36–37%, becoming the dominant factor, while the contribution rate of inter-regional differences fell to 29–30%. From 2021 to 2023, the inter-regional contribution rate gradually rebounded to 32–33%, the contribution rate of super-variation density fell back to 33–34%, and the intra-regional contribution rate stabilized at 32–33%. Overall, the contributions from these three sources are tending toward equilibrium; inter-regional differences remain a key driver of spatial differentiation, the contribution of intra-regional differences remains stable, and the contribution of super-variation density first rose and then fell.
5. Factors Driving the Development of Farmers’ Specialized Cooperatives
5.1. Selection of Indicators
Based on provincial panel data from China covering the period 2015–2023, this study identifies driving factors across four dimensions—Regional Economic Development, Agricultural Production Efficiency, Rural Human Capital, Land Resource Allocation—with the development level of farmers’ specialized cooperatives as the dependent variable. Regarding Regional Economic Development, Urbanization Level, Household Consumption, Regional GDP were selected to represent market pull and external support [
28,
29,
30,
31,
32,
33,
34]. Regarding Agricultural Production Efficiency, Agricultural Productivity, Land Productivity, Agricultural Producer Price Volatility were selected to represent the industrial foundation and profit space [
35,
36,
37,
38,
39]. Regarding Rural Human Capital, the Agricultural R&D Personnel Scale, Rural Labor Force Stock, Average Years of Schooling were used to represent human resources and innovation vitality [
28,
40,
41,
42,
43,
44,
45,
46]. Regarding Land Resource Allocation, Land Transfer Level, Small-scale Farming Degree were used to represent economies of scale and organizational safeguards [
16,
47,
48,
49]. The specific details are presented in
Table 7.
5.2. Descriptive Statistics and Multicollinearity Tests
The descriptive statistics for the variables in this study are shown in the
Table 8. The total sample consists of 270 observations. Among these, the dependent variable, cooperative development level (y), has a mean of 0.107 and a standard deviation of 0.089, indicating that there are certain differences in cooperative development levels across the sample and that the overall level is relatively low; its range is from 0.024 to 0.689, reflecting significant regional heterogeneity in cooperative development levels across different regions. Regarding the core explanatory variables, within the regional economic development dimension, the mean for the Urbanization Level (URB) is 63.047%, the mean for the Household Consumption (CON) is 21,177.61 yuan, and the mean for the Regional GDP (GDP) is 32,3995.82 million yuan. The standard deviations for all three are relatively large, reflecting the imbalance in economic development across regions. In the agricultural production efficiency dimension, the mean Agricultural Productivity (AGP) was 2.543, the mean Land Productivity (LAND) was 0.496, and the mean Agricultural Producer Price Volatility (PPV) was 102.753, indicating that agricultural production efficiency is generally at a moderate level and that price fluctuations are relatively stable. In the rural human capital dimension, the mean Rural Labor Force Stock (LAB) was 1.145 persons per household, the mean Agricultural R&D Personnel Scale (RD) was 18,062.878, and the mean Average Years of Schooling (AYS) was 8.011 years. The standard deviations for these indicators were all within a reasonable range, indicating regional disparities in rural labor endowments and scientific and technological investment. In the land resource allocation dimension, the mean Land Transfer Level (LTR) was 54.364 mu per unit, and the mean Degree of Small-scale Farming (SF) was 0.808. The former had a high standard deviation of 49.045, reflecting significant differences in the scale of land transfers among cooperatives across regions, while the high mean of the latter indicates that small-scale farming operations remain predominant in the sample regions. Overall, the ratios of standard deviation to mean for all variables fall within a reasonable range, with no outliers, and the data distribution is relatively stable, providing a reliable foundation for subsequent empirical analysis.
To ensure the robustness of the model and the reliability of statistical inferences, this study first applied a natural logarithmic transformation to variables such as regional GDP, household consumption levels, and the number of agricultural researchers. This approach not only converts regression coefficients into an elasticity-based form that facilitates cross-dimensional comparisons but also effectively reduces differences in variable scales, mitigates heteroscedasticity, eliminates unit-of-measurement interference among variables, and enhances the stability of model estimates. On this basis, multicollinearity was further tested using the variance inflation factor (VIF). The results of
Table 9 showed that the VIF values of the explanatory variables ranged from 1.080 to 9.050, none exceeding the empirical critical value of 10. The average VIF of the model was 4.540, indicating that there was no severe multicollinearity among the variables. The data structure met the basic requirements for subsequent regression analysis, and the model specification possessed statistical validity and stability.
5.3. Identification of Drivers of Cooperative Development Levels
5.3.1. Single-Factor Exploration Results
The results of the univariate analysis are presented in
Table 10. They show that all 11 influencing factors passed the significance test, indicating that the selected variables all have significant explanatory power for the development level of farmers’ specialized cooperatives. Judging by the magnitude of the q-statistic, there are clear differences in the explanatory power of each factor, ranked as follows: LAB (0.449) > CON (0.444) > SF (0.143)> AYS (0.125) > LTR (0.125) > AGP (0.101) > GDP > LAND (0.067) > RD (0.047) > PPV (0.042) > URB (0.284).
Among these, the Q-values for the LABr and the CON both exceed 0.4, making them core dominant factors with the strongest explanatory power; they are key determinants of the quality of cooperative development. SF, LTR, and AYS are factors of moderate strength, with Q-values ranging from 0.12 to 0.15, exerting a stable influence on cooperative development. AGP, GDP, and LAND are weak influencing factors, with explanatory power ranging from 0.06 to 0.10; RD and PPV have the lowest explanatory power (q < 0.05), but they still pass the significance test, indicating that although their effects are weak, they cannot be ignored; the URB has a moderately weak explanatory power, with a relatively stable spatial impact. Overall, human capital and consumer demand are the dominant factors, supported by land allocation and economic factors, with price and research factors playing a supplementary role, forming a single-factor driving pattern for the development of cooperatives.
5.3.2. Results of the Two-Factor Interaction Analysis
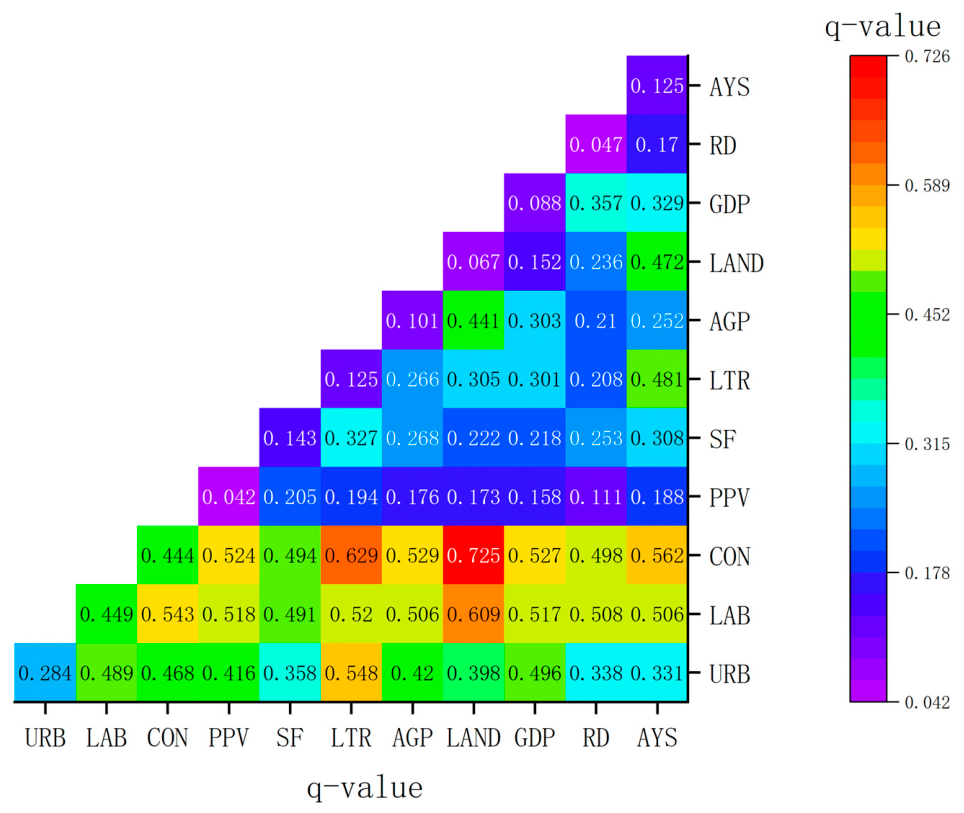
The interaction detection results indicate that the explanatory power of any two factors interacting is greater than that of a single factor, exhibiting a significant two-factor enhancement or nonlinear enhancement effect. There is no independent or weakening relationship, suggesting that cooperative development is the result of multi-factor synergistic driving and nonlinear coupling.
In terms of interaction strength, the interaction between CON and LAND had the highest q-value (0.725), followed by that between LAB and LAND (0.609). While the interactions between CON and LTR (0.629), CON and AYS (0.562), and LAB and CON (0.543) all exhibit strong synergistic effects. These reflect a cross-dimensional combination of consumption upgrading, human capital enhancement, optimized land allocation, and improved talent quality, which exerts a strong amplifying driving force on the development of agricultural cooperatives. Furthermore, combinations such as SF and LTR (0.327), LTR and AYS (0.481), and GDP and RD (0.357) all exhibit interaction effects significantly higher than those of individual factors. This indicates that the synergistic combination of improvements in land fragmentation, scaled operations, human capital accumulation, economic development, and research investment is a crucial pathway for driving the quality improvement and upgrading of cooperatives. The results of interaction detector analysis are presented in
Figure 6.
Overall, the results of the geographic detector reveal that the stock of rural labor and residents’ consumption levels serve as core drivers, while land allocation, human capital, and the regional economy provide important support, and price fluctuations and research investment exert auxiliary influences. Interactions among factors are generally enhanced, forming a multidimensional coupled driving mechanism involving regional economic development, agricultural production efficiency, rural human capital, and land resource allocation, which collectively shape the spatial patterns and quality differences in the development of farmers’ specialized cooperatives.
5.4. The Four-Dimensional Coupled Driving Mechanism of Farmers’ Specialized Cooperatives’ Development Level
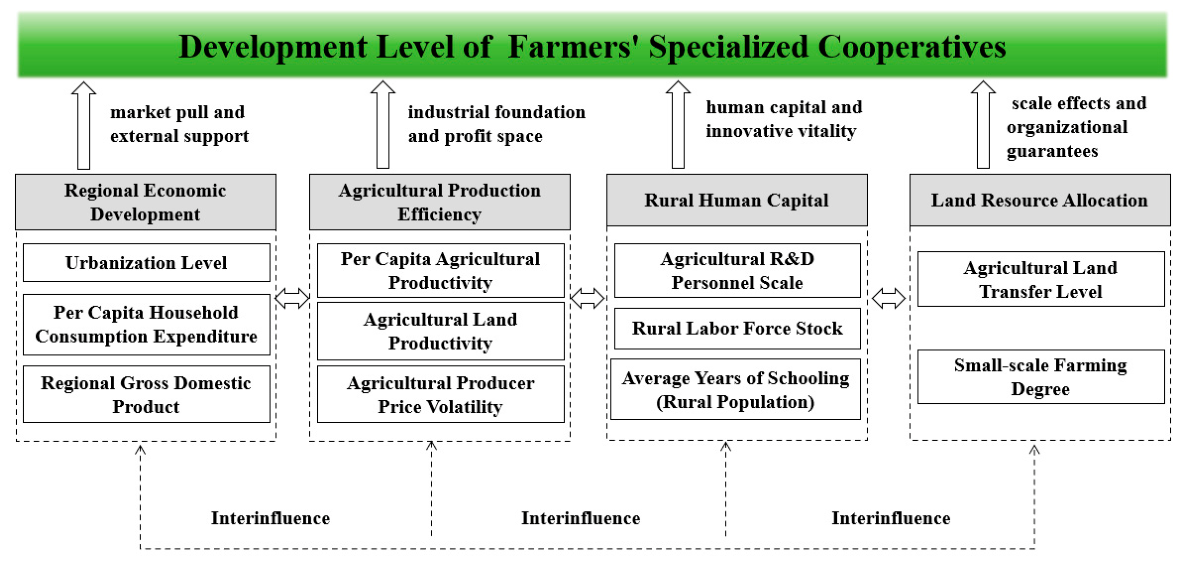
The development mechanism of farmers’ specialized cooperatives is complex and multifaceted, resulting from the combined effects of factors such as regional economic development, agricultural production efficiency, rural human capital and land resource allocation. The factor exploration results indicate that rural human capital and regional economic development are the primary drivers of cooperative development, with household consumption levels and the stock of rural labor playing particularly critical roles, followed by land resource allocation, and finally agricultural production efficiency. The results of the interaction analysis indicate that the development of cooperatives has shifted from an extensive expansion model reliant solely on land resources and factor inputs to an intensive improvement model that prioritizes organizational efficiency, service quality, and the benefits derived from linking and supporting farmers. Under the previous extensive development model, factors such as resource endowments and policy subsidies are no longer the sole determining factors. Instead, rising consumer demand and the accumulation of human capital have become the core drivers of quality and efficiency improvements in cooperatives. By empowering cooperatives to adopt standardized production, brand-oriented operations, and service-oriented transformation, these initiatives facilitate a deep integration between smallholder farmers and modern agriculture, thereby enhancing cooperative operational efficiency, strengthening their capacity to drive local development, and unlocking the potential of the industry.
Regional economic development provides cooperatives with market pull and external support. Rising urbanization and upgrading consumer demand are driving the agricultural market to shift from quantity-based demand to a focus on quality, diversity, and branding, compelling cooperatives to optimize production standards and extend their industrial chains. Meanwhile, growth in regional GDP has strengthened local governments’ capacity to support cooperatives. Through project subsidies, infrastructure development, and market-matching services, these measures reduce operational costs and provide a stable external environment for scaled operations and service expansion. Consumer demand and market competition pressures under market-driven mechanisms further drive cooperatives to optimize resource allocation and improve operational efficiency, serving as key drivers for their sustainable development.
Agricultural production efficiency provides cooperatives with an industrial foundation and profit margins. Improvements in agricultural productivity and land output efficiency have lowered the cost barriers to organized production, providing the technical and output guarantees necessary for large-scale, standardized operations; meanwhile, fluctuations in producer prices, transmitted through market signals, compel cooperatives to mitigate market risks and enhance operational stability through unified sales, contract farming, and brand premiums. Improvements in agricultural production efficiency directly impact the profit margins and service capabilities of cooperatives, serving as the industrial foundation for their sustained operations and their ability to integrate and benefit farmers.
Rural human capital provides cooperatives with human resources and innovative vitality. The existing rural labor force ensures a sufficient supply of labor for cooperative production and operations, alleviating labor shortages; the growing number of agricultural researchers and the increase in the average years of education among the rural population have strengthened cooperatives’ capabilities in technology dissemination, standardized governance, and innovation, driving the adoption of new varieties, technologies, and models, and facilitating industrial upgrading and service optimization. The accumulation of human capital determines the cooperative’s level of organizational management, technical application capabilities, and potential for innovative development; it is the core force enabling the cooperative to break through development bottlenecks and achieve improved quality and efficiency.
Land resource allocation provides cooperatives with economies of scale and organizational support. The higher the proportion of smallholder farmers and the more fragmented the land, the higher the costs of organizational coordination, unified production, and centralized sales for cooperatives, making it difficult to realize economies of scale; conversely, increased land transfer creates conditions for contiguous operations and large-scale production, reducing organizational costs and improving resource integration efficiency. The state of land resource allocation profoundly influences the organizational structure and development ceiling of cooperatives, serving as the underlying factor that either constrains or empowers their scale and industrialization.
These driving factors operate independently yet interact with one another, forming a four-dimensional coupled driving system for the development of farmers’ specialized cooperatives (
Figure 7). Support policies for regional economic development can only be implemented based on rural human capital and land resource allocation conditions; the demand for quality driven by consumption upgrades requires improved agricultural production efficiency and optimized land resource allocation to meet; the accumulation of rural human capital, through technological innovation, activates the value of land resource allocation and amplifies the effectiveness of regional economic development; the optimization of land resource allocation reduces organizational costs, which in turn improves the efficiency of rural human capital utilization and enhances the driving role of regional economic development. These four elements form a closed-loop coupled relationship characterized by regional economic traction, agricultural efficiency support, human capital empowerment, and land allocation constraints, jointly promoting the improvement of quality and efficiency as well as balanced development of cooperatives.
6. Conclusions and Recommendations
6.1. Research Conclusions
Using panel data from 30 Chinese provinces covering the period 2015–2023 as the research sample, this study constructs an evaluation system for the high-quality development of farmers’ specialized cooperatives across five dimensions: standardized operations, operational performance, service scope, spillover effects, and industrial upgrading. By comprehensively applying the entropy method, kernel density estimation, spatial autocorrelation analysis, the Dagum Gini coefficient, and the Geographical Detector model, we systematically reveal the temporal evolution patterns, spatial differentiation patterns, sources of regional disparities, and multidimensional coupled driving mechanisms in the development of China’s farmers’ specialized cooperatives. The main research conclusions are as follows.
First, in terms of temporal evolution, the development level of China’s farmers’ specialized cooperatives has not improved in tandem with their increasing numbers. Overall, the sector exhibits continuous quantitative expansion but fluctuating and declining quality, accompanied by structural differentiation and upgrading. During the study period, the number of registered cooperatives nationwide grew steadily, yet the overall development level showed a downward trend, indicating a severe disconnect between quantitative expansion and qualitative improvement. Structural characteristics varied significantly across dimensions. While standardized operation and service scope maintained a stable development trajectory with minimal fluctuations, operational performance and driving effect showed a marked downward trend, representing the core shortcomings constraining the overall improvement in cooperative quality. Scores in the industrial upgrading dimension rose slowly but steadily, with achievements in the integration of the primary, secondary, and tertiary sectors, brand development, and the construction of physical processing facilities gradually emerging, becoming the core new drivers for the current phase of quality-driven development in cooperatives.
Second, at the spatial level, the spatial distribution pattern of China’s farmers’ specialized cooperatives exhibits dynamic optimization. The overall “pyramid-shaped” hierarchical structure has undergone an evolutionary process characterized by initial intensified differentiation followed by optimization and convergence, with significant regional spatial divergence. In terms of tier distribution, provinces in the first and second tiers are predominantly concentrated in the eastern and central regions, where abundant resources and a solid development foundation enable strong upward mobility; the third tier, however, has long been dominated by inland provinces in the Northeast and Northwest, where weak industrial foundations and insufficient development momentum have kept these regions mired in low-level development tiers. Analysis of spatial agglomeration effects indicates that the development of cooperatives exhibits significant spatial autocorrelation, with local agglomeration patterns undergoing dynamic reshaping. Notably, the core of high-value agglomeration has shifted from the Yangtze River Delta toward the southeastern regions, leading to a restructuring of the agglomeration pattern along the eastern coast. Meanwhile, the Northeast has formed a stable low-value agglomeration zone characterized by pronounced low-value lock-in. Concurrently, a low-to-high heterogeneous agglomeration pattern has emerged in the eastern coastal regions in later stages, intensifying internal development divergence within these areas. Over time, the spatial equity of cooperative development nationwide has gradually improved: the scale of provinces at a medium development level has continued to expand, the scope of low-level development regions has steadily contracted, and inter-provincial development gaps have continued to narrow. However, overall, the problem of lagging development in the inland regions of the Northeast and Northwest persists, and the long-standing issues of spatial heterogeneity and regional differentiation have not yet been completely resolved.
Third, regarding regional disparities, regional differences in the development level of cooperatives in China persist, and overall dispersion is gradually widening. Kernel density analysis reveals that the development level of cooperatives consistently follows a unimodal distribution, with most provinces remaining in the low-development range for an extended period. While the overall mean has risen slowly, regional development imbalances continue to intensify. The results of the Dagum Gini coefficient decomposition indicate that differences among the three major regional groups—Eastern, Central, and Western—are the primary source of spatial differentiation in cooperatives. Developmental disparities are greatest within the Eastern region, while development in the Central and Western regions is relatively balanced, revealing a distinct pattern of regional development gradients.
Fourth, at the level of driving mechanisms, the level of cooperative development is the result of multidimensional, multifactorial, and nonlinear interactions. Single-factor analysis indicates that the rural labor force stock and household consumption are the core dominant factors driving cooperative development; the degree of small-scale farming degree, the land transfer Level, and the average years of schooling are moderately key influencing factors; agricultural production efficiency, regional GDP, land productivity, the agricultural R&D personnel scale, agricultural producer price volatility, and the urbanization level are auxiliary influencing factors. Interaction analysis reveals that all factors exhibit either a two-factor enhancement or a nonlinear enhancement effect when interacted, with no independent or antagonistic effects. This forms a four-dimensional coupled driving system characterized by regional economic development, agricultural production efficiency, rural human capital and land resource allocation. The cross-dimensional synergistic effects of consumption upgrading, human capital accumulation, and the optimal allocation of land resources are key to promoting the high-quality development of cooperatives.
6.2. Policy Recommendations
The establishment of a policy orientation that prioritizes quality is paramount. From a chronological perspective, during the period under review, the expansion in scale of China’s farmers’ specialized cooperatives did not concomitantly result in an improvement in the quality of their development. Indeed, extensive development has led to a decline in the overall standard of development. Consequently, it is imperative that future policies deviate from the preceding emphasis on quantitative growth and instead accord primacy to the quality of cooperative development. Firstly, it is vital to emphasise the continuous advancement of policies such as the county-wide quality improvement campaign for cooperatives, with the quality of cooperative development set as a key objective. It is imperative that a closed-loop regulatory mechanism is established to govern the phasing out of ‘shell cooperatives’. This mechanism should encompass all aspects of the process, including entry, operation, annual inspection and exit. Secondly, the incentive policies for model cooperatives should be strengthened. Financial rewards should be provided to farmers’ specialized cooperatives that are designated as model cooperatives. Furthermore, priority should be given to such cooperatives when they undertake government-funded agricultural projects. Thirdly, it is necessary to improve the regulatory frameworks that provide support. It is recommended that the revision of implementing rules for cooperative finance and accounting be expedited. In addition, localities should be encouraged to formulate specialized support measures based on their resource endowments. This will enable them to guide cooperatives to shift from scale expansion towards high-quality, endogenous development.
The enhancement of the operational capacity and catalytic role of cooperatives is of paramount importance. During the review period, a decline in the operational performance and catalytic capacity of cooperatives has been observed, which has impacted the overall level of cooperative development. To address this decline, various measures must be taken. Firstly, the introduction of specialized policies for talent development within cooperatives is imperative. Concurrently, training in business management and agricultural techniques is to be conducted, in addition to the enhancement of the operational capabilities of cooperative management personnel. Secondly, the provision of support policies for cooperatives is recommended in areas such as brand development and market expansion. Such policies should include support for cooperatives in standardised and scaled production, the broadening of sales channels, the building of distinctive agricultural product brands, and the growth of operational profits. Thirdly, the implementation of supporting measures such as loan interest subsidies, production subsidies, technical assistance and information dissemination is required in order to precisely address the operational and developmental challenges faced by cooperatives. Fourthly, the mechanism connecting the interests of cooperatives and farmers should be refined, with a view to promoting diversified models such as guaranteed minimum returns, profit-sharing through equity participation, and income generation through labour services, thereby strengthening the leading role of cooperatives.
The spatial development pattern should be optimized and regional disparities reduced. In response to the evident regional imbalance in the development of Chinese cooperatives, it is recommended that a targeted governance model be implemented. This governance model should be based on regional classification and tailored measures. Firstly, the implementation of differentiated support by region is to be advised. The introduction of specialised support policies by region is recommended in order to assist cooperatives in the eastern and central regions in improving their operational standards. Furthermore, the provision of financial support and policy incentives to cooperatives in the western regions is advised in order to address development shortcomings. Secondly, the establishment of a cross-regional collaborative support mechanism is imperative. It is imperative to promote the dissemination of high-quality business models, management expertise and resources from eastern cooperatives to central and western regions. This is the only way to break down regional development barriers. Thirdly, the optimisation of the national spatial agglomeration pattern is to be considered. The coordination of resource allocation across the entire territory, in conjunction with the facilitation of the flow of production factors, has been demonstrated to result in a steady reduction in spatial development disparities. Furthermore, this approach has been shown to enhance the level of regional coordination and to promote the balanced development of cooperatives.
The core drivers will be identified and the coupled-drive mechanism will be refined. Firstly, the innovation of policies centred on the two core drivers—the rural labor force stock and household consumption—is imperative. The stabilisation of the rural labor force stock can be achieved through the support of local employment and the expansion of agricultural-related positions. Concurrently, cooperatives can be guided to align with trends in upgraded household consumption, the development of high-quality agricultural products and distinctive agritourism industries. This, in turn, will drive improvements in the operational performance of cooperatives. Secondly, the introduction of supporting policies for cross-factor coordination will be made. Various development resources will be integrated, and channels for the interconnection of land, talent, capital and markets will be established. This will refine the four-dimensional coupled-drive mechanism and consolidate the foundations for the high-quality development of cooperatives.
7. Discussion
Farmers’ specialized cooperatives represent distinctive agricultural business organizations with Chinese contextual characteristics, which primarily serve to bridge smallholder scattered farming with modern market systems via collective operational mechanisms. Given their vital contributions to agricultural modernization, rural revitalization, and common prosperity advancement, persistent governmental support has substantially promoted the rapid expansion and spatial coverage of cooperative entities. Nevertheless, the booming quantitative scale fails to match synchronous quality upgrading, thereby restricting the full release of organizational advantages and industrial catalytic functions. Consistent with existing evidence, this study further confirms that China’s cooperatives are generally characterized by quantity–quality mismatch, prominent structural differentiation, and solidified spatial development patterns. Such empirical findings suggest that exclusive reliance on policy incentives and scale expansion can hardly sustain long-term high-quality development, highlighting the necessity of transforming the developmental paradigm toward intensive, quality-oriented, and connotation-driven improvement.
Compared with previous studies, this study constructs a five-dimensional comprehensive evaluation framework that mitigates the one-sidedness inherent in single-dimensional assessment systems. Furthermore, this study adopts the geodetector model to identify the nonlinear relationships and interactive effects among influencing factors, thereby overcoming the methodological limitations of conventional linear models. In addition, this research focuses on exploring provincial-scale spatiotemporal evolutionary characteristics and spatial heterogeneity, which offers a novel perspective for understanding the regional differentiation of cooperative development across China.
This study still has certain limitations. First, the empirical analysis is based on provincial-level macro data, which cannot fully capture fine-scale developmental disparities across prefecture-level and county-level units. Meanwhile, this study lacks supportive micro-level survey evidence from individual cooperatives. Second, the selection of driving factors merely focuses on macroscopic elemental perspectives, while micro-level variables regarding internal governance structures, member heterogeneity, and industrial attributes of cooperatives are not incorporated. This deficiency restricts the depth of mechanism analysis regarding the formation of spatial developmental differences. Third, this study fails to further distinguish developmental discrepancies and driving heterogeneity across cooperatives with different industrial attributes and operational types. Future research can integrate county-level micro datasets and field investigation materials to classify cooperative industrial categories and operational modes. On this basis, subsequent studies can further explore the differentiated driving mechanisms and developmental bottlenecks of diverse cooperatives, so as to improve and refine the theoretical and empirical framework for the high-quality development of farmers’ specialized cooperatives.