Article

High-Resolution Site Characterization (HRSC) for Pollution Investigation of Petrochemical Enterprises: Integrated Technology Application and Validation

1
State Key Laboratory of Chemical Safety, SINOPEC Research Institute of Safety Engineering Co., Ltd., Qingdao 266000, China
2
State Environmental Protection Key Laboratory of Environmental Pollution Health Risk Assessment, South China Institute of Environmental Sciences, Ministry of Ecology and Environment, Guangzhou 510655, China
*
Author to whom correspondence should be addressed.
Sustainability 2026, 18(12), 5836; https://doi.org/10.3390/su18125836
Submission received: 18 May 2026 / Revised: 3 June 2026 / Accepted: 4 June 2026 / Published: 8 June 2026

Abstract

High-Resolution Site Characterization (HRSC) offers a promising approach to delineate spatially heterogeneous contamination in complex petrochemical sites, overcoming limitations of conventional discrete sampling. This study implemented an integrated HRSC framework combining surface soil microbial metabolic gas/functional gene detection, geophysical surveys (time-domain electromagnetics and ground-penetrating radar), and Membrane Interface Probe (MIP) sensing at a petrochemical facility in southern China. Results identified composite contamination (aromatic hydrocarbons, short-chain petroleum hydrocarbons, alkanes) primarily concentrated at 5–9 m depth, with a heavily contaminated zone of 1163 m2 and a total influence area of 17,724 m2. The contamination plume showed high spatial correlation with an underground wastewater storage pond, confirmed as the primary leakage source. Post-remediation monitoring indicated restoration of natural groundwater flow and reduced contaminant concentrations. Compared to traditional drilling, the HRSC approach improved resolution from meter to centimeter scale, reduced investigation time by 75%, and lowered overall costs by >30% through targeted sampling and real-time data acquisition. This study validates HRSC as an efficient, accurate, and cost-effective strategy for contamination delineation and source identification in operational industrial sites, supporting precise remediation and site redevelopment.

1. Introduction

The long-term operation of petrochemical sites has led to the accumulation of complex contaminant distributions, posing a significant challenge in the field of environmental remediation [1,2]. Such sites commonly exhibit co-occurrence of volatile and semi-volatile organic compounds (VOCs/SVOCs) and petroleum hydrocarbons, with marked spatial heterogeneity in contaminant occurrence [3,4]. Aromatic hydrocarbons such as benzene, toluene, ethylbenzene, and styrene can enter groundwater and partially dissolve, migrating with groundwater flow to form plume-like contamination bands downstream [5,6]. Further complexity arises from the differential migration patterns caused by micro-leakages from subsurface infrastructure. In many industrial facilities, intricate underground pipeline networks may harbor potential leakage points distributed throughout the entire plant area, exacerbating spatial heterogeneity in subsurface contamination [7,8]. Traditional site investigation methods face severe limitations in such scenarios. Reliance on discrete borehole sampling (typically on a 20–40 m grid) may fail to capture small-scale contaminant plumes or lead to significant errors in delineating the boundaries of large plumes, resulting in ineffective remediation designs or additional costs [9]. Moreover, interpolation models based on sparse data (e.g., inverse distance weighting) can amplify uncertainty under heterogeneous geological conditions, yielding large errors in predicted contaminant volumes [10]. This may lead to dual risks of under-remediation or excessive excavation, representing a critical technical bottleneck impeding precise site remediation [11].
High-Resolution Site Characterization (HRSC) technology provides a novel approach to addressing the aforementioned challenges through the innovative integration of in situ real-time monitoring and three-dimensional continuous imaging, enabled by the coupling of multiple investigation techniques [12,13,14,15]. This offers a technical foundation for safe and efficient site investigations in petrochemical enterprises. Emerging investigation techniques primarily include in situ heterogeneous body imaging coupled with geophysical detection, screening of microbial distribution and metabolic activities based on contaminant degradation mechanisms, and high-precision detection of contamination and stratigraphic distribution using membrane interface probing [16,17,18,19]. The core advantages of HRSC lie in its adaptability to complex petrochemical scenarios, high-precision planar contamination delineation, and centimeter-scale vertical resolution, making it possible to characterize contamination distribution in petrochemical sites with high resolution [20,21].
Although HRSC technology can effectively determine contamination boundaries and advance contamination identification from the meter scale to the centimeter scale, uncertainties remain regarding the integration, validation, and calibration of different techniques. Additionally, the lack of unified standards for data fusion across different technologies, combined with frequent interference from environmental complexity during field validation, diminishes the practical effectiveness of high-precision data obtained through HRSC in actual decision-making [22,23,24,25]. In the future, it is necessary to establish a cross-technology progressive validation framework and a multi-method integrated investigation process to advance the technology from experimental stages toward genuine large-scale, engineering-oriented application [26,27]. This study takes a contaminated petrochemical site in southern China as a case example, implementing a combined application of techniques including coupled geophysical detection, screening of microbial functional genes and soil gas, and in situ sensing via membrane interface probing. The results were validated and compared with traditional drilling and sampling methods. The aim is to provide a practical case reference for high-resolution contamination characterization in petrochemical sites, offer data support for precise remediation, and reduce cost overruns caused by inadequate site investigation [28,29].

2. Methodology

2.1. Overview of the Research Area

The study area is located in an industrial zone of a city in southern China. The petrochemical facility has been in continuous operation for 43 years. The region is characterized by hilly and mountainous terrain, with elevations ranging from 100 to 200 m. The hills are primarily composed of granite, sandstone, and sandy conglomerate, while plains and valleys are mostly covered by residual and slope deposits. Quaternary deposits mainly consist of sandy clay and gravel, with bedrock exposed only in locally excavated areas. Climatically, it falls within the subtropical monsoon zone, featuring warm, humid conditions with abundant rainfall. The multi-year average precipitation exceeds 1500 mm, and atmospheric precipitation surpasses evaporation, serving as the primary source of groundwater recharge. The groundwater table is relatively shallow, generally between 3 and 5 m below ground level within the investigation area. The aquifer exhibits moderate water yield capacity. The phreatic water quality is classified as either HCO3-Ca or HCO3-Na(Ca) type, with total dissolved solids consistently below 0.5 g/L. The industrial facility primarily engages in crude oil refining and processing, with main products including gasoline, diesel, ethylene, and styrene. The high-resolution investigation focuses on the central area of the facility, which was constructed in 2003 and covers approximately 55,000 square meters. This area contains seven sets of above-ground facilities and one underground wastewater storage tank, with all ground surfaces already paved.

2.2. Technology Portfolio Design

2.2.1. Technical Design Concept

Compared to traditional industrial sites (e.g., steel plants), petrochemical complexes present unique challenges for environmental site characterization. Their continuous operation prohibits intrusive, large-scale excavation or prolonged downtime. Furthermore, the intricate network of subsurface pipelines and infrastructure not only increases the risk of diffuse contaminant release but also severely limits physical access for conventional drilling and sampling. These constraints typically result in sparse, non-representative data, rendering standard investigation grids (e.g., 20–40 m) inadequate. Consequently, there is a pressing need for adaptive, minimally invasive, and integrated investigative approaches that can rapidly synthesize information from multiple complementary techniques to overcome access limitations and data scarcity.
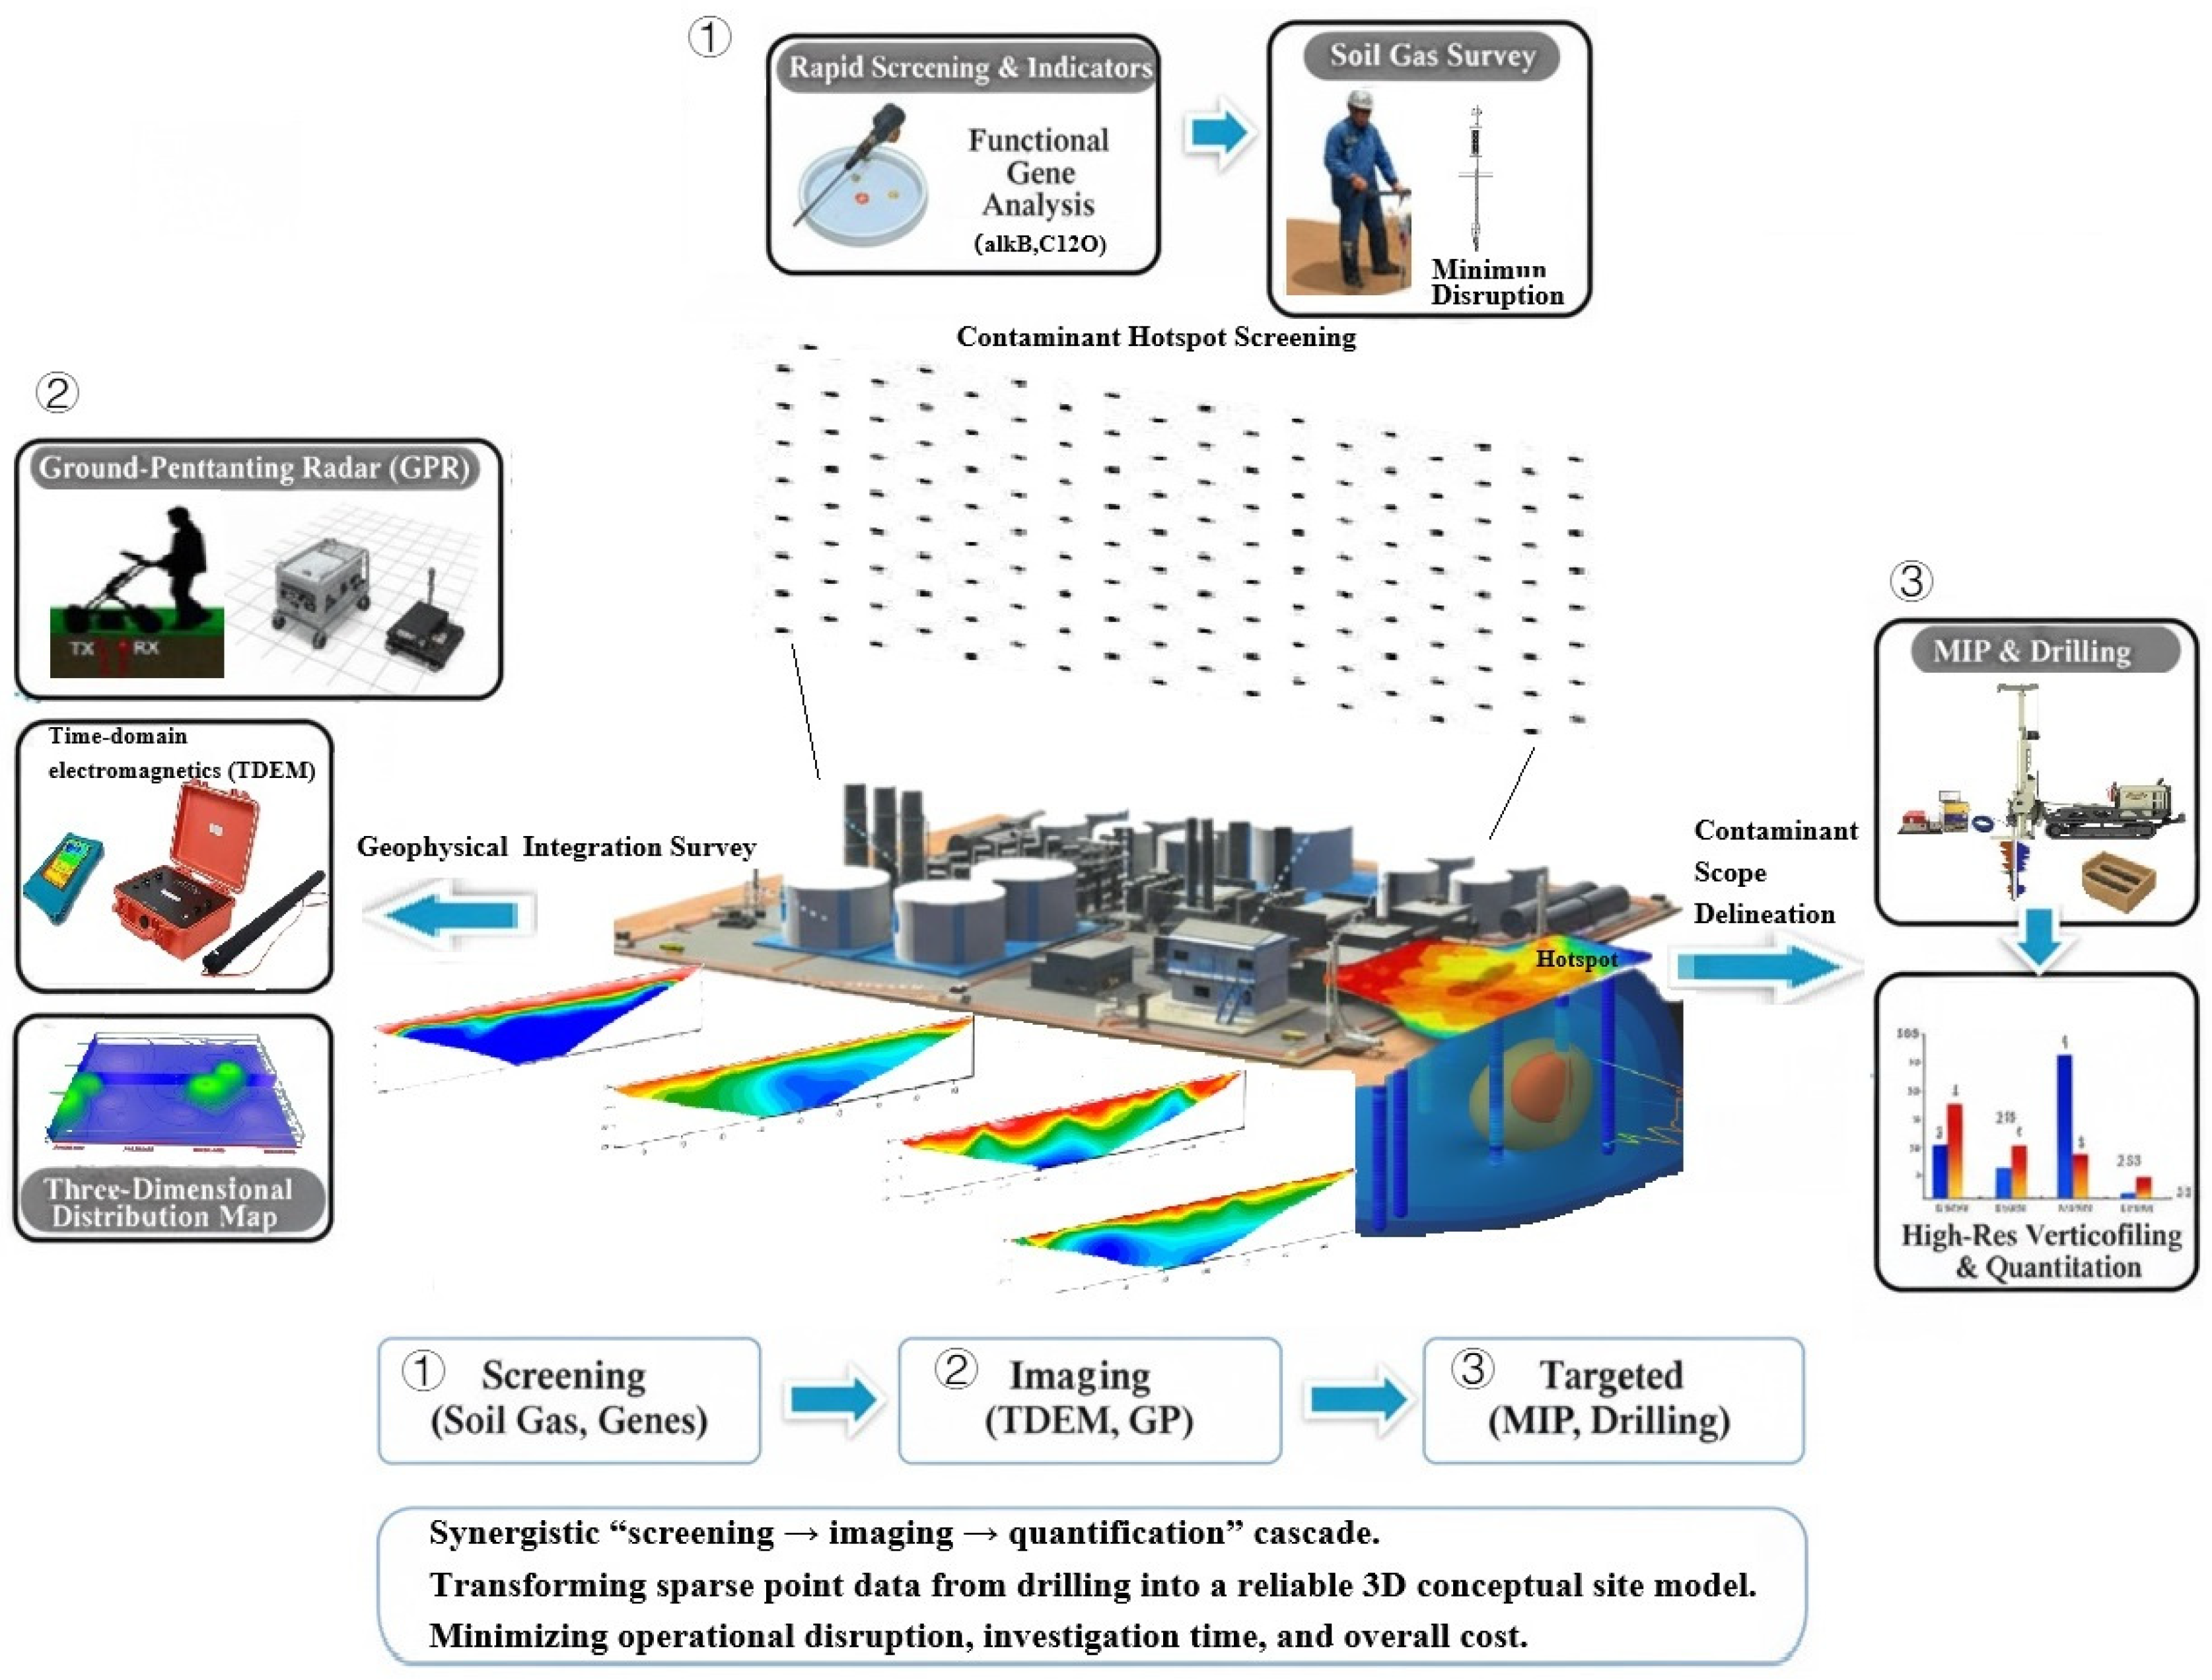
The selection and integration of multiple investigative techniques in this study were driven by the need to overcome the specific constraints of active petrochemical sites while compensating for the inherent limitations of any single method. Each technique was chosen for a distinct, complementary role in a tiered investigation framework, as shown in Figure 1.
Non-intrusive Geophysical Surveys (TDEM & GPR): Time-domain electromagnetics (TDEM) was employed for its deep penetration (up to 100 m) and sensitivity to subsurface electrical conductivity contrasts, ideal for mapping large-scale hydrogeological structures and potential plume pathways. However, its resolution decreases with depth, and anomalies are non-unique (e.g., could indicate clay, saline water, or contaminants). Ground-penetrating radar (GPR) complements this by providing centimeter-to-meter scale resolution of shallow stratigraphy and subsurface utilities, but its signal is rapidly attenuated in conductive clay or saturated zones. Their combination allows for cross-verification and provides a 3D “structural blueprint” of the subsurface without any excavation, which is critical under operational facilities.
Rapid Screening and Biological Indicators (Soil Gas & Functional Genes): Soil gas surveys and functional gene (e.g., alkB, C12O) analysis serve as low-cost, high-density screening tools. They indirectly indicate contaminant presence and microbial degradation activity by sampling the shallow vadose zone, offering a planar view of contamination hotspots and plume fringes. The topsoil microbial functional gene screening method (e.g., PCR or metagenomic sequencing) does not rely on living microbial activity; it detects functional genes regardless of whether microbes are active, dormant, or dead. At subzero winter temperatures, although most soil microbes become dormant or die, the genetic material remains sufficiently preserved. Therefore, the method remains technically effective under freezing conditions, provided that soil samples are not subjected to repeated freeze–thaw cycles. Their major advantage is speed and minimal disturbance, but they provide limited vertical resolution and quantitative contaminant concentration. They answer “where might the problem be?” and guide the targeted deployment of deeper, more invasive tools.
Direct-Push Profiling and Validation (MIP & Drilling): The Membrane Interface Probe (MIP) was then deployed in suspected zones. It provides continuous, real-time vertical profiling (every 1.5 cm) of volatile organic compounds, directly linking geophysical or soil gas anomalies to contaminant presence. Its strength is unmatched vertical delineation, yet it is semi-quantitative and primarily detects volatile species. Therefore, targeted drilling and laboratory analysis serve as the essential validation step. They yield quantitative, definitive concentration data for a wide range of contaminants (VOCs/SVOCs, TPH) and are the only way to collect groundwater samples, but they are costly, slow, and provide only discrete point data.
Integrated Framework Logic: The core rationale for this combination is to create a synergistic “screening → imaging → quantification” cascade. The rapid, low-cost methods efficiently narrow down vast areas to high-probability targets. The geophysical methods then image the subsurface structure non-destructively across these focused zones. Finally, the direct-push and drilling techniques deliver high-resolution, quantitative validation precisely where needed. This strategy mitigates the “blind spot” of any single method—transforming sparse point data from drilling into a reliable 3D conceptual site model—while minimizing operational disruption, investigation time, and overall cost. It establishes a replicable framework for high-resolution characterization in other investigation-restricted industrial settings.

2.2.2. Detection of Microbial Metabolic Gases and Functional Genes in Topsoil

By deploying detection points at shallow subsurface levels to collect signals from functional genes in gases or soils, technical personnel can investigate the planar distribution of contaminants in soil and groundwater without complex mechanical operations or large-scale excavation, thereby avoiding disruption to deeper subsurface structures. A small soil probe sampler is driven into the ground to a depth of approximately 0.5 m, and a gas collection device equipped with a polytetrafluoroethylene (PTFE) guiding tube is activated. The other end of the tube is connected to a portable pump-suction gas detector. At the surface, technicians use an RAE detector to monitor VOCs and microbial metabolic gases (such as CO2, O2, CH4, H2, H2S, NH3, etc.), recording instrument readings in real time. Gas sampling is completed once the readings for all indicators stabilize or show inflection points, with the stable or inflection values selected as the final test results.
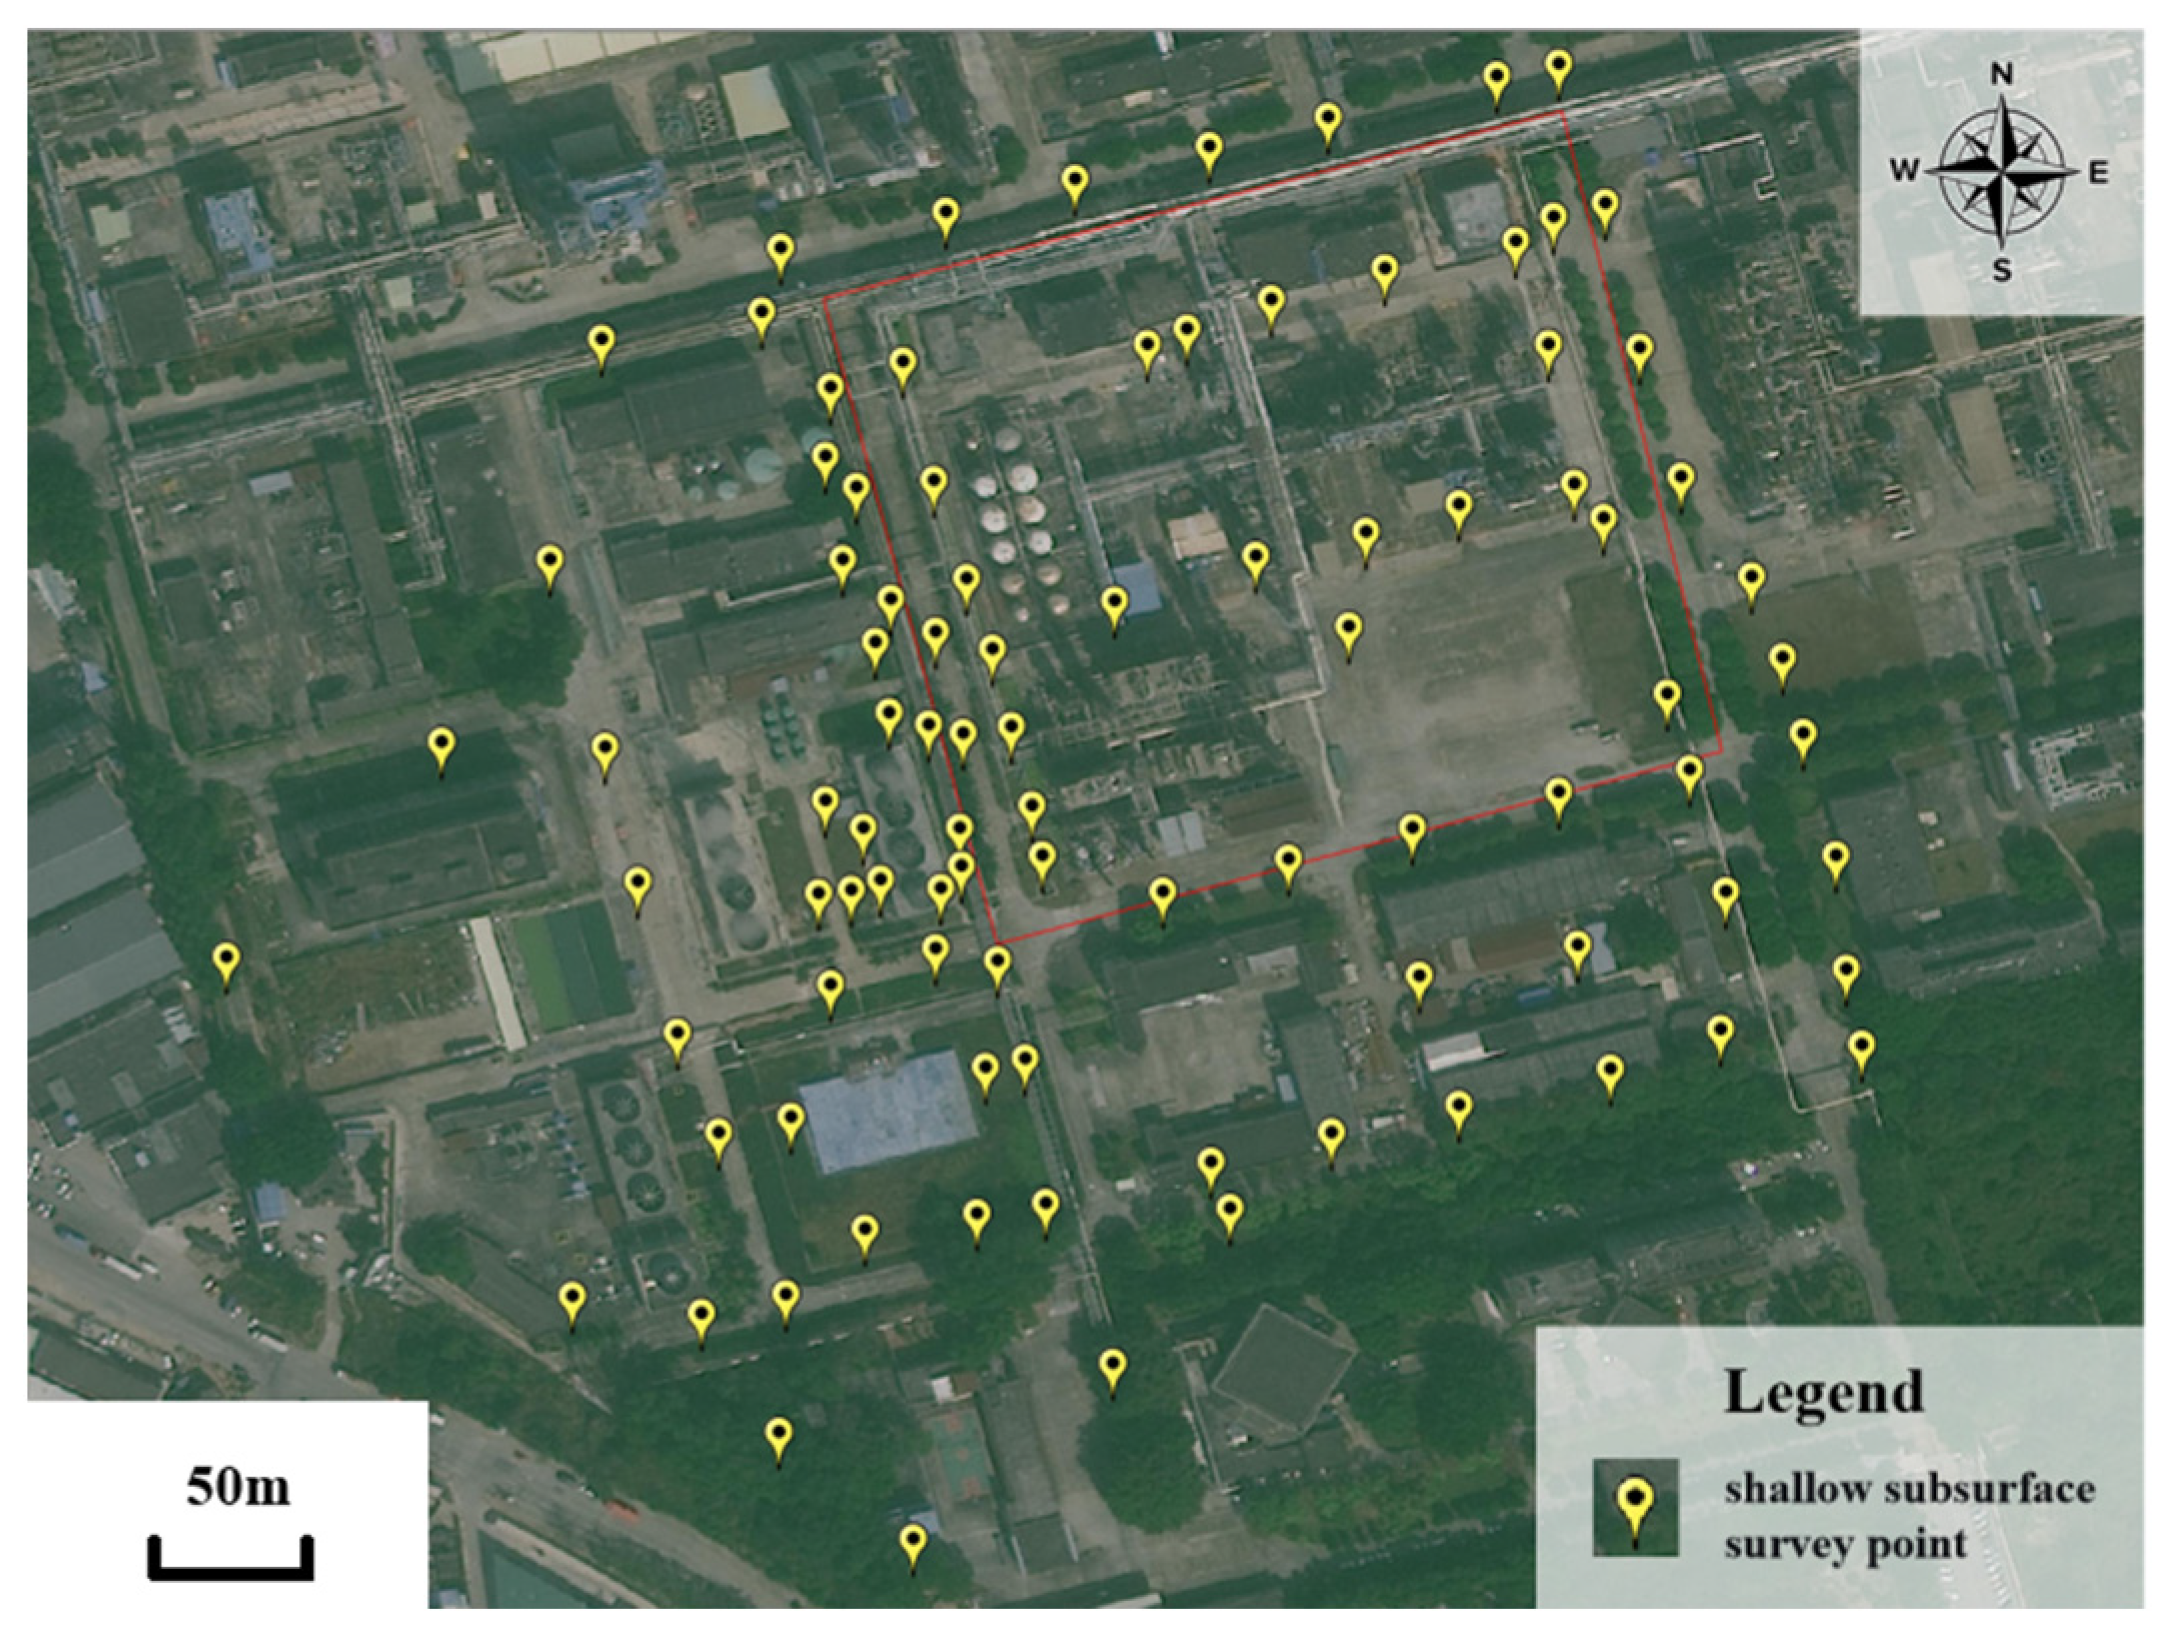
At selected sampling points, a sterile sampler is used to collect approximately 50 g of soil from about 50 cm below the surface. The sample is placed in a pre-prepared sterile sampling bag, temporarily stored in an insulated container with dry ice or liquid nitrogen, and promptly transported to the laboratory for analysis of specific functional genes. The distribution of detection points is shown in Figure 2.

2.2.3. Time-Domain Magnetotelluric and Ground-Penetrating Radar Detection

The Time Domain Electromagnetic Method (TDEM) investigates the electrical structure of the Earth’s interior by utilizing time-domain electromagnetic fields as the excitation source. Based on the principle that electromagnetic waves of different frequencies have different skin depths in conductive media, the method measures the sequence of Earth’s electromagnetic responses from high to low frequencies at the surface, thereby analyzing variations in electrical properties of subsurface geological bodies at different depths. This indirectly characterizes the distribution of different lithological units, groundwater, and organic contaminants.
In this survey, a 32-channel high-density TEM instrument was employed, with a maximum investigation depth of 100 m, a frequency range of 0.001 mV to 7 kHz, and a measurement mode of MN/TT. The resolution was 0.001 mV. Electromagnetic signals were extracted and processed using a Kalman filter, with correction of amplitude, threshold, and smoothing coefficients applied to obtain a large dataset of corrected apparent resistivity values for each measurement point. Cross-sectional profiles were generated for each survey line, and heterogeneity analysis was conducted based on the apparent resistivity data. Three-dimensional modeling and interpolation of subsurface heterogeneity were performed using the acquired apparent resistivity data.
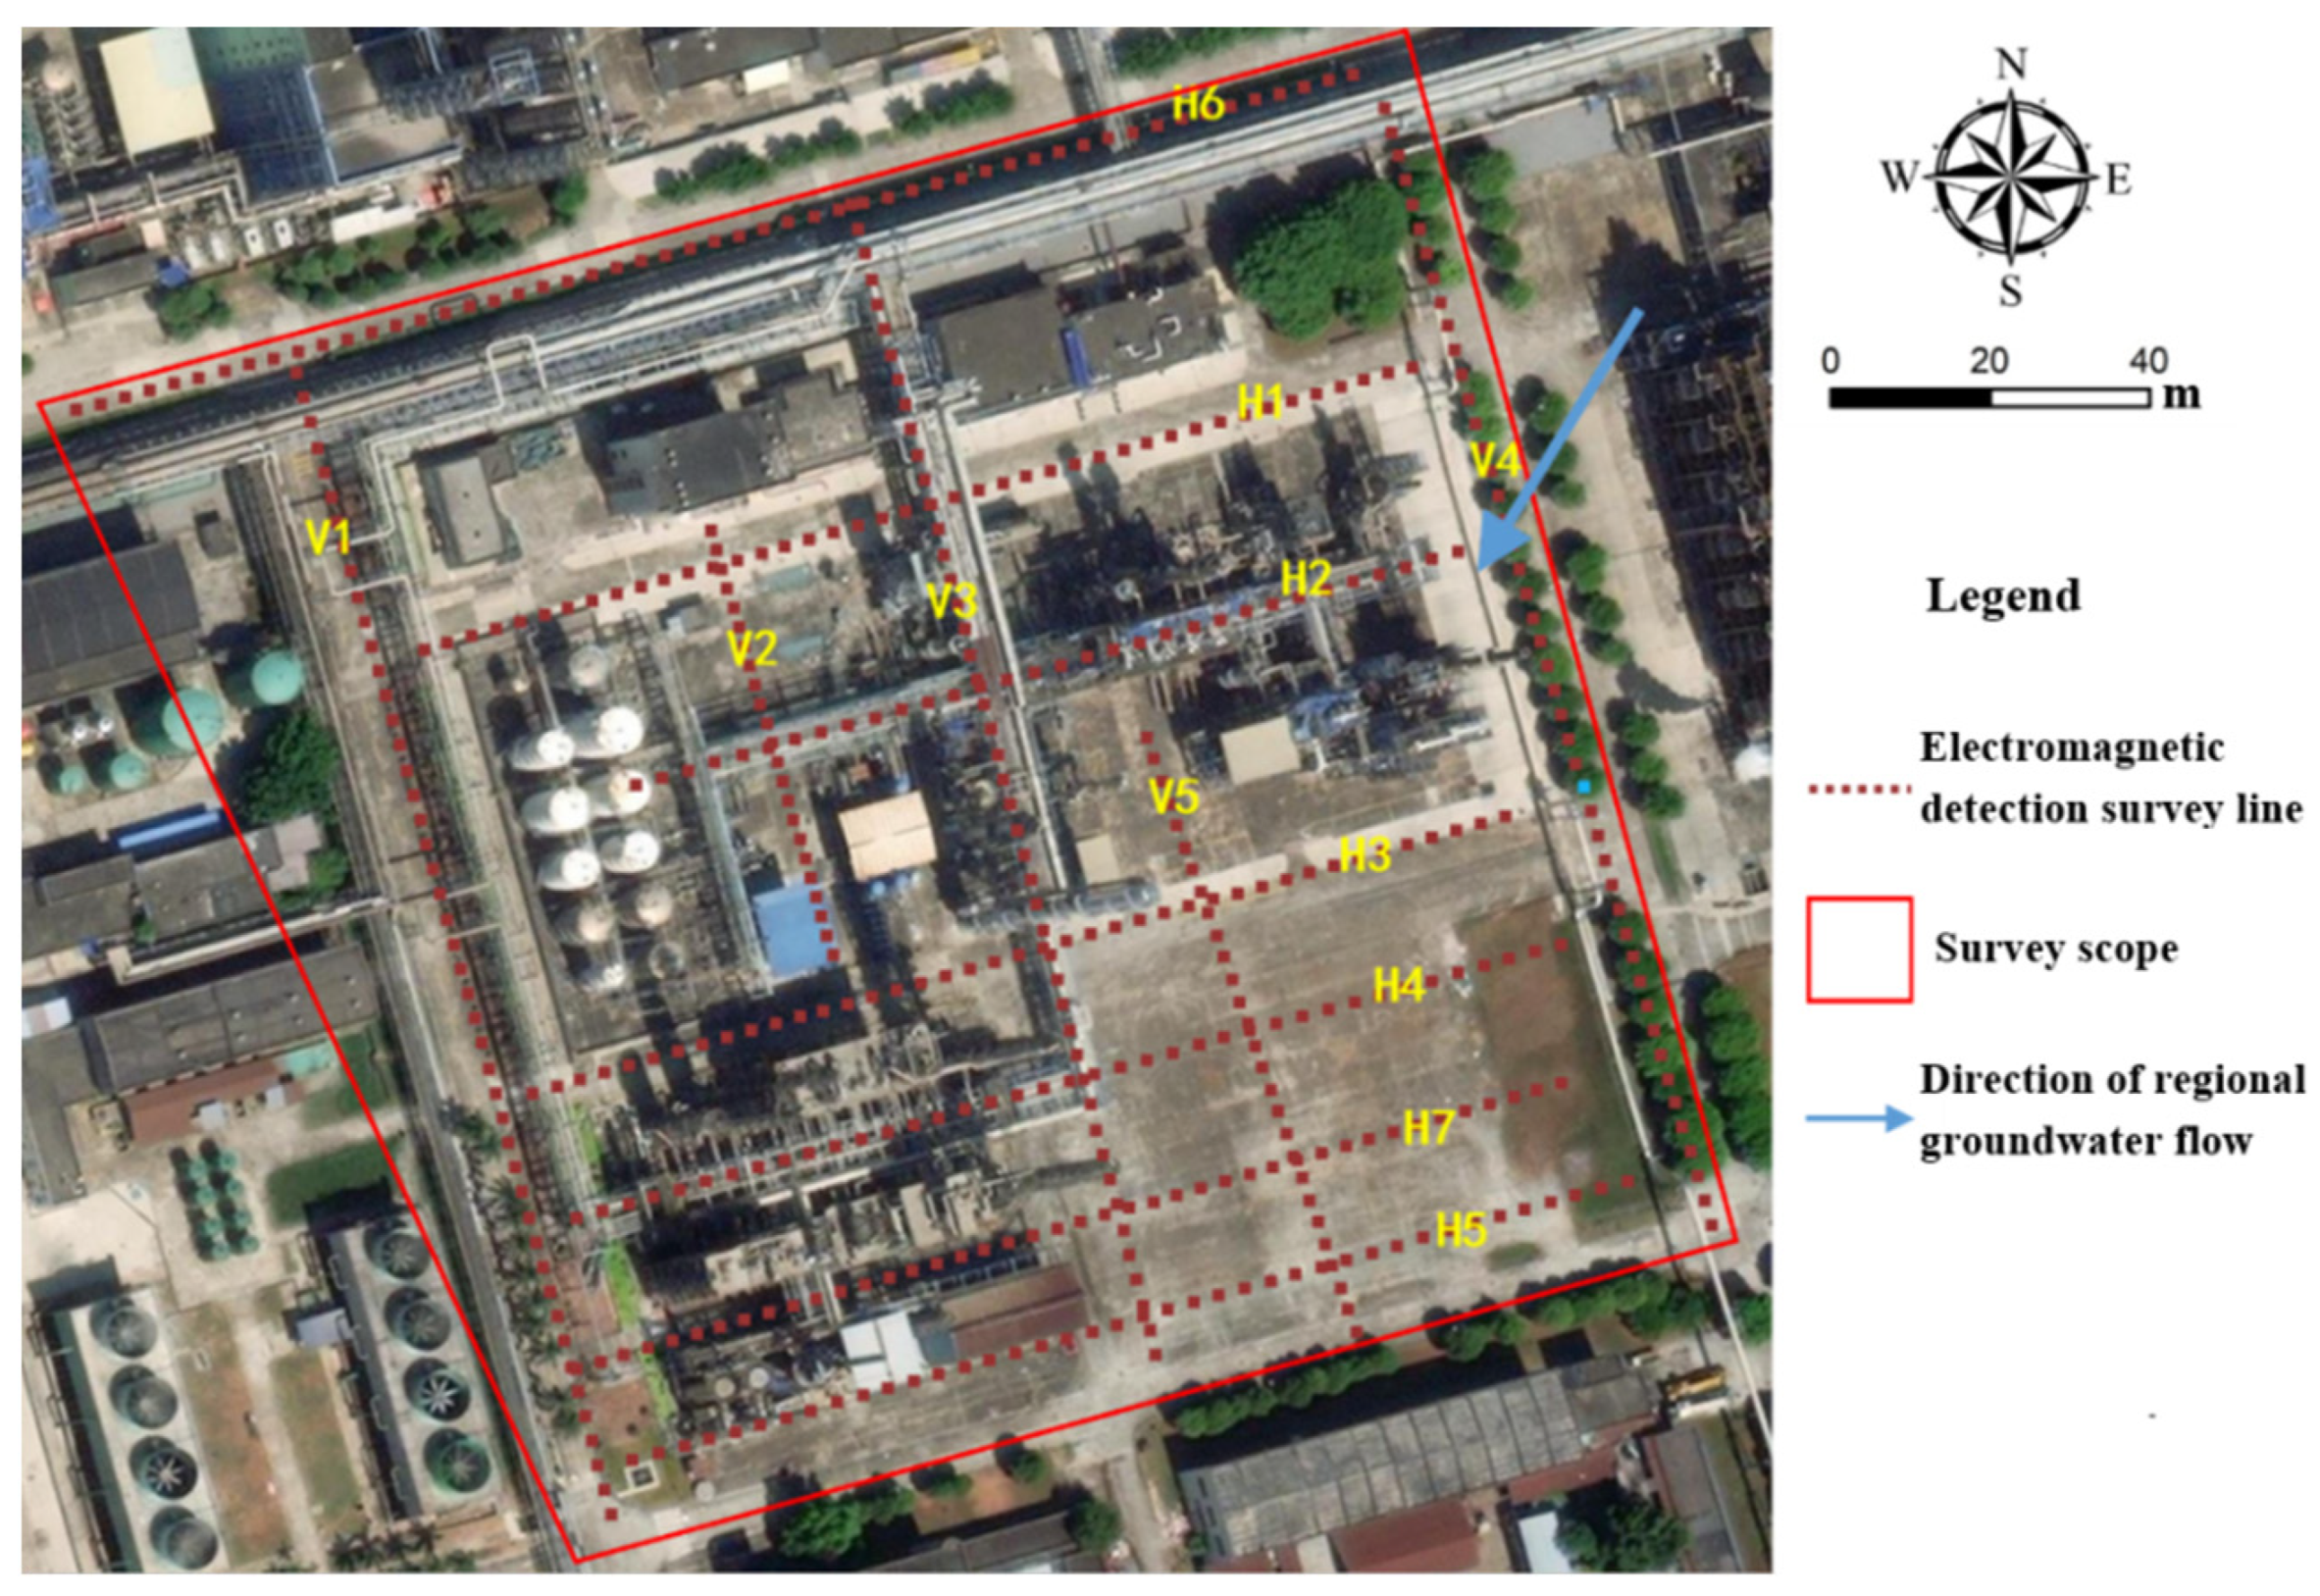
Survey line layout is a crucial step in the detection process. In this study, a linear profiling approach was adopted, with both horizontal and vertical survey lines deployed. A total of 480 measurement points were preliminarily set. To enhance data reliability, ground-penetrating radar (GPR) was simultaneously conducted during the geophysical survey. The specific layout of the geophysical survey lines is shown in Figure 3. GPR emits high-frequency broadband electromagnetic pulses into the ground, and the received electromagnetic waves are processed and analyzed to infer the spatial position, structure, electrical properties, and geometry of subsurface targets. A 100 MHz shielded antenna was used in the GPR survey, with the following acquisition parameters: transmit-receive antenna separation of 0.450 m; automatic stacking mode; and a recording time length of 1200 ns.

2.2.4. Membrane Interface Probe (MIP) Investigation

The MIP investigation was conducted using the 7822 rig manufactured by Geoprobe Systems (USA). The method involves driving a heated probe equipped with a semi-permeable membrane into the subsurface via hammering or pushing, allowing volatile organic compounds (VOCs) to diffuse through the membrane into a carrier gas stream, which is then transported to the surface for detection. This enables real-time, continuous monitoring of contaminant concentrations in both soil and groundwater.
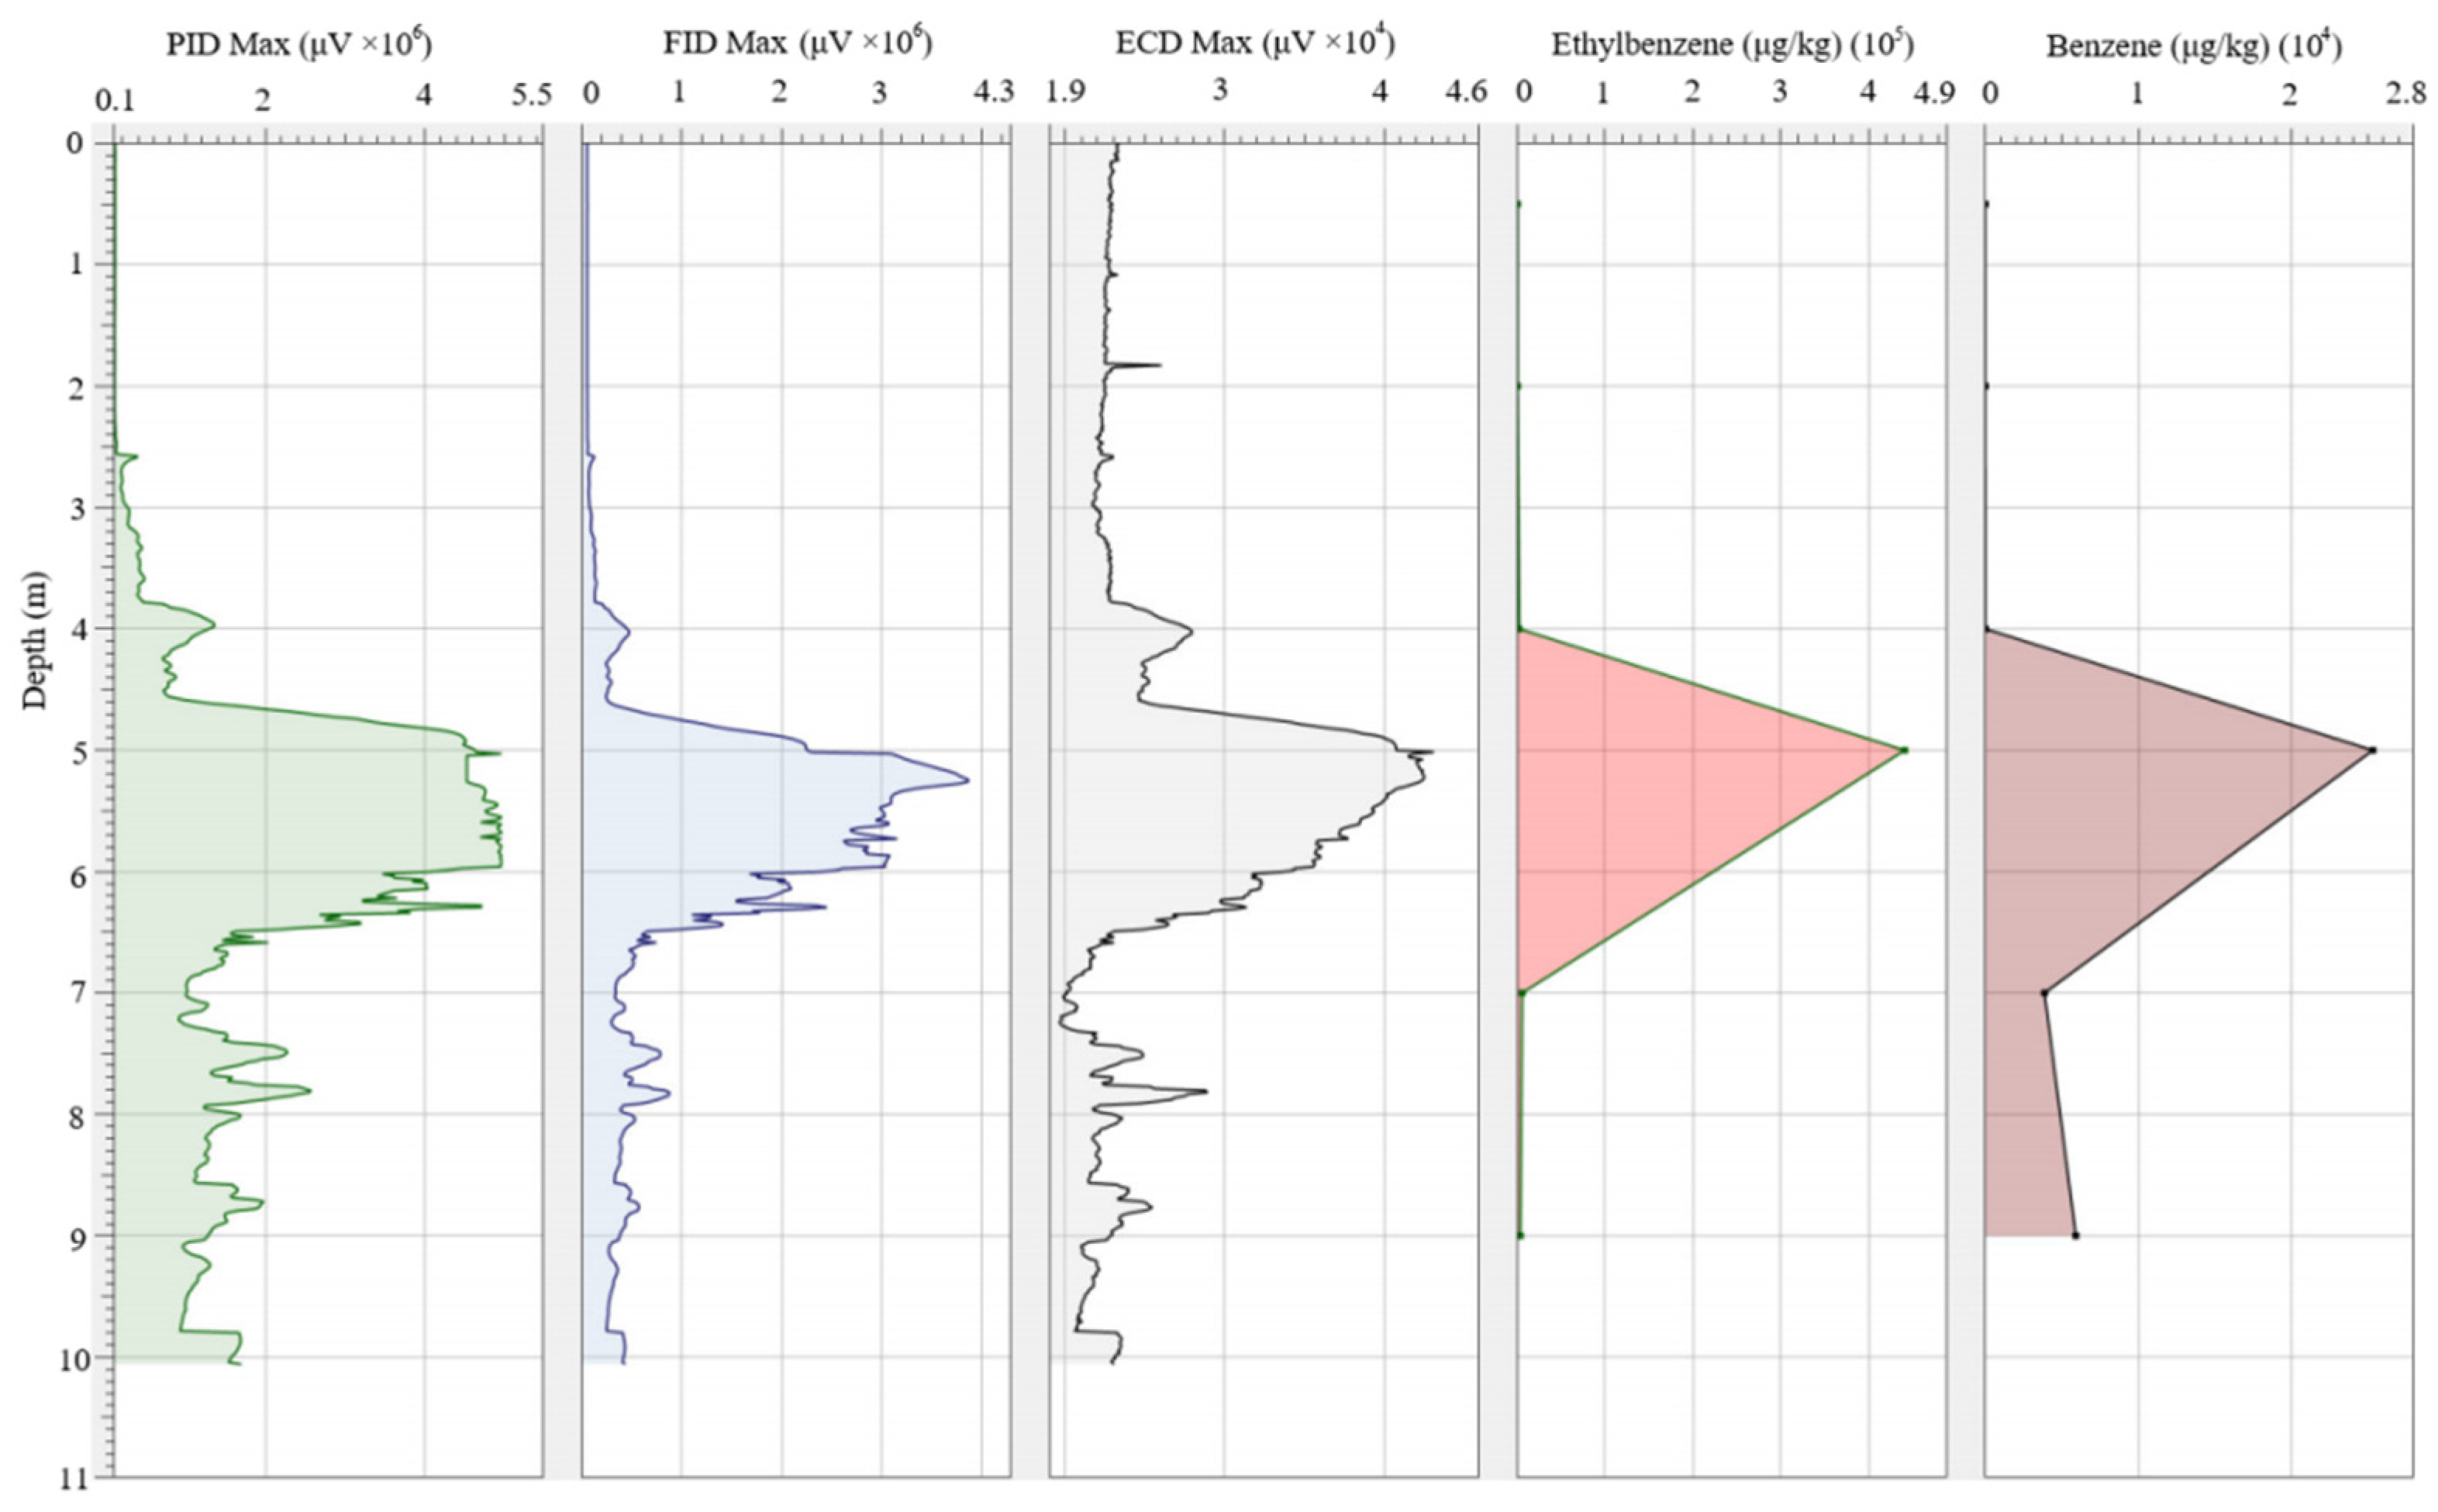
During this investigation, the MIP was heated to 110–120 °C via an on-site controller and advanced downward at a constant rate of 50 cm per minute using the GP rig’s power system, reaching a maximum depth of 10 m below ground level. Readings were recorded at 1.5 cm intervals, with each sampling point analyzed using flame ionization (FID), photoionization (PID), and electron-capture (ECD) detectors. Sampling continued until no significant contaminant signals were detected at the base of the profile, allowing a preliminary assessment of the vertical and lateral extent of organic contamination.
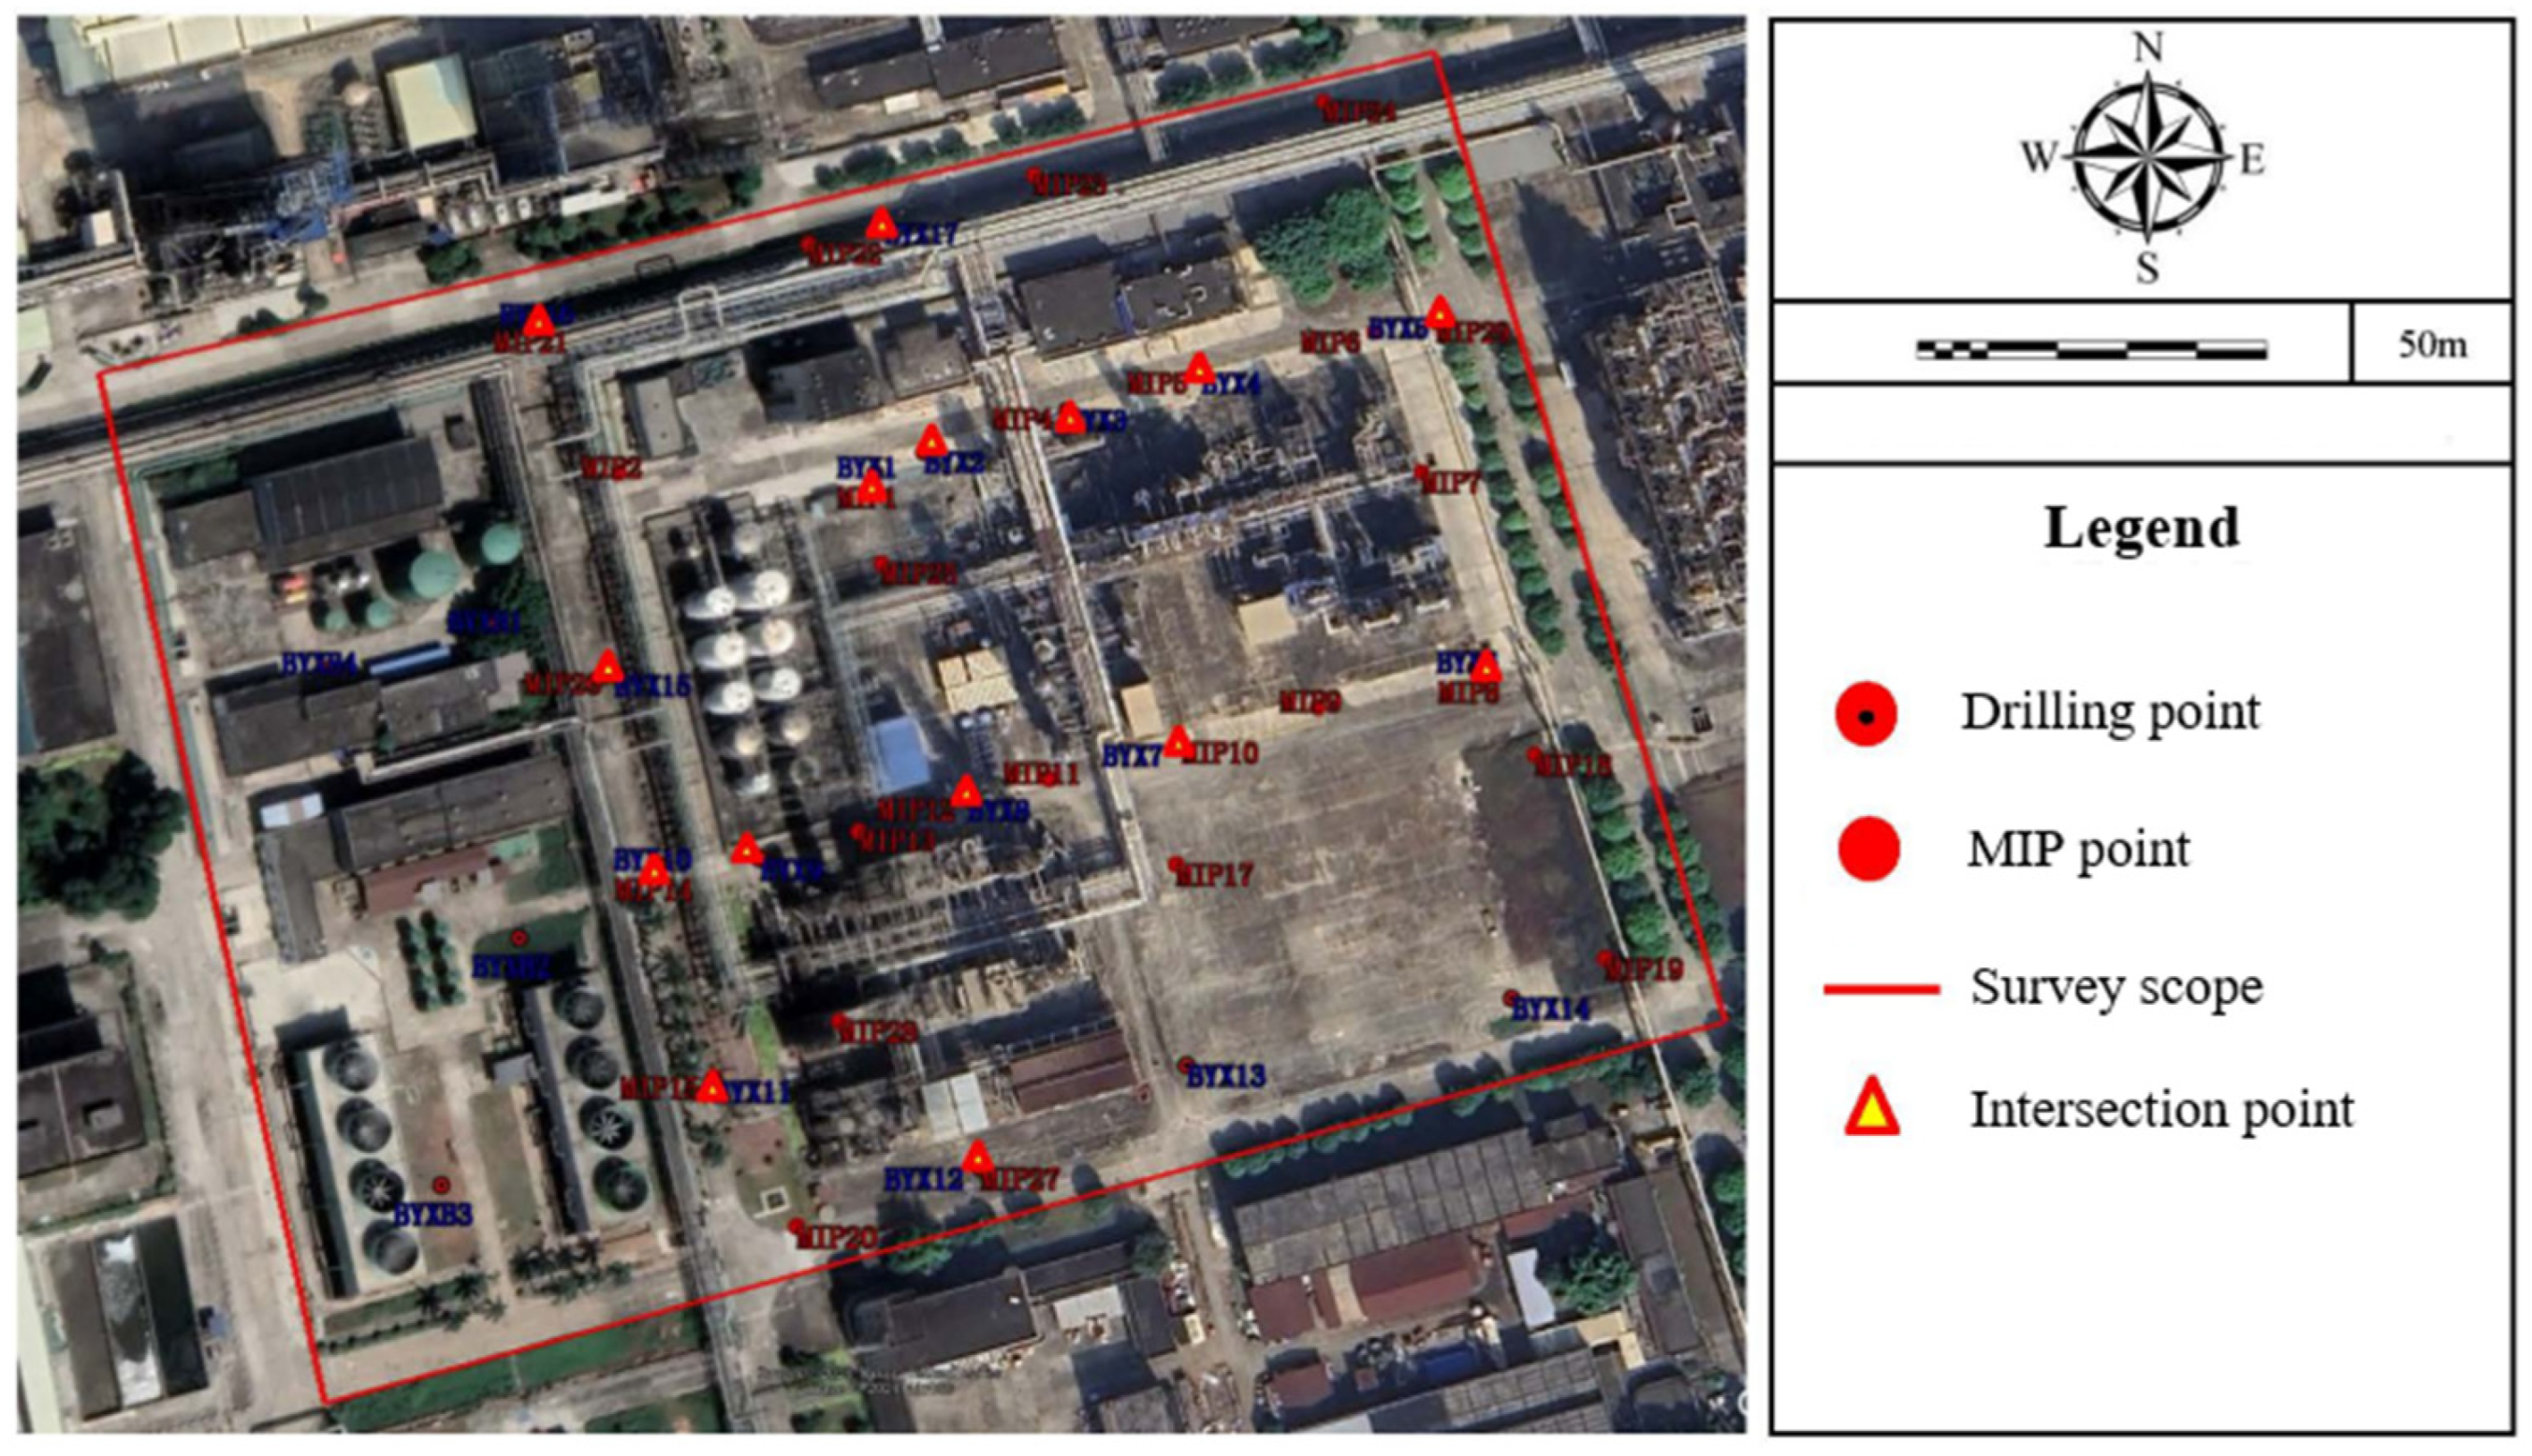
A total of 29 test points were established for this survey, with testing depths ranging from 8 m to 20 m below ground surface, corresponding to a spatial density of approximately 5.3 points per hectare over the study area. The specific sampling locations are shown in Figure 4. During the testing, electrical conductivity (EC) values were simultaneously recorded to determine formation conductivity, thereby providing information on stratigraphic structure and lithological distribution. The layout of the MIP points was designed to achieve an approximately uniform distribution while also taking into account the results from soil-gas surveys and geophysical investigations. This integrated approach aimed to capture a more accurate representation of subsurface contaminant distribution with a minimized number of sampling points.

2.3. Supplementary Investigation of Drilling

Drilling operations were conducted using conventional drilling rigs. Prior to drilling, pipe locators were employed to detect subsurface metal pipelines and conduits. Drilling bits and rods were cleaned before commencing each borehole. Mud-free drilling was adopted, with full casing advancement throughout the process to prevent borehole collapse and cross-contamination between different layers. Based on the interpreted results from multiple preliminary investigation techniques, boreholes were strategically placed at key locations. A total of 17 sampling points were established, covering suspected heavily contaminated zones, moderately contaminated areas, and non-contaminated areas. In total, 158 soil samples and 21 groundwater samples were collected. Groundwater sampling for VOCs/SVOCs analysis was performed using low-flow sampling techniques. The specific sampling locations are shown in Figure 4.

3. Results

3.1. Characterization of Spatial Heterogeneity in Pollution

3.1.1. Characterization of Functional Genes and Metabolic Gas Heterogeneity in Topsoil

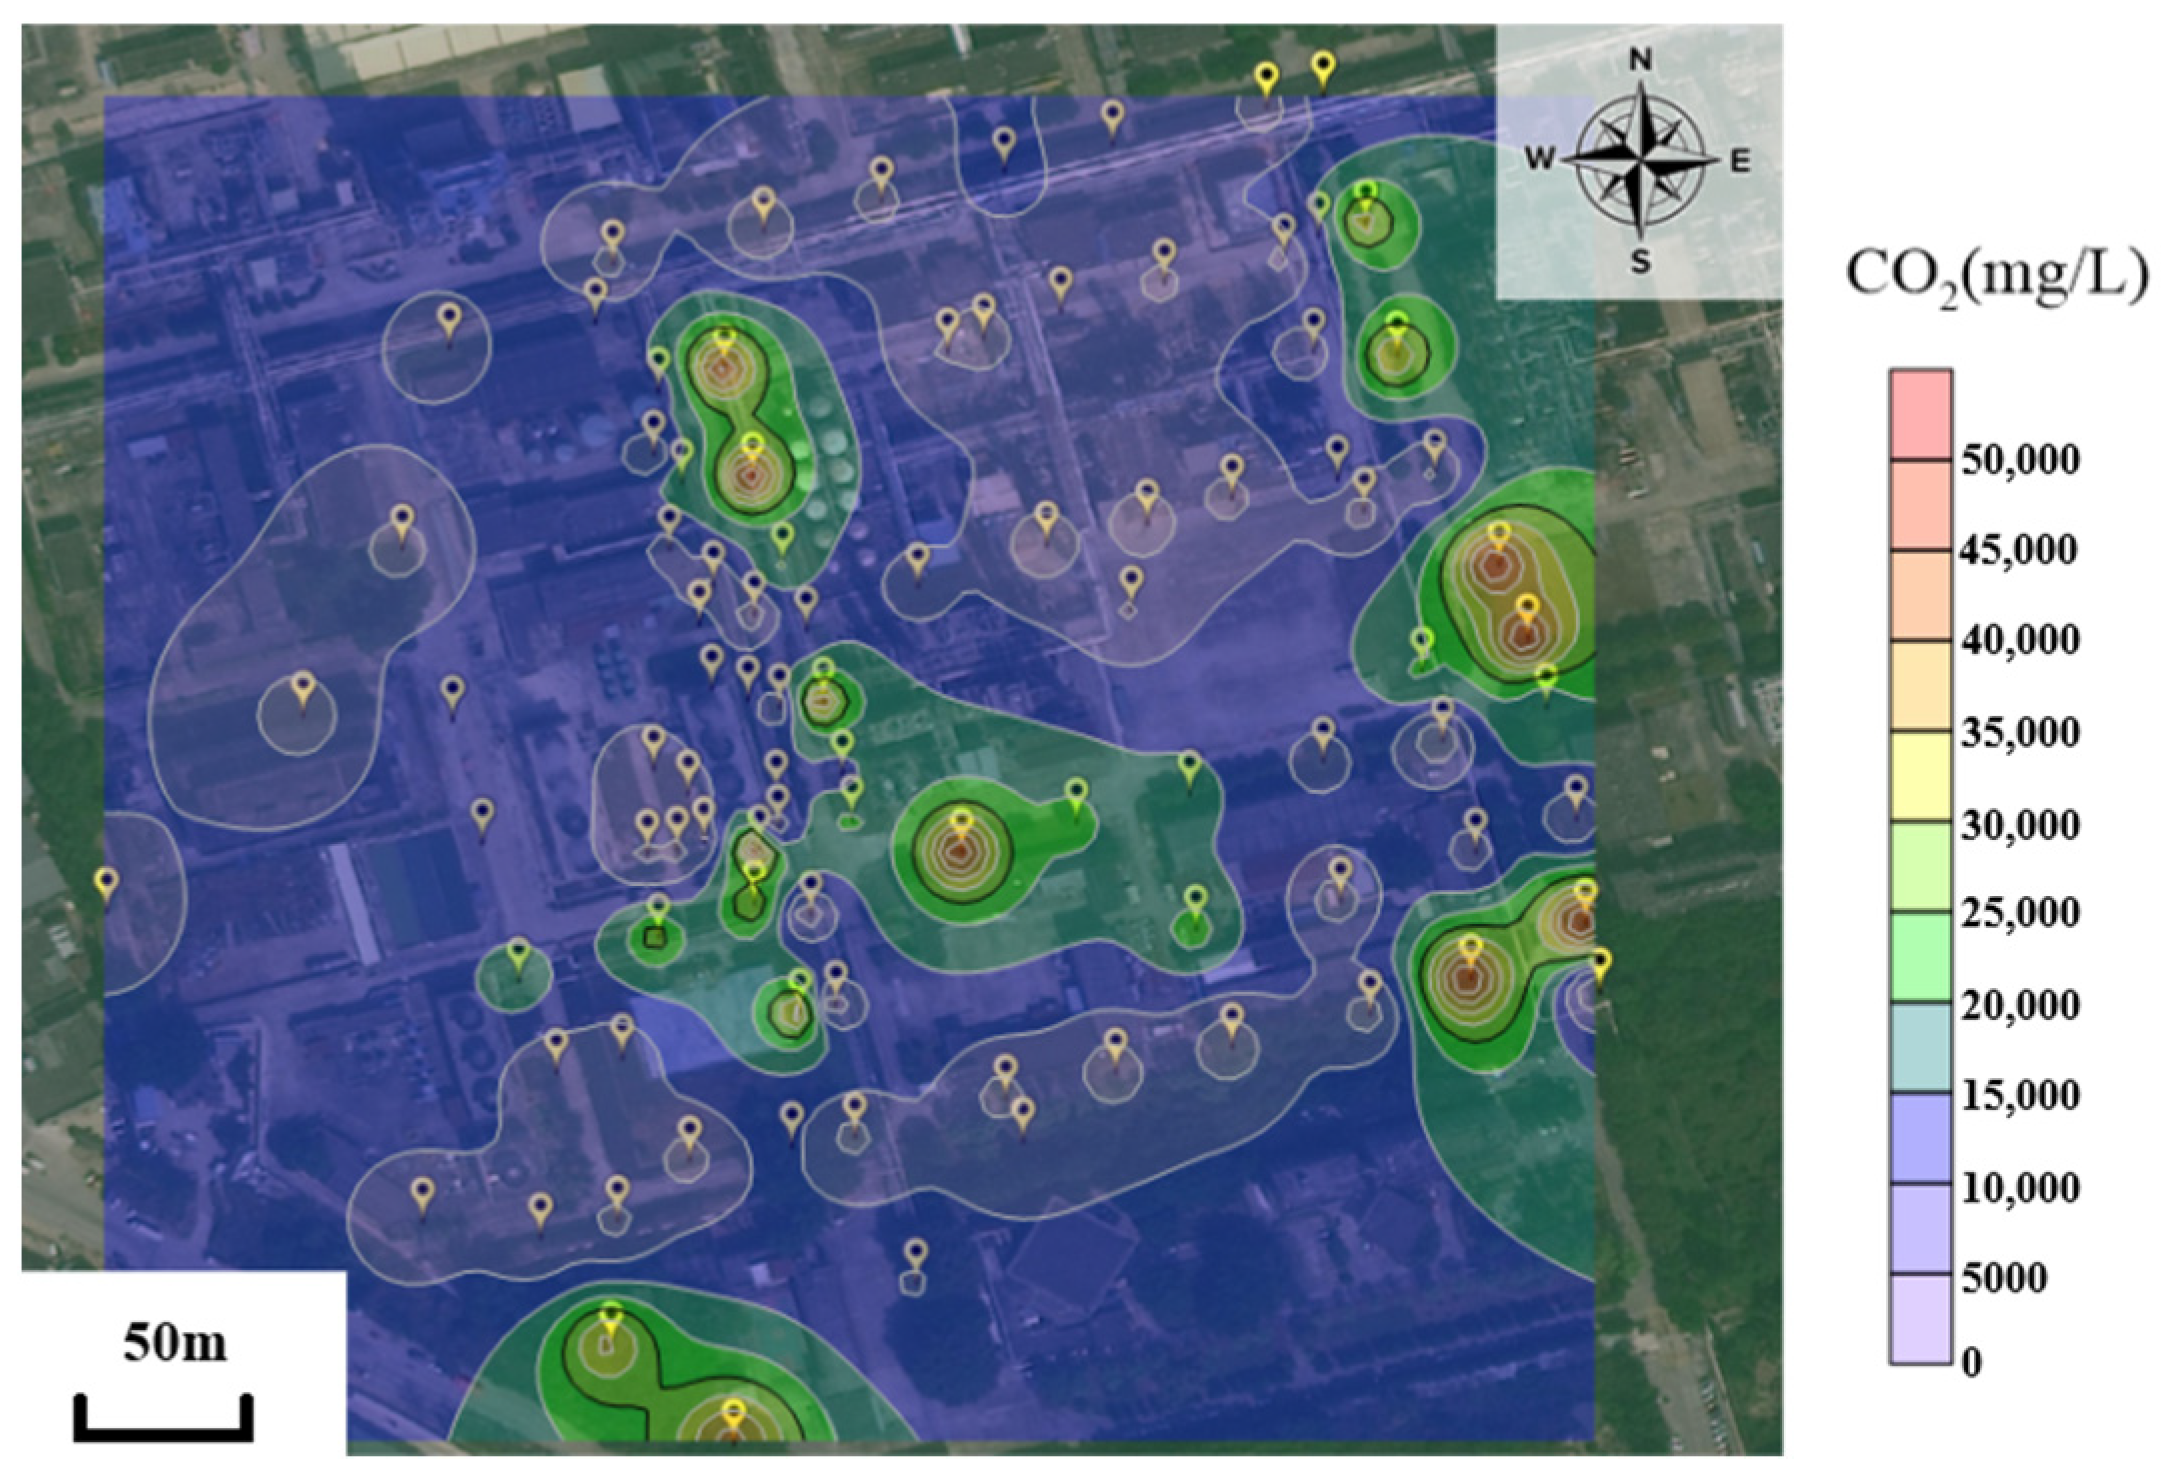
Based on the facility’s production layout and the locations of subsurface concealed infrastructure obtained through personnel interviews, a total of 94 sampling points were established for the detection of microbial metabolic gases in surface soil, with 17 functional genes collected from the surface soil. The concentration distribution of the typical microbial metabolic gas CO2 is shown in Figure 5, which exhibits an enrichment trend along the western boundary of the facility area. The O2 concentration shows an inverse correlation with CO2, further indicating anomalies in this region. According to the degradation mechanism of contaminants by microbial metabolism, subsurface pollutants migrating through vapor intrusion undergo microbial degradation during upward volatilization, with a portion of the contaminants ultimately metabolized aerobically into CO2 near the surface. This process leads to an increase in CO2 concentration and a decrease in O2 concentration. The spatial pattern of these surface soil metabolic gases suggests the presence of organic contamination within the facility area, with potential key contaminated zones located near the product storage tanks and the southwestern installation area. However, the fully paved ground within the facility limited the density of sampling points for microbial metabolic gas detection. Safety considerations and the cost associated with breaking the pavement prevented the adoption of a more intensive sampling strategy, which would have provided a clearer planar distribution of potential contamination.
The three functional genes detected—catechol 1,2-dioxygenase (C12O), alkane monooxygenase (AlkB), and propane monooxygenase (prmA)—all showed high detection rates, indicating the widespread presence of composite contamination by aromatic hydrocarbons, short-chain petroleum hydrocarbons, and alkane hydrocarbons within the facility area. This necessitates further detailed investigation. In open spaces within the facility, the concentrations of functional genes such as catechol 1,2-dioxygenase (C12O) and alkane monooxygenase (AlkB) decreased significantly, suggesting that the contaminant plume has not substantially migrated in that direction.

3.1.2. Heterogeneous Characterization of Geophysical Investigation

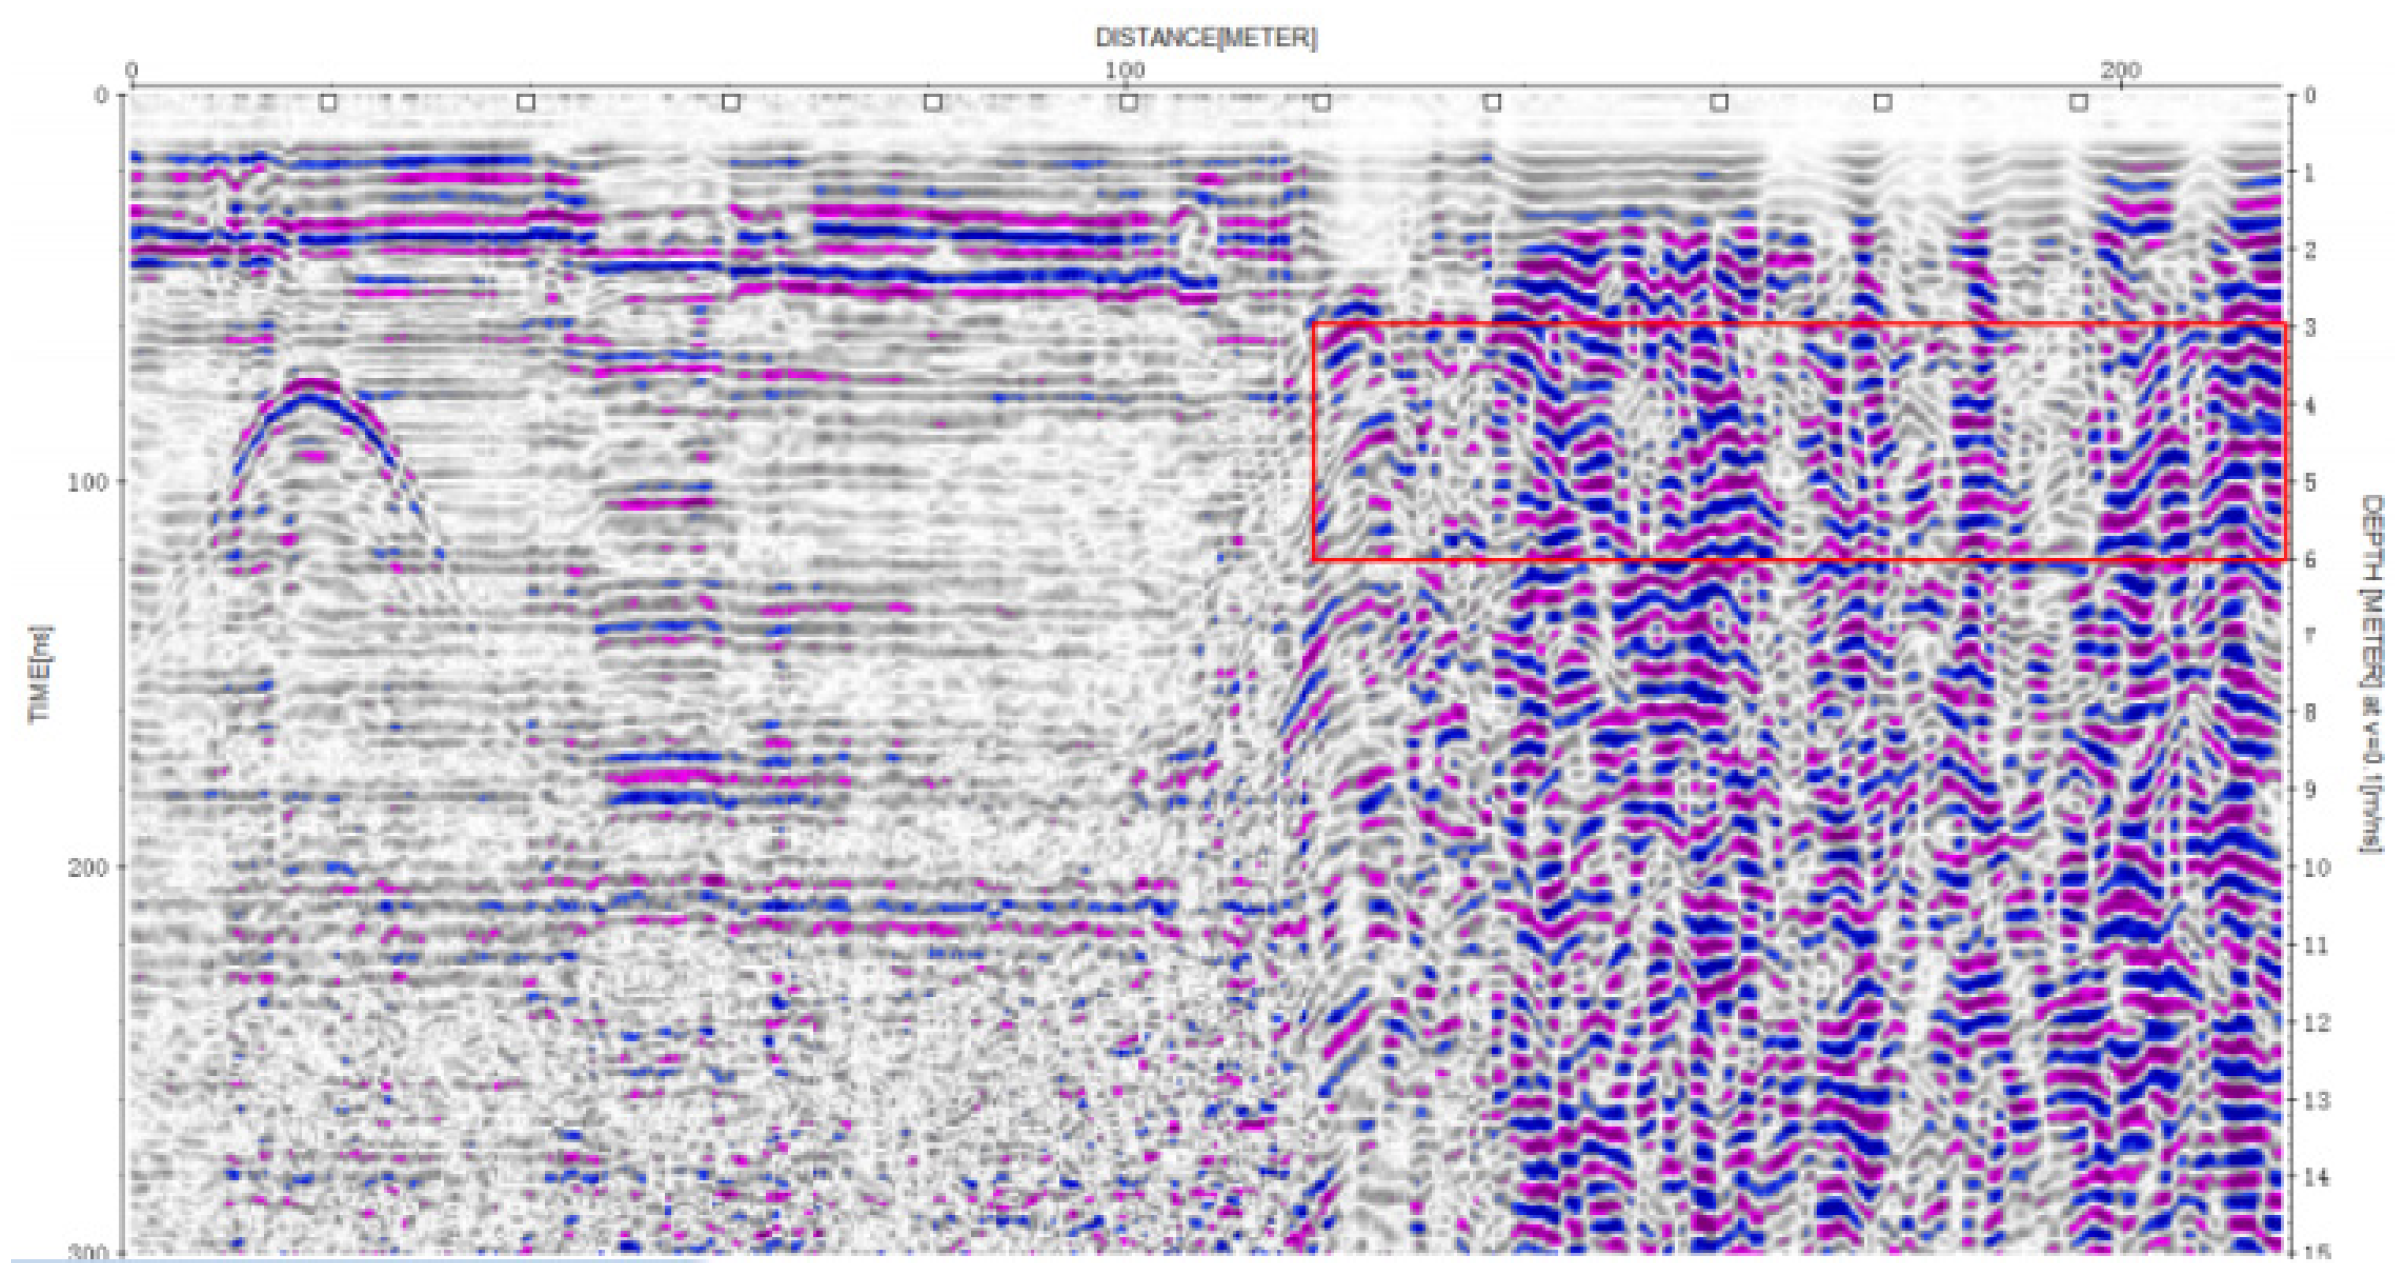
A total of 12 ground-penetrating radar (GPR) survey lines were completed in this geophysical investigation. Based on the GPR waveform images and comprehensive analysis of preliminary geological data from the site, when oil-phase contaminants are present in the surveyed area, the properties of the subsurface medium differ from those of the surrounding soil layers. The GPR waveform images in such areas exhibit characteristics such as high frequency, strong reflection, broad amplitude, and scattered clutter. After excluding interference from nearby facilities and underground pipelines, the GPR data identified that the radar waveforms along line E showed significantly higher amplitudes (as shown in Figure 6). In contrast, the radar waveforms in the surrounding soil layers displayed relatively continuous phase axes. After eliminating ambient interference factors, this area was inferred to represent an anomaly. The planar distribution of this anomaly aligns with the location of the southwestern facility indicated by the earlier soil gas detection results.
A total of 12 survey lines were deployed for the electromagnetic investigation. Among them, line H4 coincides with the aforementioned GPR line E. A total of 1560 valid apparent resistivity data points were obtained, with an average value of 9.215, a maximum of 76.370, a minimum of 0.445, and a coefficient of variation of 166.458%. Detailed statistical results are presented in Table 1 and Table 2.
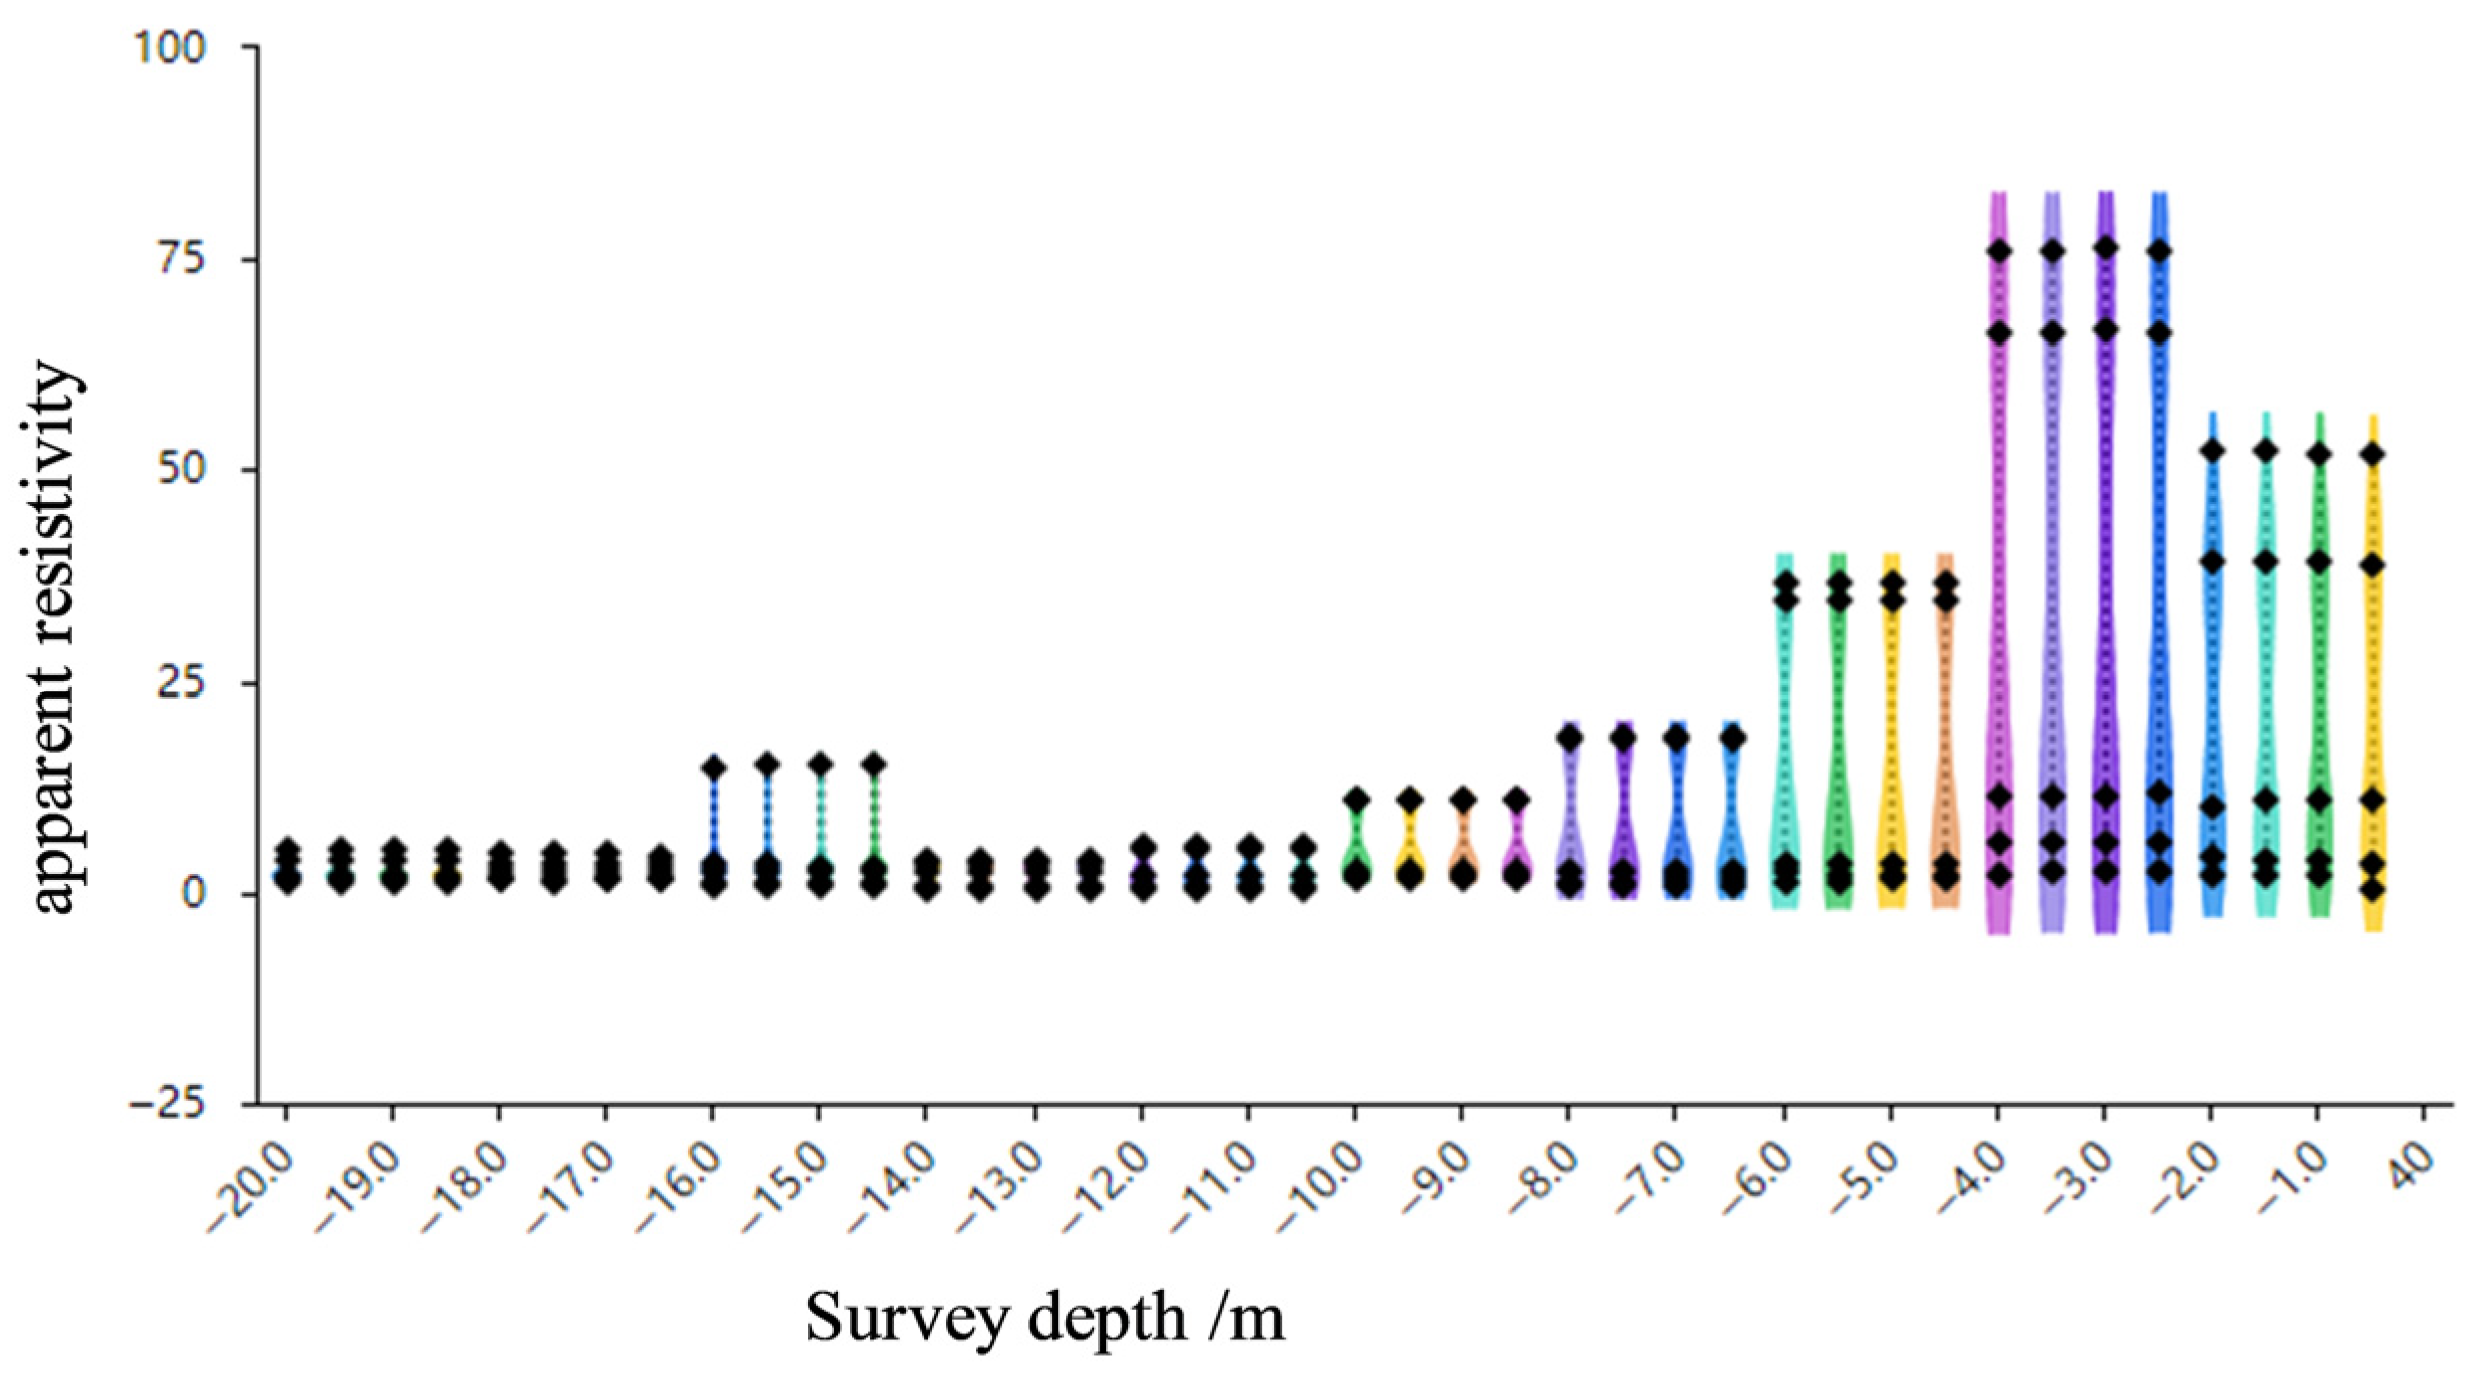
Analysis of data acquired from different depth intervals reveals a distinct pattern. The Violin Plot (shown in Figure 7) displays a pronounced cluster of high values at depths of approximately 2.5 to 4 m below ground level, indicating a significant deviation from other strata. This suggests the presence of anomalous high apparent resistivity values within this depth range.
Furthermore, statistical analysis of the apparent resistivity data along survey line H1 shows that the 97.5th percentile is 66.563, with a coefficient of variation of 166.458%. These metrics confirm the existence of a highly heterogeneous body characterized by elevated apparent resistivity along this line. The spatial location and depth of this anomalous body are consistent with the anomalies identified by the Ground-Penetrating Radar (GPR) line E. Given that the depth of this heterogeneous body (approximately 2.5–4 m) aligns closely with the observed groundwater table depth, it is inferred that subsurface contamination is likely present in this area.
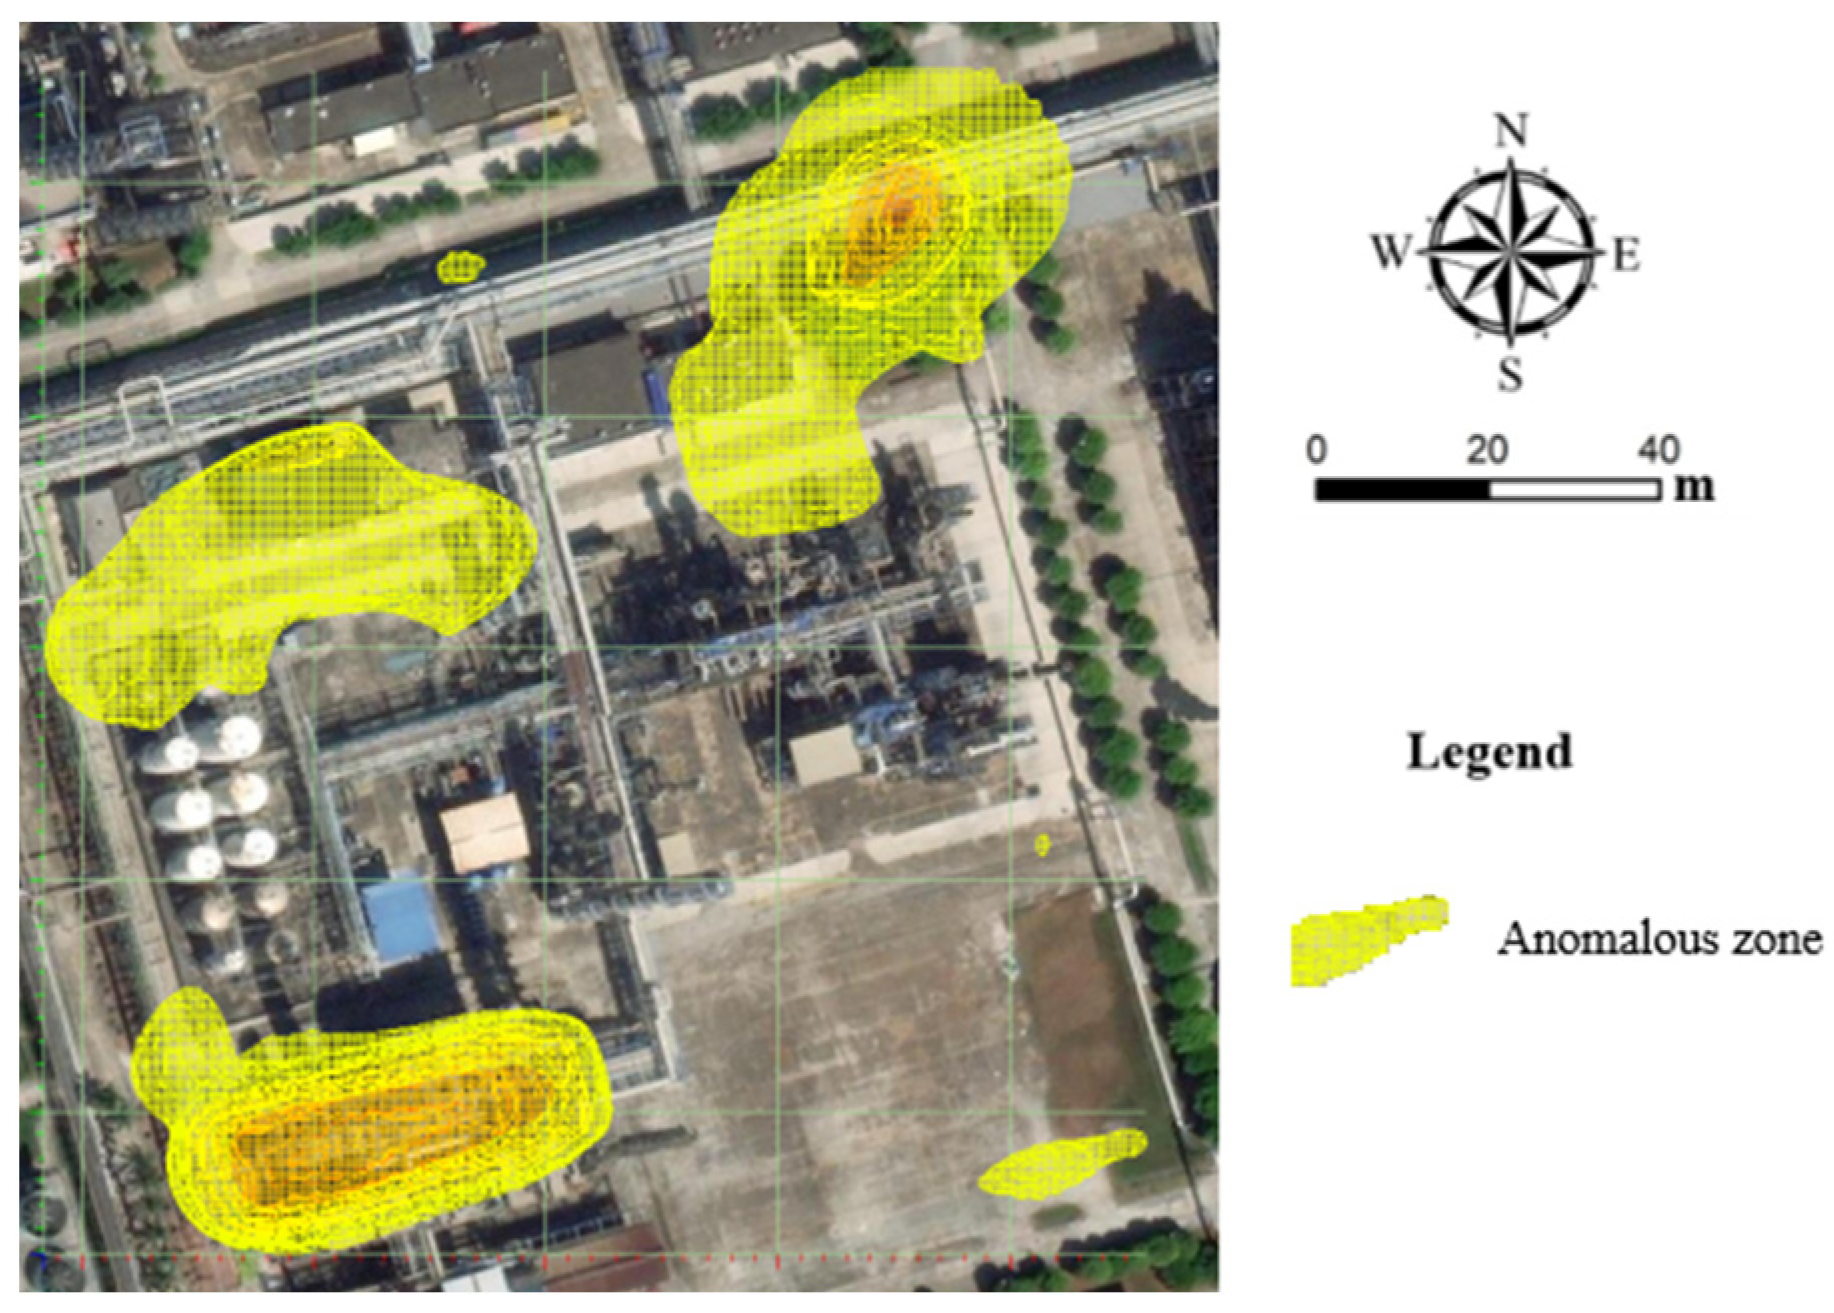
Furthermore, the Inverse Distance Weighting (IDW) algorithm was applied to all apparent resistivity data across different depths at each survey point to perform three-dimensional modeling and interpolation of subsurface heterogeneity. The three-dimensional spatial distribution of heterogeneous zones with apparent resistivity values greater than 20 is illustrated in Figure 8. Three large-scale anomalous zones with high apparent resistivity were identified and are inferred to be potentially associated with the presence of oil-phase contaminants.
In addition to the anomalous zone in the southwestern part of the survey area, two other anomalous bodies were detected in the northern region. The anomalous zone in the northwest shows spatial correspondence with the contaminated area inferred from the surface microbial metabolic gas data, suggesting likely contamination in this sector as well. The anomalous body located in the northeast, however, requires further investigation and validation to clarify its nature and potential environmental impact.

3.1.3. Heterogeneous Characterization of MIP Investigation

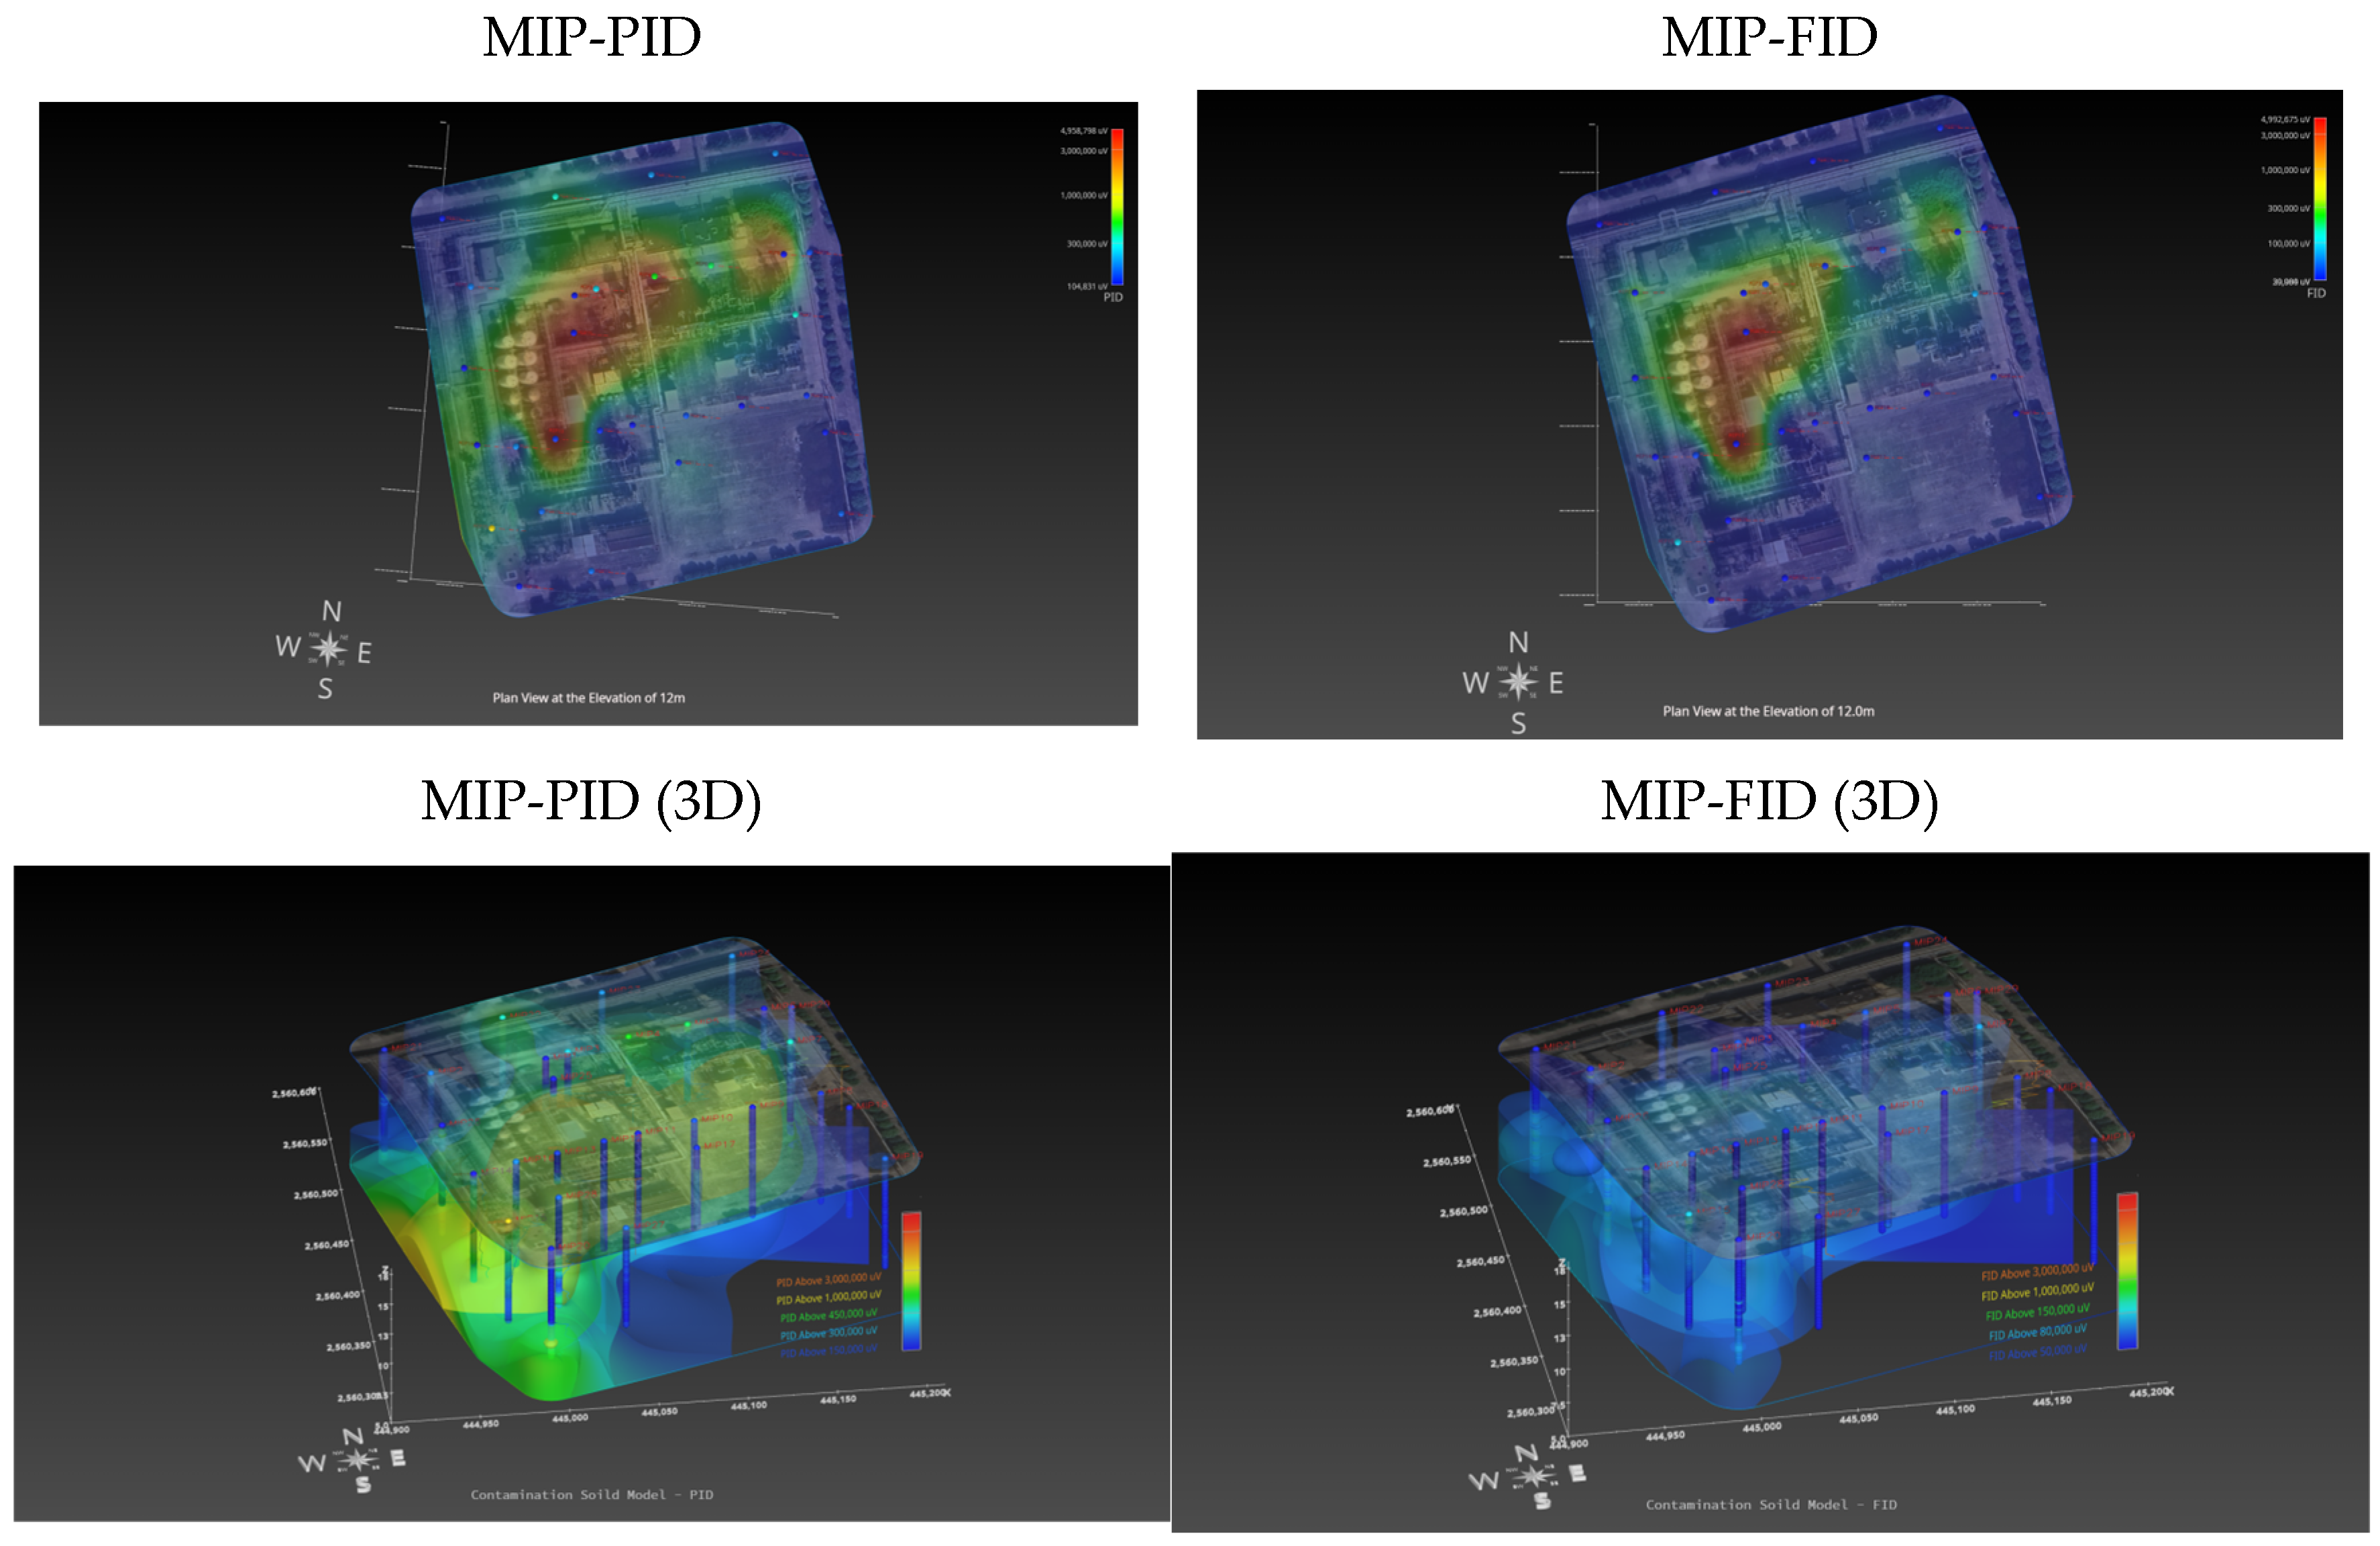
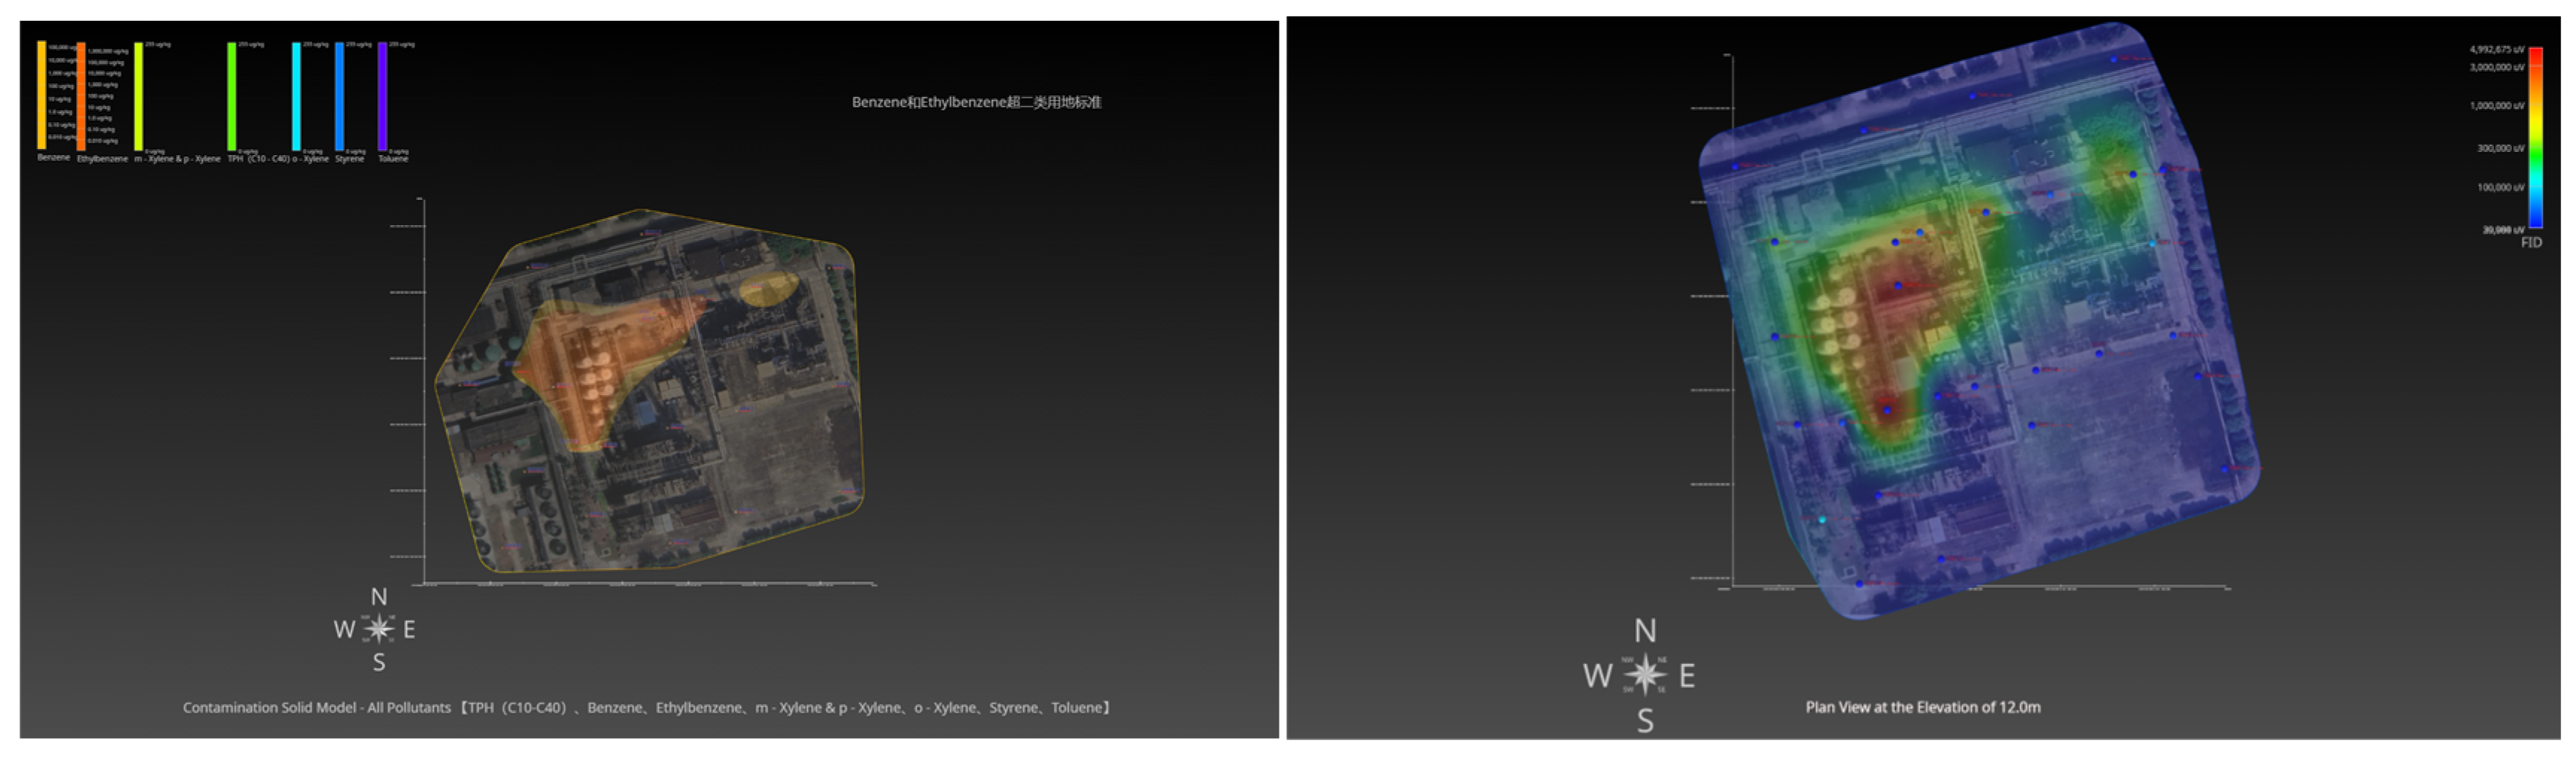
The MIP investigation was conducted as an advanced survey based on the results of previous surface-soil functional gene detection, metabolic gas analysis, and geophysical surveys. Its primary objectives were to identify and verify suspected contamination and to delineate the vertical distribution of pollutants. The planar distribution of PID detection results is shown in the accompanying Figure 9. As illustrated in the figure, PID and FID detection results exhibit strong positive correlation—except for the ECD detector—indicating that contamination in this area is predominantly composed of aromatic hydrocarbons and petroleum-based hydrocarbons.
After interpolation, the contamination distribution aligns with the geophysical survey results, indicating varying degrees of organic pollution—except in open areas within the facility—concentrated at depths of approximately 5 m to 9 m below ground level.
As a semi-quantitative auxiliary tool, the MIP collects a dataset every 1.5 cm via a subsurface probe, generating extensive continuous data. These data are presented graphically, enabling real-time and rapid preliminary assessment. However, the MIP responds only to volatile and semi-volatile organic compounds, and the detector outputs are recorded in “μV”. Therefore, the magnitude of the graphical signals alone cannot determine whether regulatory thresholds are exceeded. Laboratory data must be integrated for systematic analysis to accurately characterize the three-dimensional spatial distribution of subsurface contaminants.

3.1.4. Characterization of the Pollution Plume by Supplementary Drilling

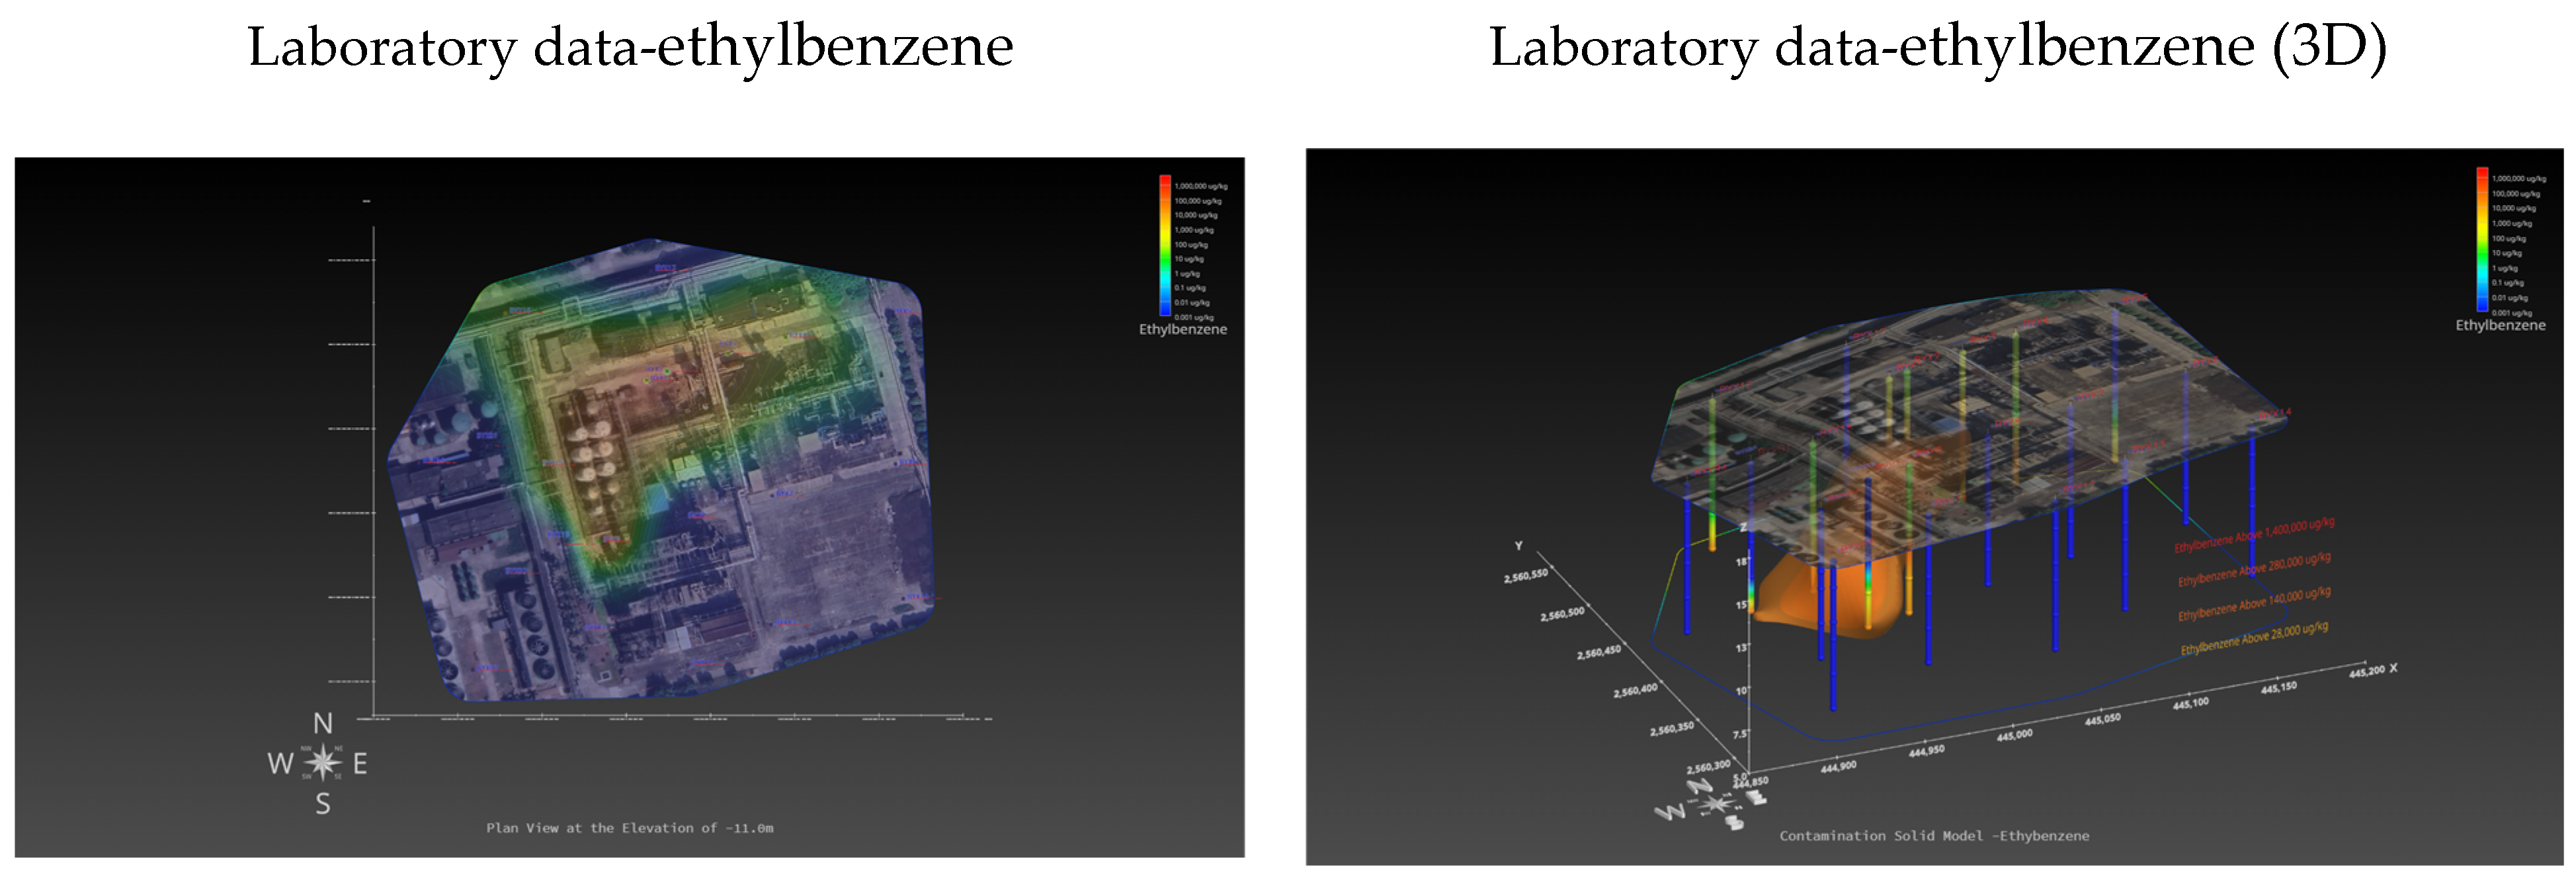
Supplementary drilling investigations were conducted based on previous integrated surveys, targeting characteristic contaminants identified during the initial site assessment, such as benzene series compounds and petroleum hydrocarbons. Laboratory analyses revealed that petroleum hydrocarbons, benzene, and ethylbenzene were among the most frequently detected indicators, confirming the earlier inference of organic contamination in this area. Three-dimensional visualization was applied to the soil sample data from various sampling points. Taking ethylbenzene, which exhibited relatively high concentrations, as an example, its planar distribution is illustrated in the accompanying Figure 10. The corresponding three-dimensional contamination distribution is also presented graphically.
As illustrated in the figures, contamination is primarily distributed in the northwestern part of the facility area, which is generally consistent with the findings from previous investigations. The contamination is concentrated at depths of 4 m to 6 m below ground level. Among them, the concentration of ethylbenzene in this area ranged from not detected to 4410 mg/kg, with relatively higher concentrations observed around 5 m depth. At 6 m depth, the area of high concentration expands further. The distribution of contaminants in groundwater corresponds well with that in soil, confirming that both share a common source and that the heavily contaminated zones are spatially correlated. Based on this analysis, the heavily contaminated zone covers an area of approximately 1163 m2, while the overall zone of influence extends over about 17,724 m2. The contamination distribution indicates that, although migration has occurred to some extent in both soil and groundwater, the contamination remains largely confined within the boundaries of the facility area.

3.2. Comparison of Technical Precision

The contamination area delineated by traditional drilling investigations was slightly smaller compared to those identified by surface soil microbial metabolic gas detection, functional gene analysis, and MIP. Taking the ethylbenzene contamination range as an example, the area exceeding the standard is 28% smaller in areal extent and 12% smaller in three-dimensional extent than the anomalous range delineated by MIP. This discrepancy arises because the figure was plotted based on soil quality standard thresholds; the actual contaminated area may be somewhat larger. Techniques such as surface soil microbial metabolic gas and functional gene detection are more sensitive and can delineate areas influenced by the random dispersion of subsurface vapors during upward migration and the migration range of groundwater contaminants. Both surface soil microbial metabolic gas/functional gene detection and geophysical surveys—two low-intrusive investigation techniques—indicated contamination zones consistent with those identified by MIP and traditional drilling investigations. In high-resolution site characterization, the high sensitivity of these methods played a crucial role in effectively screening for contamination.
The results obtained from MIP were largely consistent with those from traditional drilling investigations. An analysis of data from co-located points shows that the MIP collects a continuous dataset vertically at 1.5 cm intervals, whereas laboratory analyses were performed on samples collected at discrete depths of 0.5 m, 2 m, 4 m, 5 m, 7 m, and 9 m. A comparison of data from point #1 (as shown in Figure 11) indicates that the highest contamination concentration was detected at 5 m depth in the laboratory data, and the MIP data also exhibited a peak around 5 m depth. The overall vertical distribution profiles demonstrate a strong correlation between MIP measurements and laboratory analytical data.
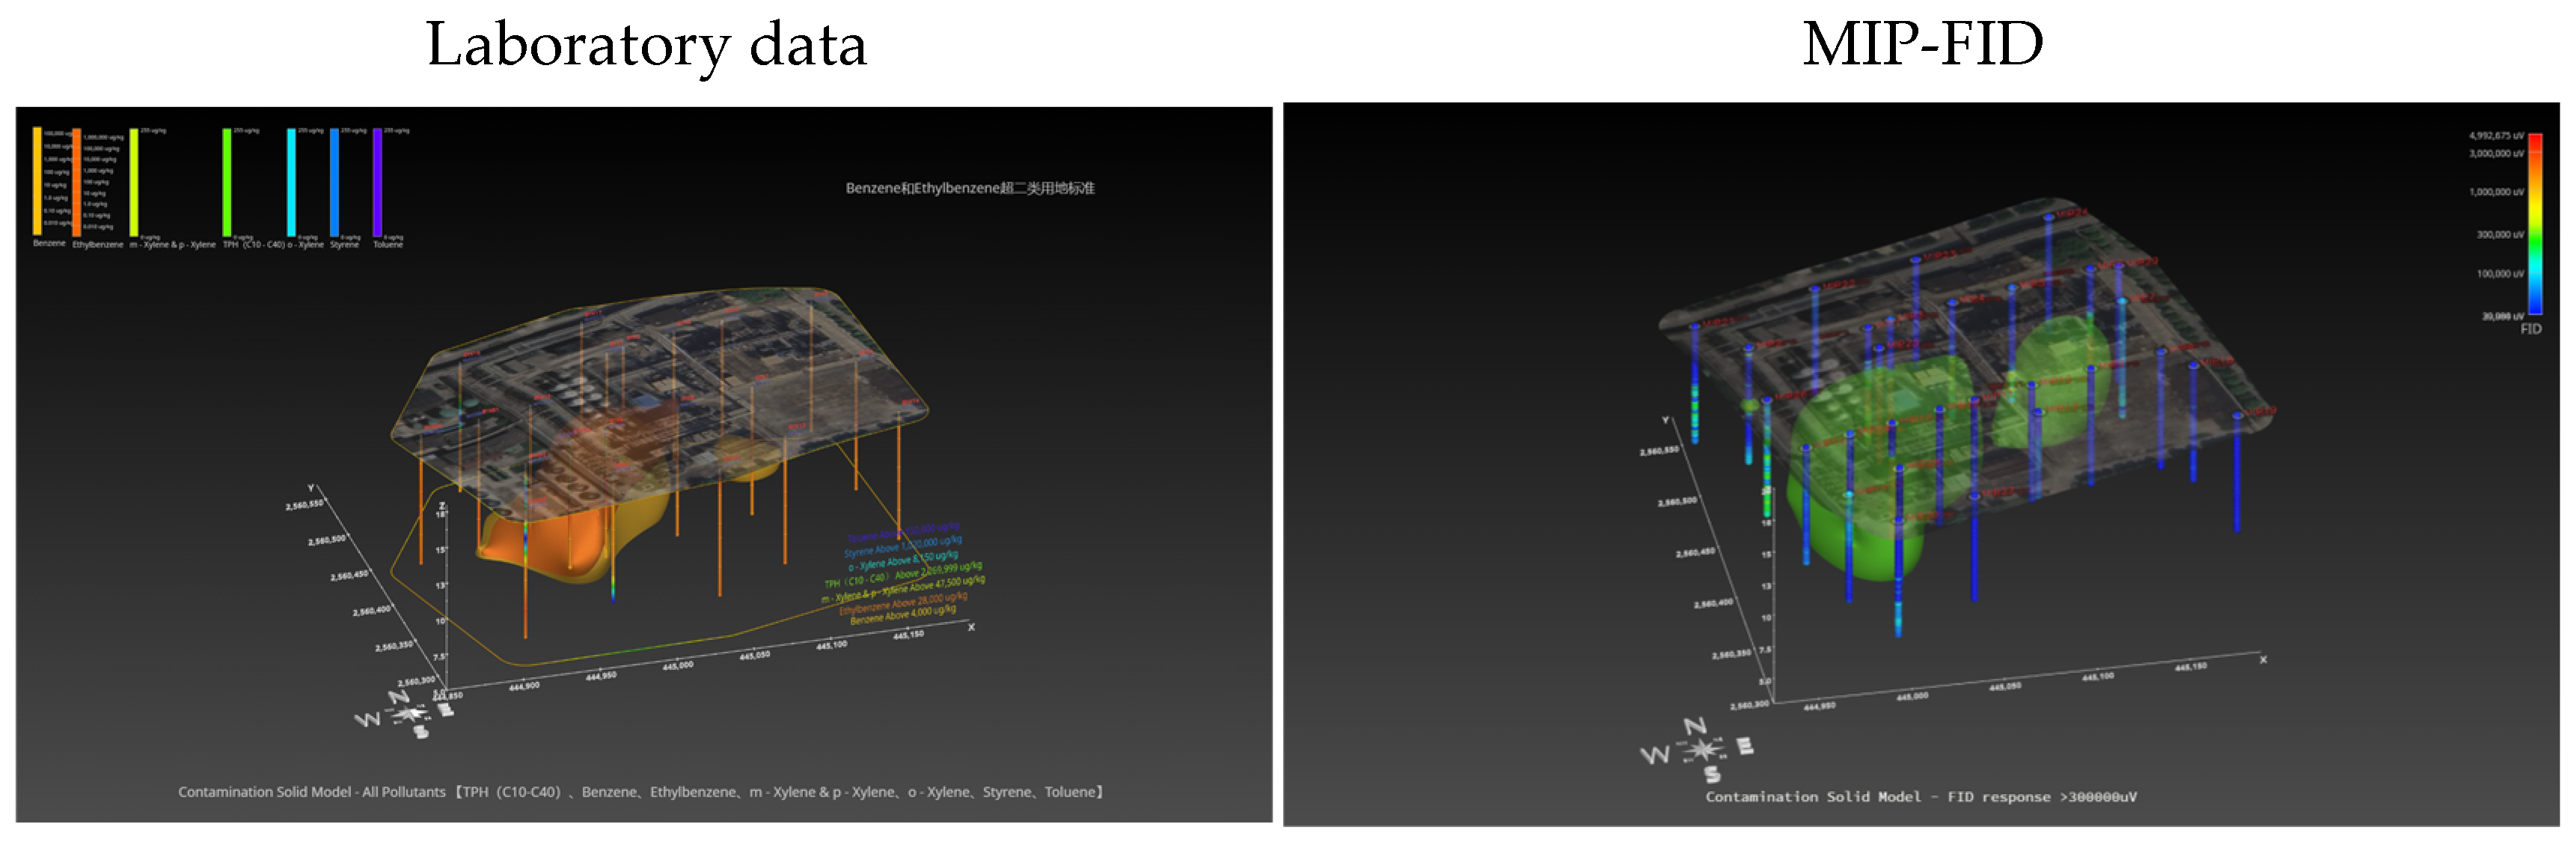
As illustrated in the 3D simulation results (as shown in the Figure 12), laboratory data and MIP test data exhibit a high degree of consistency. Contamination is predominantly concentrated in the northwestern production area, with the main contaminant plume located at depths between 5 m and 9 m below ground level. However, the contamination area delineated by the MIP-based simulation is larger than that indicated by the laboratory data. This discrepancy arises because the MIP detectors are more sensitive, while the laboratory data are evaluated against regulatory quality standard thresholds. Consequently, some areas with detectable contamination may not be delineated if the concentrations do not exceed the applicable standards.

3.3. Pollution Source Tracing and Verification

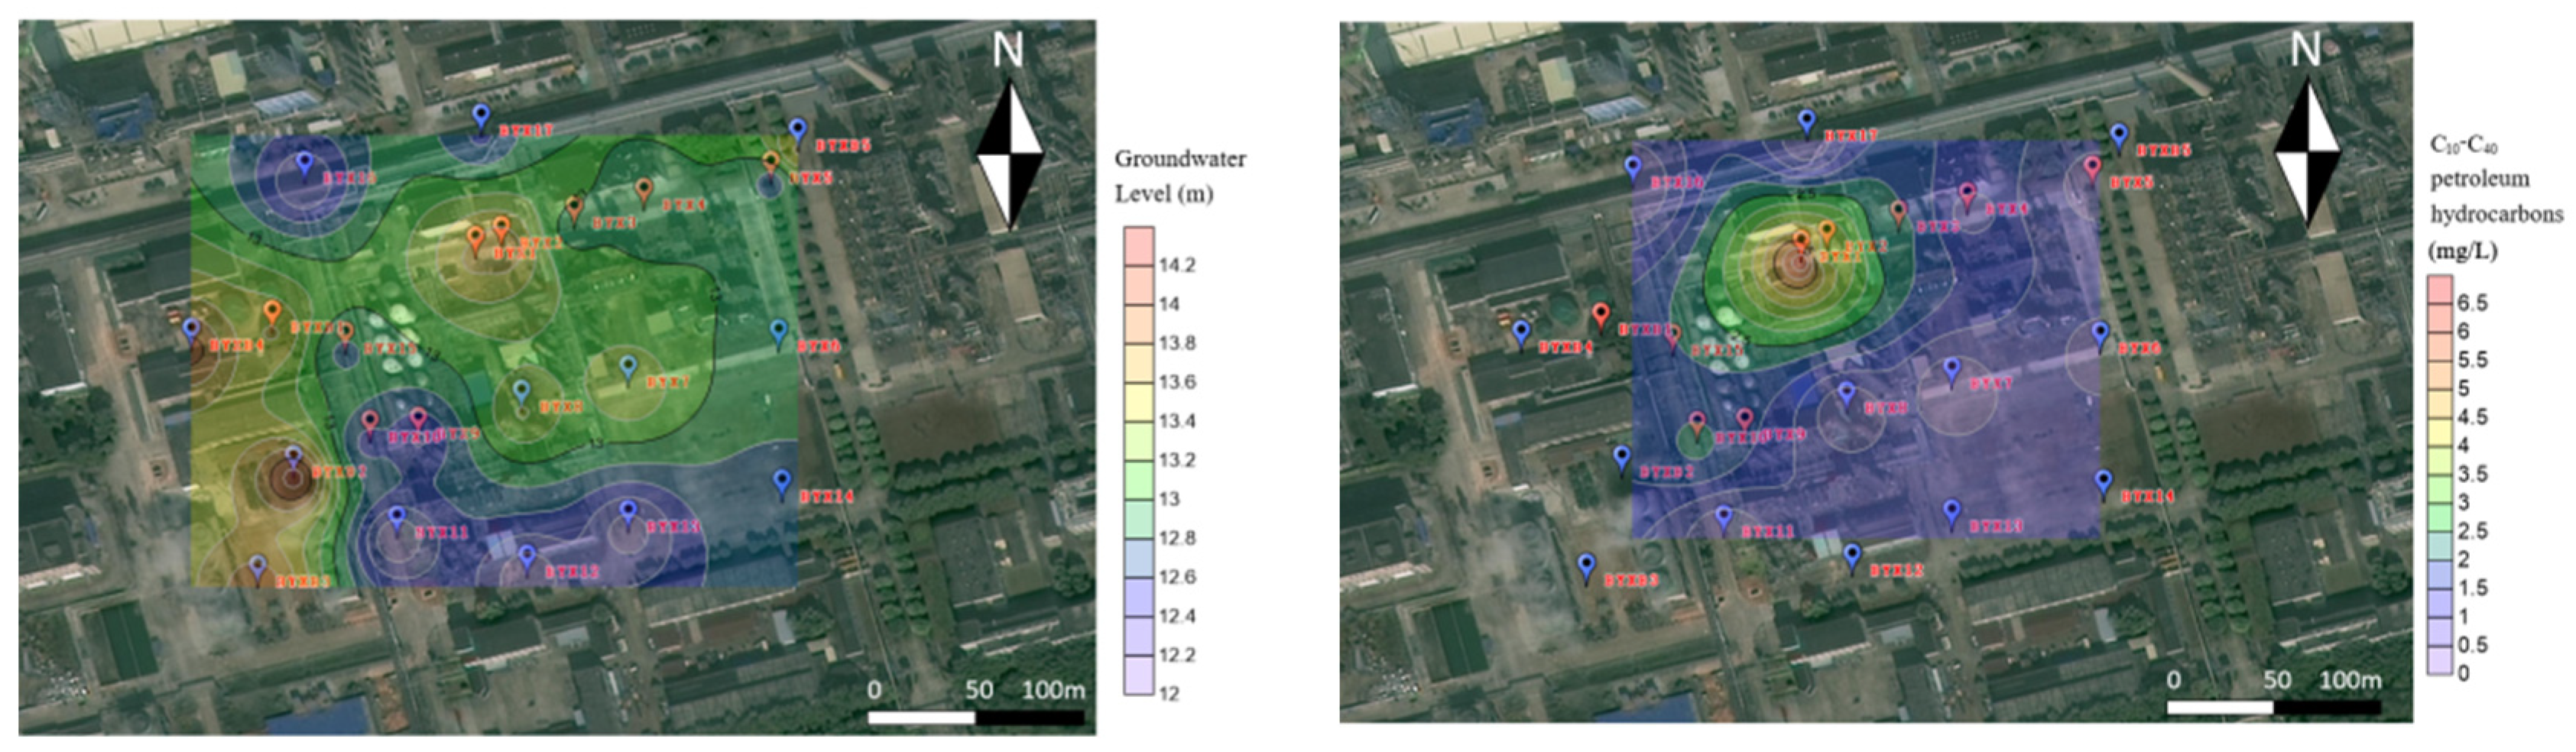
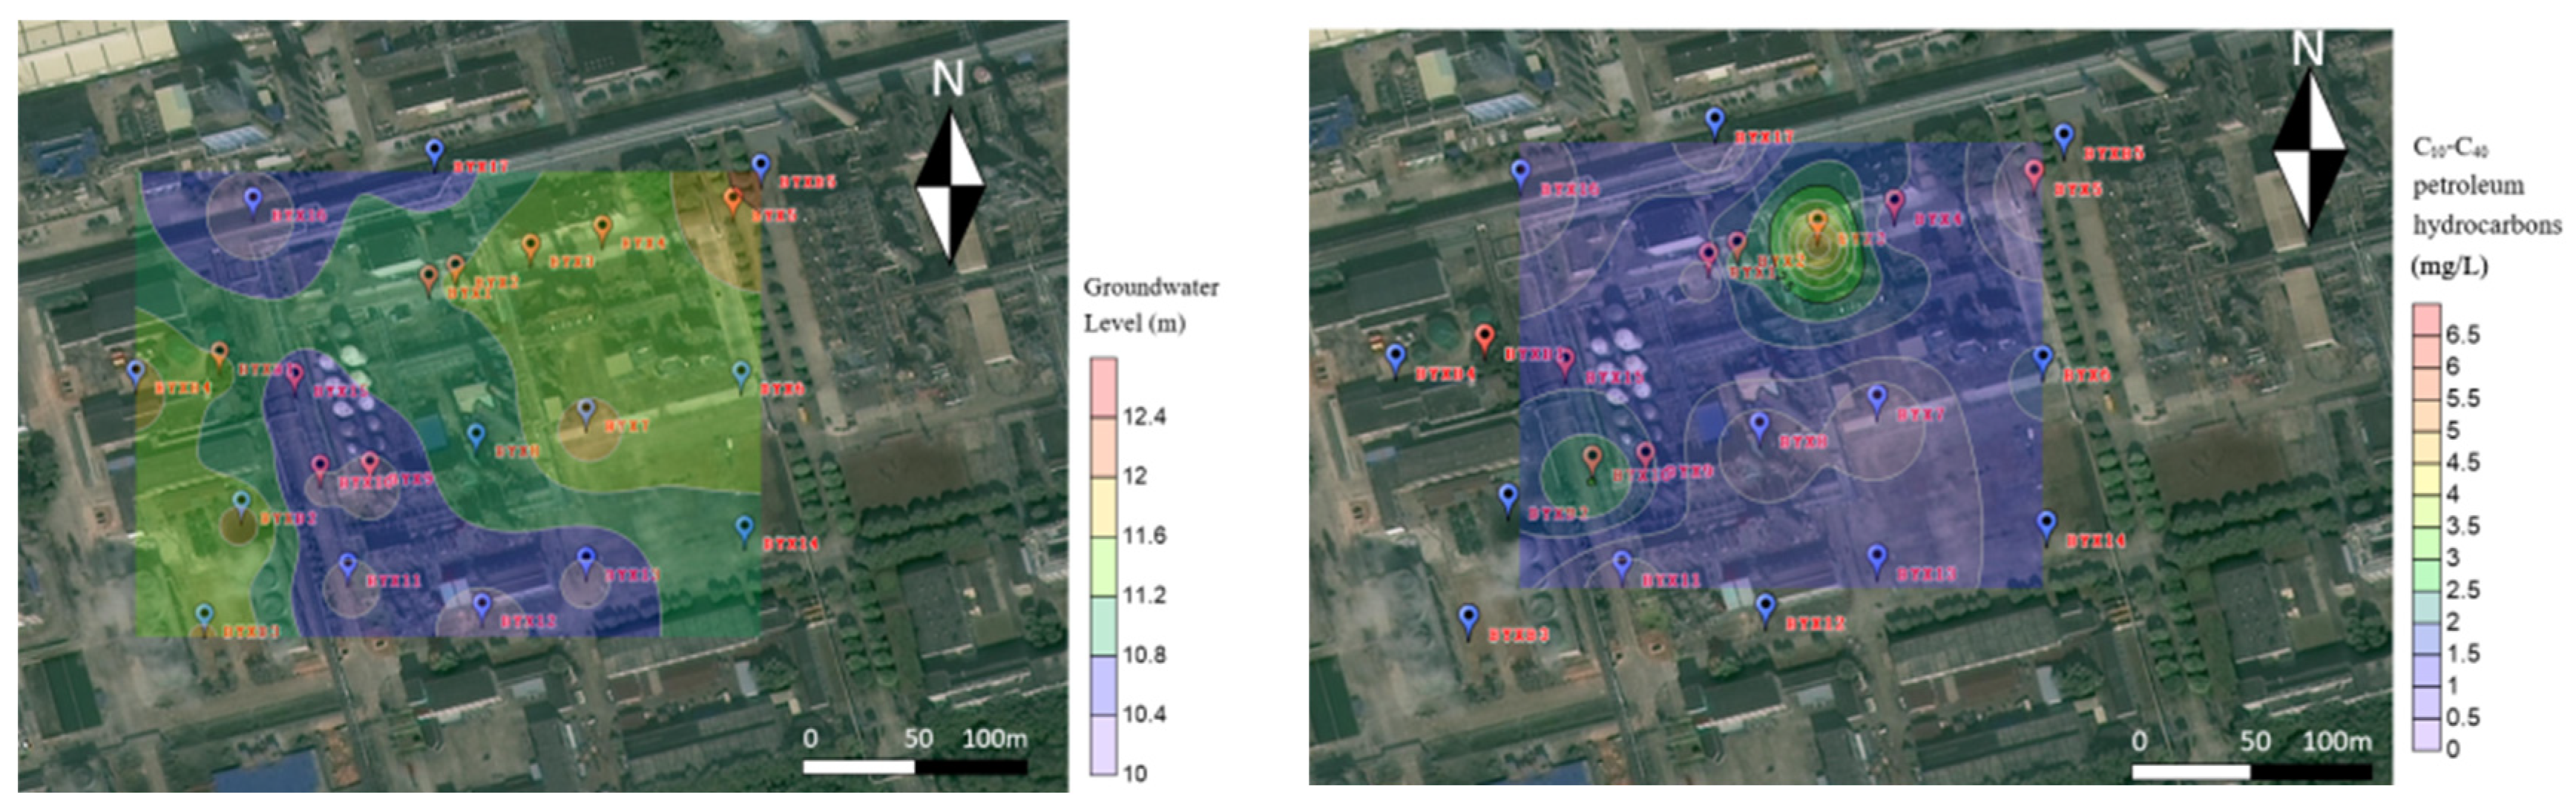
Based on the production processes and the layout of the facilities, potential sources of groundwater contamination in this area include the storage tank zone, buried pipelines, and the underground wastewater storage pond. The spatial distribution of the contaminant plume obtained through HRSC shows that the contamination hotspot highly coincides with the location of the underground wastewater pond (as shown in Figure 13), with pollutant concentrations gradually decreasing outward from the pond.
Additionally, an abnormal hydrogeological condition was observed in this area. While the overall regional groundwater flow direction is from northeast to southwest, the groundwater contour map reveals a localized “groundwater mound” in the contamination hotspot zone. This is characterized by an elevated water table and a radially diverging flow field. The formation of such a mound typically requires a sustained hydraulic pressure source, such as continuous leakage of liquids, which contradicts the natural regional flow conditions. Given that the wastewater pond is located at the center of this mound, it is inferred that leakage from the pond has provided continuous infiltration recharge to the aquifer, serving as the direct driving force behind the formation of the groundwater mound.
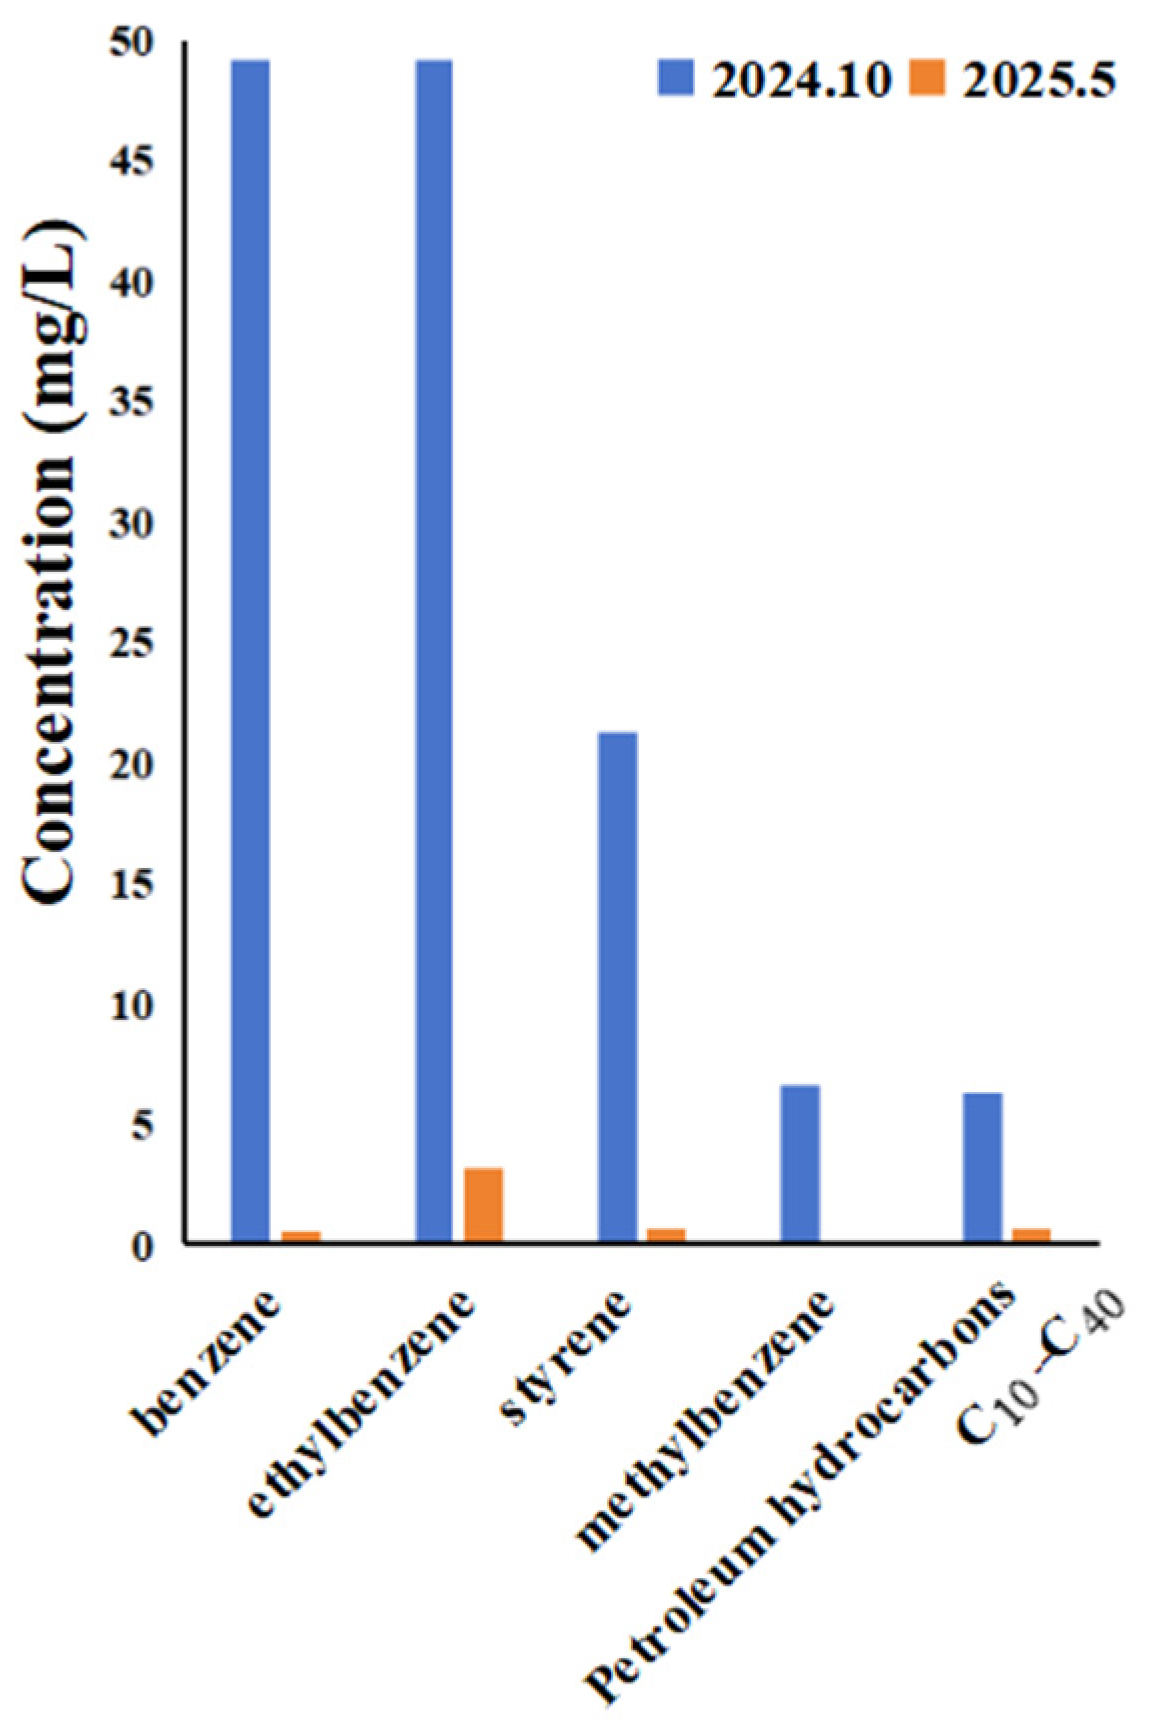
Based on the source identification results from the HRSC, the enterprise implemented a liner repair and anti-seepage reinforcement project for the underground wastewater storage pond. Following the completion of the remediation work and the resumption of the pond’s operation, monitoring of groundwater levels (as shown in Figure 14) revealed that the previously observed groundwater mound had completely disappeared, and the water table had reverted to its natural flow pattern. Furthermore, analysis of groundwater samples indicated a significant decrease in the concentration of characteristic contaminants in the well that previously showed the highest pollution levels, as shown in Figure 15.
These results collectively demonstrate that the leakage from the wastewater pond was the primary contamination source, and that the remediation measures effectively cut off the contamination pathway. This case underscores the critical value of HRSC in contaminant source identification, supporting targeted and effective remediation strategies.

4. Discussion

4.1. Analysis of Technical Applicability

Microbial functional genes (e.g., alkB) serve as effective biological indicators, offering a unique advantage by inferring contamination history through the abundance of degradation enzyme genes. This provides a rapid, indirect approach for detecting contamination distribution. In the fringe zones of contaminant plumes, surface soil microbial functional genes and metabolic gas detection can identify spreading trends earlier than chemical detection methods. However, high-density sampling is constrained by the cost of sample analysis. Future efforts should focus on developing vehicle-mounted rapid gene probes or online biosensors to reduce per-point costs, enabling technicians to utilize these tools more efficiently in high-resolution site characterization.
Geophysical detection methods are completely non-invasive and can rapidly acquire high-resolution distribution data of subsurface heterogeneous bodies. Their core advantage lies in efficiency, with the capability to scan a 1-hectare area in a single day—20 times faster than drilling-based investigations. By adjusting electromagnetic wave frequencies and survey layouts, resolution of subsurface heterogeneities can reach the centimeter scale. However, due to the non-uniqueness of geophysical interpretations, detected anomalies cannot be solely attributed to subsurface contamination; clay layers, underground structures, and fracture zones may also cause geophysical anomalies. Therefore, interpretation of heterogeneous bodies still requires integration with other methods (such as MIP penetration or drilling).
As a semi-quantitative auxiliary tool, the MIP collects data every 1.5 cm via a subsurface probe, generating extensive continuous datasets. These are presented graphically, allowing real-time, rapid assessment of vertical organic contamination distribution, which helps clarify contamination boundaries and delineate areas requiring subsequent management. However, MIP responds only to volatile organic compounds, and its detector outputs are recorded in “µV.” Thus, the level of MIP value cannot be used as the basis for determining whether a point exceeds the standard. It is necessary to combine the analysis of the laboratory data system to accurately determine the contaminants.
In summary, each individual investigation technique has its own strengths and limitations. However, when integrated, they form a refined, efficient, and cost-effective HRSC framework, offering valuable guidance for contamination investigations at operating industrial facilities. To address the core challenges of strong concealment and high heterogeneity in petrochemical site contamination, a tiered collaborative approach—combining early warning via microbial functional genes, non-destructive imaging through geophysics, and centimeter-scale sensing with MIP—can establish a three-level linkage of “screening, positioning, and quantification,” thereby achieving effective HRSC.

4.2. Economic and Efficiency Balance

At the preliminary stage of site investigation, grid-based screening of microbial metabolic gases and functional genes can be employed to identify suspected contaminated areas in a cost-effective manner. Taking a 10-hectare site as an example, surface-soil sampling points can be strategically deployed to exclude a substantial portion of clean areas, thereby concentrating investigation resources on the remaining high-risk zones.
For the suspicious areas identified through screening, high-density geophysical surveys can be deployed to capture electrical anomalies associated with aquifer contaminant plumes, enabling non-destructive interpretation of subsurface heterogeneous structures. Subsequently, targeted MIP penetration can be conducted within these geophysically anomalous zones. With a vertical resolution of 1.5 cm, real-time PID/FID response curves are obtained to generate contamination distribution heat maps. Furthermore, the semi-quantitative MIP data (in μV) can be calibrated against laboratory data from validation points to establish a calibration curve, converting the semi-quantitative spatial model into absolute concentrations and achieving centimeter-scale delineation of contamination boundaries.
Although HRSC technology may require a higher initial investment compared to conventional methods, it has the potential to substantially reduce the investigation timeline and improve overall efficiency. Geophysical techniques can proactively identify subsurface pipelines, structures, and other heterogeneities, avoiding risks such as high-pressure pipeline or tank explosions during drilling. Real-time MIP data can markedly decrease the volume of laboratory analysis needed, and the precise focusing of investigation scope can help lower remediation excavation volumes, contributing to overall cost reductions.
Through integrated application, the investigation period per hectare can be meaningfully shortened compared to conventional approaches, thereby accelerating the site redevelopment process.

4.3. Industry Application Challenges

While HRSC technology has demonstrated its advantages in accuracy and efficiency in this project, its widespread adoption in the petrochemical industry still faces systemic challenges. Current technical guidelines for site contamination investigation do not recognize HRSC data as legally valid, which discourages enterprises from applying it. Technical personnel often lack proficiency in the HRSC framework, as well as the expertise needed for geophysical data interpretation and bioinformatic analysis, making practical implementation difficult. Additionally, the initial investment for HRSC is 40–60% higher than that of traditional methods. Although case studies have shown that this upfront cost is offset by significant savings in subsequent management and remediation, rigid environmental budgets and an awareness gap among enterprises continue to hinder large-scale HRSC adoption. Industry-wide promotion will require a combination of measures.
On the government side, incentives such as green remediation subsidies could be introduced to cover the incremental cost of HRSC. Establishing a cloud-based digital twin platform for contamination would allow dynamic comparison between HRSC and traditional methods, providing decision-makers with clear evidence of its effectiveness. Concurrently, technological innovation and cost control must be advanced—for instance, by developing vehicle-mounted rapid gene probes and low-cost MIP rigs to reduce detection expenses. Furthermore, establishing interdisciplinary data interpretation standards, along with shared validation databases and interpretation algorithms, would address issues of data reliability and interpretation complexity. Only through such integrated efforts can the industry-wide promotion of HRSC be ultimately achieved.

5. Conclusions

(1)
Through the combined application of surface soil microbial metabolic gas and functional gene detection, coupled with rapid geophysical screening techniques, a composite contamination scenario involving aromatic hydrocarbons, short-chain petroleum hydrocarbons, and alkanes was identified. In the process of testing at an operating oil plant in China, both methods indicated that the potential key contaminated areas were the product tank farm and the southwestern installation area. Supplementary investigations utilizing MIP technology delineated a heavily contaminated zone of approximately 1163 m2, with a total contaminant influence area of about 17,724 m2. Contamination was primarily concentrated at depths between 5 m and 9 m below ground level. The HRSC approach achieved a breakthrough in contaminant plume resolution, advancing from the meter scale to the centimeter scale.
(2)
The contamination zones identified by minimally intrusive investigation techniques were consistent with those delineated by MIP and traditional drilling investigations. The high sensitivity of these methods played a crucial role in effective contamination screening during the high-resolution survey. A comparison of vertical contamination profiles and three-dimensional distribution patterns demonstrated a strong correlation between MIP data and laboratory analytical results. Based on the HRSC-derived source identification, the enterprise implemented a liner repair and anti-seepage remediation of the underground wastewater pond. Subsequently, the groundwater flow field returned to its natural state, and contaminant concentrations at the core of the plume decreased, confirming that leakage from the wastewater pond was the primary contamination source. This dual verification system—“laboratory data comparison and contamination source tracing”—demonstrates the high reliability of the HRSC methodology and its technical foundation for accurate source identification.
(3)
A tiered collaborative framework, integrating early warning via microbial functional genes, non-destructive imaging through geophysics, and centimeter-scale sensing with MIP, can establish a three-level HRSC strategy of “screening, positioning, and quantification.” This enables refined, efficient, and cost-effective contamination investigations. The integration of these technologies can reduce the site investigation period from the conventional 12 weeks to just 3 weeks per hectare, significantly accelerating site redevelopment. In the future, by reducing costs and improving the interpretation accuracy of HRSC data—thereby addressing issues of poor data reliability and high interpretation complexity—the industry-wide adoption of HRSC can be achieved. This will provide substantial engineering application value for targeted remediation.
(4)
Given that the present findings are derived from a single petrochemical site, caution should be exercised before claiming broad applicability of the proposed framework to large-scale or diverse industrial settings. To further advance the methodology, future research could focus on the following aspects. First, the development of real-time, field-deployable biosensors for functional gene detection (e.g., alkB, C12O, prmA) would overcome the current reliance on laboratory analysis, enabling on-site rapid screening and dynamic monitoring. Second, integrating machine learning algorithms (e.g., random forest or convolutional neural networks) to fuse multi-source heterogeneous data (soil gas, geophysics, MIP, and drilling) could reduce interpretation subjectivity and help identify contamination plume boundaries with quantified uncertainty. Third, establishing long-term groundwater monitoring networks combined with periodic HRSC surveys would capture contaminant plume dynamics (e.g., seasonal migration, natural attenuation rates) rather than relying on single-time snapshots. These extensions, once validated across multiple sites with varying geological and operational conditions, would strengthen the generalizability of the HRSC framework and support its evolution from a case-specific methodology toward a more standardized environmental management tool for active industrial facilities.

Author Contributions

All authors contributed to the study conception and design. S.Y. (First Author): Conceptualization, Methodology, Investigation, Formal Analysis, Writing—Original Draft; S.Z. (corresponding Author): Conceptualization, Funding Acquisition, Resources, Supervision, Writing—Review & Editing; J.W.: Resources, Validation; S.M.: Visualization, Data Curation, Investigation; X.W.: Writing—Original Draft. All authors have read and agreed to the published version of the manuscript.

Funding

This: work was supported by National Key R&D Program of China (Grant No. 2024YFC3713800).

Institutional Review Board Statement

Not applicable.

Informed Consent Statement

Not applicable.

Data Availability Statement

The data presented in this study are available upon reasonable request from the corresponding author. Some data may be restricted due to commercial confidentiality of the operating enterprise.

Conflicts of Interest

Authors Shuai Yang, Shucai Zhang, Shici Ma and Xinzhe Wang were employed by the company State Key Laboratory of Chemical Safety, SINOPEC Research Institute of Safety Engineering Co., Ltd. The remaining authors declare that the research was conducted in the absence of any commercial or financial relationships that could be construed as a potential conflict of interest.

References

  1. Wenmin, M.; Jian, H.; Jun, L.; Peng, G.; Peter, O.C.; Peng, W.; Jun, L. Distribution, sources, and health risk assessment of VOCs/SVOCs in soils obtained from petrochemical-contaminated sites in Guangzhou, a subtropical coastal megacity in southern China. J. Clean. Prod. 2023, 426, 139198. [Google Scholar]
  2. Wang, J.; Wang, X.; Zhu, Z.; Ying, S.; Hayat, K.; Bai, X.; Liu, S.; Xiao, X.; Jin, C.; Liu, W. Distribution, homologue pattern, sources, and environmental behavior of short-chain chlorinated paraffins in multi-media environments within the petrochemical industry of the Yangtze River Delta. Environ. Sci. Adv. 2025, 4, 1477–1487. [Google Scholar] [CrossRef]
  3. Song, Q.; Li, S.; Du, X.; Luan, H.; Sun, J.; Zheng, J.; Cong, X.; Yu, J.; Liu, X.; Li, J.; et al. Rapid assessment and remediation management of petrochemical-contaminated sites via a geophysical-geochemical synergistic approach. J. Hazard. Mater. Adv. 2025, 19, 100854. [Google Scholar] [CrossRef]
  4. Fan, C.; Chen, Y.-C.; Ma, H.-W.; Wang, G.-S. Comparative study of multimedia models applied to the risk assessment of soil and groundwater contamination sites in Taiwan. J. Hazard. Mater. 2010, 182, 778–786. [Google Scholar] [CrossRef]
  5. Podgorski, D.C.; Zito, P.; Kellerman, A.M.; Bekins, B.A.; Cozzarelli, I.M.; Smith, D.F.; Cao, X.; Schmidt-Rohr, K.; Wagner, S.; Stubbins, A.; et al. Hydrocarbons to carboxyl-rich alicyclic molecules: A continuum model to describe biodegradation of petroleum-derived dissolved organic matter in contaminated groundwater plumes. J. Hazard. Mater. 2021, 402, 123998. [Google Scholar] [CrossRef]
  6. Hwang, J.-W.; Yun, S.-T.; Yu, S.; Lee, K.-J.; Oh, J.-E.; Kim, J.H. Source differentiation of co-mingled petroleum derivatives in groundwater at a historically oil-contaminated urban aquifer in South Korea. Groundw. Sustain. Dev. 2025, 101565. [Google Scholar] [CrossRef]
  7. Chen, J.; Wu, X.; Jiang, Z.; Li, Q.; Zhang, L.; Chu, J.; Song, Y.; Yang, L. Application of machine learning to leakage detection of fluid pipelines in recent years: A review and prospect. Measurement 2025, 248, 116857. [Google Scholar] [CrossRef]
  8. Yu, W.; Wan, Y.; Zhou, W.; An, J.; Tian, L.; Ma, J. Molecular composition of water soluble fraction of petroleum products and crude oils: Insights into groundwater contamination potential and environmental forensics. J. Environ. Sci. 2026, 159, 437–444. [Google Scholar] [CrossRef] [PubMed]
  9. Zhao, L.; Zhan, L.; Zhang, H.; Zhang, Y.; Wu, L.; Zhao, R.; Zheng, L.; Zhang, G. Tracking groundwater pollution plumes at landfill sites using borehole hydrochemical and hydrodynamic profile (BHHP) method. J. Environ. Manag. 2023, 345, 118860. [Google Scholar] [CrossRef]
  10. He, Y.; Ou, G.; Zhang, Z.; Shen, Z.; Wei, H.; Ding, X.; Wang, Q.; Zhang, K.; Chen, Y.; Ye, W. On-site monitoring and numerical simulation on groundwater flow and pollution plume evolution in a hexavalent-chromium contaminated site. J. Hazard. Mater. 2024, 479, 135662. [Google Scholar] [CrossRef]
  11. Li, X.; Bardos, P.; Cundy, A.B.; Harder, M.K.; Doick, K.J.; Norrman, J.; Williams, S.; Chen, W. Using a conceptual site model for assessing the sustainability of brownfield regeneration for a soft reuse: A case study of Port Sunlight River Park (U.K.). Sci. Total Environ. 2019, 652, 810–821. [Google Scholar] [CrossRef]
  12. Soares, L.C.d.R.; Mendes, G.P.; Barbosa, A.M.; Malta-Oliveira, C.C.; de Souto, S.S.; Yoshikawa, N.K.; Nascimento, C.A.O.d. High-resolution site characterization tools: Application of fluorescence techniques to identify DNAPL in tropical lands. Chemosphere 2025, 393, 144768. [Google Scholar] [CrossRef] [PubMed]
  13. Singh, P.; Haritwal, D.K.; Ramana, G.V.; Datta, M. Framework for site specific leachate limits in MSW dumpsites: Integration of high-resolution site characterization and contaminant transport modeling. Chemosphere 2025, 371, 144054. [Google Scholar] [CrossRef]
  14. Haritwal, D.K.; Singh, P.; Ramana, G.V.; Datta, M. Application of high-resolution site characterisation tools and sampling methods for assessing microplastic migration beneath MSW dumpsites. J. Hazard. Mater. 2025, 488, 137384. [Google Scholar] [CrossRef] [PubMed]
  15. Zhao, Z.; Luo, N.; Illman, W.A. Geostatistical analysis of high-resolution hydraulic conductivity estimates from the hydraulic profiling tool and integration with hydraulic tomography at a highly heterogeneous field site. J. Hydrol. 2023, 617, 129060. [Google Scholar] [CrossRef]
  16. Wu, Y.; Yu, J.; Huang, Z.; Jiang, Y.; Zeng, Z.; Han, L.; Deng, S.; Yu, J. Migration of total petroleum hydrocarbon and heavy metal contaminants in the soil-groundwater interface of a petrochemical site using machine learning: Impacts of convection and diffusion. RSC Adv. 2024, 14, 32304–32313. [Google Scholar] [CrossRef]
  17. Trueba-Santiso, A.; Palau, J.; Soder-Walz, J.M.; Vicent, T.; Marco-Urrea, E. Assessment of aerobic biodegradation of lower-chlorinated benzenes in contaminated groundwater using field-derived microcosms and compound-specific carbon isotope fractionation. J. Environ. Sci. 2022, 118, 204–213. [Google Scholar] [CrossRef]
  18. Sharlov, M.; Buddo, I.; Pisarnitskiy, A.; Misurkeeva, N.; Shelohov, I. Shallow transient electromagnetic method application for groundwater exploration: Case study from Greece. ASEG Ext. Abstr. 2019, 1, 1–5. [Google Scholar] [CrossRef]
  19. Song, Q.; Zhou, B.; Song, Y.; Du, X.; Chen, H.; Zuo, R.; Zheng, J.; Yang, T.; Sang, Y.; Li, J. Microbial community dynamics and bioremediation strategies for petroleum contamination in an in-service oil Depot, middle-lower Yellow River Basin. Front. Microbiol. 2025, 16, 1544233. [Google Scholar] [CrossRef]
  20. Ahmed, N.O.; Nik Daud, N.N.; Okunlola, I.A. Geoelectrical soil mapping for subsurface hydrocarbon contaminant characterization and remediation site zoning at Alode, Central Niger Delta, Nigeria. Phys. Chem. Earth Parts A/B/C 2024, 136, 103726. [Google Scholar] [CrossRef]
  21. Zhang, R.; Ye, Z.; Guo, X.; Yang, Y.; Li, G. Microbial diversity and metabolic pathways linked to benzene degradation in petrochemical-polluted groundwater. Environ. Int. 2024, 188, 108755. [Google Scholar] [CrossRef] [PubMed]
  22. Tang, L.; Chen, W.; Luo, X.; Zhang, G.; Feng, X.; Guo, L.; Gao, W.; He, J.; Zhao, G.; Jiang, J.; et al. Multi-technological integration in a smelting site: Visualizing pollution characteristics and migration pattern. J. Hazard. Mater. 2023, 459, 132135. [Google Scholar] [CrossRef] [PubMed]
  23. Pan, Y.; Zhang, Q.; Yu, Y.; Tong, Y.; Wu, W.; Zhou, Y.; Hou, W.; Yang, J. Three-dimensional migration and resistivity characteristics of crude oil in heterogeneous soil layers. Environ. Pollut. 2021, 268, 115309. [Google Scholar] [CrossRef]
  24. Li, J.; Chao, C.; Ma, X.; Liu, S.; Rahman, K.U.; Mao, D. Utilizing the electrical resistivity tomography to map contamination in a quarry. Environ. Earth Sci. 2024, 83, 435. [Google Scholar] [CrossRef]
  25. Flores Orozco, A.; Ciampi, P.; Katona, T.; Censini, M.; Papini, M.P.; Deidda, G.P.; Cassiani, G. Delineation of hydrocarbon contaminants with multi-frequency complex conductivity imaging. Sci. Total Environ. 2021, 768, 144997. [Google Scholar] [CrossRef]
  26. Liu, G.; Zhou, X.; Li, Q.; Shi, Y.; Guo, G.; Zhao, L.; Wang, J.; Su, Y.; Zhang, C. Spatial distribution prediction of soil As in a large-scale arsenic slag contaminated site based on an integrated model and multi-source environmental data. Environ. Pollut. 2020, 267, 115631. [Google Scholar] [CrossRef]
  27. Bøllingtoft, A.; Bjerg, P.L.; Rønde, V.; Tuxen, N.; Nowak, W.; Troldborg, M. Quantification of contaminant mass discharge and uncertainties: Method and challenges in application at contaminated sites. J. Contam. Hydrol. 2025, 268, 104453. [Google Scholar] [CrossRef]
  28. Zeng, J.; Li, C.; Wang, J.; Tang, L.; Wu, C.; Xue, S. Pollution simulation and remediation strategy of a zinc smelting site based on multi-source information. J. Hazard. Mater. 2022, 433, 128774. [Google Scholar] [CrossRef]
  29. Trento, L.M.; Tsourlos, P.; Gerhard, J.I. Time-lapse electrical resistivity tomography mapping of DNAPL remediation at a STAR field site. J. Appl. Geophys. 2021, 184, 104244. [Google Scholar] [CrossRef]
Figure 1. Three-level progressive survey system from rapid screening to precise quantification.
Sustainability 18 05836 g001
Figure 2. Distribution of the shallow subsurface survey point.
Sustainability 18 05836 g002
Figure 3. Distribution of the geophysical survey lines.
Sustainability 18 05836 g003
Figure 4. Distribution of MIP and drilling exploration points.
Sustainability 18 05836 g004
Figure 5. Distribution of the CO2 in surface soil.
Sustainability 18 05836 g005
Figure 6. GPR waveform image of the line E.
Sustainability 18 05836 g006
Figure 7. Violin Plot Distribution of Apparent Resistivity at Different Depths along H4 Profile.
Sustainability 18 05836 g007
Figure 8. Distribution of the anomalous zone detection by geophysical investigation.
Sustainability 18 05836 g008
Figure 9. Distribution of the anomalous zone detection by MIP.
Sustainability 18 05836 g009
Figure 10. Distribution of the ethylbenzene detection by laboratory.
Sustainability 18 05836 g010
Figure 11. Comparison of the MIP data and laboratory data at different depths.
Sustainability 18 05836 g011
Figure 12. Comparison of the MIP data and laboratory data at different locations.
Sustainability 18 05836 g012aSustainability 18 05836 g012b
Figure 13. Distribution of groundwater levels and pollutant concentrations (before remediation).
Sustainability 18 05836 g013
Figure 14. Distribution of groundwater levels and pollutant concentrations (after remediation).
Sustainability 18 05836 g014
Figure 15. Changes in pollutant concentrations at monitoring point BYX1.
Sustainability 18 05836 g015
Table 1. Detected apparent resistivity data results of H4 survey line.
StatisticSample SizeMinimumMaximumMeanStandard DeviationMedianMean ± Standard Deviation
Value15600.44576.3709.21515.3402.8949.215 ± 15.340
StatisticVarianceStandard Error95% CI for Mean (Lower Limit)95% CI for Mean
(Upper Limit)
SkewnessCoefficient of Variation
Value235.3100.3888.4549.9772.770166.458%
Table 2. Percentile value of the apparent resistivity measured by the H4 survey line.
StatisticP2.5P5P10P25P27P33P50P67P73P75P90P95P97.5
Value0.6630.8641.1862.0252.1082.3142.8944.5325.5817.34733.47540.74266.563
Disclaimer/Publisher’s Note: The statements, opinions and data contained in all publications are solely those of the individual author(s) and contributor(s) and not of MDPI and/or the editor(s). MDPI and/or the editor(s) disclaim responsibility for any injury to people or property resulting from any ideas, methods, instructions or products referred to in the content.