Article

Dynamic Thermal and Energy Performance of Liquid-Cooled Electric Vehicle Batteries Using Water, Glycol Mixtures, and Jet-A

by
Mohamed H. Abdelati
,
Mostafa Makrahy
,
Al-Hussein Matar
,
Ebram F. F. Mokbel
,
M. M. Moheyeldein
and
Mohamed A. A. Abdelkareem
*
Automotive and Tractors Engineering Department, Faculty of Engineering, Minia University, El-Minia 61915, Egypt
*
Author to whom correspondence should be addressed.
Sustainability 2026, 18(11), 5529; https://doi.org/10.3390/su18115529
Submission received: 12 April 2026 / Revised: 18 May 2026 / Accepted: 28 May 2026 / Published: 1 June 2026

Abstract

Thermal management remains a key challenge for lithium-ion batteries in electric vehicles, especially under transient driving and charging conditions. This study develops a coupled thermo-hydraulic model for a liquid-cooled battery thermal management system and uses it to compare four coolants with different thermophysical properties: water, ethylene glycol–water, propylene glycol–water, and Jet-A aviation fuel. Unlike studies that focus mainly on temperature reduction, the present work evaluates battery temperature, hydraulic pump power, and cooling load/heat rejection demand within the same framework. The coolants are tested under the FTP-75 driving cycle and a high-rate charging case while pump speed is varied between 1500 and 4500 rpm. Water provides the strongest cooling performance, reducing the battery temperature during FTP-75 from about 30 °C to 21.2 °C at 1500 rpm and 20.6–20.8 °C at 4500 rpm. During charging, water maintains the battery temperature near 23 °C at 1500 rpm, whereas ethylene glycol–water and Jet-A reach about 46–47 °C. Increasing pump speed improves thermal regulation, particularly for weaker-performing coolants, but it also increases auxiliary demand; for example, the RMS pump power of water during charging rises from 0.039 to 0.735 kW. Overall, the results show that coolant selection in liquid-cooled BTMS requires a balanced assessment of heat removal capability, pumping demand, and heat rejection requirements.

1. Introduction

The rapid electrification of road transport has increased the performance, safety, and durability requirements for lithium-ion batteries in electric vehicles. As battery energy and power densities continue to rise, thermal management has become a critical design requirement. Excessive temperature and non-uniform thermal distribution accelerate degradation, reduce power capability and charging performance, and shorten service life. Thermal constraints, therefore, influence not only battery reliability and safety but also vehicle efficiency and life-cycle cost [1,2,3].
These challenges are important under realistic operation, where battery heat generation varies with vehicle load, discharge behavior, and charging intensity [4,5]. BTMS performance should, therefore, be evaluated under transient operating profiles rather than steady-state assumptions. Experimental studies on prismatic lithium-ion batteries have shown that ambient temperature and discharge rate strongly affect the battery temperature field [6]. At the same time, active liquid cooling systems introduce additional hydraulic and heat rejection demands, so improved temperature control may require higher auxiliary energy consumption [7,8,9]. Accordingly, BTMS performance should be assessed using both thermal regulation and energy demand indicators.
Among the available cooling strategies, liquid cooling is widely used because of its high heat removal capability and controllability. Its performance depends on coolant thermophysical properties, flow conditions, and control strategy. Viscosity, thermal conductivity, and specific heat affect heat transfer, pressure drop, and pumping work, while pump operation governs the balance between thermal improvement and auxiliary power demand [10]. However, many studies still examine BTMS performance from a single perspective, such as temperature reduction, component optimization, or limited operating conditions [11,12,13]. In addition, most coolant comparisons remain focused on conventional water- or glycol-based fluids [14].
Lithium-ion batteries remain the dominant energy storage technology in modern electric vehicles, making effective battery thermal management essential for maintaining safe operating temperatures and limiting temperature non-uniformity [15,16,17,18]. Recent reviews show that BTMS research covers passive, active, and hybrid approaches, with liquid cooling widely identified as a suitable option for high-power operation and fast charging, despite its added system complexity and energy demand [19,20,21]. Recent studies have also expanded toward next-generation BTMS concepts, including phase change materials, bio-inspired structures, and artificial intelligence-based control and optimization, with increasing emphasis on integrated solutions that improve cooling performance while limiting system-level energy impact [22,23,24].
A substantial part of liquid-cooled BTMS research has focused on cold plate design and coolant flow management [25,26,27,28,29]. For example, Wu et al. [28] improved temperature uniformity using a variable heat transfer path cooling plate, while Niu et al. [29] optimized serpentine channels using orthogonal design and CFD to reduce peak temperature and temperature gradients. These studies highlight the importance of geometry and flow distribution, but they mainly address structural optimization rather than systematic comparison of coolants with markedly different thermophysical properties.
Coolant selection also plays a central role in BTMS performance [30]. Nanofluid studies have shown improved heat transfer using modified ethylene glycol–water mixtures and Al2O3-based fluids [31,32]. However, such improvements are often accompanied by higher viscosity, pressure drop, and pumping power [33]. These studies highlight the thermal–hydraulic trade-off in coolant design, but most comparisons remain focused on modified water–glycol mixtures rather than fluids with distinctly different thermophysical properties.
The transient nature of battery operation adds further complexity. During driving, heat generation changes continuously with vehicle load, whereas fast charging imposes sustained high-current thermal loading [34,35]. Akbarzadeh et al. [36] showed that combining liquid cooling with phase change material improved temperature uniformity and reduced pumping energy under realistic driving conditions. Huang et al. [37] further reported, using a lumped parameter liquid-cooled battery model, that increasing coolant flow beyond a certain level provides only limited thermal benefit. These findings highlight the need to evaluate BTMS performance under dynamic operating conditions rather than relying only on steady-state analysis.
Recent studies emphasize that BTMS performance should be assessed using both thermal and energy indicators. Passive systems have low energy demand but limited cooling capacity, whereas active liquid cooling provides stronger heat removal with higher auxiliary power consumption [38]. Coolant selection and control strategy should, therefore, be considered together, since improved coolant properties may reduce the need for high flow rates [39]. This view is consistent with recent control-oriented studies that evaluate pump power and heat rejection demand alongside battery temperature response [40,41].
The literature review points to three remaining gaps in liquid-cooled BTMS research. First, many studies focus on thermal performance without giving equal attention to the auxiliary energy required to achieve it. Second, coolant comparisons are still mainly centered on water- and glycol-based formulations, while fluids with substantially different thermophysical properties remain less examined within the same BTMS framework. Third, driving and charging conditions are often treated separately, although they impose different transient thermal loads and may lead to different cooling energy trade-offs.
To address these gaps, this study develops a coupled thermo-hydraulic model for a liquid-cooled BTMS and applies it under the same system architecture, boundary conditions, and control assumptions. Four working fluids are compared: water, ethylene glycol–water, propylene glycol–water, and Jet-A aviation fuel. The analysis evaluates battery temperature, pump power, and cooling load/heat rejection demand under both FTP-75 driving and high-rate charging while varying pump speed. The main contribution is, therefore, a controlled comparison of conventional and non-traditional coolants under identical transient conditions, with the thermal benefit interpreted together with the associated hydraulic and heat rejection requirements.

2. Methodology

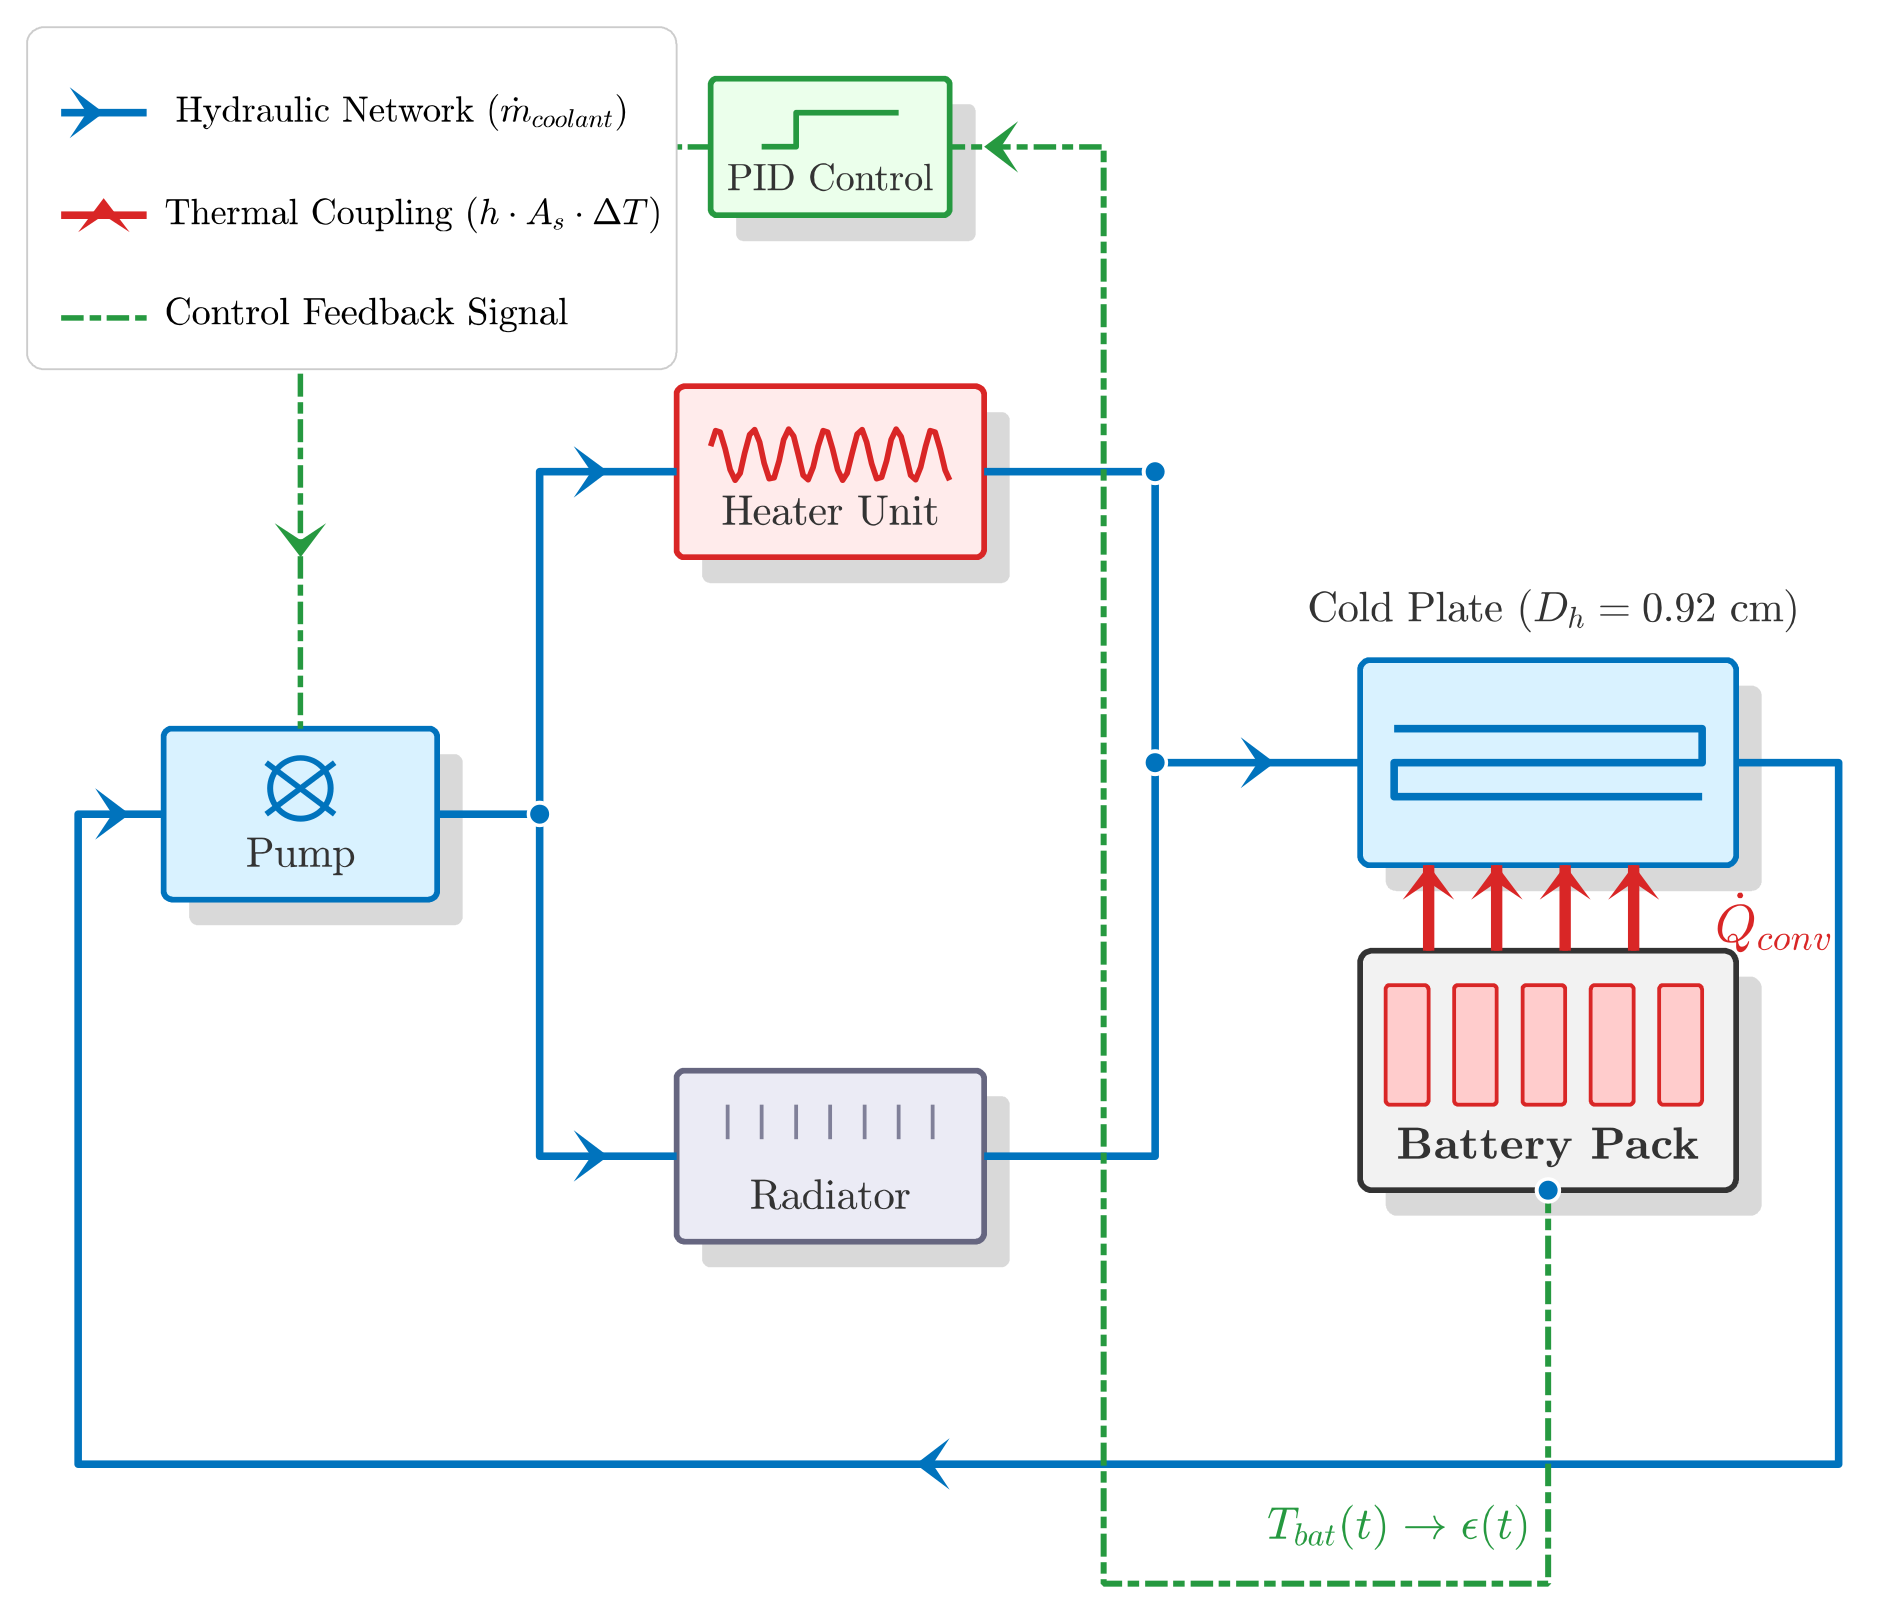
The battery thermal management system was implemented in MATLAB (Ver. 2024a) using a physics-based liquid cooling architecture to investigate both temperature regulation and the associated energy consumption during charging. The model integrates hydraulic, thermal, and control subsystems within a single simulation environment. The system configuration includes a centrifugal pump, a cold plate, a radiator, a heater, interconnecting pipes, and a feedback control unit. These components operate together to enable simultaneous evaluation of battery temperature behavior, pumping power, and refrigeration demand. Figure 1 presents a schematic of the BTMS, illustrating the hydraulic cooling loop, the thermal interaction between the battery and the cold plate, and the PID-based feedback control structure.
Four working fluids were examined in the analysis: pure water, a 50% ethylene glycol–water mixture, a propylene glycol–water mixture, and aviation fuel Jet-A. For glycol solutions, concentration was defined using volume fraction. The model assumes an ambient pressure of 0.101325 MPa, while the allowable pressure range is 0.01 MPa to 50 MPa. These fluids were selected to represent a wide range of thermophysical behavior. Water has high thermal conductivity and heat capacity, whereas glycol mixtures and Jet-A have lower thermal conductivity but favorable chemical stability. This selection allows a comparative assessment of cooling capability alongside the auxiliary energy required to circulate each coolant.
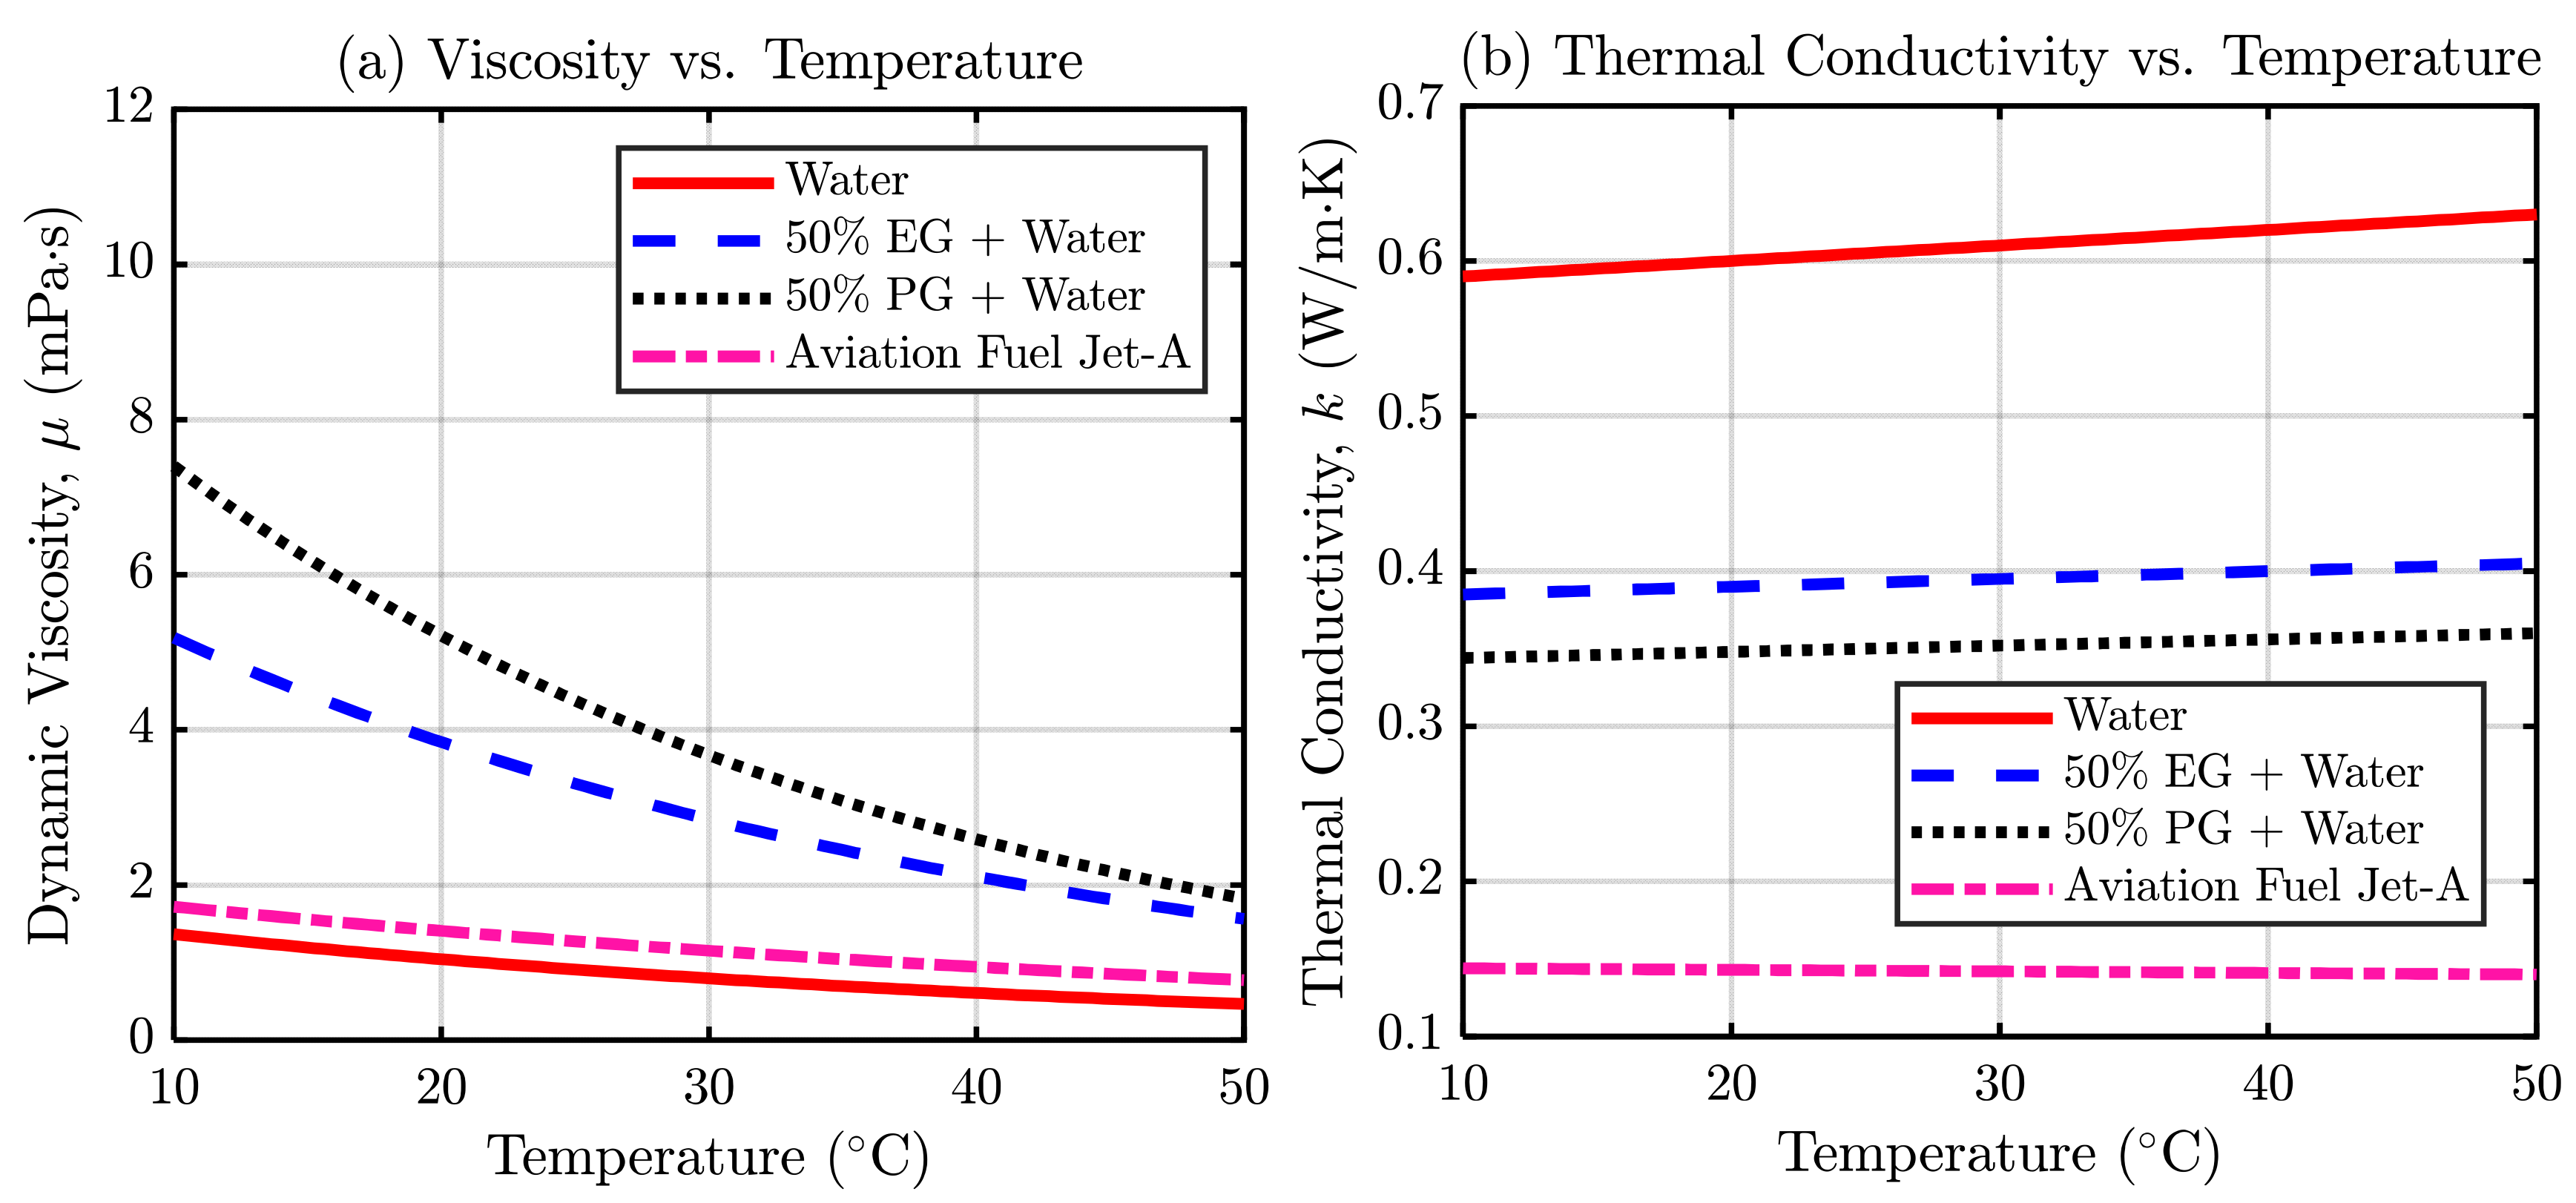
The thermal liquid model uses temperature-dependent thermophysical properties for the investigated coolants, including dynamic viscosity and thermal conductivity. This treatment is especially relevant for glycol-based mixtures, whose viscosity varies strongly with temperature and, therefore, affects pressure drop, hydraulic resistance, and pump power demand. The temperature-dependent property curves shown in Figure 2 were used to support the thermo-hydraulic comparison among the investigated fluids.
The coolant circuit was discretized into the heater loop, radiator inlet and return lines, cooling inlet, and cold plate connections. The primary loop and remaining interconnecting pipes were assigned equivalent lengths of 0.75 m, while the radiator inlet and return branches were each 0.25 m long. The cold plate was represented by a 1.5 m equivalent serpentine path beneath the battery modules. All pipe sections used a hydraulic diameter of 2.5 cm and a flow area of 4.9087 cm2, except for the cold plate channels, where a hydraulic diameter of 0.92 cm and a flow area of 3 cm2 were used to enhance convective heat transfer.
The cold plate geometry and coolant loop dimensions were kept fixed throughout all simulations. This was done to provide a controlled comparison among the investigated coolants and to avoid mixing the effect of coolant thermophysical properties with additional geometric variables. Similarly, the glycol-based mixtures were evaluated at a fixed 50% volume fraction. This concentration was selected as a representative basis for comparing glycol–water mixtures with water and Jet-A under the same BTMS architecture and operating conditions.
A constant surface roughness of 15 μm was assumed throughout the loop, consistent with automotive-grade tubing. Minor fitting losses were neglected, so pressure losses were evaluated from distributed wall friction. Laminar and turbulent transitions were defined using Reynolds number thresholds of 2000 and 4000, respectively. In the laminar regime, a constant Nusselt number of 3.66 was used, while pressure losses were calculated using Darcy-based friction relations. Fluid compressibility was included to represent transient behavior, whereas fluid inertia was neglected for numerical stability.
Distributed pressure losses along the coolant loop and cold plate channels were calculated using Darcy-based friction relations. The pressure drop depends on the channel length, hydraulic diameter, flow area, surface roughness, flow regime, coolant density, and dynamic viscosity. This treatment is particularly relevant for glycol-based mixtures, whose higher viscosity increases hydraulic resistance and pump power demand.
The system-level model does not explicitly resolve manifold effects, local losses at fittings and bends, or flow maldistribution among parallel channels. These effects were excluded because the cold plate was represented as an equivalent serpentine coolant path. Accordingly, the reported pressure drop and pump power values should be interpreted as distributed system-level estimates. Detailed manifold losses and local flow non-uniformity require component-level hydraulic modeling or three-dimensional CFD analysis.
Coolant circulation was provided by a centrifugal pump defined within the Simulink thermal liquid model. To examine the effect of circulation intensity on both thermal regulation and auxiliary energy demand, simulations were conducted at pump speeds of 1500, 3000, and 4500 rpm. These values represent low, medium, and high coolant circulation conditions in an active liquid cooling loop. They were selected to provide an operational sensitivity analysis rather than to reproduce a manufacturer-specific pump map. Within this framework, pump speed is used as the main operational sensitivity parameter, allowing the influence of coolant circulation on battery temperature, pump power, and cooling load/heat rejection demand to be quantified for each coolant.
The resulting simulation matrix consisted of four coolants, three pump speeds, and two operating conditions, giving a total of 24 transient cases evaluated under the same BTMS architecture and boundary conditions. This study, therefore, focuses on isolating the effects of coolant thermophysical properties and pump operating speed under a fixed BTMS architecture, while glycol concentration and cold plate geometry optimization are left outside the present scope.
The thermal loop included a cold plate thermally coupled to the battery pack and a liquid-to-air radiator for heat rejection to the environment. The radiator model incorporated liquid-side and air-side domains with prescribed volumes, heat transfer areas, pressure losses, and mass flow rates to represent convective heat dissipation. A heater unit was also included to support thermal conditioning at low ambient temperatures.
System operation was regulated using a PID controller driven by the battery temperature error. The controller adjusted the thermal management response to maintain the desired battery temperature range. The ambient temperature in the simulations was set to 30 °C, and the total simulation time was approximately 1877 s. The resulting Simulink framework provides a physically consistent basis for analyzing coolant selection and component interactions within the BTMS while enabling simultaneous evaluation of battery temperature, pump power, and cooling load/heat rejection demand under electric vehicle driving and charging conditions.

3. Mathematical Modeling

3.1. Battery Thermal Dynamics

A lumped thermal mass models a battery pack, in which the temperature evolution is controlled by a balance between internally generated heat and heat extracted via the cooling system. The energy balance equation can be written as:
m bat c p bat d T bat d t = Q ˙ gen Q ˙ cool
where m b a t and c p bat are the mass and specific heat of the battery, respectively. The term Q ˙ gen represents internal heat generation, and Q ˙ cool denotes the heat removed from the battery through the cold plate.

3.2. Coolant Flow and Thermal Liquid Modeling

The coolant circulation network was discretized into several segments. In the Simscape thermal liquid domain, the model considers dynamic compressibility and thermal evolution.
A.
Mass Conservation
The pressure p I and temperature T I evolution within a pipe segment of volume V is governed by:
1 β d p I d t α d T I d t ρ I V = m ˙ A + m ˙ B
where β is the liquid bulk modulus and α is the coefficient of thermal expansion.
B.
Energy Conservation
The temperature of the liquid volume evolves based on energy flow rates ( Φ ) and heat exchange with the pipe walls ( Q ˙ H ):
ρ I V C v d T I d t = Φ A + Φ B + Q ˙ H
where C v is the specific heat at constant volume.

3.3. Heat Transfer and Fluid Friction

The cooling effectiveness relates to the convective heat transfer between the fluid and the cold plate channels.
A.
Convective Heat Transfer
The heat transfer rate is calculated using Newton’s Law of Cooling:
Q ˙ conv = h A s T wall T fluid
The heat transfer coefficient ( h ) is derived from the Nusselt number ( N u ). For laminar flow ( R e < 2000 ), N u is fixed at 3.66. The system transitions to a Darcy-based friction model for pressure loss estimation in turbulent regimes ( R e > 4000 ).
B.
Frictional Pressure Loss
The pressure drop Δ p across the segments is governed by the Darcy friction factor f:
Δ p = f L + L add D h ρ v 2 2
where L is the pipe length and D h is the hydraulic diameter. Local losses ( L a d d ) were neglected in this study to prioritize distributed friction effects.

3.4. Performance Metrics

To quantify the efficacy of the BTMS, two main metrics were assessed: pump power and cooling load/heat rejection rate.
A.
Pump Power
The power required by the centrifugal pump to circulate the coolant:
P p u m p = Δ p m ˙ ρ
where P p u m p is the hydraulic pump power required to circulate the coolant, Δ p is the pressure rise or pressure drop across the coolant loop, m ˙ is the coolant mass flow rate, and ρ is the coolant density. The term m ˙ / ρ represents the volumetric flow rate of the coolant. Therefore, the calculated pump power represents the hydraulic power demand of the loop, not the calibrated electrical input power of a specific pump.
The pump power term represents the model-level hydraulic power required to circulate the coolant through the loop. In Equation (6), P p u m p is the hydraulic pump power, Δ p is the pressure rise across the coolant loop, m ˙ is the coolant mass flow rate, and ρ is the coolant density. The term m ˙ / ρ represents the volumetric flow rate. Therefore, the reported pump power values correspond to hydraulic/model-level auxiliary demand under identical assumptions for all coolants and pump speeds. If a pump efficiency map were available, the corresponding electrical input power could be estimated as P e l e c = P p u m p / η p u m p , where η p u m p is the pump efficiency. Since no manufacturer-specific efficiency map was included, the reported values should not be interpreted as calibrated electrical input power for a specific commercial pump.
The pump power term represents the model-level hydraulic power required to circulate the coolant through the loop based on the pressure rise and volumetric flow rate. A manufacturer-specific pump efficiency map was not included in this comparative model; therefore, the reported pump power should be interpreted as hydraulic/model-level auxiliary demand under identical assumptions for all coolants and pump speeds rather than calibrated electrical input power for a specific commercial pump. Introducing a fixed efficiency value without experimental or manufacturer data was avoided to prevent adding uncertainty unrelated to the coolant comparison objective of the study.
B.
Cooling load/heat rejection rate
The cooling load term represents the heat transfer rate removed from the battery coolant system and rejected to the ambient through the heat rejection unit/radiator. This quantity is a thermal power, not compressor electrical work:
Q ˙ cool = m ˙ c p T out T in
If this thermal load were supplied by an active vapor compression chiller, the corresponding compressor electrical input would depend on the system coefficient of performance:
P comp = Q ˙ cool C O P
Because the present model does not include a vapor compression cycle or a compressor efficiency map, P comp and COP are not calculated. The reported Q ˙ cool values should, therefore, be interpreted only as heat removal or heat rejection rates handled by the cooling system.
The geometric parameters used to define the coolant network are summarized in Table 1. These parameters describe the main hydraulic sections of the loop, including the primary piping, cold plate channels, and interconnecting pipes. Variations in length, hydraulic diameter, and flow area were used to represent the different flow paths and their corresponding thermal–hydraulic characteristics in the system.
The cold plate channels were represented as an equivalent serpentine coolant path beneath the battery module. The cold plate section has a total equivalent length of 1.5 m, a hydraulic diameter of 0.92 cm, and a flow area of 3 cm2, as summarized in Table 1. Heat transfer between the battery pack and the coolant loop is represented by an idealized conductive contact interface at the module–cold plate surface. This representation is appropriate for the present system-level thermo-hydraulic comparison, while detailed three-dimensional channel layout, manifold distribution, and local contact resistance effects are outside the scope of the model.
Coolant circulation was provided by a centrifugal pump defined within the Simulink thermal liquid model. Simulations were conducted at pump speeds of 1500, 3000, and 4500 rpm, representing low, medium, and high coolant circulation conditions in an active liquid cooling loop. These values were selected to provide an operational sensitivity analysis rather than to reproduce a manufacturer-specific pump map. The selected range allows the effect of circulation intensity on battery temperature, pump power, and cooling load/heat rejection demand to be assessed under identical boundary conditions.
Pump power and cooling load/heat rejection rate describe two different parts of the BTMS response. Pump power is a hydraulic quantity governed mainly by pressure rise, volumetric flow rate, coolant viscosity, and frictional losses in the pipes and cold plate channels. By contrast, the cooling load/heat rejection rate is a thermal quantity governed by the heat extracted from the battery, the coolant heat capacity and thermal conductivity, the battery coolant temperature difference, and the imposed thermal load.
The present model should be interpreted as a system-level comparative simulation rather than a prototype-validated prediction for a specific commercial BTMS. Its purpose is to compare coolant behavior under identical geometry, boundary conditions, pump speeds, and thermal loads. Accordingly, the reported rankings and trade-offs are based on relative trends within the same modeling framework. Direct experimental validation of battery temperature, pressure drop, pump power, and heat rejection load for a matched prototype is required in future work before the absolute numerical values can be generalized to a specific vehicle platform or cooling system design.

4. Results and Discussion

This section evaluates the battery thermal management system under two operating conditions: the FTP-75 driving cycle and battery charging. Simulations were performed in MATLAB (Ver. 2024a)/Simulink for four working fluids: water, ethylene glycol–water, propylene glycol–water, and Jet-A aviation fuel. The target battery temperature was set to 20 °C, and pump speeds of 1500, 3000, and 4500 rpm were used to assess the effect of coolant circulation on system response.
For each case, the analysis tracks vehicle speed, battery temperature, battery current, pump power consumption, and refrigeration power demand. Under each operating condition, the combination of four coolant types and three pump speeds yields twelve simulation cases. All cases were evaluated under identical boundary conditions, with an ambient temperature of 30 °C and a total simulation time of approximately 1877 s. Under the FTP-75 driving cycle, the imposed speed profile includes repeated acceleration, deceleration, and low-speed operation. The corresponding battery current rises to about 18–20 A during the early part of the cycle, reaches a peak of about 30–31 A during the higher-load segment, and then stabilizes near 18–20 A toward the end of the cycle. Under charging, the vehicle remains stationary, and the battery current is prescribed at approximately 100 A for the full simulation duration.

4.1. BTMS Response Under the FTP-75 Driving Cycle

The FTP-75 case represents a transient discharge-like driving load in which battery current varies with acceleration, deceleration, and low-speed periods. Heat generation, therefore, changes with the driving demand and includes intermittent lower load intervals. In contrast, the charging case applies an approximately constant 100 A current while the vehicle remains stationary, producing a sustained thermal load over the full 1877 s. This difference explains why coolant performance differences are more pronounced during charging, where continuous Joule heating makes insufficient heat removal capability more evident.
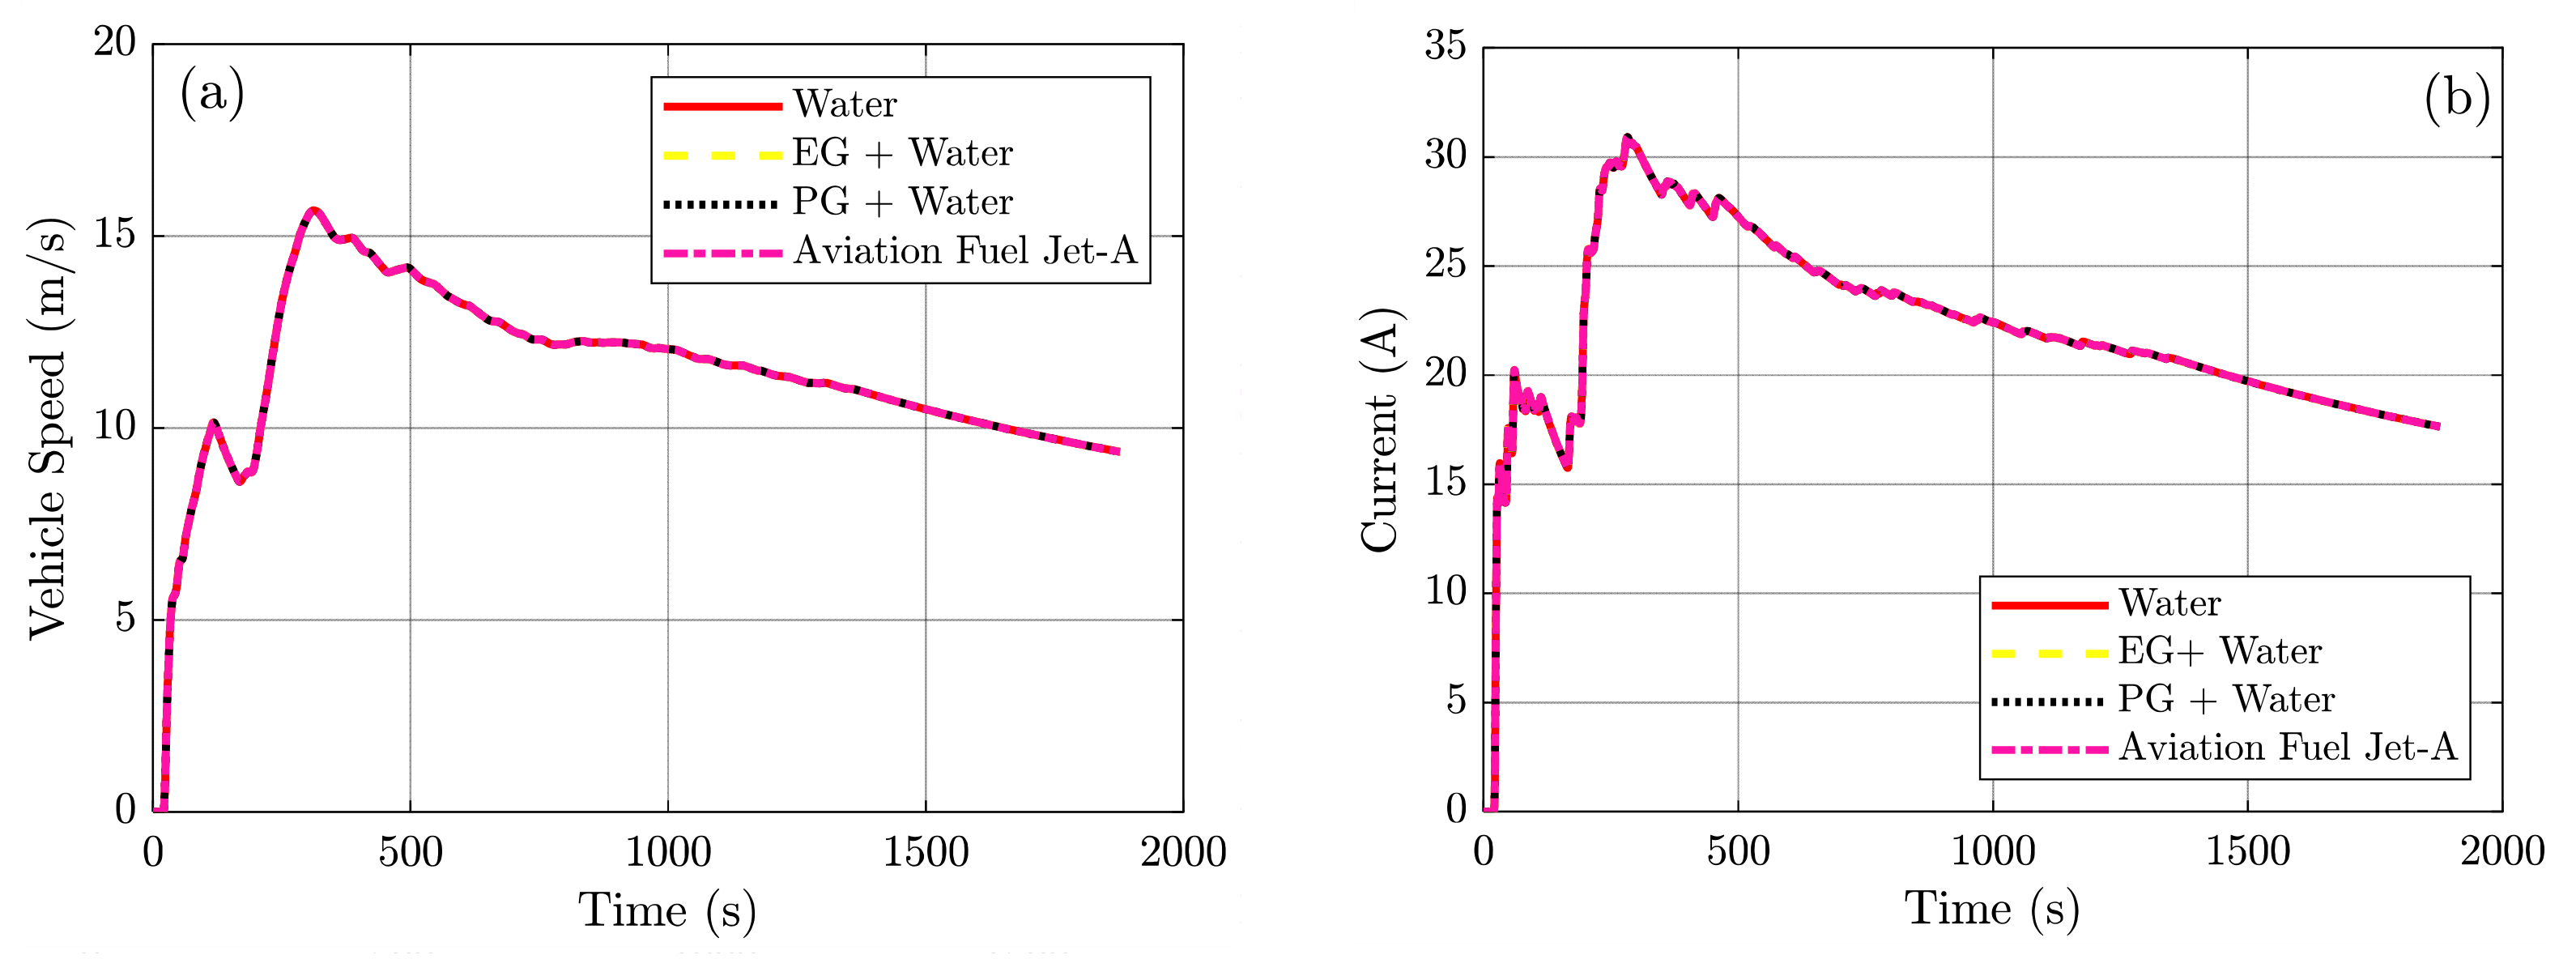
The vehicle speed profile shown in Figure 3a remains identical for all investigated cases (1500, 3000, and 4500 rpm) and the different working fluids. This consistency arises because pump operation and coolant selection are internal variables within the thermal management loop and do not influence the imposed driving schedule. At the beginning of the cycle, vehicle speed rises rapidly and reaches approximately 15.5 m/s at around 300 s. During the subsequent stages, the speed gradually decreases with small fluctuations characteristic of urban traffic conditions. Near the end of the cycle (t ≈ 1877 s), the speed stabilizes within a range of approximately 9–10 m/s. Since the speed profiles coincide with all simulations, the driving demand remains unchanged, allowing differences in thermal behavior and auxiliary energy consumption to be examined under controlled conditions.
The current response allows the load to be applied according to the FTP-75 speed profile and, therefore, shows an identical trend across all thermal management conditions (see Figure 3b). The current rises steeply from ≈0 to 18–20 A in the first 100 s, mirroring the acceleration demand of the initial phase of the cycle. The next higher-load segment (around t ≈ 250–320 s) has a higher peak of about 30–31 A, after which the current gradually decreases while the cycle transitions to lower average speed and decreased traction demand. During the later part of the simulation, the current stabilizes around 18–20 A (t ≈ 1800–1877 s). Since the current traces across its scenarios are very similar, it suggests that pump speed and coolant type do not have a material impact on traction current during that period of operation, or, in this case, that electrical demand responds primarily to the FTP-75 drive cycle as prescribed.
The invariance of the vehicle speed and current profiles across all examined cases indicates that the simulations are performed under similar VOs. As such, any variation in temperatures managed by the battery pack, or in the power used to pump and compress the refrigerant or coolant, will be explained by the thermal management architecture rather than differences in driving conditions/input or electrical loading.
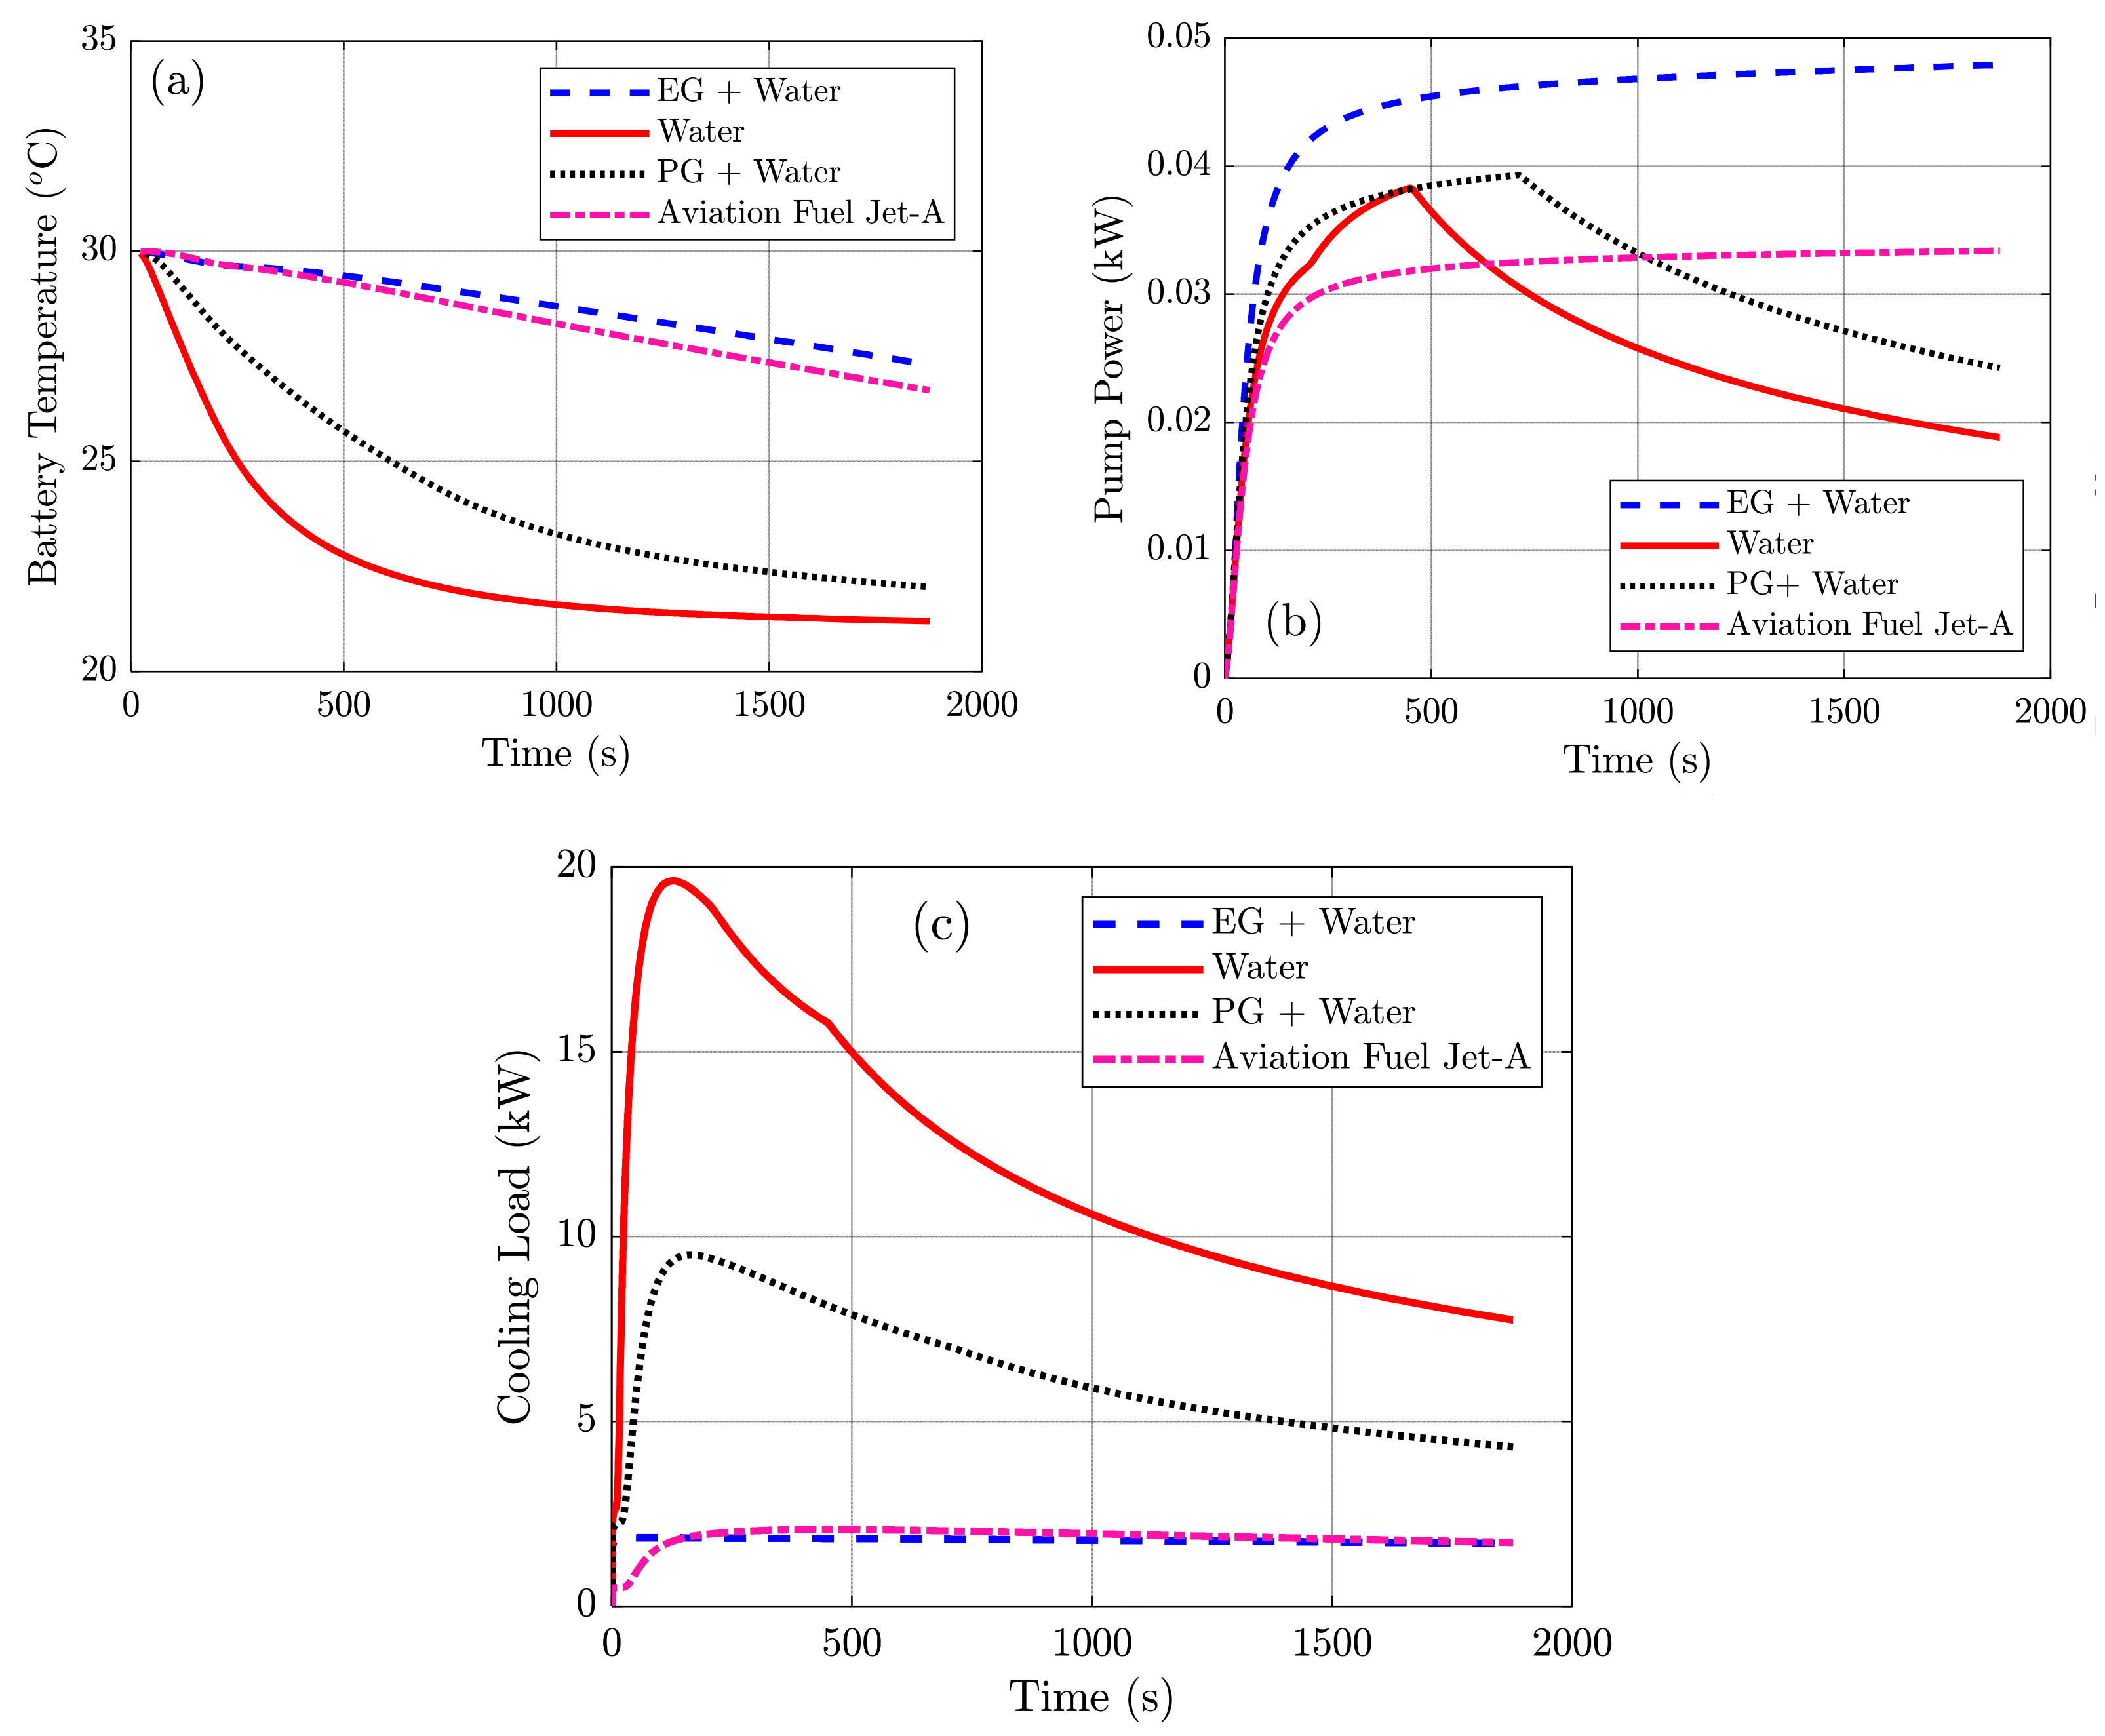
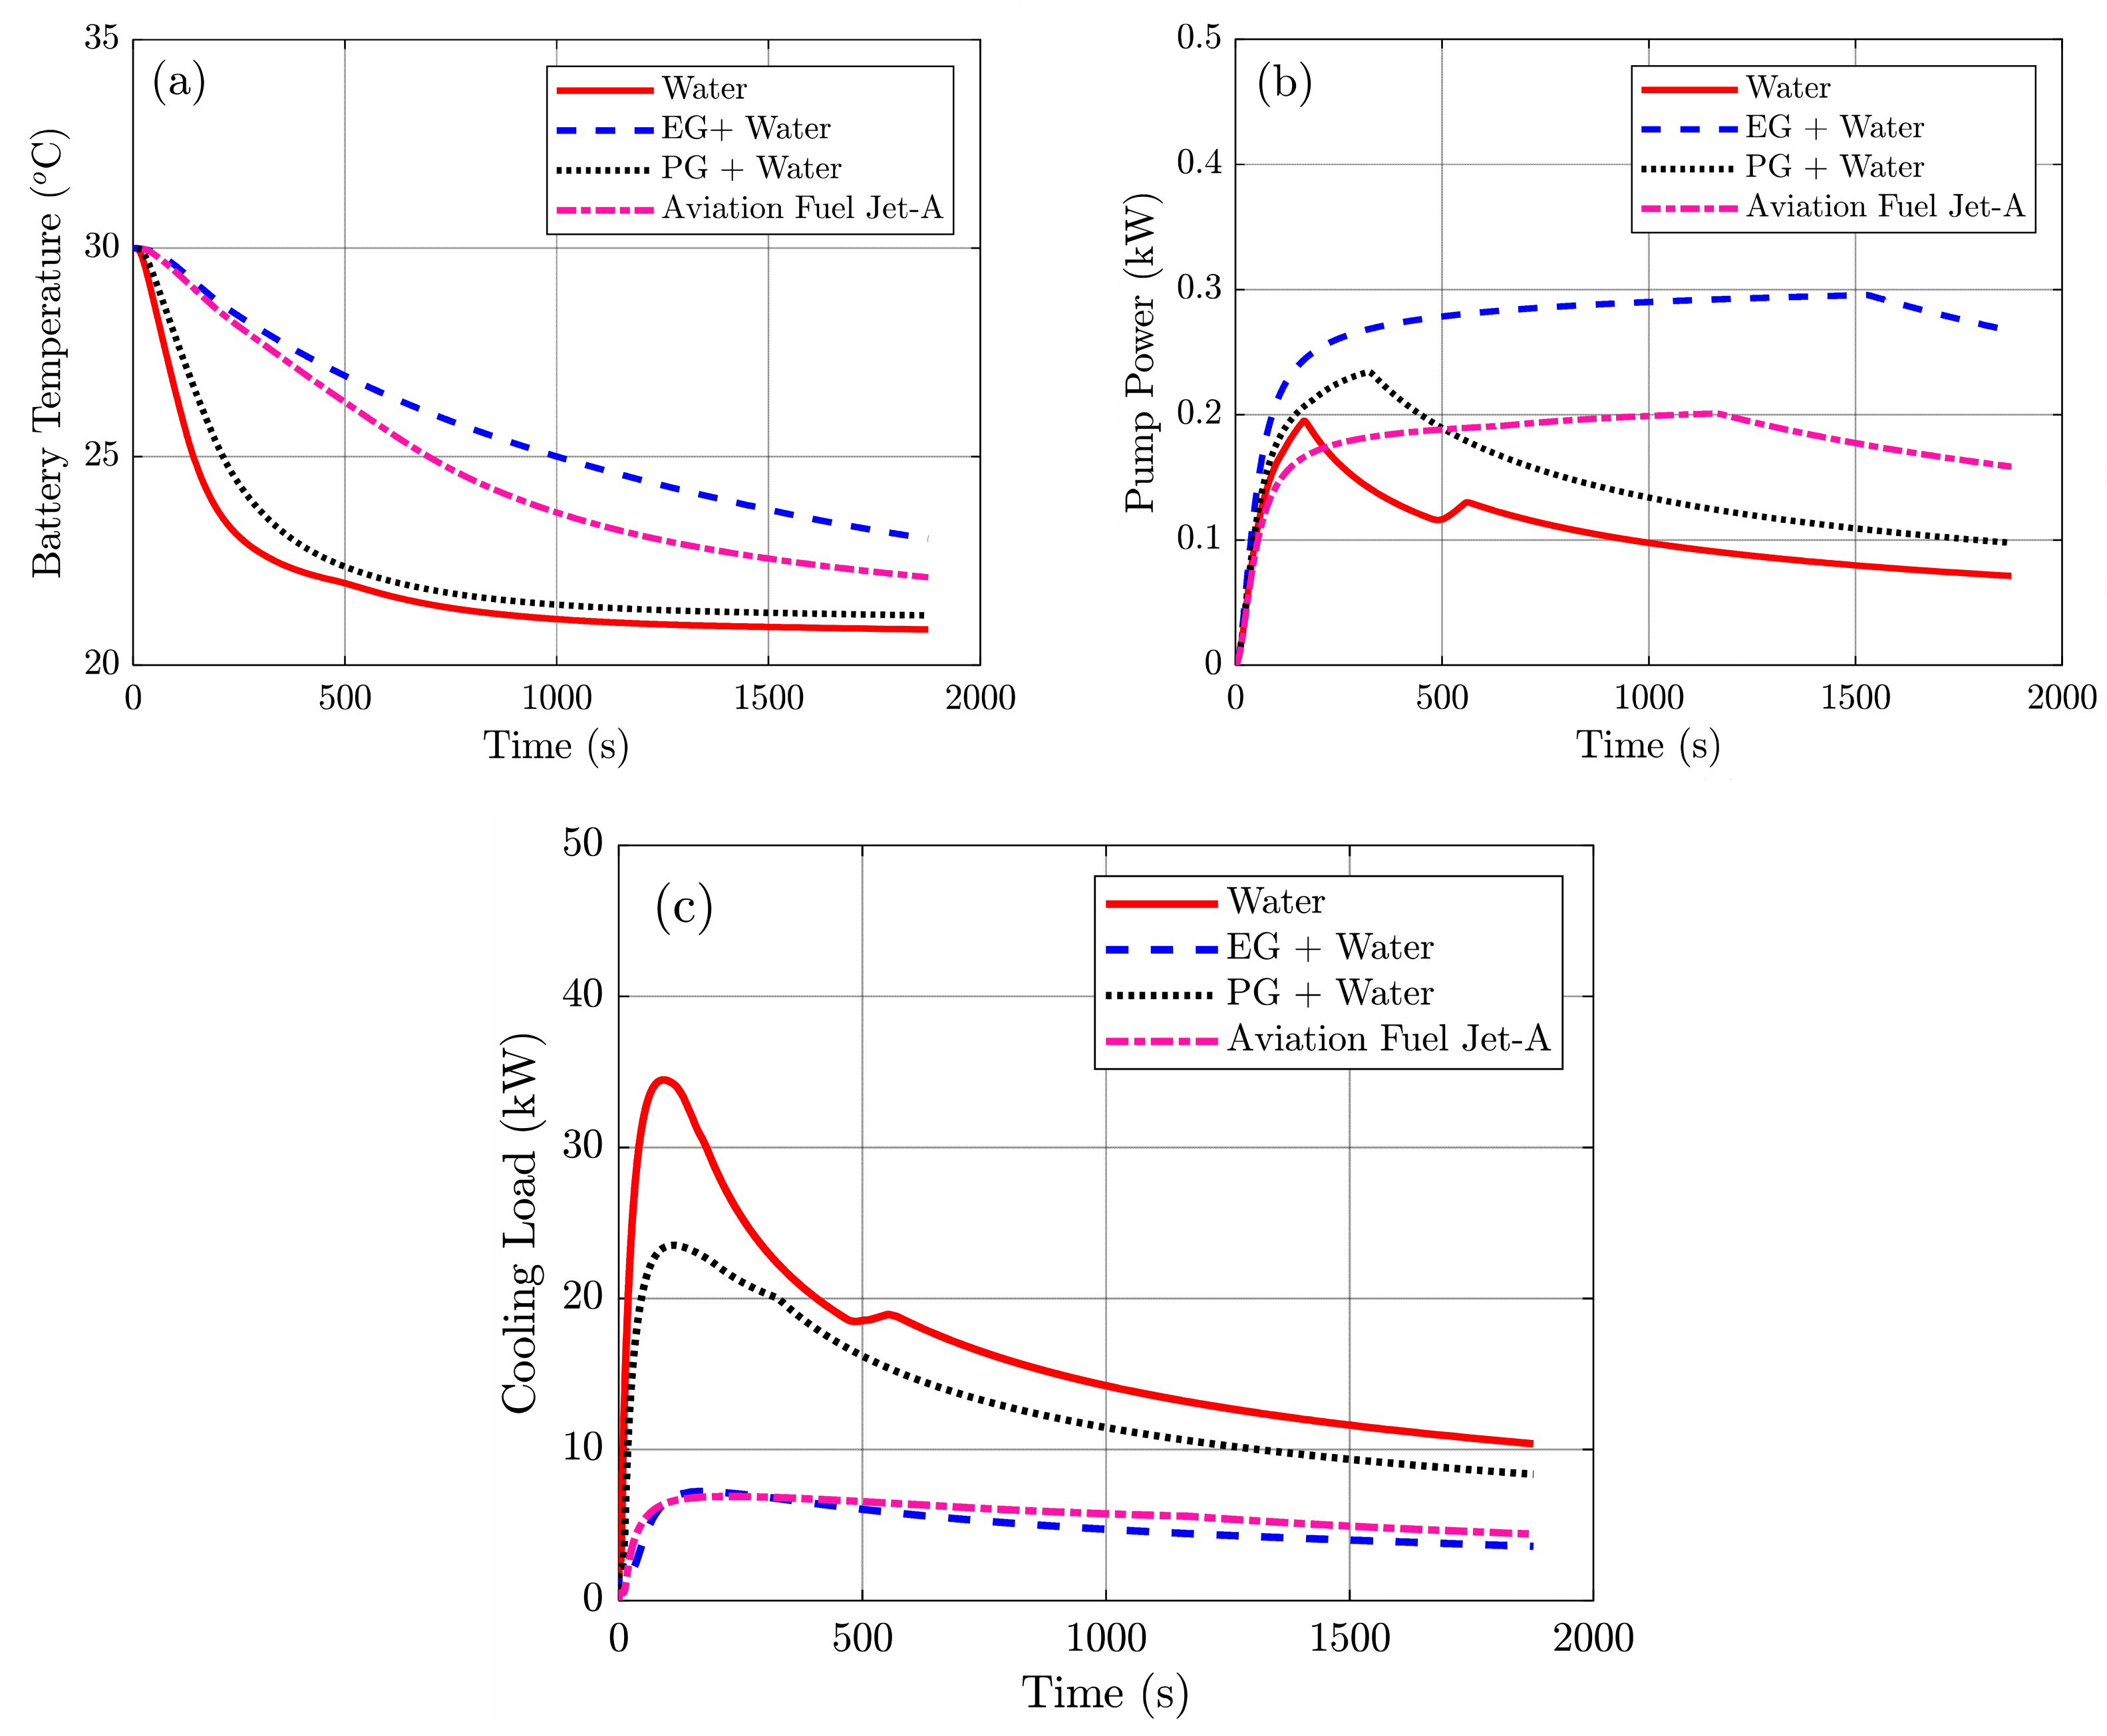
At a pump speed of 1500 rpm, the thermal and energy responses of the BTMS under the FTP-75 driving cycle show clear differences among the investigated working fluids, as summarized in Figure 4. As shown in Figure 4a, the battery temperature decreases from an initial value of about 30 °C over the 1877 s cycle for all coolants. Water provides the strongest cooling performance, reducing the battery temperature to approximately 21.2 °C by the end of the cycle. The propylene glycol–water mixture follows closely, reaching about 22.0 °C, whereas ethylene glycol–water and Jet-A remain at higher final temperatures of about 27.5 °C and 26.8 °C, respectively, indicating weaker heat removal capability.
The corresponding pump power response in Figure 4b shows a rapid initial rise followed by near-steady behavior. Ethylene glycol–water exhibits the highest pump power demand, stabilizing at approximately 0.047 kW, followed by propylene glycol–water at about 0.038 kW and Jet-A at about 0.033 kW. The higher pumping demand of the glycol-based mixtures is primarily attributed to their greater viscosity, which increases hydraulic resistance and frictional losses within the coolant loop.
A similar trend is evident in the cooling load shown in Figure 4c. Water produces the highest cooling demand, with an initial peak of approximately 19.5 kW that gradually declines to about 7.8 kW by the end of the cycle. The propylene glycol–water mixture shows an intermediate response, decreasing from about 9.5 kW to nearly 4.5 kW. By contrast, ethylene glycol–water and Jet-A maintain much lower cooling load/heat rejection rate requirements, remaining close to 2 kW for most of the simulation. Overall, the results indicate that water offers the most effective temperature regulation at 1500 rpm, but this advantage is accompanied by a higher auxiliary energy penalty.
At 3000 rpm, the FTP-75 results show a clear shift in system behavior: thermal regulation improves for all working fluids, but the associated energy cost becomes much more pronounced, as shown in Figure 5. The benefit of the higher flow rate is evident in Figure 5a, where all coolants reduce the initial battery temperature of about 30 °C more effectively than in the lower-speed case. Water again gives the lowest final temperature, approaching 21.0 °C, followed closely by the propylene glycol–water mixture at about 21.4 °C. Jet-A and ethylene glycol–water remain less effective, ending the cycle at approximately 22.2 °C and 23.0 °C, respectively. This ranking is consistent with the fluid property differences, particularly the advantage of water in combining relatively high thermal conductivity with lower viscosity.
The improved temperature control at 3000 rpm is accompanied by a clear increase in hydraulic demand. As in Figure 5b, pump power rises to about 0.28 kW for ethylene glycol–water, 0.20 kW for Jet-A, 0.14 kW for propylene glycol–water, and 0.08 kW for water. The higher values for the more viscous fluids reflect their greater flow resistance and pumping requirement. A similar trend is observed in the cooling load/heat rejection rate in Figure 5c. Water shows the highest demand, with an initial peak near 34 kW and a later level of about 11 kW, while propylene glycol–water decreases from about 23 kW to nearly 9 kW. Jet-A and ethylene glycol–water remain below about 7 kW for most of the cycle, mainly because of their lower heat removal capability. Thus, the 3000 rpm case provides improved temperature control, but with a noticeable increase in auxiliary energy demand.
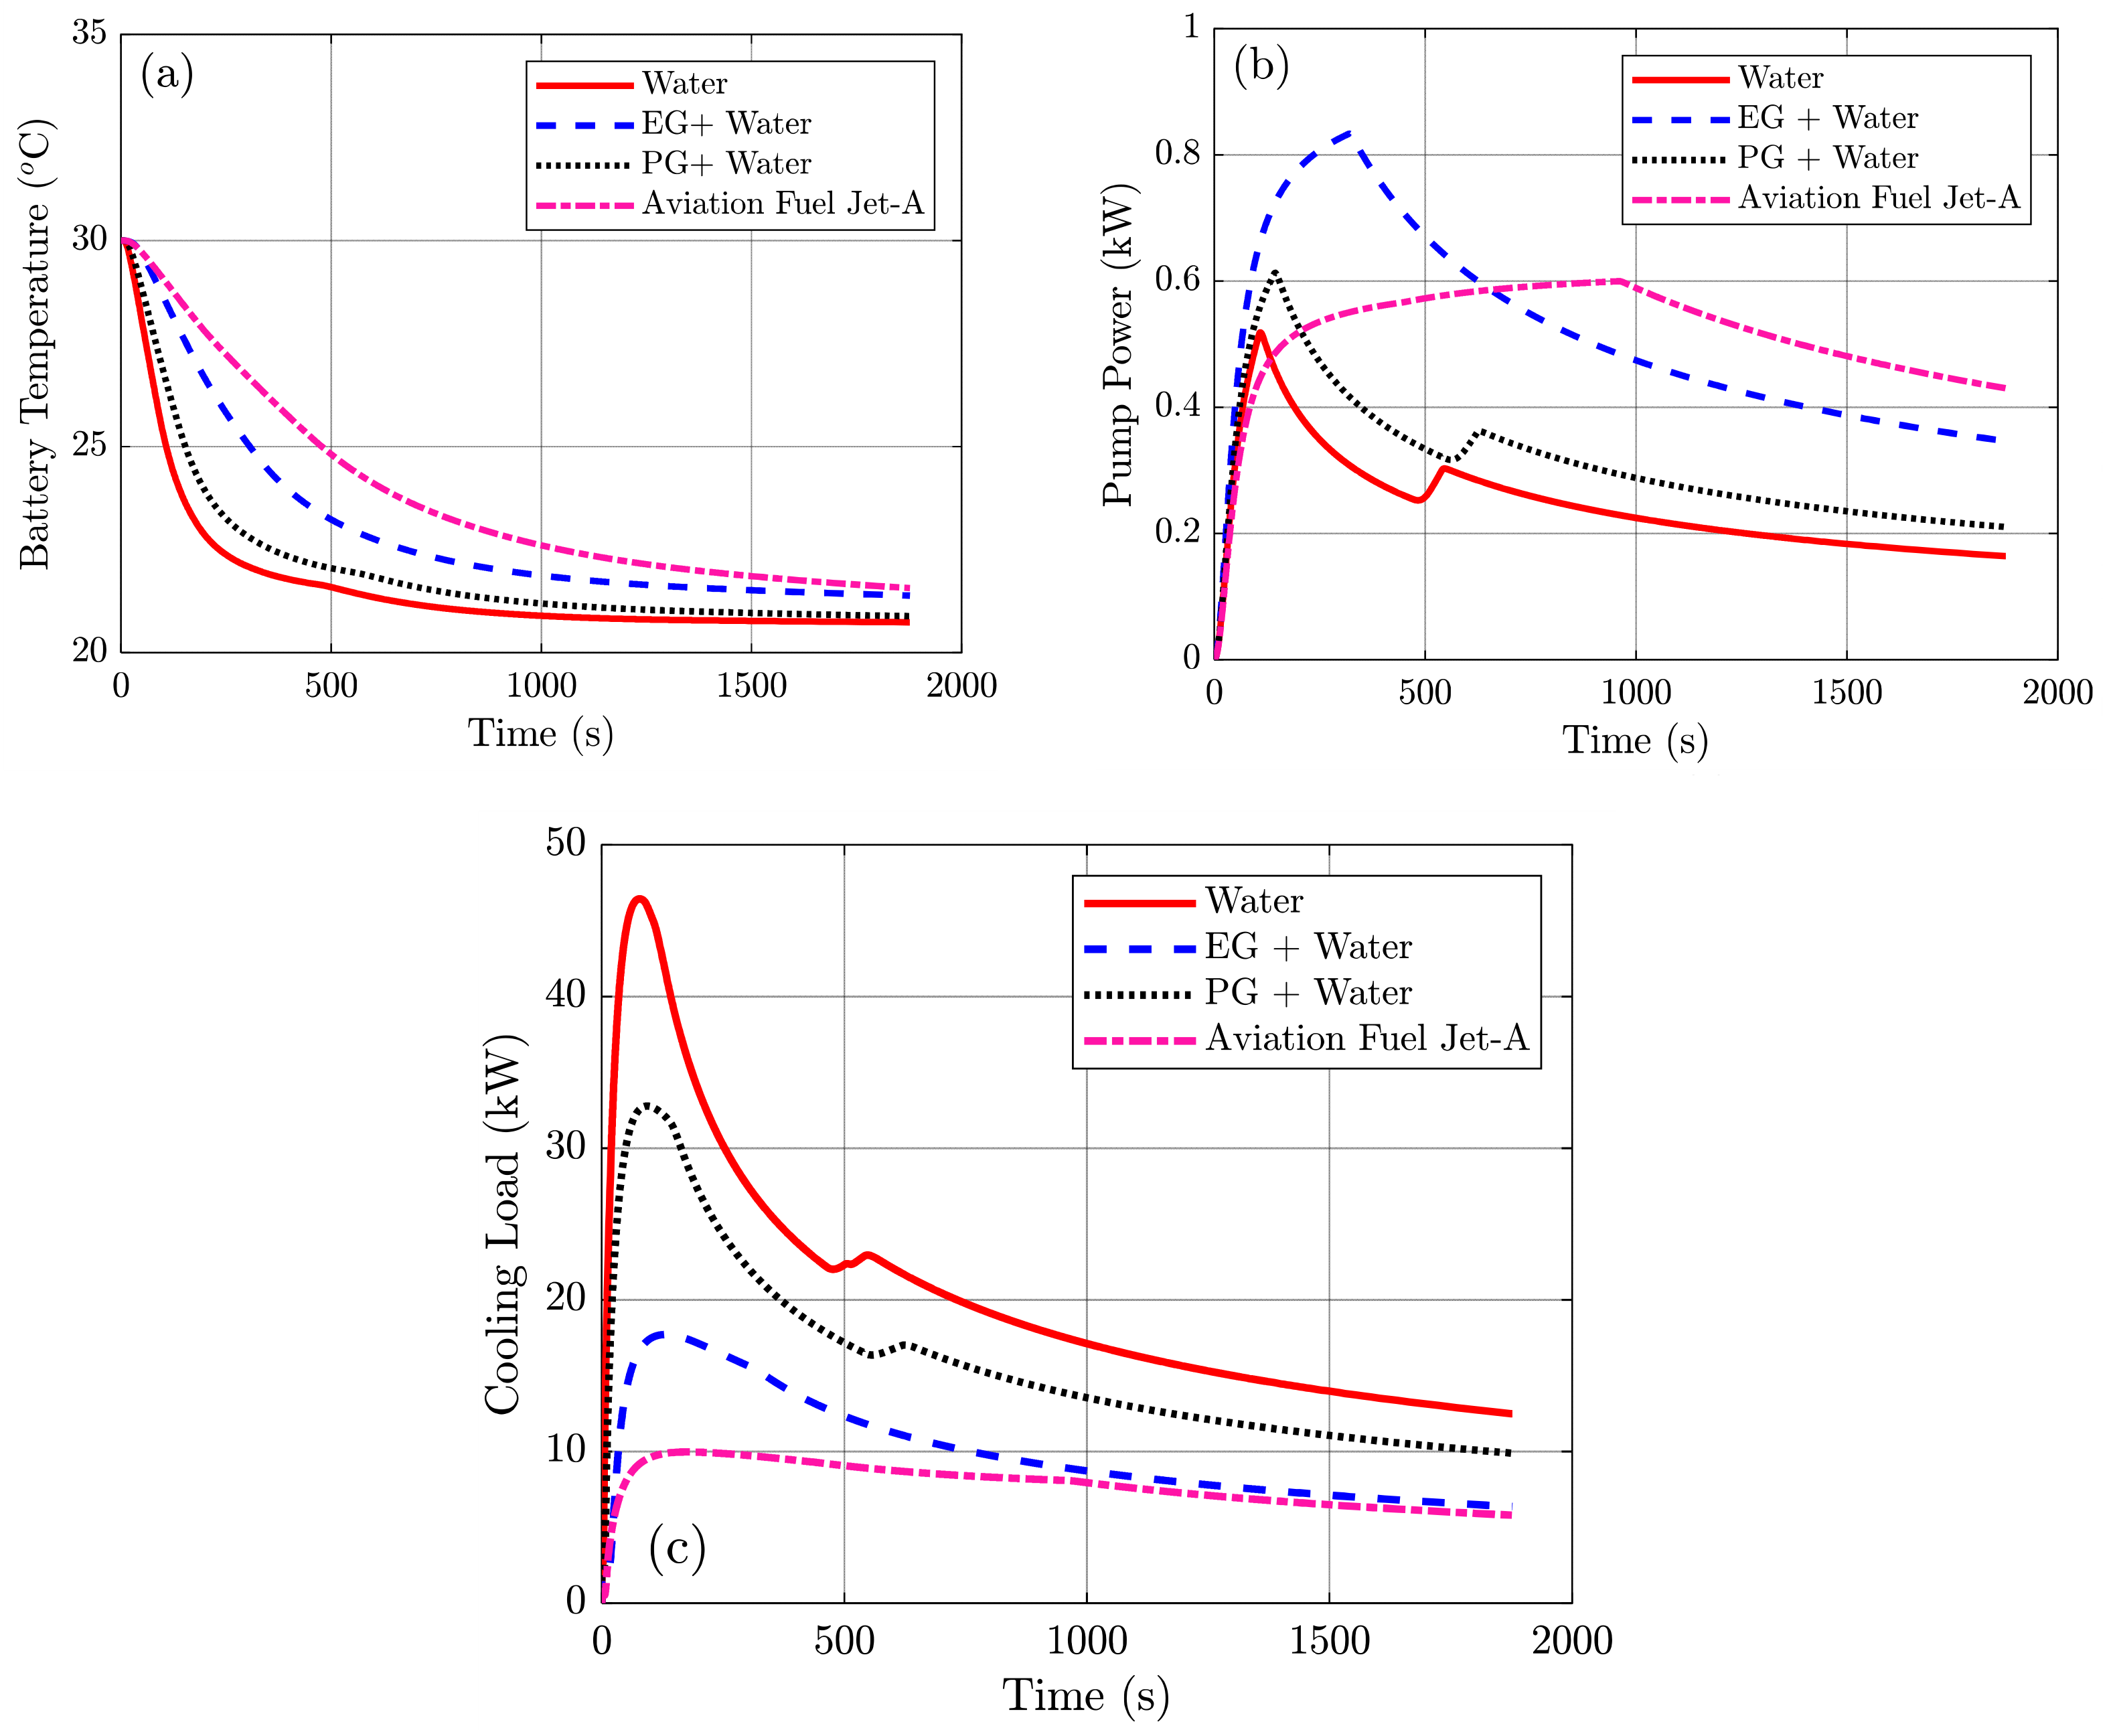
Further increasing the pump speed to 4500 rpm produces only a limited additional thermal benefit, as illustrated in Figure 6. In Figure 6a, battery temperature drops rapidly from about 30 °C during the first 200–300 s and then gradually approaches quasi-steady conditions. Water gives the lowest final temperature, about 20.6–20.8 °C, followed closely by propylene glycol–water at 20.8–21.0 °C. Ethylene glycol–water and Jet-A remain slightly warmer, at about 21.2 °C and 21.4–21.6 °C, respectively. The narrower spread among coolants at this speed indicates that higher circulation reduces the sensitivity of battery temperature to coolant type.
This convergence in thermal behavior is achieved at a much higher hydraulic cost. As shown in Figure 6b, pump power increases sharply with pump speed, with ethylene glycol–water exhibiting the highest demand, peaking at about 0.80–0.83 kW before settling near 0.35 kW. Water also shows a substantial rise, from an initial value of about 0.50 kW to a steady level close to 0.18 kW. The same ranking observed at lower speeds is maintained, confirming that viscosity remains the dominant factor governing pressure loss and pumping work in the loop.
The cooling load/heat rejection rate response in Figure 6c follows the same general trend as the thermal results. Water produces the largest cooling demand, with an initial requirement of about 45–46 kW that decreases gradually to nearly 13 kW by the end of the simulation. The propylene glycol–water mixture shows the next highest demand, falling from roughly 33 kW to around 10 kW over the same period. These results show that although operation at 4500 rpm slightly improves temperature control, especially for the weaker-performing fluids, the incremental benefit is relatively small compared with the pronounced increase in auxiliary power demand. In this sense, the highest pump speed offers the clearest evidence of diminishing thermal returns in the BTMS.
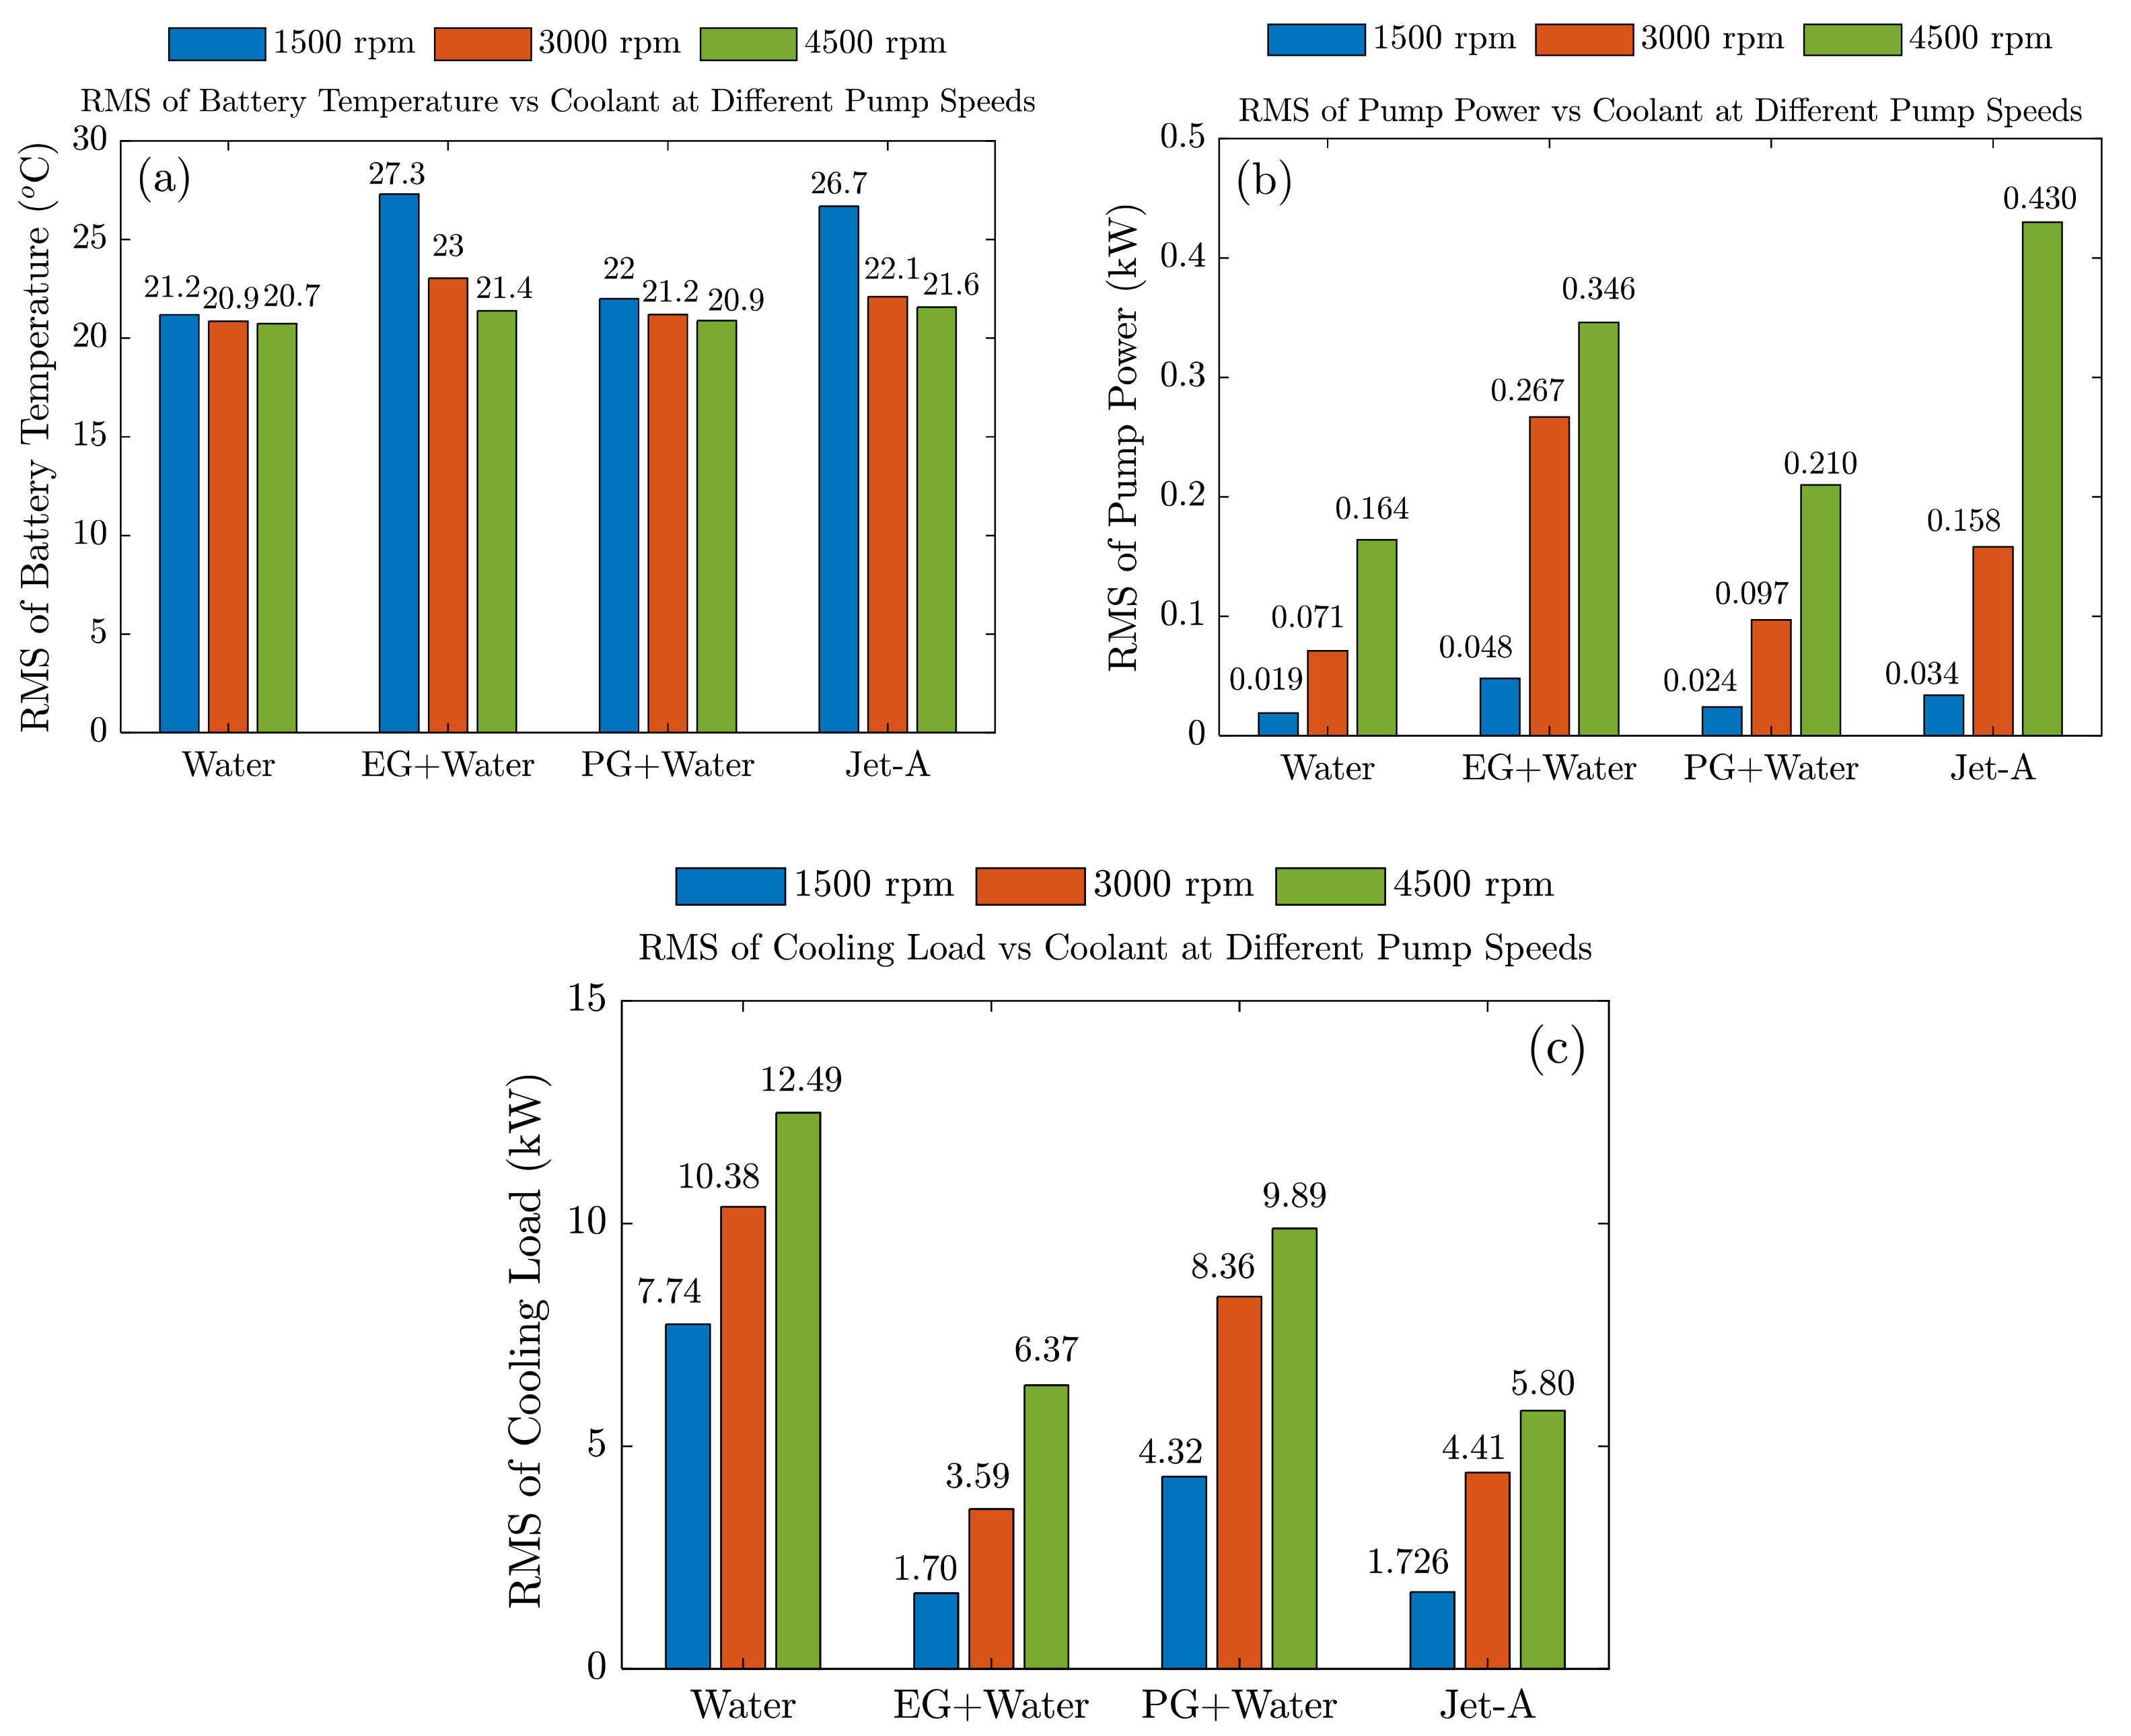
Figure 7 summarizes the RMS response of the BTMS for the four coolants at three pump speeds. As shown in Figure 7a, increasing pump speed reduces RMS battery temperature for all fluids, with the largest reductions observed for ethylene glycol–water and Jet-A. Ethylene glycol–water decreases from about 27.3 °C at 1500 rpm to nearly 21.4 °C at 4500 rpm, while Jet-A decreases from about 26.7 °C to 21.6 °C. Water and propylene glycol–water already show lower RMS temperatures at 1500 rpm, so their additional improvement at higher speeds is limited. The reduced spread at 4500 rpm indicates that stronger circulation lowers the sensitivity of battery temperature to coolant type.
The improvement in thermal regulation is accompanied by higher auxiliary energy demand. As shown in Figure 7b, RMS pump power increases with pump speed for all coolants, especially for the more hydraulically demanding fluids. Water remains the least demanding case, increasing from about 0.019 kW at 1500 rpm to 0.164 kW at 4500 rpm, whereas ethylene glycol–water rises from about 0.048 kW to 0.346 kW. A similar trend appears in the RMS cooling load/heat rejection rate in Figure 7c. Water shows the highest heat rejection demand, increasing from about 7.74 to 12.49 kW, followed by propylene glycol–water, while ethylene glycol–water and Jet-A remain lower because of their weaker heat removal capability. The RMS results, therefore, confirm that higher pump speed improves temperature control, but with increased pumping and heat rejection requirements.

4.2. BTMS Response Under the Charging Cycle

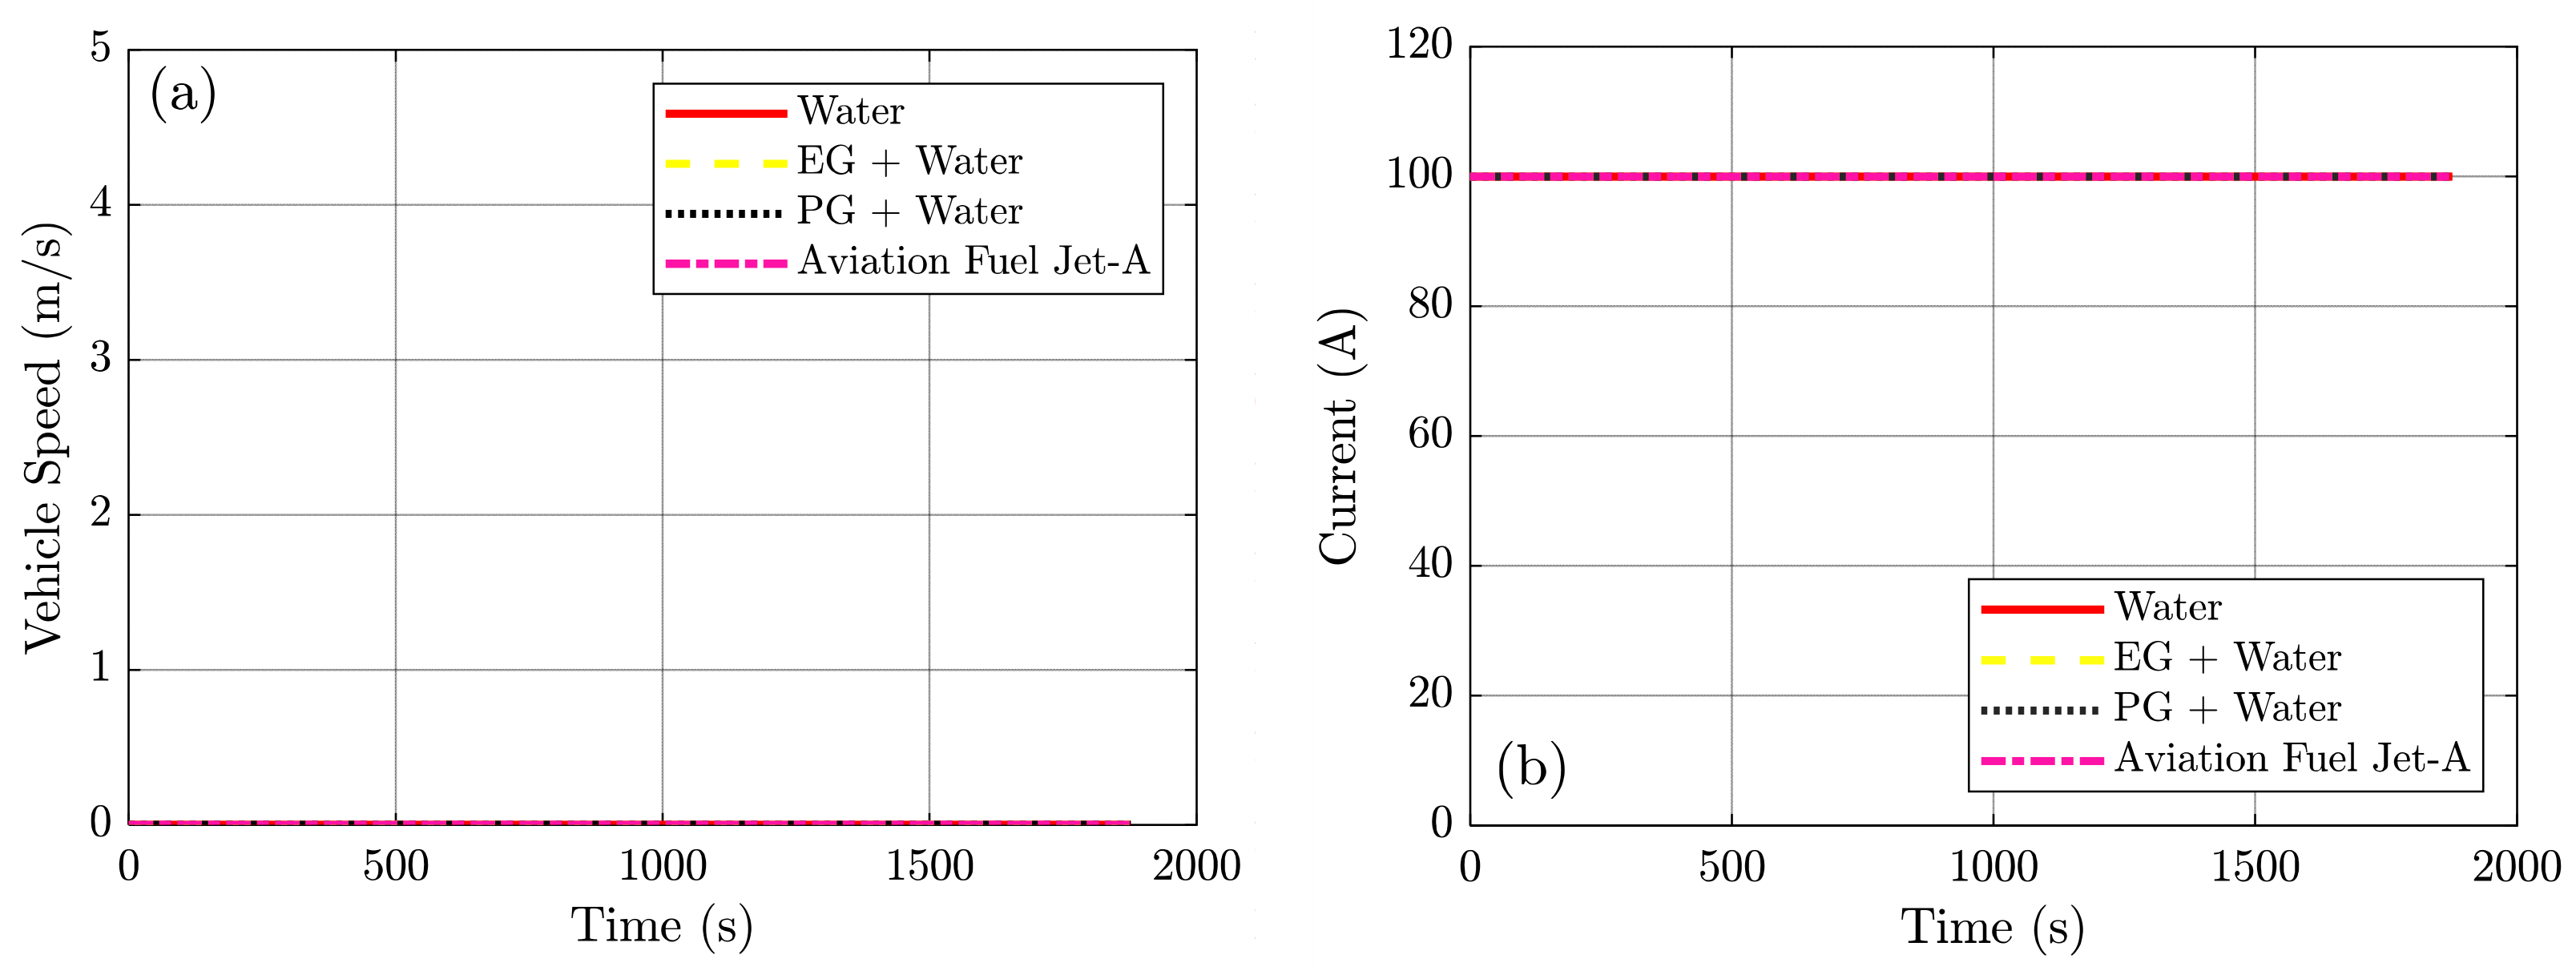
The charging cycle represents a stationary operating condition (see Figure 8a). Vehicle speed remains zero throughout the 1877 s simulation, so the battery thermal load is governed by charging rather than traction demand. The battery current in Figure 8b remains nearly constant at 100 A for all cases, with overlapping curves for all coolants. Thus, differences in battery temperature, pump power, and cooling load/heat rejection rate can be attributed to the BTMS response rather than variations in the charging profile.
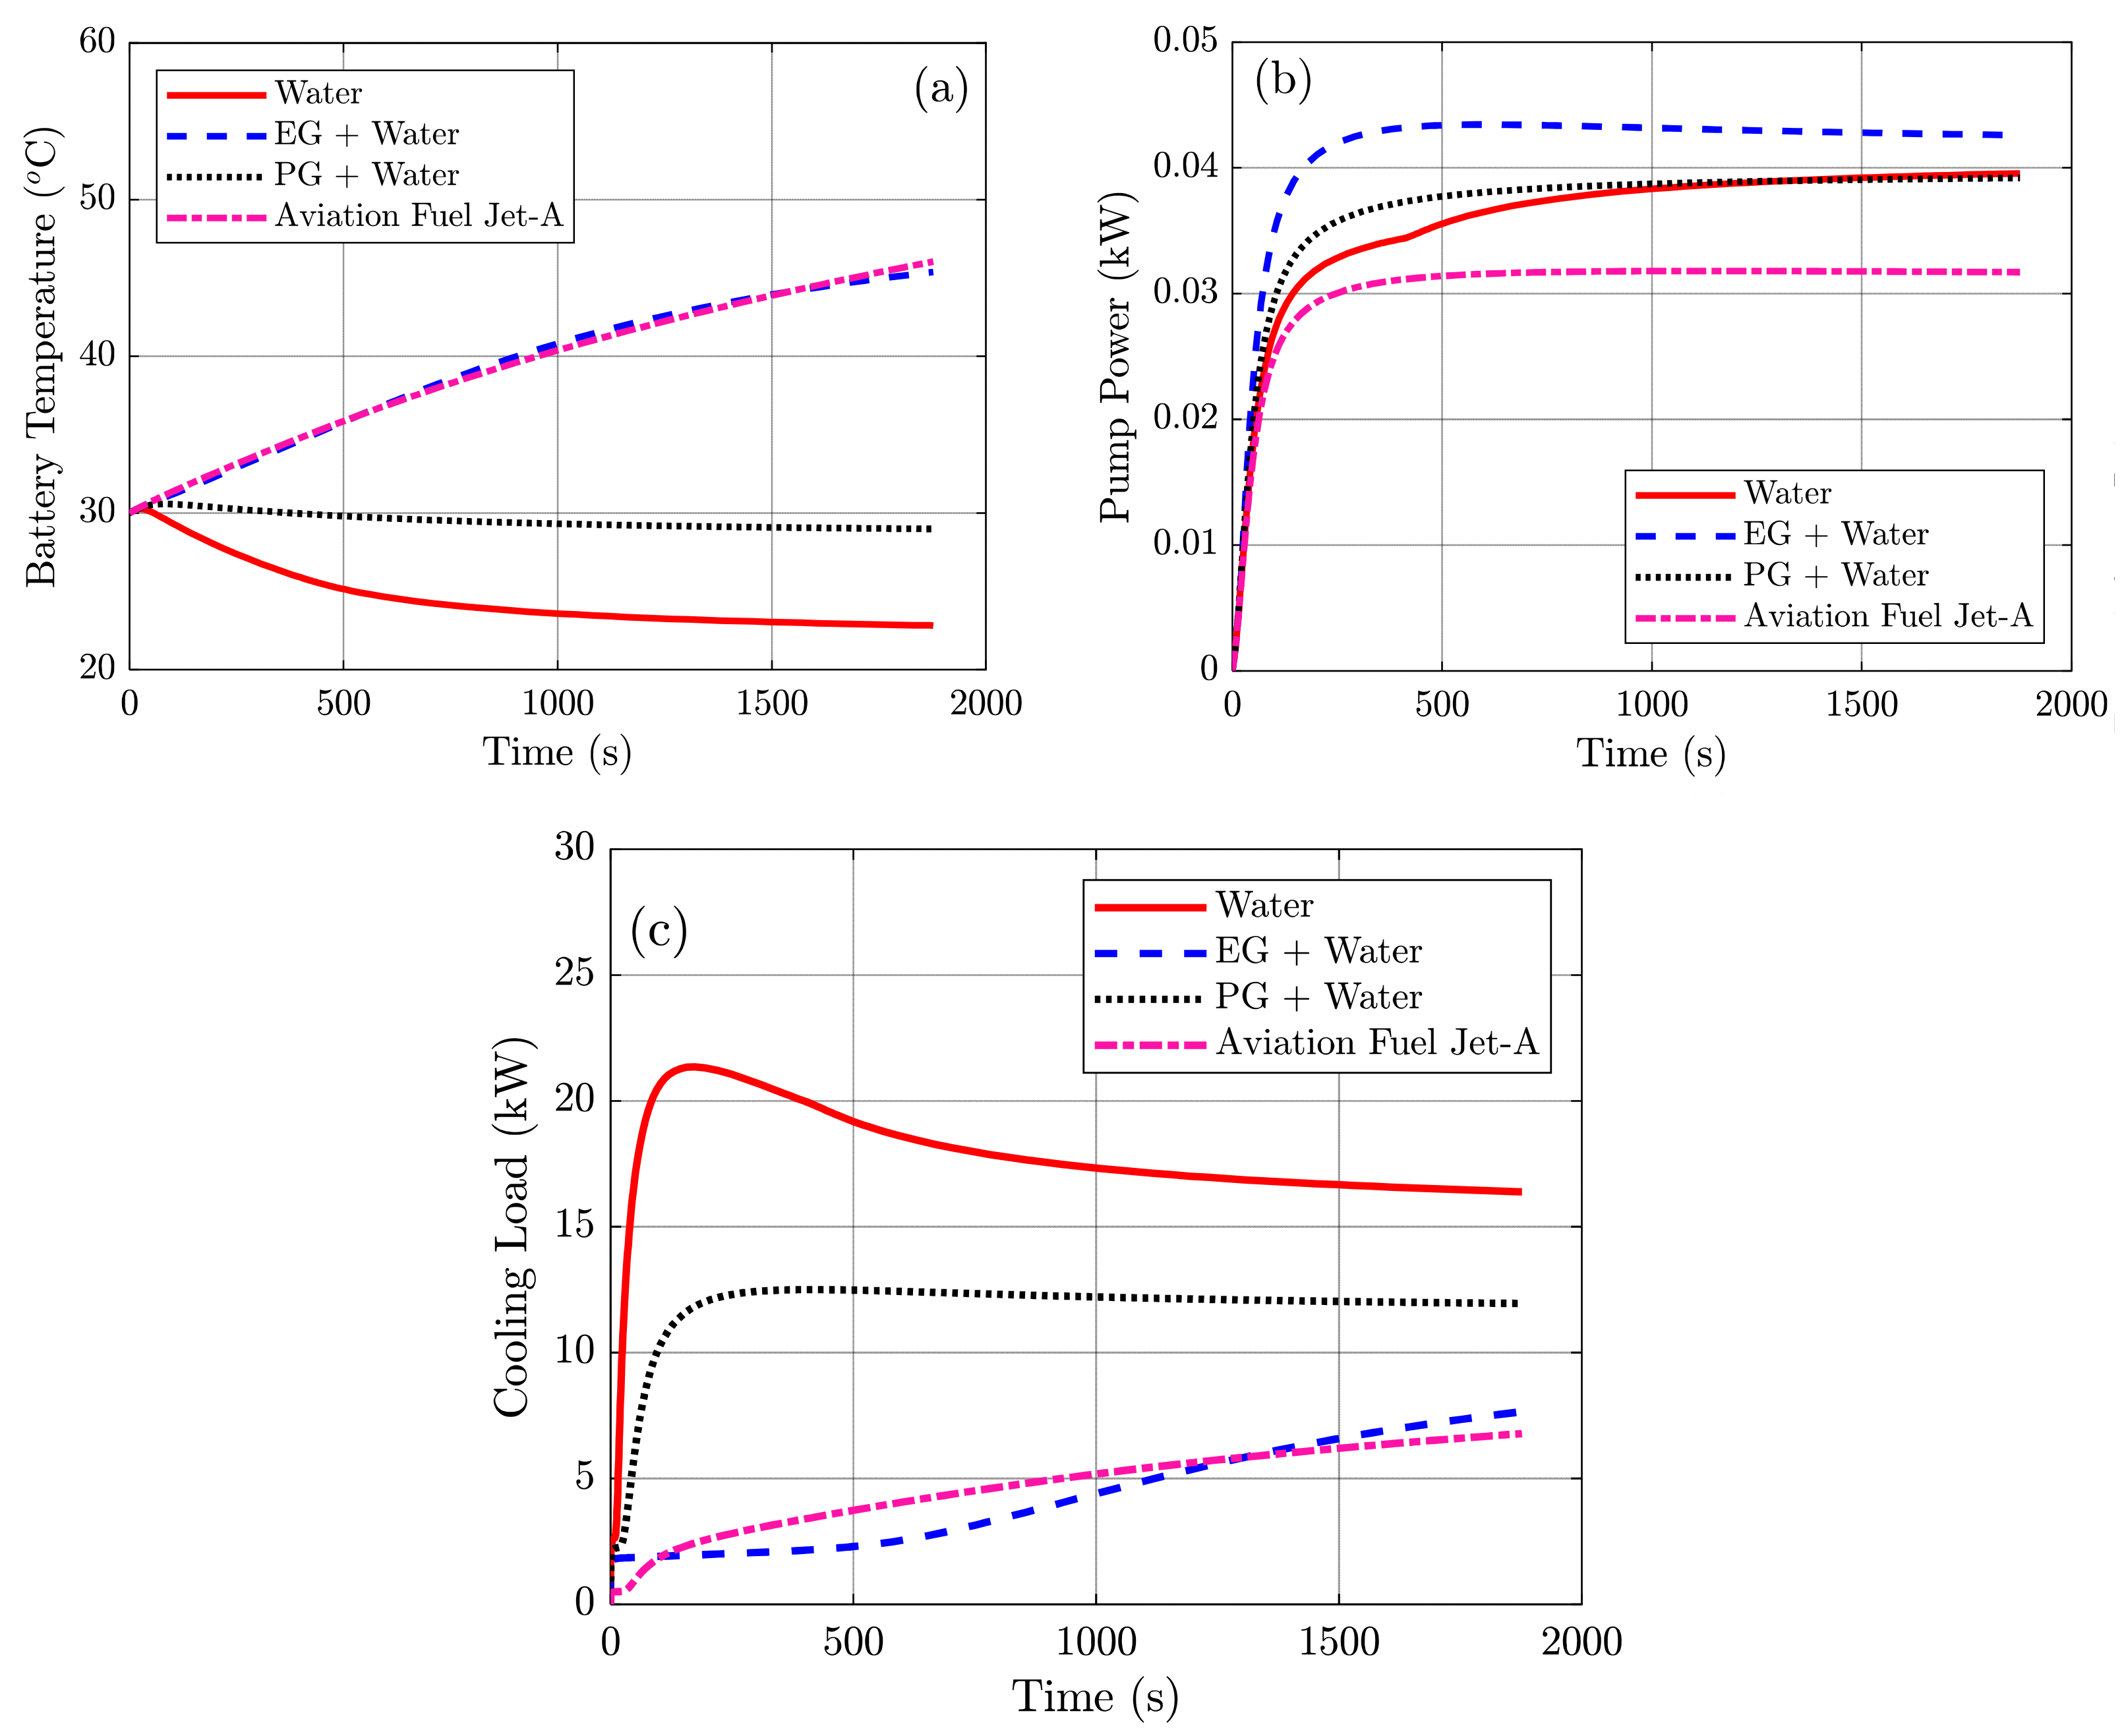
At 1500 rpm, the charging cycle results show a clearer separation among coolants than under FTP-75, as shown in Figure 9. Under the sustained charging load, coolant capability becomes more decisive. In Figure 9a, water reduces the battery temperature from about 30 °C to nearly 23 °C and maintains the lowest temperature throughout the cycle. Propylene glycol–water provides moderate control, with the battery remaining close to 29–30 °C. In contrast, ethylene glycol–water and Jet-A allow the temperature to rise continuously, reaching about 46–47 °C near the end of charging. This confirms that, at low pump speed, coolant thermophysical properties strongly control the balance between heat generation and heat removal.
Pump power and heat rejection response show a similar distinction among the coolants. In Figure 9b, pump power approaches about 0.040 kW for water, 0.043 kW for ethylene glycol–water, 0.039 kW for propylene glycol–water, and 0.032 kW for Jet-A. The slightly higher values for glycol mixtures reflect their higher viscosity and hydraulic resistance. In Figure 9c, water gives the highest cooling load/heat rejection rate, peaking near 21 kW and stabilizing around 16–17 kW, while propylene glycol–water remains below about 12 kW. Jet-A and ethylene glycol–water stay lower, about 2–8 kW, mainly because they remove less heat. Thus, at 1500 rpm, water provides the best temperature control but requires the highest heat rejection load.
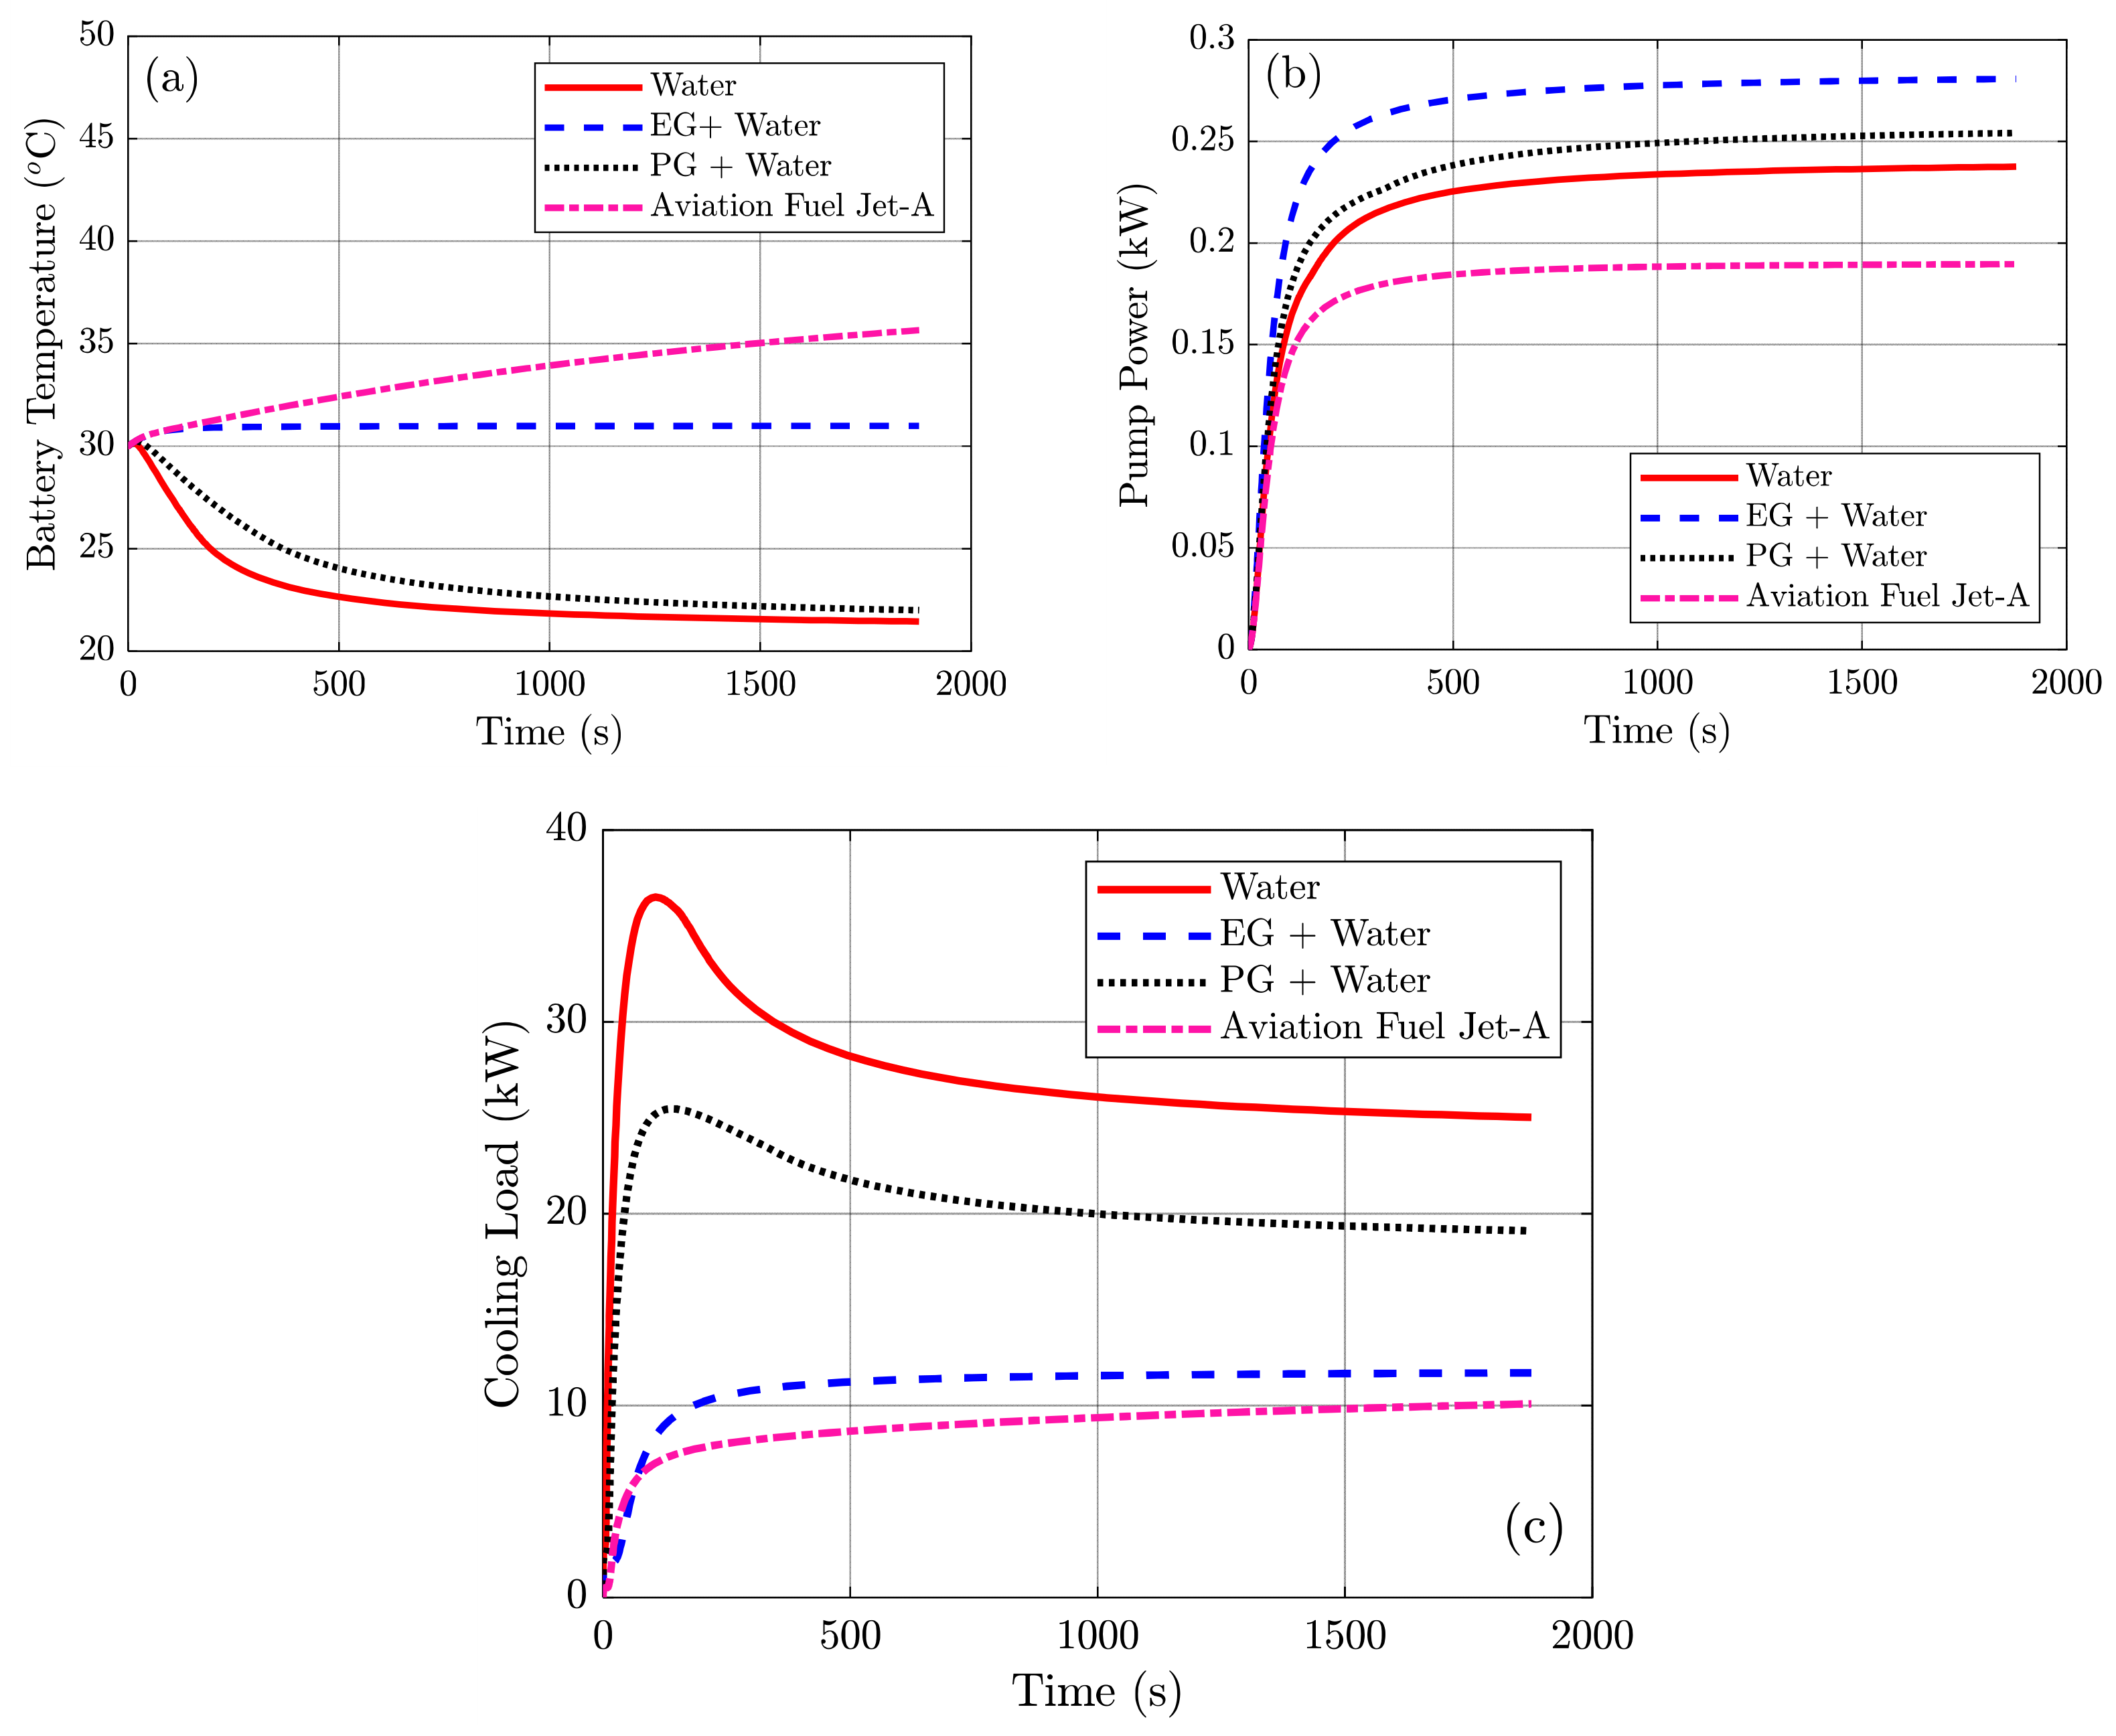
Increasing the speed to 3000 rpm improves charging thermal control, but the response remains strongly dependent on coolant type (see Figure 10). The higher circulation rate brings the better-performing fluids into a lower temperature range: water reduces the battery temperature from about 30 °C to nearly 21.7 °C, while propylene glycol–water follows closely at about 22.3 °C (Figure 10a). Ethylene glycol–water shows weaker control, stabilizing near 31 °C, and Jet-A remains the least effective coolant, reaching roughly 36 °C under the sustained charging load. This indicates that higher flow rate improves heat extraction but does not eliminate the influence of coolant properties; fluids with better thermal conductivity and lower flow resistance still retain a clear advantage.
The improved thermal response is accompanied by higher pump power and cooling load. In Figure 10b, pump power settles at approximately 0.24 kW for water, 0.28 kW for ethylene glycol–water, 0.25 kW for propylene glycol–water, and 0.19 kW for Jet-A. The higher values for glycol mixtures are consistent with their greater viscosity and hydraulic resistance. In Figure 10c, water shows the highest cooling load, starting near 36 kW and later remaining around 25 kW, while propylene glycol–water decreases from about 25 kW to nearly 19 kW. Ethylene glycol–water and Jet-A remain lower, at roughly 12 kW and 10 kW, mainly because of weaker heat removal. Thus, 3000 rpm provides better temperature control than 1500 rpm, but with a substantial increase in pumping and cooling load requirements.
Further increasing the pump speed to 4500 rpm gives only a limited additional thermal benefit (see Figure 11). In Figure 11a, water and propylene glycol–water approach similar end-of-cycle temperatures, reaching about 21.2 °C and 21.5 °C, respectively. Ethylene glycol–water improves relative to the lower-speed cases but still settles at about 24 °C, while Jet-A remains less effective, ending near 31 °C. This narrowing among the better-performing fluids indicates that, once circulation is sufficiently high, further flow rate increases provide only limited additional thermal benefit.
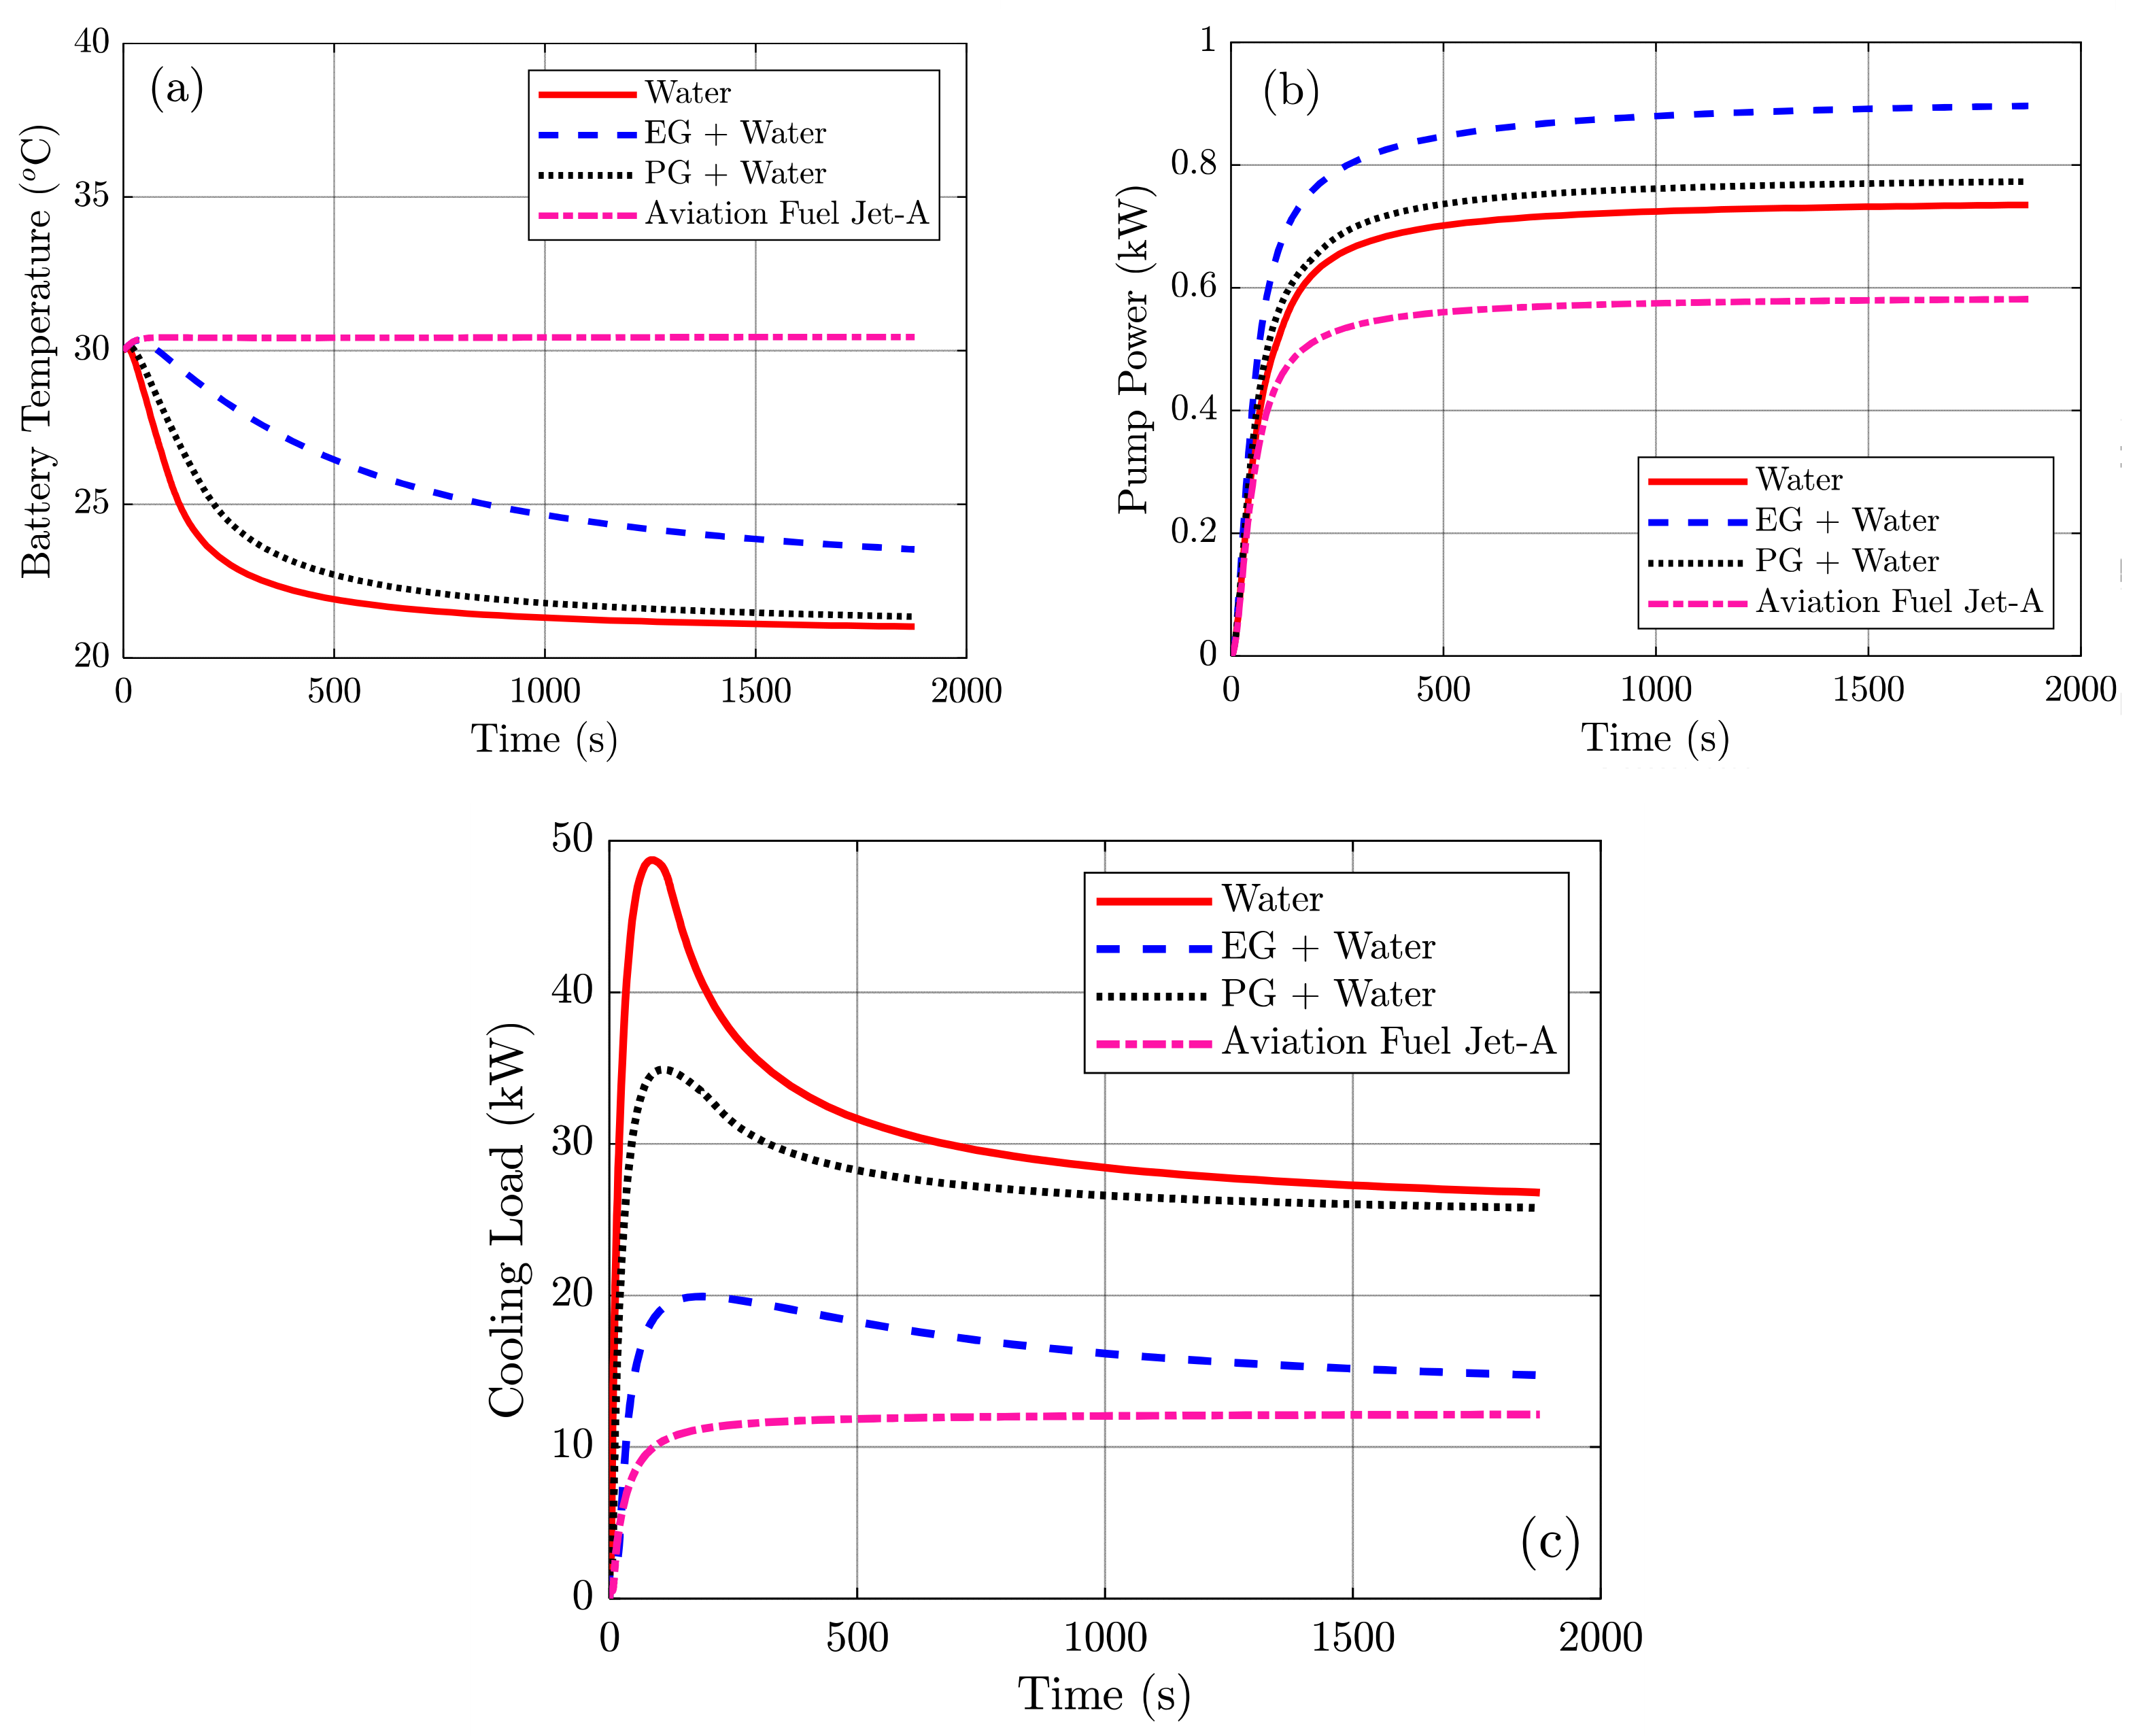
The increase in pump power and cooling load is more pronounced at 4500 rpm. In Figure 11b, pump power rises to about 0.73 kW for water, 0.90 kW for ethylene glycol–water, 0.78 kW for propylene glycol–water, and 0.58 kW for Jet-A, confirming the role of viscosity-driven hydraulic resistance. In Figure 11c, water shows the highest cooling load, decreasing from an initial peak near 49 kW to about 27 kW, while propylene glycol–water decreases from roughly 35 kW to 26 kW. Ethylene glycol–water and Jet-A remain lower, at about 15 kW and 12 kW, mainly because of weaker heat extraction. Thus, the 4500 rpm case highlights the diminishing practical return of further increasing coolant circulation.
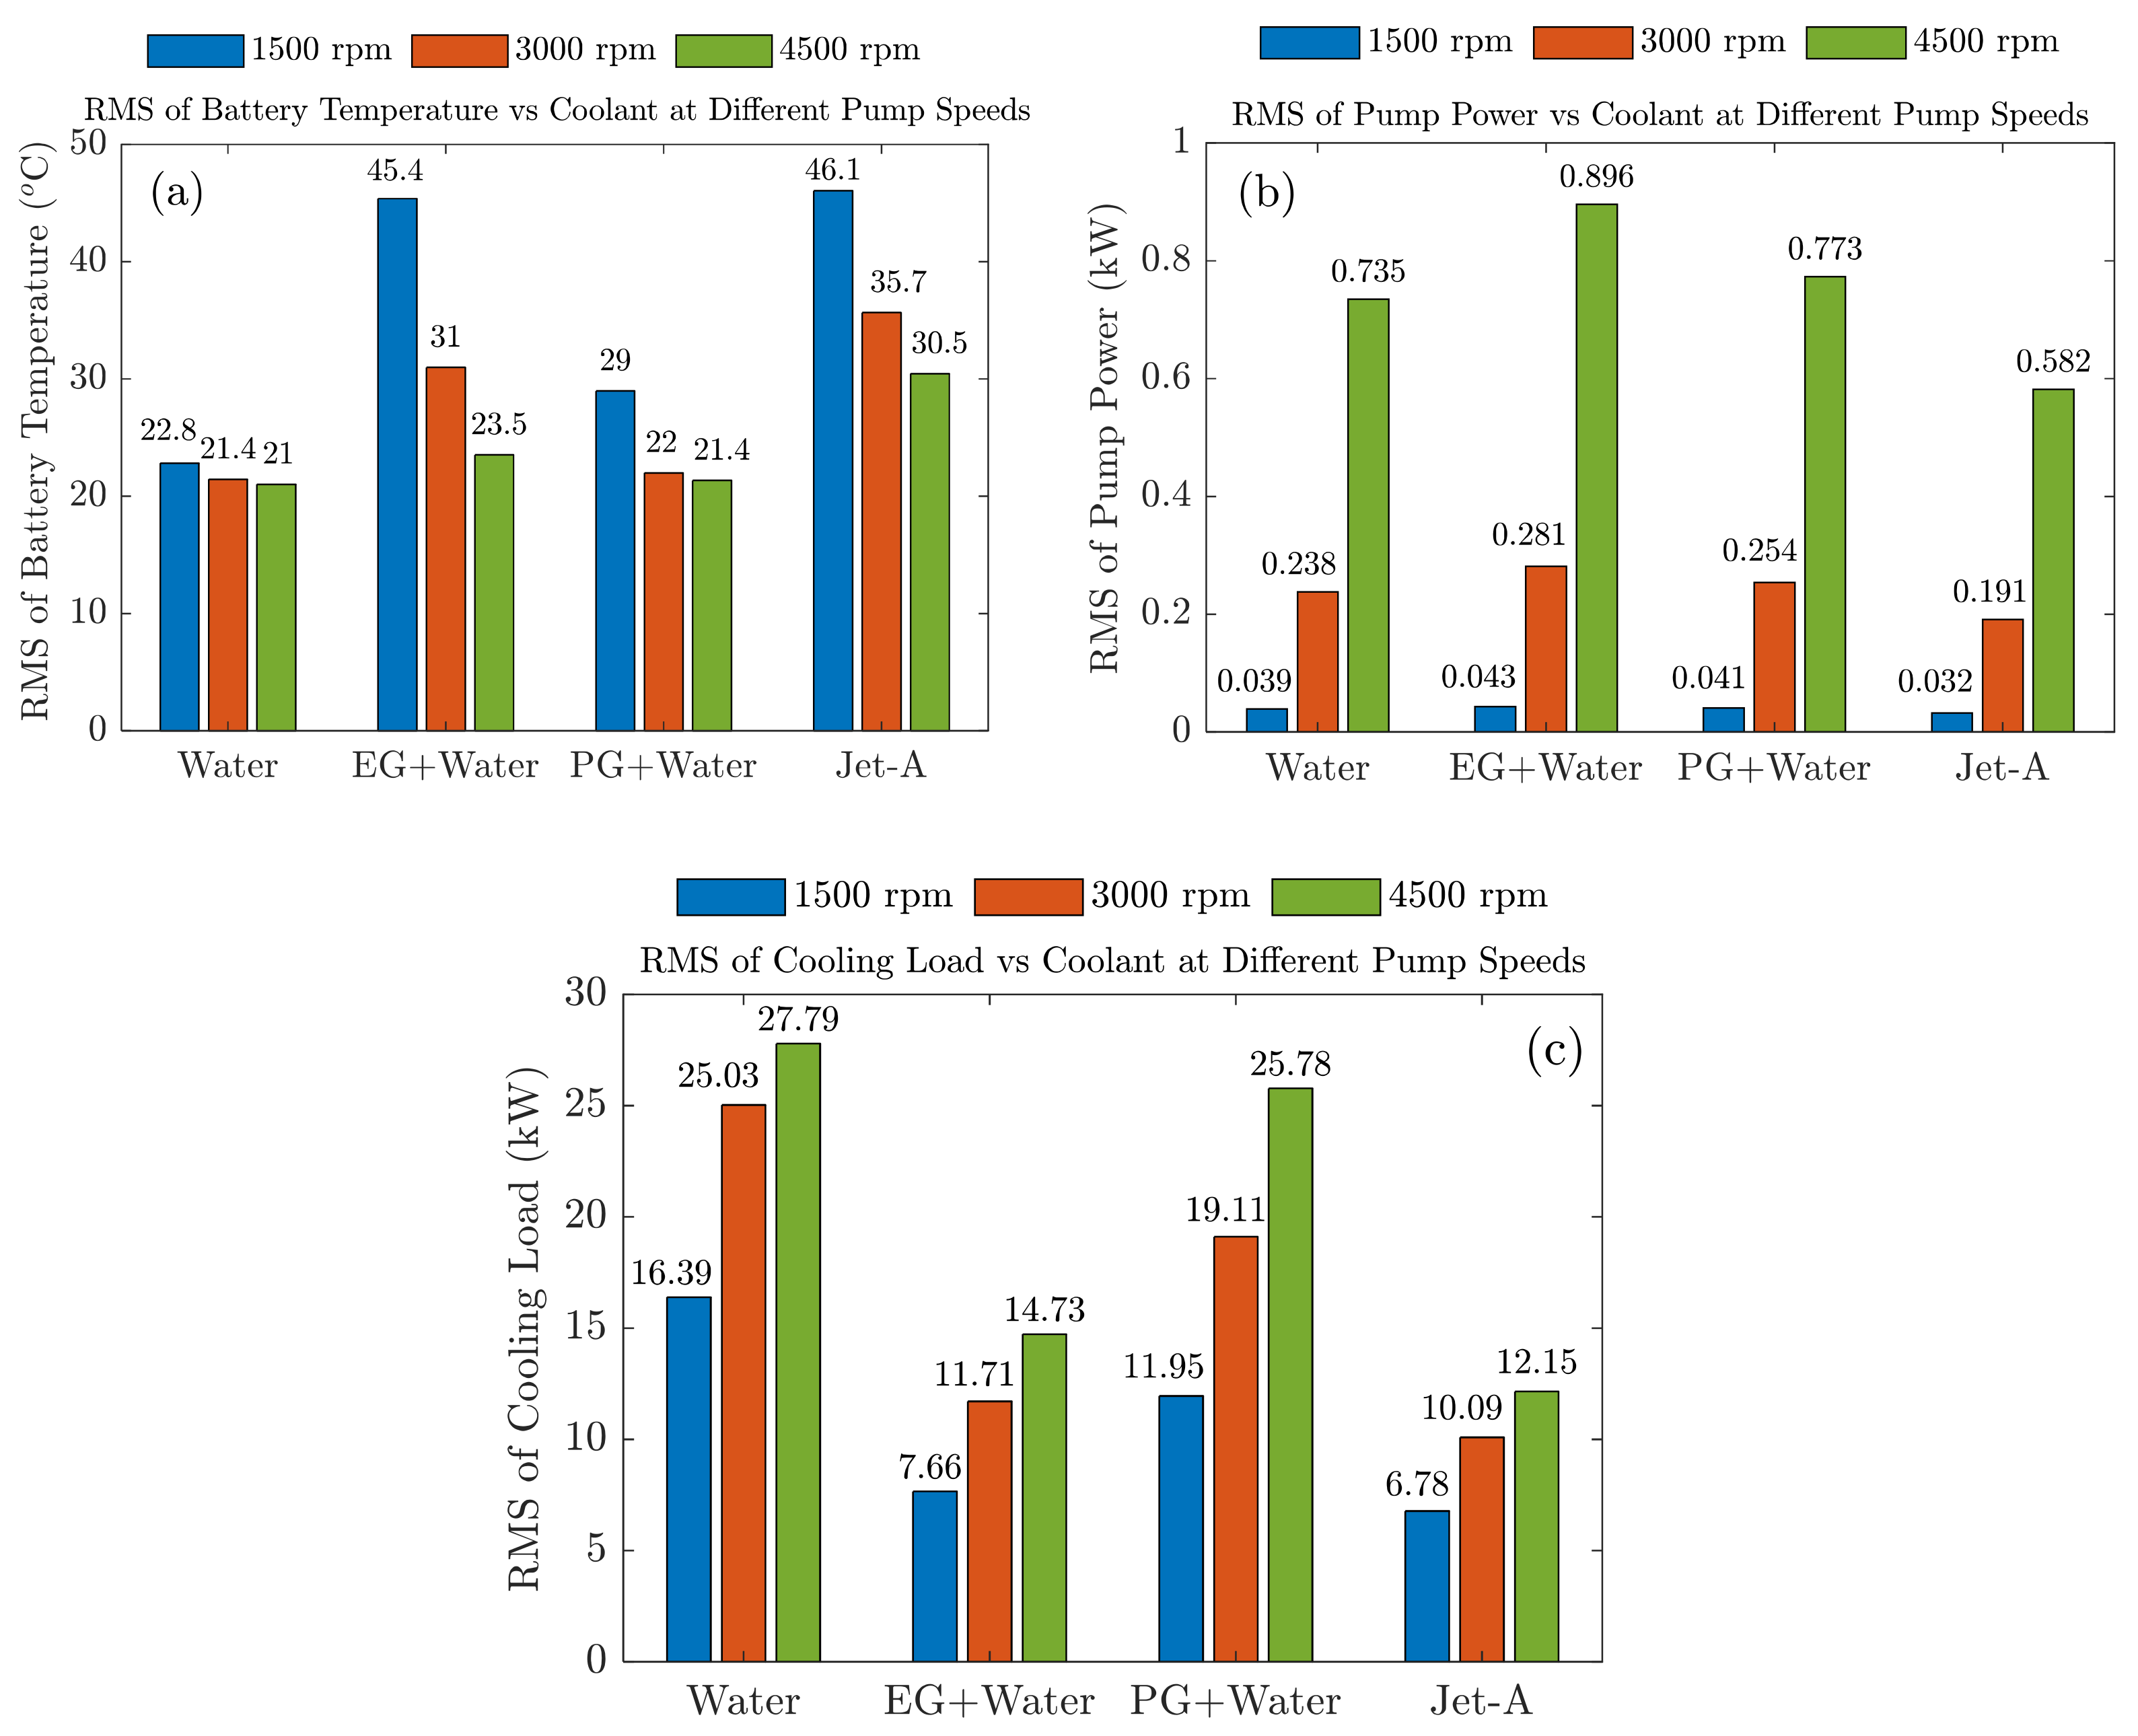
Under charging conditions, the RMS results in Figure 12 summarize how coolant type and pump speed jointly affect BTMS performance. As shown in Figure 12a, increasing pump speed reduces the RMS battery temperature for all coolants, but the extent of improvement differs considerably. Water maintains the lowest RMS temperature, decreasing from about 22.8 °C at 1500 rpm to nearly 21.0 °C at 4500 rpm. Propylene glycol–water follows closely, decreasing from about 29.0 °C to 21.4 °C. Ethylene glycol–water shows the strongest sensitivity to pump speed, with RMS temperature falling from about 45.4 °C to 23.5 °C, while Jet-A improves from about 46.1 °C to 30.5 °C but remains the weakest coolant overall.
This thermal improvement is accompanied by a marked increase in auxiliary demand. RMS pump power increases with pump speed, with higher values generally associated with the more viscous fluids. Water increases from about 0.039 to 0.735 kW, while ethylene glycol–water reaches the highest value, about 0.896 kW. Jet-A remains the least demanding hydraulically, peaking at about 0.582 kW. The RMS cooling load/heat rejection rate also increases with pump speed; water and propylene glycol–water show the highest values, increasing from 16.39 to 27.79 kW and from 11.95 to 25.78 kW, respectively. The lower values for ethylene glycol–water and Jet-A mainly reflect weaker heat extraction rather than better thermal performance.
These trends show that pump power and heat rejection demand should be interpreted separately. Pump power is mainly governed by hydraulic resistance and viscosity, whereas heat rejection demand reflects the amount of heat removed from the battery–coolant system. Accordingly, water removes more heat and imposes a higher heat rejection load, while glycol-based mixtures can require higher pump power because of their greater viscosity. Overall, the charging cycle results confirm that higher pump speed improves thermal regulation, but with increased hydraulic and heat rejection requirements.
Taken together, the results obtained under the FTP-75 driving cycle and the charging cycle show that BTMS performance is governed by the combined influence of coolant properties and pump speed. Across both operating conditions, water consistently provides the strongest temperature control, while the propylene glycol–water mixture offers the closest overall alternative. Ethylene glycol–water generally incurs the highest pumping penalty because of its larger viscosity, whereas Jet-A, despite its lower hydraulic resistance, shows limited heat removal capability and performs poorly under sustained charging. Increasing pump speed improves thermal regulation for all coolants, but the associated gains become progressively less significant relative to the increase in pump and cooling load/heat rejection rate, particularly at the highest speed. This trade-off is more severe during charging than during the FTP-75 cycle, owing to the continuous thermal load imposed on the battery.
To provide a simple quantitative indication of the pump speed trade-off, a marginal thermal–hydraulic benefit index was introduced:
η T P = T 1500 T 4500 P pump 4500 P pump 1500
where T is the RMS battery temperature and Ppump is the RMS hydraulic pump power. This index expresses the reduction in RMS battery temperature obtained per additional kW of hydraulic pump power when the pump speed is increased from 1500 to 4500 rpm. It is used only as a supplementary indicator of the pump speed effect within each coolant. It is not intended to replace the direct comparison of battery temperature, pump power, and cooling load/heat rejection demand.
Under charging conditions, water shows a limited additional temperature reduction at higher pump speed, from about 22.8 to 21.0 °C, while its RMS pump power increases from 0.039 to 0.735 kW. This gives a marginal benefit of approximately 2.6 °C/kW. Jet-A shows a larger apparent value because its RMS temperature decreases from about 46.1 to 30.5 °C over the same pump speed range. However, this value should not be used alone to rank coolant performance, since Jet-A remains thermally inferior in absolute battery temperature. Therefore, the index is used only to describe the marginal benefit of increasing pump speed within each coolant, while coolant selection is interpreted using the combined battery temperature, pump power, and heat rejection results.
Although water provides the strongest heat removal performance in the simulations, practical EV coolant selection cannot rely on thermal performance alone. Pure water has freezing and boiling limitations, may promote corrosion without suitable additives, and raises electrical safety concerns in leakage scenarios. Water–glycol mixtures extend the usable temperature range and improve practical robustness, but they also increase viscosity and pumping demand while reducing heat transfer capability. Therefore, water should be viewed as a thermal performance benchmark, whereas practical coolant selection should also consider freezing protection, boiling margin, corrosion inhibition, electrical safety, material compatibility, and auxiliary energy demand.

5. Conclusions

This study evaluated a liquid-cooled battery thermal management system under two representative operating conditions: the FTP-75 driving cycle and high-rate charging. A coupled thermo-hydraulic model was developed in MATLAB/Simulink to compare water, ethylene glycol–water, propylene glycol–water, and Jet-A aviation fuel under identical system architecture, boundary conditions, and pump operating speeds.
The results show that coolant thermophysical properties strongly influence both battery temperature and auxiliary energy demand. Water provided the strongest thermal regulation under all tested conditions. Under the FTP-75 cycle, it reduced the battery temperature from about 30 °C to approximately 21.2 °C at 1500 rpm and 20.6–20.8 °C at 4500 rpm. During charging, the coolant effect became more pronounced: at 1500 rpm, water maintained the battery temperature near 23 °C, whereas ethylene glycol–water and Jet-A allowed the temperature to rise to about 46–47 °C. Propylene glycol–water offered the closest overall alternative to water, particularly at medium and high pump speeds. The model predicts average battery pack temperature only; local maximum temperature, cell-to-cell uniformity, and three-dimensional thermal resistance require distributed electro-thermal or CFD analysis.
The improvement in thermal regulation was accompanied by higher auxiliary demand. Under charging conditions, the RMS pump power of water increased from about 0.039 kW at 1500 rpm to 0.735 kW at 4500 rpm, while the corresponding cooling load/heat rejection demand increased from 16.39 to 27.79 kW. These results indicate that increasing pump speed can improve temperature control, especially for weaker-performing coolants, but the additional thermal benefit becomes smaller at higher flow rates relative to the increase in hydraulic and heat rejection requirements.
These findings indicate that coolant selection in liquid-cooled BTMS should consider heat removal capability, pumping demand, and heat rejection requirement together. Within the present conditions, water represents the strongest thermal performance benchmark, while propylene glycol–water offers a more balanced alternative when auxiliary demand and practical coolant constraints are considered. The model should be interpreted as a system-level comparative simulation, not as a spatially resolved CFD, prototype-validated, or safety abuse model. It predicts average battery pack temperature under normal operating loads and does not resolve local temperature gradients, maximum cell temperature, detailed cold plate thermal resistance, thermal runaway, venting, gas generation, or failure propagation. Future work should include experimental validation using a matched BTMS prototype, together with CFD or distributed electro-thermal analysis where local thermal behavior or safety-limit assessment is required.

Author Contributions

Conceptualization, M.H.A. and M.A.A.A.; methodology, E.F.F.M.; software, E.F.F.M. and A.-H.M.; validation, M.H.A., A.-H.M. and M.M.; formal analysis, E.F.F.M.; investigation, M.M., E.F.F.M. and A.-H.M., resources, M.H.A.; data curation, E.F.F.M.; writing—original draft, M.H.A. and M.A.A.A., writing—review and editing, M.A.A.A., E.F.F.M., A.-H.M., M.M.M. and M.M.; visualization, M.M. and M.M.M.; supervision, M.H.A. and M.A.A.A.; project administration, M.H.A. All authors have read and agreed to the published version of the manuscript.

Funding

This research received no external funding.

Data Availability Statement

The original contributions presented in this study are included in the article’s material. Further inquiries can be directed to the corresponding author.

Conflicts of Interest

The authors declare no conflicts of interest.

References

  1. Parvizi, P.; Jalilian, M.; Amidi, A.M.; Zangeneh, M.R.; Riba, J.-R. From present innovations to future potential: The promising journey of lithium-ion batteries. Micromachines 2025, 16, 194. [Google Scholar] [CrossRef]
  2. Emadi, A.; Petrunic, J.G. Automotive industry and electrification. In Advanced Electric Drive Vehicles; CRC Press: Boca Raton, FL, USA, 2015; pp. 2–15. [Google Scholar] [CrossRef]
  3. Ralls, A.M.; Leong, K.; Clayton, J.; Fuelling, P.; Mercer, C.; Navarro, V.; Menezes, P.L. The role of lithium-ion batteries in the growing trend of electric vehicles. Materials 2023, 16, 6063. [Google Scholar] [CrossRef] [PubMed]
  4. Marecki, M. Lithium-Ion Battery Rightsizing Technologies for Future Road Transport Applications. Ph.D. Thesis, University of Nottingham, Nottingham, UK, 2023. [Google Scholar]
  5. Zeng, X.; Li, M.; Abd El-Hady, D.; Alshitari, W.; Al-Bogami, A.S.; Lu, J.; Amine, K. Commercialization of lithium battery technologies for electric vehicles. Adv. Energy Mater. 2019, 9, 1900161. [Google Scholar] [CrossRef]
  6. Chang, L.; Chen, W.; Mao, Z.; Huang, X.; Ren, T.; Zhang, Y.; Cai, Z. Experimental study on the effect of ambient temperature and discharge rate on the temperature field of prismatic batteries. J. Energy Storage 2023, 59, 106577. [Google Scholar] [CrossRef]
  7. Wang, Y.; Gao, Q.; Wang, G.; Lu, P.; Zhao, M.; Bao, W. A review on research status and key technologies of battery thermal management and its enhanced safety. Int. J. Energy Res. 2018, 42, 4008–4033. [Google Scholar] [CrossRef]
  8. Fayaz, H.; Afzal, A.; Samee, A.M.; Soudagar, M.E.M.; Akram, N.; Mujtaba, M.; Jilte, R.; Islam, M.T.; Ağbulut, Ü.; Saleel, C.A. Optimization of thermal and structural design in lithium-ion batteries to obtain energy efficient battery thermal management system (BTMS): A critical review. Arch. Comput. Methods Eng. 2022, 29, 129–194. [Google Scholar] [CrossRef]
  9. Shelly, T.J.; Weibel, J.A.; Ziviani, D.; Groll, E.A. Comparative analysis of battery electric vehicle thermal management systems under long-range drive cycles. Appl. Therm. Eng. 2021, 198, 117506. [Google Scholar] [CrossRef]
  10. Zhou, R.; Chen, Y.; Zhang, J.; Guo, P. Research progress in liquid cooling technologies to enhance the thermal management of LIBs. Mater. Adv. 2023, 4, 4011–4040. [Google Scholar] [CrossRef]
  11. Fan, Y.; Zhan, D.; Tan, X.; Lyu, P.; Rao, J. Optimization of cooling strategies for an electric vehicle in high-temperature environment. Appl. Therm. Eng. 2021, 195, 117088. [Google Scholar] [CrossRef]
  12. Akinlabi, A.H.; Solyali, D. Configuration, design, and optimization of air-cooled battery thermal management system for electric vehicles: A review. Renew. Sustain. Energy Rev. 2020, 125, 109815. [Google Scholar] [CrossRef]
  13. Zhang, W.; Liang, Z.; Wu, W.; Ling, G.; Ma, R. Design and optimization of a hybrid battery thermal management system for electric vehicle based on surrogate model. Int. J. Heat Mass Transf. 2021, 174, 121318. [Google Scholar] [CrossRef]
  14. Joshi, A.; Sharma, R.; Acharya, I.; Chitrakar, S.; Baral, B. Effect of graphene nanoplatelets induced ethylene glycol/water mixture (50: 50) fluid on lithium-battery cooling. Case Stud. Therm. Eng. 2024, 56, 104267. [Google Scholar] [CrossRef]
  15. Li, M.; Lu, J.; Chen, Z.; Amine, K. 30 years of lithium-ion batteries. Adv. Mater. 2018, 30, 1800561. [Google Scholar] [CrossRef]
  16. Kim, T.; Song, W.; Son, D.-Y.; Ono, L.K.; Qi, Y. Lithium-ion batteries: Outlook on present, future, and hybridized technologies. J. Mater. Chem. A 2019, 7, 2942–2964. [Google Scholar] [CrossRef]
  17. Li, Y.-Z.; Chang, K.-F.; Xu, J.-L. Temperature uniformity analysis and transient performance of space Li-ion battery pack under different thermoelectric coolers arrangement. J. Energy Storage 2024, 92, 112213. [Google Scholar] [CrossRef]
  18. Abdelati, M.H.; Makrahy, M.; Mokbel, E.F.F.; Matar, A.-H.; Kamel, M.; Abdelkareem, M.A.A. Combined Experimental, Statistical and CFD Study of the Thermal–Electrical Behavior of a LiFePO4 Battery Pack Under Varying Load and Cooling Conditions. Sustainability 2026, 18, 1279. [Google Scholar] [CrossRef]
  19. Kharabati, S.; Saedodin, S. A systematic review of thermal management techniques for electric vehicle batteries. J. Energy Storage 2024, 75, 109586. [Google Scholar] [CrossRef]
  20. Akkus, F.; Isik, M.Z. A review of thermal management systems of lithium-ion batteries used in electric vehicles. J. Traffic Transp. Eng. (Engl. Ed.) 2025, 12, 1763–1783. [Google Scholar]
  21. Murugan, M.; Elumalai, P.; Vijayakumar, K.; Babu, M.; Suresh Kumar, K.; Ganesh, M.; Kuang, L.; Prabhakar, S. A comprehensive review of thermal management methods and ideal system design for improved electric vehicle battery pack performance and safety. Energy Sci. Eng. 2025, 13, 1011–1036. [Google Scholar] [CrossRef]
  22. Abdelkareem, M.A.; Choy, Y.; Guo, Y.; Jing, X. Bio-inspired tridirectional energy harvesting system for efficient ultralow-frequency self-powered monitoring. Commun. Nonlinear Sci. Numer. Simul. 2025, 150, 108987. [Google Scholar] [CrossRef]
  23. Es-satte, M.; Afaynou, I.; Faraji, H.; Choukairy, K.; Regragui, I.; Amghar, K.; Boucetta, M.; Saadeddine, S.; Bourich, M. Phase change materials, bionic structures and artificial intelligence for lithium-ion battery thermal management: A comprehensive review. Int. Commun. Heat Mass Transf. 2026, 173, 110870. [Google Scholar] [CrossRef]
  24. Abdelkareem, M.A.; Jing, X.; Ali, M.K.A.; Choy, Y. Recent advances in vibration energy harvesting reinforced by bioinspired designs/structures. Smart Mater. Struct. 2025, 34, 083002. [Google Scholar] [CrossRef]
  25. Jhariya, M.; Dewangan, A.K.; Moinuddin, S.Q.; Kumar, S.; Ahmad, A.; Yadav, A.K. Research progress on efficient battery thermal management system (BTMs) for electric vehicles using composite phase change materials with liquid cooling and nanoadditives. J. Therm. Anal. Calorim. 2024, 149, 13653–13680. [Google Scholar] [CrossRef]
  26. Wei, L.; Zou, Y.; Cao, F.; Ma, Z.; Lu, Z.; Jin, L. An optimization study on the operating parameters of liquid cold plate for battery thermal management of electric vehicles. Energies 2022, 15, 9180. [Google Scholar] [CrossRef]
  27. Rabiei, M.; Gharehghani, A.; Andwari, A.M. Enhancement of battery thermal management system using a novel structure of hybrid liquid cold plate. Appl. Therm. Eng. 2023, 232, 121051. [Google Scholar] [CrossRef]
  28. Wu, C.; Ni, J.; Shi, X.; Huang, R. A new design of cooling plate for liquid-cooled battery thermal management system with variable heat transfer path. Appl. Therm. Eng. 2024, 239, 122107. [Google Scholar] [CrossRef]
  29. Niu, Z.-H.; Pang, K.-G.; Pang, B.-B.; Wang, S. Orthogonal experimental-based thermal management design and simulation optimization of a liquid-cooled battery module. Sci. Rep. 2025, 15, 33442. [Google Scholar] [CrossRef] [PubMed]
  30. Kalaf, O.; Solyali, D.; Asmael, M.; Zeeshan, Q.; Safaei, B.; Askir, A. Experimental and simulation study of liquid coolant battery thermal management system for electric vehicles: A review. Int. J. Energy Res. 2021, 45, 6495–6517. [Google Scholar] [CrossRef]
  31. Gümüş, M.H.; Sözen, A.; Kazancıoğlu, Ş. Effect of nanofluids on electric vehicle battery cooling system performance. J. Environ. Sci. Eng. Technol. 2024, 12, 17–27. [Google Scholar] [CrossRef]
  32. Chávez, M.D.; Sullayme, D.V.; Vidal, Y.S.; Salazar, J.V.; Canazas, J.; Diaz, C. Numerical Study on Thermal Management of Electric Vehicle Battery Cooling Modules Using Al2O3 Nanofluids. Int. J. Heat Technol. 2025, 43, 1–10. [Google Scholar] [CrossRef]
  33. Dhuchakallaya, I.; Saechan, P. Enhancing the cooling efficiency of the air cooling system for electric vehicle battery modules through liquid spray integration. J. Energy Storage 2023, 72, 108751. [Google Scholar] [CrossRef]
  34. Ramu, P.; Thangavel, V. The effects of fast and normal charging, driving cycle, and a 24-hour regional climate on the performance of electric vehicle batteries. J. Energy Storage 2023, 73, 108840. [Google Scholar] [CrossRef]
  35. Senol, M.; Bayram, I.S.; Naderi, Y.; Galloway, S. Electric vehicles under low temperatures: A review on battery performance, charging needs, and power grid impacts. IEEE Access 2023, 11, 39879–39912. [Google Scholar] [CrossRef]
  36. Akbarzadeh, M.; Jaguemont, J.; Kalogiannis, T.; Karimi, D.; He, J.; Jin, L.; Xie, P.; Van Mierlo, J.; Berecibar, M. A novel liquid cooling plate concept for thermal management of lithium-ion batteries in electric vehicles. Energy Convers. Manag. 2021, 231, 113862. [Google Scholar] [CrossRef]
  37. Huang, Y.; Wang, S.; Lu, Y.; Huang, R.; Yu, X. Study on a liquid cooled battery thermal management system pertaining to the transient regime. Appl. Therm. Eng. 2020, 180, 115793. [Google Scholar] [CrossRef]
  38. Wen, T.; Zhou, Z.; Zhang, Y.; Xu, X. Advances and Challenges in the Battery Thermal Management Systems of Electric Vehicles. Materials 2025, 18, 4718. [Google Scholar] [CrossRef] [PubMed]
  39. Li, J.; Zhu, Z. Battery Thermal Management Systems of Electric Vehicles. Master’s Thesis, Chalmers University of Technology, Gothenburg, Sweden, 2014. [Google Scholar]
  40. Tung, S.C.; Woydt, M.; Shah, R. Global insights on future trends of hybrid/EV driveline lubrication and thermal management. Front. Mech. Eng. 2020, 6, 571786. [Google Scholar] [CrossRef]
  41. Ahmad, H.; Dhamodharan, P.; Kim, S.C. Advances in cooling technologies for electric vehicle drive motors, reducers, and inverters: A comprehensive review. Energy Technol. 2025, 13, 2401691. [Google Scholar] [CrossRef]
Figure 1. Schematic representation of the battery thermal management system.
Sustainability 18 05529 g001
Figure 2. Temperature-dependent thermophysical properties of the investigated coolants: (a) dynamic viscosity and (b) thermal conductivity.
Sustainability 18 05529 g002
Figure 3. (a) Vehicle speed as a function of time under the FTP-75 driving cycle; (b) battery current response over time under the FTP-75 driving cycle.
Sustainability 18 05529 g003
Figure 4. (a) Battery temperature response under FTP-75 at 1500 rpm; (b) pump power variation under FTP-75 at 1500 rpm; (c) cooling load/heat rejection rate variation under FTP-75 at 1500 rpm.
Sustainability 18 05529 g004
Figure 5. (a) Battery temperature response under FTP-75 at 3000 rpm; (b) pump power variation under FTP-75 at 3000 rpm; (c) cooling load/heat rejection rate variation under FTP-75 at 3000 rpm.
Sustainability 18 05529 g005
Figure 6. (a) Battery temperature response under FTP-75 at 4500 rpm; (b) pump power variation under FTP-75 at 4500 rpm; (c) cooling load/heat rejection rate variation under FTP-75 at 4500 rpm.
Sustainability 18 05529 g006
Figure 7. RMS (a) battery temperature, (b) pump power, and (c) cooling load/heat rejection rate for the investigated coolants at 1500, 3000, and 4500 rpm under the FTP-75 driving cycle.
Sustainability 18 05529 g007
Figure 8. (a) Vehicle speed as a function of time under the charging cycle; (b) battery current response over time under the charging cycle.
Sustainability 18 05529 g008
Figure 9. (a) Battery temperature, (b) pump power, and (c) cooling load/heat rejection rate under the charging cycle at 1500 rpm.
Sustainability 18 05529 g009
Figure 10. (a) Battery temperature, (b) pump power, and (c) cooling load/heat rejection rate under the charging cycle at 3000 rpm.
Sustainability 18 05529 g010
Figure 11. (a) Battery temperature, (b) pump power, and (c) cooling load/heat rejection rate under the charging cycle at 4500 rpm.
Sustainability 18 05529 g011
Figure 12. (a) RMS battery temperature, (b) RMS pump power consumption, and (c) RMS cooling load/heat rejection rate requirement for the investigated coolants at pump speeds of 1500, 3000, and 4500 rpm under the charging cycle.
Sustainability 18 05529 g012
Table 1. Geometric variations across the thermal management architecture.
ComponentTotal Length (L)Hydraulic Diameter (Dh)Flow Area (A)
Primary Loop Pipes0.75 m2.5 cm4.9087 cm2
Cold Plate Channels1.5 m0.92 cm3 cm2
Interconnecting Pipes0.75 m2.5 cm4.9087 cm2
Disclaimer/Publisher’s Note: The statements, opinions and data contained in all publications are solely those of the individual author(s) and contributor(s) and not of MDPI and/or the editor(s). MDPI and/or the editor(s) disclaim responsibility for any injury to people or property resulting from any ideas, methods, instructions or products referred to in the content.