Article

Green Chemistry and Computational Energy Analysis for Sustainable Chitosan Production: A Case Study of Green Solvent and Water Management


by
Federico Lopez-Muñoz
1,
Luis Ricardez-Sandoval
2,
Viktor Oswaldo Cardenas-Concha
3,
Daniela S. Mainardi
4,
Arturo Gonzalez-Quiroga
5,
Angel Darío González-Delgado
6 and
Jeffrey Leon-Pulido
1,*
1
Faculty of Engineering, EAN University, St. 79 #11-45, El Nogal, Bogotá 110221, Colombia
2
Department of Chemical Engineering, University of Waterloo, Waterloo, ON N2L 3G1, Canada
3
School of Chemical Engineering Federal, University of São Paulo (UNIFESP), R. Sena Madureira, 1500-Vila Clementino, São Paulo 04021-001, SP, Brazil
4
Institute for Micromanufacturing, Chemical Engineering Louisiana Tech University, Ruston, LA 71272, USA
5
UREMA Research Unit, Mechanical Engineering Department, Universidad del Norte, Barranquilla 081007, Colombia
6
Nanomaterials and Computer Aided Process Engineering Research Group (NIPAC), Chemical Engineering Department, Faculty of Engineering, University of Cartagena, Cartagena 130015, Colombia
*
Author to whom correspondence should be addressed.
Sustainability 2026, 18(11), 5455; https://doi.org/10.3390/su18115455 (registering DOI)
Submission received: 22 April 2026 / Revised: 14 May 2026 / Accepted: 25 May 2026 / Published: 29 May 2026
(This article belongs to the Section Sustainable Engineering and Science)

Abstract

The environmental performance of chitosan production is evaluated through a rigorous computational comparison between traditional thermochemical deacetylation and innovative green synthesis pathways utilizing Deep Eutectic Solvents (DES). Implementation of the Waste Reduction (WAR) algorithm facilitates the quantification of the Potential Environmental Impact (PEI) across eight toxicological and ecotoxicological categories, providing a systematic benchmark for process sustainability. While the conventional route, characterized by the intensive consumption of HCl and NaOH, generates a substantial environmental burden of 1.37 × 10⁷ PEI/ton, the optimized green architecture leveraging a choline chloride:ethylene glycol (ChCl:EG) system achieves a radical reduction to 2.25 × 10⁴ PEI/ton. This 99.8% decrease in PEI is primarily driven by the mitigation of Human Toxicity Potential (HTP) and Acidification Potential (AP) through the substitution of corrosive mineral acids and volatile organics with biodegradable, low-vapor-pressure alternatives. These findings substantiate the integration of DES-mediated biorefineries as a high-efficiency strategy for the valorization of marine waste into high-purity biopolymers, aligning with the requirements for industrial process intensification and circular bioeconomy standards.

1. Introduction

Green chemistry is a concept that, since the end of the last century, has intervened in various industrial sectors to transform processes and products, obtaining sustainable and profitable results [1]. Therefore, one objective within this is to have raw materials of sustainable origin that are valuable for different industrial sectors. Among the different materials appearing in the last decade, chitosan stands out for various reasons. First, the source of this material is the industrial waste from the shrimp industry. Chitosan comes from chitin deacetylation, an essential part of the shrimp exoskeleton structure, representing between 35 and 40% of its composition [2]. After a series of chemical reactions and physical processes, chitin is extracted from the shrimp shell. After this process, chitosan can be used in numerous industries depending on its deacetylation degree and molecular weight. For instance, a high deacetylation degree (>70%) is optimal for the pharmaceutical and medical industries. In those fields, the polymer is used for its hemostatic, anticoagulant, bioavailability, and immunologic properties [3,4]. Another important application is wastewater treatment, where the formation of chelates allows the extraction of heavy metals and some organic material [5,6,7,8]. Additionally, other industries where chitosan is already used are agriculture and food packaging.
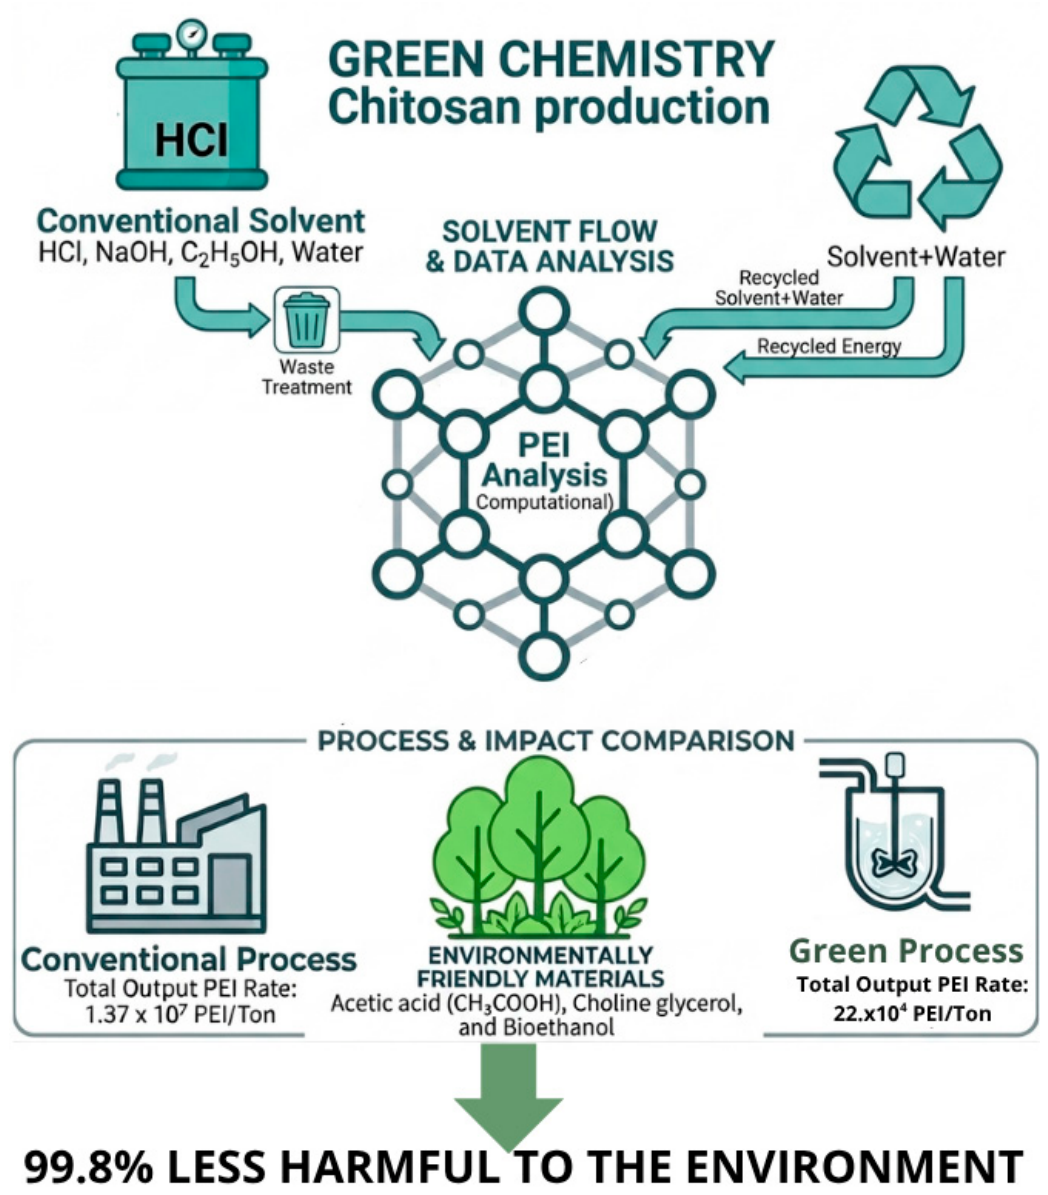
The principles of green chemistry were established with the intention of providing a sustainable framework, encompassing objectives such as prevention, atom economy, reduced synthesis of hazardous substances, design of safer products and chemical pathways, use of safer solvents and auxiliary agents, designs for energy efficiency, utilization of renewable feedstocks, reduction of derivatives, catalysis, and real-time contamination analysis and prevention thereof, as well as the development of inherently safer chemical products to prevent accidents [9,10]. From these concepts, novel products and processes have emerged, including green solvents like bioethanol or biomethanol [11,12]. Additionally, organic acids, ketones, platform chemicals, and other similar products have experienced a notable increase in both production and applications [13,14]. The implementation of these concepts is well-received across various industries, including the automotive sector, where advancements in process efficiencies and material extraction are evident, along with the emergence of new fuels like bioethanol or hydrogen [15]. Furthermore, these concepts find application in agricultural processes, such as the use of environmentally friendly pesticides or mechanical mechanisms to mitigate the impacts of farming activities [16,17]. Other sectors where the adoption of these principles holds significance include aerospace, energy, cosmetics, pharmaceuticals, and many others [18]. However, among the various models for understanding, visualizing, and quantifying the environmental impact of industrial processes, the Waste Reduction Algorithm stands out. This algorithm identifies the flows of both material and energy, both input and output, in a process, providing a comprehensive view to assess potential environmental impacts [19,20]. This approach is defined as the impact that the evaluated chemical or process would have on the environment. The algorithm has been utilized in numerous articles, such as the evaluation of methyl ethyl ketone production from secondary butyl alcohol [21,22]. In this study, different scenarios were assessed to identify optimal recycling points for the product. Moreover, the Waste Reduction Algorithm has been applied in processes like coal gasification with carbon capture and storage [23,24]. Six cases using different carbon capture techniques were evaluated, including gas-liquid absorption with physical or chemical solvents and chemical looping with calcium and iron oxygen carriers. Four environmental impact indicators were calculated and compared: the total rate of impact output, the total impact output per mass of products, the total rate of impact generation, and the total impact generated per mass of product. The results of the environmental assessment reveal that chemical looping cycles show great promise compared to gas-liquid absorption processes [23]. A sensitivity analysis was conducted to examine the influence of the carbon capture rate on the environmental impact indicators. Therefore, this algorithm allows for the identification of processes and components with greater influence on the PEI and enables the comparison of processes or cases for decision-making and process improvement as show in Figure 1.
The process development followed the environmental assessment methodology established in recent literature, integrating simulations performed via the WAR GUI software vs 1.0.17 according to the protocols defined by its developers [19,25]. Subsequently, the simulation outputs were analyzed and benchmarked against the performance data of the conventional process reported by Meramo (2020) [26]. This comparison facilitated a rigorous evaluation of the potential environmental impact reductions achieved in the current design.

Conventional Chitosan Synthesis Process

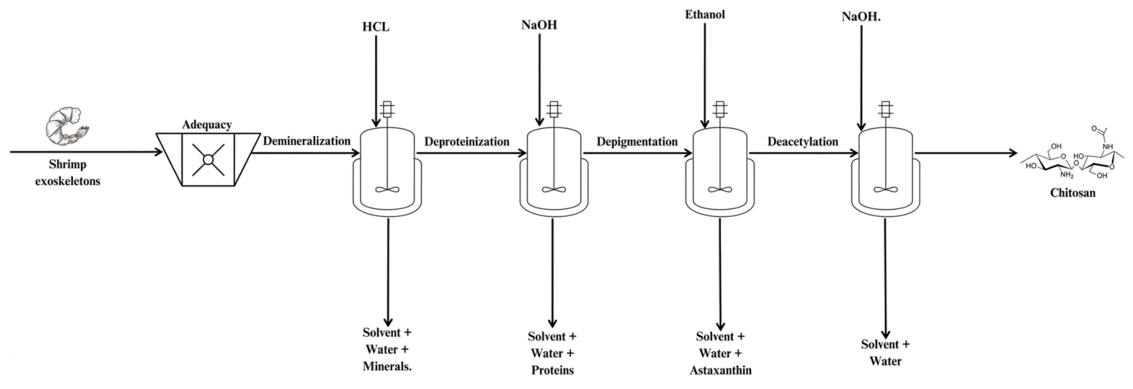
The conventional route to chitosan production is made up of five stages. In the first stage, the exoskeletons must be separated from the shrimp industry leftovers, separating organic remains such as meat and lipids. Subsequently, the particle size must be reduced in addition to drying the material [27]. In the second stage, astaxanthin must be extracted. This material is a carotenoid belonging to the phytochemical series of terpenes. This is done using ethanol and a temperature between 40–50 °C [28,29]. The third stage requires separating the proteins from the shrimp exoskeleton, for which HCL is the solvent that is typically used [30]. Before obtaining the chitin, the proteins must be eliminated utilizing different solvents, for which NaOH [31,32] is among the most utilized. Finally, the chitin obtained from the previous stage using NaOH is deacetylated, obtaining chitosan as shown in Figure 2 [33,34,35].
Through the conventional process, several aqueous residue flows are not used, in addition to containing harmful solvents. This work presents a new green route to chitosan production that eliminates the aforementioned existing drawbacks of the conventional production process.

2. Materials and Methods

For the development of this process, the methodology presented by Meramo [26] was followed, which includes the simulation carried out using the WAR GUI simulator, following the instructions of the software developer [19] Subsequently, the results were analyzed and compared with those obtained in the traditional process analyzed by Meramo [26].

2.1. Simulation and Potential Environmental Impact (PEI)

The use of simulations lowers the costs related to design, as simulations can be used to rapidly screen candidate materials and processes, so that experimental efforts can be limited to the candidates deemed most promising by simulations. This work utilizes Aspen Plus® V14 and the WAR GUI to implement the Waste Reduction Algorithm, a powerful tool for assessing the environmental impact of industrial processes based on effluent mass and energy requirements. The Waste Reduction Algorithm evaluates various industrial processes, considering their environmental implications. The cumulative impact in each category results in a final Pollution Environmental Impact (PEI) value, either on a mass basis (per kg of products) or a time basis (per hour), as detailed by Arteaga-Díaz et al. (2019) [36]. The PEI serves as a metric to measure the potential effects of different compound emissions on the environment. This assessment involves comparing exit and generation rates, employing a methodology that incorporates eight parameters categorized for thorough analysis.
This model was designed to characterize the flow dynamics and the generation of potential environmental impacts within a chemical process. Its formulation integrates material and energy balances with environmental impact data for chemical species and energy, establishing a conservation framework for the potential environmental impact (PEI) associated with the process. The algorithm is governed by a conservation equation 1, which quantifies the balance of environmental impacts in the system [37,38].
d l s y t d t = I i n I o u t + I g e n
where
l s y t : The PEI content within the process.
I i n : The PEI input rate.
I o u t : The PEI output rate.
I g e n : The rate of PEI generation within the system due to chemical reactions or other mechanisms.
The input and output PEIs are defined as follows Equations (1) and (2):
I i n = i j k α i M J ( i n ) x k , j γ k , j S
I o u t = i j k α i M J ( o u t ) x k , j γ k , j S
α i : A relative weighting factor for environmental category i .
M J ( i n ) and M J ( o u t ) x k , j : The mass flow rates of the inlet and outlet streams, respectively.
x k , j : The mass fraction of chemical k in stream j .
γ k , j S : The specific PEI of chemical k associated with environmental impact category i .
The PEI γ k , j S depends on metrics that assess its impact across various categories. The γ k , j S values are standardized relative to the mean value of all chemicals within each impact category, facilitating the comparison of their relative contributions.
Under steady-state conditions, Equations (4) and (5) are as follows:
d l s y t d t = 0
I g e n = I i n I o u t
Thus, the PEI generation I g e n   can be calculated as follow in Equation (6):
I g e n = i j k α i M J ( o u t ) x k , j γ k , j S i j k α i M J ( i n ) x k , j γ k , j S
The environmental performance of the process was evaluated through toxicological and atmospheric impact categories, following the methodology described by Meramo [26]. The first category incorporates crucial parameters to assess potential health and ecological risks. Human Toxicity Potential by Ingestion (HTPI) evaluates risks associated with the consumption of contaminated products, while Human Toxicity Potential by Inhalation or Dermal Exposure (HTPE) examines hazards for individuals exposed through air or skin contact. Additionally, Terrestrial Toxicity Potential (TTP) and Aquatic Toxicity Potential (ATP) assess deleterious effects on land-based and water ecosystems, respectively, providing insights into the potential harm to flora, fauna, and aquatic life. The second category focuses on atmospheric effects, including Global Warming Potential (GWP), Ozone-Depleting Potential (ODP), Photochemical Oxidation Potential (PCOP), and Acidification Potential (AP). In this study, the GWP analysis adopts a cradle-to-gate approach, integrating the impacts associated with energy generation alongside the carbon footprint of chemical reagent production. This comprehensive boundary is essential for a rigorous comparison, as it accounts for the fact that while acetic acid synthesis typically exhibits a higher GWP than HCl production, its selection is justified by its superior performance in toxicological categories and lower overall environmental persistence. Furthermore, PCOP evaluates contributions to smog formation and air quality degradation, while AP gauges the risks of acid rain and the subsequent acidification of natural environments.
This assessment was conducted by integrating Aspen Plus® with the WAR GUI simulator, using high-fidelity physical and thermodynamic data to determine the Potential Environmental Impact (PEI) of the process. Aspen Plus® enables data regression and sensitivity analysis, providing a robust computational foundation that reduces the need for extensive experimentation. The WAR algorithm then processes these data to compare the environmental wear of the proposed design against conventional benchmarks in chemical engineering, including an evaluation of three primary energy sources: oil, gas, and coal. This methodology aligns with green chemistry principles by addressing the environmental hazards posed by traditional solvents. For instance, the uncontrolled release of strong acids like HCl can cause acute acidification of water bodies and soils, altering nutrient availability and detrimental pH levels. Similarly, the improper disposal of NaOH can lead to extreme alkalinity in aquifers, significantly impacting biodiversity and inhibiting essential biological processes such as seed germination and nutrient absorption [39,40,41,42]. The implementation of the Waste Reduction Algorithm (WAR) enabled the quantification of the Potential Environmental Impact (PEI) across eight impact categories, requiring the manual incorporation of the biopolymers into the software database. For chitin (CAS 1398-61-4), a molecular weight of 161.16 g/mol was specified, whereas for chitosan (CAS 9012-76-4), a molecular weight of 161.00 g/mol was used.
Regarding biological safety parameters, toxicity data were incorporated into the model, including an oral LD50 value greater than 10,000 mg/kg for chitosan and an LC50 value of 1.73 mg/L for rainbow trout (Oncorhynchus mykiss) [43,44]. Furthermore, atmospheric impact indicators such as GWP and ODP were assigned values of zero due to the solid-state nature, biodegradability, and negligible atmospheric reactivity of these biopolymers.

2.2. Simulation-Based Green Chitosan Production

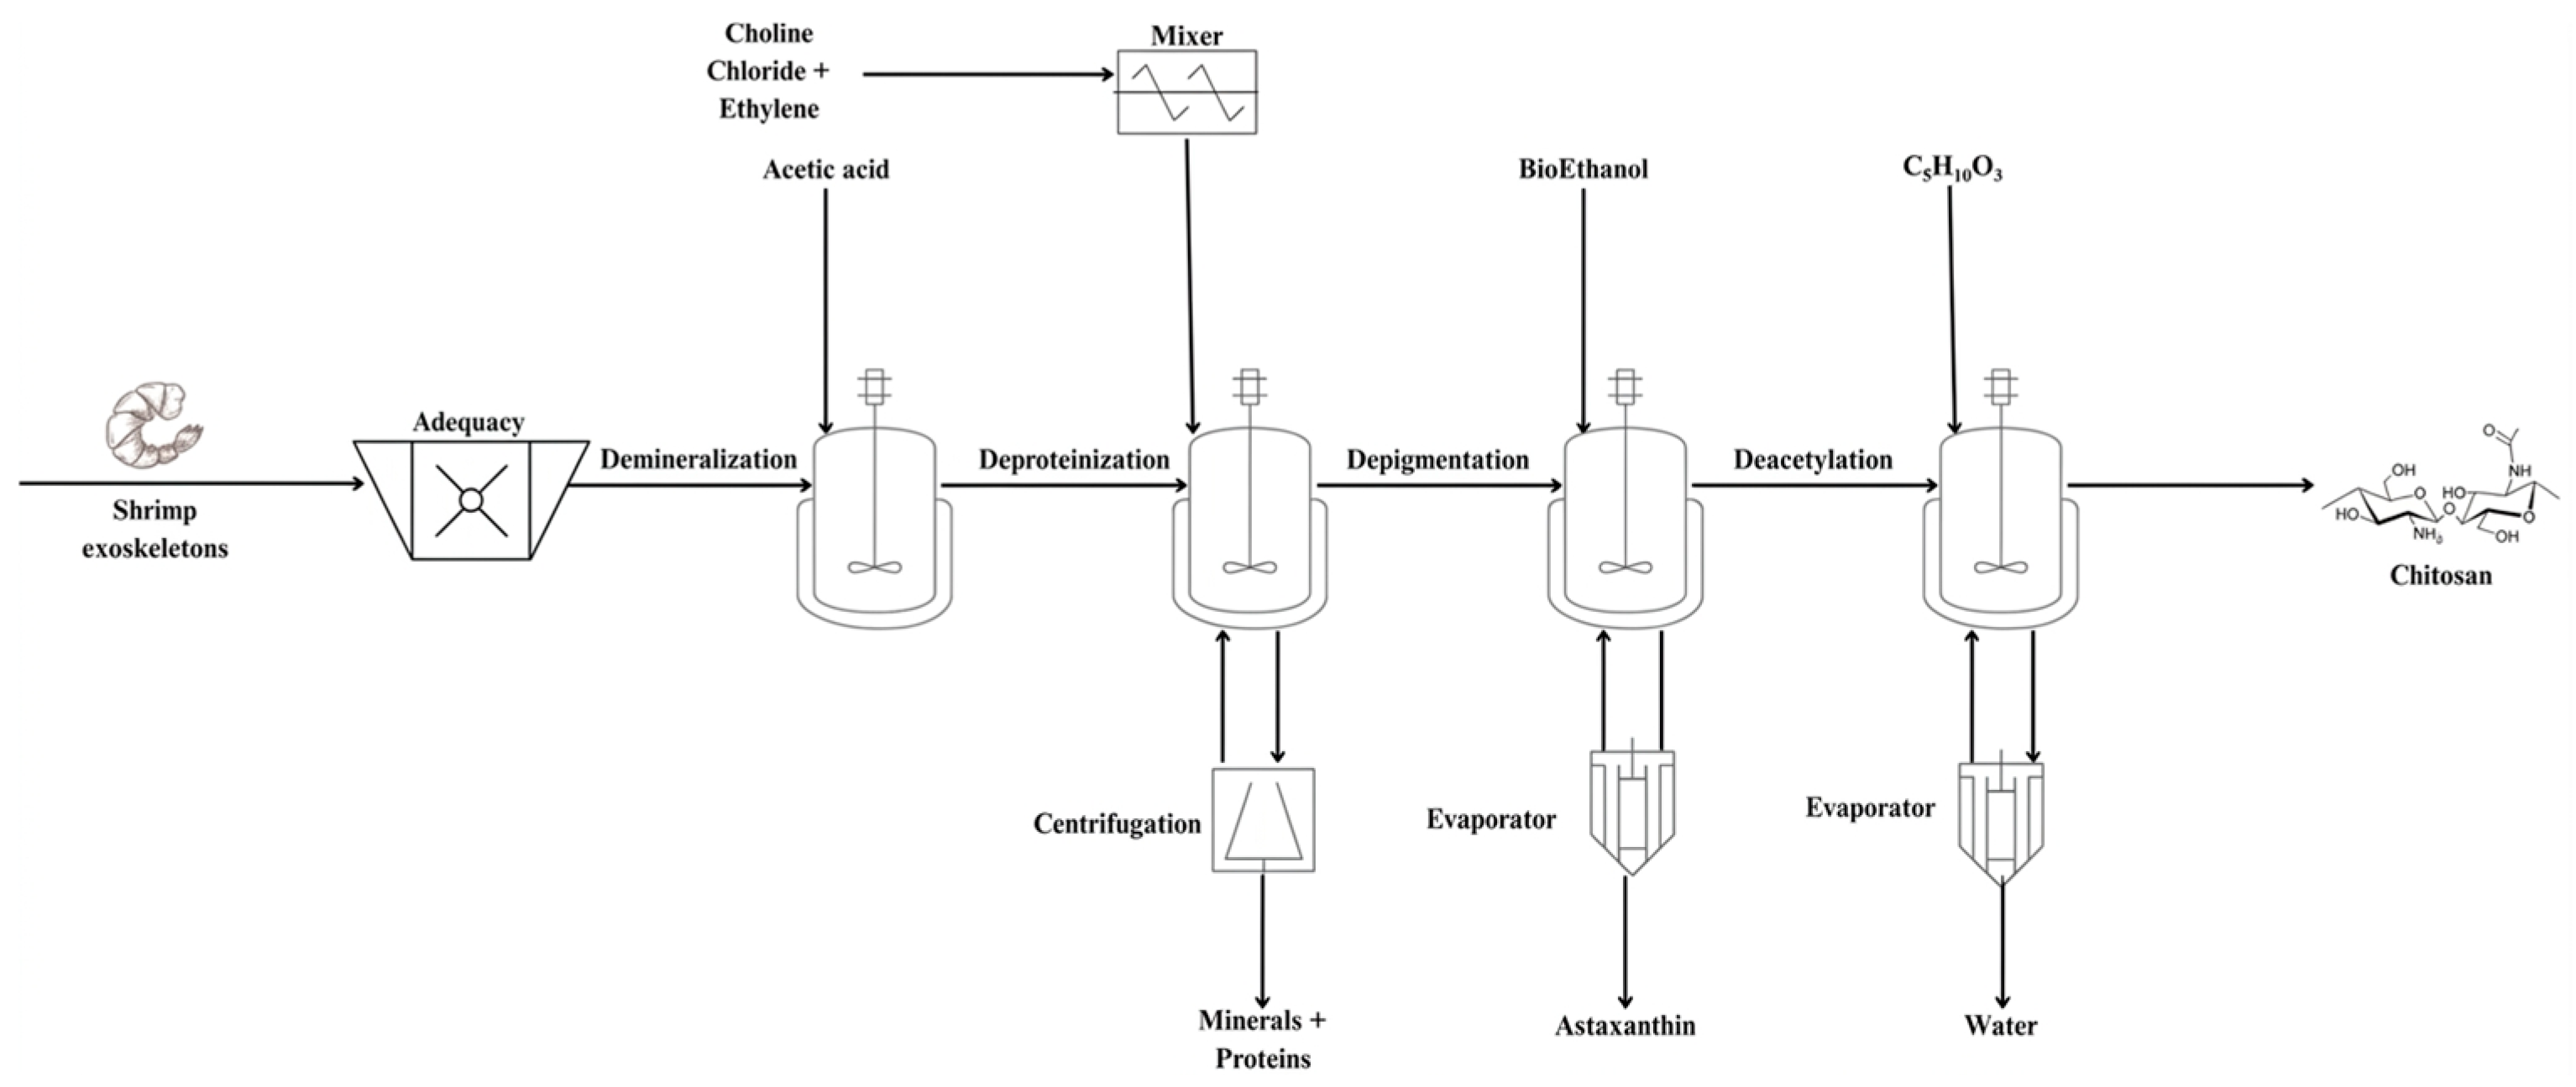
The primary objective of this study is to develop an alternative production route that eliminates the use of hazardous solvents in chitosan manufacturing, replacing them with green alternatives at each stage of the process. In the demineralization stage, hydrochloric acid (HCl) is replaced by acetic acid. Beyond being a less toxic and corrosive alternative, acetic acid offers a significant cost advantage, being approximately 30–40% less expensive than industrial-grade HCl in specific regional markets, while providing higher selectivity in removing inorganic matter from organic matrices [45,46]. For the deproteinization step, the combination of choline chloride and ethylene glycol is utilized. This deep eutectic solvent (DES) system leverages choline’s hydrogen-transfer capabilities to break peptide bonds more efficiently than traditional alkaline treatments, resulting in a reduction in the overall environmental footprint by minimizing hazardous wastewater generation. Regarding the purification and deacetylation stages, the methodology incorporates bioethanol and glycerol as sustainable substitutes. Bioethanol is presented as a superior economic option compared to synthetic ethanol; comparative techno-economic analyses indicate that utilizing pelleted biomass can achieve lower minimum ethanol selling prices (MESP), particularly when integrated with agricultural waste streams [47]. For deacetylation, glycerol serves as an effective reducing agent for the removal of acetyl groups. Although glycerol offers a safer profile than NaOH, it currently involves higher operating costs; based on 2024 pricing data from Sigma-Aldrich, the cost per kilogram of NaOH is approximately 87% higher than that of crude glycerol, though the high-purity glycerol required for specific reactions can shift the economic balance in large-scale operations. Ultimately, the proposed green route is designed as a near-zero-waste system. As illustrated in the process configuration, every output stream is treated as a potential product or intermediate rather than waste [47,48]. Finally, regarding deacetylation, it works because of the use of glycerol as a reducing agent that helps to transfer hydrogens and eliminate acetyl groups. This alternative is safer than NaOH, although it comes with higher operating costs for 2024, amounting to 87% more than that of glycerol, as per the weight value from Sigma-Aldrich. For its part, the green route is a system without waste streams, and therefore, at each output of the process, a product stream is considered, as shown in Figure 3 [49,50]. This approach prioritizes the recirculation of solvents between stages, which not only enhances the atom economy of the process but also reduces raw material consumption by up to 60% compared to open-loop conventional designs. By aligning with these circular economy principles, the process ensures that the valorization of agro-industrial byproducts is both environmentally benign and technically viable.
The selection of the deep eutectic solvent (DES) system comprising choline chloride and ethylene glycol (ChCl:EG) in a 1:2 molar ratio was based on a technical screening analysis focused on mass transfer efficiency and thermal stability [51]. Unlike other common DES, ChCl:EG exhibits a significantly lower viscosity (approx. 36.7 mPa·s at 30 °C) compared to the ChCl:urea system (>600 mPa·s), which promotes a faster solvent diffusion rate into the shrimp exoskeleton matrix and enhances protein dissolution efficiency by approximately 18% [52,53]. Furthermore, the chemical stability of ethylene glycol as a hydrogen bond donor (HBD) allows for operation within a broader thermal range (80–120 °C) without the thermal decomposition characteristic of urea, which typically initiates at 133 °C via biuret formation [54]. This stability ensures greater reproducibility in simulation conditions under the NRTL model, yielding a high-quality biopolymer with a deacetylation degree of 85.36 ± 1.04% and a viscosity-average molecular weight (Mv) of 30,874 g/mol [55].
Table 1 enabling extraction of data from various streams. The objective was to produce 807.1 kg/h of chitosan, alongside 6506.9 kg/h of minerals, proteins, and 29.5 kg/h of astaxanthin. According to Cuiyun Liu [56], the deacetylation process achieved a chitosan deacetylation degree of up to 85.36 ± 1.04%. The viscosity-average molecular weight (Mv) of the chitosan produced was 30,874 ± 1123 g/mol under optimized conditions. Incorporating glycerol into chitosan films resulted in surfaces that were more homogeneous and hydrophilic, enhancing wettability. Higher concentrations of glycerol (up to 25%) also increased the flexibility of the chitosan films, with glycerol interacting via hydrogen bonding, influencing molecular mobility and structural arrangement within the films [57] Table 1.
The simulation of the chitosan biorefinery was developed using the Aspen Plus software under a steady-state model to optimize calculation speed and validate mass and energy balances. The system consists of 27 unit operations, including washing, centrifugation, cooling, condensation, and evaporation stages. The design was scaled to process 6507 kg/h of shrimp exoskeletons, resulting in a net production of 807.1 kg/h of high-purity chitosan [49]. This scale enables the evaluation of the industrial performance of the process under a “zero-waste” architecture, where outlet streams are treated as valuable products or recirculated within the system.
From a thermodynamic standpoint, the NRTL (Non-Random Two-Liquid) activity coefficient model was selected due to its accuracy in calculating the properties of systems containing complex mixtures of polar and nonpolar components, such as deep eutectic solvents and the organic acids employed [71]. For handling solid phases, the SOLIDS property package was used, which allows the estimation of properties for nonconventional components not available in standard databases, such as chitin, chitosan, minerals, and proteins [71]. This method is essential for rigorously modeling solid–liquid interactions in the reactors by using specific heat capacity, enthalpy, and vapor pressure data for these biopolymers. Regarding equipment configuration, the demineralization and deacetylation reactors were modeled as stoichiometric reactors (RStoic). Critical operating parameters were established, including a 98% conversion for demineralization (using acetic acid) and an 80% conversion for chitin deacetylation. The modeling of Deep Eutectic Solvents, specifically the choline chloride:ethylene glycol (1:2) system, was carried out using a pseudo-component approach to overcome their absence from standard databases. The critical properties of the precursors were estimated using the modified Lydersen–Joback–Reid (LJR) method and combined through the Lee–Kesler mixing rule, yielding values such as a critical temperature (T(C)) of 601.99 K and a critical pressure (P(C)) of 40.40 bar [72]. To represent the negligible volatility of these solvents, the extended Antoine equation was modified by assigning a value of −1016 to the parameter C1i and setting the parameters C2i, C3i, and C5i to zero, thereby ensuring that the simulator treats the DES as a nonvolatile substance under process conditions [73].
The entire process operates under atmospheric pressure conditions, and the drying operations were simulated as shortcut heat exchangers using hot air at 200 °C to ensure moisture removal without compromising the thermal stability of the polymer. In addition, the deproteinization and depigmentation stages were technically specified as flash separators for the recovery of by-products such as astaxanthin. Finally, it is important to clarify in the manuscript that this technical configuration and the simulation settings are the same as those previously reported and validated by Federico Lopez Muñoz et al. (2023) [49], which guarantees the reliability of the baseline data for subsequent exergy and environmental sustainability analyses.

3. Results

With the simulation results, the data of the different currents are entered into the WAR® Algorithm, and additional data of some components must be extracted from the literature or safety data sheets. The environmental evaluation was carried out considering three cases, which depend on whether the energy source is coal, gas, or oil. Considering these results, the different output PEI and the generated PEI were extracted. To generate this algorithm, it is necessary to provide a series of inputs. Firstly, data on streams from Aspen Plus® is introduced into the WAR® algorithm, defining them as either inlet streams, product outlet streams, or waste outlet streams. Each component must be sourced from a database, although certain components like chitosan or chitin need to be created within the database. This requires extracting data from literature sources such as molecular weight, CAS number, oral LD50 (HTPI and TTP), OSHA TWA PEL (HTPE), fathead minnow LC50 (ATP), Global Warming Potential (GWP), Ozone Depletion Potential (ODP), Photochemical Oxidation Potential (PCOP), and Acidification Potential (AP). These data were sourced from literature. Additionally, the program requires the energy demand for the process, which was calculated based on the energy required at each stage of the process as generated by Aspen Plus®.

Environmental Results

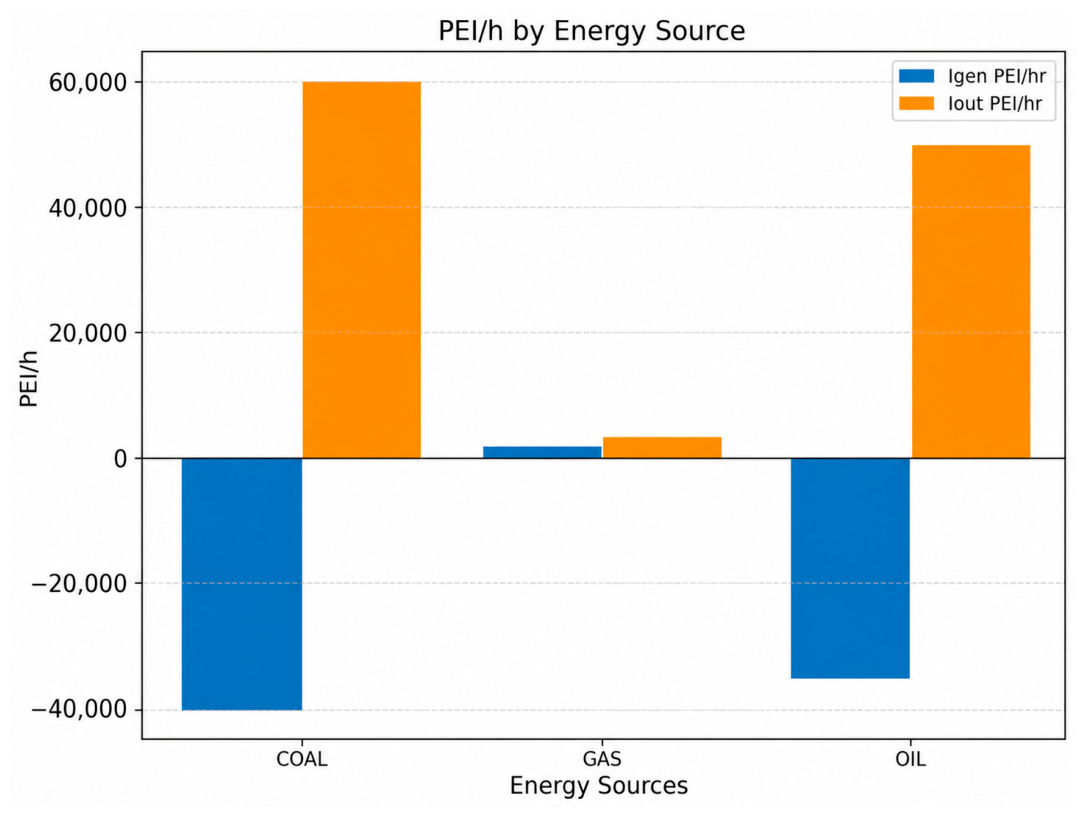
In its macro aspect, the environmental analysis reveals the total Potential Environmental Impact (PEI) generated and the output PEI, as shown in Figure 4. Only in the case of using gas was a positive PEI generated.
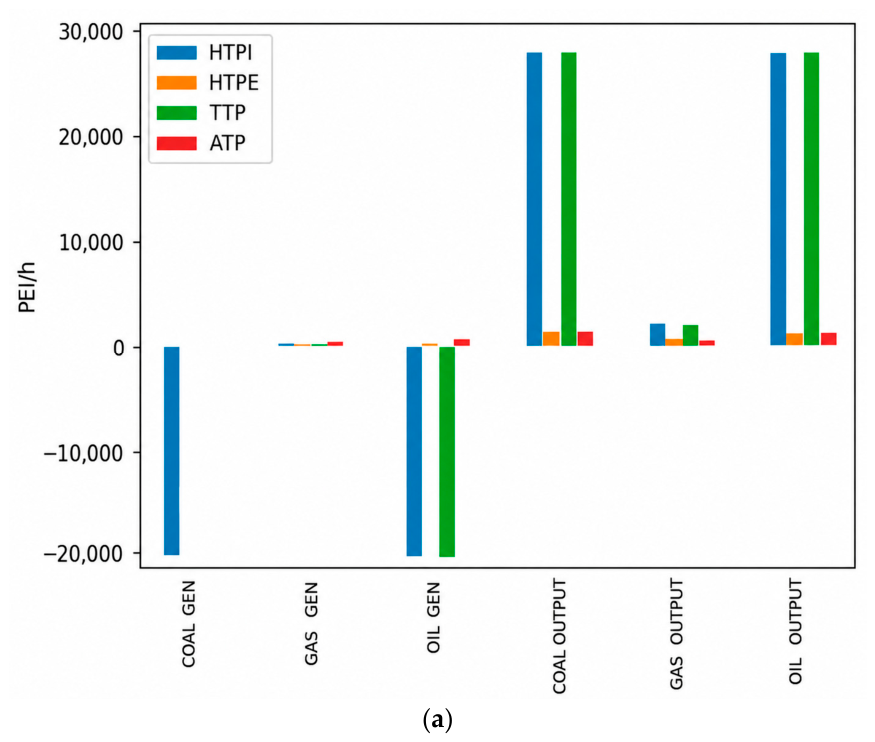
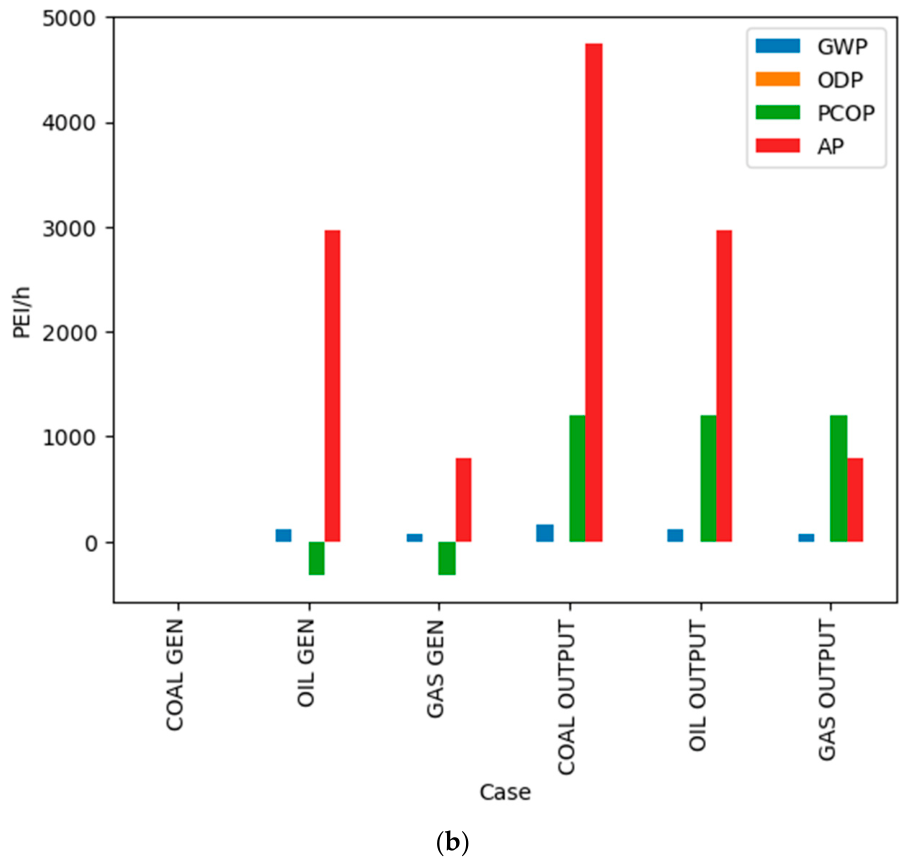
Of the total PEI, the toxicological section is divided into possible damage to humans and the ecosystem. Therefore, in Figure 5a, the input and output PEI are reported. On the other hand, the atmospheric impact is recorded according to the global impact and the regional impact (Figure 5b).
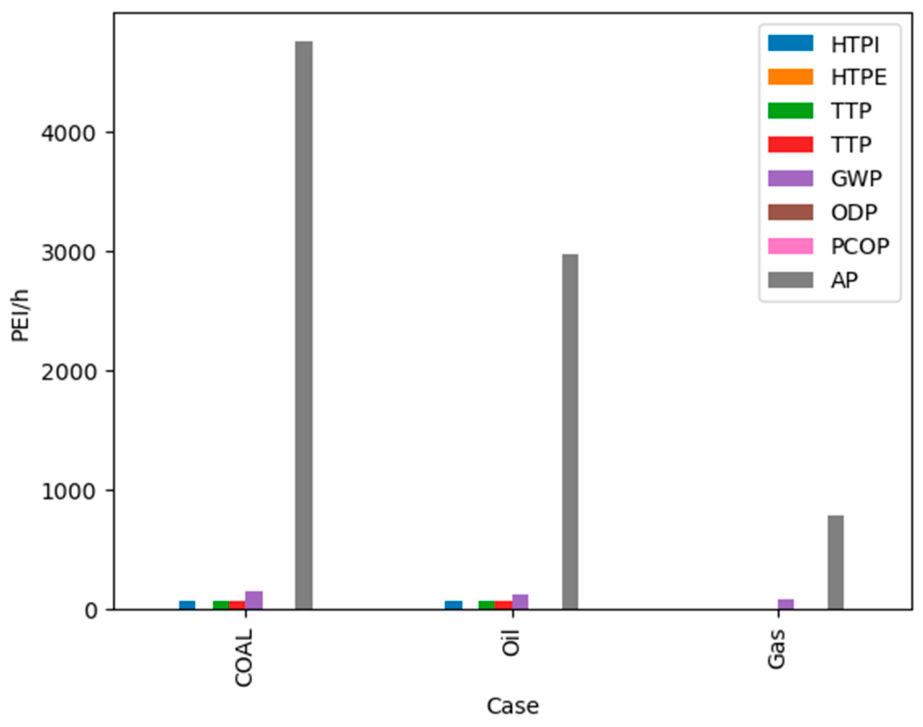
Additionally, within any process, there is an environmental burden resulting from the energy used. Therefore, it is necessary to calculate PEI according to the type of energy used. In this case, it is simulated employing the three types of energy sources found in the simulator show in Figure 6.
In the introduction section, the definitions of PEI are established. This allows for a comparative evaluation between the generated PEI and the output PEI. If a result is negative, it indicates that the output of the process product is less polluting than the input. Conversely, a positive result suggests that the output products are mostly more polluting than the reagents used in the process. This comparison is then applied to the three studied cases to determine which of them is the least polluting. Consequently, the lower the PEI value, the lower the impact of the respective process. Figure 4 illustrates that among the three cases, coal has the highest PEI output at 64,850, followed by oil at 60,490, and gas at 8030. Notably, in terms of PEI generation, only gas yields a positive value of 3341, while both coal and oil result in negative PEIs, specifically −38,790 and −43,160, respectively.
These findings indicate that gas, despite its positive PEI generation, is significantly less impactful overall compared to coal and oil. The negative PEI for coal and oil suggests that their processes involve substantial recycling or mitigation measures that partially offset their high outputs. However, their absolute PEI values still render them the least favorable options. Delving deeper into factors related to the toxicology of the process, as depicted in Figure 5a, it becomes evident that across all three cases, the primary toxicological impact stems from HTPI, followed by TTP. In the cases of using coal or oil, the PEI/h output is relatively high compared to gas. However, when considering the overall impacts, the primary determinant is HTPI, indicating that in the event of an accidental release of components, the result is approximately 0.028 PEI/kg. The impact of solvent exchange is evident in this scenario. Despite the presented quantities, solvents can act as contaminants, although not due to their inherent properties. For instance, comparing the LD50 (median lethal dose), HCl has a value of 230 mg/kg, whereas acetic acid has about 3500 mg/kg. In terms of atmospheric impact, as depicted in Figure 5b, AP must be considered. Although it constitutes less than 10% of the total PEI/h generated or output from the process, it represents over 73% of the atmospheric impact. It is worth noting that for the gas and oil case, coal generation is lower than the other two scenarios. In the atmospheric impact, two observations arise. Firstly, the high AP suggests a potential for acid rain generation. Secondly, energy sources act as constant contributors, making PCOP the second-highest factor in PEI/h in the atmospheric segment, resulting in a constant production of smog in any of the cases. By contrast, parameters such as Global Warming Potential (GWP) and Ozone Depletion Potential (ODP) have minimal influence, suggesting that these processes have negligible direct impacts on global warming and ozone layer depletion. This underscores the need for targeted strategies to address AP and PCOP in industrial processes. Factors like GWP and ODP have minimal to no influence on the atmosphere, indicating no impact on ozone depletion. In the analysis of available energy sources, as depicted in Figure 6, it is evident that the primary impact is attributed to AP, particularly in the case of coal (PEI/h), followed by oil (2970 PEI/h) and gas (789 PEI/h). In the conclusive examination of the energy balance, it is affirmed that the most environmentally friendly option would be utilizing gas as an energy source, showcasing a 597% reduction in PEI/h compared to coal. Considering atmospheric impact, where the toxicological section has a minimal effect (less than 300 PEI/h), a substantial generation of the AP factor is observed, especially in the cases of coal and oil, with 4750 and 2970 PEI/h, respectively. This underscores the importance of considering environmental impact mitigation through energy source selection. Despite the process’s intention to minimize its environmental footprint, it becomes clear that this is most effectively achieved through gas utilization, as it consistently exhibits the lowest regional impact across all three analyses. Both oil and coal usage contribute to a high PEI/h of AP, favoring the potential generation of acid rain. Extrapolating these findings to the Colombian context, natural gas emerges as the most suitable primary energy source for minimizing environmental impacts. However, the study also underscores the potential benefits of exploring alternative fuels, such as lignocellulosic biomass. Biomass-based energy sources not only diversify the energy mix but also align with sustainability objectives by utilizing renewable resources and reducing dependency on fossil fuels. This approach would further decrease the acidification and toxicological impacts observed in conventional processes and also emphasizes the need for integrated environmental and economic analyses. While gas presents significant environmental advantages, its economic feasibility must be evaluated alongside other sustainable options. Additionally, process optimization should focus on minimizing residual impacts, such as acid rain generation, through innovative technologies and solvent recycling strategies.

4. Discussion

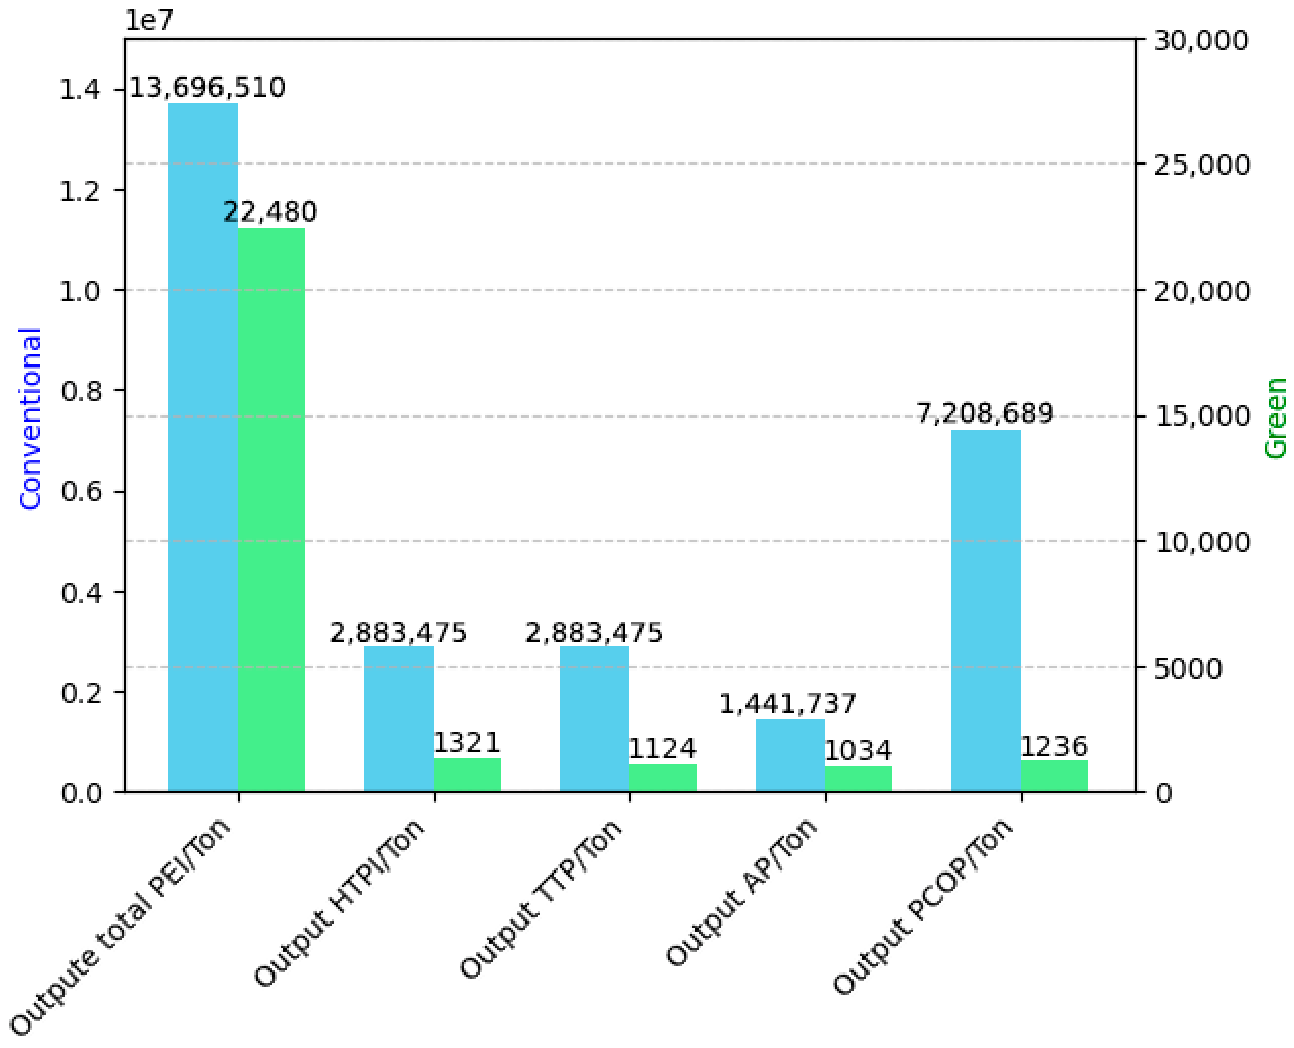
Meramo-Hurtado [26] introduces a comparable methodology that effectively simulates the conventional chitosan production process through an environmental impact assessment using the WAR® simulator. The study evaluates the impact outputs across various categories, comparing them on a per-ton basis of chitosan production. The conventional process generates 12,152 tons of chitosan annually, and these results were meticulously compared with those of the green simulation, as illustrated in Figure 7. Despite achieving higher production rates, the PEI per ton of chitosan is significantly lower in the green process compared to the conventional one, particularly when natural gas is used as the energy source. The green process demonstrates a 99.8% reduction in emissions for categories such as HTPI, TTP, AP, and PCOP compared to the conventional method (Table 2).
This highlights the green process as a substantially more sustainable alternative. While the environmental benefits of the green process are evident, it is essential to evaluate its economic feasibility comprehensively. Table actors such as operating costs, solvent recovery efficiency, and energy requirements must be scrutinized to determine the process’s overall viability Figure 7. Moreover, potential improvements in process efficiency, such as optimizing solvent usage and integrating renewable energy sources, could further enhance the sustainability and cost-effectiveness of the green approach. Future studies should address these aspects to ensure that the green process can be adopted on an industrial scale without compromising its environmental and economic benefits. Plus, there is a need for integrated environmental and economic analyses. While gas presents significant environmental advantages, its economic feasibility must be evaluated alongside other sustainable options. Additionally, process optimization should focus on minimizing residual impacts, such as acid rain generation, through innovative technologies and solvent recycling strategies.
The evaluation highlights the significant environmental benefits of utilizing gas over coal and oil, particularly in reducing acidification and toxicity impacts. The study reinforces the importance of addressing key parameters such as AP and HTPI in designing sustainable processes. Future research should prioritize exploring alternative energy sources, process innovations, and advanced mitigation measures to achieve greater environmental and economic sustainability in industrial applications.
Nevertheless, from a strictly economic perspective, the profitability of chitosan production depends on the volatility of industrial input prices and the maturity of regional biorefineries. In the Americas, particularly in countries with strong biofuel industries such as Brazil, the United States, and Colombia, crude glycerol (approx. USD 0.25–0.40/kg) emerges as a disruptive alternative to sodium hydroxide (USD 0.60–0.85/kg). Sodium hydroxide production is electrochemically energy-intensive, and its price has shown a 15% annual increase in Europe due to electricity grid costs. Furthermore, although acetic acid (USD 0.70–0.95/kg) has a higher procurement cost than hydrochloric acid (USD 0.18–0.45/kg), the simulated real savings of 30–40% from using acetic acid are justified by lower capital expenditures (CAPEX) for corrosion protection and reduced effluent treatment costs. In the European Union, effluent disposal is subject to chemical discharge taxes under the REACH regulation. Deep eutectic solvents (DES) such as choline chloride are widely available on both continents due to their massive use in the animal feed industry, ensuring a stable supply at prices between USD 1.10 and 1.60/kg. Together with a solvent recovery rate exceeding 85%, this optimizes the cost per operating cycle compared to conventional open-loop routes. By contrasting the performance of the ChCl:EG system with alternatives such as ChCl:urea and ChCl:glycerol, critical advantages in process controllability were identified. While ChCl:glycerol typically requires longer residence times to achieve deacetylation degrees (DD) above 80%, the use of ChCl:EG in this study enabled a DD of 85.36 ± 1.04% under optimized conditions. This enhanced reactivity is attributed to the ability of ethylene glycol to stabilize transition states during the removal of acetyl groups, offering more precise control over molecular weight (Mv ~ 30,874 g/mol) compared to urea-based systems, where side reactions can degrade the polymeric chain [74]. These findings position the proposed pathway as a necessary evolution relative to schemes recently reported by Wang et al. [56] where the integration of green chemistry and environmental impact assessment via the WAR algorithm demonstrates a 99.8% reduction in total PEI.
From a strictly economic perspective, the profitability of chitosan production depends on the volatility of industrial input prices and the maturity of regional biorefineries. In the Americas, particularly in countries with strong biofuel industries such as Brazil, the United States, and Colombia, crude glycerol (approx. USD 0.25–0.40/kg) emerges as a disruptive alternative to sodium hydroxide (USD 0.60–0.85/kg) [75]. Sodium hydroxide production is electrochemically energy-intensive, and its price has shown a 15% annual increase in Europe due to electricity grid costs. Furthermore, although acetic acid (USD 0.70–0.95/kg) has a higher procurement cost than hydrochloric acid (USD 0.18–0.45/kg), the simulated real savings of 30–40% from using acetic acid are justified by lower capital expenditures (CAPEX) for corrosion protection and reduced effluent treatment costs [76,77]. In the European Union, effluent disposal is subject to chemical discharge taxes under the REACH regulation. Deep eutectic solvents (DES) such as choline chloride are widely available on both continents due to their massive use in the animal feed industry, ensuring a stable supply at prices between USD 1.10 and 1.60/kg, as shown in Table 3 [78].

5. Conclusions

The conventional production of chitosan, although effective in yield, poses significant environmental challenges due to the use of hazardous solvents like HCl and NaOH and excessive waste generation. This study presents a green production route that addresses these challenges through the integration of environmentally friendly solvents such as acetic acid, bioethanol, and glycerol and the incorporation of water regeneration and recycling systems. The proposed green process achieves an 80% chitosan conversion rate and aligns with the principles of green chemistry by significantly reducing the toxicological and ecological impacts. Simulation results using the Waste Reduction Algorithm (WAR) demonstrate that the green process reduces the Potential Environmental Impact (PEI) by 99.8% per ton of chitosan when compared to the conventional process. Furthermore, the process modeling in Aspen Plus® highlights its technical feasibility, with a production capacity of 807 kg/h. Key toxicological and atmospheric impacts, such as Human Toxicity Potential by Ingestion (HTPI) and Acidification Potential (AP), were reduced by 37.5% and 65.8%, respectively, demonstrating significant environmental improvements. The adoption of natural gas as the primary energy source further reduced the Global Warming Potential (GWP) by 98.4%, making it the most sustainable energy option. Despite these advancements, the study underscores the need for further research on economic feasibility and scalability. Exploring alternative renewable energy sources, such as lignocellulosic biomass, and optimizing solvent recovery efficiency will be crucial for achieving a more sustainable and cost-effective industrial application. This study provides a strong foundation for implementing green chemistry principles in the chitosan production industry, offering a pathway toward reduced environmental impact, improved process sustainability, and alignment with global sustainability goals.

Author Contributions

Conceptualization, F.L.-M. and J.L.-P.; methodology, F.L.-M. and J.L.-P.; software, F.L.-M., A.G.-Q., and J.L.-P.; validation, V.O.C.-C., D.S.M., A.D.G.-D., and J.L.-P.; formal analysis, L.R.-S., V.O.C.-C., D.S.M., and J.L.-P.; investigation, F.L.-M. and J.L.-P.; resources, L.R.-S., A.D.G.-D., and J.L.-P.; data curation, F.L.-M., L.R.-S., V.O.C.-C., D.S.M., A.G.-Q., A.D.G.-D., and J.L.-P.; writing—original draft, F.L.-M., D.S.M., A.G.-Q., A.D.G.-D., and J.L.-P.; writing—review and editing, F.L.-M., D.S.M., and J.L.-P.; visualization, F.L.-M., L.R.-S., A.D.G.-D., and J.L.-P.; supervision, F.L.-M., L.R.-S., V.O.C.-C., D.S.M., A.G.-Q., and J.L.-P.; project administration, L.R.-S., V.O.C.-C., D.S.M., A.G.-Q., A.D.G.-D., and J.L.-P.; funding acquisition, V.O.C.-C., A.G.-Q., and J.L.-P. All authors have read and agreed to the published version of the manuscript.

Funding

This research received no external funding.

Institutional Review Board Statement

Not applicable.

Informed Consent Statement

Not applicable.

Data Availability Statement

The original contributions presented in this study are included in the article. Further inquiries can be directed to the corresponding author.

Acknowledgments

The authors thank EAN University for providing support to perform this work and Universidad del Norte, Waterloo University, and Louisiana Tech University for collaboration.

Conflicts of Interest

The authors declare no conflicts of interest.

References

  1. Zuin, V.G.; Stahl, A.M.; Zanotti, K.; Segatto, M.L. Green and sustainable chemistry in Latin America: Which type of research is going on? And for what? Curr. Opin. Green Sustain. Chem. 2020, 25, 100379. [Google Scholar] [CrossRef]
  2. Lv, J.; Lv, X.; Ma, M.; Oh, D.H.; Jiang, Z.; Fu, X. Chitin and chitin-based biomaterials: A review of advances in processing and food applications. Carbohydr. Polym. 2023, 299, 120142. [Google Scholar] [CrossRef]
  3. Orrego, C.; Salgado, N. Green Logistics in Chitin/Chitosan Industry. In Green Supply Chains: Applications in Agroindustries; Universidad Nacional de Colombia: Bogotá, Colombia, 2014; pp. 27–45. Available online: https://www.researchgate.net/publication/299290637_GREEN_LOGISTICS_IN_CHITINCHITOSAN_INDUSTRY (accessed on 5 February 2023).
  4. Concha, V.O.C.; Timóteo, L.; Duarte, L.A.N.; Bahú, J.O.; Munoz, F.L.; Silva, A.P.; Lodi, L.; Severino, P.; León-Pulido, J.; Souto, E.B. Properties, characterization and biomedical applications of polyvinylidene fluoride (PVDF): A review. J. Mater. Sci. 2024, 59, 14185–14204. [Google Scholar] [CrossRef]
  5. Bailey, S.E.; Olin, T.J.; Bricka, R.M.; Adrian, D.D. A review of potentially low-cost sorbents for heavy metals. Water Res. 1999, 33, 2469–2479. [Google Scholar] [CrossRef]
  6. Pillai, C.K.S.; Paul, W.; Sharma, C.P. Chitin and chitosan polymers: Chemistry, solubility and fiber formation. Prog. Polym. Sci. 2009, 34, 641–678. [Google Scholar] [CrossRef]
  7. Rinaudo, M. Chitin and chitosan: Properties and applications. Prog. Polym. Sci. 2006, 31, 603–632. [Google Scholar] [CrossRef]
  8. Zhang, W.; Khan, A.; Ezati, P.; Priyadarshi, R.; Sani, M.A.; Rathod, N.B.; Goksen, G.; Rhim, J.-W. Advances in sustainable food packaging applications of chitosan/polyvinyl alcohol blend films. Food Chem. 2024, 443, 138506. [Google Scholar] [CrossRef]
  9. Anastas, P.; Eghbali, N. Green Chemistry: Principles and Practise. Chem. Soc. Rev. 2010, 29, 301–312. [Google Scholar] [CrossRef]
  10. Pommeret, A.; Yu, X.; Zhang, L. Stringency of environmental policy in China: When pollution drives bribery. Econ. Model. 2022, 117, 106048. [Google Scholar] [CrossRef]
  11. Kane, A.O.; Pellergini, V.O.A.; Santo, M.C.E.; Ngom, B.D.; García, J.M.; Acevedo, A.; Erazzú, L.E.; Polikarpov, I. Evaluating the Potential of Culms from Sugarcane and Energy Cane Varieties Grown in Argentina for Second-Generation Ethanol Production. Waste Biomass Valorization 2022, 13, 329–343. [Google Scholar] [CrossRef]
  12. Mneimneh, F.; Ghazzawi, H.; Hejjeh, M.A.; Manganelli, M.; Ramakrishna, S. Roadmap to Achieving Sustainable Development via Green Hydrogen. Energies 2023, 16, 1368. [Google Scholar] [CrossRef]
  13. Yilan, G.; Cordella, M.; Morone, P. Evaluating and managing the sustainability of investments in green and sustainable chemistry: An overview of sustainable finance approaches and tools. Curr. Opin. Green Sustain. Chem. 2022, 36, 100635. [Google Scholar] [CrossRef]
  14. Ray, P.; Smith, C.; Simon, G.P.; Saito, K. Renewable green platform chemicals for polymers. Molecules 2017, 22, 376. [Google Scholar] [CrossRef] [PubMed]
  15. Rivas, D.F.; Cintas, P. On an intensification factor for green chemistry and engineering: The value of an operationally simple decision-making tool in process assessment. Sustain. Chem. Pharm. 2022, 27, 100651. [Google Scholar] [CrossRef]
  16. Ojea, E.; Martin-Ortega, J. Understanding the economic value of water ecosystem services from tropical forests: A systematic review for South and Central America. J. For. Econ. 2015, 21, 97–106. [Google Scholar] [CrossRef]
  17. Olabi, A.; Abdelkareem, M.A.; Mahmoud, M.S.; Elsaid, K.; Obaideen, K.; Rezk, H.; Wilberforce, T.; Eisa, T.; Chae, K.-J.; Sayed, E.T. Green hydrogen: Pathways, roadmap, and role in achieving sustainable development goals. Chem. Eng. Res. Des. 2023, 177, 664–687. [Google Scholar] [CrossRef]
  18. Mammino, L. Green chemistry: Chemistry working for sustainability. In Green Chemistry and Computational Chemistry; Elsevier: Amsterdam, The Netherlands, 2022; pp. 41–54. [Google Scholar] [CrossRef]
  19. Young, D.M.; Cabezas, H. Designing sustainable processes with simulation: The waste reduction (WAR) algorithm. Comput. Chem. Eng. 1999, 23, 1477–1491. [Google Scholar] [CrossRef]
  20. Al-Sakkari, E.G.; Ragab, A.; Ali, M.; Dagdougui, H.; Boffito, D.C.; Amazouz, M. Learn-To-Design: Reinforcement Learning-Assisted Chemical Process Optimization. Syst. Control Trans. 2024, 3, 245–252. [Google Scholar] [CrossRef]
  21. Cabezas, H.; Bare, J.C.; Mallick, S.K. Pollution prevention with chemical process simulators: The generalized waste reduction (WAR) algorithm. Comput. Chem. Eng. 1997, 21, S305–S310. [Google Scholar] [CrossRef][Green Version]
  22. Yadav, A.; Dubey, A. A Review on Green Chemistry and Its Applications. Asian J. Pharm. Res. Dev. 2024, 12, 35–41. [Google Scholar] [CrossRef]
  23. Petrescu, L.; Cormos, C.C. Waste reduction algorithm applied for environmental impact assessment of coal gasification with carbon capture and storage. J. Clean. Prod. 2015, 104, 220–235. [Google Scholar] [CrossRef]
  24. Beatrice, A.C. Chemical Engineering in Uganda: Evolution, Innovation, and the Economic Impact of Process Optimisation. IDOSR J. Comput. Appl. Sci. 2024, 9, 15–20. [Google Scholar] [CrossRef]
  25. Ningrum, E.O.; Perwitasari, T.S.E.; Fahreza, N.A.; Abidin, S.Z.; Gotoh, T.; Suprapto, S.; Triastuti, W.E.; Arifin, R. Sustainable marine waste-derived hydroxyapatite/collagen/chitosan hydrogels as bioactive composite materials for bone-related applications. Biochem. Eng. J. 2026, 230, 110134. [Google Scholar] [CrossRef]
  26. Meramo-Hurtado, S.; Alarcón-Suesca, C.; González-Delgado, Á.D. Exergetic sensibility analysis and environmental evaluation of chitosan production from shrimp exoskeleton in Colombia. J. Clean. Prod. 2020, 248, 119285. [Google Scholar] [CrossRef]
  27. Macea, R.B.; De Hoyos, C.F.; Montes, Y.G.; Fuentes, E.M.; Ruiz, J.I.R. Síntesis y propiedades de filmes basados en quitosano/lactosuero Síntesis y propiedades de filmes basados en quitosano/lactosuero. Polimeros 2015, 25, 58–69. [Google Scholar] [CrossRef][Green Version]
  28. Hall, G.M.; Barrera, C.H.; Shirai, K. Alternative methods for chitin and chitosan preparation, characterization, and application. In Handbook of Chitin and Chitosan; Volume 1: Preparation and Properties; Elsevier: Amsterdam, The Netherlands, 2020; pp. 225–246. [Google Scholar] [CrossRef]
  29. Liu, Q.; Jia, Q.; Wang, P.; Liao, B.; Luo, Y.; Xiao, W.; Yan, K.; Zhang, J. Conical chitosan/polyvinyl alcohol aerogel evaporator with multiscale water activation and directional salt management for efficient solar desalination. Colloids Surf. A Physicochem. Eng. Asp. 2026, 741, 140341. [Google Scholar] [CrossRef]
  30. Valderrama, N.; Albarracín, W. Modificaciones físicas, químicas y enzimáticas y sus efectos sobre las propiedades de las películas de quitosano. Matéria 2014, 19, 301–312. [Google Scholar] [CrossRef]
  31. Bhardwaj, S.; Bhardwaj, N.K.; Negi, Y.S. Effect of degree of deacetylation of chitosan on its performance as surface application chemical for paper-based packaging. Cellulose 2020, 27, 5337–5352. [Google Scholar] [CrossRef]
  32. Kumari, R.; Bagchi, S.; Dadheech, P.K.; Vivekanand, V.; Pareek, N. Sustainable chemoenzymatic production of bioactive chitooligosaccharides using deep eutectic solvents and Thermomyces dupontii chitinase. Int. J. Biol. Macromol. 2026, 358, 151749. [Google Scholar] [CrossRef]
  33. Barros, I.; Guzmán, L.; Tarón, A. Extracción y comparación de la quitina obtenida a partir del caparazon de Callinectes sapidus y Penaeus vannameis. Actual. Divulg. UDCA 2015, 18, 27. [Google Scholar] [CrossRef]
  34. López-Muñoz, F.; García-Perez, A.; Cárdenas, V.O.; Meramo, S.; Ricardez-Sandoval, L.; González-Delgado, Á.D.; León-Pulido, J.; Mainardi, D. A bibliometric study of Chitosan Applications: Insights from processes. Rev. ION 2023, 36, 59–78. [Google Scholar] [CrossRef]
  35. Fonseca, A.C.M.; Santos, M.T.D. Techno-economic and environmental assessment of shrimp waste biorefinery routes. Bioresour. Technol. 2026, 449, 134380. [Google Scholar] [CrossRef]
  36. Arteaga-Díaz, S.J.; Meramo-Hurtado, S.I.; León-Pulido, J.; Zuorro, A.; González-Delgado, A.D. Environmental assessment of large scale production of magnetite (Fe3O4) nanoparticles via coprecipitation. Appl. Sci. 2019, 9, 1682. [Google Scholar] [CrossRef]
  37. Barrett, W.M.; van Baten, J.; Martin, T. Implementation of the waste reduction (WAR) algorithm utilizing flowsheet monitoring. Comput. Chem. Eng. 2011, 35, 2680–2686. [Google Scholar] [CrossRef]
  38. Talan, A.; Kaur, R.; Tyagi, R.D.; Drogui, P. Bioconversion of oily waste to polyhydroxyalkanoates: Sustainable technology with circular bioeconomy approach and multidimensional impacts. Bioresour. Technol. Rep. 2020, 11, 100496. [Google Scholar] [CrossRef]
  39. Gomes, H.I.; Mayes, W.M.; Rogerson, M.; Stewart, D.I.; Burked, I.T. Alkaline residues and the environment: A review of impacts, management practices and opportunities. J. Clean. Prod. 2016, 112, 3571–3582. [Google Scholar] [CrossRef]
  40. Saha, N.; Kharbuli, Z.Y.; Bhattacharjee, A.; Goswami, C.; Häussinger, D. Effect of alkalinity (pH 10) on ureogenesis in the air-breathing walking catfish, Clarias batrachus. Comp. Biochem. Physiol.—A Mol. Integr. Physiol. 2002, 132, 353–364. [Google Scholar] [CrossRef]
  41. Al Kiey, S.A.; Mohamed-Ezzat, R.A.; Dacrory, S. Eco-friendly anti-corrosion performance of chitosan modified with fused heterocyclic compound on mild steel in acidic medium. Int. J. Biol. Macromol. 2024, 263, 130133. [Google Scholar] [CrossRef]
  42. Rudayni, H.A.; Allam, A.A.; Negm, N.A.; Abukhadra, M.R.; El-Housseiny, S.; Rabie, A.M. Sustainable bioremediation of glufosinate pesticide from agricultural runoff using Schiff base functionalized chitosan-activated carbon nanocomposite: Characterization, adsorption, kinetics, and real conditions evaluation. J. Taiwan Inst. Chem. Eng. 2026, 187, 106713. [Google Scholar] [CrossRef]
  43. Bajaj, G.; Van Alstine, W.G.; Yeo, Y. Zwitterionic Chitosan Derivative, a New Biocompatible Pharmaceutical Excipient, Prevents Endotoxin-Mediated Cytokine Release. PLoS ONE 2012, 7, e30899. [Google Scholar] [CrossRef]
  44. Zuorro, A.; Moreno-Sader, K.A.; González-Delgad, Á.D. Inherent Safety Analysis and Sustainability Evaluation of Chitosan Production from Shrimp Exoskeleton in Colombia. Water 2021, 13, 553. [Google Scholar] [CrossRef]
  45. Leon-Pulido, J.; Sarmiento, M.P.; Garzon, D.M.; Hernandez, M.A.; Gonzalez, A.D.; Peralta-Ruiz, Y.Y.; Duran, M.A. Energy study of reactive-HIDiC simulation for ethyl acetate synthesis from acetic acid. Chem. Eng. Trans. 2017, 58, 547–552. [Google Scholar] [CrossRef]
  46. Annanaz, M.; Isaad, J. A Sustainable and Effective Sand/Chitosan Composite for the Removal of Nitrates from Wastewater. Sustainability 2026, 18, 3500. [Google Scholar] [CrossRef]
  47. Pandey, R.; Nahar, N.; Pryor, S.W.; Pourhashem, G. Cost and Environmental Benefits of Using Pelleted Corn Stover for Bioethanol Production. Energies 2021, 14, 2528. [Google Scholar] [CrossRef]
  48. El-Araby, A.; Janati, W.; Ullah, R.; Ercisli, S.; Errachidi, F. Chitosan, chitosan derivatives, and chitosan-based nanocomposites: Eco-friendly materials for advanced applications (a review). Front. Chem. 2024, 11, 1327426. [Google Scholar] [CrossRef]
  49. Muñoz, F.L.; Meramo, S.; Ricardez-Sandoval, L.; Gonzalez, A.D.; Castillo, B.C.; Quiroga, A.G.; Baptiste, B.L.; León-Pulido, J. Insights from an Exergy Analysis of a Green Chemistry Chitosan Biorefinery. Chem. Eng. Res. Des. 2023, 194, 666–677. [Google Scholar] [CrossRef]
  50. Halder, A.; Das, U.; Chengaiyan, J.G.; Balaji, M. Green extraction techniques and advanced coating technologies for development of edible film valorizing fruit and vegetables peels. J. Food Sci. Technol. 2026, 63, 1001–1023. [Google Scholar] [CrossRef]
  51. Haghbakhsh, R.; Duarte, A.R.C.; Raeissi, S. Viscosity Investigations on the Binary Systems of (1 ChCl:2 Ethylene Glycol) DES and Methanol or Ethanol. Molecules 2021, 26, 5513. [Google Scholar] [CrossRef]
  52. Meredith, L.; Elbourne, A.; Greaves, T.L.; Bryant, G.; Bryant, S.J. Physico-chemical characterisation of glycerol- and ethylene glycol-based deep eutectic solvents. J. Mol. Liq. 2024, 394, 123777. [Google Scholar] [CrossRef]
  53. Yu, S.; Qiu, B.; Jin, Y.; Zhao, Y.; Luo, W.; Qi, X. Efficient removal of lignin in tobacco stems with choline chloride-based deep eutectic solvents. Ind. Crops Prod. 2025, 226, 120634. [Google Scholar] [CrossRef]
  54. Nejrotti, S.; Antenucci, A.; Pontremoli, C.; Gontrani, L.; Barbero, N.; Carbone, M.; Bonomo, M. Critical Assessment of the Sustainability of Deep Eutectic Solvents: A Case Study on Six Choline Chloride-Based Mixtures. ACS Omega 2022, 7, 47449–47461. [Google Scholar] [CrossRef]
  55. Peeters, N.; Janssens, K.; de Vos, D.; Binnemans, K.; Riaño, S. Choline chloride–ethylene glycol based deep-eutectic solvents as lixiviants for cobalt recovery from lithium-ion battery cathode materials: Are these solvents really green in high-temperature processes? Green Chem. 2022, 24, 6685–6695. [Google Scholar] [CrossRef]
  56. Liu, C.; Wang, G.; Sui, W.; An, L.; Si, C. Preparation and Characterization of Chitosan by a Novel Deacetylation Approach Using Glycerol as Green Reaction Solvent. ACS Sustain. Chem. Eng. 2017, 5, 4690–4698. [Google Scholar] [CrossRef]
  57. Campos, E.V.R.; Oliveira, J.L.; Fraceto, L.F. Poly(ethylene glycol) and cyclodextrin-grafted chitosan: From methodologies to preparation and potential biotechnological applications. Front. Chem. 2017, 5, 93. [Google Scholar] [CrossRef]
  58. Xie, L.; Cahoon, E.; Zhang, Y.; Ciftci, O.N. Extraction of astaxanthin from engineered Camelina sativa seed using ethanol-modified supercritical carbon dioxide. J. Supercrit. Fluids 2019, 143, 171–178. [Google Scholar] [CrossRef]
  59. Cardoso, A.; Lins, C.I.M.; Santos, E.R.D.; Silva, M.C.F.; Campos-Takaki, G.M. Microbial Enhance of Chitosan Production by Rhizopus arrhizus Using Agroindustrial Substrates. Molecules 2012, 17, 4904–4914. [Google Scholar] [CrossRef] [PubMed]
  60. Salsabela, S.; Fibriana, F.; Heriyanti, A.P.; Haris, A.; Melati, I.S. From insect waste to clean water: Sustainable chitin extraction and its potential application in dye-contaminated wastewater adsorption. Biomass Convers. Biorefinery 2026, 16, 199. [Google Scholar] [CrossRef]
  61. Scott, J.E.; Kyffin, T.W. Demineralization in organic solvents by alkylammonium salts of ethylenediaminetetra-acetic acid. Biochem. J. 1978, 169, 697–701. [Google Scholar] [CrossRef]
  62. Oyekunle, D.T.; Omoleye, J.A. Effect of particle sizes on the kinetics of demineralization of snail shell for chitin synthesis using acetic acid. Heliyon 2019, 5, e02828. [Google Scholar] [CrossRef]
  63. Vendruscolo, F.; Ninow, J.L. Apple pomace as a substrate for fungal chitosan production in an airlift bioreactor. Biocatal. Agric. Biotechnol. 2014, 3, 338–342. [Google Scholar] [CrossRef]
  64. Hansen, B.B.; Spittle, S.; Chen, B.; Poe, D.; Zhang, Y.; Klein, J.M.; Horton, A.; Adhikari, L.; Zelovich, T.; Doherty, B.W.; et al. Deep Eutectic Solvents: A Review of Fundamentals and Applications. Chem. Rev. 2021, 121, 1232–1285. [Google Scholar] [CrossRef]
  65. Zhang, J.; Xu, W.-R.; Zhang, Y.-C. Facile production of chitin from shrimp shells using a deep eutectic solvent and acetic acid. RSC Adv. 2022, 12, 22631–22638. [Google Scholar] [CrossRef]
  66. Khajavian, M.; Vatanpour, V.; Castro-Muñoz, R.; Boczkaj, G. Chitin and derivative chitosan-based structures—Preparation strategies aided by deep eutectic solvents: A review. Carbohydr. Polym. 2022, 275, 118702. [Google Scholar] [CrossRef] [PubMed]
  67. Meramo, S.; González-Delgado, Á.D.; Sukumara, S.; Fajardo, W.S.; León-Pulido, J. Sustainable design approach for modeling bioprocesses from laboratory toward commercialization: Optimizing chitosan production. Polymers 2021, 14, 25. [Google Scholar] [CrossRef]
  68. Roshanfar, M.; Bagh, F.S.G.; Sartaj, M. Optimization of protic ionic liquid-assisted chitosan production from shrimp shell waste via response surface methodology for the sustainable recovery of critical metals from spent lithium-ion batteries. J. Environ. Chem. Eng. 2026, 14, 122497. [Google Scholar] [CrossRef]
  69. Duraisamy, P.; Vinod, A.R.; S., K.; V., D.R.K. Extraction, Characterization, Antimicrobial Activity of Chitosan Extracted from Crab Shell and Preparation of Chitosan-Based Bioplastic Film for Food Packaging. J. Adv. Sci. Res. 2022, 13, 263–268. [Google Scholar] [CrossRef]
  70. Adetoun, A.; Abdulgafar, I.; Ohifeme, O.W. Chitosan-Based Coatings for Shelf Life Elongation of Cassava Root Tubers. Moroc. J. Chem. 2024, 12, 61–77. [Google Scholar] [CrossRef]
  71. Vetere, A. The NRTL equation as a predictive tool for vapor–liquid equilibria. Fluid Phase Equilib. 2004, 218, 33–39. [Google Scholar] [CrossRef]
  72. Haider, M.B.; Jha, D.; Sivagnanam, B.M.; Kumar, R. Modelling and simulation of CO2 removal from shale gas using deep eutectic solvents. J. Environ. Chem. Eng. 2019, 7, 102747. [Google Scholar] [CrossRef]
  73. Samarov, A.; Prikhodko, I.; Liubichev, D.; Toikka, M. Liquid–Liquid Equilibrium of Alcohol–Ester Systems with Deep Eutectic Solvents Based on Choline Chloride and Alkanediols (Ethylene Glycol or Propylene Glycol). J. Chem. Eng. Data 2022, 67, 707–716. [Google Scholar] [CrossRef]
  74. Wang, H.; Chen, J.; Pei, Z.; Fang, Z.; Yang, S.; Li, H. Bio-based deep eutectic solvent of enhanced lignin solubility for wheat straw fractionation and full-component utilization. Ind. Crops Prod. 2025, 223, 120054. [Google Scholar] [CrossRef]
  75. Riofrio, A.; Alcivar, T.; Baykara, H. Environmental and Economic Viability of Chitosan Production in Guayas-Ecuador: A Robust Investment and Life Cycle Analysis. ACS Omega 2021, 6, 23038. [Google Scholar] [CrossRef] [PubMed]
  76. Johnson, D.T.; Taconi, K.A. The glycerin glut: Options for the value-added conversion of crude glycerol resulting from biodiesel production. Environ. Prog. 2007, 26, 338–348. [Google Scholar] [CrossRef]
  77. Hyba, A.M.; Hamza, S.F.; Shahen, S.; El-Rashedy, A.A.; Abdel-Karim, A.M. Comprehensive study on chitosan-derived corrosion inhibitor: Synthesis, electrochemical performance, and quantum chemical assessment. J. Mol. Liq. 2025, 437, 128444. [Google Scholar] [CrossRef]
  78. Isaifan, R.J.; Amhamed, A. Review on Carbon Dioxide Absorption by Choline Chloride/Urea Deep Eutectic Solvents. Adv. Chem. 2018, 2018, 2675659. [Google Scholar] [CrossRef]
Figure 1. Expanded graphic structure of research.
Sustainability 18 05455 g001
Figure 2. Conventional chitosan syntheses processes.
Sustainability 18 05455 g002
Figure 3. Synthesis of chitosan and byproducts under green chemistry concepts [49].
Sustainability 18 05455 g003
Figure 4. Total PEI per energy time of the three evaluated cases from the green route for chitosan production obtained by WAR®.
Sustainability 18 05455 g004
Figure 5. (a) Toxicological impact of the three evaluated cases from the green route for chitosan production obtained by WAR®. (b) Atmospheric impact of the three evaluated cases from the green route for chitosan production obtained by WAR®.
Sustainability 18 05455 g005aSustainability 18 05455 g005b
Figure 6. Environmental impact according to the type of energy source for the green route for chitosan production obtained by WAR®.
Sustainability 18 05455 g006
Figure 7. Environmental impact assessment comparison between the conventional process and the green process [26].
Sustainability 18 05455 g007
Table 1. Changes made to the chitosan production model.
StepSolventEcological HarmNew SolventEnvironmental En-hancementSource
Depigmenta-tionEthanolConventional ethanol, relying on food crops, has a higher environmental impact than bioethanol, contributing to deforesta-tion and increased greenhouse gas emissions.BioethanolBioethanol is cost-effective, with lower minimum selling prices, especially when using pelleted biomass. Integrating production with agricultural waste aligns with sustainability goals, reducing waste in the process.[47,58,59,60]
Deminerali-zationHydro-chloric AcidHCl easily travels in the air, reacts with alkaline elements, and, when leaked or used industri-ally, contributes to acid rain, harming living or-ganisms.Acetic Acid.Due to its low cost and improved toxicology and safety profile.[25,61,62,63]
Deprotein-izationSodium hydroxideNaOH poses a severe health risk, causing in-ternal burns, vomiting, diarrhea, and nausea upon ingestion. High concentrations can result in permanent damage to the digestive and respir-atory systems, potentially leading to death. Moreover, chemical plant discharge can contaminate soils and aquifers, hindering effective plant development due to in-creased pH levels.Choline Chloride + EthyleneDeep eutectic solvents achieve 88% efficiency, and lower polluting ca-pacity.[64,65,66,67,68]
DeacetylationGlycerolGlycerol, a biocompatible and eco-friendly option, improves the sustainability of chitin deacetylation. Its use enables milder reactions, reduc-ing energy consumption. Chitosan produced with glycerol shows enhanced biodegradability.[56,69,70]
Table 2. Environmental impact comparison.
Impact CategoryConventional MethodGreen Method
HTPI (Human Toxicity Potential by Ingestion)3870 PEI/h, normalized score: 0.00234 PEI/kg.2420 PEI/h (−37.5%), normalized score: 0.00146 PEI/kg.
HTPE (Human Toxicity Potential by Inhalation or Dermal Exposure)330 PEI/h, normalized score: 0.00027 PEI/kg.120 PEI/h (−63.6%), normalized score: 0.00010 PEI/kg.
ODP (Ozone Depletion Potential)0 PEI/h (no impact).0 PEI/h (no impact).
TTP (Terrestrial Toxicity Potential)3880 PEI/h, normalized score: 0.00239 PEI/kg.2400 PEI/h (−38.1%), normalized score: 0.00148 PEI/kg.
GWP (Global Warming Potential)4.46 PEI/h (coal), 0.07 PEI/h (natural gas).0.07 PEI/h (−98.4%) using natural gas, normalized score: 6.0 × 10⁻⁸ PEI/kg.
PCOP (Photochemical Oxidation Potential)11,100 PEI/h, normalized score: 0.00680 PEI/kg.7700 PEI/h (−30.6%), normalized score: 0.00472 PEI/kg.
AP (Acidification Potential)2310 PEI/h (coal), 2200 PEI/h (oil).789 PEI/h (−65.8%), normalized score: 0.00048 PEI/kg.
ATP (Aquatic Toxicity Potential)650 PEI/h, normalized score: 0.00040 PEI/kg.327 PEI/h (−49.7%), normalized score: 0.00020 PEI/kg.
Table 3. Comparative techno-economic indicators of solvents and inputs for green chitosan production.
Solvent/InputRoutePrice (USD/kg)Corrosion Cost Factor (Index, 1.0 = Baseline)Effluent Treatment Cost (USD/kg Input)Price Volatility (YoY %)Availability (Americas/Europe)Critical Economic Observation
Hydrochloric Acid (37%)Conventional0.18–0.451.5 (high, requires Hastelloy lining)0.12–0.188–12% (moderate)High/Medium-HighCheap purchase price but hidden CAPEX/OPEX from corrosion and neutralization.
Acetic Acid (Glacial)Green0.70–0.950.4 (low, standard SS316L)0.05–0.076–9% (stable)High/HighHigher upfront cost, yet 30–40% total cost saving due to mild corrosivity and easier disposal.
Sodium Hydroxide (NaOH)Conventional0.60–0.850.8 (moderate, requires alkali-resistant alloys)0.10–0.1512–15% (rising in EU)Stable/Variable87% more expensive than crude glycerol; energy-intensive electrochemical production drives price up 15% annually in Europe.
Crude GlycerolGreen0.25–0.400.2 (negligible, plastic or SS304)0.02–0.045–8% (low, tied to biodiesel)Surplus/HighMost profitable input for green deacetylation; abundant as biodiesel waste stream.
Choline ChlorideDES (Green)1.10–1.600.3 (very low, compatible with polymers)0.01–0.024–6% (very stable)High/HighPremium price offset by >85% recovery rate; animal feed industry ensures stable supply.
Ethylene GlycolDES (Green)0.65–0.850.3 (low)0.02–0.0310–18% (high, natural gas linked)High/MediumExcellent solvation power, but volatile due to natural gas crisis in Europe.
BioethanolGreen0.55–0.800.2 (negligible)0.01–0.036–10% (moderate)Massive/HighCheaper than synthetic ethanol in circular biorefinery models; Brazil and US lead production.
Disclaimer/Publisher’s Note: The statements, opinions and data contained in all publications are solely those of the individual author(s) and contributor(s) and not of MDPI and/or the editor(s). MDPI and/or the editor(s) disclaim responsibility for any injury to people or property resulting from any ideas, methods, instructions or products referred to in the content.