Article

How Does Corporate Digitalization Promote Green Innovation of Heavily Polluting Firms: Evidence from China

by
Yuhang Ma
and
Nor Farradila Abdul Aziz
*
Faculty of Business and Management, Universiti Teknologi MARA, Selangor Branch, Shah Alam 40450, Malaysia
*
Author to whom correspondence should be addressed.
Sustainability 2026, 18(11), 5436; https://doi.org/10.3390/su18115436 (registering DOI)
Submission received: 25 March 2026 / Revised: 12 May 2026 / Accepted: 26 May 2026 / Published: 28 May 2026
(This article belongs to the Special Issue Green Innovation and Digital Transformation in a Sustainable Economy)

Abstract

High emissions and excessive resource consumption by heavily polluting firms pose significant obstacles to sustainable development. As a strategic tool, digitalization has shown increasing potential to promote sustainable transformation. Existing studies mainly focus on the relationship between digitalization and green innovation (GI) at the regional level, while firm-level evidence remains limited, especially in heavily polluting industries. Based on information asymmetry theory and stakeholder theory, this study establishes a framework to explore how corporate digitalization (CD) affects the green innovation of heavily polluting firms (GIHPF) through external information intermediaries. Using panel data on Chinese listed heavily polluting firms from 2012 to 2023, we find that CD significantly promotes GIHPF, and the results remain robust across a series of tests. CD enhances GIHPF mainly by increasing investment analysts’ attention (IAA) and media attention (MA), thereby mitigating information asymmetry and strengthening external monitoring. Heterogeneity tests show the effect is stronger for non-state-owned firms, central-region firms, and growth and maturity-stage firms. This study contributes to the literature by providing firm-level evidence from heavily polluting industries and by uncovering the role of external information intermediaries in the relationship between CD and GIHPF. The findings also offer important implications for promoting sustainable development through digitalization.

1. Introduction

Over the past several decades, rapid economic growth has relied heavily on resource-intensive production and large-scale fossil fuel consumption, generating substantial environmental degradation and sustainability challenges [1]. As environmental pressures continue to intensify, firms are increasingly expected to balance economic development with ecological responsibility [2,3]. In this context, green innovation (GI) has become an important pathway toward sustainable development. GI generally refers to innovation activities that reduce environmental impacts, improve energy efficiency, and support cleaner production processes [4,5,6,7]. At the firm level, GI facilitates technological upgrading, supply chain coordination, and the integration of economic and sustainability objectives [8,9,10].
Despite its importance, GI remains particularly challenging for heavily polluting firms. Compared with firms in low-pollution industries, heavily polluting firms are more likely to face technological lock-in, high transition costs, and strong dependence on traditional production systems [4,11]. These constraints are especially evident in emerging economies such as China, where industrial development has historically relied on energy-intensive growth models [12,13]. Although China has strengthened environmental regulation and promoted low-carbon transformation in recent years, many heavily polluting firms still face substantial barriers to implementing GI, including financing constraints, technological uncertainty, and limited access to external support [14,15,16]. As a result, promoting green innovation in heavily polluting firms (GIHPF) requires both internal technological upgrading and external institutional support [17,18].
However, digitalization has emerged as a potentially transformative force in facilitating GI [19]. Advances in big data, cloud computing, and artificial intelligence enable firms to integrate digital tools into production and management, reshaping innovation processes [20,21]. Digitalization improves information connectivity, scalability, and knowledge spillovers, which lowers information costs and accelerates green technology diffusion [21,22]. These advantages are especially valuable for GI, which is often limited by information asymmetry, technical uncertainty, and coordination costs.
At the macro level, digitalization improves environmental governance, promotes green technology sharing, and strengthens regulatory efficiency [10,23,24]. These changes support industrial upgrading and low-carbon economic transition [22]. At the micro level, corporate digitalization (CD) optimizes production, strengthens environmental monitoring, and improves resource allocation, creating favorable conditions for GI [25,26]. Furthermore, digitalization enhances transparency and mitigates information asymmetry, attracting attention from financial analysts and the media [9,27,28]. This stronger external supervision encourages firms to invest in GI [27].
Existing studies generally confirm the positive role of digitalization in promoting environmental performance and green transformation [9,19]. However, most prior research has concentrated on regional digitalization or macro-level evidence [24,25], while firm-level evidence on CD remains limited, especially in heavily polluting industries. Although several studies have explored the relationship between digitalization and GI in manufacturing sectors or listed firms, empirical evidence specifically focused on heavily polluting firms remains scarce [19,26,27]. Moreover, existing studies primarily emphasize the technological and operational benefits of digitalization, whereas the underlying informational and governance mechanisms through which CD affects GI are still not fully understood.
To address these gaps, this study develops a theoretical framework grounded in information asymmetry theory and stakeholder theory to examine the impact of CD on GIHPF. Specifically, we incorporate investment analysts’ attention (IAA) and media attention (MA) as key mediating channels through which digitalization affects firms’ GI behavior.
Compared with the existing literature, this study makes three main contributions. First, it extends the literature on digitalization and GI by providing firm-level evidence from heavily polluting industries, which remain underexplored in previous studies. Second, this study also strengthens the theoretical integration between CD and GI. By grounding the analysis in information asymmetry theory and stakeholder theory, this study clarifies how CD affects GI through external information intermediaries [29]. This theoretical framing moves beyond a purely technical view of digitalization and establishes a more complete institutional explanation for GIHPF. Third, this study extends the sample period to 2012–2023, incorporating the latest developments in China’s digital economy and environmental governance. Existing studies rely on samples ending before 2021, which may not fully capture the recent dynamics of digital transformation and GI [16,26,30]. Finally, the heterogeneity analysis further reveals that the effects of CD differ across ownership structures, regional locations, and firm lifecycle stages. These findings enrich the literature on firms’ GI by providing updated and context-specific evidence [31].
The remainder of this study is structured as follows. Section 2 reviews the relevant literature and develops the research hypotheses. Section 3 describes the data, variables, and empirical methodology. Section 4 presents the empirical results, including baseline estimations, robustness checks, mechanism analysis, and heterogeneity tests. Section 5 discusses the main findings. Section 6 concludes the paper and outlines the corresponding implications, followed by the limitations and directions for future research.

2. Literature Review

2.1. Conceptualization of Green Innovation (GI)

Green innovation (GI) generally refers to the development and adoption of products, technologies, and production processes that reduce environmental damage and improve resource efficiency [12]. At the firm level, GI is commonly associated with environmentally oriented technological activities, such as cleaner production technologies, energy-saving processes, and pollution abatement innovations [19,32]. Compared with conventional innovation, GI involves greater uncertainty and longer investment horizons, which may deter firms from undertaking such activities [28,33]. In empirical studies, GI is typically measured using green patents, as they offer observable and comparable indicators of firms’ environmentally oriented technological outputs [28]. Following this approach, this study conceptualizes GI as firm-level technological innovation with explicit environmental objectives and measures it using green patent applications.

2.2. Theoretical Foundation

2.2.1. Information Asymmetry Theory

Information asymmetry theory explains how unequal access to information influences economic decision-making and organizational behavior [34,35]. In the corporate context, managers typically possess more information about firm operations and strategic activities than external stakeholders [36]. This information gap can result in inefficient resource allocation and reduced external support, particularly for activities characterized by high uncertainty [37].
GI is particularly susceptible to information asymmetry. Compared with conventional innovation, GI involves more uncertain technological outcomes, longer investment horizons, and less transparent performance signals, making it difficult for external stakeholders to accurately evaluate its value [28,33]. As a result, firms engaging in GI may face tighter financing constraints and weaker external monitoring.
Mechanisms that improve information disclosure and facilitate information dissemination therefore play a crucial role in shaping firms’ GI behavior [38]. In particular, information intermediaries such as financial analysts and the media help mitigate information asymmetry by collecting, interpreting, and disseminating firm-level information to the market [14]. Their attention can strengthen external monitoring and influence firms’ strategic decisions [39].

2.2.2. Stakeholder Theory

Stakeholder theory offers a complementary explanation of firms’ environmental behavior by emphasizing the impact of external stakeholders on corporate decision-making [40,41]. According to this perspective, firms are embedded in a network of relationships with various stakeholders, including investors, customers, regulators, and the media, whose expectations shape corporate strategies [42].
In the context of environmental sustainability, stakeholders increasingly require greater environmental responsibility and transparency from firms [37]. Under growing public and regulatory pressure, firms may adopt GI strategies to enhance corporate legitimacy, mitigate reputational risks, and strengthen stakeholder relationships [38]. Previous studies further suggest that external attention from analysts and the media can amplify stakeholder pressure by raising public scrutiny of firms’ environmental performance [39]. Accordingly, stakeholder theory provides an important perspective for understanding why external attention may encourage heavily polluting firms to engage in GI.

2.3. Corporate Digitalization (CD) and GI

In the information era, digital technologies have emerged as critical tools for decision-making optimization, and their predictive capabilities and information interactivity have received considerable attention in management research [29,30]. Similarly, corporate digitalization (CD) facilitates information application, corporate financing, and R&D for heavily polluting firms.
First, advanced digital technologies such as big data, artificial intelligence (AI), and the Internet of Things (IoT) offer essential technical support for GI. By helping build efficient knowledge-sharing platforms, CD enables firms to overcome constraints in green knowledge accumulation [43]. In particular, access to digital infrastructure allows firms to obtain up-to-date information on global green technologies, environmental solutions, and industry best practices [20,44]. Improved access to knowledge may shorten R&D cycles, lower innovation costs, and increase firms’ incentives to engage in GI [45].
Second, digitalization enhances information disclosure and transparency, thereby shaping firms’ environmental behavior. Through real-time data sharing and monitoring, CD improves the visibility of pollution emissions and operational activities [46], which helps mitigate information asymmetry between firms and external stakeholders [47]. Meanwhile, stakeholder theory suggests that greater transparency exposes firms to stronger external evaluation and accountability pressures [7]. In this context, heavily polluting firms become more likely to adopt GI strategies in response to external monitoring.
Finally, CD alleviates financial constraints associated with GI. By improving the efficiency and transparency of financing channels, digitalization expands access to external funding for sustainable project [48]. Heavily polluting firms can use digital platforms to disclose financing needs and attract environmentally oriented investors, especially those concerned with environmental, social, and governance (ESG) issues [49]. In addition, reduced information asymmetry between firms and financial institutions strengthens lenders’ confidence and lowers financing costs [45], thereby improving the feasibility of GI investments. Based on the above arguments, this study proposes the following hypothesis:
H1. 
While other factors remain unchanged, CD has a significant and positive effect on green innovation of heavily polluting firms (GIHPF).

2.4. Mediating Effect of Investment Analysts’ Attention (IAA)

Investment analysts’ attention (IAA) generally reflects the scope of analyst coverage and the depth of their research on firms. It is commonly measured by the number of analysts following a firm and the number of analyst reports issued within a given period [28,50].
From the perspective of information asymmetry theory, digitalization can significantly improve the information environment of heavily polluting firms. By enhancing information disclosure systems and enabling real-time data sharing, CD reduces the level of information asymmetry between firms and external stakeholders, including analysts [1,29,51]. Lower information acquisition costs and improved data accessibility make heavily polluting firms more attractive to analysts, thereby increasing analyst coverage and research intensity [52]. As a result, CD is likely to attract greater IAA, reflected in both the number of analysts following the firm and the volume of analyst reports [39].
In turn, increased IAA may influence GIHPF through multiple channels. First, analysts play a crucial role in information processing and dissemination, particularly in areas such as GI, which are characterized by high uncertainty and information opacity [25]. By interpreting and transmitting firm-level information, analysts help mitigate investors’ information disadvantages and improve the market’s understanding of firms’ green activities [53]. Second, from the stakeholder perspective, analysts also act as external evaluators. Enhanced analyst coverage strengthens external monitoring, which helps mitigate agency problems and constrains managerial opportunism [50]. Managers may otherwise underinvest in long-term and uncertain GI projects due to short-term performance pressure [28]. With more intensive analyst scrutiny, heavily polluting firms face greater pressure to improve environmental performance and are more likely to engage in GI activities [17]. Based on the above arguments, this study proposes the following hypothesis:
H2a. 
While other factors remain unchanged, CD promotes GIHPF by increasing the number of analysts.
H2b. 
While other factors remain unchanged, CD promotes GIHPF by increasing analyst research reports.

2.5. Mediating Effect of Media Attention (MA)

Media attention (MA) represents a crucial form of external monitoring that can impose reputational pressure on firms and shape their environmental behavior. Existing studies suggest that MA can promote environmental responsibility and green technological innovation by increasing public scrutiny [26,43].
From the perspective of information asymmetry theory, CD may improve firms’ information visibility and accessibility, thereby attracting greater media coverage [54]. On the one hand, digital technologies reduce information acquisition costs for online media and enable more frequent and timely reporting [55]. Through digital systems, heavily polluting firms can generate and disclose data in real time, which enhances the availability and credibility of information [27]. This facilitates media access to firm-level environmental data and improves information processing efficiency. On the other hand, heavily polluting firms rely on digital tools to achieve low-carbon and intelligent production. Their novel and innovative production models are considered newsworthy by the media due to their social relevance [56]. As a result, CD is likely to increase the level of MA.
Stakeholder theory further suggests that MA amplifies external scrutiny and reputational concerns. By reducing information asymmetry between firms and the public, media coverage enhances the transparency of corporate environmental performance and exposes firms to greater public scrutiny [57]. When environmental issues are reported, heavily polluting firms may face stronger pressure from stakeholders, including consumers, investors, and regulators, which can incentivize them to improve environmental practices [58]. In addition, media coverage can shape public perception and strengthen the reputational benefits associated with GI, thereby encouraging heavily polluting firms to adopt environmentally friendly technologies and practices [59]. Empirical evidence also supports the positive role of MA in promoting green innovation in heavily polluting industries [24]. Based on the above arguments, this study proposes the following hypothesis:
H3. 
While other factors remain unchanged, CD promotes GIHPF by increasing the MA.
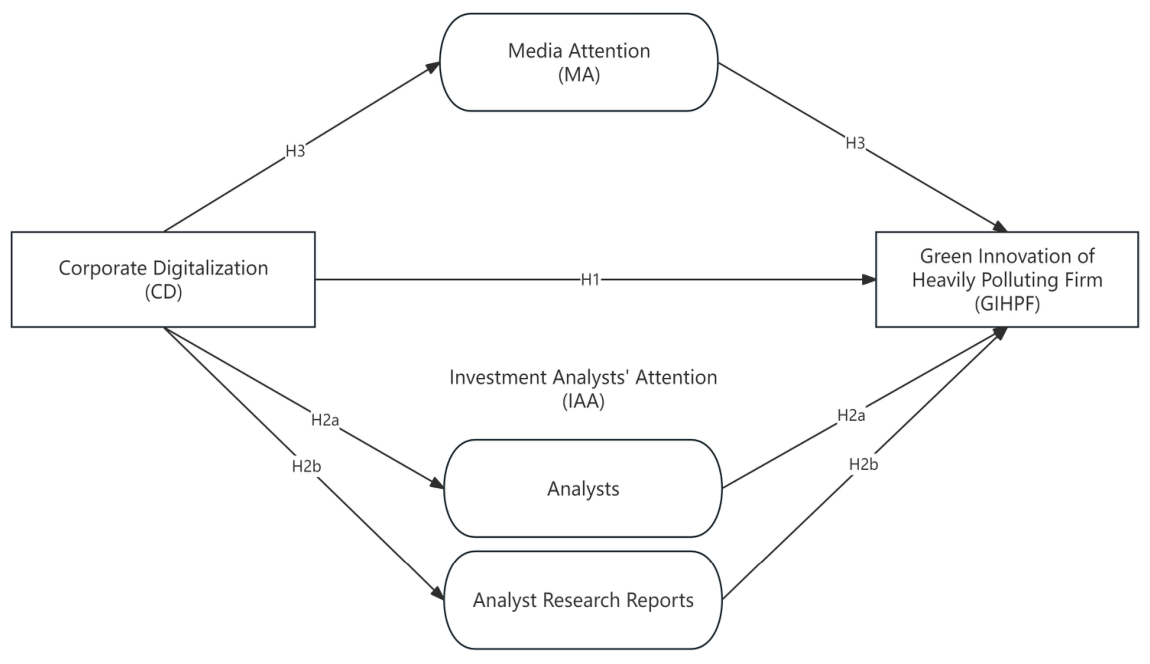
This study proposes a CD-GIHPF framework (see Figure 1). At its core, the framework focuses on the direct effect of CD on GIHPF while further considering the indirect channels through IAA and MA. According to information asymmetry theory and stakeholder theory, IAA and MA, as forms of external supervision, send signals to the public and prompt firms to carry out sustainable technology upgrades to achieve GI.

3. Data and Methods

3.1. Sample Selection

This study selected Chinese listed firms in heavily polluting industries from 2012 to 2023 as the initial sample. The classification of heavily polluting industries followed the Guidelines for the Classification of Industries of Listed Companies revised by the China Securities Regulatory Commission in 2012, covering industry codes B06, B07, B08, B09, C17, C19, C22, C25, C26, C28, C29, C30, C31, C32, and D44. Detailed industry classifications are presented in Table 1.
Data on GI, MA, and regional macro indicators were obtained from the China Research Data Service (CNRDS) (https://www.cnrds.com/). Firm-level microdata and IAA were collected from the CSMAR database (https://data.csmar.com/). Data on CD were extracted manually from the corporate annual reports.
Financial firms were excluded due to their unique accounting standards and regulatory frameworks. Firms labeled as “special treatment” (ST) were also dropped, as such status indicates abnormal financial conditions such as sustained losses, which could distort innovation behavior. To mitigate the impact of extreme values, all continuous variables were winsorized at the 1–99% percentiles. The final sample comprised 6943 observations from 782 distinct firms. All data processing was performed using STATA 16.

3.2. Dependent Variable

Green Innovation (GI)

Green innovation (GI) is primarily measured using green patent applications. According to the classification standard of the China National Intellectual Property Administration, green patents include two categories: green invention patents and green utility model patents. Green invention patents emphasize novelty, inventiveness, and practical applicability, which are highly consistent with environmental sustainability objectives. By contrast, green utility model patents reflect incremental technological improvements in green practices [28,33].
Consistent with the prior literature, this study measured GI as the natural logarithm of one plus the number of green invention and green utility model patent applications in a given year [28]. This measure reflects firms’ output in green technological innovation. The detailed measurement approach is as follows:
G I   ( G r e I n n o v )   =   L n   ( N u m b e r   o f   p a t e n t s   f i l e d   i n   t h e   y e a r + 1 )

3.3. Independent Variable

Corporate Digitalization (CD)
Corporate digitalization (CD) reflects a firm’s adoption and deployment of digital technologies. Existing literature has proposed two primary methods for measuring CD. Some scholars used a binary variable indicating whether a firm implemented digital technologies in a given year (1 for adoption, 0 otherwise) [21]. However, the method cannot reflect the actual intensity or scope of digitalization, making it difficult to evaluate real economic effects accurately. Other scholars constructed a CD index using the logarithm of the frequency of digital-related keywords in annual reports [60]. This method overcomes the weakness of the binary measure and better captures the degree of digital transformation. Therefore, this study adopted the second method.
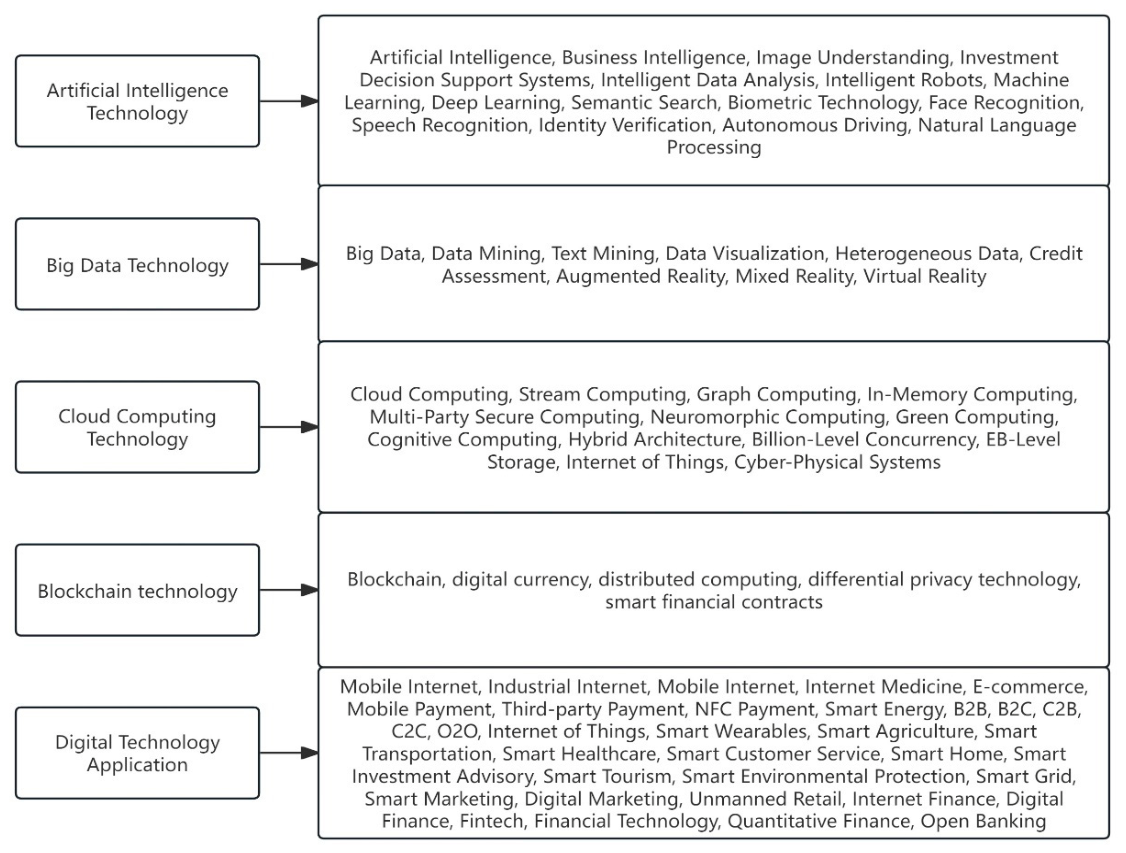
Digital-related terms were selected based on previous studies, including blockchain, artificial intelligence, cloud computing, big data, and digital information technology [60]. The detailed operation steps are as follows (see Figure 2): (1) Plain text was extracted from PDF-format annual reports using the pdfminer.six in Python 3.13.5. (2) Headers, footers, chart captions, and table serial numbers were removed using regular expressions. (3) Applied Jieba for tokenization, loading a custom dictionary aligned with the keywords shown in Figure 2. (4) Expressions preceded by negative words such as “none,” “no,” or “not” were excluded. (5) Filtered tokens by the relevant lexicon and counted their frequencies. (6) The CD index was calculated as the natural logarithm of one plus the total frequency of digital keywords:
C D   ( D i g i t a l )   =   L n (   T o t a l   f r e q u e n c y + 1 )
Figure 2. Relevant Keywords Related to Corporate Digitalization. Source: Compiled by the authors; Keywords are based on the Zheng et al. (2023) [60].
Sustainability 18 05436 g002

3.4. Mediating Variable

Investment Analysts’ Attention (IAA) and Media Attention (MA)

This study employed IAA as a mediating variable to investigate the relationship between CD and GIHPF. Previous studies mainly focus on the number of analysts, while ignoring the number of research reports. This may result in an incomplete evaluation of the mediating role of IAA [9,28,61]. To address the limitation, this study measured IAA using two complementary indicators [50]:
(1)
Analyst coverage: the natural logarithm of one plus the number of analysts following the firm in a given year.
(2)
Analyst reports: the natural logarithm of one plus the number of analyst research reports issued for the firm in a given year.
MA is widely defined as the extent of media coverage and public recognition of a firm [14]. The rapid advancement of digital communication has accelerated information dissemination and improved corporate transparency [58]. Following Chen et al., this study measured MA as the logarithm of one plus the total number of firm-related news reports published in major online media outlets within a given year [38].

3.5. Control Variable

In accordance with previous studies, this study included the following control variables: Size of board (board), Ratio of independent directors (InBoard), Firm age (Firmage), Innovation Capability (IC), and Regional Economic Development Level (EL) [47,52,60,62]. All measurement approaches for variables are presented in Table 2.

3.6. Model Establishment

Baseline Model

To control for unobserved firm-level heterogeneity, this study adopted a fixed effects model. This method controls for time-invariant firm-specific characteristics such as management quality and initial technological endowments, which could confound the relationship between CD and GIHPF [63]. Industry fixed effects were included to capture cross-industry differences in regulatory environments and technology adoption. while year fixed effects account for common shocks and policy changes over time [64]. Furthermore, standard errors were clustered at the firm level to account for potential heteroscedasticity and serial correlation within firms over time [65]. Therefore, the baseline regression model was constructed as follows:
G r e I n n o v i t = α 0 + α 1 D i g i t a l i t + α n C o n t r o l i t + μ i + γ t + δ j + ε i t
where G r e I n n o v i t denotes the level of GI of firm “i” in year “t”, Independent Variable D i g i t a l i t denotes the level of digitalization of firm “i” in year “t” , C o n t r o l i t denotes the set of control variables, μ i denotes firm-specific fixed effect. γ t denotes the fixed year, δ j denotes the fixed industry, and   ε i t is a random error term. α 0 is a constant term, a n d   α 1 is the coefficient of the independent variable.

3.7. Mediation Effect Model

This study adopted the stepwise regression analysis to explore the mediating effects of IAA and MA in the relationship between CD and GIHPF [45,60,66]. The stepwise regression follows the classical procedure proposed by Baron and Kenny (1986), which remains widely used in corporate sustainability and innovation research [44,67,68]. It enables the identification of both direct and indirect effects by testing the links between the independent variable, the mediators, and the dependent variable in sequence. The model is established as follows:
M e d i a t o r i t = β 0 + β 1 D i g i t a l i t + β n C o n t r o l i t + μ i + γ t + δ j + ε i t
G r e I n n o v i t = θ 0 + θ 1 D i g i t a l i t + θ 2 M e d i a t o r i t + θ n C o n t r o l i t + μ i + γ t + δ j + ε i t
where M e d i a t o r i t is IAA and MA level of firm “i” in year “t”, Mediator includes Analyst, Report, and MA, representing the number of analysts, the number of tracking research reports, and media reports, respectively. The specific operation steps are as follows:
  • Test whether α 1 in Model (3) is significant. If α 1 is significant, proceed to the next step.
  • Test models (4) and (5), whether the β 1 , θ 1 and θ 2 are significant. If all are significant and θ 1 is less than α 1 , it proves that the Mediator has a partial mediating effect between CD and GIHPF.
  • If θ 1 is not significant, but β 1 and θ 2 are significant, it indicates that the Mediator completely mediates between CD and GIHPF.
Furthermore, to ensure the robustness of the results, this study adopted the bootstrap method with resampling performed 500 times based on the original sample. This method is preferred because it does not rely on the assumption of normality in the sampling distribution of the indirect effect [18,69]. It addresses the limitations of traditional stepwise regression, which may fail to detect the significance of mediation effects under small sample sizes or non-normal conditions [69]. Moreover, the bootstrap method also provides more accurate and reliable confidence intervals.

4. Results

4.1. Descriptive Statistical Analysis

Descriptive statistics of all the variables are provided in Table 3 of this study. The mean value of GIHPF is 0.307, with a minimum of 0 and a maximum of 3.664. In addition, the standard deviation of GIHPF is 0.684, indicating substantial cross-firm variation in GI performance and a relatively low overall average level among sample firms. Regarding CD, the mean, minimum, and maximum values are 0.750, 0, and 4.234, respectively. The standard deviation of CD is 0.925, suggesting large differences in digitalization intensity across firms and that some firms have not yet implemented digital strategies. For IAA, the mean value is 1.289, with a minimum of 0 and a maximum of 3.871. The standard deviation of 1.151, indicating heterogeneity in analyst coverage across heavily polluting firms. Further, for research reports, the mean value is 1.580, with a minimum of 0 and a maximum of 4.754. The standard deviation is 1.428. which indicates significant variations in the number of research reports by analysts tracking different heavily polluting firms. For MA, the mean value is 5.018, the minimum is 1.386, and the maximum is 9.262, with a standard deviation of 0.878, suggesting considerable variation in MA across companies.
To assess potential multicollinearity among the independent and control variables, this study conducts a Variance Inflation Factor (VIF) test. The results show that all VIF values are well below the commonly accepted threshold of 10, with the highest VIF being 1.49 and the lowest being 1.05 [70]. Therefore, the results indicate that all VIF values are below the conventional threshold of 10, with a maximum of 1.49 and a minimum of 1.05, suggesting no concerns about multicollinearity.

4.2. Correlation Analysis

Table 4 presents the Pearson correlation coefficients among the core variables. The correlation coefficient between CD and GIHPF is 0.057, which is statistically significant at the 1% level. This finding indicates a positive but weak correlation, suggesting that increases in corporate digitalization tend to be accompanied by higher GI engagement.

4.3. Baseline Model Results

Table 5 reports the baseline regression results for the effect of CD on GIHPF. All models use clustered (Company) standard errors to correct for potential biases from autocorrelation and heteroscedasticity. Column (1) shows that CD has a significantly positive effect on GIHPF (coefficient = 0.042, significant at the 5% level). After including control variables in Column (2), the coefficient slightly decreases to 0.041 but remains significant at the 5% level. In Column (3), after controlling for industry and year fixed effects, the coefficient rises to 0.047, still at the 5% significance level. Column (4) incorporates firm, industry, and year fixed effects, and the coefficient is 0.036, significant at the 1% level, and the model yields the highest R2 value of 0.612, indicating the best model fit. These results consistently confirm that CD significantly promotes GIHPF, supporting Hypothesis 1.

4.4. Robustness Test

To examine the robustness of the baseline model findings, this study conducts a series of robustness checks on the core explanatory variables and sample selection.
First, this study employs alternative measures of CD to ensure the robustness of the results. On the one hand, the measurement of the independent variable is refined by decomposing CD into four dimensions, namely digital technology application, internet business model, intelligent manufacturing, and modern information systems [22]. Based on this classification, a new proxy for CD (Digital2) is constructed by calculating the logarithm of the frequency of relevant keywords (plus one) extracted from annual reports of heavily polluting firms.
On the other hand, following prior studies, this study adopts the proportion of digital economy–related intangible assets as an alternative indicator of CD (Digital3) [71]. As reported in Table 6, Columns (1) and (2), the estimated coefficients of Digital2 and Digital3 remain significantly positive, indicating that the positive effect of CD on GIHPF is robust to different measurement approaches, thereby providing further support for Hypothesis 1.
Second, the potential dynamic effect of CD is considered by lagging CD by one period. The results in Column (3) remain positive and significant, supporting Hypothesis 1 again.
Third, this study also considers the influence of special events. For example, the persistent destructive impact of COVID-19 on the entire economic environment means that most firms cannot address the shortage of funds to implement green and sustainable strategies. To eliminate interference from the COVID-19 pandemic, observations from 2020 to 2021 are excluded, and the model is re-estimated for the periods 2012–2019 and 2022–2023. The results are indicated in Column (4) of Table 6; Hypothesis 1 is still supported.
Finally, as there is a considerable economic gap across various provinces in China, the provincial governments have inconsistent policies for supporting corporate sustainable development, mainly reflected in the level of GI development. To minimize estimation bias resulting from policy differences across provinces, this study fixes the provinces in the original base model. The results presented in Column (5) of Table 6 show that the final result remains robust.

4.5. Endogeneity Test

To address potential endogeneity concerns arising from reverse causality, this study applies a two-stage least squares (2SLS) regression. The 2SLS method helps correct for possible reverse causality and omitted variable bias by using instrumental variables [45]. In the first stage, CD is regressed on the selected instruments to isolate the exogenous component of digitalization. In the second stage, the predicted values of CD are used to estimate its effect on GIHPF.
Regarding the instrumental variable, this study constructs a Bartik (shift–share) instrument following established approaches in the literature [72,73]. Specifically, the instrumental variable is defined as the product of (i) the average industry digitalization level excluding the firm itself (share variable) and (ii) the national Internet user growth rate excluding the firm’s province (shift variable) [73,74]. For the exclusion restriction, the shift component reflects changes in national Internet development, which are unlikely to be affected by individual firms. In addition, excluding the firm’s own province helps reduce the possibility that local economic conditions or environmental policies jointly influence CD and GI. It is also unlikely that national Internet growth directly drives firm-level GIHPF. GI in these sectors usually depends on firm-specific investment, regulatory requirements, and technological capabilities. A more plausible channel is that Internet development promotes CD, which in turn affects GIHPF. Taken together, these arguments support the validity of the instrument.
This instrument exhibits strong relevance, as evidenced in Table 7: the first-stage regression yields a highly significant coefficient and a Wald F-statistic of 646.541, which is well above conventional critical values, confirming that it effectively captures macro-level digital transformation shocks filtered through industry exposure. The Kleibergen–Paap LM statistic of 408.513 further indicates ruling out under-identification. These diagnostic results demonstrate that the instrumental variable is valid and that the results are both robust and reliable.
As a further check, the Heckman two-stage model is employed to address potential self-selection bias. The decision to adopt digital transformation is not random and may be influenced by unobserved factors, which can lead to selection bias. In the first stage, a probit model estimates the likelihood of digital transformation. The inverse Mills ratio is then calculated to capture the likelihood that companies self-select into digital transformation based on both observed and unobserved characteristics [45]. In the second stage, the inverse Mills ratio is included in the outcome regression to control for this non-random selection. This method helps ensure that the estimated effect of CD on GIHPF is not biased by systematic differences between companies that choose to undergo digital transformation and those that do not [32].
Following prior studies, a dummy variable (Dummy_Digital) is constructed, where a company is assigned a value of 1 if it implements a digitalization strategy in a given year, and 0 otherwise [21,32]. In the first-stage model, a control variable indicating whether the company implements a GI is introduced, and a probit model is used to estimate the probability of the CD, obtaining the inverse Mills ratio (IMR). The IMR is incorporated into the regression equation in the second stage. Columns (3) and (4) of Table 7 show the Heckman results. The regression coefficient for Dummy_Digital is 0.206, a significantly positive value at the 5% level. Additionally, the IMR coefficient is −0.109, and the significance level is negligible. These findings indicate that the reliability of the results.
To mitigate potential endogeneity concerns arising from sample selection bias, this study adopts propensity score matching (PSM). To measure whether a company adopts a digital transformation strategy, this study continues to employ the variable (Dummy_Digital). Companies adopting digitalization are classified as the treatment group, while the remaining companies serve as the control group. The matching covariates include all control variables in this study. A radius matching method with a caliper of 0.05. The average treatment effect on the treated (ATT) is estimated at 0.0858, with a t-statistic of 5.09, indicating that CD achieve significantly higher levels of GIHPF compared to non-digitalized companies. Following matching, a regression analysis is performed on the matched samples, controlling for covariates, industry, and year fixed effects. The regression coefficient of Dummy_Digital remains significantly positive at the 5% level, with an estimated effect of 0.031, as shown in Column (5) of Table 7.

4.6. Mechanism Test

The previous hypothesis analysis posits that CD can facilitate GIHPF by increasing IAA and MA. The results of the IAA mechanism (the number of tracking analysts and the number of tracking research reports) are presented in columns (1), (2), (3), and (4) of Table 8, while the results of MA are shown in columns (5) and (6) of Table 8. Columns (1) and (2) show that CD significantly increases analyst coverage, which in turn promotes GIHPF. Thus, Hypothesis 2a is supported. Columns (3) and (4) indicate that CD also increases the number of analyst reports, which then enhances GIHPF, supporting Hypothesis 2b. Columns (5) and (6) of Table 8 show that the coefficient of MA is positively significant, indicating that CD can foster GIHPF by promoting the increase in MA, and Hypothesis 3 is supported.
In addition, to verify the robustness of the mediating effect, this study employs a bootstrap approach with 500 replications. The results show that the CD attracts the IAA, thereby promoting the number of analysts. The indirect effect is 0.0111, and the direct effect is 0.0302. This study reports the 95% bias-corrected confidence interval, which confirms the reliability of the partial mediating effect of the number of analysts. Furthermore, regarding the robustness analysis of the mediating effect of the number of research reports, the indirect effect is 0.0124, and the direct effect is 0.0290. The 95% bias-corrected confidence interval does not contain 0, and Hypothesis 2b is verified. Finally, the indirect effect of MA is 0.0045, and the direct effect is 0.0367. The 95% bias-corrected confidence interval does not contain 0, and the previous mediating effect test is supported.

4.7. Heterogeneity Analysis

4.7.1. Business Ownership

This study examines how CD influences GIHPF, taking into account the business ownership. The findings are summarized in Table 9. Column (1) of Table 9 reports the regression results for non-state-owned firms, and Column (2) for state-owned firms. Based on the results, in non-state-owned firms, CD positively and significantly influences the GIHPF (coefficient is 0.034, at the 1% level). However, in state-owned firms, CD does not have a significant impact on the GIHPF. The Chow test is employed to determine whether there are significant structural differences among multiple groups of samples, usually in the context of heterogeneity analysis. As shown in Table 9, F(7, 6929) = 30.87, p < 0.001. The results provide strong evidence to reject the null hypothesis of no structural change, indicating that the regression coefficients differ significantly before and after the cut-off point.
This study shows that in non- state-owned firms, CD has a significant and positive effect on GIHPF. However, there is no significant effect on state-owned firms, which differs from the findings of previous studies [75,76]. This finding can be attributed to three primary reasons. First, while prior studies focused on the overall sample of listed firms, this study specifically targets companies in heavily polluting industries. Such sample selection inherently leads to differences in corporate behavior and the digitalization–innovation pathway.
Second, existing research suggests that in heavily polluting industries, state-owned firms generally outperform non-state ownership in regulatory compliance, pollution control, and GI [77]. As a result, the incremental GI gains from additional digital investment are expected to be more limited for state ownership companies, reflecting a typical case of diminishing marginal returns, consistent with the findings of Zhao et al. [78,79].
Finally, differences in managerial incentives further widen the efficiency gap. In state-owned firms, managers are typically appointed by government agencies or higher-level corporate authorities, with performance evaluations emphasizing policy implementation and organizational stability. This structure discourages risk-taking in research and development, as innovation failures are penalized, while successful outcomes may not result in immediate managerial incentives [80]. In contrast, non- state-owned firms, often facing greater financing constraints, have stronger incentives to leverage CD to signal green performance and attract capital, particularly from green investors. Consequently, non-state-owned firms are more likely to experience the advantages of CD in the process of GI, promoting the commercialization of green patents and products.

4.7.2. Regional Heterogeneity

This study also investigates the effect of CD on GIHPF, taking into account their geographical locations. The results are shown in Table 10. Columns (1), (2), and (3) of Table 10 display GIHPF in the western, central, and eastern regions, respectively. The findings suggest that, there is no significant relationship between CD and GIHPF in the Western region. However, in both the central and eastern regions, CD has a positive impact on GI in these firms. Notably, the regression coefficient for firms in the central region is higher (0.053, significant at the 5% level). In particular, CD appears to have a stronger positive effect on GIHPF in the central region compared to those in the eastern region. Furthermore, since there are three regression groups, two Chow tests must be conducted to assess coefficient heterogeneity. The Chow tests identify whether the regression coefficients differ significantly across regions [81]. According to Table 10, the p-values for the Chow tests in columns (1), (2), and (3) are all statistically significant. This strongly rejects the null hypothesis of no structural change, indicating that the regression coefficients differ significantly before and after the cut-off point.
Several factors contribute to this regional divergence. First, a substantial gap remains in the policy frameworks supporting GI between less-developed and more-developed regions in China [31]. The eastern region benefits from advanced economic development, a mature technological infrastructure, robust policy support, and an industrial structure heavily concentrated in high-tech sectors. As a result, many heavily polluting firms in the east have already completed the initial stages of GI, including digitalization and technological upgrading [82]. Therefore, the marginal benefits of further digitalization on GIHPF tend to be lower.
In contrast, the central region still features a dominant presence of traditional heavily polluting industries, while also enjoying relatively better infrastructure and government support compared to the western region [31]. Companies in this region face dual pressures from regulatory authorities and market stakeholders, prompting them to prioritize green development in order to secure policy incentives and enhance market competitiveness. In this context, CD has become a critical tool for companies in the central region to accelerate GI and transition toward sustainable development.
The western region presents a different scenario. Due to underdeveloped economic conditions, complex terrain, and significant gaps in transportation infrastructure, companies in the west are more focused on survival than on environmental innovation. Limited resources and weaker policy enforcement further constrain their capacity to leverage digital technologies for GI.

4.7.3. Firm Lifecycle

This study further examines the heterogeneous effects of CD on GIHPF across different stages of the firm lifecycle. Following the mainstream classification approach in prior literature, this study divides firm lifecycle into three stages: growing period, mature period, and recession period [7,38]. The results are reported in Table 11. Columns (1), (2), and (3) present the regression results for firms in the growing, mature, and recession periods, respectively. The findings show that CD has a significantly positive effect on GIHPF in both the growing and mature periods, with coefficients of 0.050 and 0.047, respectively, both significant at the 5% level. In contrast, the effect of CD on GIHPF in the recession period is not statistically significant. The results of Chow test indicate that the differences in coefficients across lifecycle stages are statistically significant, suggesting clear heterogeneity in the impact of CD on GIHPF.
For firms in the growing period, CD significantly promotes GIHPF. This may be attributed to the strong expansion incentives faced by growing firms. At this stage, firms actively invest in digital technologies to improve operational efficiency, expand production scale, and optimize resource allocation [83]. These improvements not only reduce costs but also create favorable conditions for undertaking GI, as firms are more capable of integrating digital technologies with environmentally oriented innovation activities.
In the mature period, CD continues to exert a positive and significant effect on GIHPF. Firms at this stage often encounter growth bottlenecks and increasing pressure to upgrade their business models. As a result, they are more likely to use digitalization as a tool to facilitate strategic transformation, including investments in GI. In addition, mature firms typically possess more stable financial resources and organizational capabilities, which enable them to support long-term and uncertain GI activities [83].
In contrast, the effect of CD on GIHPF is not significant for firms in the recession period. Firms in this stage are generally more constrained by declining performance, intensified competition, and limited financial resources. Under such conditions, firms tend to prioritize short-term survival over long-term investments, reducing their willingness to engage in risky and resource-intensive GI activities [84]. Consequently, the role of CD in promoting GIHPF becomes less pronounced.

5. Discussion

The relationship between GI and digital transformation has attracted increasing scholarly attention [23,85,86]. However, limited research has examined how digitalization can drive heavily polluting firms to implement GI. This study finds that firms with higher levels of digitalization are generally more proactive in pursuing GI. Further analysis reveals that digital transformation not only directly facilitates GI but also strengthens corporate sustainability incentives through investment in IAA and MA.
Compared with the existing literature, this study makes the following contributions. First, this study enriches the relatively limited literature on the relationship between CD and GIHPF. Using evidence from China’s heavily polluting industries, this study shows that CD significantly promotes GIHPF. This effect arises because firms in such industries typically face substantial barriers to GI, including technological uncertainty, inefficient resource allocation, and financial constraints [60,87]. CD helps to mitigate these challenges by enabling knowledge sharing through modern digital technologies, thereby addressing inefficiencies in resource allocation and gaps in technological awareness. More importantly, the improved transparency brought about by CD enhances corporate financing opportunities. Digital technologies enable financial institutions to strengthen monitoring, expand financing channels, and lower financing costs [68]. In other words, by leveraging digital technologies, firms can alleviate financial constraints and become more willing to engage in GI.
Second, similar patterns have been observed in other regions. Comparative evidence from the EU and the US underscores a similar “twin transition” in which digitally advanced firms are more likely to invest in environmental sustainability. European firms in heavily polluting industries are increasingly engaged in green investments [88]. Furthermore, a recent time-series study based on US data finds that innovation in artificial intelligence and the digital economy significantly reduces CO2 emissions, highlighting the effectiveness of digital-driven green transitions even in mature industrial contexts [89].
Third, this study further advances understanding of the mechanisms linking CD and GIHPF. This study finds that CD promotes GIHPF not only directly but also indirectly through IAA and MA. Unlike prior studies, this study explicitly captures the heterogeneity of IAA by incorporating two dimensions: the number of analysts tracking the firm and the number of analyst research reports focusing on the firm [9,28,61]. The results indicate that IAA plays a partial mediating role in the relationship between CD and GIHPF. This effect suggests that firms with higher levels of CD are more likely to attract greater attention from both analysts and media outlets [9]. Such attention provides crucial external monitoring and increases reputational pressure, thereby fostering the adoption of GIHPF [56,58].
This study expands the theoretical framework of CD and GIHPF. On the one hand, existing studies pay limited attention to the institutional and informational mechanisms behind CD [9,90]. This study uses information asymmetry theory to explain why CD helps reduce information gaps and stimulate GI. The findings show that CD is not only a technical tool but also an important channel for improving information transparency and external supervision. On the other hand, this study also enriches the application of stakeholder theory. The results confirm that IAA and MA act as important external governance forces. CD helps firms disclose more credible information, which attracts more IAA and MA. These intermediaries then strengthen supervision and push firms to improve GI. This mechanism offers a new theoretical explanation for GIHPF.

6. Conclusions and Implications

This study examines the impact of CD on GIHPF using panel data from Chinese listed companies over the period 2012–2023. Building on information asymmetry theory and stakeholder theory, this study explores both the direct effect of CD and the indirect channels through external information intermediaries.
The empirical results show that CD significantly promotes GIHPF, and this finding remains robust across a series of tests. Further analysis indicates that CD enhances GIHPF not only through internal efficiency improvements but also by attracting greater IAA and MA, highlighting the role of external information channels in shaping firms’ GI behavior.
In addition, the results reveal substantial heterogeneity in the effect of CD. The positive impact is more pronounced in non-state-owned firms and firms located in central regions, while it is not statistically significant in state-owned firms and firms in less developed regions. Moreover, differences across firm life cycle stages are also observed. The effect of CD is stronger among firms in the maturity stage, whereas it is weaker among firms in the growth stage, reflecting variations in firms’ strategic priorities and resource allocation patterns at different stages of development. Further, the findings of this study yield both theoretical and policy implications.
Theoretical implication: First, this study extends the literature on CD and GIHPF. Most previous studies discuss the topic at a regional or general firm level [8,26]. This study provides targeted theoretical evidence for heavily polluting industries, which helps clarify the unique constraints and incentives in these industries.
Moreover, this study integrates information asymmetry theory and stakeholder theory to establish a complete analytical framework. The study clarifies that digitalization promotes GI by improving information transparency and attracting external supervision. This view goes beyond the traditional technology-oriented explanation and highlights the role of information and governance mechanisms.
Further, this study identifies heterogeneous effects of CD on GIHPF. The differences across business ownership, regions, and firm lifecycles show that the impact of digitalization is not universal. These findings help explain inconsistent results in previous studies and improve the theoretical accuracy of research in this field.
Policy implication: Policymakers should recognize CD as a critical driver of corporate green upgrading. Promoting the integration of digital technologies into corporate operations can indirectly stimulate GI by enhancing information dissemination and attracting external supervision from analysts and media. Establishing supportive digital infrastructure and encouraging the use of digital management systems in polluting sectors may help accelerate this process.
Moreover, given the role of external supervision in promoting environmentally responsible corporate behavior, regulatory bodies should focus on improving the quality and accessibility of corporate environmental disclosures. By lowering information acquisition costs for market participants such as analysts and media, policymakers can amplify the market-based monitoring effect, which complements formal environmental regulation.
Further, the differentiated impact of digitalization across ownership types and regions suggests the need for tailored policy tools. Instead of implementing uniform mandates, policies should provide targeted incentives that encourage non-state-owned firms and firms in central regions to leverage digital technologies for GI. This approach helps align CD efforts with environmental objectives while respecting the heterogeneity in business ownership and local conditions.

7. Limitations and Future Research

7.1. Limitations

This study acknowledges several limitations. First, this study focuses exclusively on heavily polluting industries, which may limit the generalizability of the findings. Although these industries play a critical role in achieving national sustainability goals, the mechanisms by which CD promotes GI are likely to differ in other industries. Second, the empirical analysis is confined to China. The institutional, regulatory, and market differences between China and other countries may influence the relationship between CD and GI. These contextual factors may affect the generalization of the results to other countries.

7.2. Future Research

Future studies could address these limitations in several ways. Expanding the scope of future research to include a broader range of industries would help determine whether the observed mechanisms apply beyond heavily polluting firms. Furthermore, incorporating international data would provide valuable insights into how different institutional environments shape the interaction between CD and environmental strategies. Cross-country comparisons, particularly involving the United States and EU member states, could test the robustness of these findings and provide a more comprehensive understanding of the global green digital transition.

Author Contributions

Conceptualization, software, validation, formal analysis, resources, data curation, Y.M.; writing—original draft preparation, Y.M.; writing—review and editing, N.F.A.A.; visualization, N.F.A.A.; supervision, N.F.A.A. and Y.M.; funding acquisition, Y.M. All authors have read and agreed to the published version of the manuscript.

Funding

The APC was funded by Yuhang Ma.

Institutional Review Board Statement

Not Applicable.

Informed Consent Statement

Not Applicable.

Data Availability Statement

Data are available on request from the authors.

Conflicts of Interest

The authors declare no conflicts of interest.

Abbreviations

The following abbreviations are used in this manuscript:
CDCorporate digitalization
GIGreen innovation
GIHPFGreen innovation in in heavily polluting firms
MAMedia attention
STSpecially treated
SMESmall and medium-sized enterprise
IAAInvestment analysts’ attention

References

  1. Gu, X.; Wang, Y. Green credit policy and digital transformation of polluting firms: A quasi-natural experiment from China. Front. Environ. Sci. 2023, 11, 1281165. [Google Scholar] [CrossRef]
  2. Rehman, S.U.; Kraus, S.; Shah, S.A.; Khanin, D.; Mahto, R.V. Analyzing the relationship between green innovation and environmental performance in large manufacturing firms. Technol. Forecast. Soc. Change 2021, 163, 120481. [Google Scholar] [CrossRef]
  3. Su, X.; Pan, C.; Zhou, S.; Zhong, X. Threshold effect of green credit on firms’ green technology innovation: Is environmental information disclosure important? J. Clean. Prod. 2022, 380, 134945. [Google Scholar] [CrossRef]
  4. Chang, K.; Luo, D.; Dong, Y.; Xiong, C. The impact of green finance policy on green innovation performance: Evidence from Chinese heavily polluting enterprises. J. Environ. Manag. 2024, 352, 119961. [Google Scholar] [CrossRef]
  5. Sheng, J.; Ding, R.; Yang, H. Corporate green innovation in an aging population: Evidence from Chinese listed companies. Technol. Forecast. Soc. Change 2024, 202, 123307. [Google Scholar] [CrossRef]
  6. Roh, T.; Lee, K.; Yang, J.Y. How do intellectual property rights and government support drive a firm’s green innovation? The mediating role of open innovation. J. Clean. Prod. 2021, 317, 128422. [Google Scholar] [CrossRef]
  7. Zhou, W.; Cheng, J.; Yang, H.; Zhang, R.; Xie, H. Green Bellwether: How Do Government Environmental Concerns Influence Corporate Environmental Information Disclosure? Sustainability 2026, 18, 477. [Google Scholar] [CrossRef]
  8. Hao, X.; Li, Y.; Ren, S.; Wu, H.; Hao, Y. The role of digitalization on green economic growth: Does industrial structure optimization and green innovation matter? J. Environ. Manag. 2023, 325, 116504. [Google Scholar] [CrossRef] [PubMed]
  9. Qin, L.; Chen, C.; Chen, Y.; Su, Y. Digital financial inclusion, analyst attention, and the green innovation in energy firms. Financ. Res. Lett. 2024, 67, 105947. [Google Scholar] [CrossRef]
  10. Yang, Y.; Wang, Y. Research on the Impact of Environmental Regulations on the Green Innovation Efficiency of Chinese Industrial Enterprises. Pol. J. Environ. Stud. 2021, 30, 1433–1445. [Google Scholar] [CrossRef]
  11. Huang, J.-W.; Li, Y.-H. Green innovation and performance: The view of organizational capability and social reciprocity. J. Bus. Ethics 2017, 145, 309–324. [Google Scholar] [CrossRef]
  12. Wang, Q.; Sun, T.; Li, R. Does artificial intelligence promote green innovation? An assessment based on direct, indirect, spillover, and heterogeneity effects. Energy Environ. 2025, 36, 1005–1037. [Google Scholar] [CrossRef]
  13. Sethi, L.; Behera, B.; Sethi, N. Do green finance, green technology innovation, and institutional quality help achieve environmental sustainability? Evidence from the developing economies. Sustain. Dev. 2024, 32, 2709–2723. [Google Scholar] [CrossRef]
  14. He, Z.; Cao, C.; Feng, C. Media attention, environmental information disclosure and corporate green technology innovations in China’s heavily polluting industries. Emerg. Mark. Financ. Trade 2022, 58, 3939–3952. [Google Scholar] [CrossRef]
  15. Dou, J.; Dou, J.; Qin, M.; Su, C.-W. Towards Sustainable Development: Assessing the Significance of World Uncertainty in Green Technology Innovation. Sustainability 2025, 17, 1314. [Google Scholar] [CrossRef]
  16. Zhou, Q.; Wang, S.; Ma, X.; Xu, W. Digital technologies and corporate green innovation: Opening the “black box” of resource orchestration mechanisms. Sustain. Account. Manag. Policy J. 2024, 15, 884–912. [Google Scholar] [CrossRef]
  17. Cui, X.; Wang, C.; Sensoy, A.; Liao, J.; Xie, X. Economic policy uncertainty and green innovation: Evidence from China. Econ. Model. 2023, 118, 106104. [Google Scholar] [CrossRef]
  18. Wang, J.; Xue, Y.; Yang, J. Can proactive boundary-spanning search enhance green innovation? The mediating role of organizational resilience. Bus. Strategy Environ. 2023, 32, 1981–1995. [Google Scholar] [CrossRef]
  19. Zang, J.; Teruki, N.; Ong, S.Y.Y.; Wang, Y. Can Enterprise Digitalization Promote Green Technological Innovation? Evidence from China’s Manufacturing Sector. Sustainability 2025, 17, 1222. [Google Scholar] [CrossRef]
  20. Pagani, M.; Pardo, C. The impact of digital technology on relationships in a business network. Ind. Mark. Manag. 2017, 67, 185–192. [Google Scholar] [CrossRef]
  21. Leão, P.; da Silva, M.M. Impacts of digital transformation on firms’ competitive advantages: A systematic literature review. Strateg. Change 2021, 30, 421–441. [Google Scholar] [CrossRef]
  22. Gao, J.; Xu, N.; Zhou, J. Does Digital Transformation Contribute to Corporate Carbon Emissions Reduction? Empirical Evidence from China. Sustainability 2023, 15, 13414. [Google Scholar] [CrossRef]
  23. Wang, J.; Liu, Y.; Wang, W.; Wu, H. How does digital transformation drive green total factor productivity? Evidence from Chinese listed enterprises. J. Clean. Prod. 2023, 406, 136954. [Google Scholar] [CrossRef]
  24. Jia, L.; Hu, X.; Zhao, Z.; Zhou, T.; Liu, W.; He, B. The Impact of Digitization on Green Innovation Performance: Evidence Based on Panel Data of 228 Prefectural-Level Cities in China. Complexity 2022, 2022, 9442902. [Google Scholar] [CrossRef]
  25. Ning, J.; Yin, Q.; Yan, A. How does the digital economy promote green technology innovation by manufacturing enterprises? Evidence from China. Front. Environ. Sci. 2022, 10, 967588. [Google Scholar] [CrossRef]
  26. Li, J.; Wang, L.; Nutakor, F. Empirical research on the influence of corporate digitalization on green innovation. Front. Environ. Sci. 2023, 11, 1137271. [Google Scholar] [CrossRef]
  27. Wang, T.; Zhao, X.; Li, X. Geographical influences, media attention and enterprise digital transformation. Technol. Forecast. Soc. Change 2025, 210, 123853. [Google Scholar] [CrossRef]
  28. Wang, L.; Cao, L. Analyst attention and corporate green innovation. Financ. Res. Lett. 2024, 60, 104924. [Google Scholar] [CrossRef]
  29. Guo, C.; Li, R.; Yuan, B. Mathematical models of digital transformation asymmetric information game in energy enterprises. Alex. Eng. J. 2025, 113, 584–592. [Google Scholar] [CrossRef]
  30. Pei, X.; Song, J.; Li, N.; Cao, B. Digital transformation and the spillover of green innovation: Evidence from peer firms in heavily polluting industries. Eur. J. Innov. Manag. 2025, 28, 4257–4283. [Google Scholar] [CrossRef]
  31. Song, Y.; Yang, T.; Zhang, M. Research on the impact of environmental regulation on enterprise technology innovation—An empirical analysis based on Chinese provincial panel data. Environ. Sci. Pollut. Res. 2019, 26, 21835–21848. [Google Scholar] [CrossRef]
  32. Zhang, H.; Wu, J.; Mei, Y.; Hong, X. Exploring the relationship between digital transformation and green innovation: The mediating role of financing modes. J. Environ. Manag. 2024, 356, 120558. [Google Scholar] [CrossRef]
  33. Li, X.; Guo, F.; Wang, J. A path towards enterprise environmental performance improvement: How does CEO green experience matter? Bus. Strategy Environ. 2024, 33, 820–838. [Google Scholar] [CrossRef]
  34. Akerlof, G. The market for lemons: Qualitative uncertainty and the market mechanism d. Q. J. Econ. 1970, 89, 488–500. [Google Scholar] [CrossRef]
  35. Stiglitz, J.E.; Weiss, A. Credit rationing in markets with imperfect information. Am. Econ. Rev. 1981, 71, 393–410. [Google Scholar]
  36. Tsvetkov, V.Y. Information asymmetry as a risk factor. Eur. Res. 2014, 86, 1937–1943. [Google Scholar] [CrossRef]
  37. Balakrishnan, R. Information acquisition and resource allocation decisions. Account. Rev. 1991, 66, 120–139. [Google Scholar] [CrossRef]
  38. Chen, N.; Yan, N.; Xie, H.; Ou, Y. Impact of media attention on corporate green innovation: What is the role of dual environmental regulation? Int. Rev. Financ. Anal. 2024, 96, 103553. [Google Scholar] [CrossRef]
  39. Xia, G.; Yu, Z.; Peng, X. How Does Enterprise Digital Transformation Affect Total Factor Productivity? Based on the Information Intermediary Role of Analysts’ Attention. Sustainability 2023, 15, 8601. [Google Scholar] [CrossRef]
  40. Martínez-Ferrero, J.; Ramón-Llorens, M.C.; García-Meca, E. CEO narcissism and ESG misconduct. Res. Int. Bus. Financ. 2024, 69, 102284. [Google Scholar] [CrossRef]
  41. Wang, Y.; He, Z.; Zou, J.; Xie, H.; Bao, J. Energy transition for sustainable economy: What is the role of government governance and public concern? Financ. Res. Lett. 2024, 69, 106087. [Google Scholar] [CrossRef]
  42. Freeman, R.E. The Politics of Stakeholder Theory: Some Future Directions. Bus. Ethics Q. 1994, 4, 409–421. [Google Scholar] [CrossRef]
  43. Xu, Q.; Li, X.; Dong, Y.; Guo, F. Digitization and green innovation: How does digitization affect enterprises’ green technology innovation? J. Environ. Plan. Manag. 2023, 68, 1282–1311. [Google Scholar] [CrossRef]
  44. Wang, X.; Yao, Z.; Ma, C.; Wang, C. Does digital economy policy benefit green innovation? Evidence from heavily polluting industries in China. Ind. Innov. 2024, 31, 377–407. [Google Scholar] [CrossRef]
  45. Qiao, P.; Liu, S.; Fung, H.-G.; Wang, C. Corporate green innovation in a digital economy. Int. Rev. Econ. Financ. 2024, 92, 870–883. [Google Scholar] [CrossRef]
  46. Zakaria, M.; Aoun, C.; Liginlal, D. Objective sustainability assessment in the digital economy: An information entropy measure of transparency in corporate sustainability reporting. Sustainability 2021, 13, 1054. [Google Scholar] [CrossRef]
  47. Wilson, K.B.; Karg, A.; Ghaderi, H. Prospecting non-fungible tokens in the digital economy: Stakeholders and ecosystem, risk and opportunity. Bus. Horiz. 2022, 65, 657–670. [Google Scholar] [CrossRef]
  48. Wang, L.; Chen, L.; Li, Y. Digital economy and urban low-carbon sustainable development: The role of innovation factor mobility in China. Environ. Sci. Pollut. Res. 2022, 29, 48539–48557. [Google Scholar] [CrossRef]
  49. Cai, C.; Tu, Y.; Li, Z. Enterprise digital transformation and ESG performance. Financ. Res. Lett. 2023, 58, 104692. [Google Scholar] [CrossRef]
  50. Li, S.; Zhang, M. The impact of analysts’ attention and research reports’ attention on corporate bond credit spreads in China. Procedia Comput. Sci. 2022, 199, 284–292. [Google Scholar] [CrossRef]
  51. Anctil, R.M.; Dickhaut, J.; Kanodia, C.; Shapiro, B. Information transparency and coordination failure: Theory and experiment. J. Account. Res. 2004, 42, 159–195. [Google Scholar] [CrossRef]
  52. Francis, J.R.; Neuman, S.S.; Newton, N.J. Does tax planning affect analysts’ forecast accuracy? Contemp. Account. Res. 2019, 36, 2663–2694. [Google Scholar] [CrossRef]
  53. Feng, G.-F.; Niu, P.; Wang, J.-Z.; Liu, J. Capital market liberalization and green innovation for sustainability: Evidence from China. Econ. Anal. Policy 2022, 75, 610–623. [Google Scholar] [CrossRef]
  54. Pan, M.; Meng, J. Impact of Enterprise Digital Transformation on Green Technology Innovation in China: Roles of Carbon Information Disclosure and Media Attention. Sustainability 2025, 17, 10901. [Google Scholar] [CrossRef]
  55. Gourevitch, S.; Deslandes, G. Digitalisation and the need for a “humanistic turn” in media management. J. Media Bus. Stud. 2024, 21, 191–210. [Google Scholar] [CrossRef]
  56. Valero-Gil, J.; Suárez-Perales, I.; Garcés-Ayerbe, C.; Rivera-Torres, P. Navigating toward the promised land of digitalization and sustainability convergence. Technol. Forecast. Soc. Change 2024, 202, 123283. [Google Scholar] [CrossRef]
  57. Liu, X.; Xu, H. Going green with digital media attention: Evidence from Chinese A-share listed companies’ environmental performance. Res. Int. Bus. Financ. 2025, 73, 102617. [Google Scholar] [CrossRef]
  58. Liu, L.; Ge, M.; Ding, Z. Impacts of online media and investor attention on enterprise green innovation. Int. Rev. Econ. Financ. 2024, 96, 103569. [Google Scholar] [CrossRef]
  59. Sun, J.; Hou, S.; Deng, Y.; Li, H. New media environment, green technological innovation and corporate productivity: Evidence from listed companies in China. Energy Econ. 2024, 131, 107395. [Google Scholar] [CrossRef]
  60. Zheng, Y.; Zhang, Q. Digital transformation, corporate social responsibility and green technology innovation-based on empirical evidence of listed companies in China. J. Clean. Prod. 2023, 424, 138805. [Google Scholar] [CrossRef]
  61. Jing, C.; Keasey, K.; Lim, I.; Xu, B. Analyst coverage and corporate environmental policies. J. Financ. Quant. Anal. 2024, 59, 1586–1619. [Google Scholar] [CrossRef]
  62. Qiu, Y.; Liu, W.; Wu, J. Digital economy and urban green innovation: From the perspective of environmental regulation. J. Environ. Plan. Manag. 2025, 68, 267–289. [Google Scholar] [CrossRef]
  63. Zhao, X.; Yang, M. Can analyst coverage improve green innovation?-Empirical research based on China’s heavy polluting enterprises. In SHS Web of Conferences; EDP Sciences: Les Ulis, France, 2023; p. 03019. [Google Scholar]
  64. Allison, P.D. Fixed Effects Regression Models; SAGE Publications: Thousand Oaks, CA, USA, 2009. [Google Scholar]
  65. Abadie, A.; Athey, S.; Imbens, G.W.; Wooldridge, J.M. When should you adjust standard errors for clustering? Q. J. Econ. 2023, 138, 1–35. [Google Scholar]
  66. Lu, F.; Meng, J.; Cheng, B. How does improving agricultural mechanization affect the green development of agriculture? Evidence from China. J. Clean. Prod. 2024, 472, 143298. [Google Scholar] [CrossRef]
  67. Baron, R.M.; Kenny, D.A. The moderator–mediator variable distinction in social psychological research: Conceptual, strategic, and statistical considerations. J. Personal. Soc. Psychol. 1986, 51, 1173. [Google Scholar] [CrossRef]
  68. Sun, G.; Fang, J.; Li, J.; Wang, X. Research on the impact of the integration of digital economy and real economy on enterprise green innovation. Technol. Forecast. Soc. Change 2024, 200, 123097. [Google Scholar] [CrossRef]
  69. Alfons, A.; Ateş, N.Y.; Groenen, P.J. A robust bootstrap test for mediation analysis. Organ. Res. Methods 2022, 25, 591–617. [Google Scholar] [CrossRef]
  70. Yan, Q.; Yan, J.; Zhang, D.; Bi, S.; Tian, Y.; Mubeen, R.; Abbas, J. Does CEO power affect manufacturing firms’ green innovation and organizational performance? A mediational approach. Sustainability 2024, 16, 6015. [Google Scholar] [CrossRef]
  71. Liu, M.; Huang, X.; Wang, P.; Liao, Y. Enterprise digitalization, organizational slack, and green innovation. Int. Rev. Econ. Financ. 2025, 103, 104443. [Google Scholar] [CrossRef]
  72. Bartik, T.J. Who Benefits from State and Local Economic Development Policies? W.E. UPJOHN Institute for Employment Research: Kalamazoo, MI, USA, 1991. [Google Scholar]
  73. Goldsmith-Pinkham, P.; Sorkin, I.; Swift, H. Bartik instruments: What, when, why, and how. Am. Econ. Rev. 2020, 110, 2586–2624. [Google Scholar] [CrossRef]
  74. Chen, Y.; Sun, R.; Zhang, T. Enterprise digital transformation and maturity mismatch: Evidence from China. Appl. Econ. Lett. 2026, 33, 511–515. [Google Scholar] [CrossRef]
  75. Wang, C.; Yan, G.; Ou, J. Does digitization promote green innovation? Evidence from China. Int. J. Environ. Res. Public Health 2023, 20, 3893. [Google Scholar] [CrossRef]
  76. Yang, P.; Hao, X.; Wang, L.; Zhang, S.; Yang, L. Moving toward sustainable development: The influence of digital transformation on corporate ESG performance. Kybernetes 2024, 53, 669–687. [Google Scholar] [CrossRef]
  77. Meelen, T.; Sluijs, J.P. Government-owned enterprises and sustainability: Review and research agenda. Energy Res. Soc. Sci. 2025, 122, 103994. [Google Scholar] [CrossRef]
  78. Zhao, Y.; Xu, H.; Liu, G.; Zhou, Y.; Wang, Y. Can digital transformation improve the quality of enterprise innovation in China? Eur. J. Innov. Manag. 2025, 28, 1034–1060. [Google Scholar] [CrossRef]
  79. Zhao, X.; Sun, X.; Zhao, L.; Xing, Y. Can the digital transformation of manufacturing enterprises promote enterprise innovation? Bus. Process Manag. J. 2022, 28, 960–982. [Google Scholar] [CrossRef]
  80. Liu, R.; Zhang, B.; He, T.; Fan, Y.; Li, S. State Ownership and Green Innovation: The Moderating Role of Digitalization. J. Glob. Inf. Manag. (JGIM) 2024, 32, 20. [Google Scholar] [CrossRef]
  81. Anwar, C.J. Heterogeneity effect of central bank independence on inflation in developing countries. Glob. J. Emerg. Mark. Econ. 2023, 15, 38–52. [Google Scholar] [CrossRef]
  82. Hou, Q.Y.; Zhang, Q. The Effect and Mechanism of ESG Performance on Corporate Debt Financing Costs: Empirical Evidence from Listed Companies in the Heavy-Polluting Industries. Pol. J. Environ. Stud. 2024, 33, 1753–1766. [Google Scholar] [CrossRef]
  83. Pellegrino, G. Barriers to innovation in young and mature firms. J. Evol. Econ. 2018, 28, 181–206. [Google Scholar] [CrossRef]
  84. Shahzad, F.; Fareed, Z.; Wang, Z.; Shah, S.G.M. Do idiosyncratic risk, market risk, and total risk matter during different firm life cycle stages? Phys. A Stat. Mech. Its Appl. 2020, 537, 122550. [Google Scholar] [CrossRef]
  85. Khurram, M.U.; Abbassi, W.; Chen, Y.; Chen, L. Outward foreign investment performance, digital transformation, and ESG performance: Evidence from China. Glob. Financ. J. 2024, 60, 100963. [Google Scholar] [CrossRef]
  86. Vo-Thai, H.-C.; Tran, M.-L. Green innovation strategies in Vietnamese enterprises: Leveraging knowledge management and digitalization for sustainable competitiveness. J. Knowl. Manag. 2025, 29, 1055–1091. [Google Scholar] [CrossRef]
  87. Li, L.; Lin, J.B. Digital transformation for the sustainable development of firms: The role of green capability and green culture. Sustain. Dev. 2024, 32, 1861–1875. [Google Scholar] [CrossRef]
  88. Veugelers, R.; Faivre, C.; Rückert, D.; Weiss, C. The green and digital twin transition: EU vs US firms. Intereconomics 2023, 58, 56–62. [Google Scholar] [CrossRef]
  89. Sultana, A.; Chowdhury, A.A.A.; Rafi, A.H.; Noman, A.A. Role of AI Innovation, Clean Energy and Digital Economy towards Net Zero Emission in the United States: An ARDL Approach. arXiv 2025, arXiv:2503.19933. [Google Scholar] [CrossRef]
  90. Li, M.; Meng, M.; Chen, Y. The impact of the digital economy on green innovation: The moderating role of fiscal decentralization. Econ. Change Restruct. 2024, 57, 37. [Google Scholar] [CrossRef]
Figure 1. The CD-GIHPF Framework. Source: Compiled by the authors.
Sustainability 18 05436 g001
Table 1. Classification of Heavily Polluting Industries.
CodeIndustry Classification
B06Coal mining and washing industry
B07Oil and gas extraction industry
B08The mining and selection of ferrous metals.
B09Non-ferrous metal mining and selection industry
C17Textile Industry
C19Leather, fur, feather, and their product manufacturing, and the footwear industry
C22Paper and paper products industry
C25Petroleum refining, coal coking, and nuclear fuel processing industries.
C26Chemical raw materials and chemical products manufacturing industry
C28Chemical fiber manufacturing industry
C29Rubber and plastic products industry
C30Non-metallic mineral products industry
C31The smelting and rolling processing industry of ferrous metals
C32Non-ferrous metal smelting and rolling processing industry
D44Electricity, heat, and power production and supply industry
Source: Compiled by the authors; Classification criteria are based on the China Securities Regulatory Commission.
Table 2. Measurement Approaches of Variables.
VariableDefinitionSymbolProxy
Dependent VariableGreen InnovationGreInnovln (Number of green patents filed in the year + 1)
Independent VariableCorporate DigitalizationDigitalln (total frequency calculated by text analysis + 1)
Control VariableBoard SizeBoardln (Number of directors on the Board)
Proportion of Independent DirectorsInBoardNumber of independent boards/Number of board members
Firm AgeFirmageln (Age of establishment + 1)
Innovation CapabilityICln (Number of provincial patent applications)
Regional Economic Development LevelELTotal GDP of the province/Total population of the province
Mediating VariableAttention by AnalystsAnalystln (Number of analysts tracking and analyzing companies + 1)
Attention of the Research ReportReportln (Number of research report tracking and analyzing companies + 1)
Media AttentionMedialn (Number of media reports + 1)
Source: Compiled by the authors.
Table 3. Descriptive Statistics and VIF Value.
VariableObsMeanStd.Dev.MinMaxVIF1/VIF
GreInnov69430.3070.6840.0003.664
Digital69430.7500.9250.0004.2341.050.951
Analyst69431.2891.1510.0003.8711.300.768
Report69431.5801.4280.0004.7541.310.762
Media69435.0180.8781.3869.2621.310.764
Board69432.1460.1991.6092.7081.490.670
InBoard69430.3730.0510.2860.6001.400.714
Firmage69432.9810.3061.6093.6381.060.941
IC694310.5701.3174.39412.4001.410.712
EL694315,1548999542349,3521.310.762
Source: Compiled by the authors.
Table 4. Correlational Analysis.
GreInnovDigitalBoardInBoardFirmageICELAnalystReportMedia
GreInnov1
Digital0.057 ***1
Board0.130 ***−0.047 ***1
InBoard0.0110.066 ***−0.515 ***1
Firmage−0.0020.111 ***0.049 ***0.01001
IC0.0190.152 ***−0.167 ***0.055 ***0.051 ***1
EL0.0170.066 ***−0.030 *0.037 **−0.044 ***0.475 ***1
Analyst0.186 ***0.079 ***0.148 ***−0.00700−0.156 ***0.033 **0.078 ***1
Report0.189 ***0.088 ***0.143 ***−0.00600−0.154 ***0.037 **0.079 ***0.988 ***1
Media0.222 ***−0.003000.170 ***0.029 *−0.108 ***−0.156 ***−0.006000.436 ***0.439 ***1
* p < 0.1, ** p < 0.05, *** p < 0.01; Source: Compiled by the authors.
Table 5. Results of the Baseline Model.
(1)(2)(3)(4)
GreInnovGreInnovGreInnovGreInnov
Digital0.042 **0.041 **0.047 **0.036 ***
(0.020)(0.019)(0.021)(0.013)
Control VariableNOYESYESYES
_cons0.276 ***−1.770 ***−0.8721.558 **
(0.022)(0.477)(0.630)(0.731)
N6943694369436943
R20.0030.0310.0790.612
adj. R20.0030.0300.0710.561
F4.7005.7385.5302.745
CompanyNONONOYES
IndustryNONOYESYES
YearNONOYESYES
Clustered (Company) standard errors in parentheses ** p < 0.05, *** p < 0.01. Source: Compiled by the authors.
Table 6. Robustness Test.
(1)(2)(3)(4)(5)
Variables NameGreInnovGreInnovGreInnovGreInnovGreInnov
Digital20.030 **
(0.012)
Digital3 0.002 **
(0.001)
L.Digital 0.030 **
(0.013)
Digital 0.031 **0.036 ***
(0.013)(0.013)
Control VariableYES YESYESYES
_cons1.468 **−1.591 ***1.750 **1.315 *1.558 **
(0.731)(0.213)(0.857)(0.743)(0.733)
N69435174600257156943
R20.6120.0250.6330.6280.612
adj. R20.5600.0240.5790.5680.558
F2.45921.7812.6222.4042.733
FirmYESYESYESYESYES
YearYESYESYESYESYES
IndustryYESYESYESYESYES
ProvinceNONONONOYES
Clustered (Company) standard errors in parentheses * p < 0.1, ** p < 0.05, *** p < 0.01. Source: Compiled by the authors.
Table 7. Results of Endogeneity Test.
(1)(2)(3)(4)(5)
First-StageSecond-StageFirst-StageSecond-Stage
Variables NameDigitalGreInnovDigitalGreInnovGreInnov
Bartik0.178 ***
(0.01)
Digital 0.046 ***
(0.01)
Dummy_Digital 0.206 **0.031 **
(0.091)(0.016)
IMR −0.109 **
(0.05)
Control VariableYESYESYESYESYES
Observations69436943568856886941
R2 0.0170.611
Kleibergen-PaaprkLMstatistic408.513 ***
The first stage F value646.541
FirmYES YES
YearYES YES
IndustryYES YES
Clustered (Company) standard errors in parentheses ** p < 0.05, *** p < 0.01. Source: Compiled by the authors.
Table 8. Mechanism Examination.
(1)(2)(3)(4)(5)(6)
AnalystGreInnovReportGreInnovMediaGreInnov
Digital0.085 ***0.033 ***0.108 ***0.033 ***0.031 **0.035 ***
(0.023)(0.012)(0.029)(0.012)(0.014)(0.009)
Analyst 0.034 ***
(0.012)
Report 0.025 ***
(0.009)
Media 0.024 **
(0.012)
Control VariableYESYESYESYESYESYES
_cons3.482 **1.441 *4.404 **1.446 **3.242 ***1.480 ***
(1.431)(0.735)(1.757)(0.733)(0.845)(0.521)
N694369436943694369436943
R20.6760.6130.6710.6130.6890.612
adj. R20.6340.5620.6270.5620.6480.562
F4.8513.0454.6632.9042.9945.590
FirmYESYESYESYESYESYES
YearYESYESYESYESYESYES
IndustryYESYESYESYESYESYES
Indirect Effect0.01110.01240.0045
95% CI[0.0785, 0.0144][0.0088, 0.0159][0.0009, 0.0081]
Direct Effect0.03020.02900.0367
95% CI[0.0116, 0.0489][0.0104, 0.0476][0.0188, 0.0549]
Clustered (Company) standard errors in parentheses * p < 0.1, ** p < 0.05, *** p < 0.01. Source(s): Compiled by the authors.
Table 9. Business Ownership.
NON-SOESOE
Variables NameGreInnovGreInnov
Digital0.034 ***0.035
(0.013)(0.024)
Control VariableYESYES
_cons0.1734.078 *
(0.674)(2.168)
N37763148
R20.5230.667
adj. R20.4480.623
F1.8841.607
FirmYESYES
YearYESYES
IndustryYESYES
Chow Test30.87 ***
Clustered (Company) standard errors in parentheses * p < 0.1, *** p < 0.01. Source(s): Compiled by the authors.
Table 10. Corporate Location.
WesternCentralEastern
Variables NameGreInnovGreInnovGreInnov
Digital0.0320.053 **0.027 **
(0.025)(0.021)(0.011)
Control VariableYESYESYES
_cons4.551 ***1.8480.978
(1.687)(1.168)(0.662)
N136715733956
R20.5670.6120.632
adj. R20.5060.5630.581
F2.8442.1135.530
FirmYESYESYES
YearYESYESYES
IndustryYESYESYES
Chow Test5.95 ***5.93 ***9.45 ***
Clustered (Company) Standard errors in parentheses ** p < 0.05, *** p < 0.01; Source(s): Compiled by the authors. The Chow test reported in Column (1) evaluates whether the regression coefficients differ significantly between the models represented in columns (1) and (2). The test in Column (2) evaluates the differences between the regressions of columns (2) and (3), while the test in Column (3) evaluates the coefficient differences between the regressions shown in columns (1) and (3).
Table 11. Firm Lifecycle.
Growing PeriodMature PeriodRecession Period
Variables NameGreInnovGreInnovGreInnov
Digital0.050 **0.047 **0.017
(0.020)(0.022)(0.018)
Control VariableYESYESYES
_cons3.513 ***1.2392.043
(1.066)(1.212)(1.272)
N216319622209
R20.7150.6650.629
adj. R20.6160.5570.531
F5.2921.6201.785
FirmYESYESYES
YearYESYESYES
IndustryYESYESYES
Chow Test3.13 ***3.95 ***2.77 ***
Clustered (Company) Standard errors in parentheses ** p < 0.05, *** p < 0.01; Source(s): Compiled by the authors. The Chow test reported in Column (1) evaluates whether the regression coefficients differ significantly between the models represented in columns (1) and (2). The test in Column (2) evaluates the differences between the regressions of columns (2) and (3), while the test in Column (3) evaluates the coefficient differences between the regressions shown in columns (1) and (3).
Disclaimer/Publisher’s Note: The statements, opinions and data contained in all publications are solely those of the individual author(s) and contributor(s) and not of MDPI and/or the editor(s). MDPI and/or the editor(s) disclaim responsibility for any injury to people or property resulting from any ideas, methods, instructions or products referred to in the content.