2.1. Materials
The selection of materials was based on local availability to ensure cost optimization and timely procurement. Among the constituent materials, river sand was of primary importance, as it was partially replaced with BA to evaluate the influence of this replacement on concrete properties. The physical properties of river sand and coarse aggregates are summarized in
Table 1.
River sand (RS) was collected from the Ajay River in West Bengal. Its grading and particle size distribution were evaluated through sieve analysis because these characteristics improve particle packing, reduce voids within the concrete matrix, and significantly influence workability and density. Sieve analysis was conducted in accordance with IS 2386 (Part 1) [
49]. The percentage passing values and particle size distribution discussed in
Section 2.1.4 confirmed that the sand satisfied the Zone II grading requirements specified in IS 383 [
50]. The specific gravity and water absorption of the river sand were also determined in accordance with IS 2386 (Part 3) [
51], as these properties affect mix proportioning, moisture correction, and durability performance of concrete.
Coarse aggregates (CA) of 20 mm and 10 mm sizes were procured from a stone quarry in the Panchami region of West Bengal. The aggregates consisted of crushed particles with rounded-to-angular geometry and a dark, polished surface texture. As the primary load-bearing component of the concrete matrix, the grading and shape characteristics of the aggregates were evaluated due to their significant influence on aggregate interlocking, packing density, workability, and strength performance of concrete. Sieve analysis was conducted in accordance with IS 2386 (Part 1) [
49], which confirmed the grading of the single-size 20 mm and 10 mm aggregates. A 50:50 blend of the two aggregate fractions satisfied the requirements of a combined graded nominal 20 mm CA as specified in IS 383 [
50]. The specific gravity, water absorption, flakiness index, and elongation index of the aggregates were also determined following IS 2386 (Part 3 and Part 1) [
49,
51], as these properties affect the strength, durability, and deformation behavior of concrete.
Ordinary Portland Cement (OPC) of 53 grade was used as the primary binding material in the concrete mixes. Upon hydration with water, the cement formed C–S–H gel, which contributed significantly to the strength development of concrete. The physical properties of cement, including specific gravity, consistency, setting time, and compressive strength, were evaluated because these parameters influence hydration, workability, setting behavior, and strength development. The specific gravity of cement was found to be 3.15, determined using the Le Chatelier flask in accordance with IS 4031 (Part 11) [
52]. Standard consistency, initial setting time, and final setting time were determined using the Vicat apparatus as per IS 4031 (Part 4), and IS 4031 (Part 5) [
53,
54], and were found to be 28%, 120 min, and 215 min, respectively. The compressive strength of cement was determined using 70.6 mm mortar cubes prepared with a cement-to-sand ratio of 1:3 and water content of
by weight of total material in accordance with IS 4031 (Part 6) [
55]. The mortar cubes achieved compressive strengths of 28.00 MPa, 39.50 MPa, and 56.00 MPa at 3, 7, and 28 days, respectively, confirming compliance with IS 269 [
56].
Water used in the concrete mix was sourced from groundwater with a pH value of 7.4, satisfying the requirement of IS 456 [
47]. The quality of mixing water influences cement hydration, setting behavior, strength development, and durability of concrete. Water provided the required workability and facilitated hydration; however, excessive water increases porosity and reduces strength.
A polycarboxylate ether (PCE)-based superplasticizer (SP), modified with a viscosity-modifying agent (VMA) and conforming to IS 9103 [
57], was used to improve workability at a lower water-to-cement ratio. The admixture had a specific gravity of 1.09, a pH of 7.09, and appeared dark reddish-brown.
Bottom ash was the central focus of this study. A thorough evaluation was carried out to characterize its properties and assess its suitability as a partial replacement for river sand in concrete. Since the characteristics of BA vary significantly depending on coal source and combustion conditions, BA samples from different TPPs were considered to evaluate source-dependent variations in concrete performance. BA samples were collected from five major TPPs across India: (a) Anpara-B Thermal Power Station (A-BTPS), Sonebhadra, Uttar Pradesh; (b) Koradi Thermal Power Station (KTPS), Nagpur, Maharashtra; (c) Mettur Thermal Power Station (MTPS), Tamil Nadu; (d) Talcher Super Thermal Power Station (TSTPS), Odisha; and (e) Ukai Thermal Power Station (UTPS), Gujarat. A detailed collection process and the physical, chemical, and microstructural properties of BA are discussed in subsequent sections.
2.1.1. Bottom Ash Handling System and Collection of Samples
Pulverized coal is widely used for power generation; however, complete burnout is rarely achieved despite advances in combustion technology. Consequently, approximately 46% of the coal remains unburned [
15], resulting in the generation of large amounts of coal combustion by-products, mainly fly ash and BA [
18]. The disposal of these by-products poses significant environmental concerns, including land occupation, dust emission [
2], and the potential leaching of hazardous components into soil and groundwater [
58]. According to standard definitions, the ash collected from the bottom of the boiler is classified as BA [
2,
17,
59].
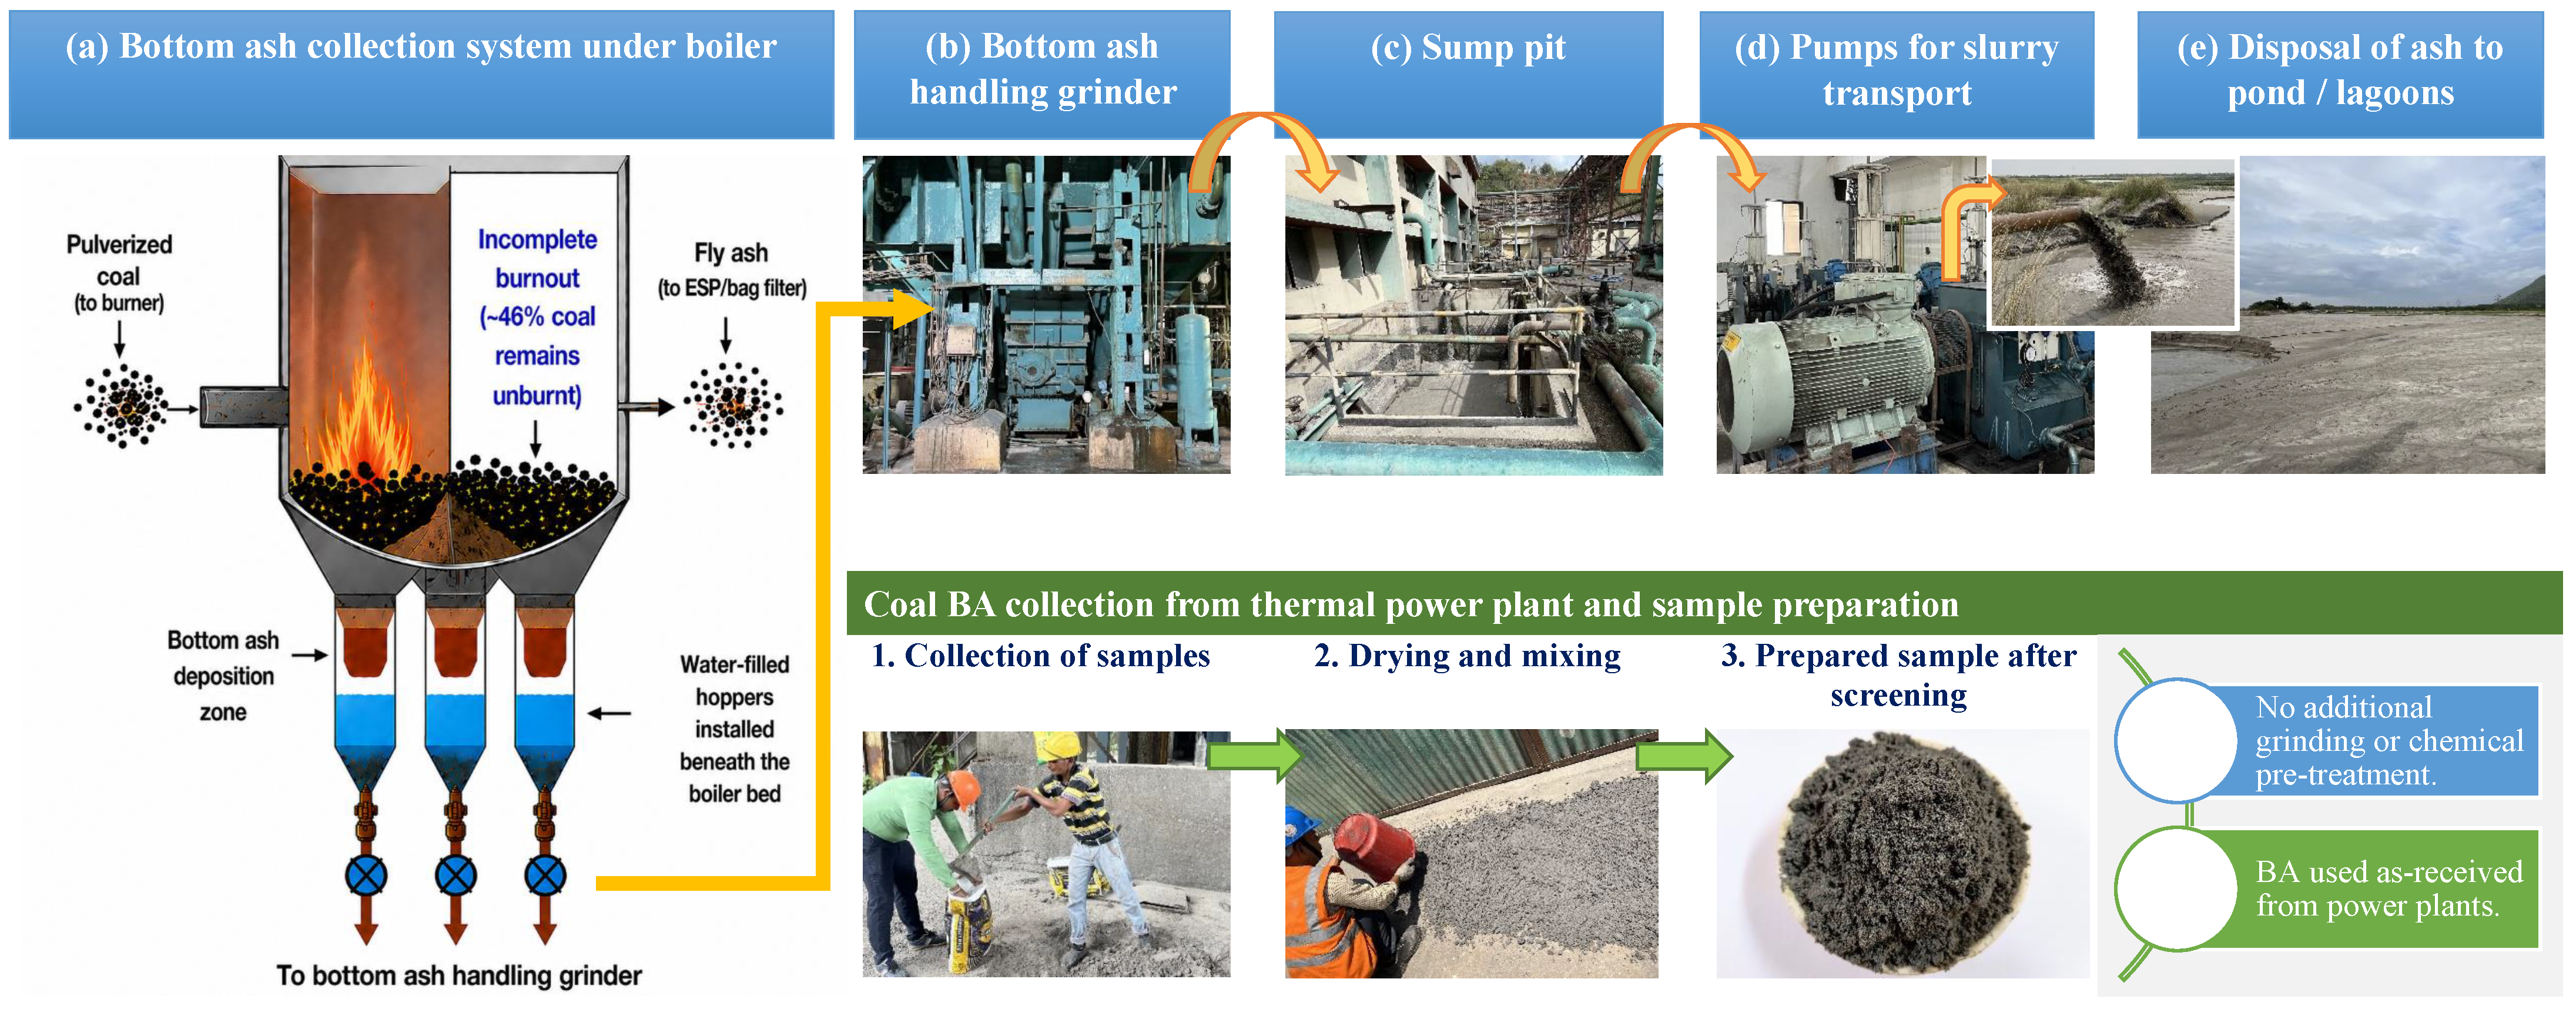
BA is generally collected using a water-filled hopper installed beneath the boiler bed, into which fused residues of partially combusted coal descend. As shown in
Figure 1, large ash clinkers are mechanically crushed by a bottom ash handling grinder (BAHG) located below the hopper outlet to facilitate hydraulic transport through pipelines [
31] using high-pressure pumps. In the wet ash handling system adopted in this study, BA, together with a minor fraction of uncollected fly ash, is first conveyed to a sump pit. The resulting slurry is then discharged into ash ponds or lagoons for disposal. When BA mixes with fly ash under slurry conditions, the material is commonly referred to as pond ash [
59], which exhibits increased fineness due to the presence of fly ash. Such disposal practices raise concerns related to land consumption, and long-term environmental sustainability [
15].
To enable value-added utilization and reduce environmental impacts, the BA used in the present study was collected before its mixing with fly ash in the sump pit, thereby preserving its distinct physical characteristics. Approximately 500 kg of BA was collected from each source using three different batches collected within a single day. After collection, the material, which had already undergone mechanical crushing during handling, was dried to remove free moisture associated with wet collection systems. The dried BA is then hand-mixed to ensure uniformity of the sample, subsequently sieved through a 10 mm sieve to remove any remaining oversized particles. This procedure allowed the evaluation of BA in a condition representative of its as-received state at TPPs, without additional grinding or chemical treatment.
2.1.2. Physical Properties of Bottom Ash
BA is a relatively lightweight material [
17], with a specific gravity ranging from 2.00 to 2.24. Sieve analysis indicates that the particle size distribution of BA is comparable to that of river sand. SEM observations confirm that BA particles possess an uneven surface texture, with shapes varying from angular to sub-rounded and exhibiting an interlocking, porous, popcorn-like morphology [
15] having dark gray colour [
15,
27]. The bulk density of BA ranges from 1320 to 1450 kg/m
3. The detailed physical properties of BA are summarized in
Table 2.
Zeta potential (ZP) is a key physicochemical parameter that characterizes the surface charge of particles suspended in a fluid and governs their dispersion, flocculation, and coagulation behavior [
60]. In cementitious systems, ZP provides insight into particle stability and interparticle interactions, which influence fresh-state properties.
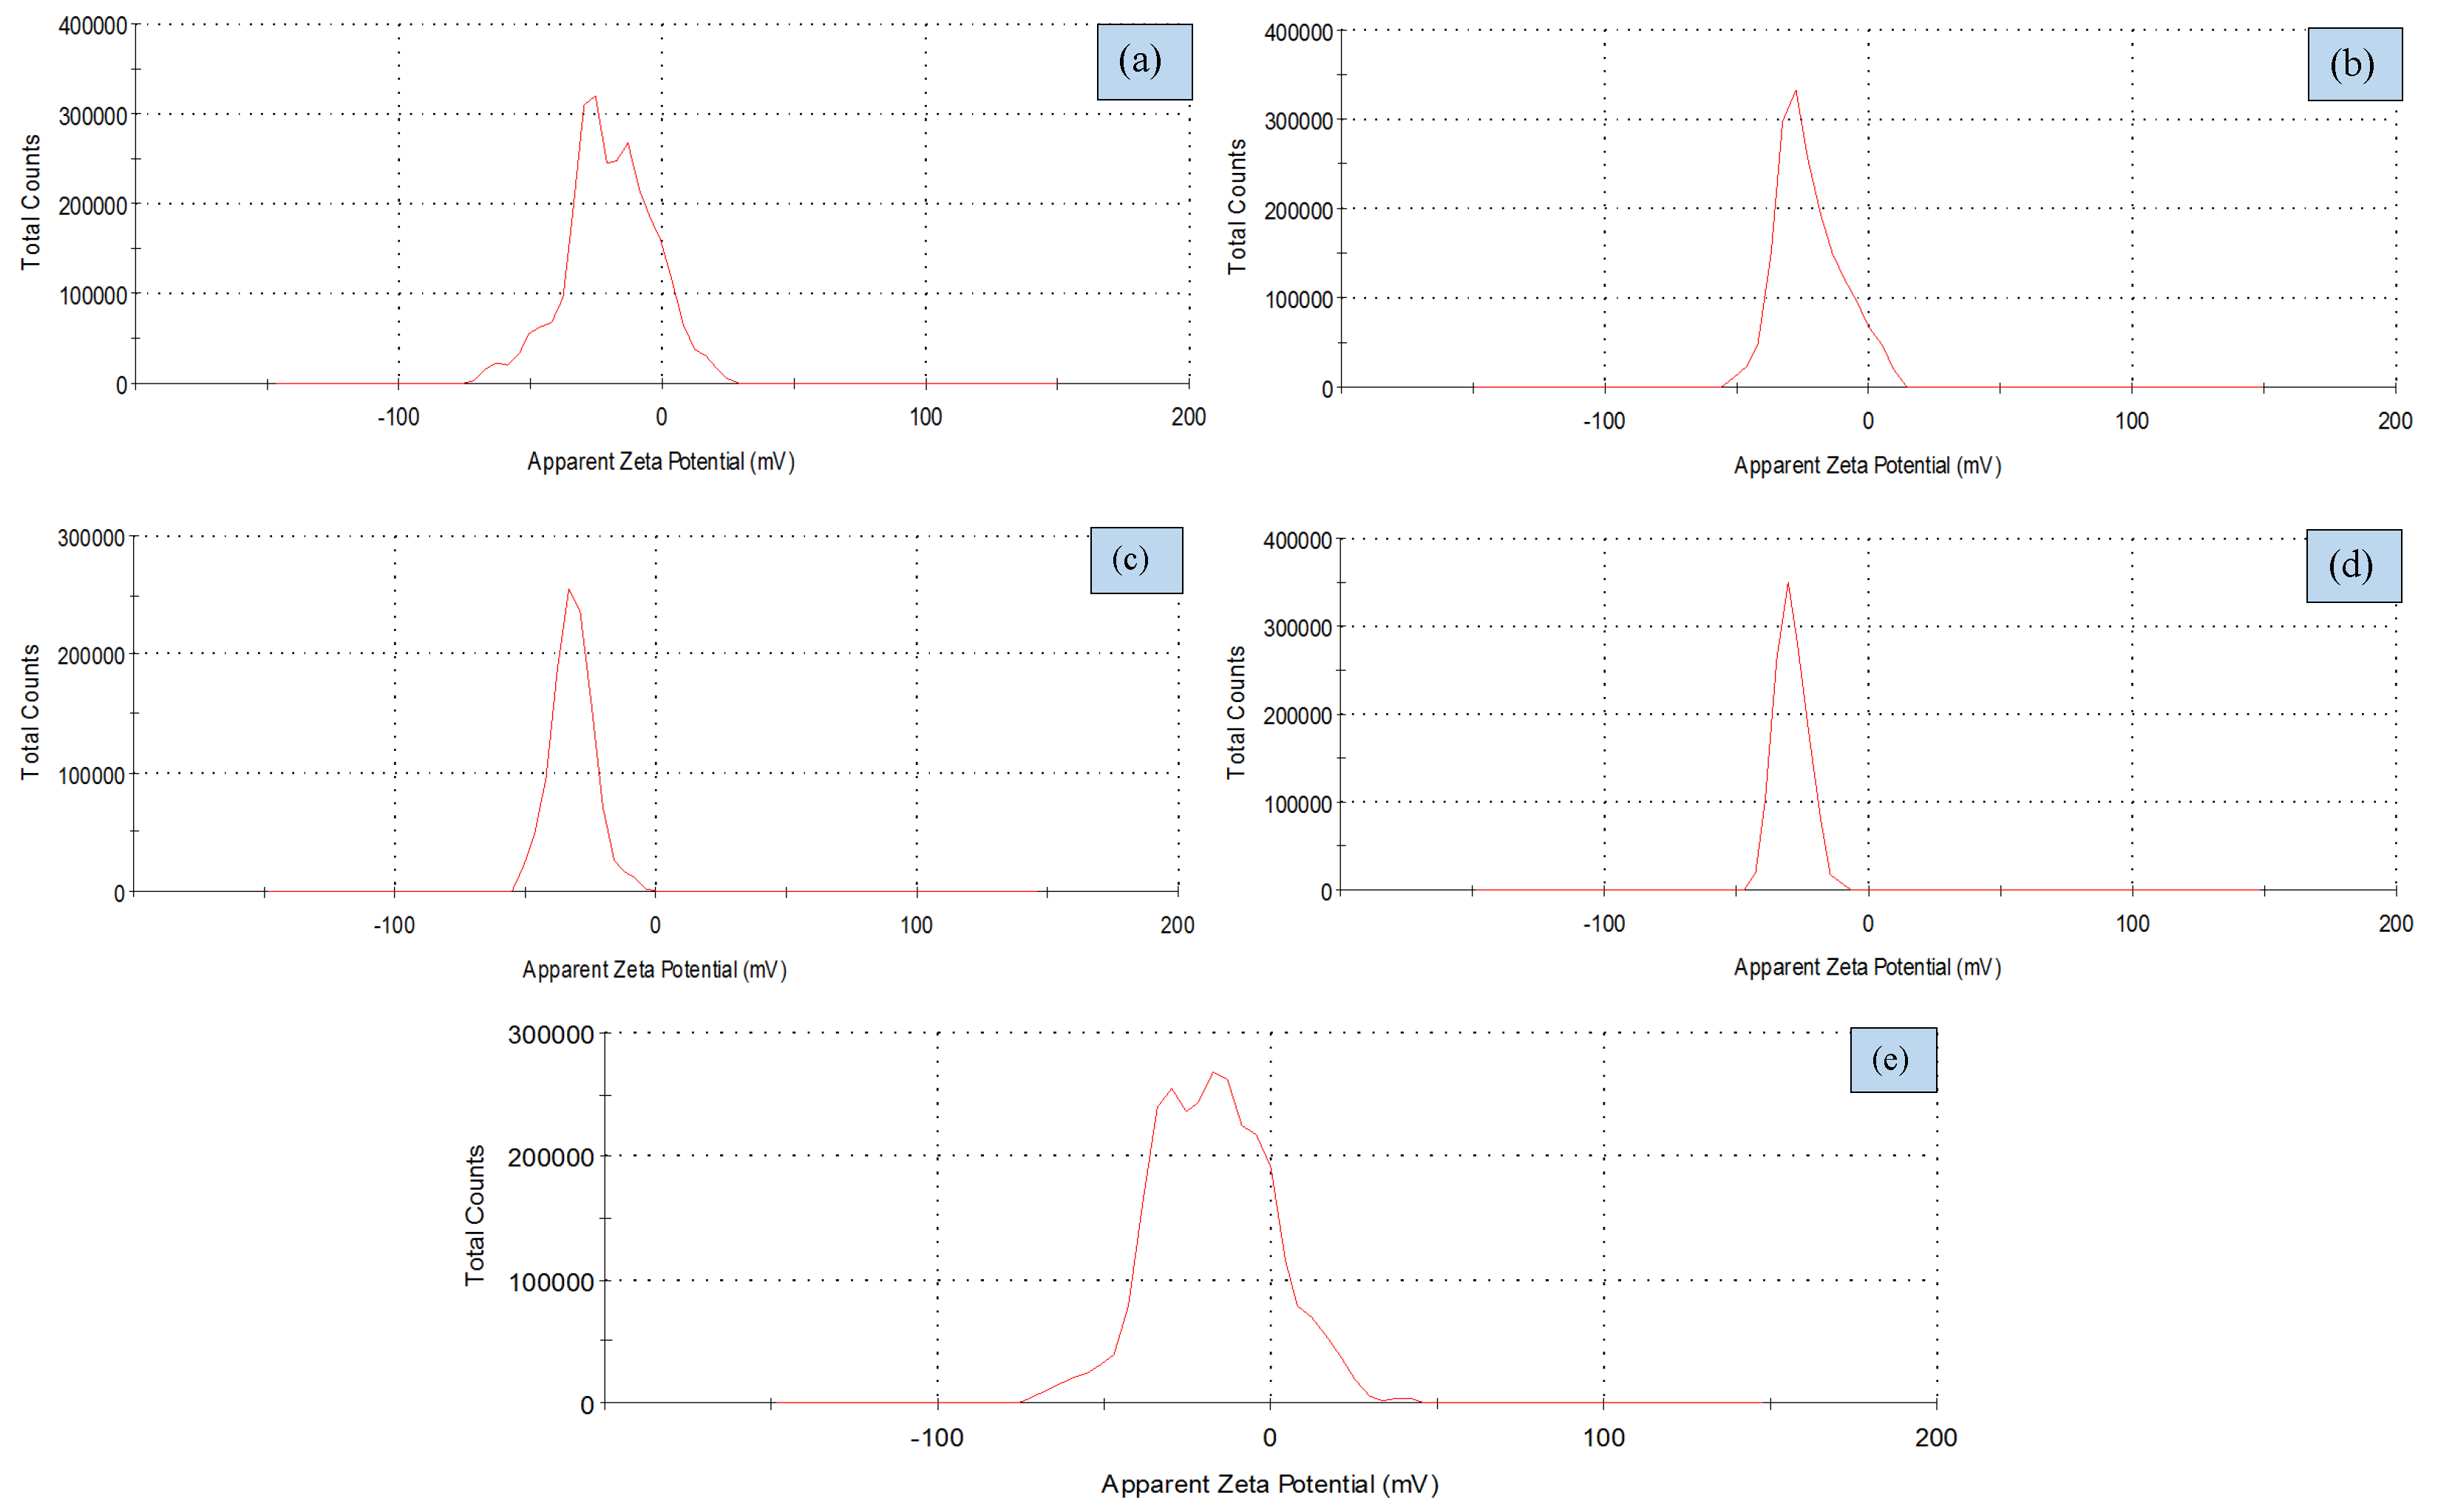
In this study, the ZP of BA was measured by a dynamic light scattering (DLS) test to assess its surface charge characteristics. The measured ZP values ranged from −17.4 mV to −31.7 mV, indicating a predominantly negative surface charge. Such values suggest moderate electrostatic repulsion and a tendency toward controlled flocculation in the cement pore solution. The measured ZP values are summarized in
Table 2, and the corresponding ZP distribution is presented in
Figure 2.
2.1.3. Chemical Properties of Bottom Ash
The compound obtained from a chemical reaction primarily depends on the source of coal [
31], and nature and quantity of the reactants involved. The chemical composition of BA was determined using XRF analysis. The results indicate that silica (SiO
2), alumina (Al
2O
3), and iron oxide (Fe
2O
3) are the predominant constituents, while calcium oxide, magnesium oxide, sulfate, and other oxides are present in minor quantities. These chemical characteristics significantly influence the strength development of concrete incorporating BA.
As summarized in
Table 3, the high combined content of SiO
2, Al
2O
3, and Fe
2O
3 confirms the pozzolanic nature of the material, enabling secondary hydration reactions. Based on IS 3812 [
59] classification and consistent with ASTM C 618-03 [
38], the BA qualifies as siliceous (ASTM class F) ash [
37]. The total oxide content (SiO
2 + Al
2O
3 + Fe
2O
3) for A-BTPS, KTPS, MTPS, TSTPS, and UTPS ranges from 91.40–95.10%, exceeding the ASTM minimum requirement of 70%. Except for KTPS, all samples exhibited negligible CaO content (<1%), indicating limited cementitious behavior and minimal participation in early-age hydration reactions responsible for the formation of primary C–S–H gel as the initial binding phase. However, the high reactive content of SiO
2 promotes pozzolanic reactions of later age with Ca(OH)
2 released during cement hydration, leading to the formation of a secondary hydrate, i.e., C–S-H gel [
5,
10] and the consequent densification of the matrix. Therefore, the observed strength enhancement is primarily attributed to pozzolanic activity at later curing stages.
2.1.4. Particle Size Distribution of River Sand and Bottom Ash
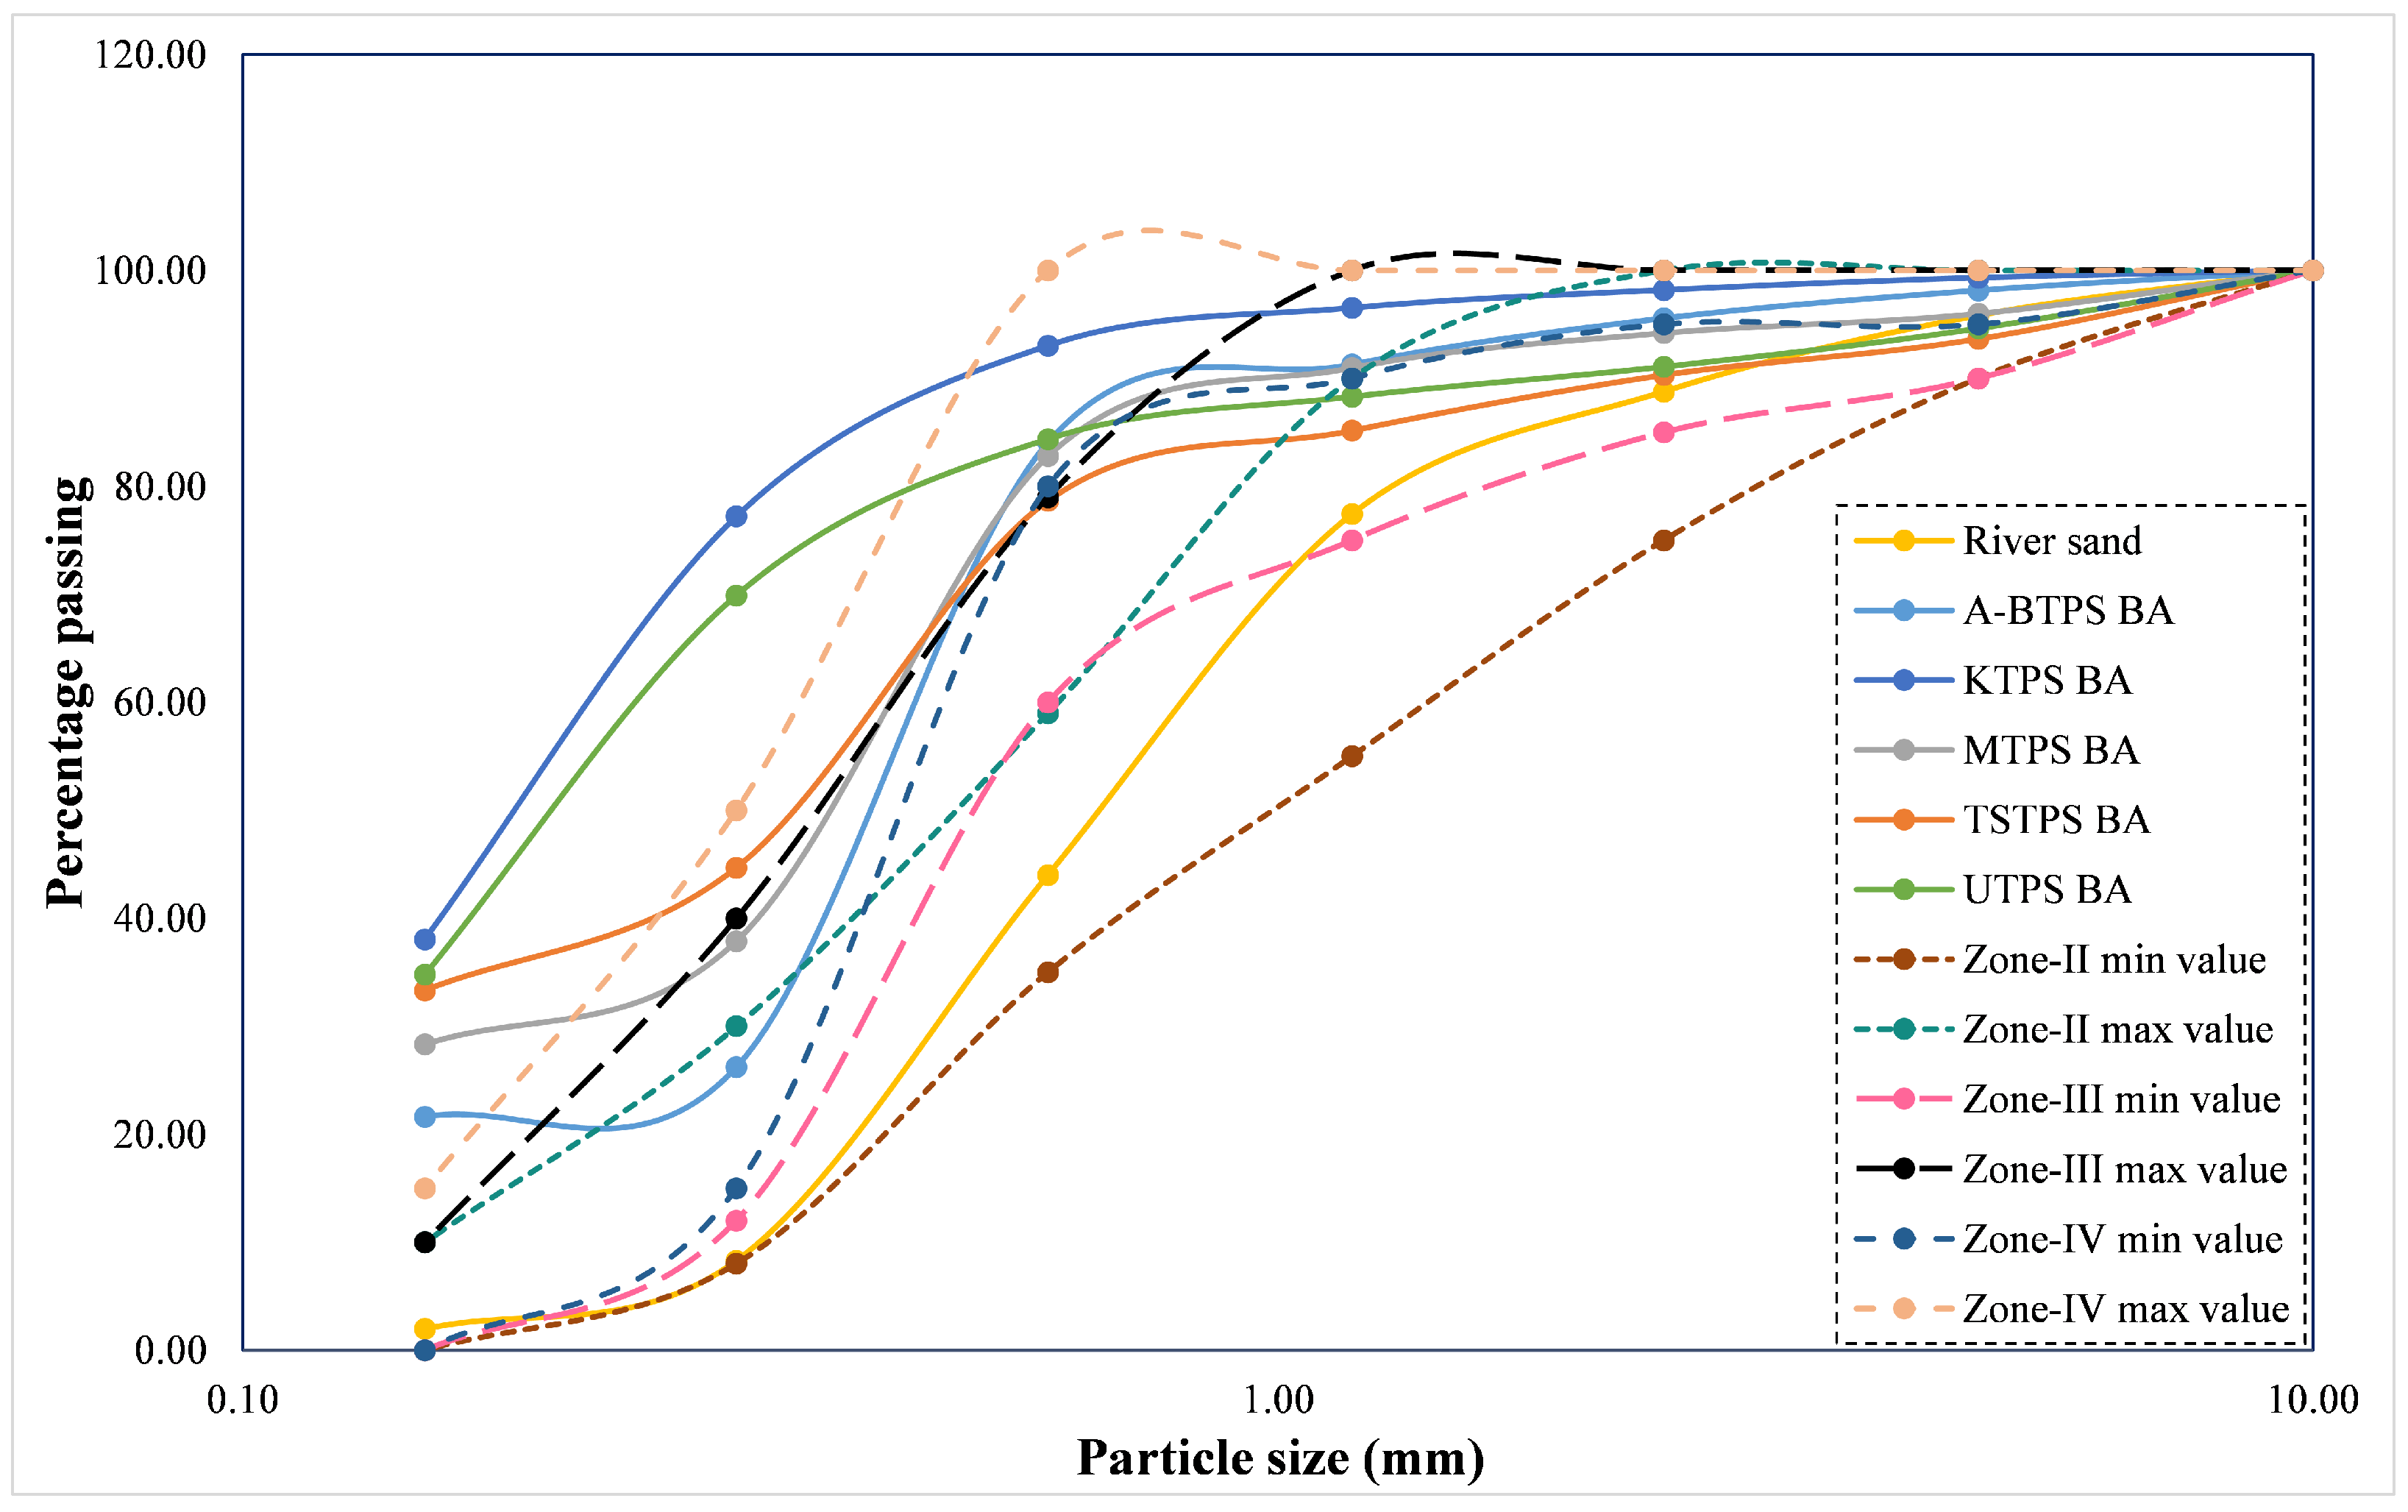
Based on IS 383 [
50], sieve analysis indicated that the BA gradation corresponds to Zone III and Zone IV. When blended with Zone II river sand, partial replacement levels of 20% and 35% shifted the combined gradation to a range between Zone II and Zone III, whereas a 50% replacement resulted in a combined gradation falling within Zone IV. The percentage passing values for river sand and BA are provided in
Table 4. The particle size distribution curves are shown in
Figure 3. The finer BA fractions, reflected in the lower portion of the curve, exhibit pozzolanic activity and contribute to pore structure refinement within the concrete matrix [
10].
2.1.5. Microstructural Properties of Bottom Ash
Scanning electron microscopy (SEM) was performed by mounting the BA samples on a glass plate using an adhesive.
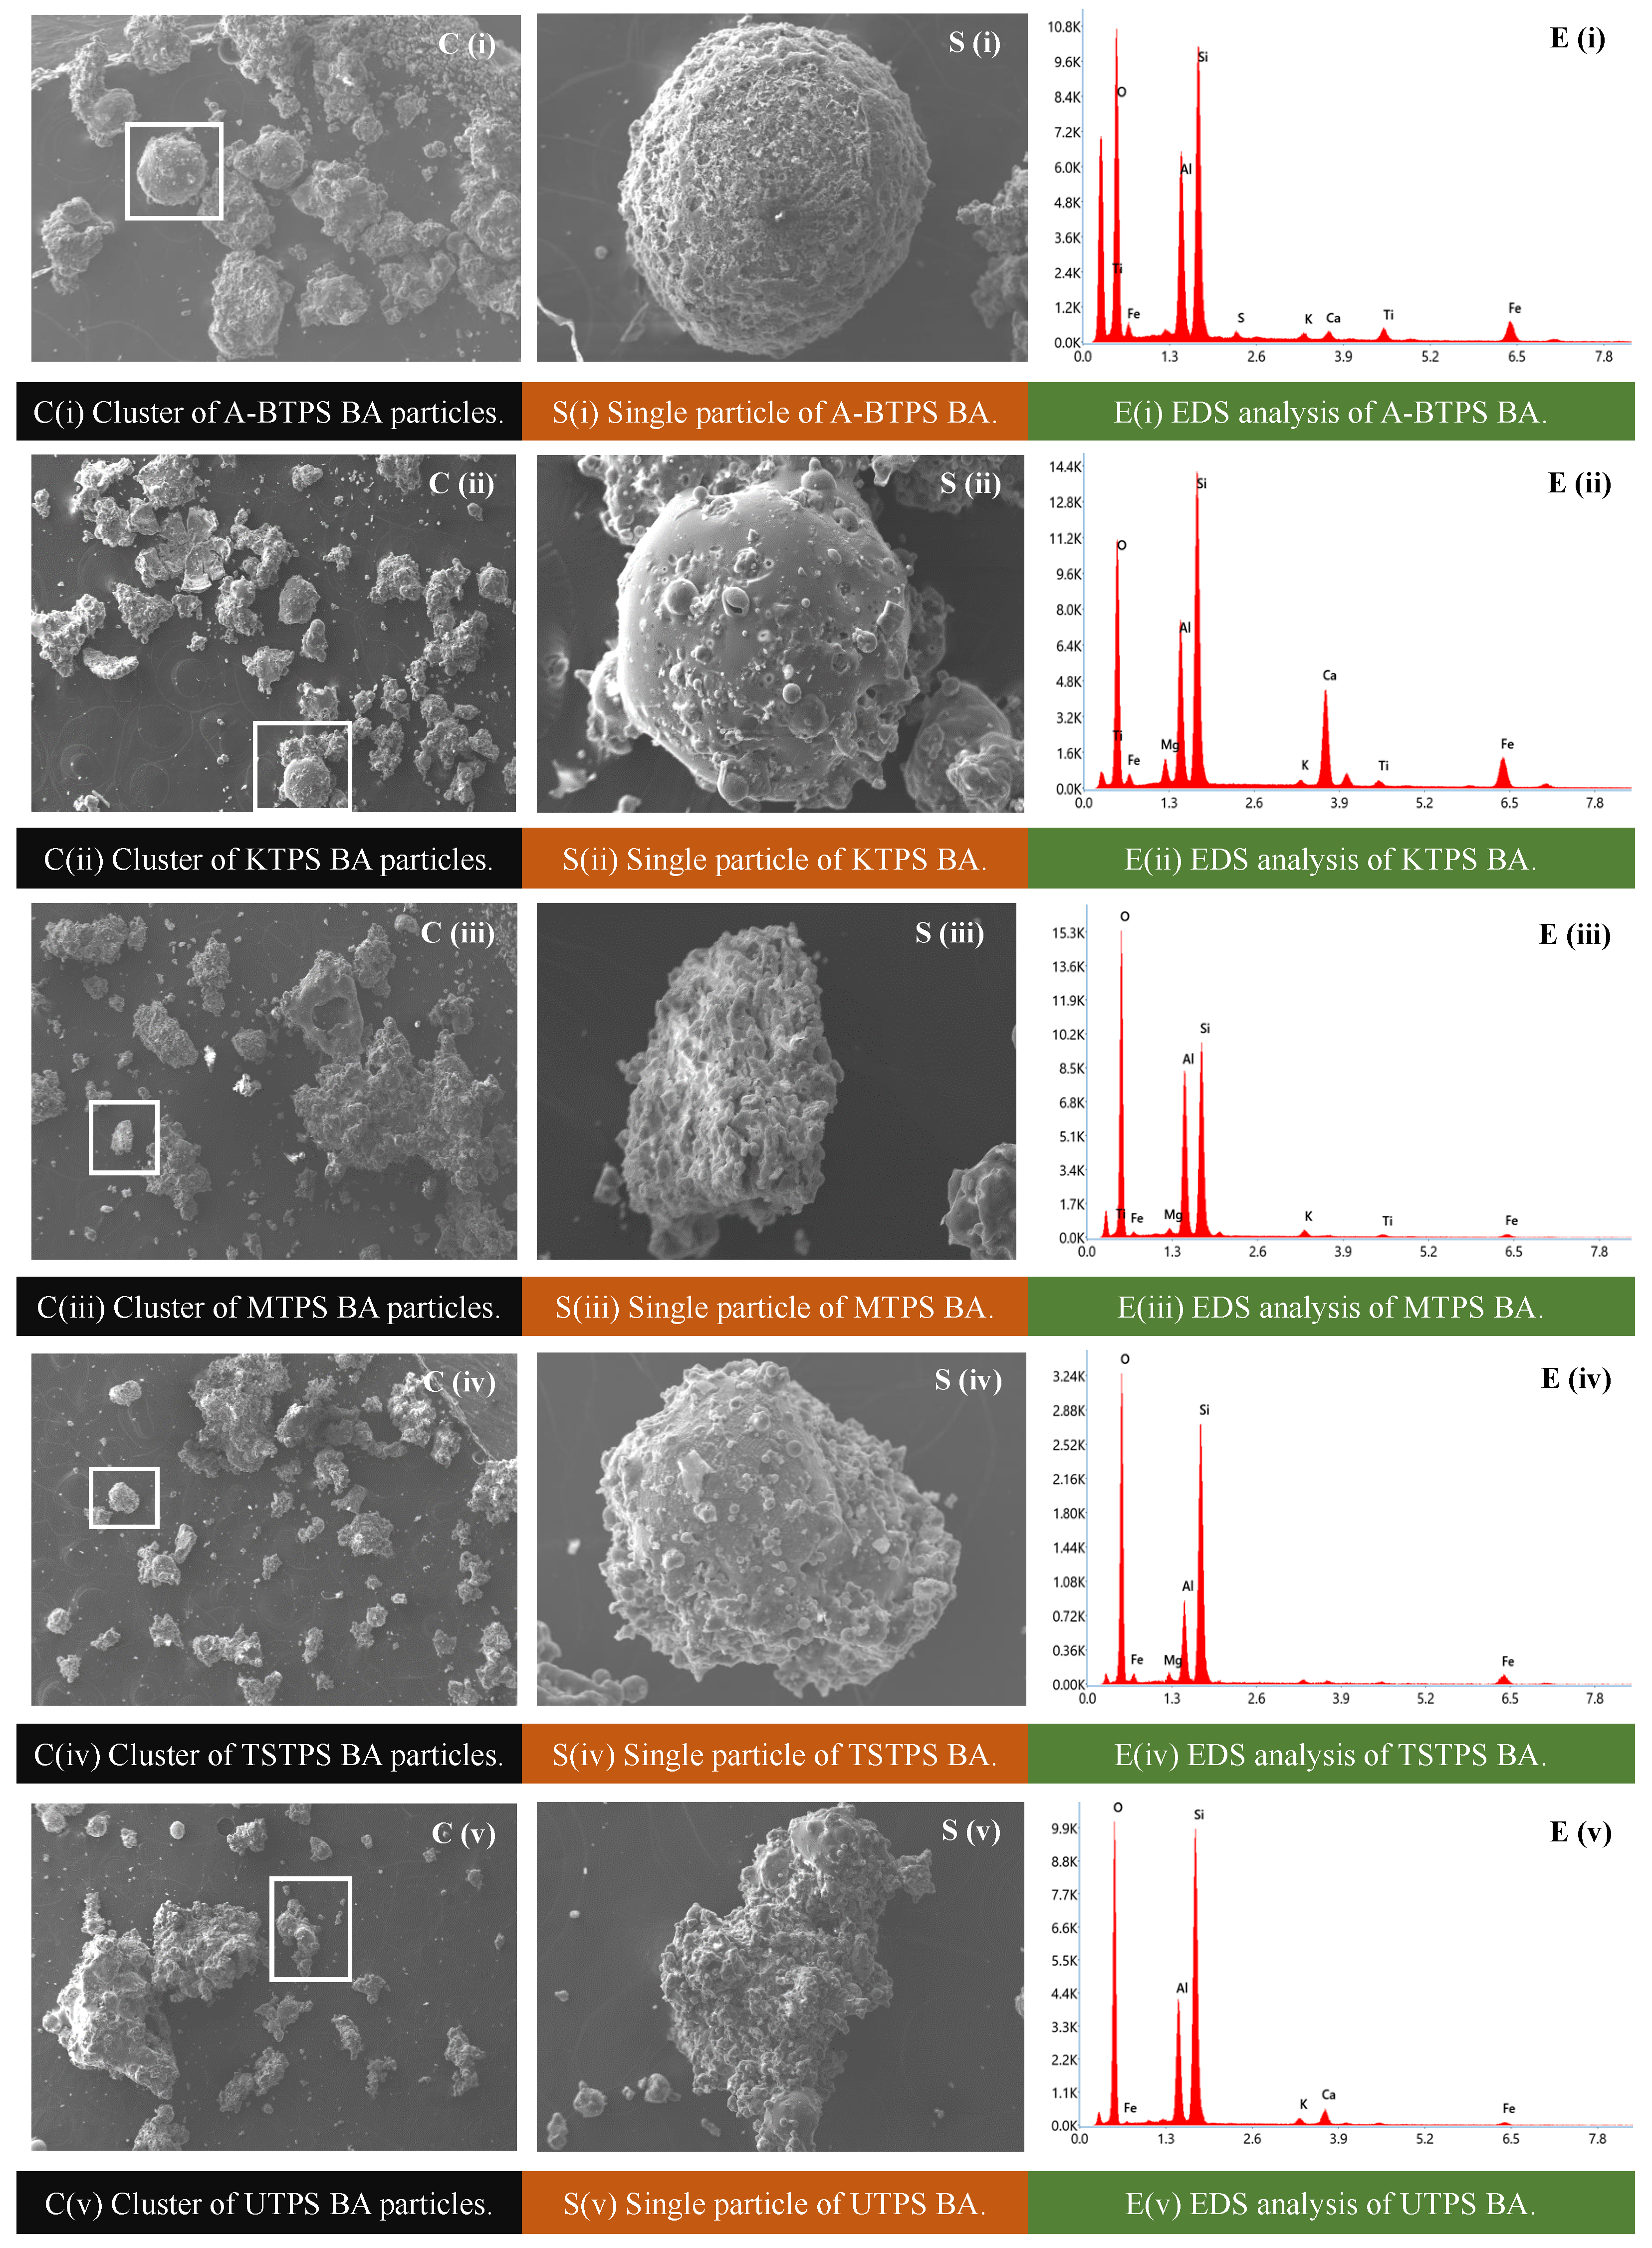
Figure 4C(i)–C(v),S(i)–S(v) present SEM images of clustered and individual/single BA particles collected from five different TPPs, illustrating their morphology and surface texture. The microstructural observations provide a clear understanding of the physical form and textural characteristics of the material. The SEM images reveal that the BA particles are predominantly angular and rough-textured, exhibiting a porous, popcorn-like morphology, while some particles show partial sphericity.
Figure 4S(i),S(ii),S(iv) show that the BA particles from A-BTPS, KTPS, and TSTPS are rounded to sub-rounded in shape with rough surface textures. In contrast, the MTPS BA exhibits a popcorn-like morphology with hollow internal structures (
Figure 4C(iii)), which may influence the strength and durability characteristics of concrete. The UTPS BA particles exhibit angular and irregular shapes, as shown in
Figure 4S(v).
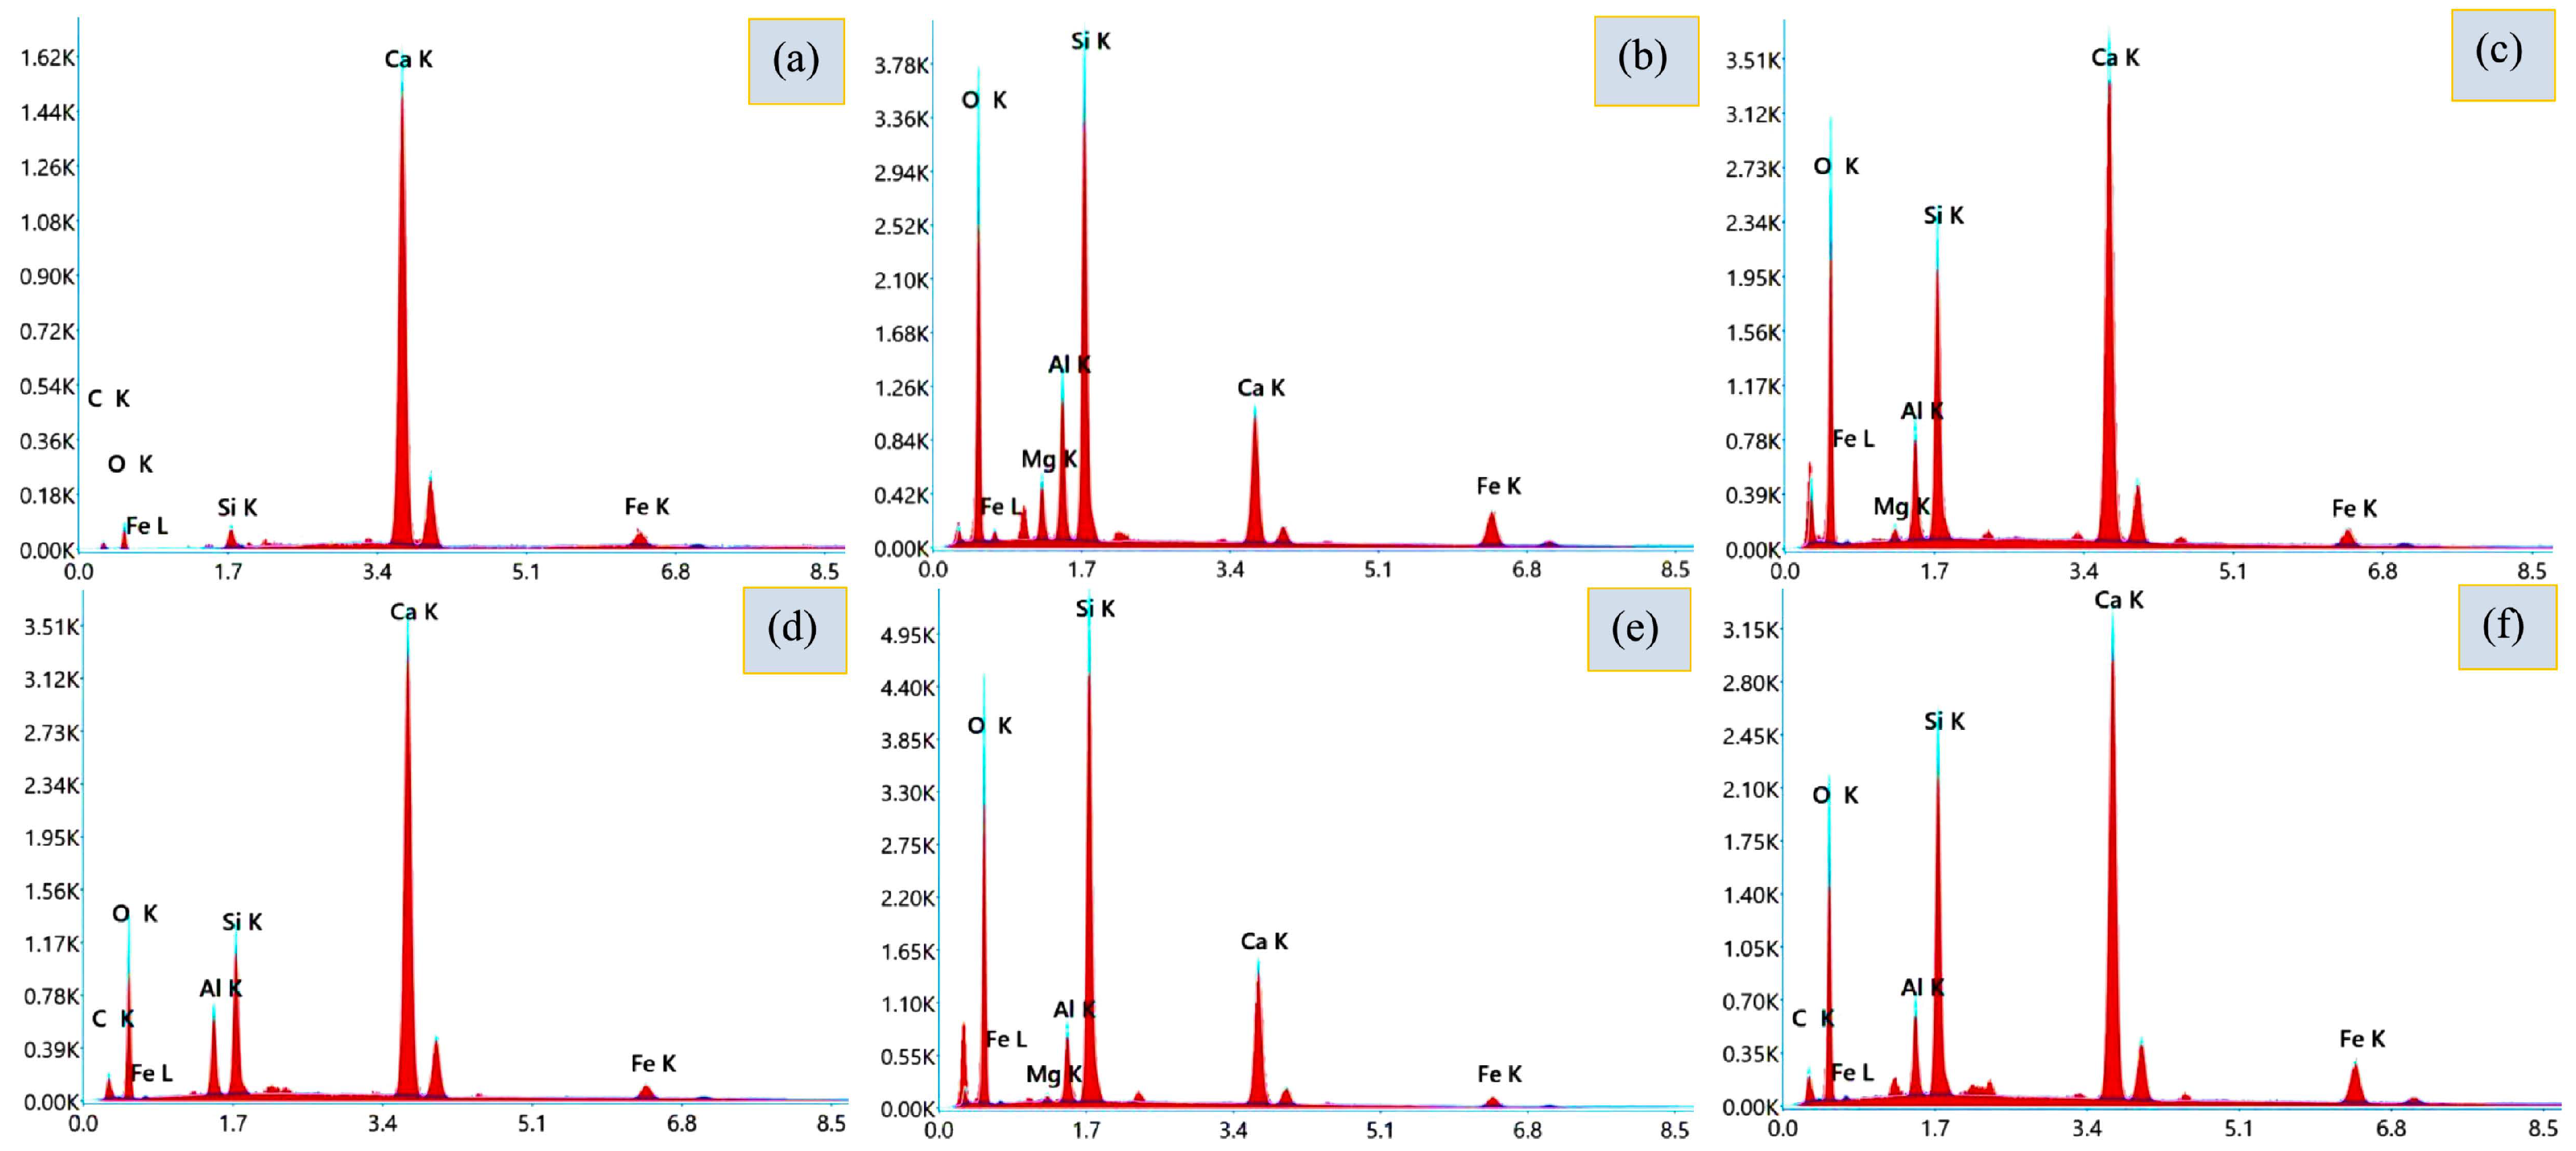
Energy-dispersive spectroscopy (EDS), coupled with SEM, was used to examine the elemental composition and morphology of the BA particles simultaneously. The EDS analysis confirmed the presence of the major elemental constituents in the BA, as shown in
Figure 4E(i)–E(v), including Si, Al, Fe, O, Ca, and Mg. The high intensities of the Si and Al peaks are generally consistent with the chemical composition results presented in
Table 3. The highest Si peak intensity was observed for KTPS, followed by A-BTPS, UTPS, MTPS, and TSTPS. However, the EDS results indicate a relatively higher Si content in KTPS BA, which is inconsistent with the XRF-based chemical analysis showing lower SiO
2 content for KTPS BA. This variation may be attributed to the localized nature of EDS analysis, which reflects the elemental composition at a specific spot or region of the sample surface, whereas XRF provides the bulk chemical composition of the material.
A comparatively high Al peak intensity was observed in the MTPS BA. The elevated alumina content may influence the hydration characteristics of the cementitious system and alter the formation of hydration products in the concrete matrix [
61].
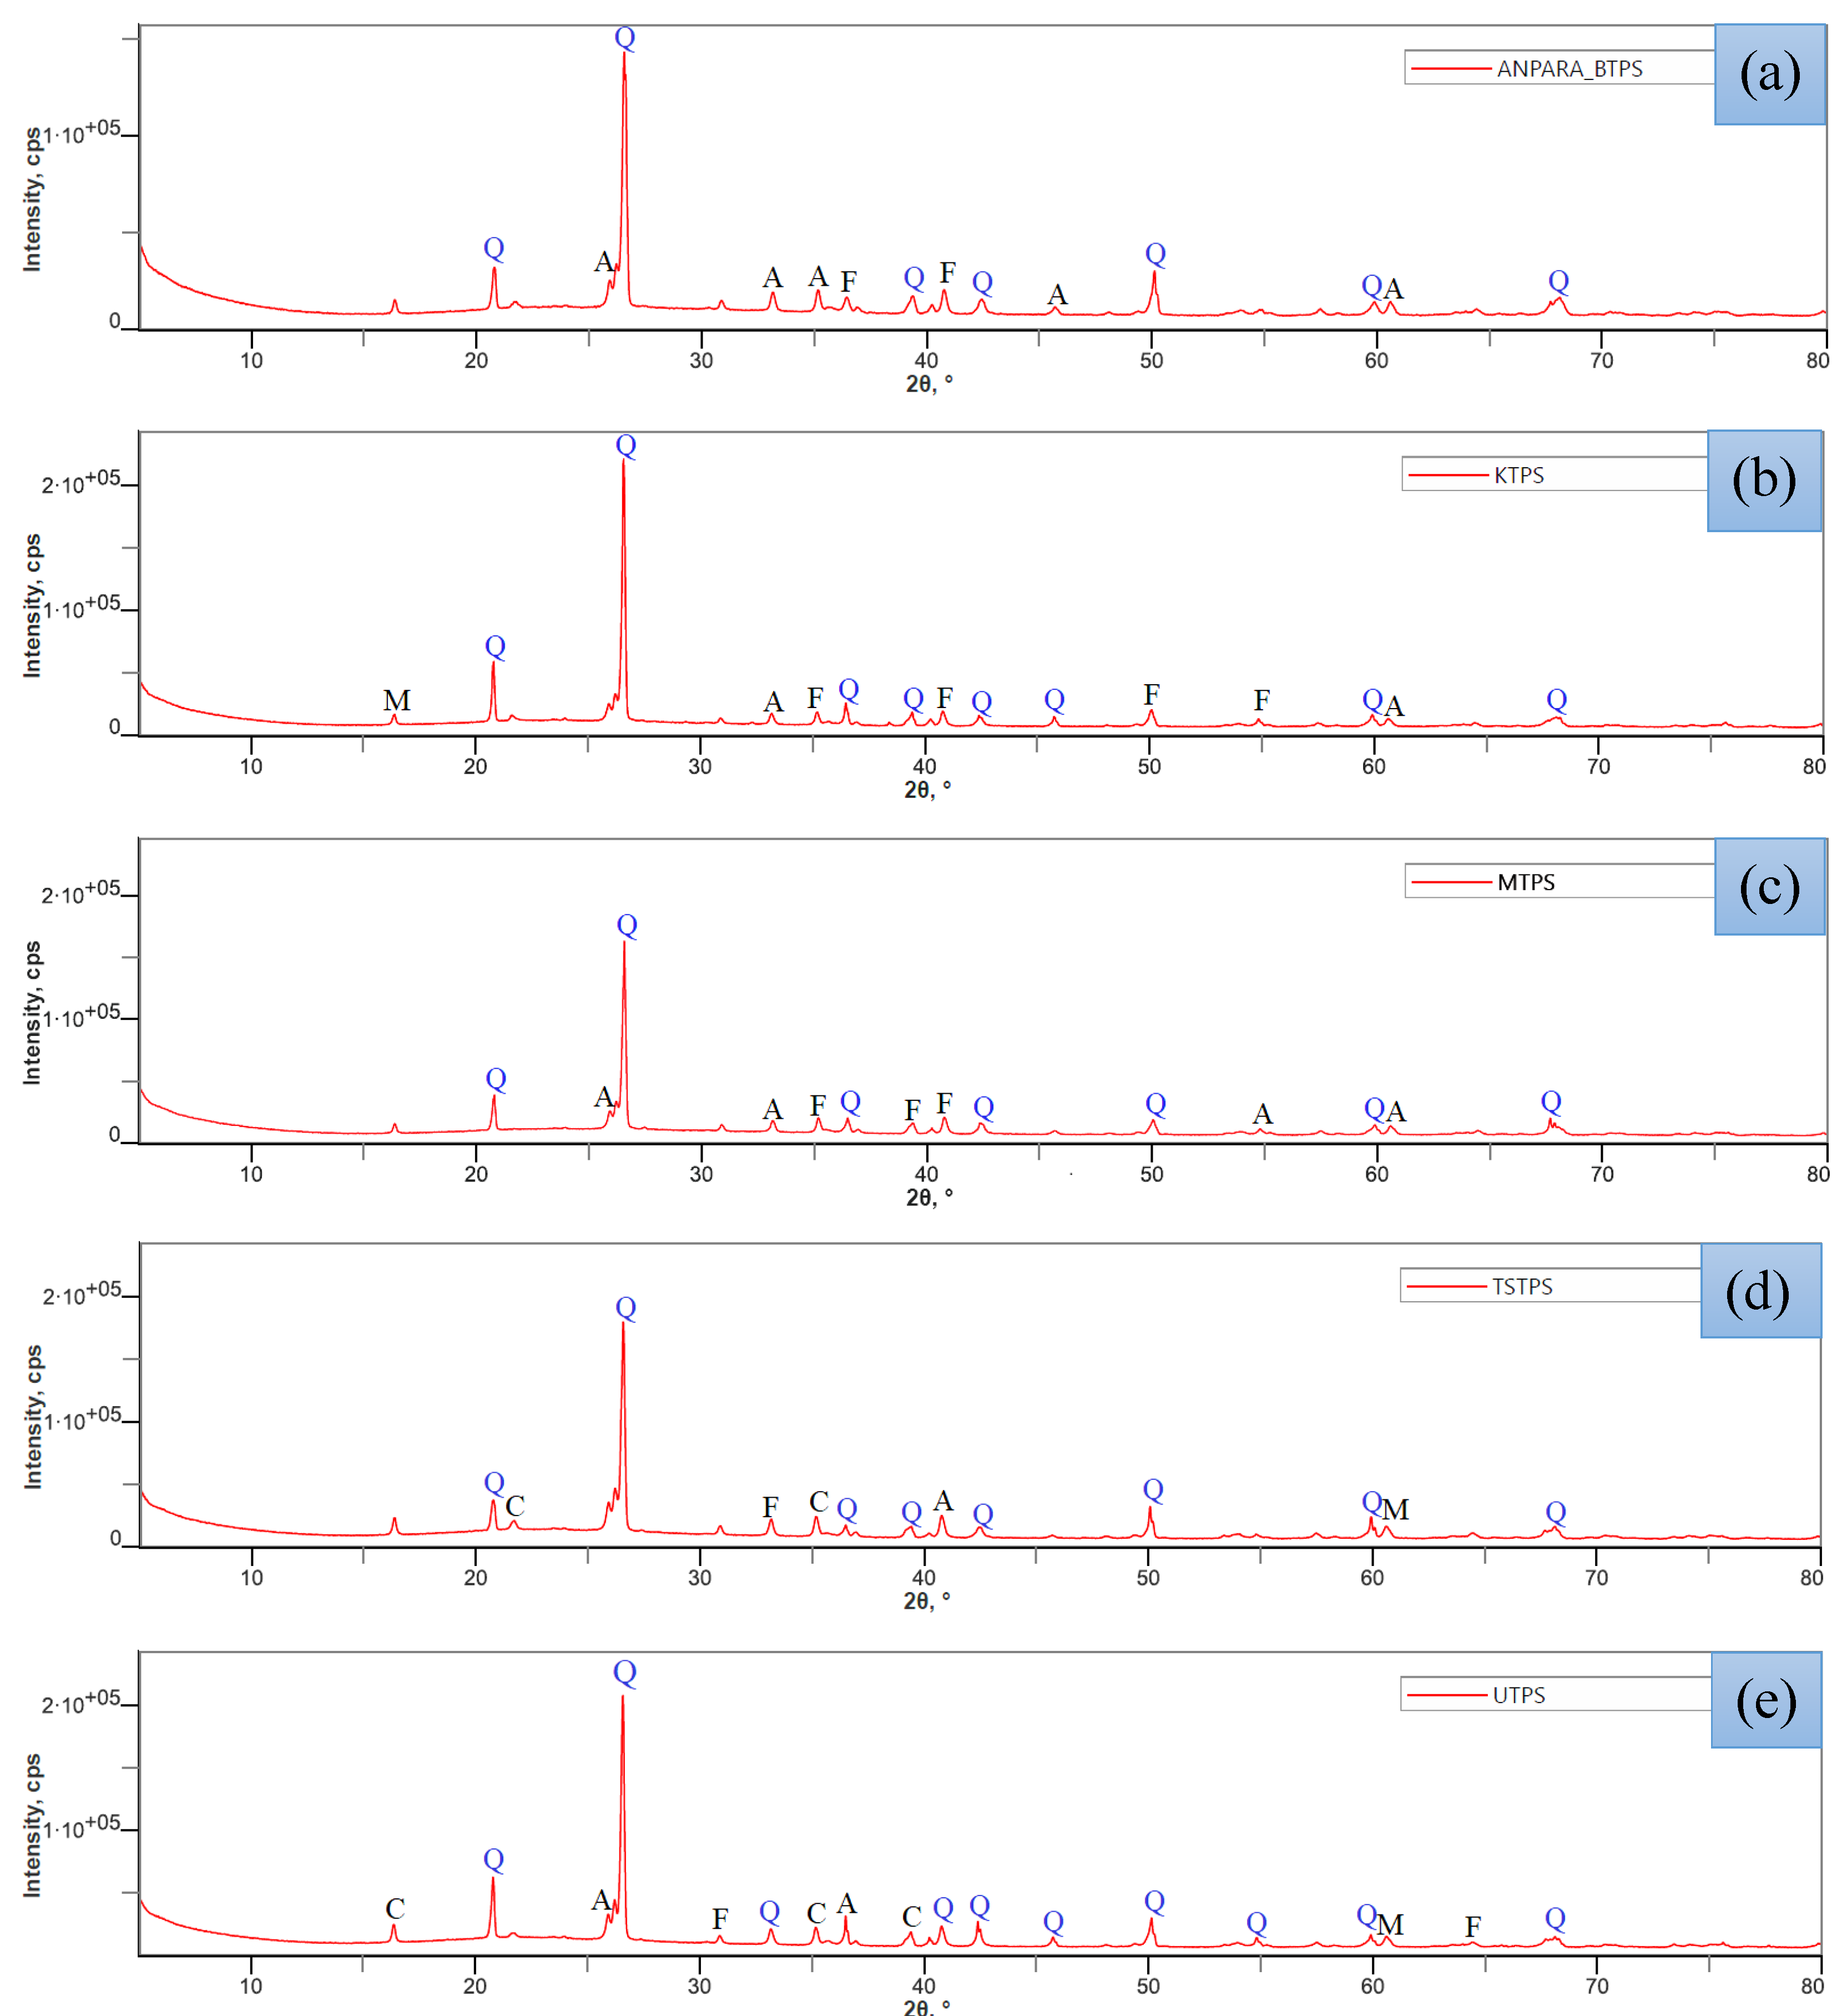
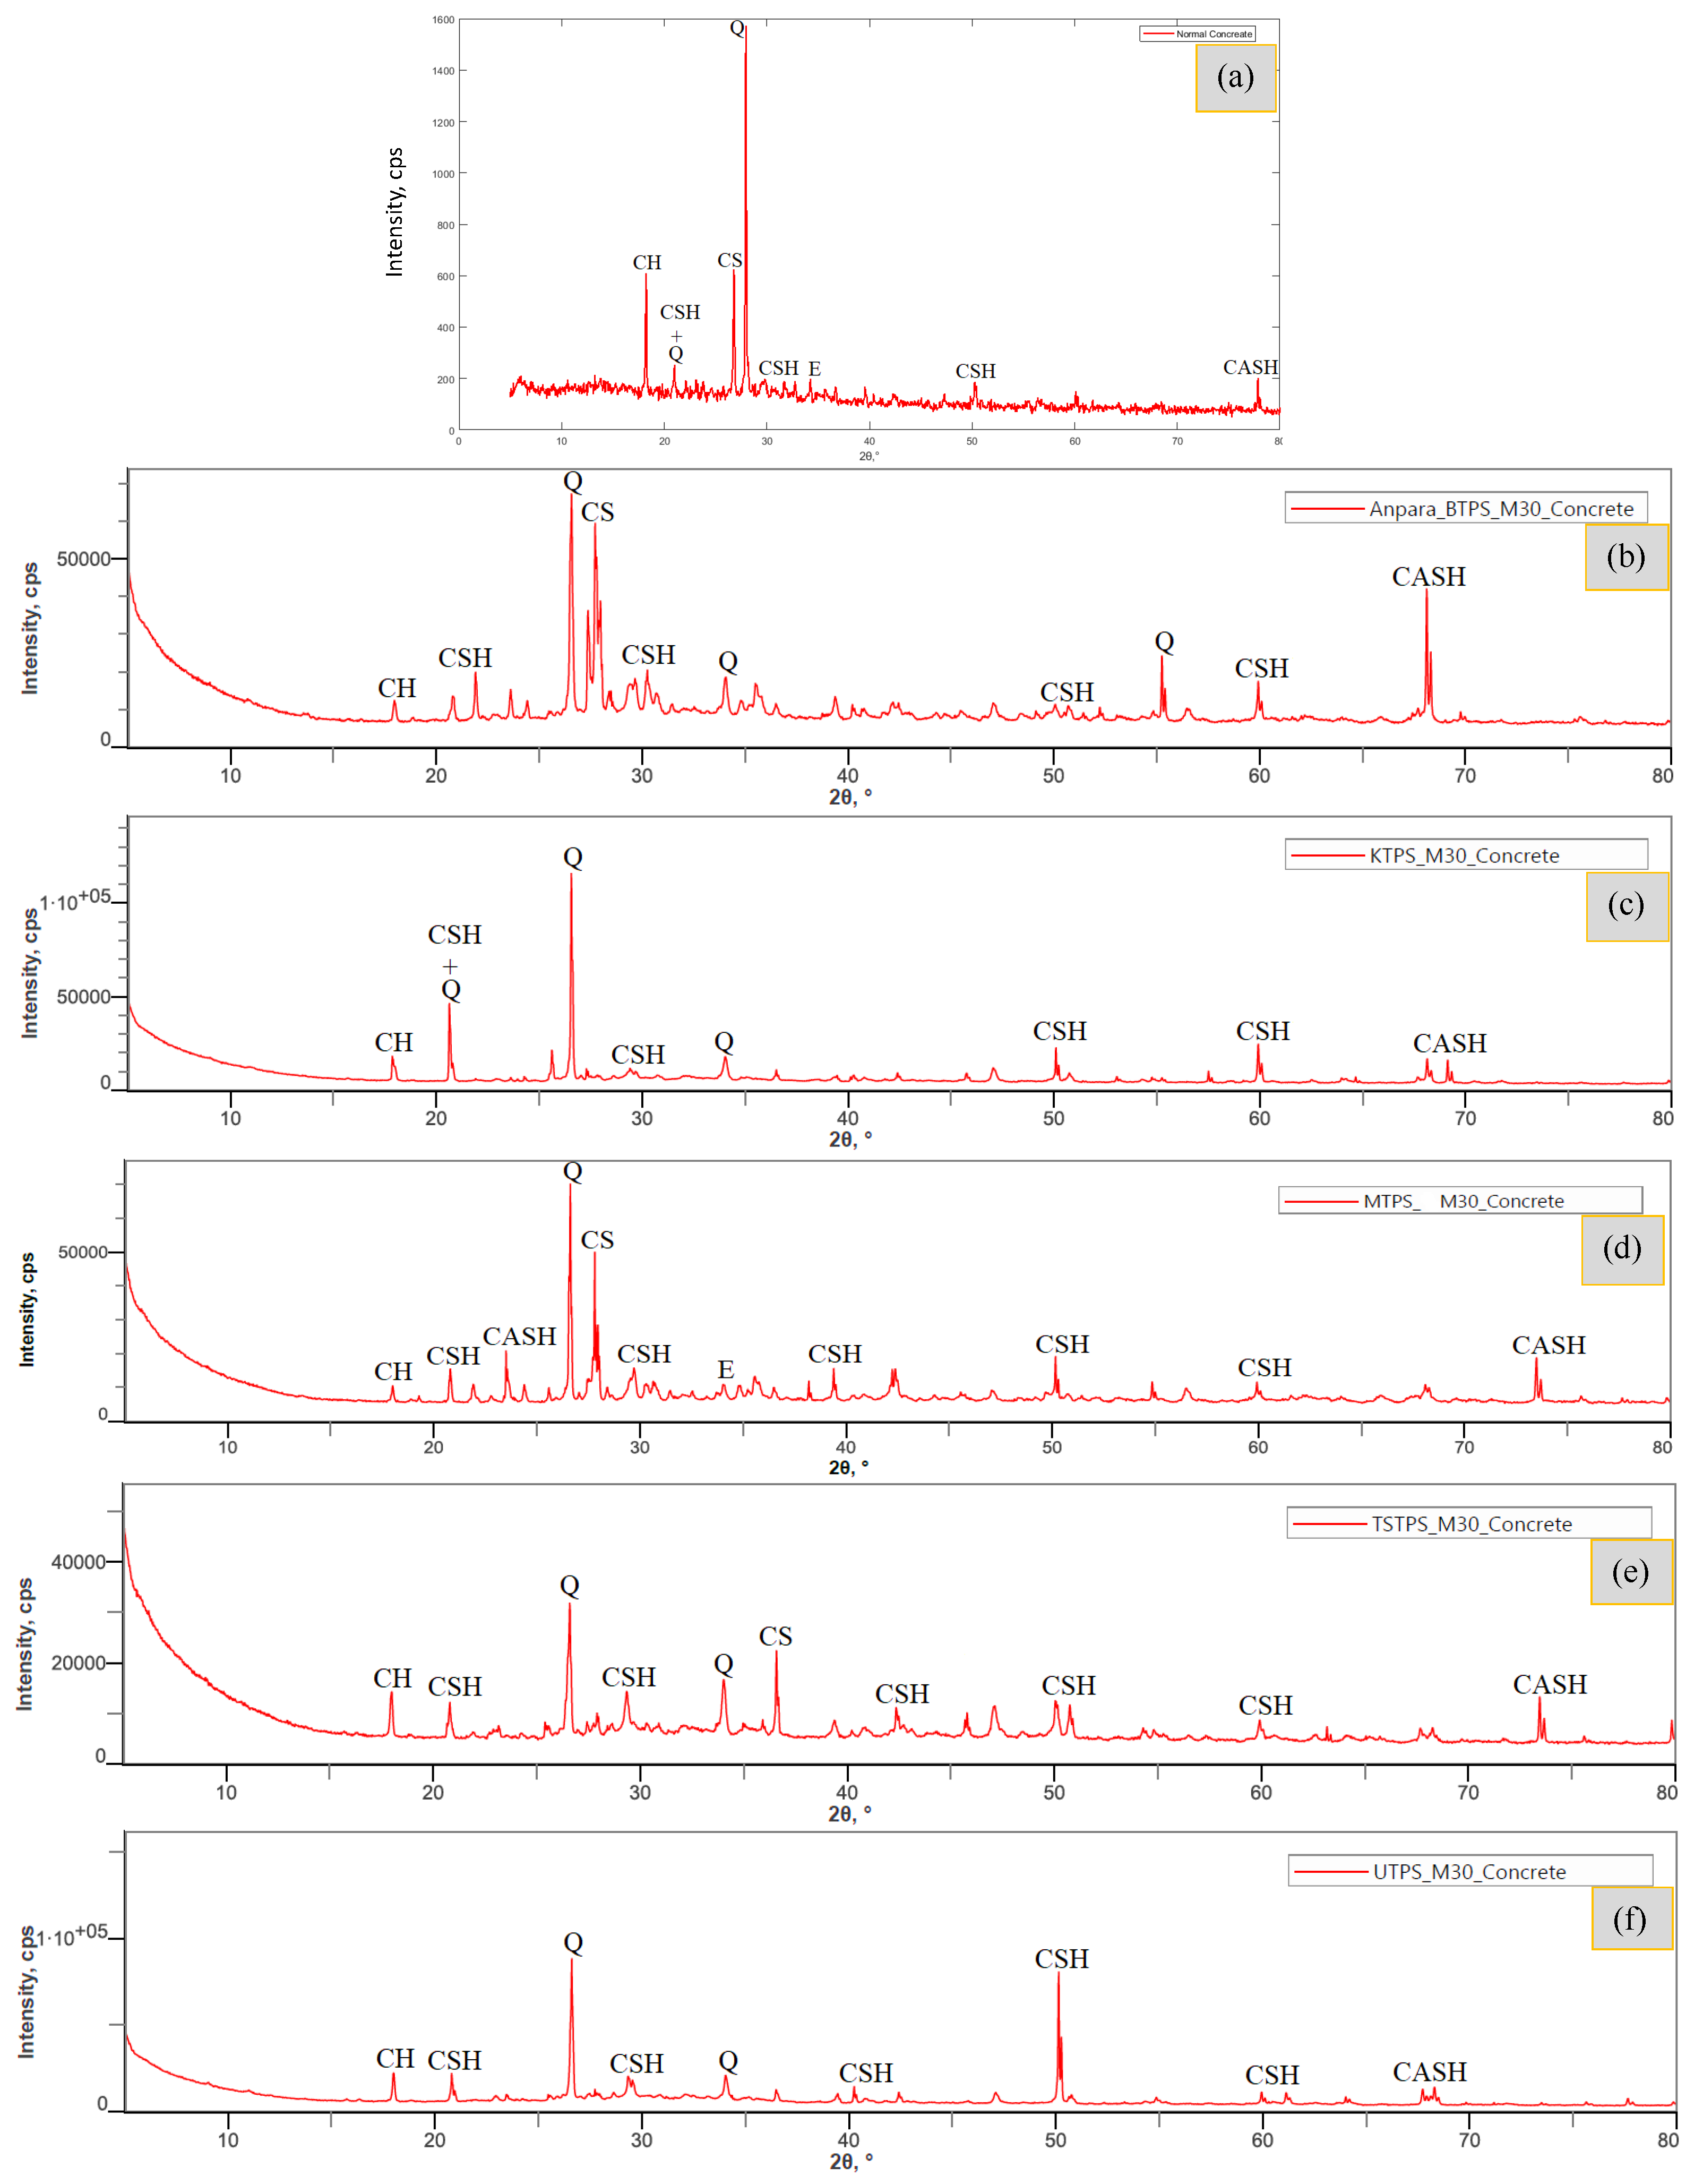
Furthermore, the elemental distribution obtained from the EDS analysis corroborates the phase identification derived from the XRD results. The XRD patterns reveal dominant quartz (Q) peaks corresponding to crystalline SiO
2, along with other mineral phases such as mullite (M), Al
2O
3 (A), Fe
2O
3 (F), and CaO (C), as shown in
Figure 5a–e, which is consistent with previous studies [
26]. The highest intensity quartz peak observed at
confirms the silica-rich and highly crystalline nature of the BA samples. This observation is further supported by the prominent Si peaks identified in the EDS spectra. Since crystalline quartz is relatively inert under normal cement hydration conditions, it mainly contributes through micro-filler and particle packing effects rather than significant pozzolanic reactivity [
62]. However, excessive crystalline quartz content may reduce the overall reactivity of the ash due to the lower proportion of reactive amorphous silica.
2.2. Mixing and Sampling
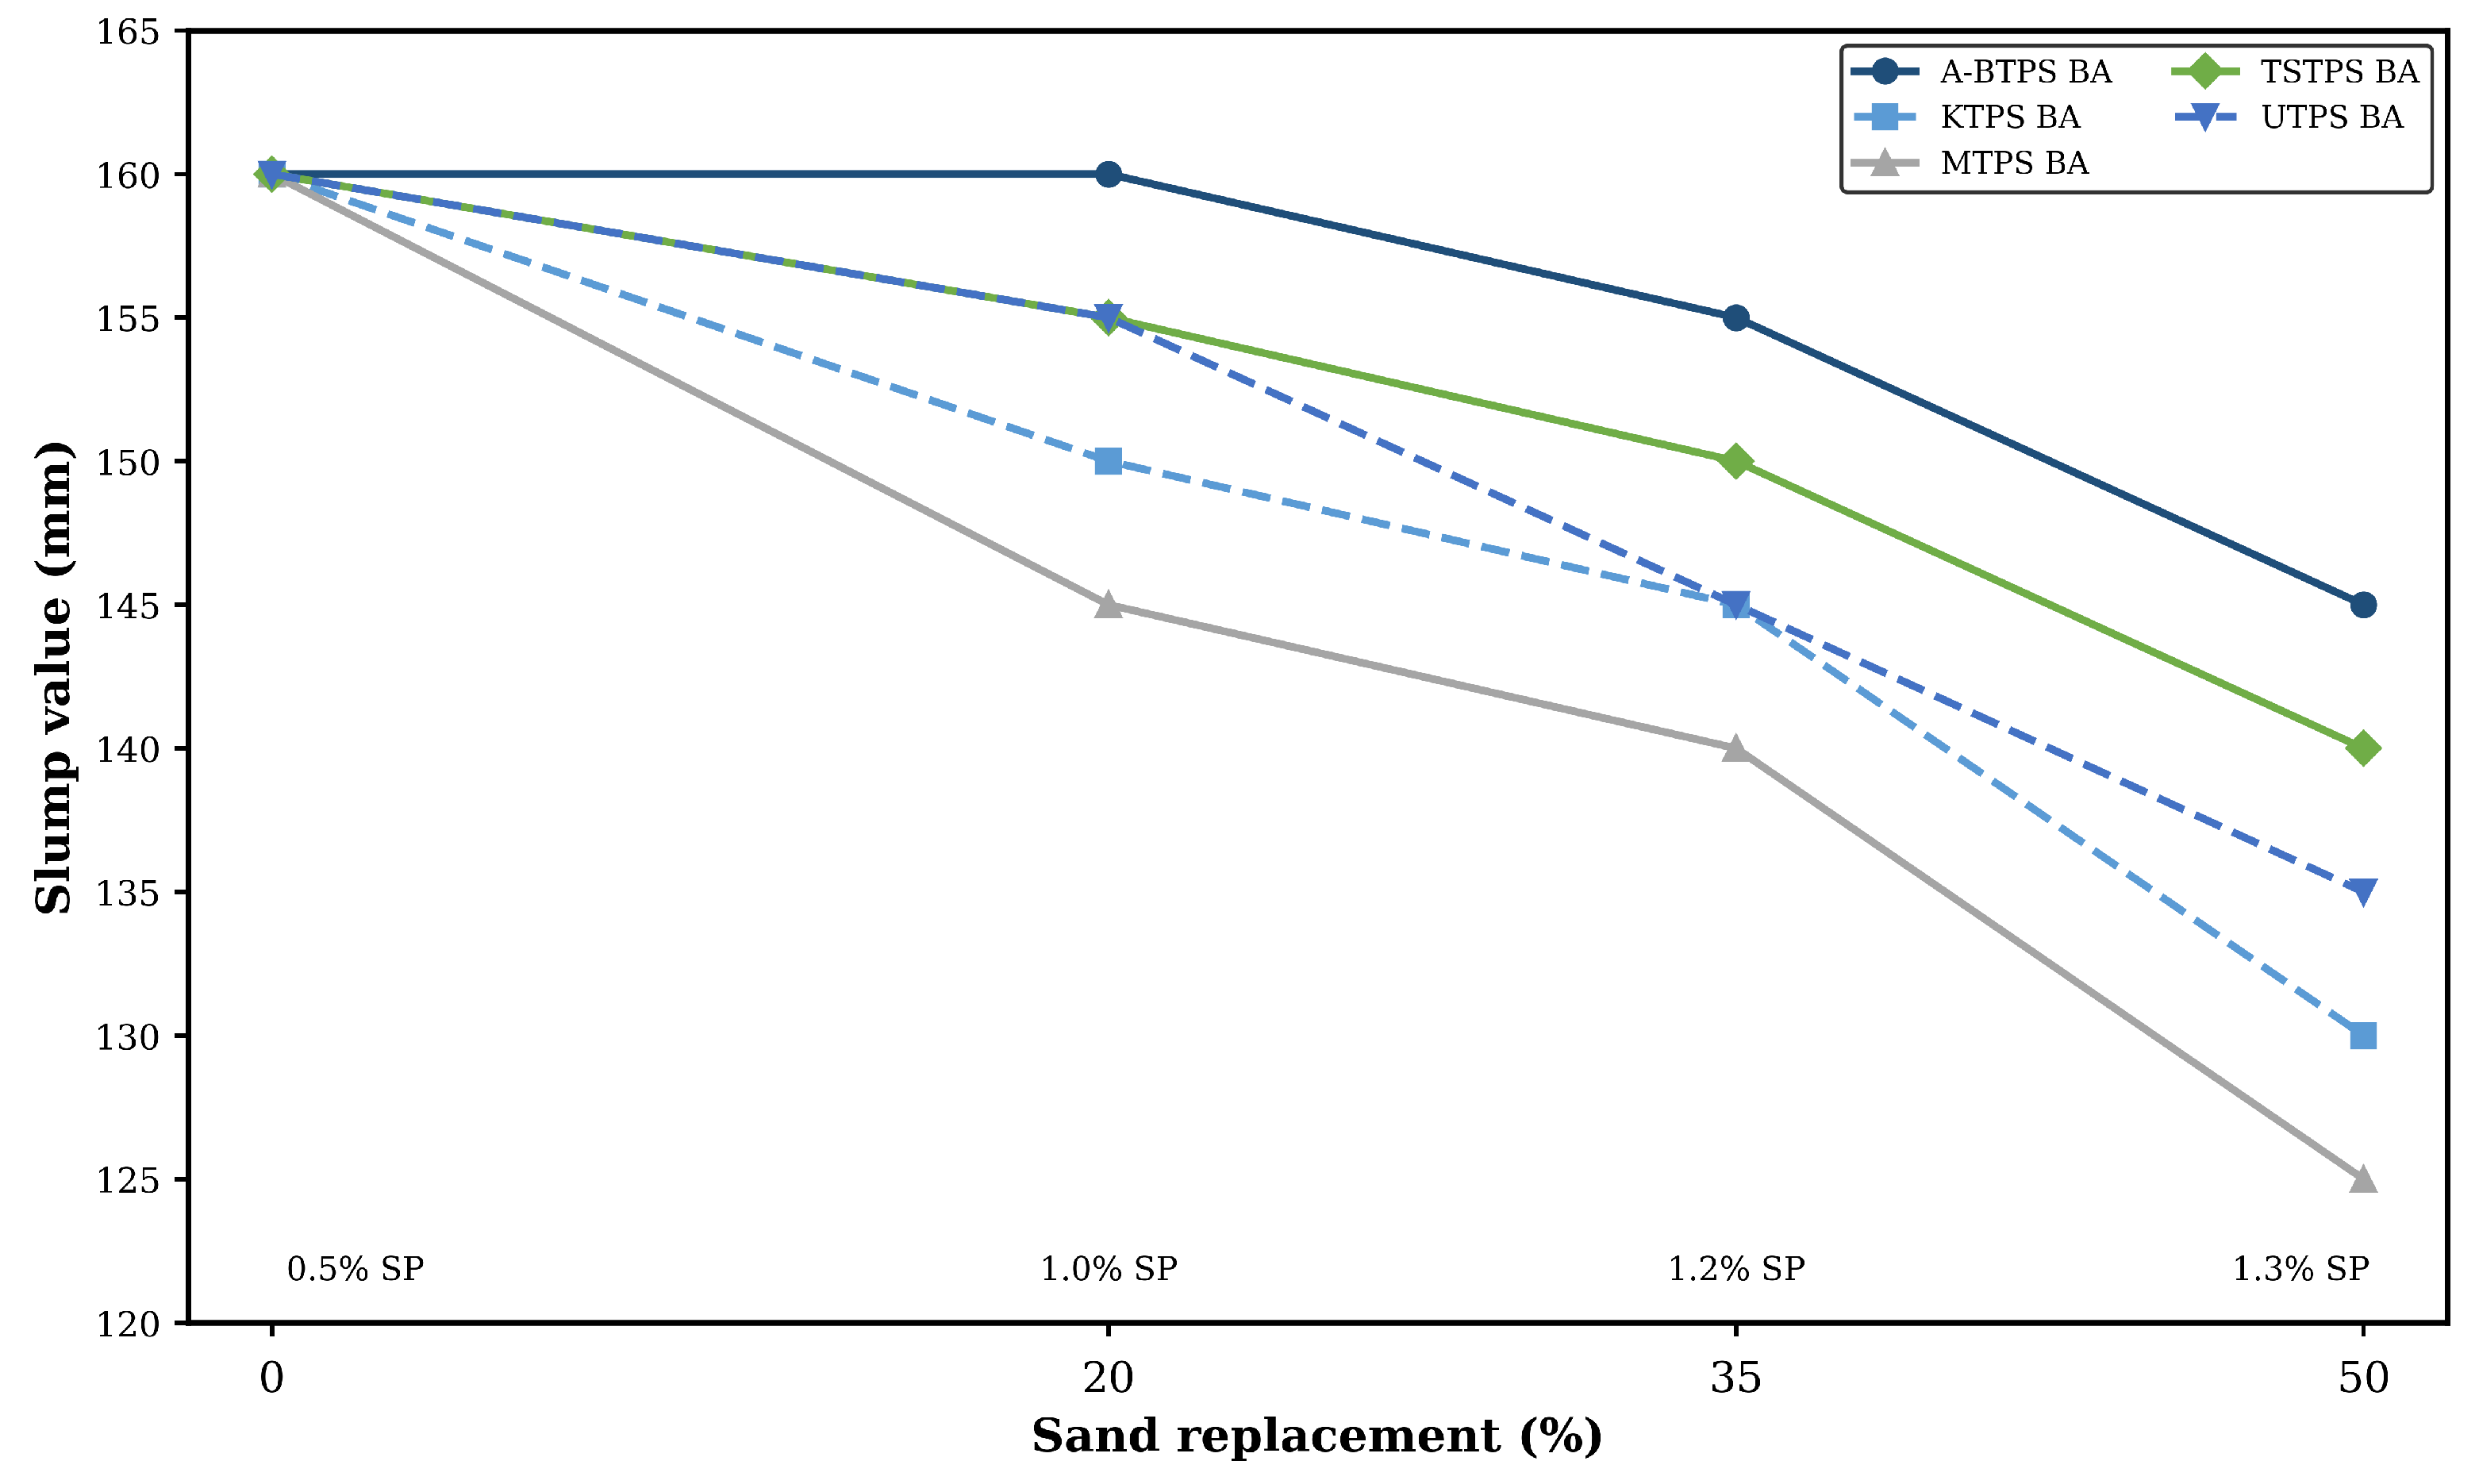
In this study, targeting a M 30 grade concrete was prepared with a water–cement ratio of 0.45. Normal concrete (NC) was produced with 0% BA, while BAC was prepared with 20%, 35%, and 50% replacement of river sand using BA sourced from five coal-based TPPs. The choice of replacement levels was primarily governed by the combined particle size distribution and percentage passing characteristics of river sand and BA. Cement content, water content, and water–cement ratio were kept constant in this study. The targeted slump value (100–150 mm) was achieved by using SP dosages of 0.5%, 1.0%, 1.2%, and 1.3% by mass of cement for 0%, 20%, 35%, and 50% sand replacement levels with BA, respectively. Mix proportions were determined in accordance with IS 10262 [
63], and the quantities of cement, water, fine aggregate, CA (20 mm and 10 mm), and SP admixture are summarized in
Table 5. All mixes were designed to satisfy the minimum cement content and maximum water–cement ratio requirements specified for ’severe’ exposure conditions as per IS 456 [
47], so that the widespread use of BAC, including coastal areas and structures immersed in seawater.
River sand and CA were used in a saturated surface-dry (SSD) condition, whereas BA was pre-conditioned to a moisture content of 13–15% to minimize rapid water absorption during mixing. The preliminary trial mixes indicated that the porous BA absorbed and retained water within its internal pore structure, resulting in a dry and harsh mix with reduced workability [
17] and prolonged mixing time. Therefore, pre-moisture conditioning was adopted to improve the mixing characteristics and stabilize workability. During batching, the free surface moisture associated with the pre-conditioned BA was accounted for through wet aggregate water adjustment by deducting the corresponding quantity from the mixing water, in accordance with the SSD-based mix design approach recommended in IS 10262 [
63], thereby maintaining the targeted effective water–cement ratio.
All specimens were cast in accordance with IS 1199 (Part 2) [
64]. Fresh concrete was placed into the molds and compacted manually using a standard tamping rod of 16 mm diameter and 600 mm length. After casting, the specimens were cured under water at 27 ± 2 °C until the respective testing ages. The dimensions of the cube, beam, and cylindrical specimens, along with the corresponding testing procedures, are described in the subsequent ‘methods’ section.
2.3. Methods
The workability and consistency of fresh concrete were evaluated using the slump test, which provides a practical measure of ease of placement, compaction, and finishing without segregation or bleeding [
61]. The test was performed using a slump cone conforming to IS 1199 (Part 2) [
64]. The cone had a height of 300 mm, a top diameter of 100 mm, and a bottom diameter of 200 mm, and the slump value was recorded to the nearest 5 mm.
The compressive strength (
) tests were carried out on all specimens under uniaxial compression until failure, following IS 516 (Part 1/Sec 1) [
65]. Cube specimens of size
were tested at curing ages of 7, 28, 56, and 90 days using a compression testing machine. The compressive strength was calculated using the following expression,
where
P is the maximum load in N, and
is the loaded area in mm
2.
The flexural strength (
), representing the tensile behavior of concrete, was determined using prism specimens of dimensions
. The specimens were tested under third-point loading as per IS 516 (Part 1/Sec 1) [
65], and the results were expressed in terms of the modulus of rupture. When the distance between the fracture location and the nearest support exceeded 133 mm for a 100 mm specimen, the modulus of rupture was calculated as,
If failure occurred at a distance less than 133 mm but greater than 110 mm, the modulus of rupture was calculated using the following expression,
where
P is the maximum load in N;
a is the distance between the line of fracture and the nearest support in mm;
b and
d are the breadth and height, respectively, in mm; and
L is the supported span length in mm.
The splitting tensile strength (
) tests were conducted in accordance with IS 516 (Part 1/Sec 1) [
65] using cylindrical specimens of 150 mm diameter and 300 mm height. The load was applied along the longitudinal diameter through the loading platens. The splitting tensile strength was computed using the following expression,
where
P is the maximum load in N,
l is the height of the cylinder in mm, and
d is the diameter in mm.
The dynamic modulus of elasticity (
) was determined using ultrasonic pulse velocity (UPV) measurements obtained from 150 mm cube specimens. Calculations were performed in accordance with Annex D of IS 516 (Part 5/Sec 1) [
66] using the following expression,
where
is the dynamic modulus of elasticity (MPa),
is the concrete density (kg/m
3),
V is the pulse velocity (m/s), and
is the dynamic Poisson’s ratio. The static modulus of elasticity was estimated using the empirical relation
as per IS 456 [
47], and also using Neville’s correlation
[
67].
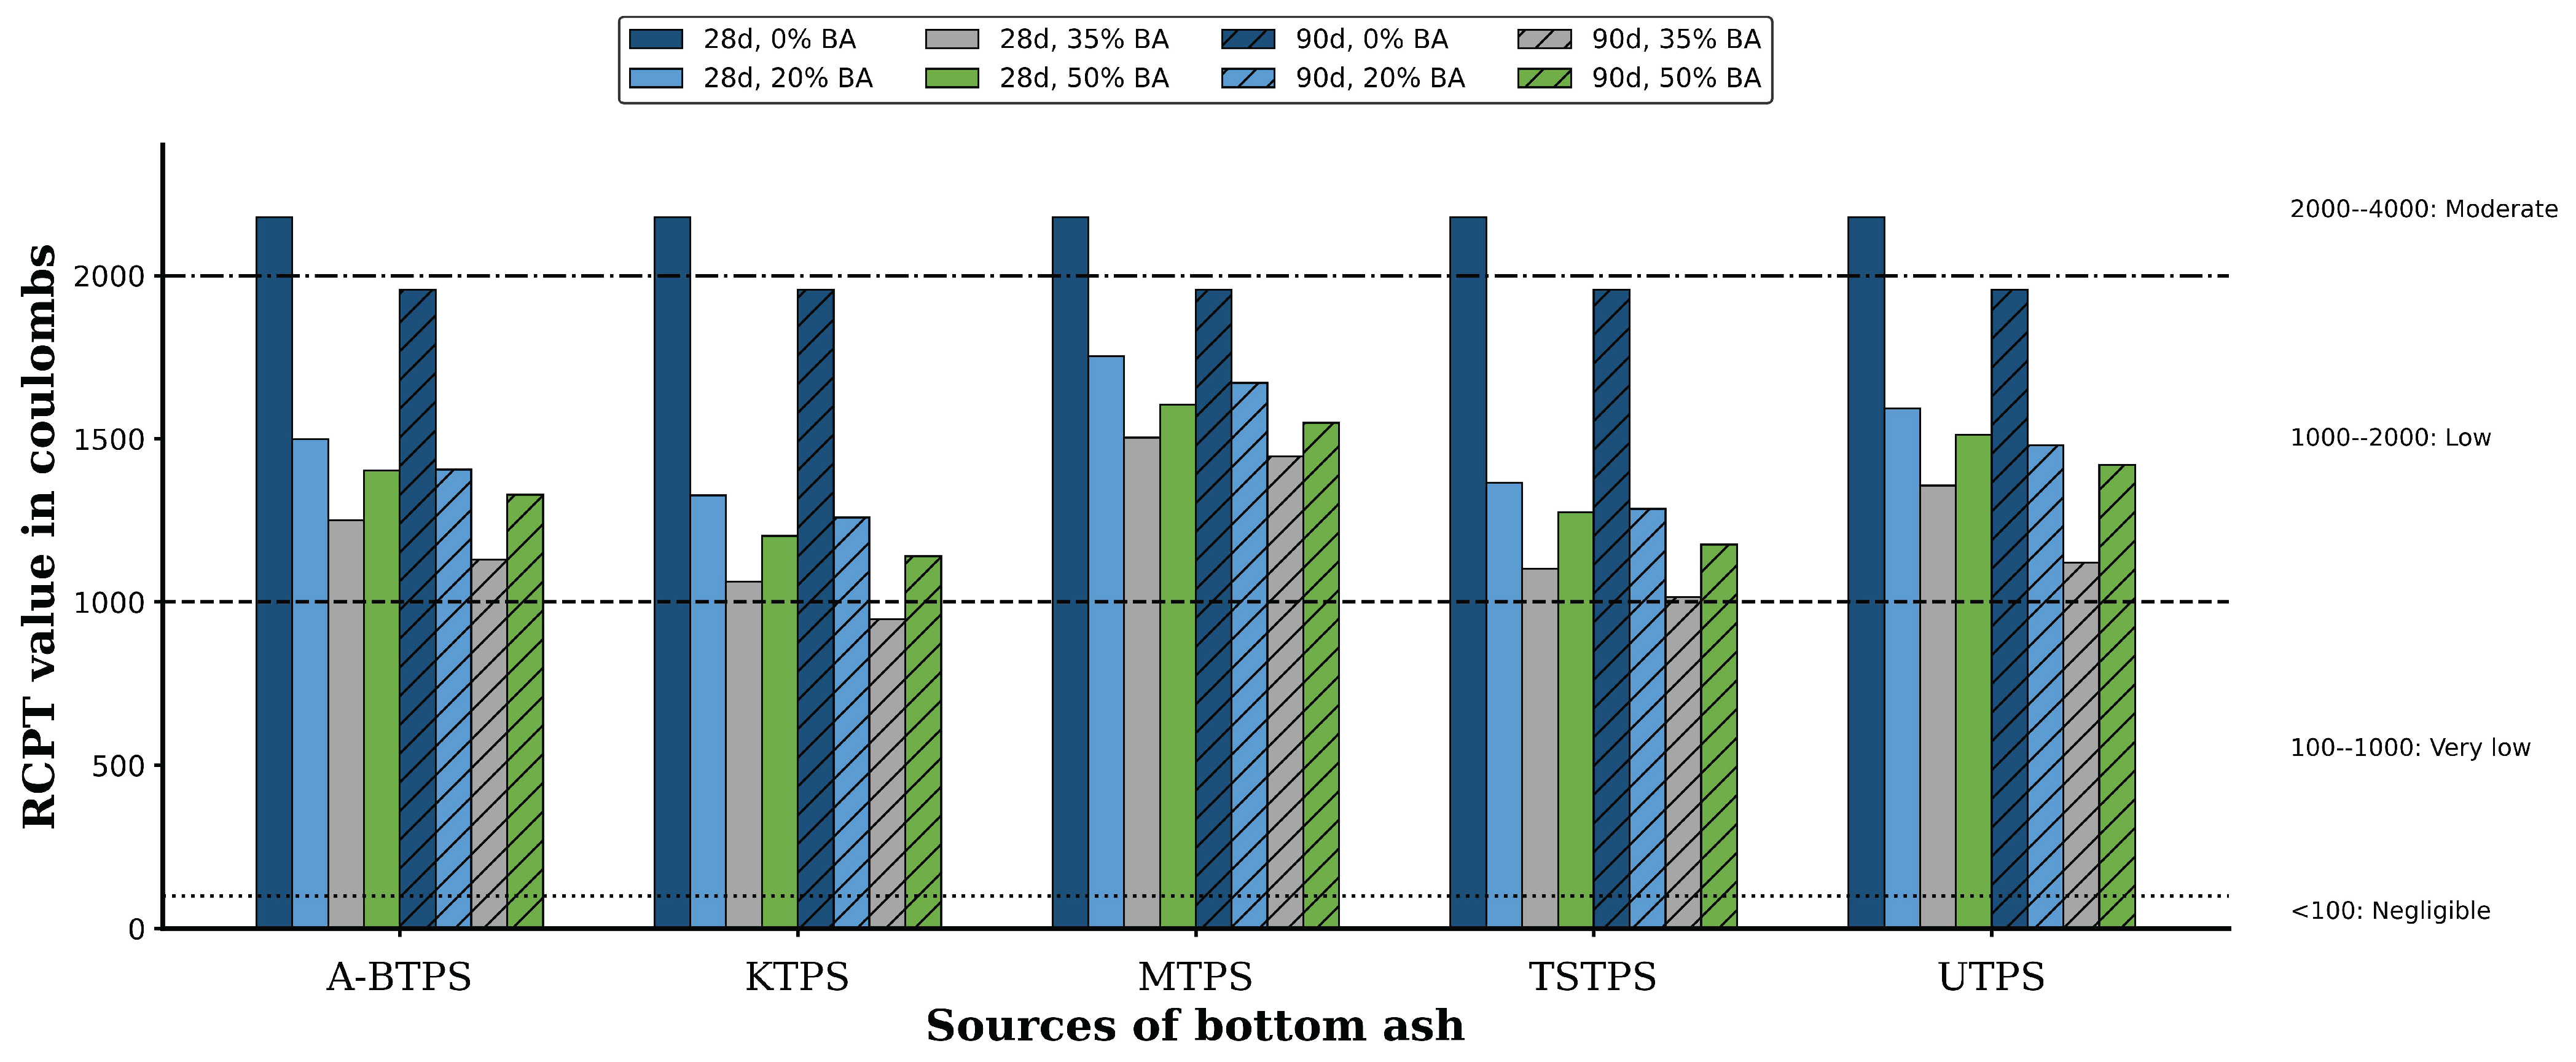
The rapid chloride permeability test (RCPT) was conducted in accordance with ASTM C1202-12 [
68]. Cylindrical specimens of 100 mm diameter and 50 mm thickness were prepared, and their lateral surfaces were sealed using epoxy. The specimens were vacuum conditioned at a pressure below 1 mm Hg for 3 h, followed by vacuum saturation for 1 h and immersion for
h. A constant DC potential of 60 V was applied for 6 h, with one face exposed to 0.3 N NaOH solution and the opposite face to a 3% NaCl solution. The resistance of the specimen to chloride ion penetration is quantified by the total charge passed, expressed in Coulombs (C). Current values are recorded at 30 min intervals, and the cumulative charge is determined using the trapezoidal rule, as given by:
where
Q is the charge passed in coulombs,
is the current (A) immediately after the voltage is applied, and
is the current (A) at
t minutes after the voltage is applied.
The rapid chloride migration test (RCMT) was conducted following the NT Build 492 [
69] on cylindrical samples measuring 100 mm in diameter and 50 mm in thickness. Initially, loose particles were removed, and the specimens underwent vacuum treatment at 1–5 kPa for 3 h, followed by saturation in a Ca(OH)
2 solution for 1 h and subsequent storage in the same solution for
h. During the test, the anolyte chamber was filled with 0.3 N NaOH (12 g NaOH per liter of water), while the catholyte chamber contained a 10% NaCl solution (100 g NaCl dissolved in 900 g water). Each specimen, enclosed within a rubber sleeve and secured with a clamp, was positioned between the electrodes, connecting the cathode to the negative pole and the anode to the positive pole of the power supply. Upon completion, the specimens were axially split and sprayed with a 0.1 M AgNO
3 solution. The depth of chloride penetration was recorded at 10 mm intervals, and the chloride migration coefficient was subsequently calculated using the following expression,
where
is the non-steady-state migration coefficient in units of
,
U is the absolute value of the applied voltage (V),
T is the average value of the initial and final temperatures of the solution (°C),
L is the thickness of the specimen (mm),
is the average penetration depth (mm), and
t is the test duration (h).
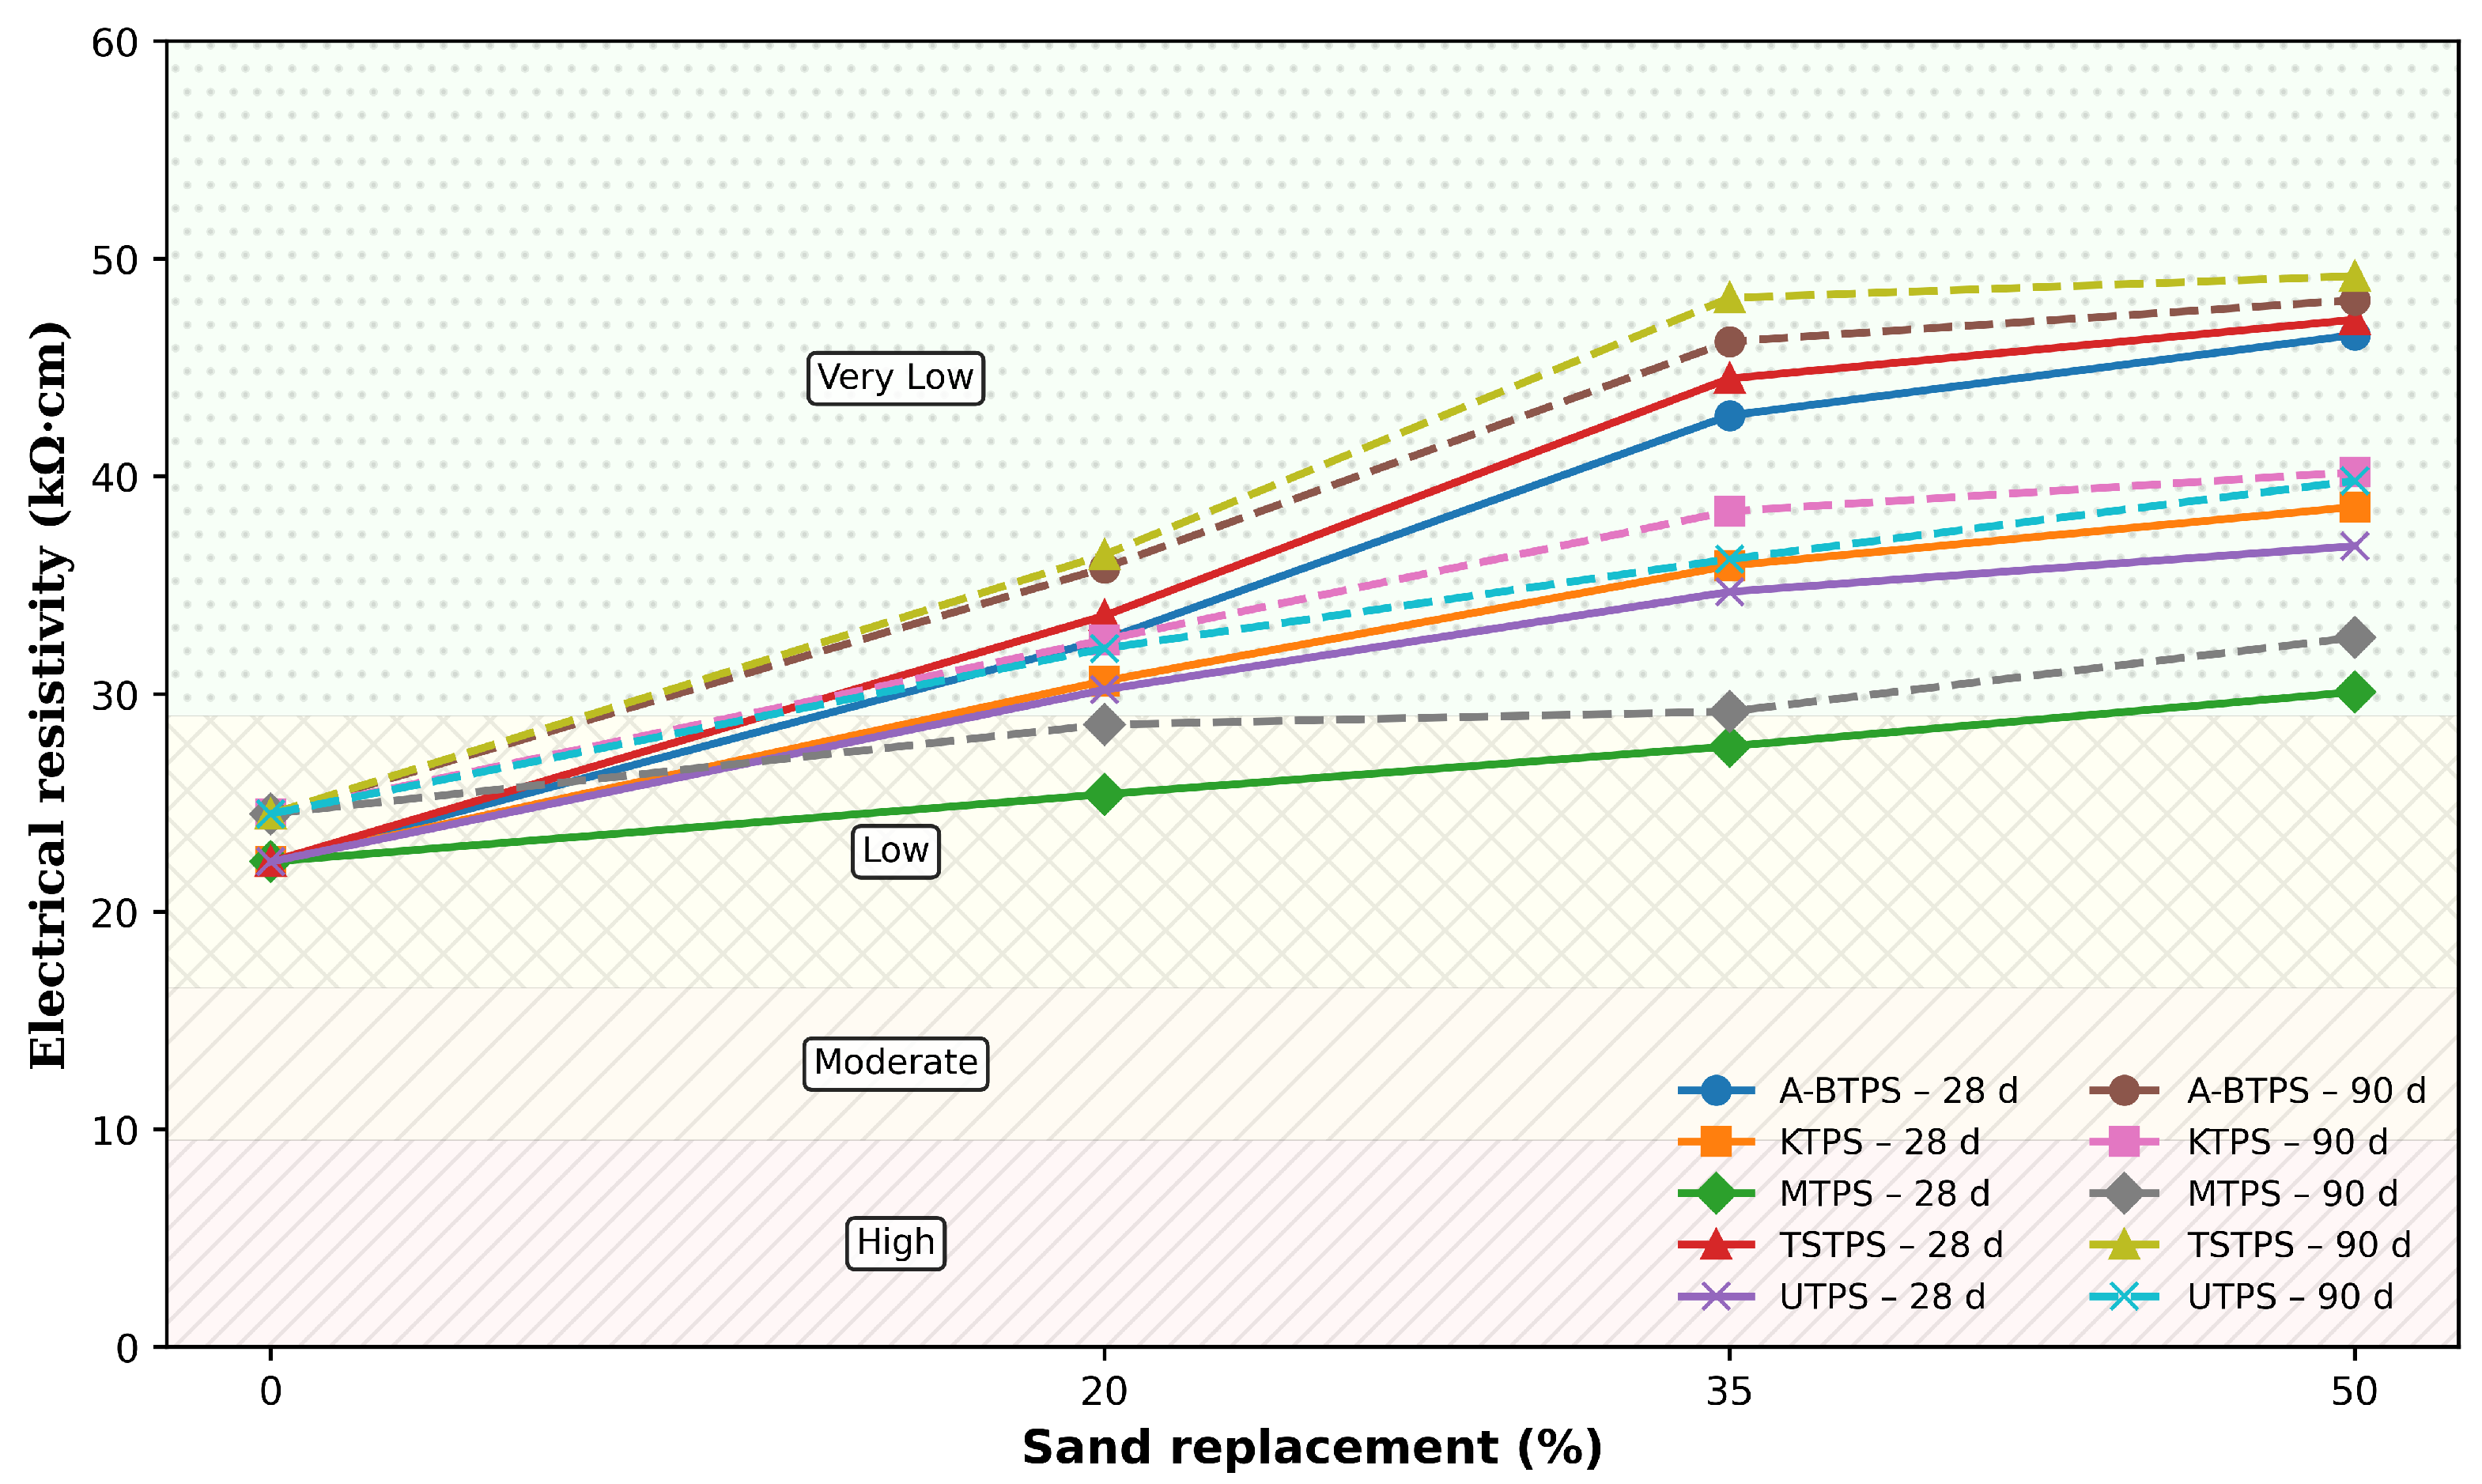
The electrical resistivity (ER) of concrete was determined using the Wenner four-probe resistivity technique as per the guidelines of AASTHO TP 95 [
70]. Concrete specimens were cast in cylindrical molds of 150 mm diameter and 300 mm height and cured in water for 28 days and 90 days duration. After curing, the specimen surfaces were cleaned to ensure proper electrical contact, and four equally spaced probes were positioned on the concrete surface following the Wenner configuration. A low-voltage electrical current (
I) was applied through the two outer probes, while the resulting potential difference (
V) between the two inner probes was measured using a resistivity meter. The electrical current was primarily conducted through ions present in the pore solution of the concrete. The ER (
) was calculated using the Wenner equation,
where
a represents the equal spacing between adjacent probes. The measured resistivity values were used as an indicator of concrete quality and durability-related performance, particularly with respect to ionic transport and corrosion resistance [
71].
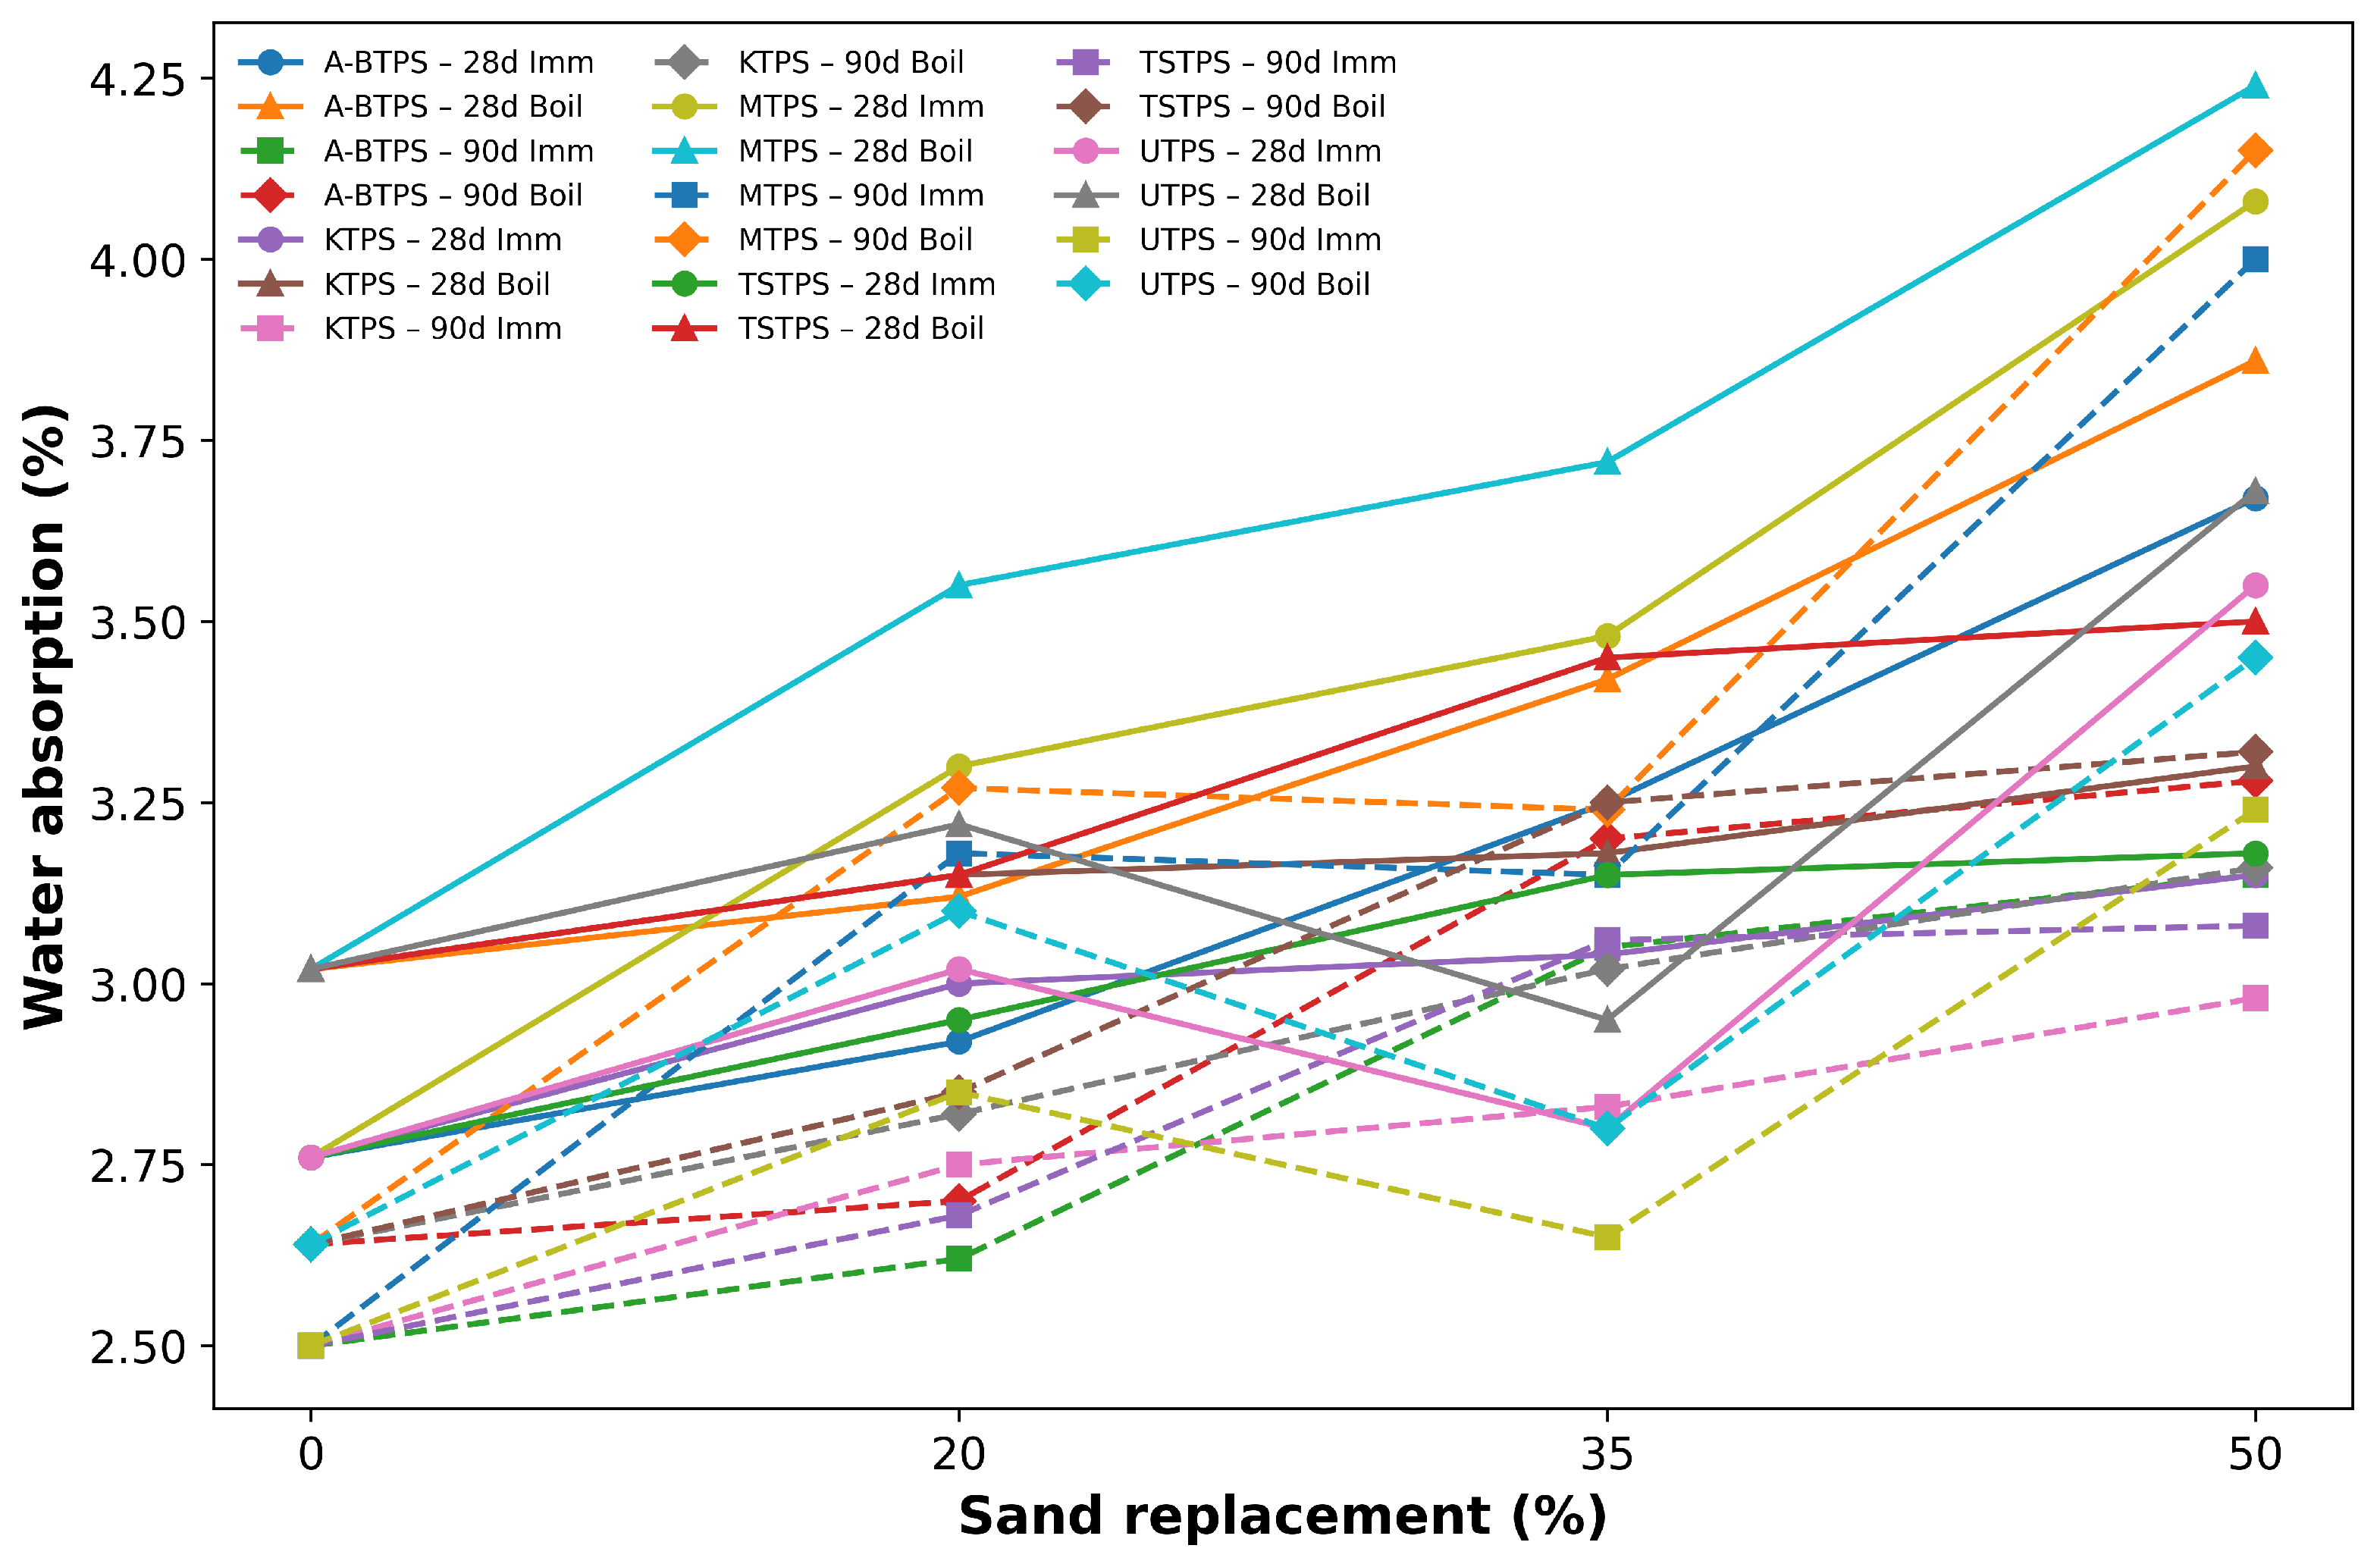
Water absorption tests were carried out on specimens of 100 mm diameter and 50 mm height, having a volume greater than 350 cm
3, in accordance with ASTM C642-06 [
72]. The tests considered water absorption after immersion as well as after immersion and boiling.
Water permeability was evaluated following DIN 1048 (Part 5) [
73] using cylindrical specimens of 150 mm diameter and 160 mm height. A constant water pressure of 0.5 N/mm
2 was applied for 72 h, after which the specimens were split, and the maximum penetration depth was measured.
Drying shrinkage was measured on prismatic specimens of dimensions
in accordance with IS 516 (Part 6) [
74]. The drying shrinkage was calculated using
where
is the initial length after curing,
is the final length after drying, and
is the effective gauge length.
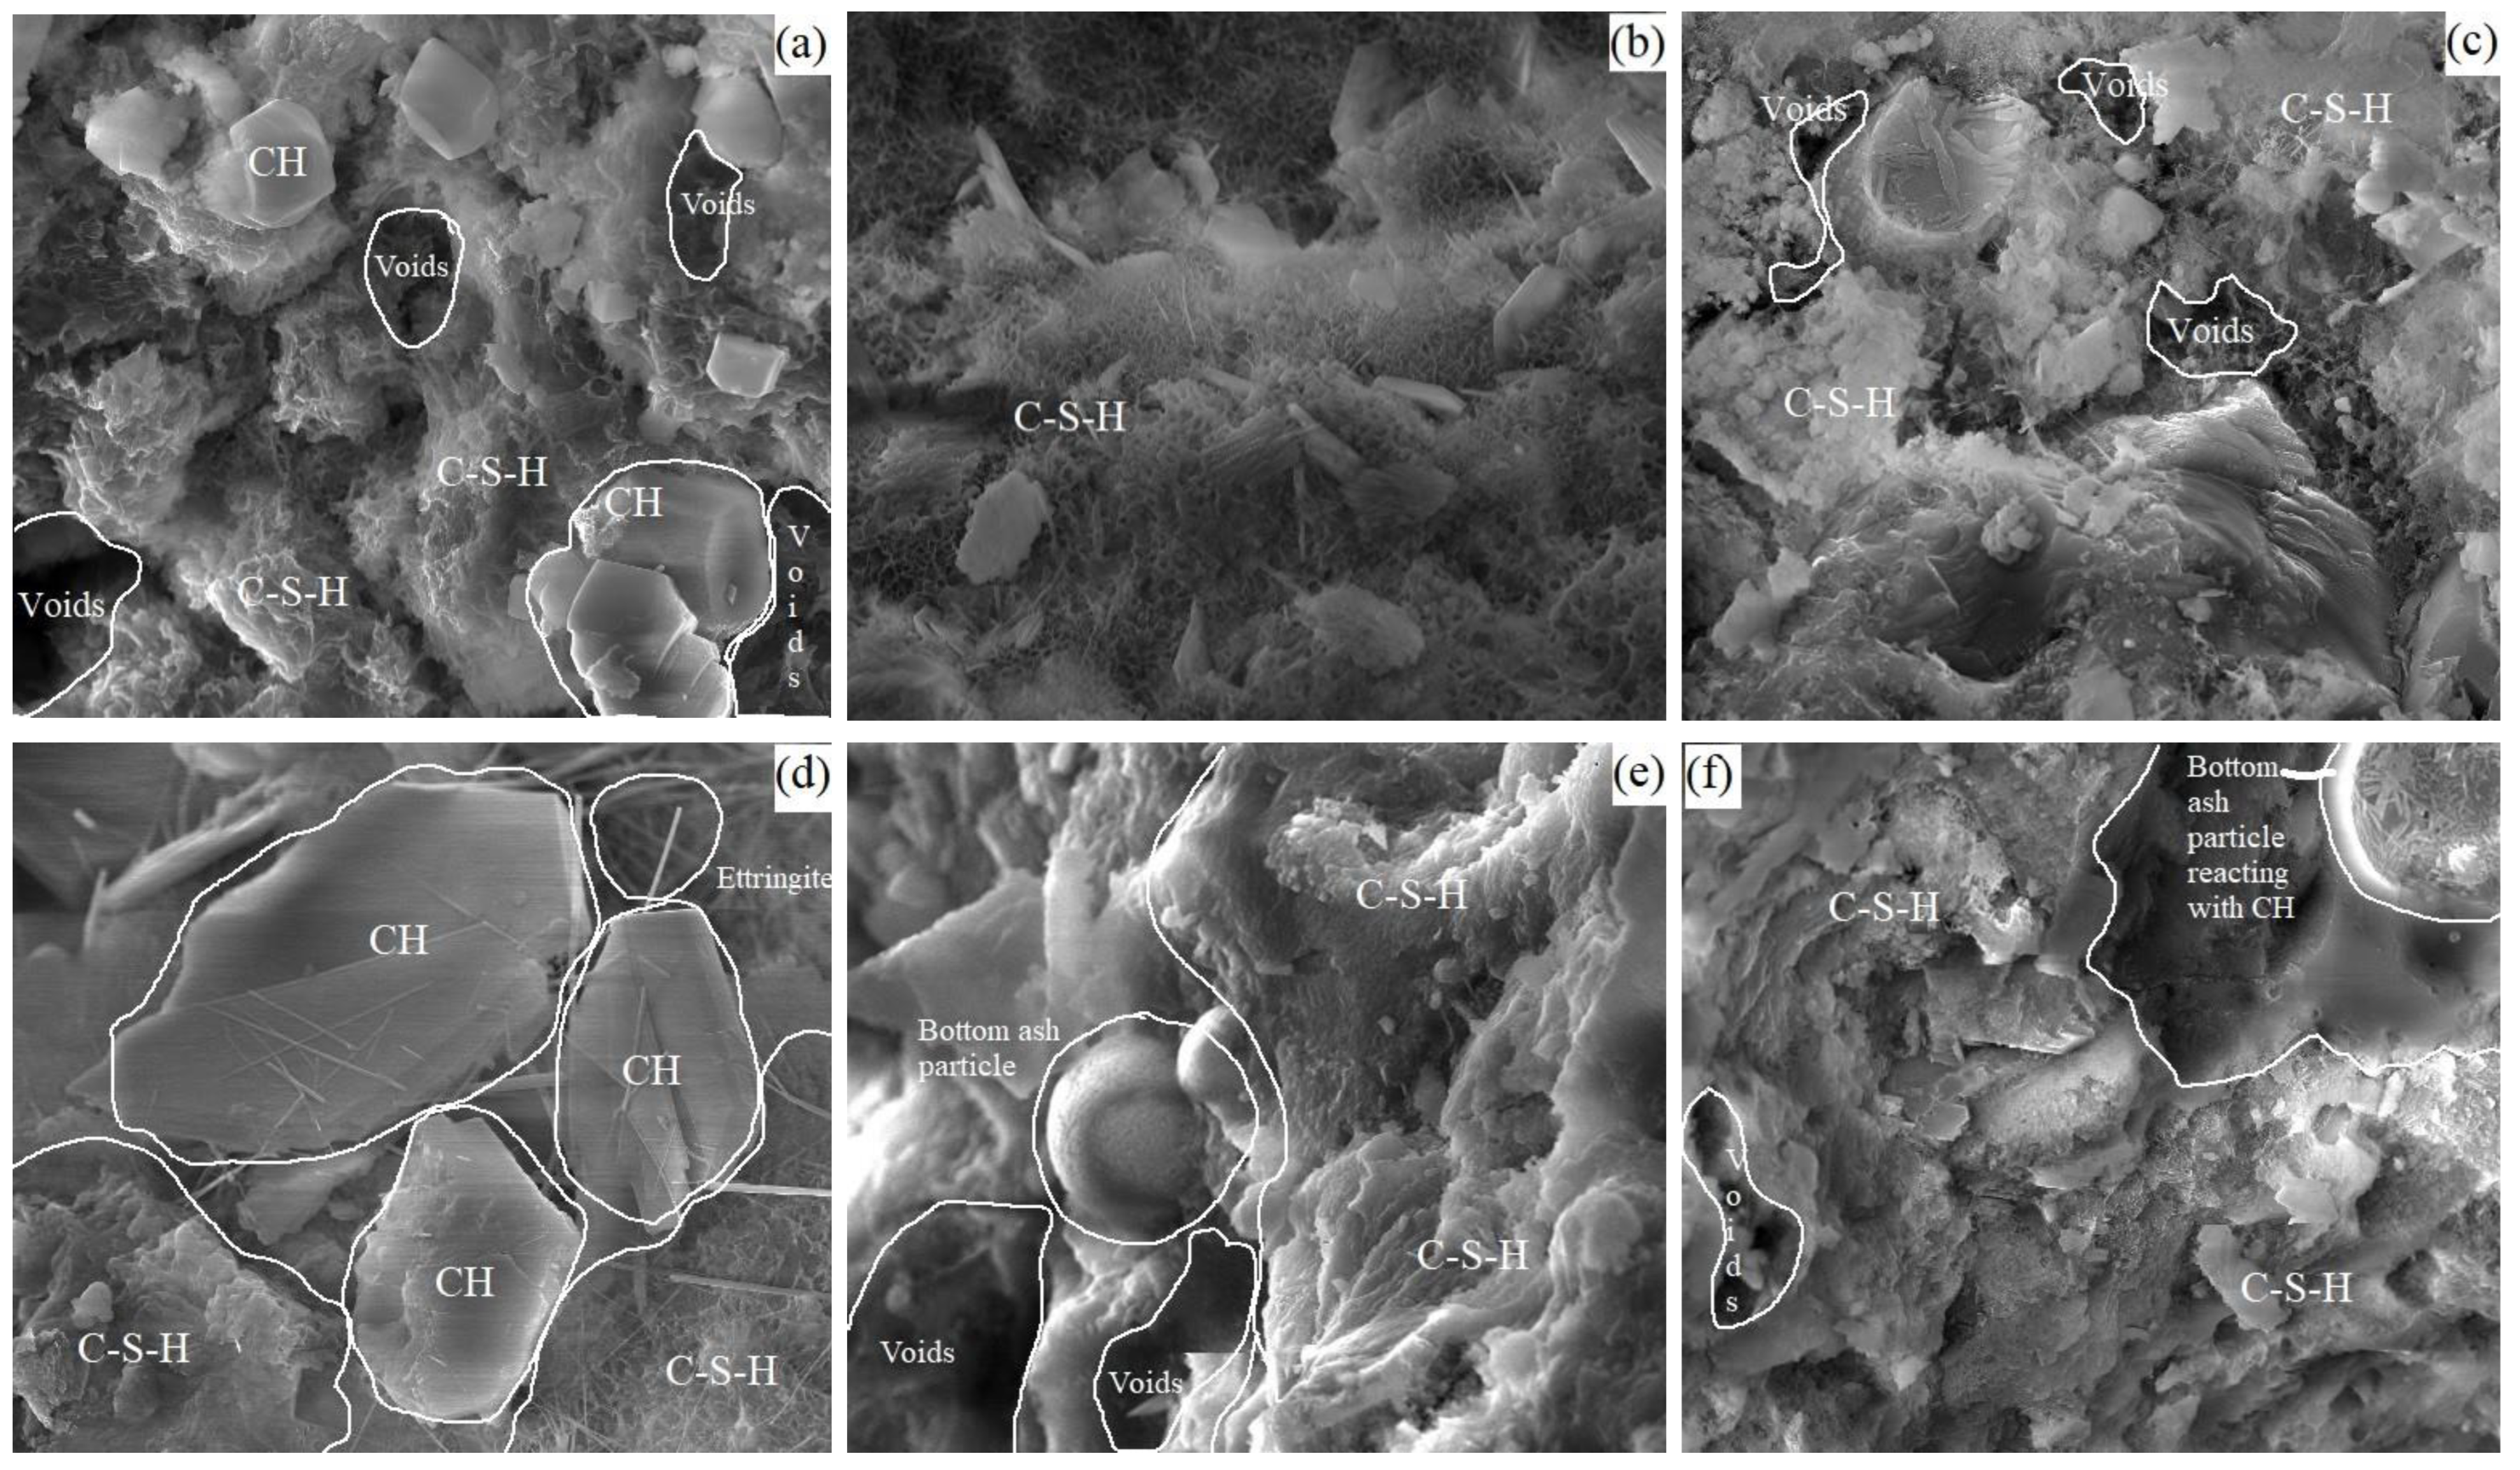
Microstructural characterization was carried out using scanning electron microscopy (SEM) coupled with energy-dispersive spectroscopy (EDS), also known as energy-dispersive X-ray (EDX) analysis, on specimens cured for 90 days. Samples were collected from fractured surfaces after compressive strength testing, vacuum-dried, gold-coated, and mounted for SEM–EDS examination. For phase analysis, powdered samples were obtained from the mortar phase by grinding hardened concrete to pass a 75 μm sieve. Phase identification was performed using X-ray diffraction (XRD) over a diffraction angle range of – with a step size of .