Article

Structural Constraints and Realized Digital Use: Evidence from Ziguinchor, Senegal

by
Jean-Claude Baraka Munyaka
1,*,
Pablo De Roulet
1,
Jérôme Chenal
1,2,
Dimitri Samuel Adjanohoun
3,
Madoune Robert Seye
4,
Tatiana Dieye Pouye Mbengue
3,
Djiby Sow
3,
Cheikh Samba Wade
3,
Derguene Mbaye
4,
Moussa Diallo
4 and
Mamadou Lamine Ndiaye
4
1
School of Architecture, Civil and Environmental Engineering, Environmental Engineering Institute, Urban and Regional Planning Community, Ecole Polytechnique Federale de Lausanne, Bâtiment BP—Station 16, 1015 Lausanne, Switzerland
2
Center of Urban Systems (CUS), University Mohammed VI Polytechnic (UM6P), Hay Moulay Rachid, Benguerir 43150, Morocco
3
Geography Department, Gaston Berger University, Nationale 2, Route de Ngallèle, B.P. 234, Saint-Louis 46024, Senegal
4
Computer Engineering Department, Higher Polytechnic School (ESP) of Dakar, Cheikh Anta Diop University, Corniche Ouest, B.P. 5085, Dakar 10700, Senegal
*
Author to whom correspondence should be addressed.
Sustainability 2026, 18(11), 5408; https://doi.org/10.3390/su18115408
Submission received: 27 March 2026 / Revised: 11 May 2026 / Accepted: 16 May 2026 / Published: 28 May 2026

Abstract

This study examines patterns of digital inclusion in Ziguinchor, Senegal, using household survey data combined with spatial indicators of infrastructure and access. We construct a Digital Inclusion Index (DII) capturing realized digital practices and a Composite Digital Access Score (CDAS) reflecting enabling conditions across six domains, including technological equipment, electricity, affordability, and spatial access. The results reveal substantial variation in digital inclusion across quartiers, with strong associations between inclusion outcomes and infrastructural and socioeconomic conditions, particularly electricity reliability, device quality, and mobility constraints. A key finding is the coexistence of near-universal smartphone ownership with relatively low levels of internet use, indicating a pronounced gap between access and effective engagement. This divergence suggests that device ownership alone is insufficient to ensure meaningful digital participation. A typology combining DII and CDAS further highlights mismatches between realized use and enabling conditions, identifying groups of “under-utilizers” and “over-achievers.” The findings are consistent with multidimensional digital divide frameworks and point to the importance of both structural conditions and user capabilities. Given the cross-sectional design, results should be interpreted as conditional associations rather than causal effects. The study contributes a place-based analytical framework for diagnosing digital inclusion gaps in secondary cities and provides evidence to inform targeted, context-specific policy interventions.

1. Introduction

Digital access has expanded rapidly across African cities over the past decade, with mobile internet penetration in Sub-Saharan Africa rising from 23% in 2015 to 49% in 2023 [1]. This trajectory parallels broader transformations across the Global South, where mobile internet penetration increased from 18% to 43% in South Asia and reached 75% in Southeast Asia over the same period [1]. Yet international policy frameworks consistently stress that inclusion depends on far more than the presence of backbone and radio networks. Foundational analyses distinguish universal access, the broad availability of affordable opportunities to connect, from universal service, defined as household-level subscription and regular use [2,3]. The global experience shows that closing the “digital divide” (fracture numérique) requires complementary interventions such as shared-access facilities, universal service obligations, targeted subsidies, and attention to local appropriation practices, not infrastructure deployment alone [4,5]. Well-documented examples, including India’s Common Service Centres and Brazil’s telecentros, demonstrate how publicly supported access points can effectively bridge gaps where household connectivity remains unaffordable, especially in secondary urban centres and peri-urban neighbourhoods [6,7]. This global evidence motivates our focus on the local ecology of ICT commerce in Ziguinchor rather than relying solely on indicative mobile coverage maps.
A second strand of work foregrounds the bottom-up appropriation (appropriation par le bas) of digital tools in African cities [8]. The diffusion of smartphones, mobile data bundles, and social media platforms has generated dense but uneven digital practices that are deeply embedded in local economic and mobility systems. Empirical studies illustrate these hybrid forms of digital urbanism: in Dakar, WhatsApp groups coordinate informal transport routes [9]; in Nairobi, mobile money reshapes micro-entrepreneurship and supplier relations [10]. Comparable dynamics are documented across Global South, Jakarta’s informal motorcycle taxis appropriating ride-hailing platforms for collective bargaining [11]; Mumbai’s neighbourhood WhatsApp networks supplementing deficient municipal service delivery [12]; and Lima’s market vendors leveraging Facebook Marketplace to extend informal retail circuits [13]. These examples underscore that digital practices rarely align neatly with formal infrastructure footprints, reinforcing the need for within-city analysis with fine spatial resolution [14,15].
Despite this growing recognition, empirical evidence on how proximity to ICT access points and local digital service density affect household connectivity remains scarce in both African and broader Global South contexts. Much of the existing literature relies on national surveys that lack neighbourhood-level variation [16,17,18] or focuses on capital cities whose digital economies are atypical, more competitive, and often better serviced than secondary cities [19,20,21]. Yet secondary cities, home to a rapidly growing share of Africa’s urban population and roughly 40% of urban residents across the Global South, display infrastructural, economic, and spatial configurations distinct from both rural areas and major metropolitan centres [22,23]. This gap is especially salient in West Africa, where secondary cities are projected to absorb much of the region’s urban growth through 2040 [24] but remain understudied from a digital inclusion perspective.
This paper addresses that gap through a geospatially informed, intra-urban analysis of Ziguinchor, a secondary city in Senegal characterized by a heterogeneous ICT service ecosystem. The study integrates household survey data with spatial layers capturing the distribution of ICT-related commerce and services, operationalizing exposure through nearest-distance and local service density (≤1 km). It examines two key outcomes, any internet use and use intensity, while controlling for unobserved neighbourhood heterogeneity using quartier/commune fixed effects.
Building on this empirical strategy, the study develops and applies a multidimensional framework of digital inclusion that integrates infrastructural, economic, and social dimensions. This approach enables a more comprehensive assessment of the structural constraints shaping realized digital use at the intra-urban level.
While the framework is designed to be applicable across multiple secondary cities (e.g., Mwanza, Bhavnagar, Cali), this paper focuses on its first empirical application in a single-city context. This positioning allows for a detailed and context-sensitive analysis, while laying the foundation for future comparative work across cities.
The remainder of the paper is organized as follows. Section 2 addressed the methodology data and measures. Section 3 presents the empirical results. Section 4 discusses the findings and their policy implications. Section 5 concludes.

2. Methodology Data and Measures

2.1. Study Areas

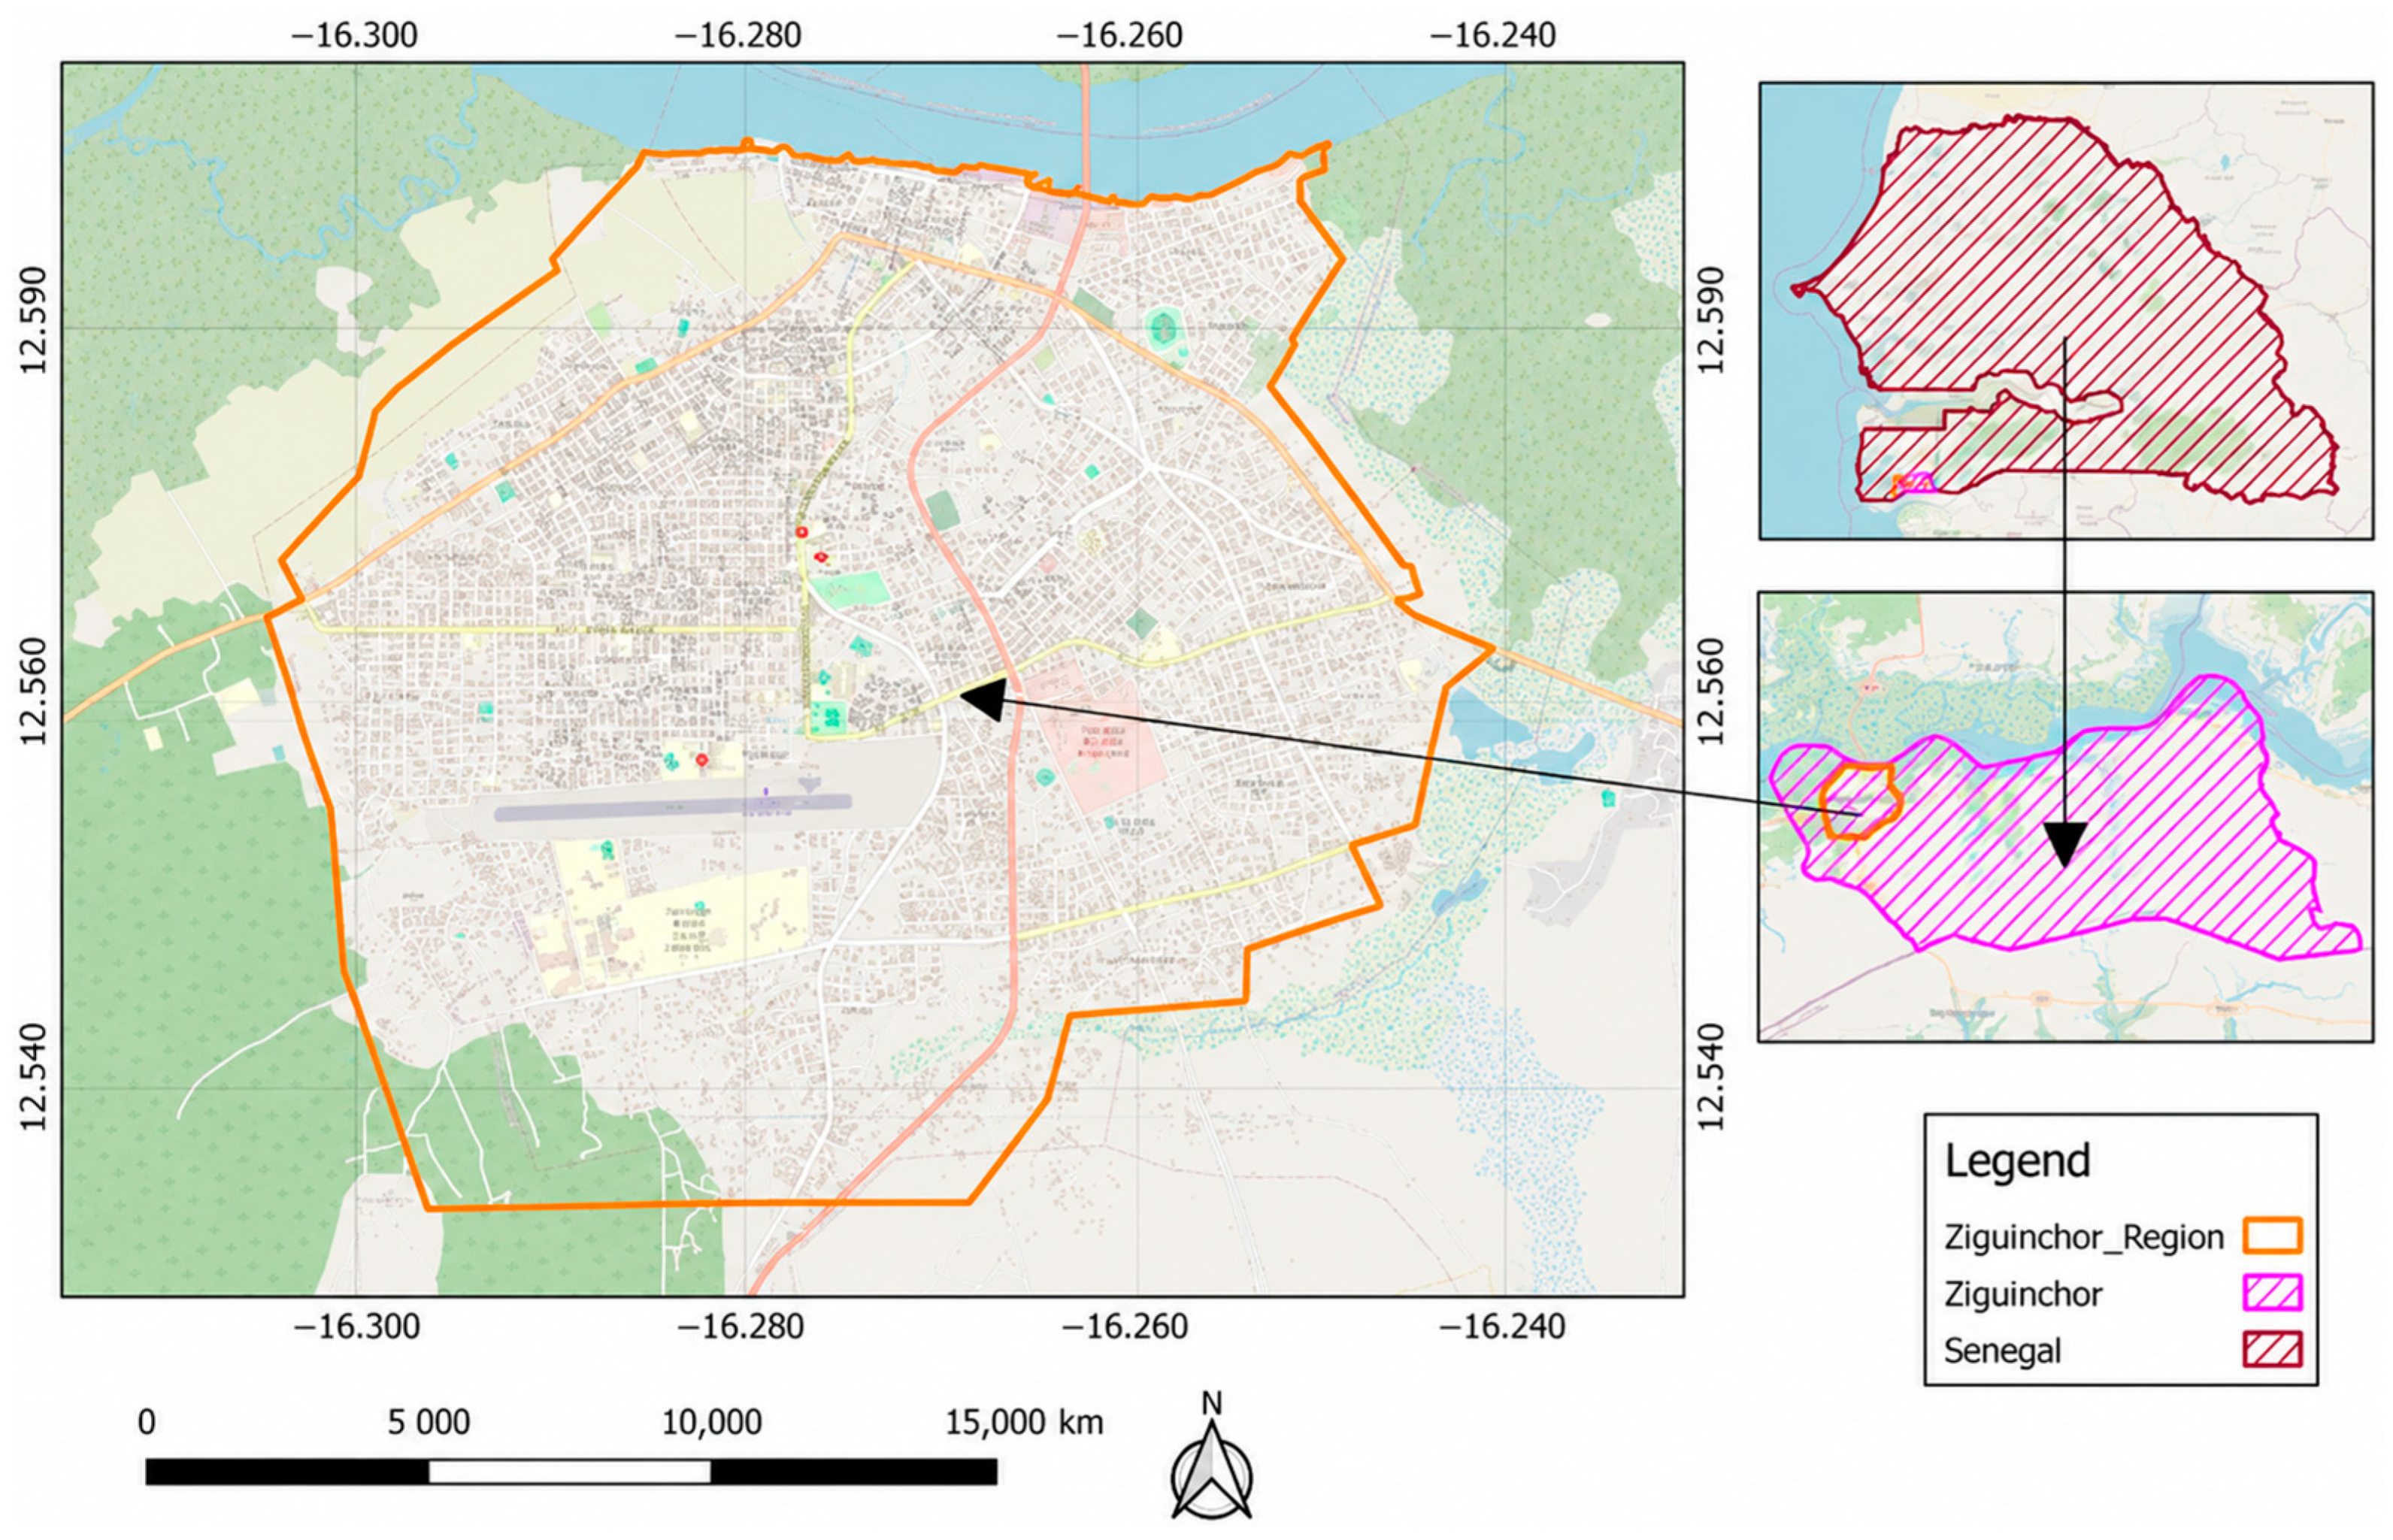
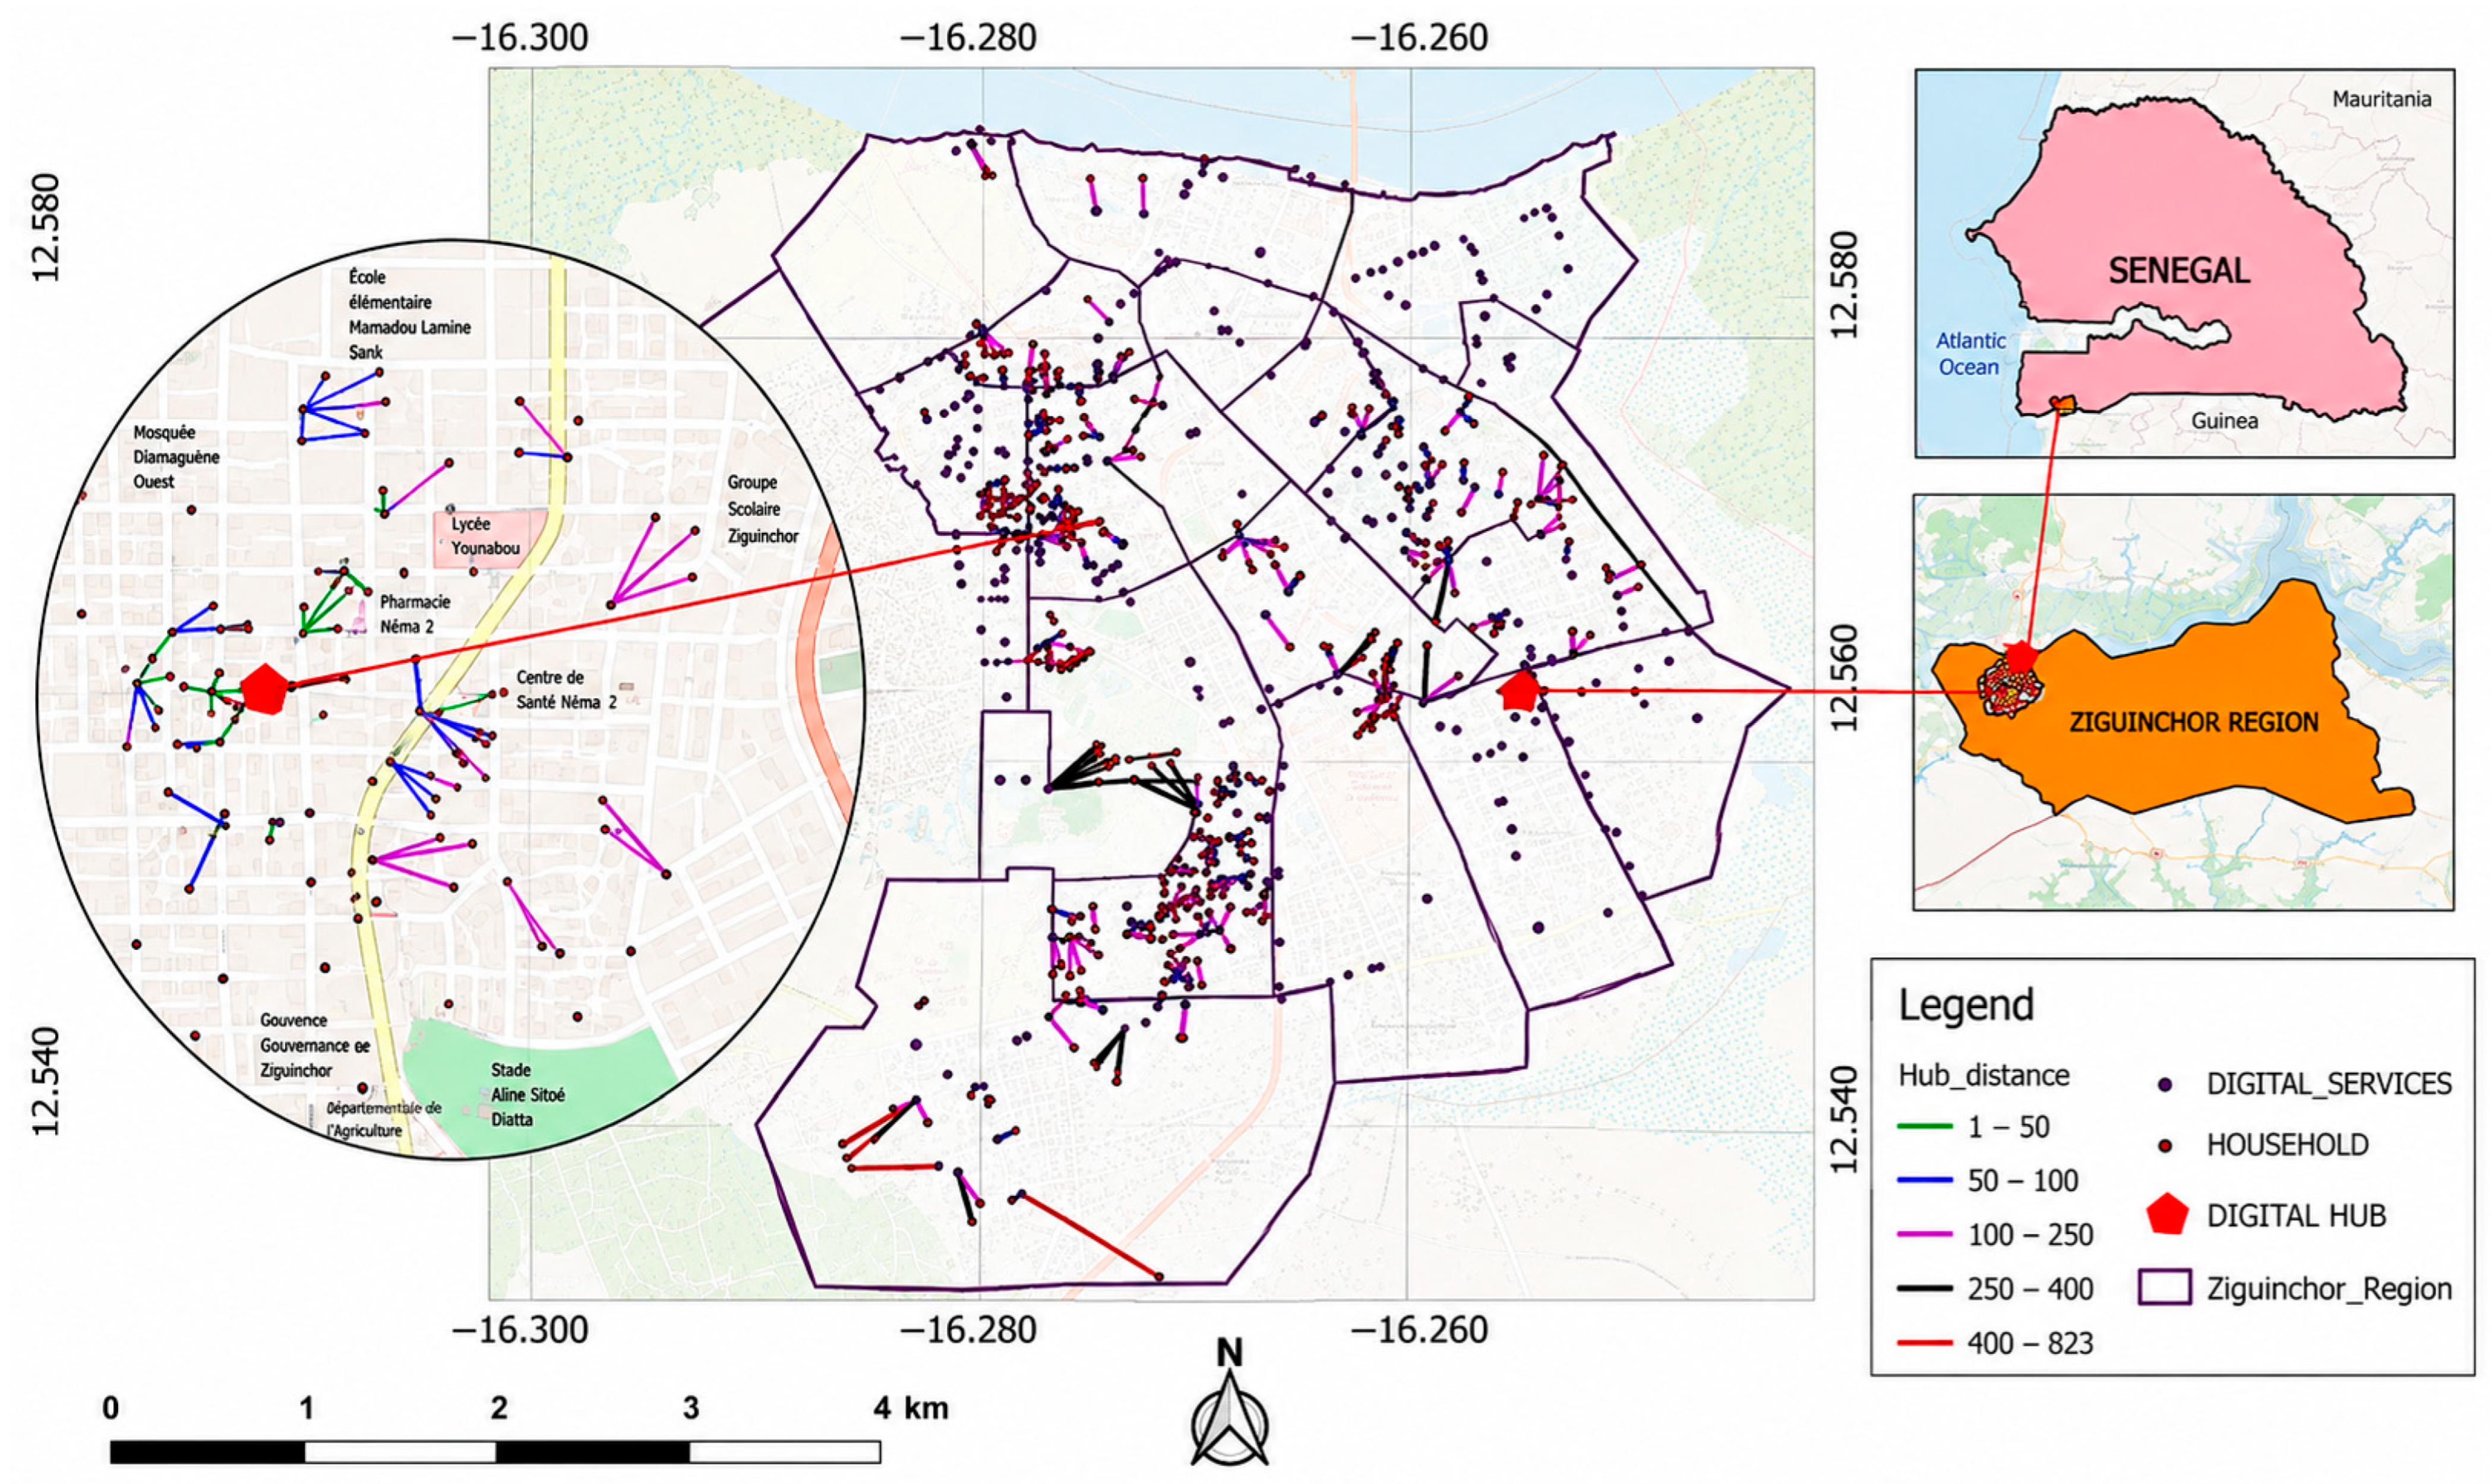
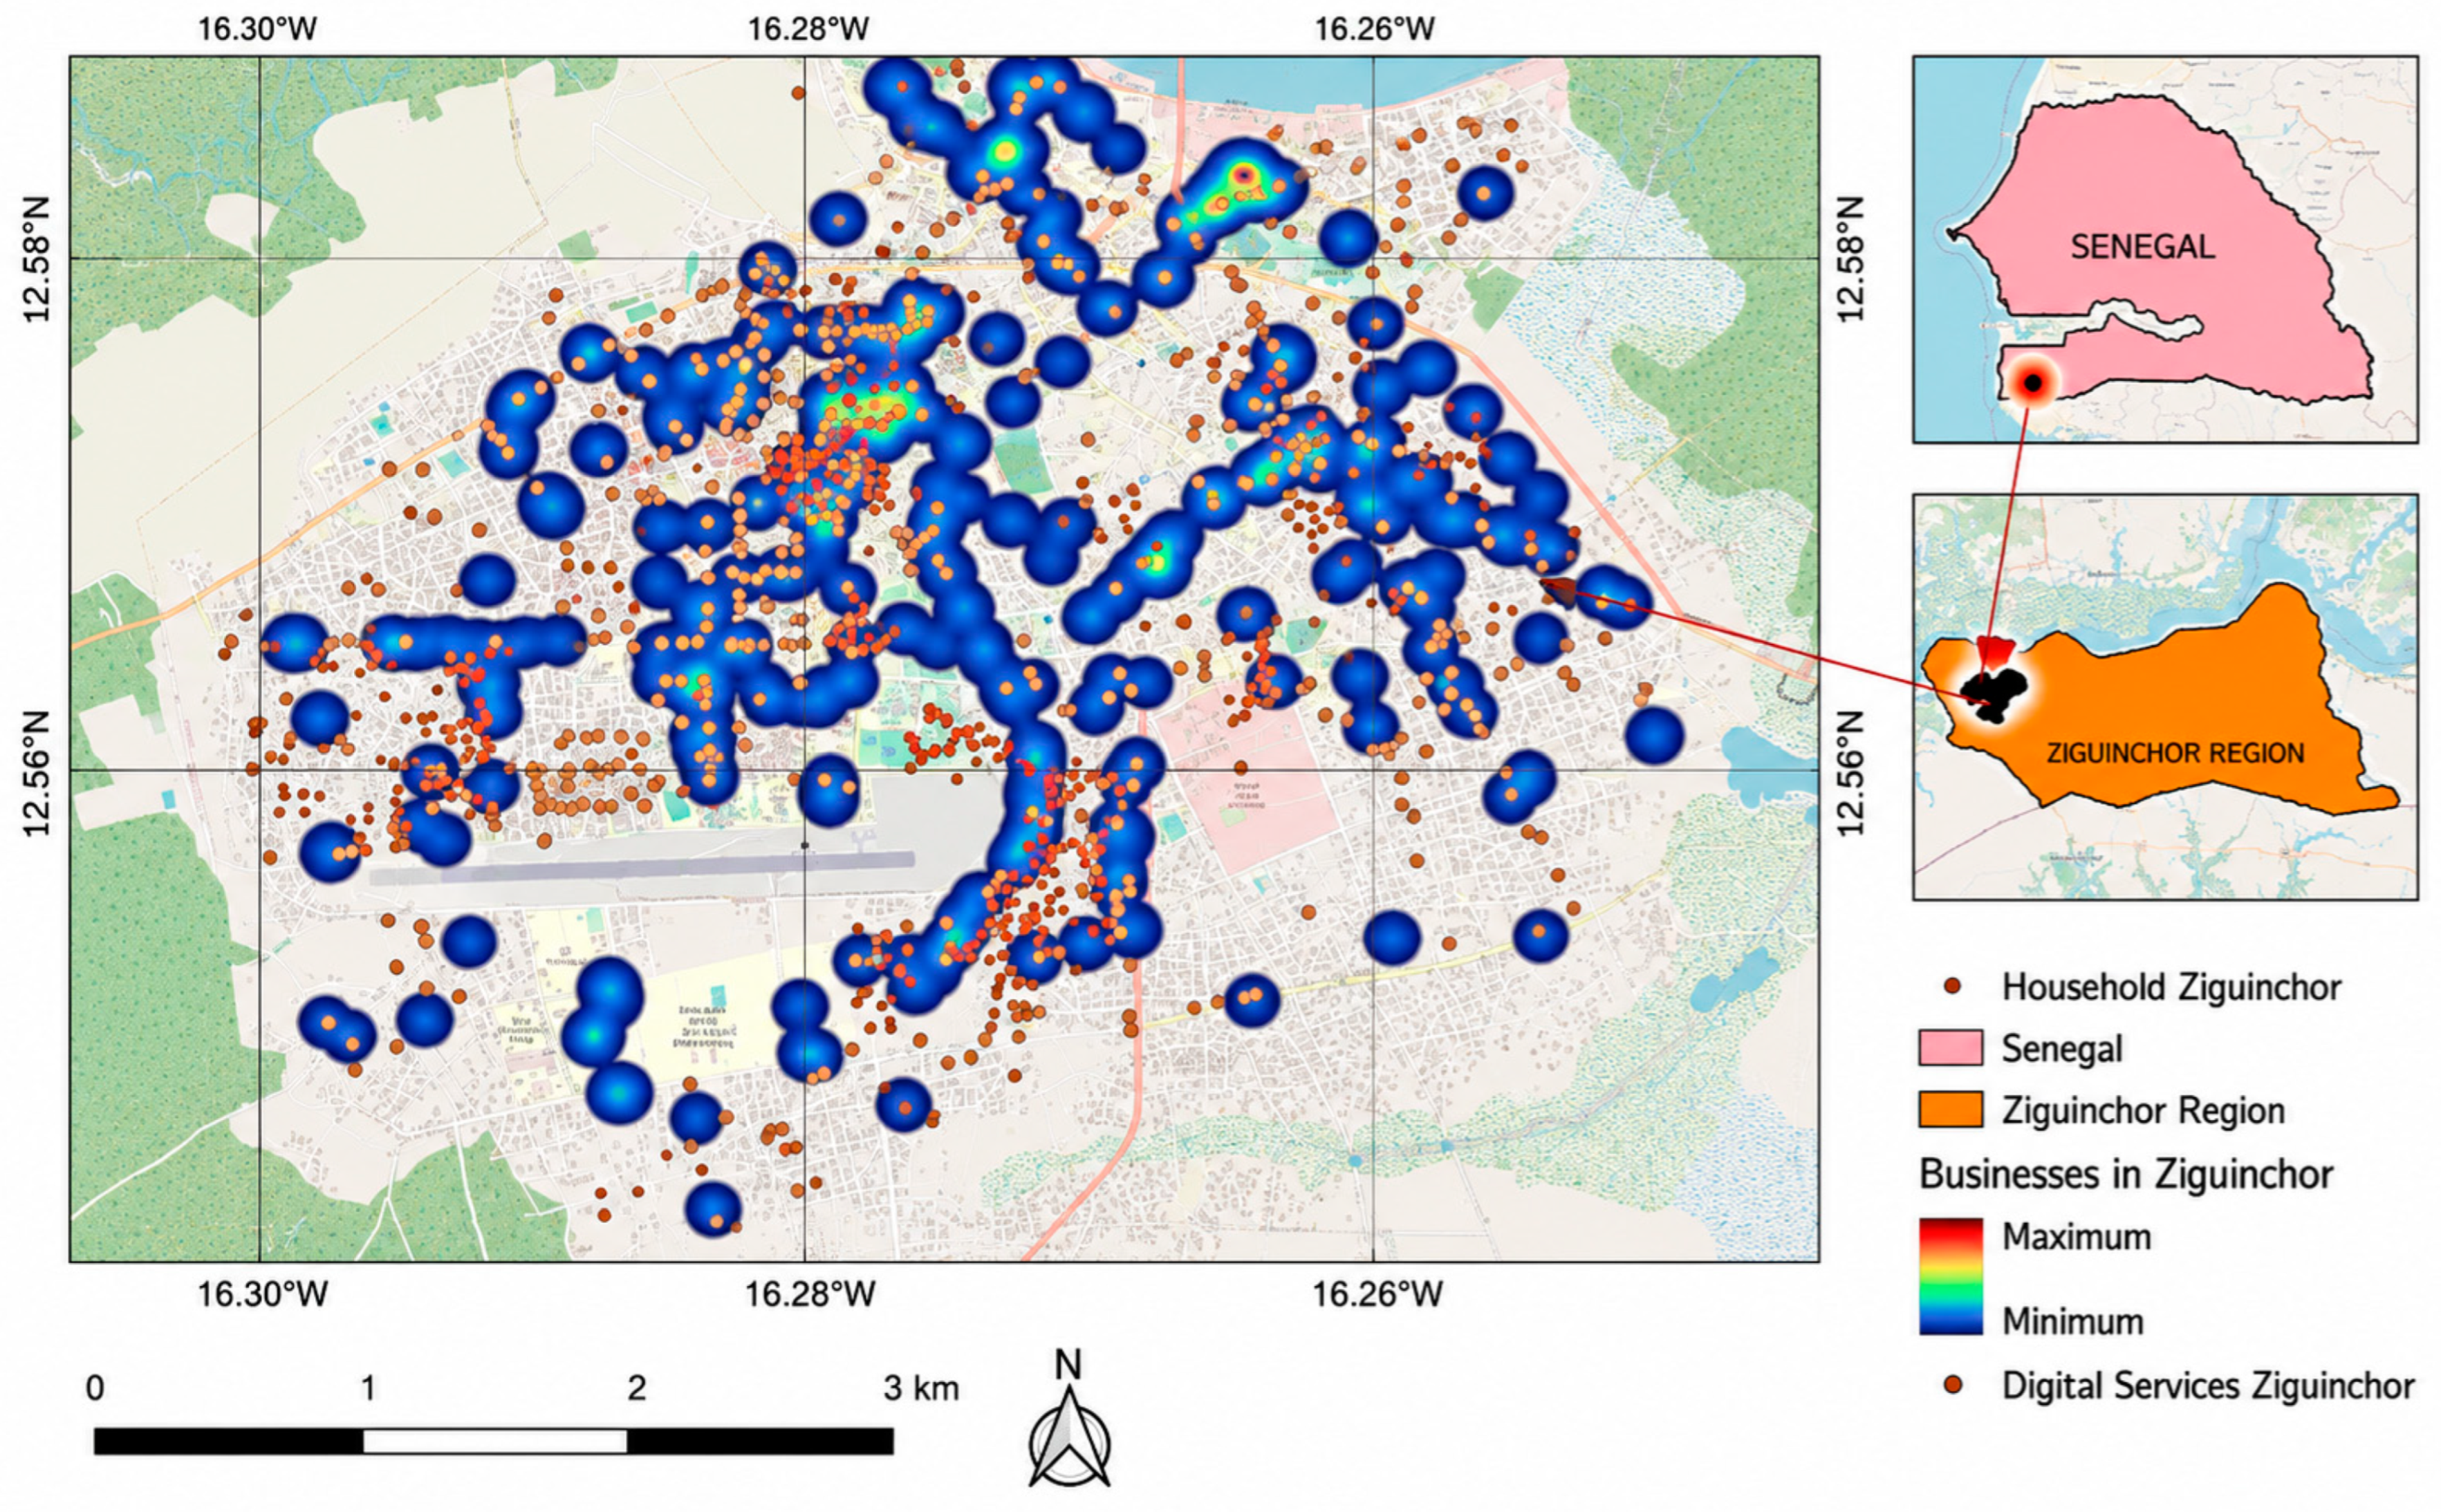
While the analytical framework is designed for comparative multi-city applications, the present study focuses on a single-city case study of Ziguinchor. Ziguinchor, as shown in Figure 1, is located in the Casamance region of southern Senegal, a geographically and socioeconomically distinct area separated from the rest of the country by the Gambia. Historically, Casamance has experienced periods of political instability and relative economic marginalization, which have shaped patterns of infrastructure provision, mobility, and service access. The regional economy is largely based on agriculture, small-scale trade, and informal services, with limited industrial development. As a result, household incomes are generally lower and more variable than in Dakar, and economic activity is strongly embedded in informal and community-based systems.
These socioeconomic characteristics directly influence digital access and use. Large household sizes, reliance on informal livelihoods, and constrained and irregular incomes affect both the affordability of digital services and the capacity to maintain and replace devices. At the same time, strong social networks and community-based resource sharing, characteristic of the region, play an important role in facilitating access to digital technologies through practices such as device sharing, data pooling, and collective use arrangements.
The trajectory of ICT development in Ziguinchor reflects broader national expansion trends but with uneven local outcomes. While Senegal has experienced rapid growth in mobile network coverage and smartphone penetration over the past decade, secondary cities such as Ziguinchor lag behind the capital in terms of service quality, broadband speed, and network reliability. ICT services, including mobile money agents, data resellers, and device repair shops, are spatially concentrated along commercial corridors and central quartiers, leaving peripheral neighbourhoods relatively underserved. This uneven distribution contributes to significant intra-urban disparities in digital opportunity.
Infrastructure constraints remain a defining feature of the local digital ecosystem. Electricity supply is characterized by frequent outages and voltage instability, which limit the effective use of digital devices despite widespread ownership. Transport infrastructure and mobility options are also unevenly distributed, affecting households’ ability to physically access ICT service points. These constraints interact with affordability barriers, particularly the cost of mobile data, to shape patterns of constrained connectivity observed in the study.
From a governance perspective, digital development in Senegal is guided by national strategies such as the Plan Sénégal Émergent and sectoral ICT policies aimed at expanding connectivity and promoting digital services. However, implementation at the local level remains uneven, particularly in secondary cities where municipal capacity, investment levels, and coordination across sectors are more limited. In Ziguinchor, the provision of ICT-related services is largely driven by private and informal actors, resulting in a hybrid digital ecosystem characterized by both formal infrastructure and decentralized, community-based service provision.
Taken together, these contextual factors make Ziguinchor a particularly relevant case for studying digital inclusion in secondary cities of the Global South. The combination of infrastructural deficits, spatial inequalities, and strong social networks creates a setting in which digital access and use are shaped by both structural constraints and adaptive strategies. At the same time, these specific regional and institutional conditions imply that the findings should be interpreted as context-dependent, with careful consideration required when generalizing to other urban environments.

2.2. Data Sources and Preparation

2.2.1. Primary Data Collection

Household Survey
A household survey was conducted in Ziguinchor between 10 and 18 May 2025 to collect data on digital access, usage, and enabling conditions. The survey employed a two-stage sampling design. First, 27 quartiers were stratified by population density and infrastructure characteristics. Second, within each quartier, households were selected using systematic random sampling along predefined transects to ensure spatial coverage and reduce selection bias.
The sampling frame was constructed using administrative population estimates and field reconnaissance. Transects were designed to traverse each quartier from edge to edge, capturing variation in housing types and infrastructure quality. Enumerators followed a systematic skip pattern (every n th household) along each transect, with n adjusted to achieve target sample sizes proportional to quartier population.
Soft quotas were monitored across key demographic strata, including respondent age groups and education levels, to ensure adequate representation of diverse household types. When the primary respondent (household head or spouse) was unavailable, enumerators scheduled return visits. Refusal rates were low (<5%), and non-response was not systematically associated with observable household characteristics.
The final sample comprises 566 households distributed across all 27 quartiers. The survey instrument included modules on: (1) Household composition and demographics, (2) Digital device ownership and internet access, (3) Frequency and intensity of digital service use, (4) Electricity access and reliability, (5) Mobility patterns and transport access, (6) Household expenditure and income proxies and Spatial access to key services (health, education, markets).
The sample reflects a diverse demographic profile. The gender distribution is balanced, with 50.9% male (=288) and 49.1% female (=278) respondents. Educational attainment is relatively high, with 46.1% having completed secondary education, 17.8% holding a university-level qualification, and 14.8% reporting college-level education. Household size averages 8.8 individuals, consistent with extended household structures typical of secondary urban contexts in Senegal. The response rate was high, with non-response primarily due to temporary absence or refusal at the time of visit. In such cases, the next eligible household along the sampling route was selected to maintain sampling continuity. Comparison of key characteristics (age, household size, electricity access, and water access) with available administrative benchmarks suggests that the sample provides a reasonable approximation of the urban population structure. Sampling weights were not applied in the main analysis due to the absence of fully calibrated population weights; however, the sampling strategy ensured broad spatial representativeness across quartiers. Standard errors in regression models are clustered at the quartier level to account for intra-neighbourhood correlation.
Data was collected through face-to-face interviews with an adult household respondent using a structured questionnaire. Geographic coordinates were recorded at the dwelling level using handheld mobile devices to enable linkage with spatial data.
All survey protocols were approved by Senegales institutional review board, and informed consent was obtained from all respondents.
Geolocation and Spatial Data
The geospatial component of the study is built around a detailed, citywide point inventory of ICT-related commerce and service infrastructure in Ziguinchor. This database includes formal and informal telecom outlets, mobile money agents, Wi-Fi vendors, cybercafés, device repair stalls, accessory shops, and data resellers. All points were geocoded, screened for duplicates, and validated for coordinate plausibility before being projected into a common metric coordinate reference system to ensure consistent spatial measurement.
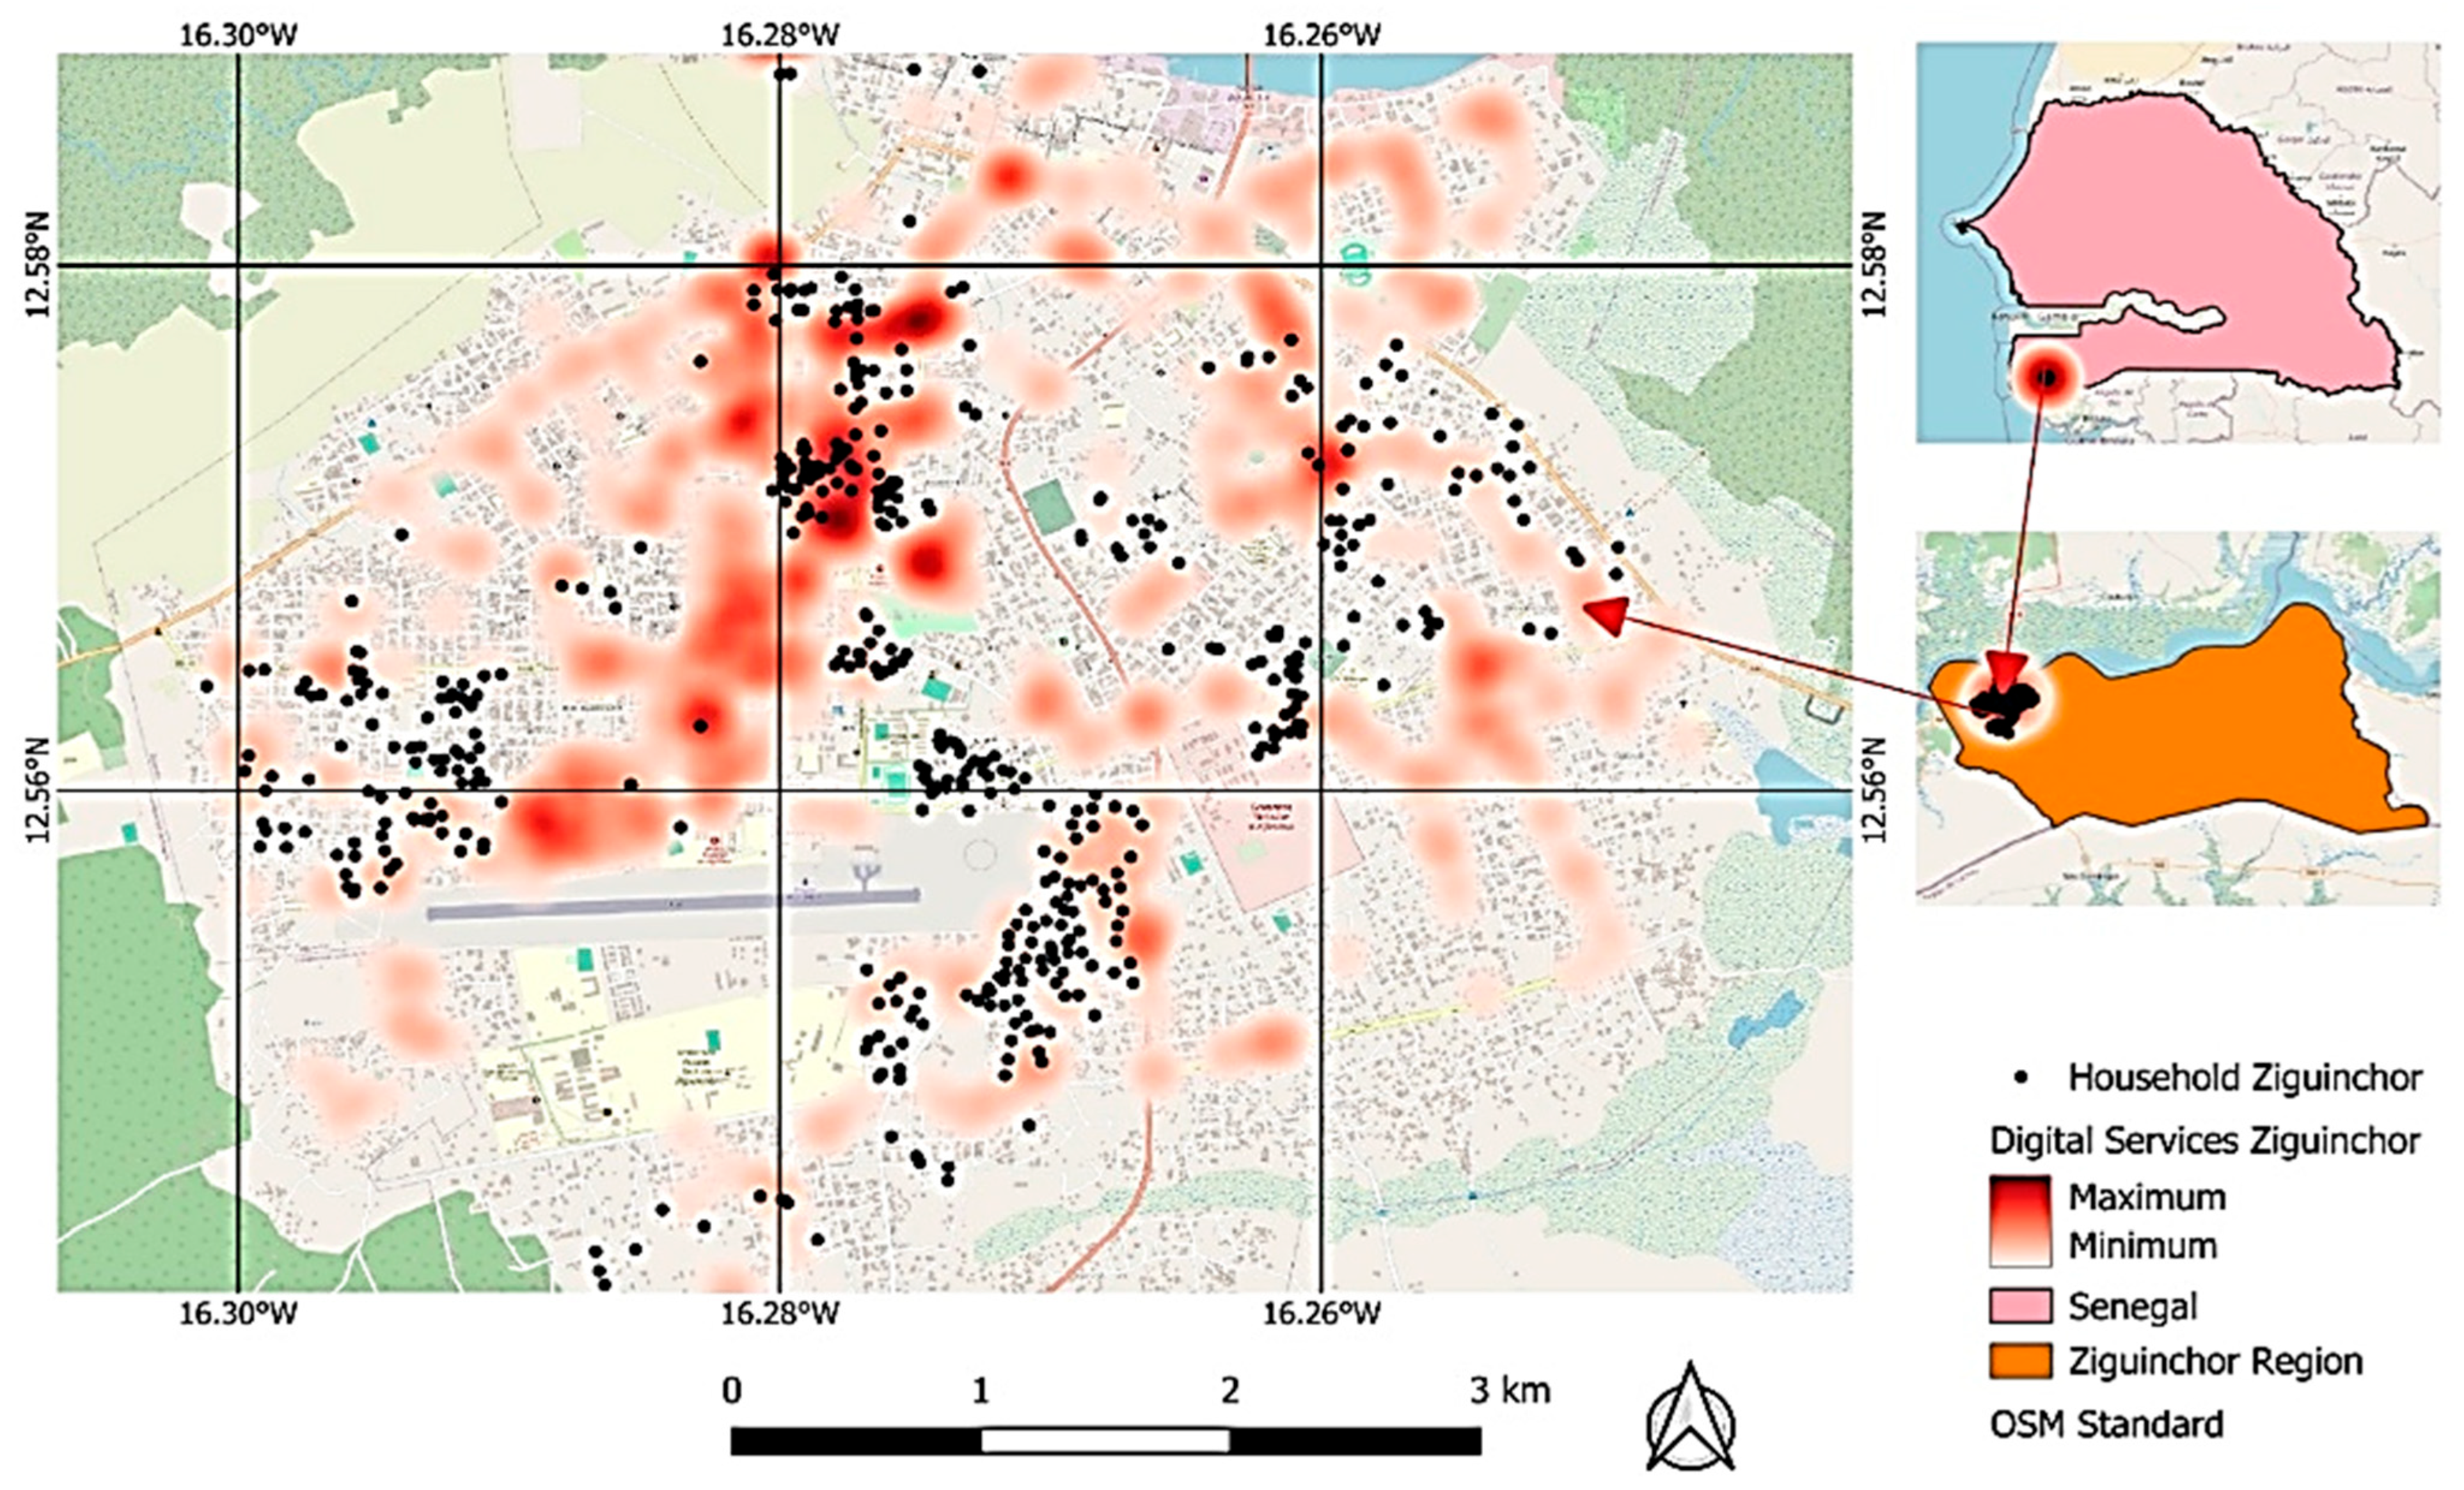
To characterize the structure of Ziguinchor’s digital service environment and link it to household conditions, three complementary geospatial analyses were undertaken. First, service density mapping using kernel density estimation (KDE) produced continuous heatmaps of ICT service locations and, where GPS coordinates were available, household distributions. GPS coordinates were obtained for most observations using handheld GPS devices (accuracy ± 5 m). Coordinates were validated against quartier boundaries using administrative shapefiles. Observations with implausible coordinates (e.g., falling outside city boundaries or in water bodies) were flagged and corrected through manual verification.
For the small number of cases where GPS coordinates could not be obtained or failed validation, respondents were assigned to their quartier centroid. The centroid substitution rate was 0% for the final analytical sample, as all observations had valid GPS coordinates. Sensitivity analyses restricting the sample to high-precision readings (±3 m) yield substantively unchanged results (Appendix A Table A1).
Spatial data layers were compiled from multiple sources. Road network data were derived from OpenStreetMap (OSM) extracts and subsequently validated and corrected through field verification. Points of interest (POIs), including health facilities, schools, markets, and administrative centres, were mapped using a combination of field surveys and OSM data. Mobile network coverage layers were obtained from operator-provided coverage maps for 2G, 3G, and 4G services and aggregated to 100 m grid cells. Electricity infrastructure data, including transformer locations and distribution lines, were digitized from utility maps and supplemented through field surveys. Administrative boundaries were obtained from official quartier shapefiles provided by municipal authorities.
All spatial layers were projected to UTM Zone 28N (EPSG:32628) for distance calculations. Network distances were computed using the OSM road network with impedance weights reflecting road surface quality and typical travel speeds.
Digital Layers Collected
Complementing the geospatial datasets, the household surveys provide the micro-level outcomes and covariates that are spatially linked, via household GPS or reported quartier, to distance, density, and accessibility measures. The study employs a city-representative household survey in Ziguinchor (details in the survey protocol) and elicits: (i) any internet access/use (home or public), (ii) use frequency (later mapped to an intensity index), (iii) smartphone ownership, (iv) demographic characteristics (age or age bands; education), (v) household size, (vi) employment/income proxies (e.g., labour force status, asset indicators), and (vii) utility access (electricity, water The utilities in Ziguinchor are recorded as binary availability with optional outage frequency. Location fields (household GPS were available; otherwise, the reported quarter) enable one-to-one joints with the service-point layers and administrative boundaries. When GPS is missing or fails validation, the respondent is assigned to the quartier centroid for exposure construction; such cases are flagged and tested in robustness checks against the GPS-only subsample. Sampling weights, when provided, are applied to descriptive statistics and used in sensitivity analyses of the regression models. Harmonization follows a documented codebook, preserving Ziguinchor differences where substantively meaningful while aligning constructs needed for the within-city fixed-effects estimation.
The survey collected data on multiple dimensions of digital inclusion, which were subsequently aggregated into two composite indices: the Digital Inclusion Index (DII) and the Composite Digital Access Score (CDAS). First, the Digital Inclusion Index (DII) summarizes realized inclusion from three survey components, internet_any, smartphone ownership, and use_intensity. Each component is standardized within city (z-scores), averaged over the observed components (flagging dii_partial = 1 if any component is missing), and linearly rescaled to 0–100. DII therefore captures both the extensive margin (whether households connect) and the intensive margin (how often they use the internet).
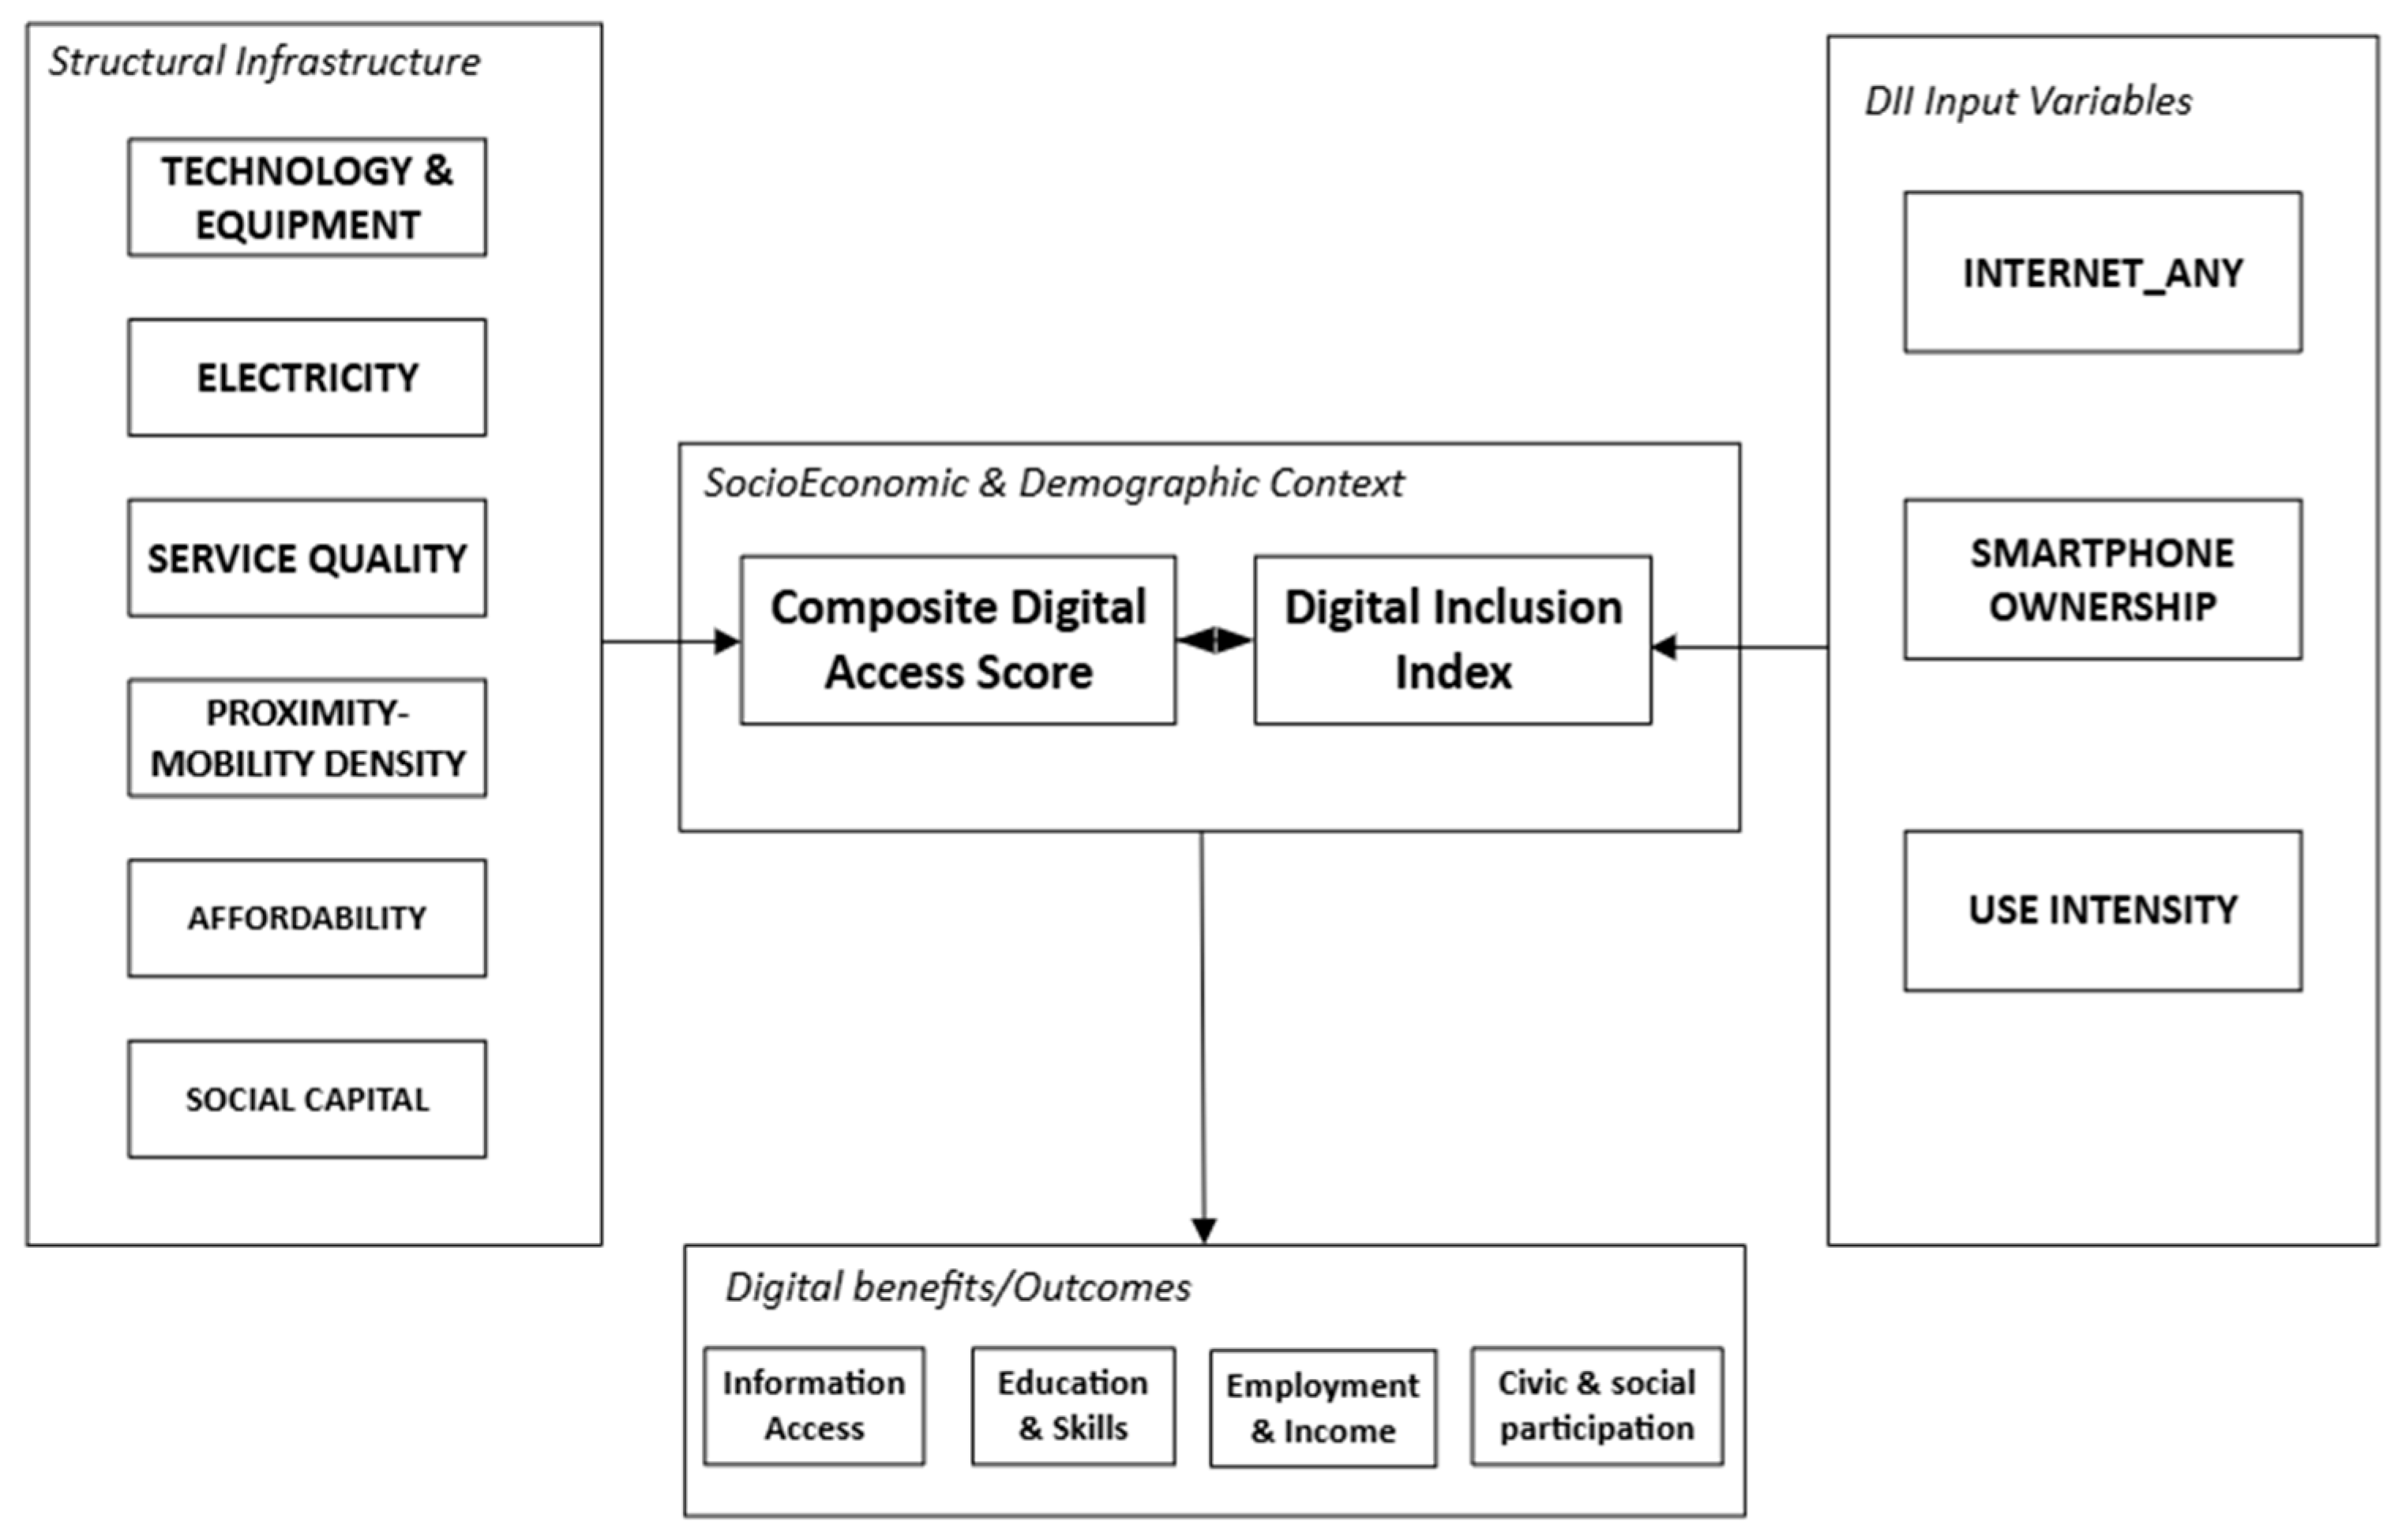
Second, the Composite Digital Access Score (CDAS) captures the structural conditions that enable or constrain digital use by aggregating six dimensions: Electricity (E), Affordability (A), Proximity–Mobility–Density (P), Service Quality (S), Technology and Equipment (T), and Social Capital (C). Each pillar is constructed from survey-derived indicators, normalized on a 0–100 scale, and averaged to produce the overall CDAS. The household survey provides the core data underpinning these pillars. In the Ziguinchor case, affordability (A) is derived from reported income or, where unavailable, an asset-based wealth proxy. Electricity (E) reflects access to power and the frequency of outages. Service quality (S) is based on self-reported internet performance, connection type, and operator characteristics. Technology (T) captures access to devices, including smartphone ownership and device condition. Social capital (C) is measured through practices such as sharing data, devices, or participation in collective access arrangements. The Proximity–Mobility–Density (P) pillar explicitly integrates survey and geospatial data. It combines the distance to the nearest ICT service point and the density of services within a 1 km radius with a survey-based indicator of transport access. These components are transformed into a 0–100 score, where proximity is modelled using a log-distance function (capped at 2 km) and density incorporates diminishing returns. When subcomponents were missing, each pillar were computed on the observed parts and rescaled to 0–100, with component_partial = 1. CDAS was computed for observations with data on at least four of the six pillars; observations with fewer were classified as partial (CDAS_partial = 1). For Regression models estimated for the Ziguinchor sample, the study standardizes CDAS to within-city z-scores; for maps and dashboards the study retained the 0–100 scale. As illustrated in Figure 2, the Digital Inclusion Index (DII) captures realized digital usage and capability outcomes, while the Composite Digital Access Score (CDAS) represents the enabling structural environment shaping digital access opportunities within neighbourhoods. these two indices provide an integrated framework for examining both realized digital inclusion and the underlying infrastructural and spatial constraints influencing digital participation.

2.2.2. Secondary Data

Secondary data were compiled from multiple institutional, administrative, and geospatial sources to complement the household survey and support the spatial analysis of digital inclusion in Ziguinchor. Population counts, settlement structure, and demographic information at the quartier level were obtained from the Agence Nationale de la Statistique et de la Démographie (ANSD) of Senegal and supplemented with municipal administrative records where available. These data were used to contextualize household density patterns and support the construction of quartier-level descriptive indicators.
Information on electricity access conditions, infrastructure distribution, and reported service interruptions was compiled from local utility records, municipal infrastructure reports, and field-based verification surveys. These data informed the electricity reliability and infrastructure-access dimensions of the Composite Digital Access Score (CDAS). High-resolution satellite imagery and basemap layers were obtained from OpenStreetMap (OSM), Google Satellite imagery, and publicly available remote-sensing sources to characterize the built environment, settlement morphology, and spatial distribution of ICT-related infrastructure. These layers were used for georeferencing, service mapping, and density estimation.
Spatial information on ICT-related points of interest, including telecom outlets, mobile money agents, cybercafés, Wi-Fi vendors, and device repair services, was compiled through field mapping, GPS-based surveys, and OpenStreetMap data. Mobile network coverage information for 2G, 3G, and 4G services was derived from publicly available operator coverage maps and validated through field observations where feasible. Road network layers were extracted from OpenStreetMap and cleaned through field verification. These data were used to derive proximity and accessibility measures, including network-based mobility indicators and nearest-distance calculations between households and ICT service points.

2.3. Integrated Framework: Linking Realized Digital Inclusion (DII) and the Enabling Environment (CDAS)

This study adopts an integrated analytical framework that distinguishes between the structural conditions enabling digital participation and the realized forms of digital engagement observed at the household level. The framework combines the Digital Inclusion Index (DII), which captures realized digital practices, with the Composite Digital Access Score (CDAS), which reflects the enabling environment shaping digital opportunity. This distinction is grounded in multidimensional digital divide frameworks [25,26,27] and capability-based approaches to technology access and use [28,29], which emphasize that access to digital technologies alone does not necessarily translate into meaningful participation or beneficial outcomes.
Conceptually, the framework recognizes that digital inclusion is shaped by the interaction between infrastructure, affordability, mobility, service quality, and individual capabilities. Households may possess access to devices or network connectivity while still facing constraints that limit effective use, including unreliable electricity, poor service quality, affordability barriers, or limited digital skills. Conversely, some households may achieve relatively high levels of digital engagement despite structurally constrained environments through adaptive strategies, shared resources, or strong social networks.
The framework is organized around three interrelated dimensions of the digital divide. The first-level divide refers to inequalities in access to digital infrastructure, connectivity, and devices. The second-level divide concerns differences in patterns and intensity of digital use among individuals who already possess some degree of access. The third-level divide relates to inequalities in the social, economic, and informational benefits derived from digital participation. Together, these dimensions provide a more comprehensive understanding of digital inequality than infrastructure-based approaches alone.
Within this framework, the CDAS captures the structural and spatial conditions associated with first-level access inequalities, while the DII captures realized digital behaviour associated with second-level inclusion outcomes. The combined interpretation of these indices enables identification of mismatches between enabling conditions and realized use, thereby providing a more nuanced basis for analyzing digital inequality and informing targeted policy interventions. Table 1 maps the conceptual framework onto the empirical measures used in the study.
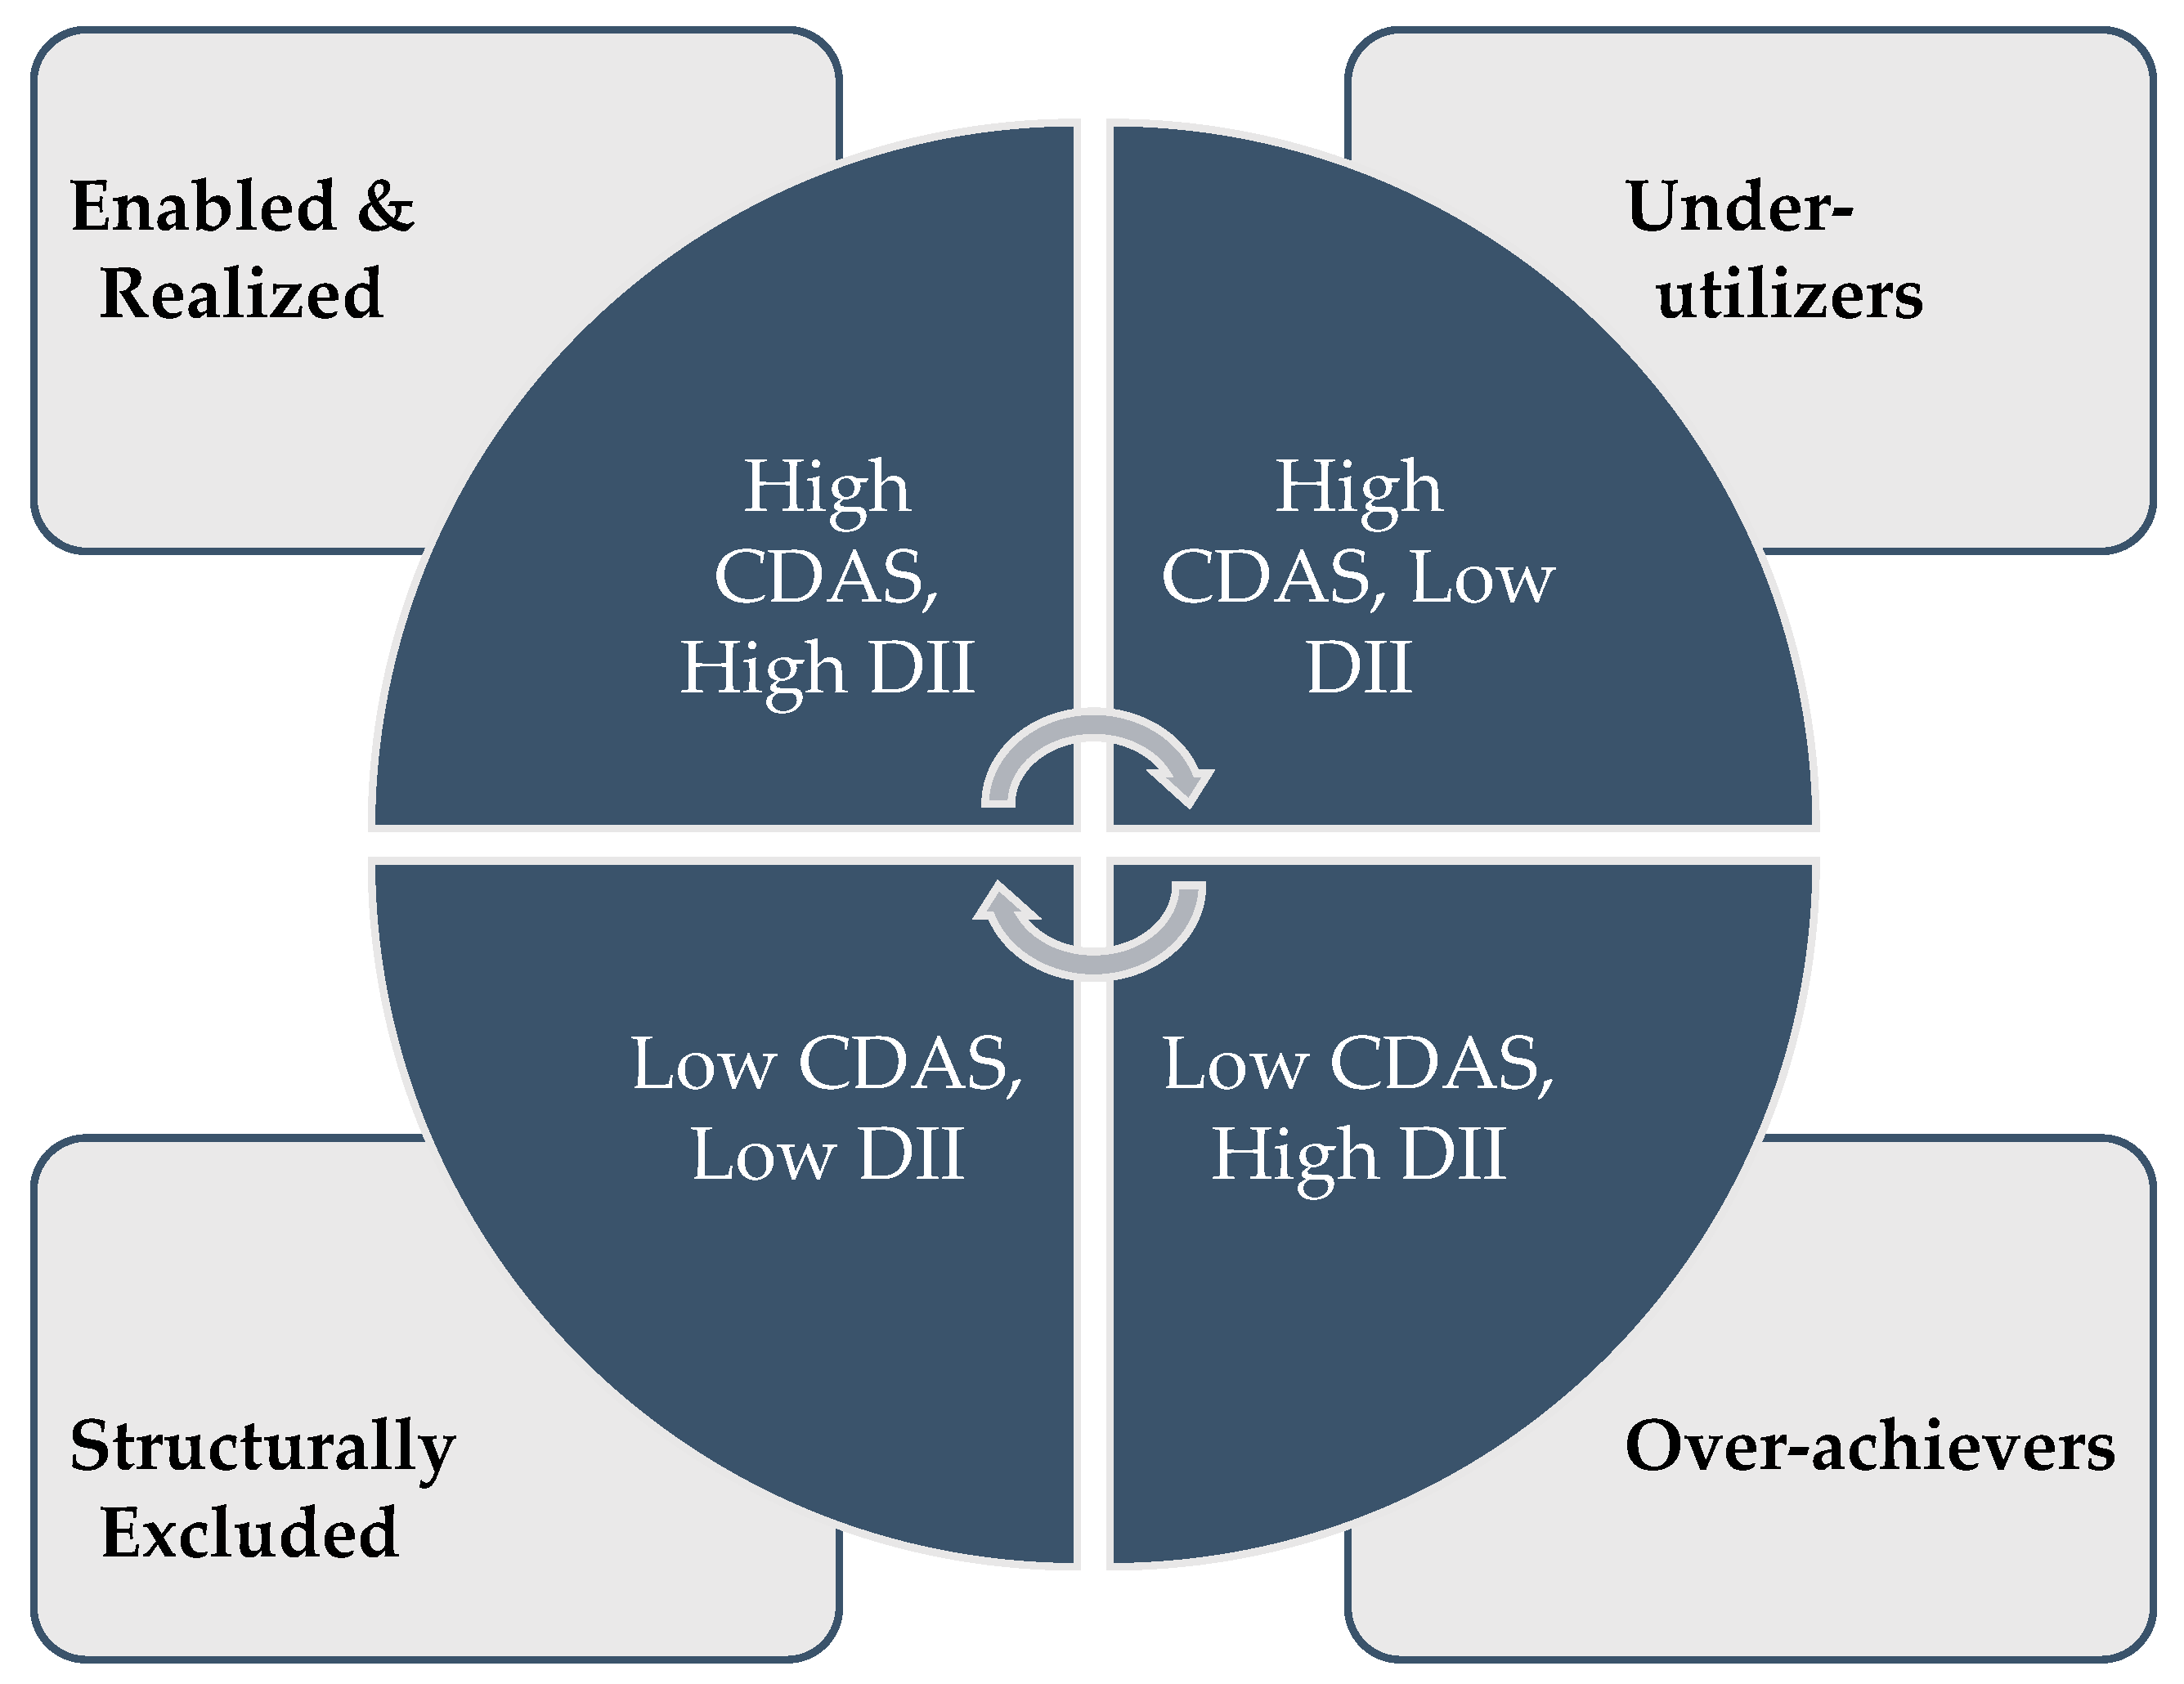
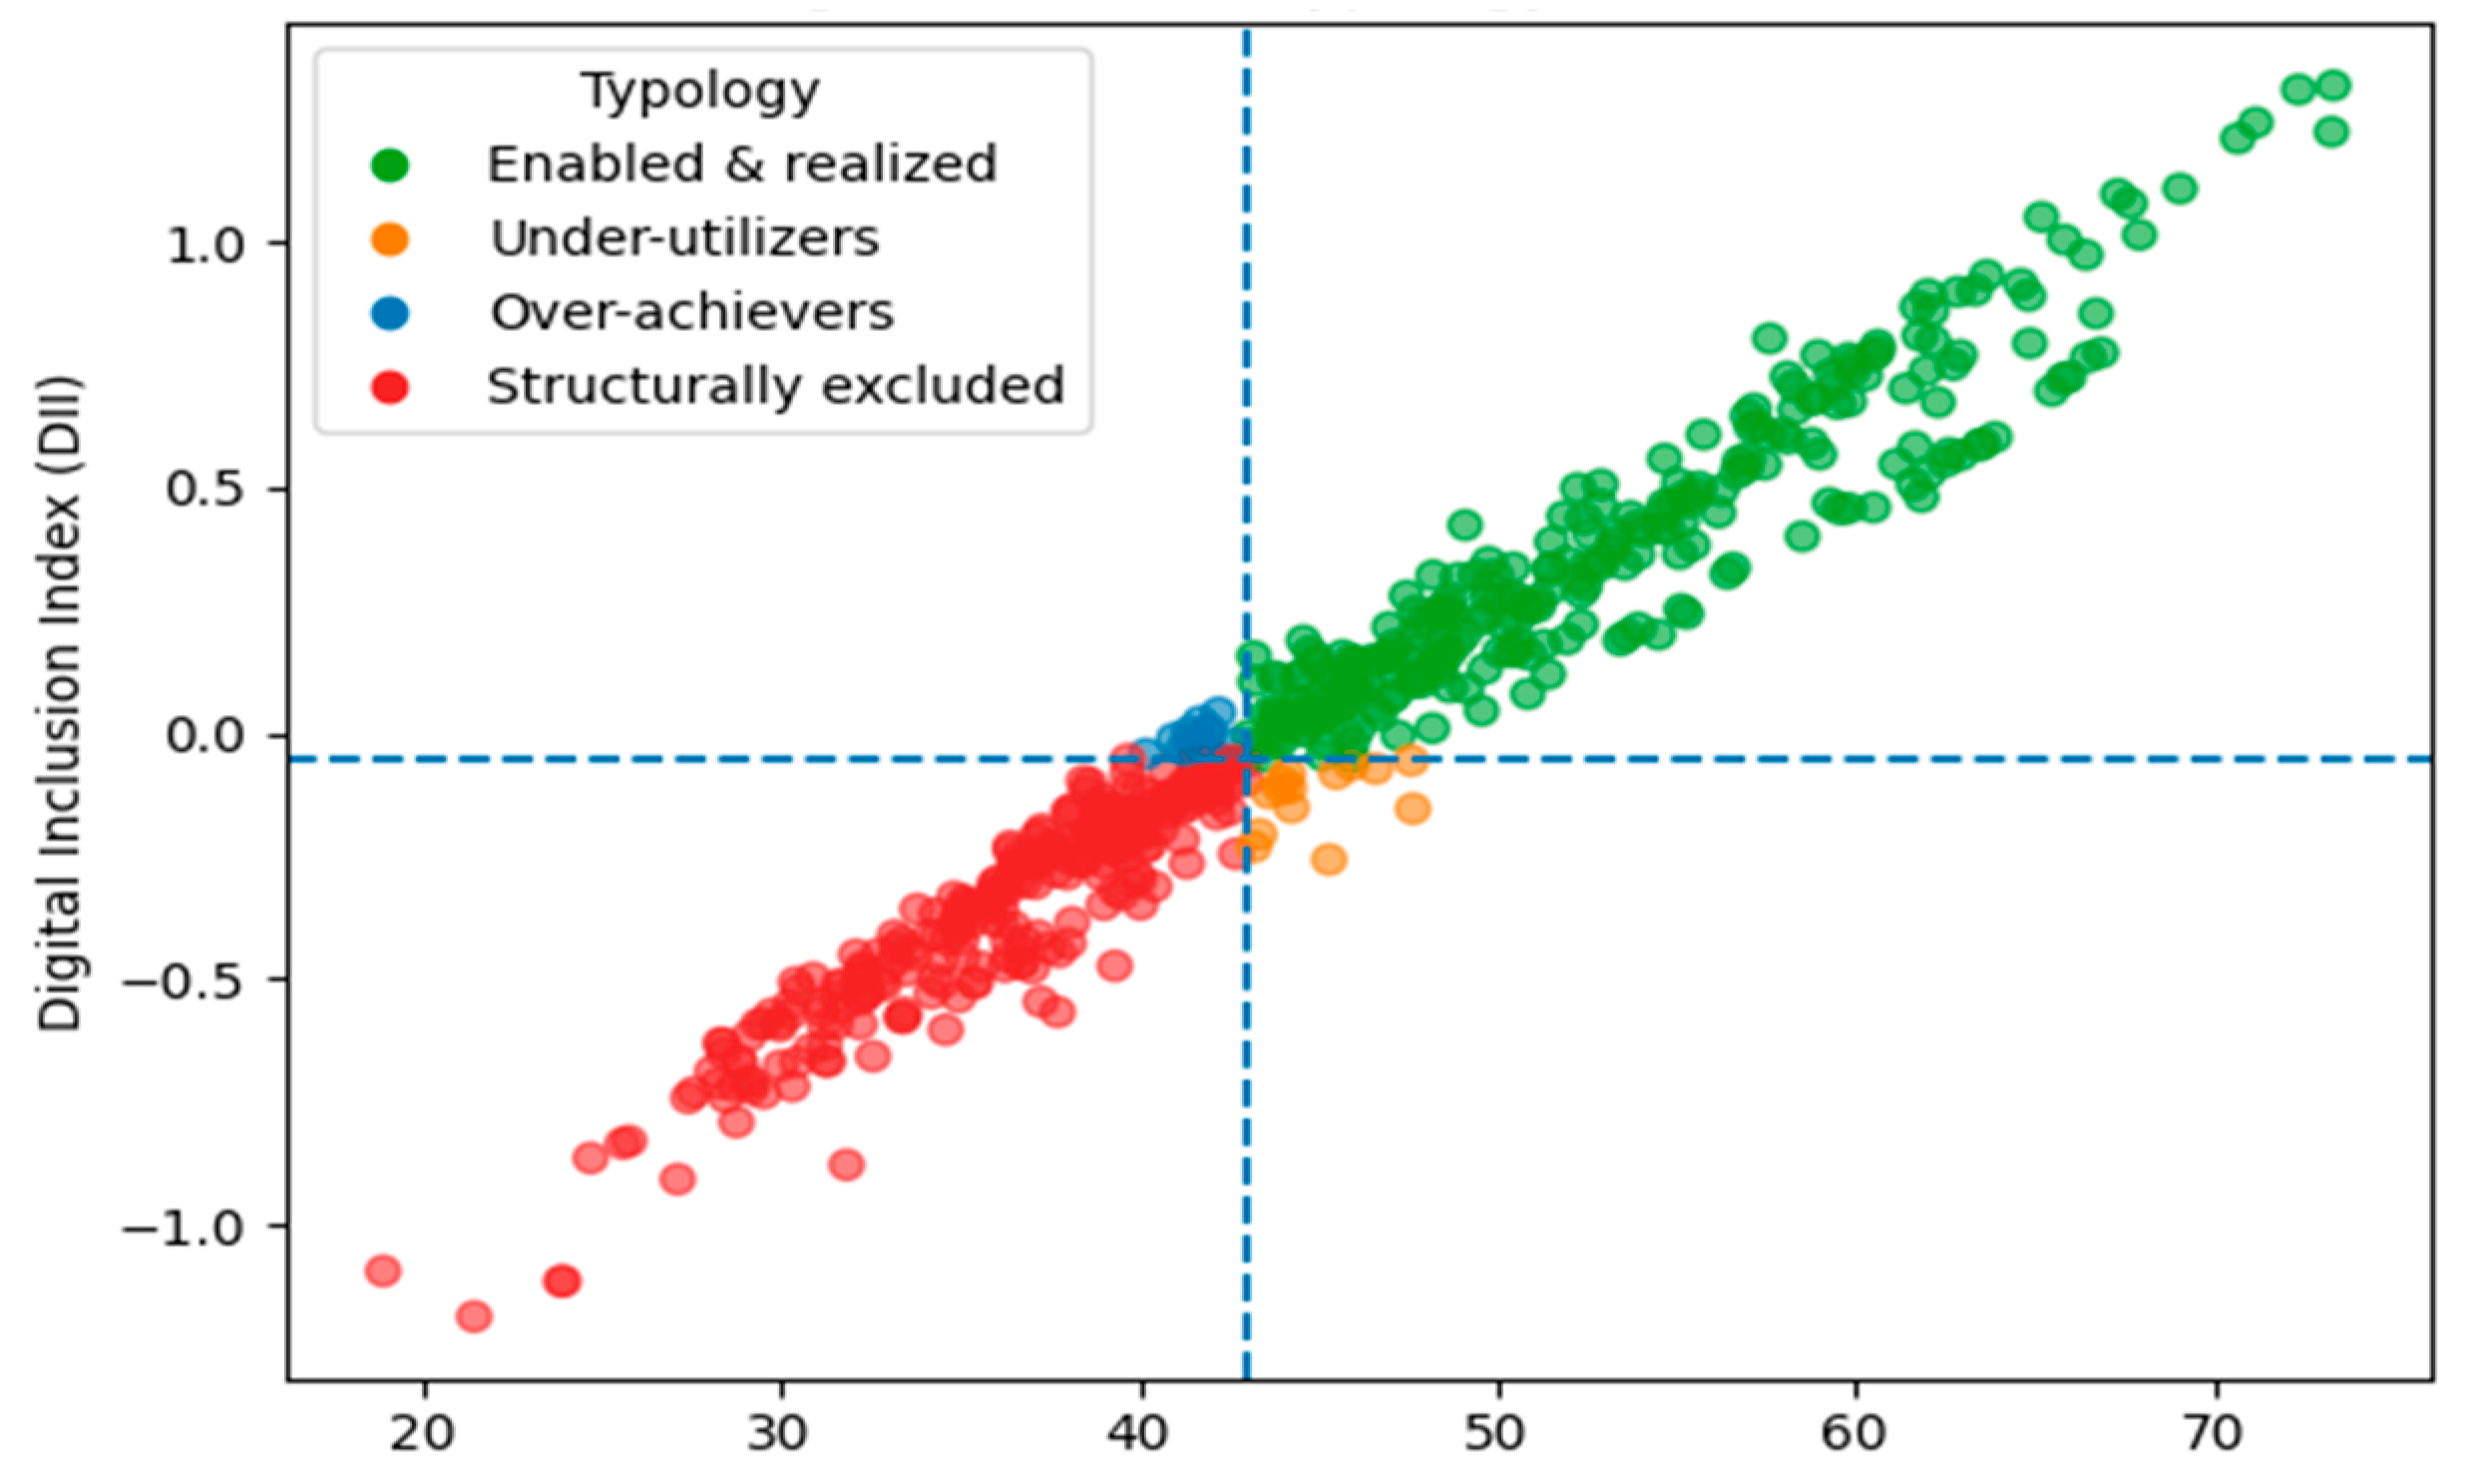
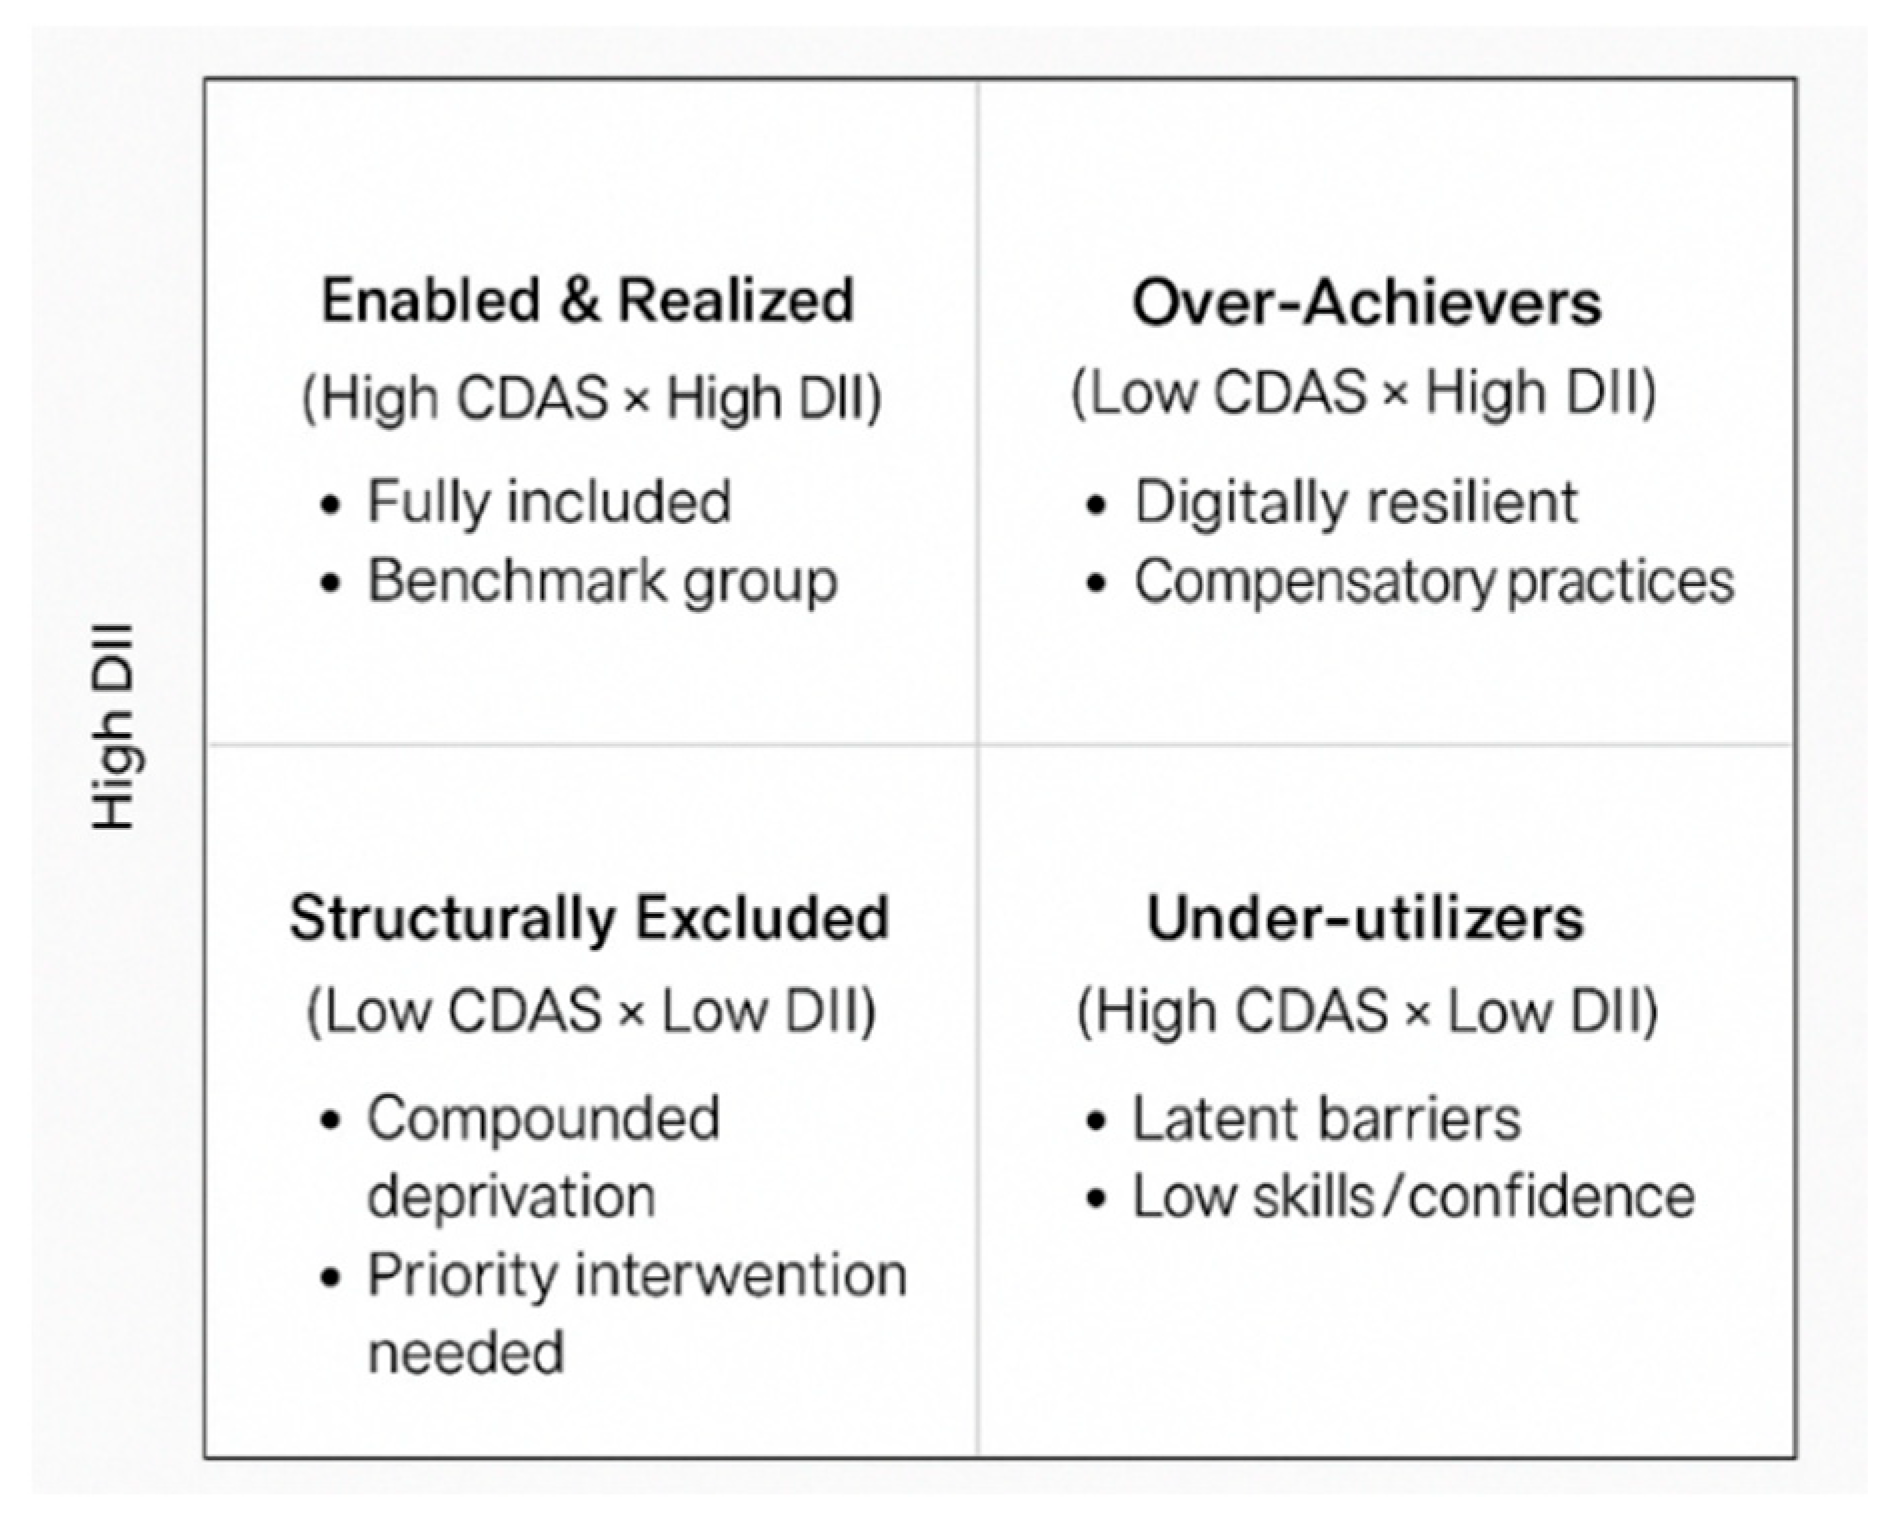
By estimating both indices consistently within cities and standardizing components across demographic strata (age × education), the framework reduces compositional confounding and enables meaningful cross-neighbourhood comparison. It provides a robust basis for identifying four distinct profiles of digital inclusion, as shown in Figure 3. First, households with high CDAS and high DII (“Enabled and Realized”) benefit from favourable structural conditions and effectively translate them into digital use. Second, high CDAS but low DII (“Under-utilizers”) indicate contexts where access exists but is not fully converted into meaningful use, pointing to behavioural, skills, or socio-cultural barriers. Third, low CDAS and low DII (“Structurally Excluded”) reflects compounded disadvantage, where limited infrastructure and resources directly constrain digital engagement. Finally, low CDAS but high DII (“Over-achievers”) captures households that, despite structural constraints, manage to achieve relatively high levels of digital use, highlighting adaptive strategies and latent demand. In doing so, the integrated CDAS–DII framework explicitly links structure (opportunity conditions) and agency (realized use), offering a theoretically grounded and operational tool for spatially targeted and group-specific digital policy interventions.
This typology is operationalized using median splits on DII and CDAS (see Section 2.5.1) and is used to diagnose spatial patterns of digital inclusion and inform policy targeting (see Section 3.3 and Section 3.7).

2.3.1. Theoretical Foundations

The analytical framework draws on Sen’s capability approach [29], which distinguishes between resources (what people have), functionings (what people do), and capabilities (what people can do). In the context of digital inclusion, resources correspond to enabling conditions such as infrastructure, digital devices, electricity access, affordability, and connectivity. Functionings refer to realized digital practices, including internet use, online engagement, and interaction with digital services. Capabilities represent the freedom and ability to achieve valued digital functionings, shaped not only by access to resources but also by conversion factors such as digital skills, literacy, education, mobility, and social support.
This perspective emphasizes that access to digital resources does not automatically translate into meaningful use. Conversion factors, including digital skills, literacy, social norms, and institutional support, mediate the relationship between resources and functionings. The framework thus highlights the importance of both structural conditions and individual/household capabilities in shaping digital inclusion outcomes.
The framework also aligns with recent work on “effective access” [30] and “meaningful connectivity” [31], which emphasize that digital inclusion requires not only availability of infrastructure but also affordability, quality, and relevance of digital services.

2.3.2. Operationalization

Composite Digital Access Score (CDAS)
The Composite Digital Access Score (CDAS) operationalizes enabling conditions by aggregating six domains: technological equipment, electricity access, affordability, spatial access to services, network coverage, and mobility. The construction of CDAS is detailed in Section 2.5.1.
These dimensions operate at both the household level (affordability, devices, skills, etc.) and the neighbourhood level (service density, transport access, outage patterns, etc.) and together define the informational and infrastructural substrate that makes digital participation feasible. In Sen’s capability terminology, CDAS represents the conversion factors, the material, social, and environmental conditions that determine whether a household can transform resources into digital capability.
The household survey provides direct measures for each pillar: outage frequency and fixed-mobile quality assessments, distance to ICT services, perceived affordability, digital expenditure, device condition, and household skill composition. These empirically grounded components allow CDAS to reflect the lived constraints and enablers that shape meaningful digital opportunity in Ziguinchor.
Digital Inclusion Index (DII)
The Digital Inclusion Index (DII) operationalizes realized digital practices by capturing both the extensive margin (whether households use the internet) and the intensive margin (how intensively they do so). The construction of DII is detailed in Section 2.5.1.
While DII is shaped by the structural conditions captured in CDAS, the relationship is not deterministic. Structural factors such as affordability, proximity, electricity reliability, and device access influence the likelihood and intensity of use, but they do not fully determine behaviour. Deviations arise in two important cases. “Under-utilizers” display low DII despite favourable CDAS, indicating behavioural, cultural, or informational constraints. Conversely, “over-achievers” exhibit high DII under constrained CDAS conditions, suggesting compensatory strategies such as device sharing, reliance on community infrastructure, or support from digitally skilled peers. These patterns highlight that digital inclusion depends not only on access but also on agency and capability conversion.
Conversion Factors and Mediating Variables
The framework recognizes that the relationship between enabling conditions (CDAS) and realized digital practices (DII) is mediated by a range of conversion factors that shape individuals’ ability to translate access into meaningful digital participation. These include digital skills, referring to the ability to use devices and navigate online services; literacy, including the reading and writing competencies required for text-based interfaces; social capital, reflected in access to informal support networks for troubleshooting, information sharing, and learning; and institutional support, including the availability of training programmes, public access facilities, and digital literacy initiatives. Although these mediating factors are not directly measured in the present study, they are discussed as potential mechanisms underlying observed patterns of digital inclusion and exclusion (see Section 4.2).

2.4. Analytical Strategy

The analytical strategy proceeds in three stages:

2.4.1. Micro-Level Household Analysis: Household Digital Inclusion

The first stage examines the distribution of DII and CDAS across households and quartiers. Descriptive statistics characterize the sample in terms of digital access, usage, and enabling conditions. Bivariate associations between DII, CDAS, and household characteristics (education, income, age) are explored using correlation analysis and cross-tabulations.
The four-quadrant typology (introduced in Section 2.3) is used to classify households and examine the prevalence of each type across quartiers. This diagnostic reveals spatial patterns of structural exclusion, under-utilization, and over-achievement.

2.4.2. Meso-Level Analysis: Spatial Patterns and Infrastructure

The second stage examines spatial patterns of digital inclusion at the quartier level. Quartier-level aggregates of DII and CDAS are computed and mapped to visualize spatial heterogeneity. Spatial autocorrelation is assessed using Moran’s I to test whether digital inclusion outcomes are spatially clustered.
Spatial access indicators, including network distance to key services (health facilities, schools, markets, administrative centres) and mobile network coverage, are analyzed to assess the role of geographic barriers in shaping digital inclusion.

2.4.3. Macro-Level Analysis: Structural Determinants

The third stage uses multivariate regression to examine the structural determinants of digital inclusion. Ordinary least squares (OLS) models estimate the conditional associations between DII, CDAS, and household/spatial characteristics. The typology introduced in Section 2.3 is used to stratify the analysis and examine whether determinants differ across household types.

2.5. Measurement and Estimation

2.5.1. Construction of Digital Inclusion Indices

Two composite indices are constructed to operationalize the conceptual framework: the Digital Inclusion Index (DII), which measures realized digital practices, and the Composite Digital Access Score (CDAS), which captures the enabling conditions shaping digital participation. Both indices are constructed using transparent and replicable procedures that aggregate multiple indicators into standardized composite measures. Equal weighting is adopted as a baseline specification to maximize interpretability and avoid imposing subjective assumptions regarding the relative importance of individual dimensions. Sensitivity analyses using alternative weighting approaches (Table 2), including PCA-based and domain-specific weights, yield substantively similar results.
The primary outcome variable is D I I core , which captures realized digital participation based on internet access (internet_any) and intensity of use (use_intensity). It combines two core behavioural indicators: any internet use (internet_any) and intensity of use (use_intensity), reflecting whether households connect and how actively they engage online. All components are standardized within city-level distributions and aggregated using an equal-weighted average, followed by min–max normalization to a 0–100 scale. Observations with partial information are retained using a partial-index approach (dii_partial), while cases with all components missing are excluded.
For robustness and equity diagnostics, an alternative measure, D I I EA , is constructed by residualizing D I I core on structural characteristics (age, education, household size, and infrastructure access), capturing digital inclusion relative to expected conditions.
The main explanatory variable is the Composite Digital Access Score (CDAS), which aggregates six domains: (i) technology_equipment, (ii) electricity_reliability, (iii) affordability, (iv) service_quality, (v) proximity_mobility_density, and (vi) social_capital. The six domains reflect infrastructural, economic, spatial, and sociotechnical dimensions of digital opportunity.
Each domain is standardized and combined using equal weights. To avoid mechanical overlap, smartphone ownership is excluded from DII_core, as it is captured within the technology_equipment domain of CDAS.
Digital Inclusion Index
To ensure comparability across heterogeneous populations and reduce compositional bias, each component is standardized using z-scores computed within city × demographic strata, defined by age and education. Age groups are categorized as 18–29, 30–44, and 45+, while education is grouped into (i) primary or no formal education, (ii) secondary education, and (iii) tertiary education. This within-strata standardization follows established guidance [32] and improves equity diagnostics by accounting for systematic demographic differences when comparing households and neighbourhoods.
The core index is defined as the Mean of the standardized components:
D I I core = 100 × MinMax 1 K k = 1 K z ( x k )
where z ( x k ) denotes the within-stratum standardized component and K is the number of observed components. The MinMax operator rescales the index to a 0–100 range within the city, following composite indicator guidelines (Saisana & Saltelli, 2008) [33].
Smartphone ownership was initially considered but excluded from the index due to near-universal prevalence in the sample, resulting in negligible variance and no discriminatory power. Including such a variable may introduce instability during standardization without adding information.
Missing item responses are handled using a partial-index approach. Observations with at least one non-missing component are retained, and the index is computed as the Mean of available standardized components. These cases are flagged using a binary indicator (dii_partial). Observations missing all components are excluded from index-based analyses. The extent of item-level missingness, and robustness checks restricting the sample to complete cases yield substantively unchanged results (Appendix A Table A1).
To distinguish realized digital behaviour from structural endowments, an equity-adjusted variant ( D I I EA ) is constructed by residualizing D I I core on a flexible function of socio-economic characteristics:
X = { age , education , hh _ size , income / employment   proxies , electricity , water }
Using spline-augmented OLS, the fitted value m ^ ( X ) is obtained, and the adjusted index is defined as:
D I I EA = 100 × MinMax D I I core m ^ ( X )
While D I I core summarizes observed digital participation, D I I EA captures deviations from expected inclusion given structural conditions. This distinction aligns with policy frameworks that separate realized digital engagement from enabling environments [1,3]. The main analysis uses D I I core , while D I I EA is used for robustness checks and equity diagnostics.
To avoid mechanical overlap with explanatory variables, indicators included in the DII were restricted to measures of internet access and usage, excluding device ownership variables that also appear in explanatory constructs.
To assess the internal structure of the domain-specific indicators, principal component analysis (PCA) was conducted separately for each domain. The results indicate that items load strongly on a dominant first component in all cases. The first component exhibits eigenvalues greater than one, with variance explained ranging from approximately 58–76% across domains. Kaiser–Meyer–Olkin (KMO) statistics exceed the commonly accepted threshold of 0.6, indicating sampling adequacy. These results support the use of a single composite index per domain. Full PCA loadings and diagnostics are reported in Appendix A Table A1.
Composite Digital Access Score
Each of the six domains were constructed from underlying survey and geospatial indicators, standardized using z-scores, and rescaled to ensure comparability. The CDAS is defined as the unweighted mean of the six standardized domains:
C D A S = 1 J j = 1 J z ( d j )
where d j represents each domain and J is the number of observed domains. Equal weighting is adopted as a transparent baseline, consistent with composite indicator guidelines in the absence of a strong theoretical basis for differential weights (Saisana & Saltelli, 2008) [33]. Sensitivity analyses using alternative weighting schemes yield substantively similar results.
To address missing data, the CDAS is computed for observations with valid information on at least four of the six domains. For such cases, the index is calculated as the mean of available standardized domain scores, and a binary indicator (cdas_partial) flag partial observations. Observations with fewer than four valid domains are excluded from CDAS-based analyses.
To avoid tautological relationships in regression models, variables included in the CDAS are carefully separated from those used in the DII. Device ownership variables (e.g., smartphone ownership) are included in the technology_equipment domain of CDAS but excluded from the DII construction. This ensures that explanatory variables do not mechanically overlap with the dependent index.
The Proximity–Mobility–Density domain integrates geospatial and survey-based measures, combining (i) distance to the nearest ICT service point, (ii) local service density within a 1 km radius, and (iii) transport-based mobility capacity. Distance enters through a log-distance decay function, while density captures diminishing returns to service concentration.
All analyses were replicated using a complete-case sample including only observations with all six domains observed. The results remain substantively unchanged (Appendix A Table A1), indicating that findings are not sensitive to the treatment of missing data.

2.5.2. Model Specification

The empirical analysis focuses on the Digital Inclusion Index ( D I I core ) as the primary dependent variable. The index combines two underlying behavioural indicators: (i) internet_any, a binary measure of whether respondents access the internet, and (ii) use_intensity, an ordinal measure capturing the frequency and intensity of digital engagement. These variables are standardized and aggregated into a continuous composite index scaled from 0 to 100, representing realized digital inclusion.
The main regression models therefore estimate associations between the CDAS domains, demographic characteristics, and D I I core using ordinary least squares (OLS) regression. An equity-adjusted specification ( D I I EA ) is used in robustness checks.
Because the dependent variables used in the main analysis are continuous composite indices, OLS provides an appropriate and interpretable estimation framework. Logit, Poisson, or ordered-response models would be more appropriate only if the underlying component indicators (internet_any or use_intensity) were modelled separately rather than aggregated into the DII.
The baseline specification estimates the association between digital inclusion and access conditions:
DII _ core i = α + β 1 CDAS i + β 2 X i + γ q + ε i
where
  • DII _ core i is the Digital Inclusion Index for household i ,
  • CDAS i is the composite access score,
  • X i is a vector of household-level controls, and
  • γ q denotes quartier fixed effects.
The control vector X i includes:
  • age (continuous),
  • hh_size (household size),
  • electricity_access (binary), and
  • water_access (binary),
capturing key demographic and infrastructural characteristics.
To examine the relative contribution of individual dimensions, alternative specifications replace the aggregate CDAS with its constituent pillars:
DII _ core i = α + k = 1 6 β k CDAS i k + β 2 X i + γ q + ε i
where CDAS i k corresponds to each domain (technology_equipment, electricity_reliability, affordability, service_quality, proximity_mobility_density, social_capital).
All models are estimated using ordinary least squares (OLS), with standard errors clustered at the quartier level to account for intra-neighbourhood correlation. Results are robust to alternative specifications using D I I EA as the dependent variable.
To assess the stability of the regression results, a series of robustness checks were conducted along four dimensions.
First, the baseline models were re-estimated using the equity-adjusted Digital Inclusion Index ( D I I EA ) as the dependent variable instead of D I I core . This alternative specification accounts for structural endowments and tests whether results hold when digital inclusion is measured relative to expected conditions.
Second, the analysis was restricted to observations with high-precision GPS coordinates. This excludes any potential influence of imputed or low-accuracy spatial data and ensures that proximity and density measures are based on reliable geolocation information.
Third, sensitivity to outliers was assessed by excluding observations in the upper and lower 1% of the DII distribution. This ensures that extreme values do not disproportionately influence the estimated relationships.
Fourth, alternative model specifications were estimated using different spatial controls. In addition to the baseline quartier fixed effects, models were estimated with commune-level fixed effects and, alternatively, without fixed effects but with standard errors clustered at the quartier level.
Across all specifications, the results remain substantively consistent. The coefficients on technology_equipment, electricity_reliability, and service_quality remain positive, statistically significant, and similar in magnitude, indicating that the findings are robust to alternative measurements, sample restrictions, and model specifications. Full results are reported in Appendix A Table A2.

2.5.3. Endogeneity and Identification Considerations

While the model provides a structured framework for examining the relationship be-tween digital inclusion and explanatory variables, it is important to clarify the limits of identification given the cross-sectional design.
The empirical strategy is based on cross-sectional ordinary least squares (OLS) regression and is designed to identify conditional associations between digital inclusion and explanatory variables. As such, the estimates should not be interpreted as causal effects.
Several sources of endogeneity may affect the results. First, reverse causality is possible, as higher levels of digital inclusion may influence household income, social capital, and access to technological resources, which are also included as explanatory variables. Second, omitted variable bias may arise from unobserved factors such as digital literacy, occupational structure, or neighbourhood-level economic conditions that jointly influence both digital inclusion and access-related variables. Third, self-selection into digitally enabled behaviours or locations may lead to non-random sorting of households across observed conditions.
To mitigate these concerns, the analysis includes a broad set of observable controls capturing demographic characteristics (age, household size), socio-economic conditions, and infrastructure access (electricity, water), and standard errors are clustered at the quartier level to account for spatial correlation. In addition, the results are complemented by robustness checks using alternative index specifications ( D I I core and D I I EA ).
Nevertheless, the cross-sectional design precludes causal identification. The findings should therefore be interpreted as descriptive of structural patterns and conditional relationships rather than causal mechanisms. In addition to regression analysis, unsupervised clustering is used to identify distinct profiles of access conditions across households.

2.5.4. Clustering Procedure and Validation

K-means clustering was applied to the standardized CDAS domain scores (technology_equipment, electricity_reliability, affordability, service_quality, proximity_mobility_density, social_capital) to identify distinct profiles of access conditions across households.
All variables were standardized prior to clustering to ensure equal contribution across dimensions. The algorithm was initialized with multiple random starts (n = 50) and a fixed random seed to ensure reproducibility.
The optimal number of clusters was determined using multiple criteria. In addition to the elbow method, clustering quality was assessed using the Silhouette Coefficient and the Calinski–Harabasz index. As shown in Table 3, the solution with k = 3 clusters yields the highest silhouette score (0.51) and strong separation across clusters, indicating well-defined and internally coherent groupings.
Cluster stability was further assessed by comparing solutions across different random initializations, yielding consistent cluster assignments. Differences in means across clusters are statistically significant at conventional levels (ANOVA tests, p < 0.05).

3. Findings

This section proceeds in five steps. We first describe the sample (Section 3.1), then validate the dimensional structure of access domains (Section 3.2) and construct composite indices (Section 3.3). We subsequently examine spatial inequalities (Section 3.4), estimate conditional associations using regression models (Section 3.5), and finally identify distinct access typologies through cluster analysis (Section 3.6).

3.1. Descriptive Statistics

The descriptive evidence from Ziguinchor reveals a pronounced gap between the material presence of digital devices and households’ ability to convert this into meaningful digital engagement. Only 28.6% of households report any internet use, despite near-universal smartphone ownership (100%), suggesting that device availability on its own is a poor proxy for inclusion. Smartphone ownership was measured at the individual level. As it exhibited no meaningful variation in the sample, it was excluded from the DII construction to avoid redundancy and potential standardization issues. This pattern mirrors regional evidence from GSMA and others showing that in sub-Saharan Africa the “usage gap” (people covered by mobile broadband but not using it) is now larger than the pure coverage gap, even as smartphone penetration rises [34]. Ziguinchor households are large on average (mean size 8.77) and face uneven basic-service provision: water access is almost universal (91.9%), whereas electricity access is available to fewer than half of households (42.9%), constraining the ability to charge, maintain, and use digital devices (as shown in Table 4).
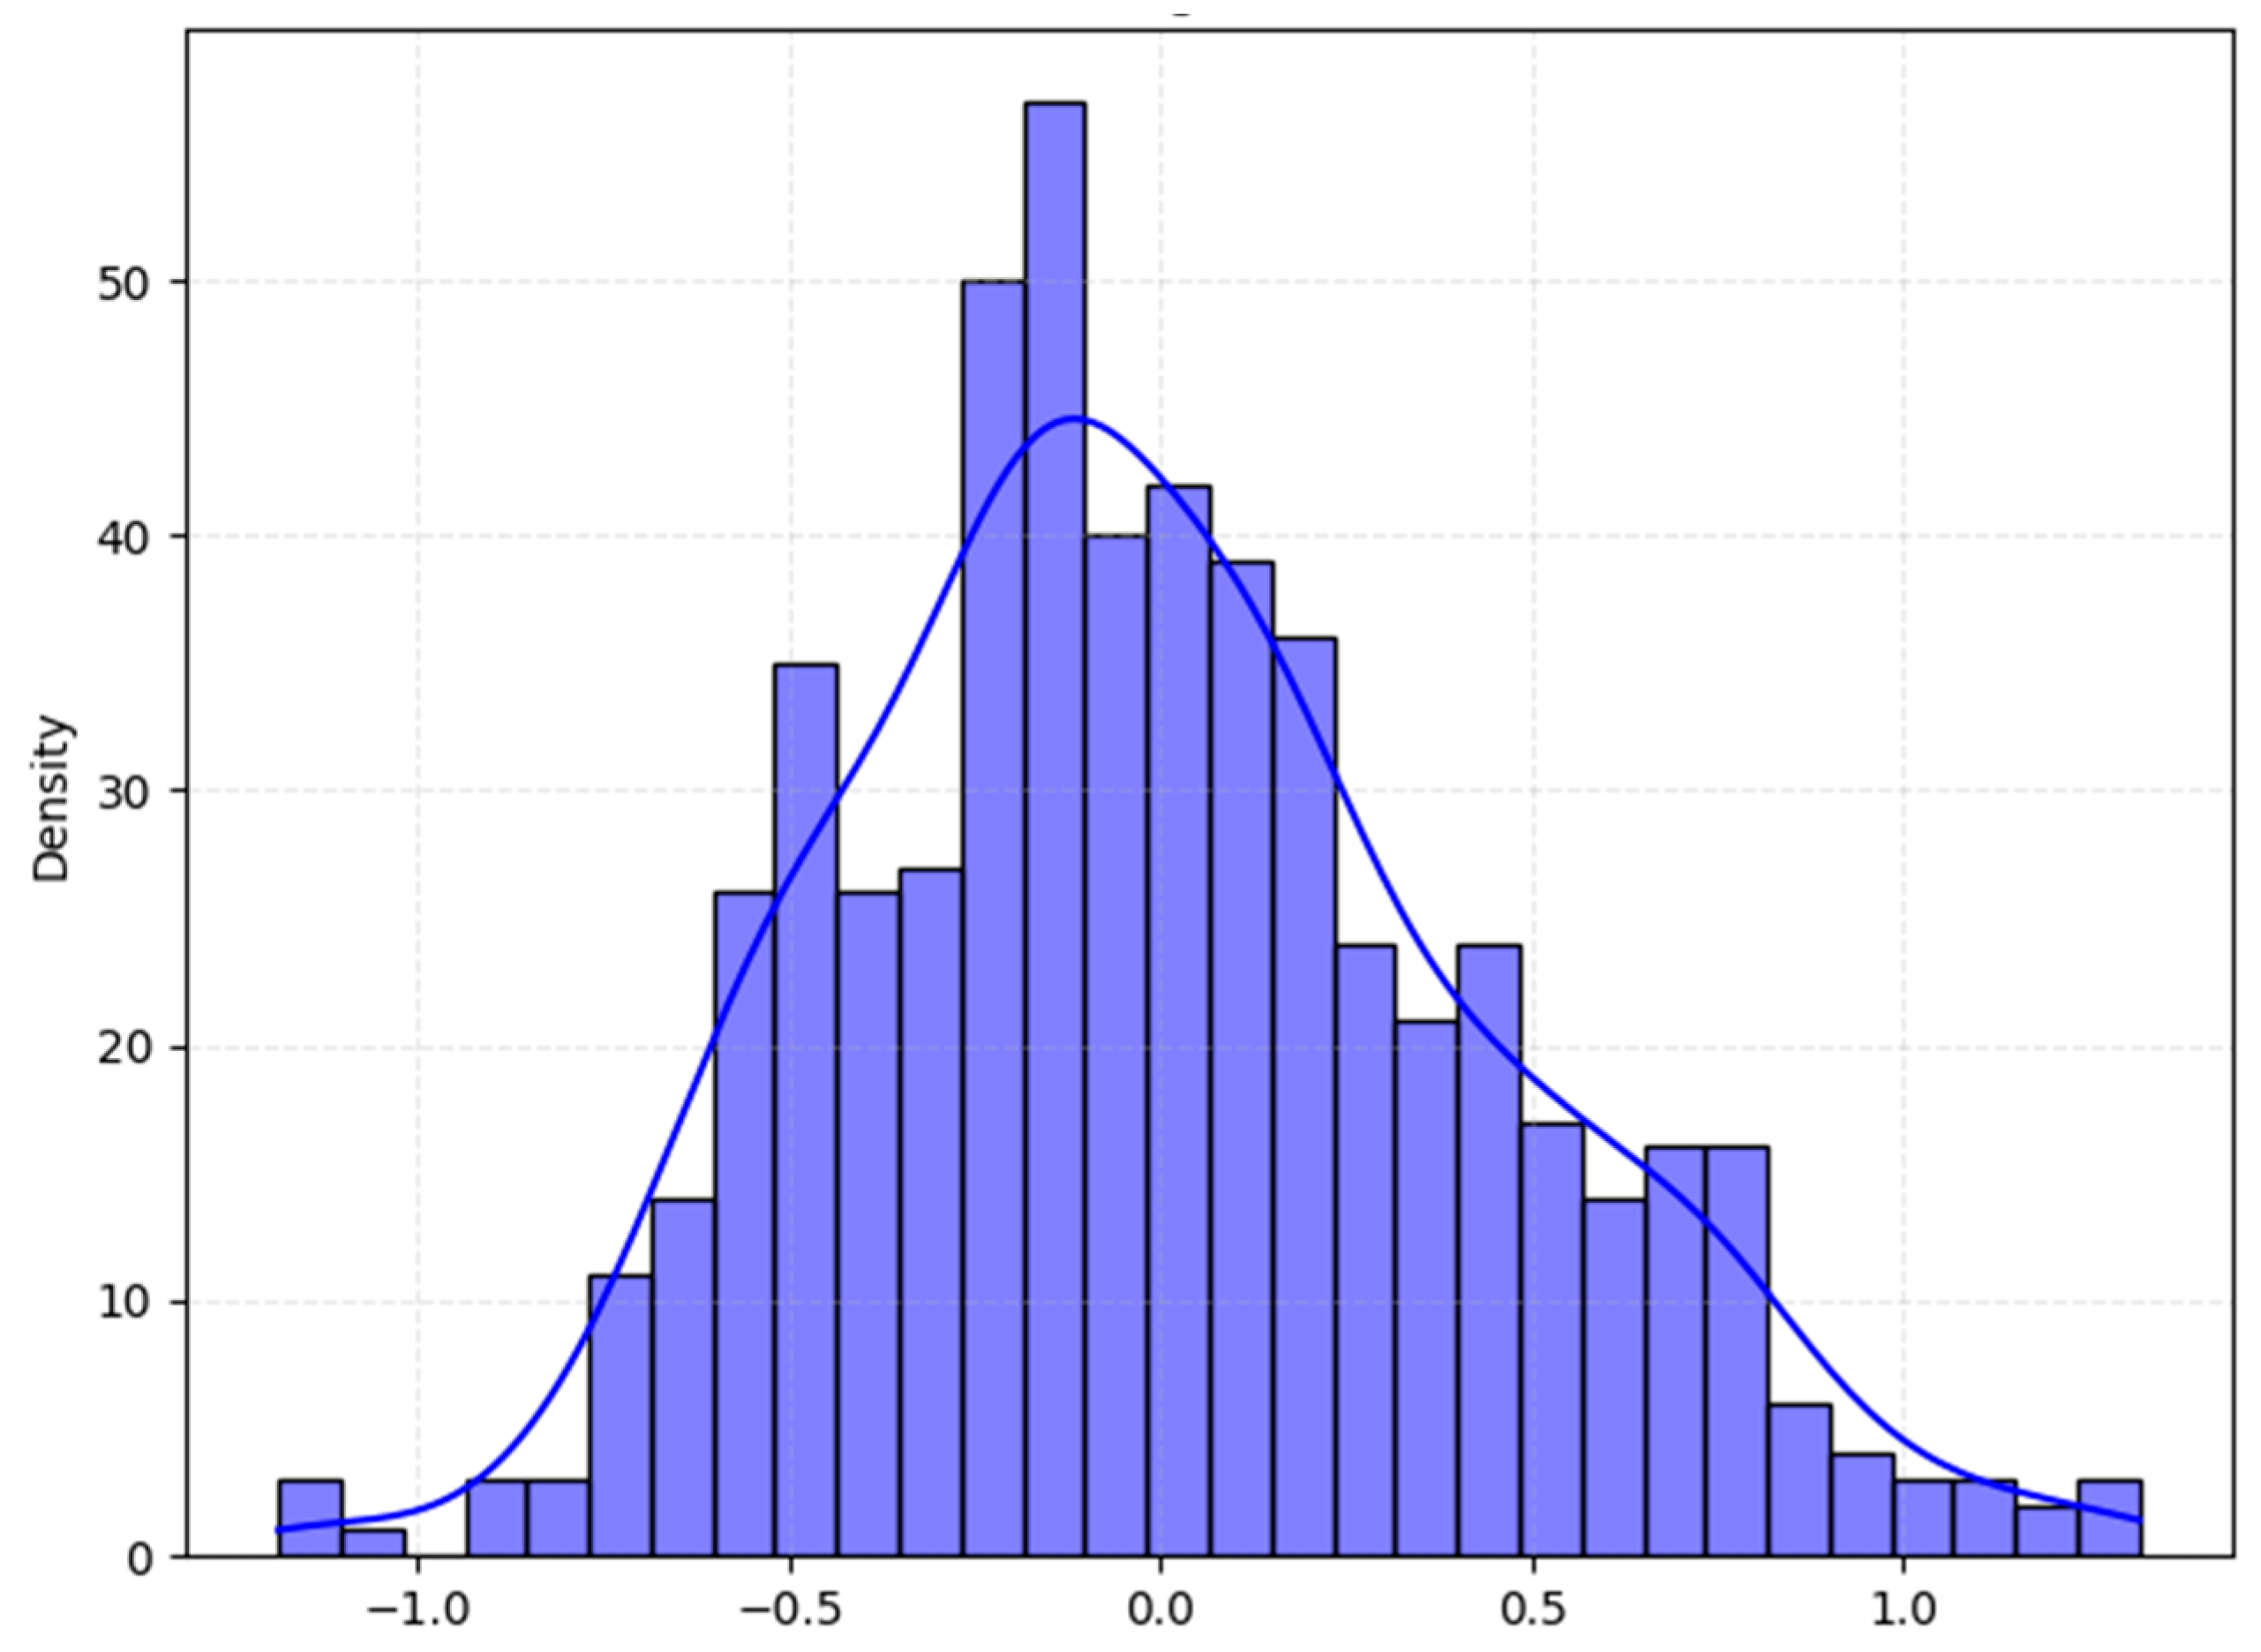
Figure 4 illustrates the distribution of Digital Inclusion Index (DII) scores across households, while the blue line represents the kernel density estimate showing the overall distribution pattern of the standardized index values. The distribution is heavily clustered at low values, with most households scoring below zero and a relatively long right tail. This left-skewed shape indicates that active digital engagement is limited and highly unequal, with a small minority of “digitally advantaged” households coexisting alongside a large majority with minimal or no use. Such patterns are consistent with work on “digital inequality” that emphasizes differentiated use rather than simple access, showing that early adopters tend to convert connectivity into skills and benefits more effectively than others [35]. They also echo findings from Donner’s “After Access” and related studies, which document that in many low- and middle-income settings, people may own smartphones but rely on sporadic or highly constrained internet use due to cost, reliability, or contextual barriers [36].
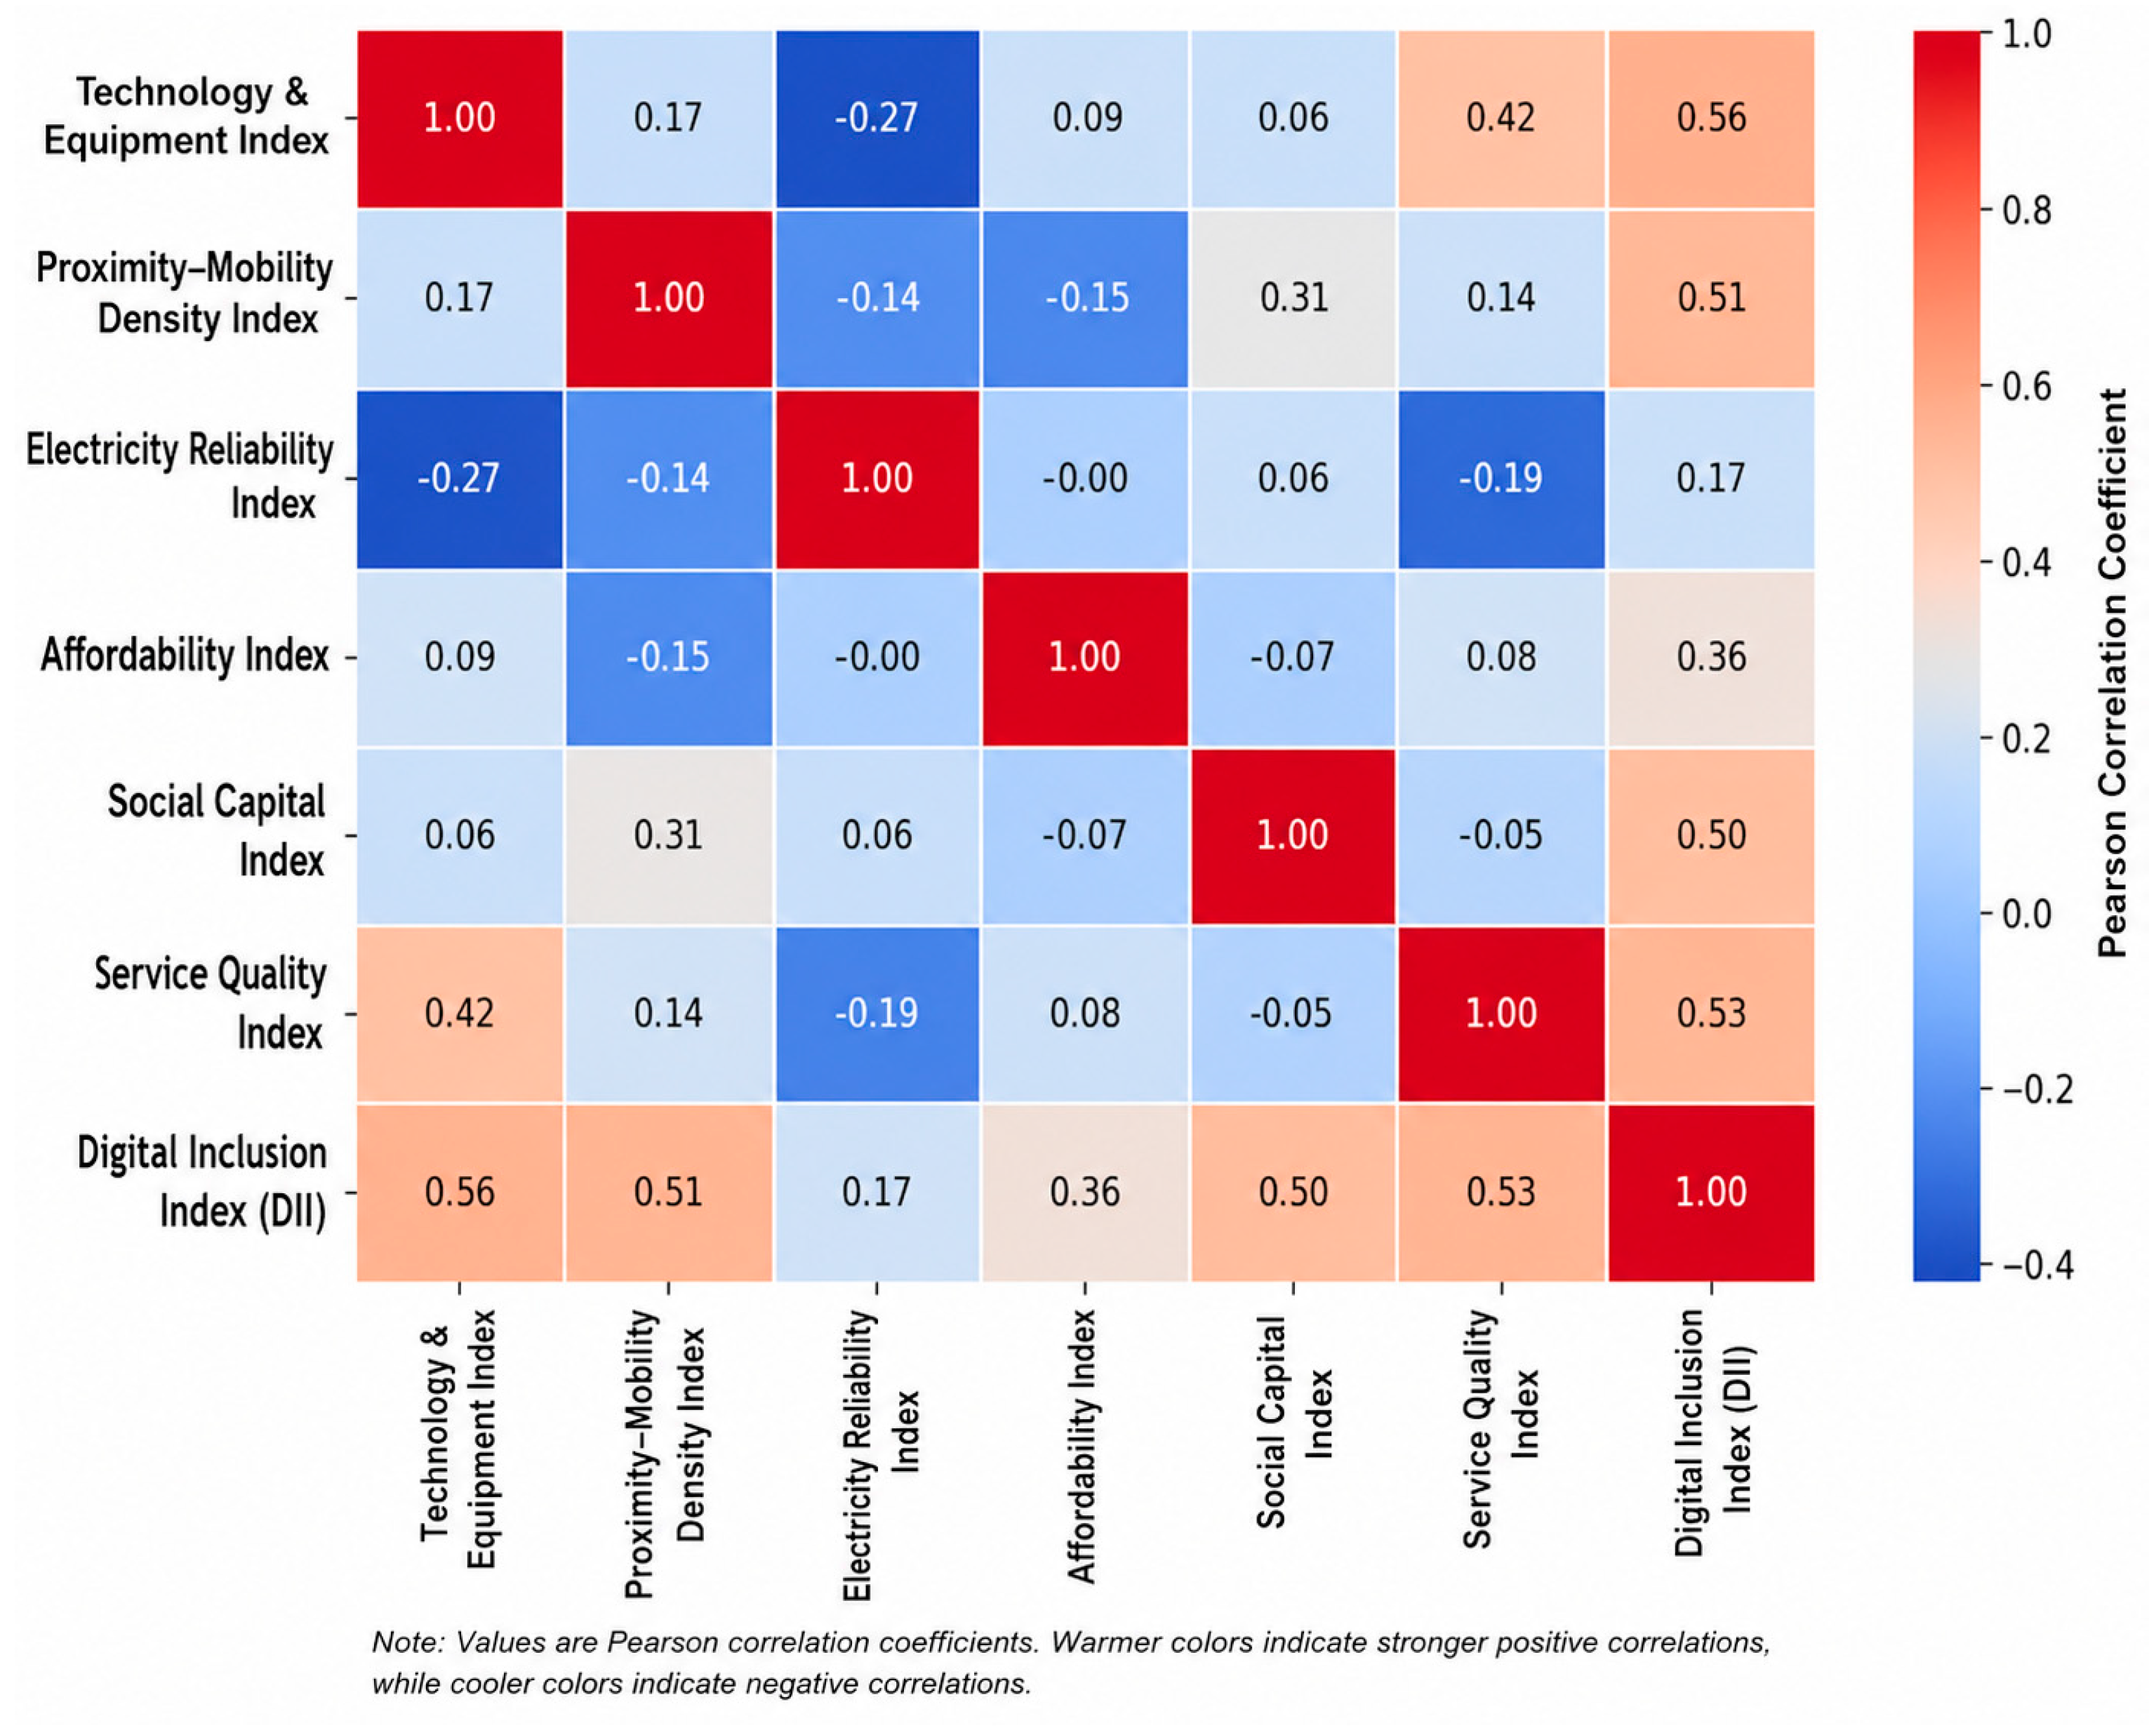
Figure 5 further clarifies the structure of these constraints by displaying correlations between the domain indices feeding into the DII and the broader enabling-environment pillars. Technology and equipment quality and service reliability exhibit the strongest associations with DII (correlations around 0.5–0.6), indicating that having a functional device and a reasonably dependable connection are the most proximate determinants of realized use in this context. Proximity–mobility and social capital also correlate meaningfully with DII (0.5), underscoring the role of spatial accessibility, transport, and informal support networks in shaping everyday digital practices, an interpretation aligned with capability-oriented accounts that stress the importance of “conversion factors” beyond infrastructure alone [37]. By contrast, the electricity index has only a weak bivariate correlation with DII (0.17). This does not imply that electricity is unimportant, van Dijk and others highlight reliable power as a foundational resource for digital participation [25], but rather suggests that in Ziguinchor households may partially compensate for poor domestic access (for example, using a power bank, charging phones at work, shops, or neighbours’ homes), or that electricity constraints interact with affordability and mobility in more complex ways than a simple linear correlation can capture.
Taken together, these descriptive patterns both confirm and nuance existing digital-divide debates. Consistent with DiMaggio & Hargittai’s distinction between access and differentiated use and Warschauer’s emphasis on social and infrastructural context [35], the Ziguinchor data show that ownership is a necessary but far from sufficient condition for inclusion. At the same time, the relatively modest correlations between some structural pillars and DII suggest that households’ adaptive strategies, social networks, and local constraints produce heterogeneous outcomes even under similar enabling conditions. This motivates the study’s subsequent multivariate and spatial analyses, which jointly model CDAS (structural opportunity) and DII (realized behaviour) to understand where and why digital participation remains constrained.

3.2. Latent Structure of Digital Access Domains (PCA Results)

The distributional patterns showed that most households in Ziguinchor remain at the lower end of digital inclusion despite widespread device ownership. In this subsection, we unpack why by examining the latent structure of the six domain indices that underpin the Composite Digital Access Score (CDAS) and by exploring how these domains aggregate into distinct household profiles.
Principal Component Analysis (PCA) confirms strong internal coherence within each conceptual domain: items load cleanly onto a dominant first component, consistent with multidimensional digital divide theory [1,25,38]. The Technological Equipment Index is associated with device type, quality, and frequency of use [3,37]; the Electricity Index by outage frequency and reliability [39]; and the Affordability Index by data expenditure and perceived broadband costs [40]. Social capital, shaped by education, occupation, and household youth composition, aligns with literature emphasizing informal skills and household learning environments [26,41]. Service quality reflects perceived mobile and fixed-network performance [42]. All indices were normalized using z-scores for comparability across domains.
The proximity–mobility domain is where the microdata most clearly intersects with the inequalities across Ziguinchor’s quartiers. The Proximity–Mobility Index is shaped by distance to ICT services, transport options, and neighbourhood service density, and its components can be directly read from the spatial figures. As shown in Figure 6, households located in central quartiers such as Boucotte Centre, Escale, and Santhiaba benefit from shorter distances to ICT service points. In contrast, households in Kandialang (East and West), Djibock, Néma, and the southern peripheries experience significantly greater distances and weaker accessibility. Figure 7 further highlights this pattern through a kernel density map of ICT services. A clear west–east corridor of high service concentration emerges across central and commercially active quartiers (e.g., Boucotte, Escale, Tilène), while “cold spots” are visible in the southern belt (e.g., Djibock, Kandialang) and eastern fringes, where households are present but digital services remain sparse. Figure 8 reinforces this finding: although ICT services tend to cluster in economically active areas, several quartiers with visible commercial activity still show under-provision of ICT services, indicating latent and unmet demand. Taken together, these spatial diagnostics confirm that proximity and mobility are not abstract constraints but are embedded in the uneven urban structure of Ziguinchor, shaping differential access across quartiers.
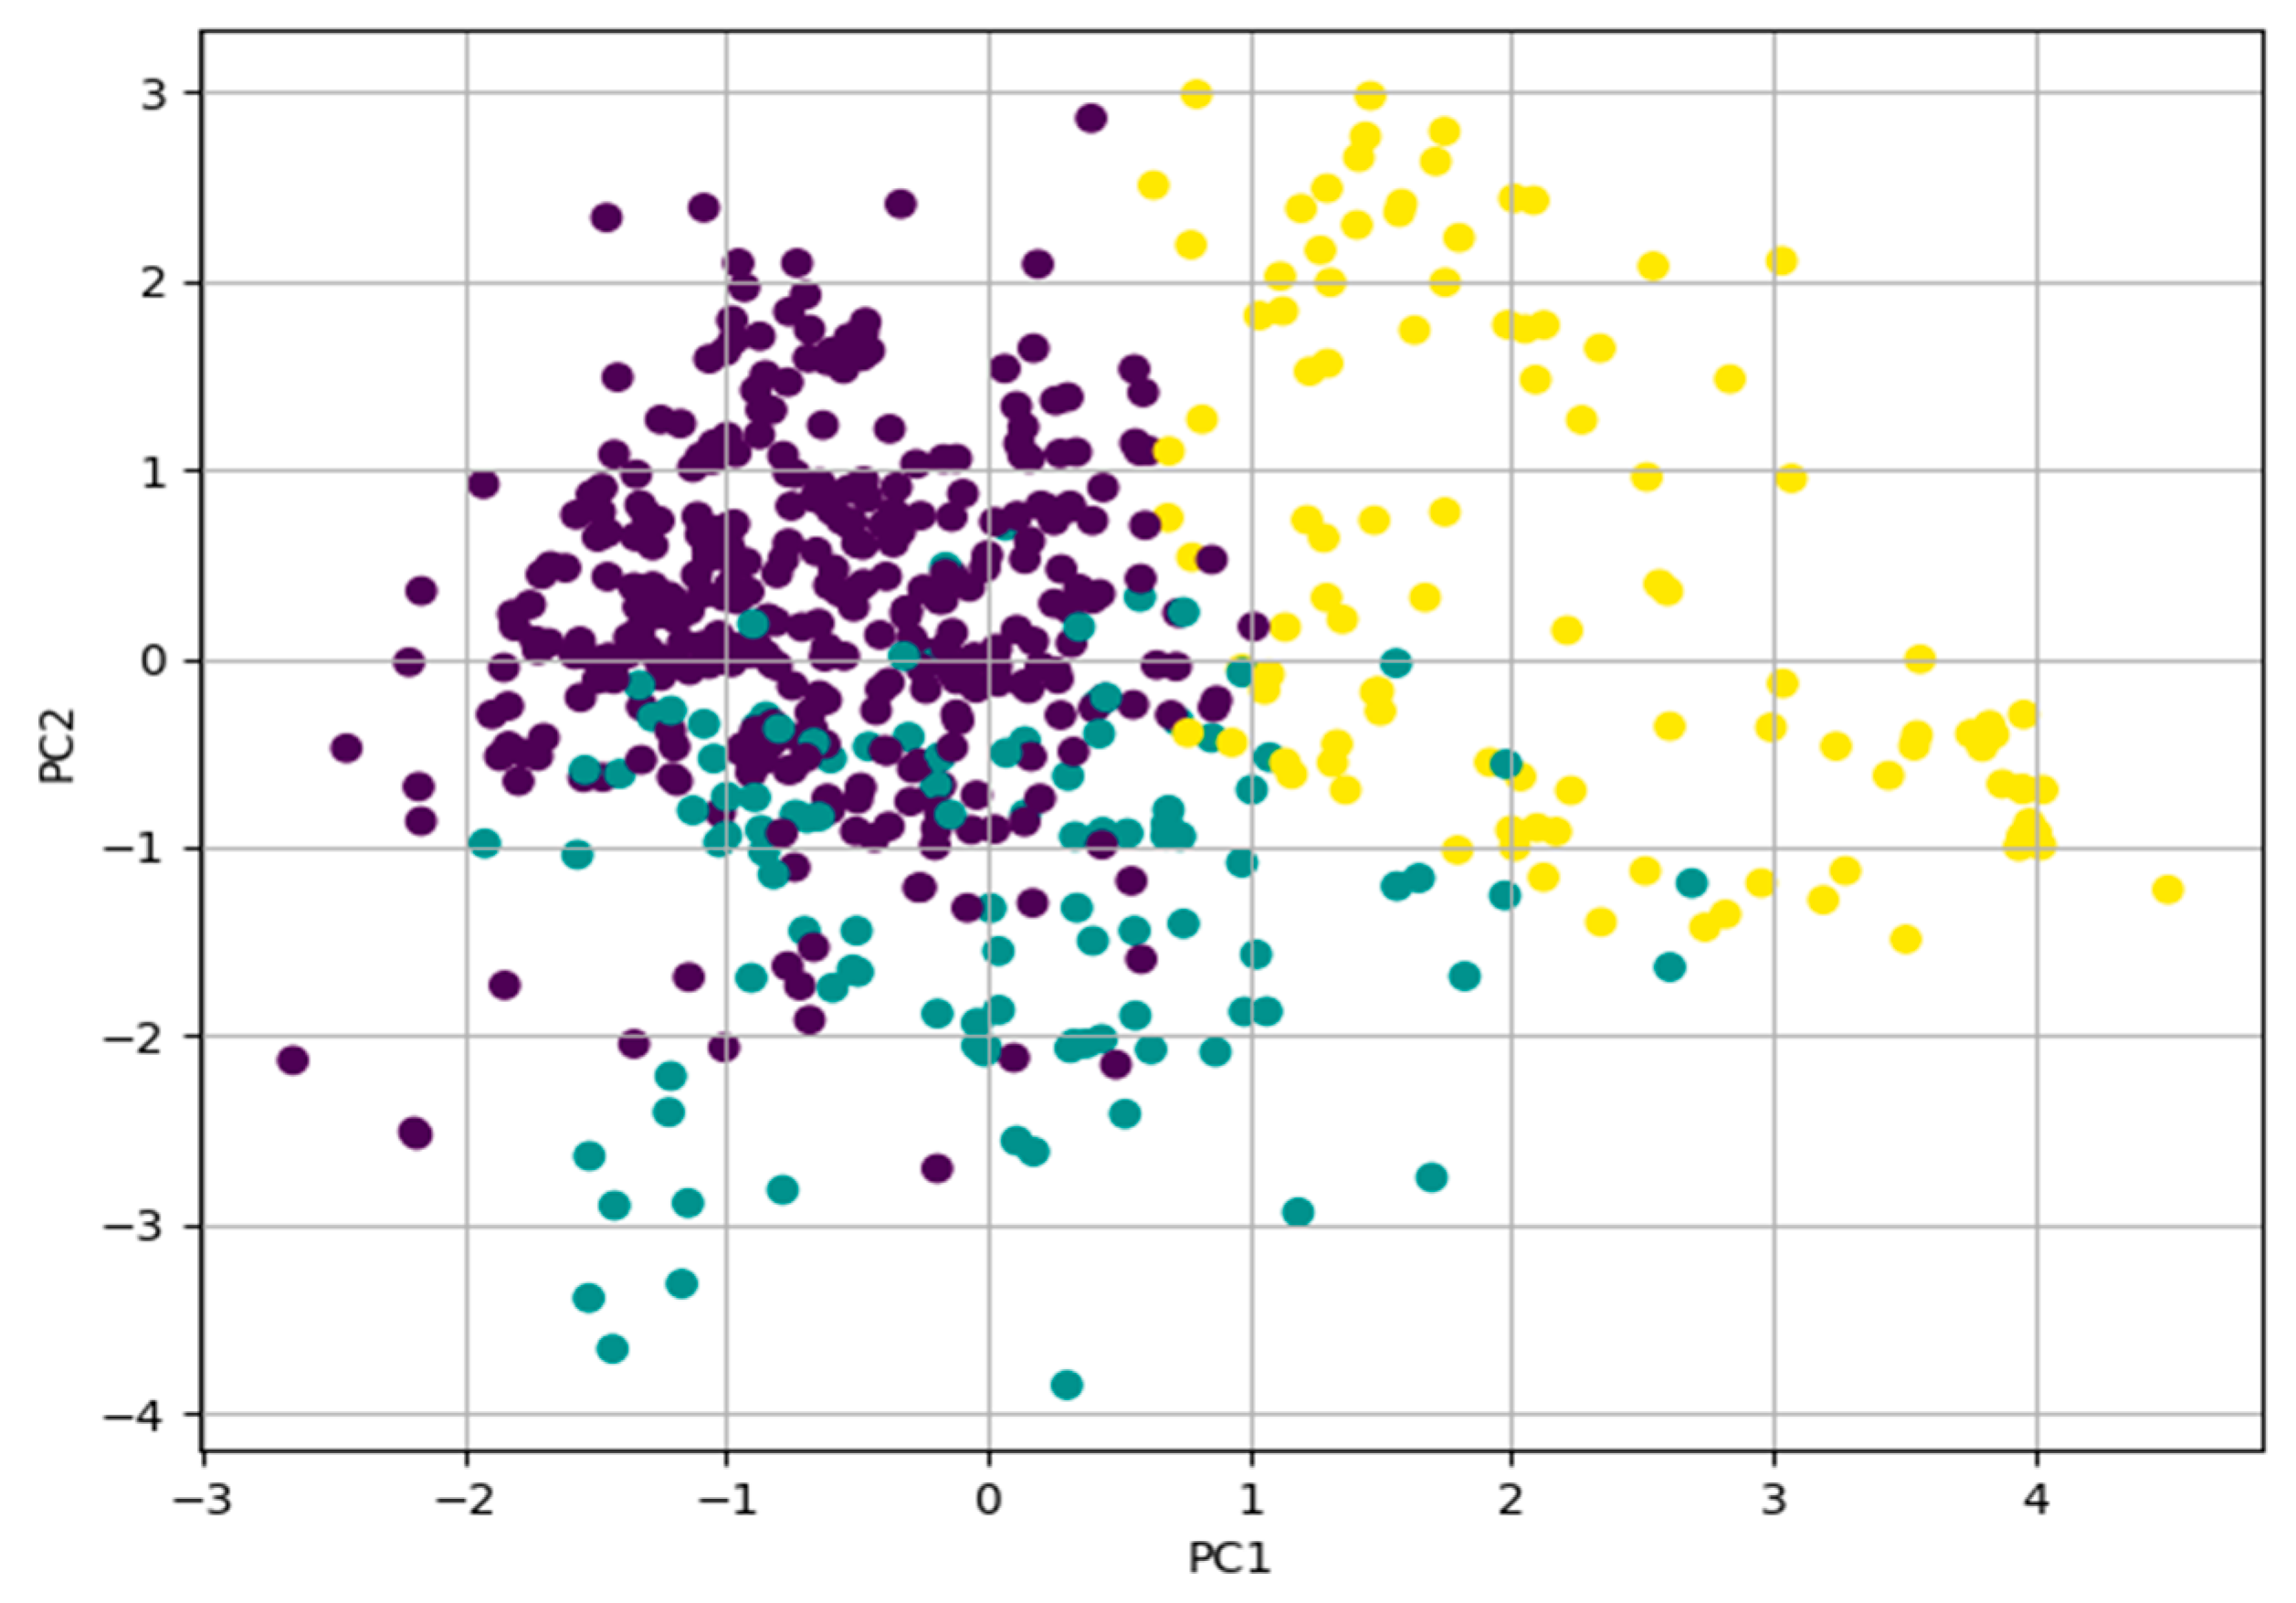
K-means clustering was applied to identify distinct profiles of digital inclusion (Figure 9). All input variables were standardized (z-scores) prior to clustering to ensure equal weighting. The algorithm was implemented with multiple random initializations (nstart = 50) and a fixed seed to ensure convergence to a stable solution. The number of clusters was determined using the elbow method and validated using the average silhouette width and the Calinski–Harabasz index. Both criteria supported the selected cluster solution, indicating good separation and cohesion of clusters. Cluster stability was assessed by repeating the K-means algorithm across multiple random initializations; the resulting cluster assignments were highly consistent (average adjusted Rand index > 0.90). Figure 9 presents the projection of household observations onto the first two principal components (PC1 and PC2) derived from the Principal Component Analysis (PCA). Each dot represents a household observation, while the different colors indicate the three identified clusters, reflecting variations in digital inclusion characteristics and structural access conditions. Three coherent profiles emerge:
  • A structurally enabled cluster, concentrated in central quartiers (e.g., Boucotte Centre, Escale), characterized by strong equipment access, better service quality, and favourable spatial positioning.
  • A moderately included cluster, distributed across mixed neighbourhoods, combining device access with constraints in affordability or service quality.
  • A structurally excluded cluster, more prevalent in peripheral quartiers (e.g., Kandialang, Djibock, Néma), where households face compounded disadvantages including unreliable electricity, long distances to services, and weaker device access.
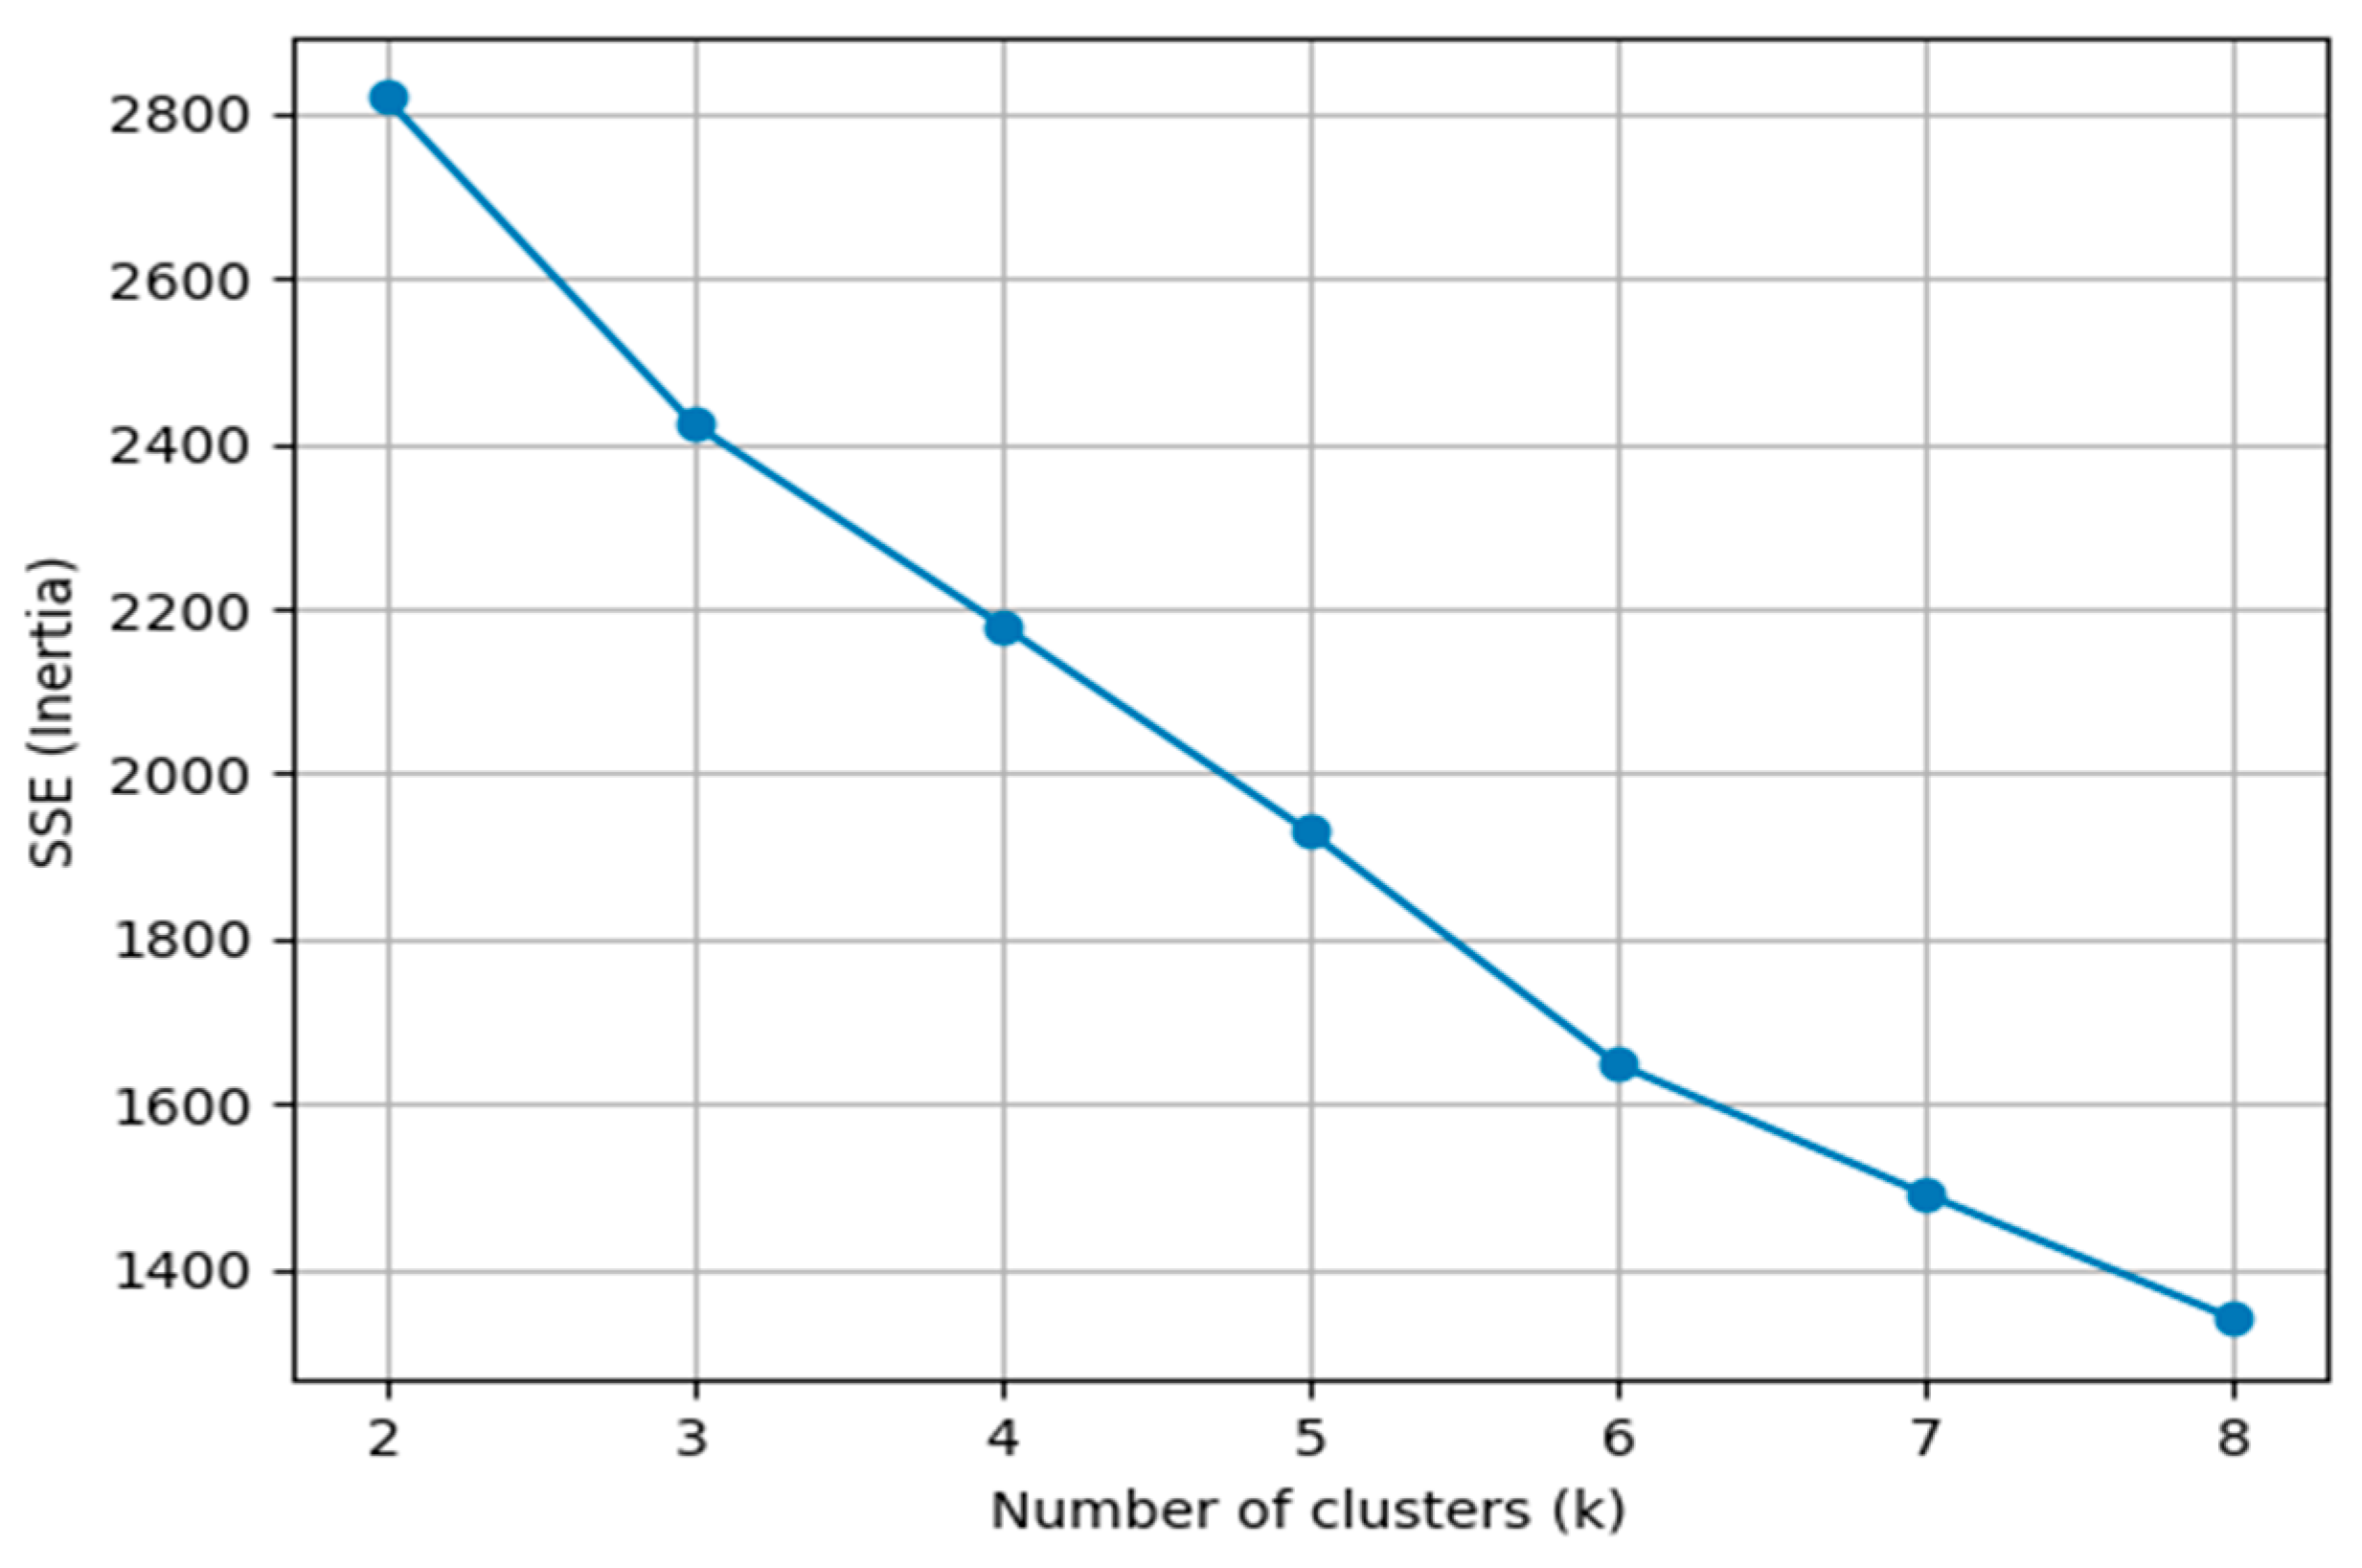
The choice of three clusters is supported by the elbow method (Figure 10), which shows a clear inflexion between k = 2 and k = 3, after which improvements in fit diminish. This aligns with literature showing that digital inequalities, especially in low-income urban settings, typically crystallize into a small set of layered configurations rather than a binary divide [1,25].
Figure 10 illustrates the elbow method used to determine the optimal number of clusters ( k ) for the K-means analysis. Each dot represents the within-cluster sum of squares (SSE/inertia) for a specific number of clusters, with the inflection point between k = 2 and k = 3 indicating the optimal cluster solution.
Overall, the PCA and clustering results deepen the descriptive patterns documented in Section 3.1. They demonstrate that low digital inclusion in Ziguinchor arises from spatially structured, multidimensional constraints, combining deficits in infrastructure, mobility, affordability, and social resources across different quartiers. This empirical structure underpins the design of CDAS and motivates the subsequent multivariate and typology analyses, where these domains are linked to realized digital use and spatial inequalities.

3.3. Construction of Digital Inclusion and Access Indices

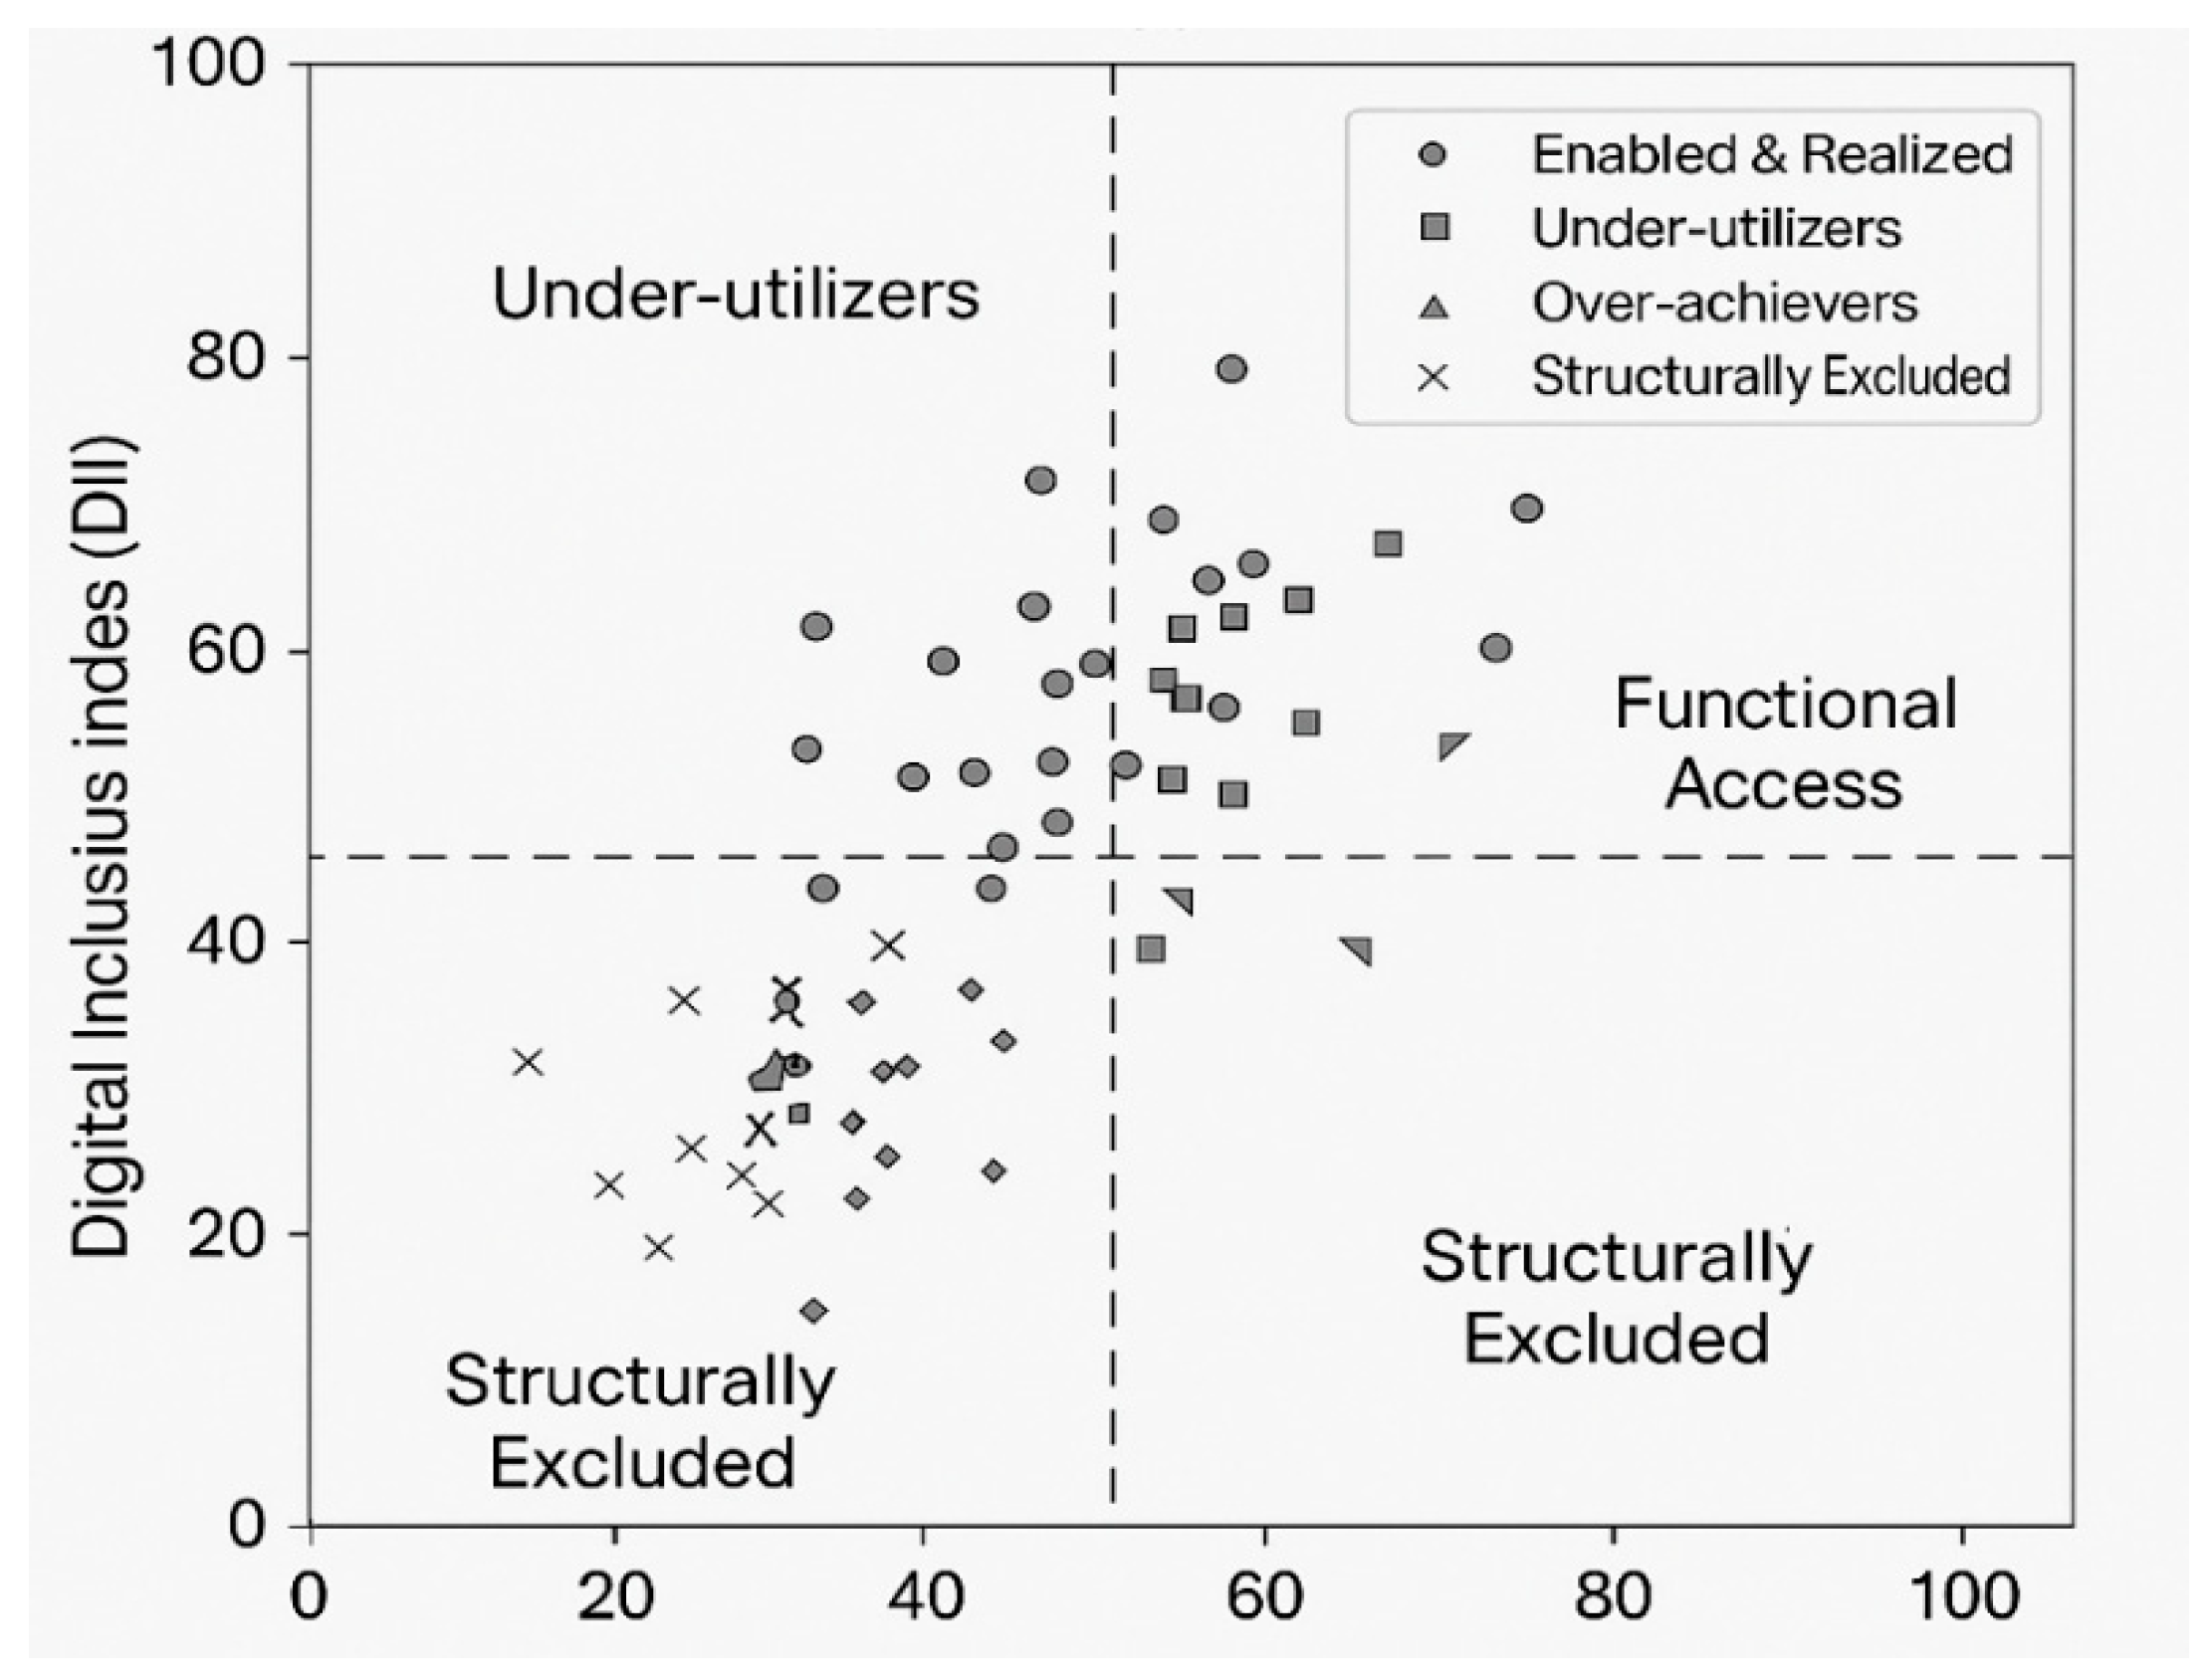
Building on the descriptive patterns in Section 3.1, which showed that most households in Ziguinchor exhibit low realized digital use despite nearly universal smartphone ownership, the joint distribution of CDAS and DII provides a clearer understanding of how structural conditions translate into digital behaviour. Figure 11 plots each household by its Composite Digital Access Score (horizontal axis) and its Digital Inclusion Index (vertical axis). The strong positive slope confirms the expected relationship: households with more favourable enabling conditions tend to achieve higher levels of digital participation. This gradient is also consistent with the distributional stratification observed across CDAS quintiles, where higher-access groups systematically achieve higher DII scores. Spatially, this pattern is consistent with capability-based digital inequality frameworks in which access conditions (conversion factors) shape but do not fully determine achieved digital functionings [25,38].
However, the scatterplot also reveals meaningful deviations from this average trend. The quadrant typology in Figure 12 classifies households using median splits of DII and CDAS. Because such thresholds are inherently sample-dependent, we assess robustness using alternative quartile-based thresholds. Results (Appendix A Table A2) show that the main spatial and analytical patterns remain stable, particularly in identifying structurally excluded (low CDAS–low DII) and enabled and realized (high CDAS–high DII) groups. Differences are concentrated among households near the central cut-points, where small shifts in thresholds affect classification. Accordingly, the typology is interpreted as a heuristic diagnostic tool for policy targeting rather than a rigid categorical structure.
Two smaller but analytically important groups highlight the behavioural heterogeneity behind the left-skewed DII distribution documented earlier. Under-utilizers (high CDAS, low DII), often situated in upper CDAS quintiles (Q4–Q5), possess favourable structural conditions but exhibit low engagement, suggesting latent barriers such as limited digital literacy, low confidence, or weak perceived relevance. Conversely, over-achievers (low CDAS, high DII) demonstrate high levels of digital participation despite structural deficits, pointing to compensatory strategies, stronger intrinsic motivation, or supportive social networks. These misalignment patterns echo findings in digital inequality research showing that structural access is necessary but not sufficient for digital participation, and that motivational, cultural, and skill-based factors play a significant complementary role [26,43].
Overall, the joint analysis of CDAS and DII, reinforced by quintile-based gradients, indicates that digital exclusion in Ziguinchor is shaped by intertwined infrastructural and behavioural factors. Figure 11 presents the relationship between the Digital Inclusion Index (DII) and the Composite Digital Access Score (CDAS), where the dashed vertical and horizontal lines divide households into four typology categories: “Enabled & Realized,” “Under-utilizers,” “Over-achievers,” and “Structurally Excluded.” The coloured points represent household-level observations within each category, illustrating how structural access conditions and realized digital use are positively associated but not always aligned. The typology therefore provides a nuanced diagnostic framework for identifying priority groups requiring infrastructure investment, digital literacy support, and community-based interventions.
Scatterplot analysis further illustrates the relationship between structural enabling conditions and realized digital inclusion outcomes across households in Ziguinchor. Figure 12 presents the Digital Inclusion and Access Quadrant Typology (DII–CDAS Framework), which classifies households according to their relative levels of structural digital access and realized digital engagement. The dashed vertical and horizontal lines indicate the threshold values used to divide the scatterplot into four analytical quadrants: “Enabled & Realized,” “Under-utilizers,” “Over-achievers,” and “Structurally Excluded.” These thresholds distinguish households with relatively high or low enabling conditions and digital inclusion outcomes. Figure 12 demonstrates a strong positive association between structural access conditions and realized digital use, while also revealing important mismatches between access and effective digital engagement across households.
Four-quadrant classification of households based on median splits of the Digital Inclusion Index (DII) and the Composite Digital Access Score (CDAS): (i) Enabled and Realized (high CDAS, high DII), (ii) Under-utilizers (high CDAS, low DII), (iii) Over-achievers (low CDAS, high DII), and (iv) Structurally Excluded (low CDAS, low DII). Points represent household-level observations. The typology provides an intuitive diagnostic of alignment between structural access and realized digital use. To assess robustness, alternative classifications using quartile-based thresholds yield substantively similar spatial and distributional patterns, particularly for the upper and lower segments of the distribution. Differences are limited to observations near the central cut-points, indicating that the typology is stable for identifying priority groups but should be interpreted as a heuristic targeting tool rather than a rigid categorical partition.
Situated within Ziguinchor’s uneven urban landscape, this typology reflects how digital inclusion varies across quartiers with distinct infrastructural and socioeconomic conditions. Households in centrally located and better-served quartiers (e.g., Boucotte Centre, Escale, Santhiaba), where ICT service density, proximity, and infrastructure are stronger, are more likely to fall into the enabled and realized group, effectively translating favourable structural conditions into active digital use. In contrast, peripheral and underserved quartiers (e.g., Kandialang, Djibock, Néma), characterized by longer distances to services, weaker electricity reliability, and lower service density, are disproportionately represented among the structurally excluded, where compounded constraints limit both access and use.
The typology also captures important behavioural deviations from this spatial gradient. Under-utilizers, often located in relatively well-served areas, highlight that access does not automatically translate into use, pointing to barriers such as limited digital skills, gendered norms, or low perceived relevance. Conversely, over-achievers, more common in structurally constrained environments, demonstrate adaptive strategies such as device sharing, reliance on social networks, and strategic mobility to access services.
Overall, the typology illustrates pronounced behavioural heterogeneity across similar structural conditions and identifies groups whose digital practices either align with or diverge from their enabling environment, reinforcing that digital inclusion in Ziguinchor is both spatially structured and shaped by household-level capabilities and agency.

3.4. Spatial Inequality and Distribution of Digital Inclusion

The inequality patterns observed across socioeconomic, spatial, and demographic groups reinforce and deepen the misalignments identified in the joint DII–CDAS typology (Section 3.3), showing that digital inclusion in Ziguinchor is shaped by layered and mutually reinforcing forms of inequality.
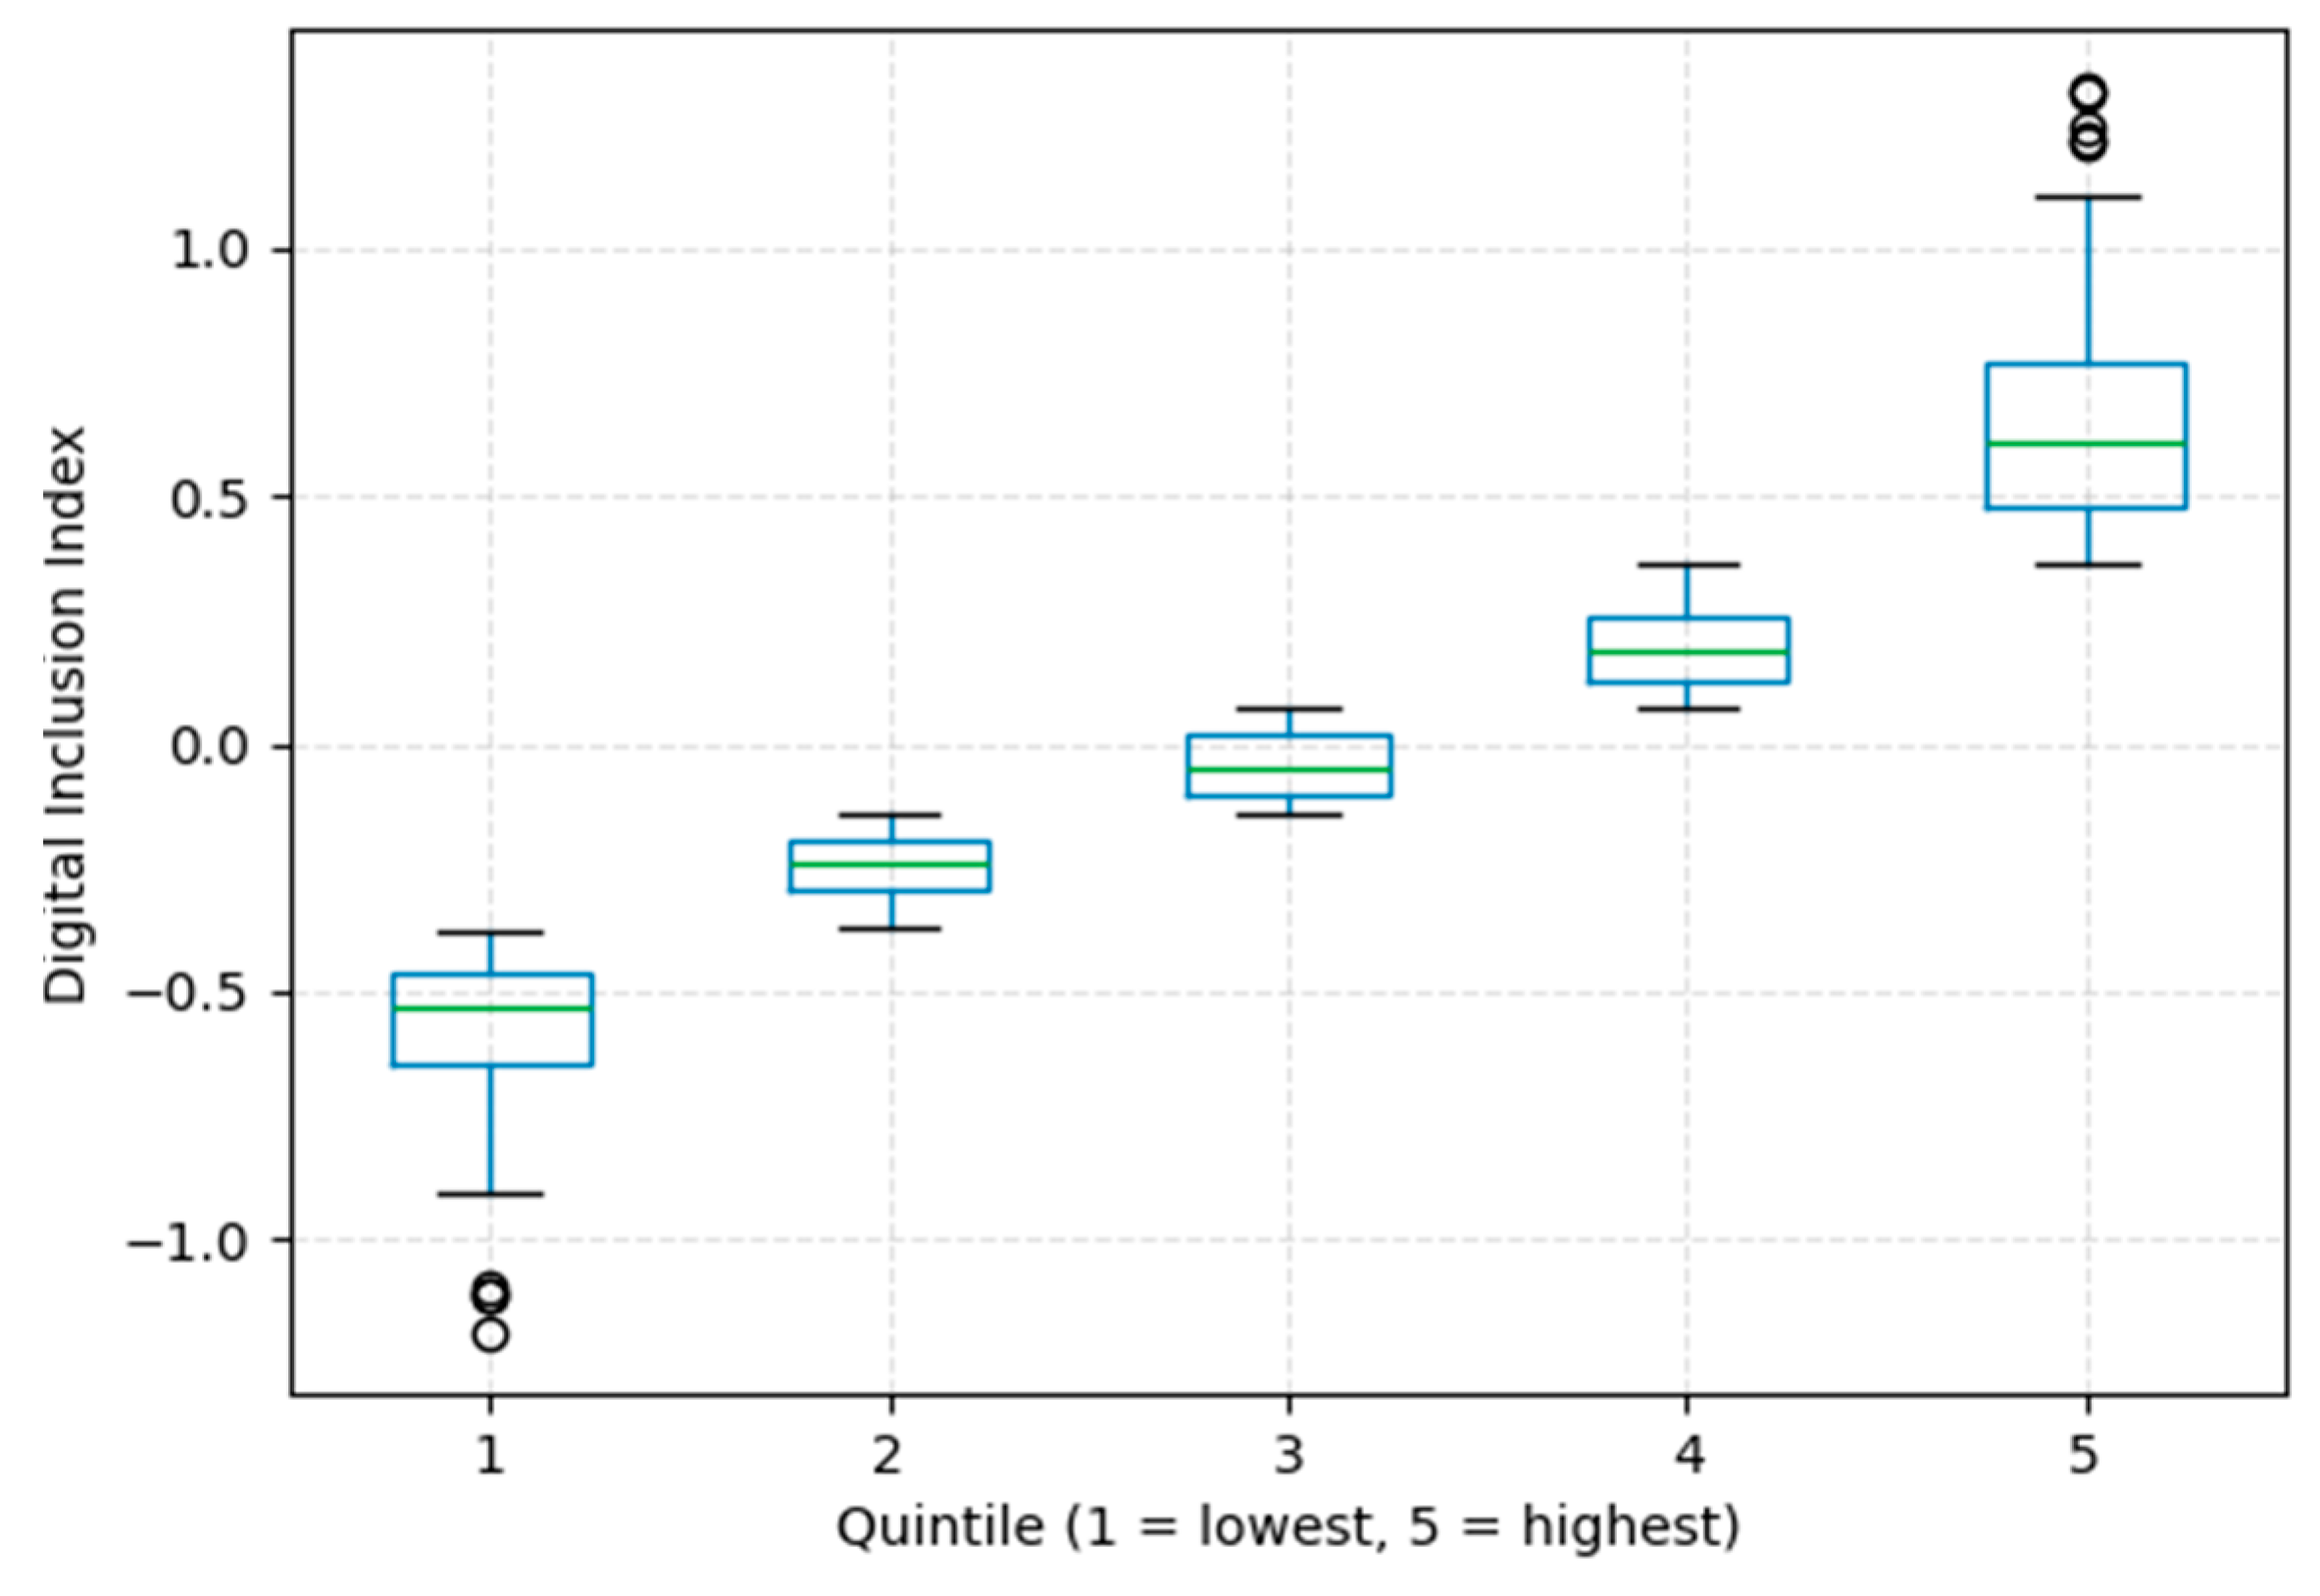
Figure 13 presents boxplots illustrating the distribution of Digital Inclusion Index (DII) scores across socioeconomic quintiles, ranging from the lowest (1) to the highest (5) income/expenditure groups. The rectangular boxes represent the interquartile range (IQR), capturing the middle 50% of DII values within each quintile, while the horizontal green lines inside the boxes indicate the median DII score. The blue whiskers show the spread of non-outlier observations, and the black circles represent outlier households with exceptionally high or low DII values relative to the overall distribution. The figure demonstrates a clear upward gradient in digital inclusion across quintiles, with higher-income groups exhibiting substantially higher DII scores and greater representation among digitally included households.
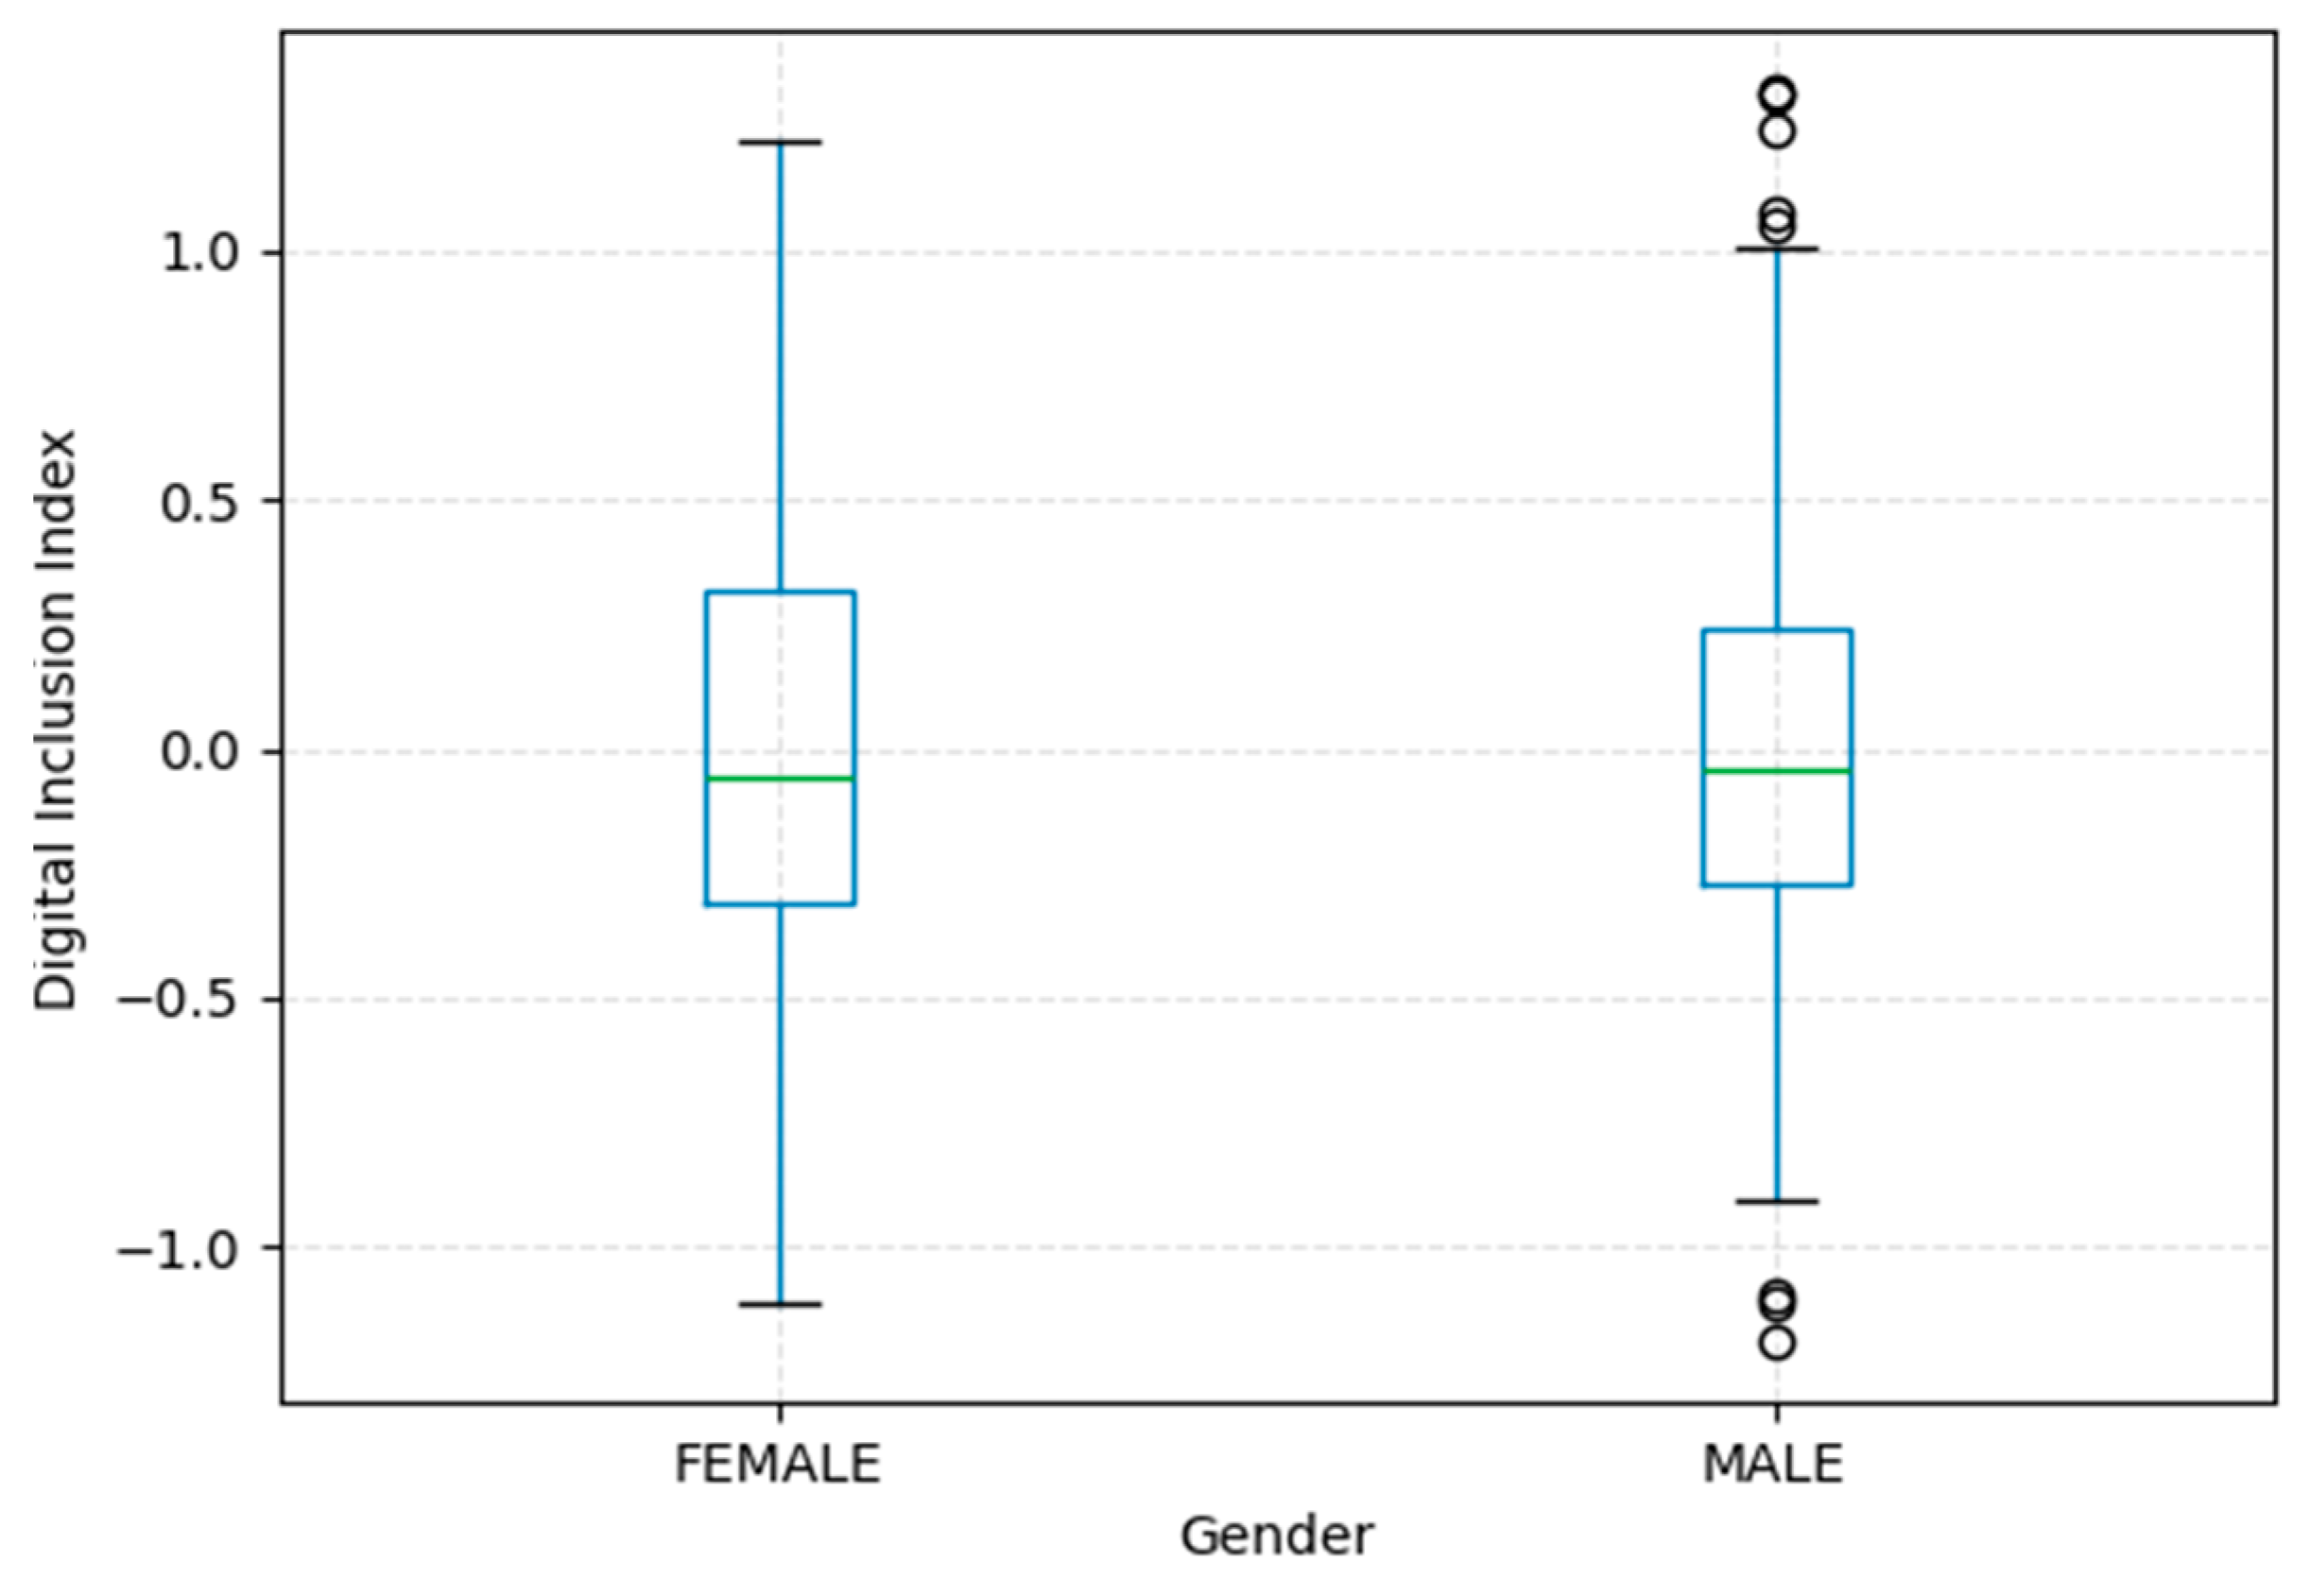
Gender disparities further complicate this picture. As shown in Figure 14, women consistently exhibit lower Digital Inclusion Index (DII) scores than men, with distributions shifted downward and showing less representation among highly digitally included groups. Importantly, this gap persists even within similar structural environments, suggesting that gender differences are not driven solely by access deficits but also by disparities in digital skills, autonomy, confidence, and socially mediated usage patterns. This pattern closely aligns with the “under-utilizer” profile identified in Section 3.3, where relatively favourable enabling conditions do not translate into equivalent levels of digital engagement. Figure 14 presents boxplots comparing DII distributions between female and male respondents, where the boxes represent the interquartile range (IQR), the green horizontal lines indicate median scores, the blue whiskers show the spread of non-outlier observations, and the black circles represent outlier values.
Spatial inequalities remain a defining dimension of digital inclusion in Ziguinchor. Neighbourhood-level patterns show a clear clustering of low DII scores in peri-urban and peripheral quartiers, where households face longer distances to ICT service points, lower service density, and weaker infrastructure, particularly in electricity reliability and transport connectivity. These areas correspond to the “cold spots” identified in the kernel density and proximity analyses (Section 3.2), reinforcing the importance of spatial exposure in shaping digital opportunity. By contrast, central quartiers along the west–east commercial corridor exhibit higher and more consistent DII levels, reflecting both better access conditions and stronger integration into the local digital economy.
Taken together, these overlapping socioeconomic, gender, and spatial disparities demonstrate that digital inequality in Ziguinchor is profoundly multidimensional and structurally embedded. While the DII–CDAS typology provides a powerful lens for identifying alignment and misalignment between access and use, the inequality analysis shows that these patterns are further stratified by income, gender, and location. This layered structure underscores that effective digital inclusion policies must address not only infrastructural deficits but also economic constraints and socio-cultural barriers that shape how different groups engage with digital technologies.

3.5. Determinants of Digital Inclusion: Regression Results

The multivariate regressions provide a consistent and statistically robust account of the relationships between structural conditions and realized digital use in Ziguinchor. The empirical analysis identifies conditional associations between variables and digital inclusion; given the cross-sectional design, results should not be interpreted as causal effects. By jointly accounting for household characteristics and neighbourhood-level conditions (through quartier fixed effects), the results clarify how structural inequalities across the urban landscape are associated with differences in digital participation. Technological Equipment emerges as the strongest positive predictor of digital inclusion (p < 0.001), confirming earlier evidence from the PCA and clustering analyses that device quality and functional usability, rather than mere ownership, are the most immediate enablers of digital participation. This is particularly relevant in Ziguinchor, where smartphone ownership is widespread, but device quality varies significantly across quartiers. Households in central and better-served areas such as Boucotte Centre, Escale, and Santhiaba are more likely to possess functional and up-to-date devices, reinforcing their position within the “enabled & realized” group. While electricity access exhibits a modest bivariate correlation with digital inclusion (r = 0.17). The relatively low bivariate correlation likely reflects limited variation in electricity access across some areas and its co-movement with other infrastructure variables, which dilutes its standalone association (Table 5). The electricity coefficient becomes substantially larger and statistically significant in multivariate models. This suggests that the unconditional association understates its role due to confounding with other infrastructural and socioeconomic factors. Once these are accounted for, electricity access emerges as a key enabling constraint for digital participation, supporting the spatial diagnostics which identified unstable power supply as a defining constraint in peripheral quartiers such as Kandialang, Djibock, and Néma. In these areas, frequent outages directly limit the ability to charge devices and sustain digital engagement, anchoring many households in the “structurally excluded” quadrant despite the nominal presence of connectivity infrastructure. Comparison of coefficient magnitudes indicates that infrastructural variables exhibit larger effects than affordability and service quality, although all remain statistically significant.
Proximity–mobility exerts a negative effect through distance to ICT services (p < 0.01), reinforcing the spatial gradients observed across neighbourhoods. Households located farther from ICT service clusters, particularly in the southern and eastern peripheries face higher time and transport costs, which systematically reduce digital use even when devices are available. This finding aligns closely with the kernel density and distance analyses (Section 3.2), which highlighted the concentration of digital services along the west–east commercial corridor and the relative isolation of peripheral quartiers.
Affordability and service quality both contribute positive but more moderate effects (p < 0.05), indicating that while cost and network performance matter, they are not the primary binding constraints in this context. This nuance is important: even in areas where network coverage exists, limited purchasing power and inconsistent service quality can still dampen usage, but these factors operate alongside, rather than in place of, more fundamental infrastructure and spatial barriers.
Social capital also shows a significant positive association (p < 0.01), echoing the typology’s identification of “over-achievers” who achieve relatively high digital use despite constrained structural conditions. In practice, this reflects the importance of informal support systems, device sharing, peer learning, youth-driven digital familiarity, and community knowledge networks, which are particularly salient in lower-access quartiers. These mechanisms help explain why some households in structurally disadvantaged environments can partially overcome spatial and infrastructural constraints.
Finally, gender and age effects remain negative and statistically significant even after controlling for all structural variables (p < 0.01). This finding directly complements the inequality analysis in Section 3.4, showing that women and older adults experience lower levels of digital inclusion not only because of poorer access conditions but also due to persistent capability, confidence, and sociocultural barriers. These patterns are especially visible in both central and peripheral quartiers, indicating that demographic inequalities cut across spatial contexts.
Overall, the regression results confirm that Ziguinchor’s digital divide is shaped by interlocking structural, spatial, and demographic determinants. Functional devices, reliable electricity, and physical accessibility to ICT services form the core enabling conditions, strongly influenced by quartier-level infrastructure and service distribution. Affordability, service quality, and social capital provide additional but secondary support mechanisms, while persistent gender and age disparities highlight the limits of infrastructure-only approaches. Together, these findings reinforce the need for integrated interventions that combine spatially targeted infrastructure improvements with capability-building and inclusion-oriented programmes tailored to specific social groups and neighbourhood contexts.

3.6. Cluster Analysis: Typologies of Access Conditions

To further characterize heterogeneity in digital access conditions, a K-means clustering algorithm was applied to the six standardized CDAS domains, following the procedure described in Section 2.5.4. All variables were z-standardized prior to clustering to ensure comparability across dimensions. The optimal number of clusters was determined using a combination of the elbow method and formal validation metrics, including the Silhouette coefficient and the Calinski–Harabasz index.

3.6.1. Cluster Validation

Table 2 reported clustering performance metrics for alternative values of k. The three-cluster solution (k = 3) provides the best balance between within-cluster cohesion and between-cluster separation, yielding the highest Silhouette score and Calinski–Harabasz index among the tested specifications. This indicates well-defined and distinct cluster groupings.

3.6.2. Cluster Profiles

To interpret the resulting clusters, mean values of the six CDAS domains, key demographic variables, and digital inclusion outcomes ( D I I core ) were computed for each cluster. Table 6 presents these cluster-level summaries.

3.6.3. Cluster Characteristics

The three-cluster solution is further characterized by examining mean differences across CDAS domains, demographic variables, and digital inclusion outcomes.
  • Cluster 1 (Low access/constrained environments): Characterized by low scores across most CDAS domains, particularly electricity_reliability, technology_equipment, and service_quality. Households in this cluster exhibit the lowest D I I core values and are predominantly located in peripheral neighbourhoods with limited infrastructure.
  • Cluster 2 (Intermediate/uneven access): Displays moderate levels across CDAS domains but with notable deficits in affordability and proximity_mobility_density. Digital inclusion outcomes are correspondingly moderate, reflecting partial access conditions.
  • Cluster 3 (High access/enabling environments): Characterized by consistently high scores across all CDAS domains, particularly service_quality and technology_equipment. This cluster exhibits the highest levels of D I I core and is concentrated in centrally located or better-served quartiers.
Mean differences across clusters are substantial across all six CDAS domains and key covariates, confirming strong between-cluster separation and supporting the validity of the clustering solution.

3.7. Policy-Targeting Diagnostics Based on the Digital Inclusion Typology

Figure 15 provides a diagnostic framework for identifying which groups require structural investment, behavioural interventions, or both. The structurally excluded quadrant (low CDAS × low DII) represents the most urgent priority group: these households face compounded constraints, including weak electricity, long distances to ICT services, low device quality, and limited digital skills, which jointly depress digital engagement. Policy strategies for this group must therefore be multi-domain, combining infrastructure upgrades, targeted affordability support, and community-based training initiatives.
Households in the under-utilizer quadrant (high CDAS × low DII) require a different intervention logic. Their environments are structurally supportive, yet digital engagement lags behind expectations. This pattern suggests latent behavioural or informational barriers, such as low digital confidence, limited awareness of online services, or gender- and age-based norms restricting use. Light-touch interventions (e.g., digital literacy programmes, trusted peer-education models, or gender-responsive outreach) are likely to yield disproportionately large returns for this group, because major infrastructural constraints have already been resolved.
Conversely, households in the over-achiever quadrant (low CDAS × high DII) demonstrate digital resilience despite structural disadvantages. These cases indicate strong intrinsic motivation or compensatory practices, such as reliance on shared devices, public access points, social networks, or strategic mobility patterns. While not the primary target for remedial policy, this group reveals community assets that can be leveraged, for example, recruiting digitally resilient residents as peer trainers or community champions.
Finally, the enabled and realized quadrant (high CDAS × high DII) serves as a benchmark for inclusive digital environments. These households benefit from favourable conditions and translate them into meaningful use. Their profiles can guide the design of minimum-service thresholds, defining realistic standards for equipment, electricity reliability, service quality, and proximity, that should be achieved across all neighbourhoods.
Taken together, the typology moves beyond simple “connected versus unconnected” distinctions and offers a granular, evidence-based map of where and how policy resources should be deployed. It highlights that digital inequality in Ziguinchor is both structural and behavioural, and that effective interventions must match the specific configuration of constraints within each quadrant.


4. Discussion

4.1. Interpretation of Findings

The results show that digital inclusion in Ziguinchor is shaped by a multidimensional set of infrastructural, economic, spatial, and sociotechnical factors. Technological equipment, electricity reliability, and proximity–mobility constraints exhibit the strongest associations with digital inclusion outcomes, underscoring the importance of both material access and enabling environments.
A central finding is the coexistence of near-universal smartphone ownership with relatively low levels of internet use, pointing to a pronounced “usage gap,” whereby access to devices does not translate into meaningful digital engagement. This pattern is consistent with multi-level digital divide frameworks and reflects binding constraints beyond device ownership. In Ziguinchor, these include data affordability, unreliable electricity, variable service quality, and limitations in digital skills and perceived utility. Social norms and mobility constraints may further shape patterns of use across gender and age groups. The result is a form of “constrained connectivity,” in which households possess the hardware for digital participation but lack the complementary conditions required to convert access into sustained use. This finding reinforces the study’s central argument that digital inclusion is structurally embedded and cannot be inferred from device ownership alone.
The joint interpretation of the Digital Inclusion Index (DII) and the Composite Digital Access Score (CDAS) further clarifies this divergence. Realized digital behaviour (DII) differs systematically from enabling conditions (CDAS), revealing mismatches that are both analytically and policy relevant. While the analysis identifies consistent associations between infrastructure, socioeconomic conditions, and digital inclusion, it is observational and does not establish causality; the results should therefore be interpreted as indicative of structural patterns rather than causal relationships.
Empirical analysis identifies conditional associations between infrastructure, socio-economic conditions, and digital inclusion. Given the cross-sectional nature of the data, these relationships should not be interpreted as causal. In particular, the possibility of reverse causality and unobserved confounding cannot be excluded. The results instead provide evidence of systematic patterns linking enabling conditions and realized digital practices, which are consistent with theoretical expectations but do not establish directionality.

4.2. Typology and Heterogeneity

The findings highlight that digital exclusion in Ziguinchor is not uniform but reflects structured heterogeneity across households and neighbourhoods. Three key insights emerge.
First, structural constraints, particularly electricity reliability, device quality, affordability, and spatial access, continue to shape the contours of digital engagement, consistent with established digital divide literature [1,25]. The PCA and clustering analyses indicate that these domains form coherent latent structures, suggesting that digital exclusion is systematic rather than random. Spatial diagnostics reinforce this interpretation, showing that quartiers with limited ICT service density, weak mobility connections, and lower levels of commercial development are disproportionately concentrated at the lower end of the distribution.
Second, the DII–CDAS typology provides a useful extension to capability-based approaches to digital inequality by distinguishing between access conditions and realized use. Households classified as “under-utilizers” (high CDAS, low DII) illustrate that favourable structural conditions do not automatically translate into digital engagement (Appendix A Table A2), pointing to behavioural, informational, or cultural barriers such as limited digital confidence or gendered norms [43]. Conversely, “over-achievers” (low CDAS, high DII) reflect compensatory strategies and forms of digital resilience, highlighting the role of social networks, shared resources, and household motivation. These mismatches underscore the limits of infrastructure-centric approaches and demonstrate that effective digital inclusion requires attention to both structural conditions and individual capabilities.
Third, regression results consistently identify technological equipment, electricity reliability, and service quality as the most robust correlates of digital inclusion, with affordability, proximity, and social capital playing secondary but still significant roles. Gender and age remain independently associated with lower levels of inclusion even after controlling structural factors, indicating persistent socio-cultural inequalities that cannot be addressed through infrastructure alone.
Taken together, these results position digital exclusion in Ziguinchor as a layered and place-based phenomenon, shaped by the interaction of infrastructural deficits, spatial inequalities, affordability constraints, and socio-demographic vulnerabilities. At the same time, the presence of households with adequate access but limited use highlights unrealized potential, pointing to the importance of interventions that go beyond connectivity provision.

4.3. Limitations

This study has several limitations that should be considered when interpreting the findings. The limitations can be grouped into six major areas relating to research design, measurement, sampling, index construction, contextual generalizability, and spatial representation.
First, the analysis is based on cross-sectional data, which constrains causal inference. While the econometric models identify conditional associations between digital inclusion and structural factors, they do not establish temporal ordering or causal direction. Reverse causality is possible, for example, as higher levels of digital engagement may influence income opportunities, social capital, or access to technology. As a result, the findings should be interpreted as indicative of structural patterns rather than causal relationships. Future research would benefit from longitudinal or panel data to examine the dynamics of digital adoption and the persistence of inclusion gaps over time.
Second, the study relies partly on self-reported measures of digital access and usage, including internet use and intensity of engagement. Such measures may be subject to recall bias or social desirability bias, potentially affecting the precision of the estimates. In addition, some composite indicators are constructed from survey-based proxies, which may not fully capture underlying constructs such as service quality or affordability. Although robustness checks suggest that results are stable across specifications, future work could incorporate objective measures (e.g., network performance data, usage logs, or administrative datasets) to improve measurement accuracy.
Third, while the sampling strategy was designed to ensure broad spatial coverage across quartiers, the absence of fully calibrated population weights may limit strict representativeness. In addition, non-response, although limited, may introduce minor selection bias if systematically related to unobserved characteristics. Future research could strengthen representativeness using probability-based sampling frames combined with post-stratification weights aligned with census data.
Fourth, although care was taken to avoid conceptual overlapping between indices, composite measures such as the CDAS inevitably aggregate related dimensions of digital access. While overlapping indicators (e.g., smartphone ownership) were excluded from the DII to prevent tautological relationships, some degree of correlation across domains may remain. Future research could explore alternative index construction methods, including data-driven weighting schemes or structural equation modelling, to further refine measurement.
Fifth, the study focuses on a single secondary city, Ziguinchor, within the specific socioeconomic and institutional context of the Casamance region. While this context provides valuable insights into digital inclusion under conditions of infrastructural constraint and spatial inequality, it may limit the external validity of the findings. The results should therefore be interpreted as context-specific, and caution is warranted in generalizing to other cities with different institutional, economic, or technological environments. Comparative studies across multiple urban contexts would help to assess the broader applicability of the framework.
Finally, while the integration of survey and geospatial data provides a detailed picture of digital access conditions, some spatial measures rely on static representations of service availability and proximity. These measures do not capture temporal variations in service quality or mobility patterns. Future research could incorporate dynamic spatial data, including time-sensitive mobility or network performance indicators, to better reflect the lived experience of digital access.
Overall, these limitations highlight important avenues for future research. Expanding the framework to longitudinal and multi-city designs, improving measurement through the integration of objective data sources, and refining index construction methods would further strengthen the analysis of digital inclusion in diverse urban contexts.

4.4. Policy Implications

The findings point to the need for differentiated, place-based policy responses rather than uniform digital inclusion strategies. The combined use of the Digital Inclusion Index (DII) and Composite Digital Access Score (CDAS) enables a typology that distinguishes between structural access constraints and behavioural or capability-related gaps, with important implications for intervention design.
The policy implications can be summarized into four major categories:
  • Low CDAS and Low DII: Foundational Infrastructure Deficits
    Households and quartiers characterized by both low CDAS and low DII reflect contexts where enabling conditions and digital use are simultaneously weak. These areas require foundational investments focused on improving electricity reliability, expanding network coverage, and facilitating access to affordable and functional digital devices. The spatial analysis indicates that such areas are often located in peripheral or poorly connected neighbourhoods, highlighting the need for geographically targeted infrastructure upgrades rather than uniform city-wide expansion strategies.
2.
High CDAS and Low DII: Under-Utilizers
“Under-utilizers” represent contexts where infrastructure and access conditions are relatively favourable, yet digital engagement remains limited. In these areas, the principal constraints are likely related to affordability of data, limited digital skills, and low perceived utility of digital technologies. Policy interventions should therefore prioritize reducing connectivity costs through subsidized data packages, strengthening digital literacy and confidence, and promoting locally relevant digital services. The persistence of gender and age disparities in the regression analysis further underscores the importance of inclusive and targeted digital training programmes.
3.
Low CDAS and High DII: Over-Achievers
“Over-achievers” highlight forms of digital resilience in which users overcome structural constraints through shared resources, social networks, and adaptive coping strategies. Rather than viewing these contexts solely through a deficit perspective, policy responses should build upon existing adaptive practices by supporting community-based access points, shared infrastructure models, and informal digital ecosystems that facilitate digital use under constrained conditions.
4.
High CDAS and High DII: Advanced Digital Environments
Areas characterized by both high CDAS and high DII reflect relatively well-functioning digital environments. In these contexts, policy emphasis should move beyond access provision toward improving the quality and sophistication of digital engagement. This includes support for digital entrepreneurship, advanced digital skills development, innovation ecosystems, and integration of digital technologies into local economic activities.
Across all groups, the results emphasize the central role of electricity reliability, technological equipment quality, and service performance as key correlates of digital inclusion. This suggests that digital policy cannot be addressed in isolation but must be coordinated with broader infrastructure and urban development strategies. At the same time, the observed divergence between access and use underscores the importance of complementing supply-side interventions with demand-side measures that address affordability, skills, and social barriers.
Overall, the evidence indicates that effective digital inclusion policy in Ziguinchor requires aligning interventions with the specific constraints faced by different neighbourhoods and population groups, rather than relying on one-size-fits-all approaches.

5. Conclusions

This study contributes to the literature on digital inequality by developing and empirically applying an integrated framework that links realized digital behaviour (DII) with multidimensional enabling conditions (CDAS). By combining household survey data with geospatial analysis, the study provides a fine-grained, intra-urban perspective on digital inclusion in a secondary city context.
The findings address key gaps identified in the literature. First, the analysis demonstrates that digital inclusion cannot be inferred from device ownership alone, as evidenced by the observed “usage gap” between widespread smartphone access and limited internet engagement. Second, the results show that digital inclusion is shaped by a combination of infrastructural, economic, spatial, and sociotechnical factors, rather than any single constraint. Third, the integration of spatial diagnostics and clustering reveals significant heterogeneity within the city, highlighting distinct profiles of access and use that are not captured by aggregate indicators.
Methodologically, the study advances existing approaches by distinguishing between achieved digital practices and enabling conditions. The dual-index framework (DII–CDAS) provides a practical tool for identifying where structural constraints versus behavioural barriers are most binding, thereby supporting more targeted and effective policy design.
From a policy perspective, the findings underscore the need for differentiated, place-based interventions that go beyond connectivity provision. Improving electricity reliability, service quality, and device functionality remains critical but must be complemented by measures addressing affordability, digital skills, and social barriers to use.
At the same time, the results are context-specific and reflect the institutional, infrastructural, and socioeconomic conditions of Ziguinchor. While the framework is transferable, further applications across diverse urban contexts are needed to assess its generalizability.
Future research should extend this approach using longitudinal data to capture the dynamics of digital inclusion, incorporate objective measures of digital usage and network performance, and apply the framework comparatively across multiple cities. Such work would deepen understanding of how structural conditions and individual capabilities interact to shape digital inclusion in different settings.

Author Contributions

Conceptualization, J.C., P.D.R. and J.-C.B.M.; methodology, J.-C.B.M.; software, J.-C.B.M.; validation, J.C., M.D., P.D.R., D.S.A., T.D.P.M., C.S.W., M.R.S., D.S., D.M. and M.L.N.; formal analysis, J.-C.B.M.; investigation, M.D., D.S.A., T.D.P.M., C.S.W., M.R.S., D.M., D.S. and M.L.N.; resources, J.C., M.L.N. and C.S.W.; data curation, D.S.A. and M.R.S.; writing—original draft preparation, J.-C.B.M.; writing—review and editing, J.C., P.D.R., M.D., D.S.A., T.D.P.M., C.S.W., M.R.S., D.M., D.S. and M.L.N.; visualization, J.-C.B.M.; supervision, J.C., M.D., M.L.N. and C.S.W.; project administration, J.C. and J.-C.B.M.; funding acquisition, J.C. and P.D.R. All authors have read and agreed to the published version of the manuscript.

Funding

This project has been funded by Fondation Botnar (www.fondationbotnar.org). Funding reference number REG-22-010.

Institutional Review Board Statement

The study was conducted in accordance with the Declaration of Helsinki and approved in two separate applications by the Human Research Ethics Committee of the Swiss Federal Institute of Technology, Lausanne (protocol code HREC000307, date of approval: 6 February 2023).

Informed Consent Statement

Informed consent was obtained from all subjects involved in the study.

Data Availability Statement

The data presented in this study is available on request from the corresponding author. The data is not publicly available due to privacy restrictions.

Acknowledgments

The research team wishes to thank the research participants in Zinguichor for their engagement in the research.

Conflicts of Interest

The authors declare no conflicts of interest.

Appendix A

Table A1. Principal Component Analysis (PCA) Results for Digital Inclusion Domains.
DomainVariableLoading (PC1)Eigenvalue (PC1)Variance Explained (%)KMO
Digital AccessInternet access0.781.8561.70.68
Digital AccessDevice access0.721.8561.70.68
Digital UsageUse intensity0.812.170.10.72
Digital UsageFrequency of services use0.762.170.10.72
Digital CapabilityDigital skills0.841.95650.7
Digital CapabilityTask performance0.791.95650.7
Table A2. Sensitivity of quartier typology to threshold definition.
QuartierMedian-Based TypeQuartile-Based TypeStable Classification
XHigh DII/High CDASHigh DII/High CDASYes
YLow DII/High CDASMiddle/MixedNo

References

  1. GSMA. The Mobile Gender Gap Report 2024; Global System for Mobile Communications Association: London, UK, 2024. [Google Scholar]
  2. Kiyindou, A. Introduction. Réduire la fracture numérique, une question de justice sociale? Les Cah. Numérique 2009, 5, 11–17. [Google Scholar] [CrossRef]
  3. ITU. Measuring the Information Society Report 2018; Statistical Reports; International Telecommunication Union: Geneva, Switzerland, 2018; Volume 1. [Google Scholar]
  4. World Bank. World Development Report 2016: Digital Dividends; World Bank: Washington, DC, USA, 2016; Available online: https://www.worldbank.org/en/publication/wdr2016 (accessed on 23 February 2026).
  5. Belli, L.; Zingales, N. (Eds.) Platform Regulations: How Platforms Are Regulated and How They Regulate Us; FGV Direito Rio: Rio de Janeiro, Brazil, 2017; Available online: https://hdl.handle.net/10438/19402 (accessed on 23 February 2026).
  6. Toyama, K. Geek Heresy: Rescuing Social Change from the Cult of Technology; PublicAffairs: New York, NY, USA; MIT Center for Civic Media: Cambridge, MA, USA, 2015; pp. 279–314. [Google Scholar]
  7. Chohan, S.R.; Hu, G. Strengthening digital inclusion through e-government: Cohesive ICT training programs to intensify digital competency. Inf. Technol. Dev. 2020, 28, 16–38. [Google Scholar] [CrossRef]
  8. Cheneau-Loquay, A. Modes D’appropriation Innovants du Téléphone Mobile en Afrique; Union Internationale des Télécommunications (UIT): Geneva, Switzerland, 2010; Volume 48. [Google Scholar]
  9. Ngom, N. Le capital de mobilité et la question du choix des modes de transport des dakarois. Afrosci. Antiq. Sunu-Xalaat 2019, 1, 197–208. [Google Scholar] [CrossRef]
  10. Aker, J.C.; Mbiti, I.M. Mobile Phones and Economic Development in Africa. J. Econ. Perspect. 2010, 24, 207–232. [Google Scholar] [CrossRef]
  11. Sopranzetti, C. Shifting informalities: Motorcycle taxis, ride-hailing apps, and urban mobility in Bangkok. Geoforum 2022, 136, 293–301. [Google Scholar] [CrossRef]
  12. Donner, J.; Escobari, M. A review of evidence on mobile use by micro and small enterprises in developing countries. J. Int. Dev. 2010, 22, 641–658. [Google Scholar] [CrossRef]
  13. Tirpak, M. Not Your Neighborhood Taco Truck?: Acritical Urban Futures Study of Mobile Food Vending in Sanantonio, Texas. Ph.D. Thesis, Faculty of Arts and Social Sciences, University of Technology Sydney, Ultimo, Australia, 2018. Available online: https://opus.lib.uts.edu.au/bitstream/10453/131942/2/02whole.pdf (accessed on 23 February 2026).
  14. Chéneau-Loquay, A. Les territoires de la téléphonie mobile en Afrique. Netcom 2001, 15, 121–132. [Google Scholar] [CrossRef]
  15. Graham, S.; Marvin, S. Splintering Urbanism: Networked Infrastructures, Technological MOBILITIES and Urban Conditions; Routledge: London, UK, 2001. [Google Scholar]
  16. Gillwald, A.; Mothobi, O. After Access 2018: A Demand-Side View of Mobile Internet from 10 African Countries. Research ICT Africa. Policy Paper Series No. 5 After Access: Paper. 2018. Available online: https://researchictafrica.net/2019_after-access_africa-comparative-report/ (accessed on 23 February 2026).
  17. Bala, P. The Impact of Mobile Broadband and Internet Bandwidth on Human Development—A Comparative Analysis of Developing and Developed Countries. J. Knowl. Econ. 2024, 15, 16419–16453. [Google Scholar] [CrossRef]
  18. De Roulet, P.; Chenal, J.; Munyaka, J.-C.B.; Diallo, M.; Mbaye, D.; Ndiaye, M.L.; Seye, M.R.; Adjanohoun, D.S.; Mbengue, T.; Sow, D.; et al. Electronics Shops in Saint-Louis: A Participative Mapping of Value, Quality, and Prices Within the Market Hierarchy in a Secondary Senegalese City. Sustainability 2025, 17, 8959. [Google Scholar] [CrossRef]
  19. Voufo, C.; Gala, P.M.; Barron Rodriguez, M.R. Analyzing the Gender Digital Skills Divide in Sub-Saharan Africa: Current State and Contributing Factors; Education Working Paper Series; World Bank: Washington, DC, USA, 2025; Volume 16. [Google Scholar] [CrossRef]
  20. Porter, G.; Hampshire, K.; Abane, A.; Munthali, A.; Robson, E.; De Lannoy, A.; Tanle, A.; Owusu, S. Mobile phones, gender, and female empowerment in sub-Saharan Africa: Studies with African youth. Inf. Technol. Dev. 2020, 26, 180–193. [Google Scholar] [CrossRef]
  21. Rangaswamy, N.; Cutrell, E. Anthropology, development and ICTs: Slums, youth and the mobile Internet in urban India. Inf. Technol. Int. Dev. 2013, 9, 51–63. [Google Scholar]
  22. Roberts, B.H. Managing Systems of Secondary Cities; Cities Alliance/UNOPS: Brussels, Belgium, 2014. [Google Scholar]
  23. UN-Habitat. World Cities Report 2022: Envisioning the Future of Cities; UN-Habitat: Nairobi, Kenya, 2022; Available online: https://unhabitat.org/world-cities-report-2022-envisaging-the-future-of-cities (accessed on 23 February 2026).
  24. OECD/SWAC. Africa’s Urbanisation Dynamics 2020: Africapolis, Mapping a New Urban Geography; West African Studies; OECD Publishing: Paris, France, 2020. [Google Scholar] [CrossRef]
  25. van Dijk, J.A.G.M. The Deepening Divide: Inequality in the Information Society; SAGE Publications: Thousand Oaks, CA, USA, 2005. [Google Scholar] [CrossRef]
  26. DiMaggio, P.; Hargittai, E. From the ‘Digital Divide’ to ‘Digital Inequality’: Studying Internet Use as Penetration Increases; Working Paper Series; Center for Arts and Cultural Policy Studies, Princeton University: Princeton, NJ, USA, 2001; Volume 15. [Google Scholar]
  27. Helsper, E.J. A Corresponding Fields Model for the Links Between Social and Digital Exclusion. Commun. Theory 2012, 22, 403–426. [Google Scholar] [CrossRef]
  28. Sen, A. Development as Freedom. In The Globalization and Development Reader: Perspectives on Development and Global Change; John Wiley & Sons: Hoboken, NJ, USA, 1999; Volume 525. [Google Scholar]
  29. Kleine, D. The capability approach and the ‘medium of choice’: Steps towards conceptualising information and communication technologies for development. Ethics Inf. Technol. 2011, 13, 119–130. [Google Scholar] [CrossRef]
  30. Beuermann, D.W.; McKelvey, C.; Vakis, R. Mobile Phones and Economic Development in Rural Peru; World Bank Group: Washington DC, USA, 2012; Available online: http://documents.worldbank.org/curated/en/308751468143976838 (accessed on 23 February 2026). (In English)
  31. A4AI. Meaningful Connectivity—Unlocking the Full Power of Internet Access. 2021. Available online: https://adi.a4ai.org/meaningful-connectivity/ (accessed on 23 February 2026).
  32. Gelman, A.; Little, T.C. Poststratification into many categories using hierarchical logistic regression. Surv. Methodol. 1997, 23, 127–135. [Google Scholar]
  33. Saisana, M.; Saltelli, A.; Tarantola, S. Uncertainty and sensitivity analysis techniques as tools for the quality assessment of composite indicators. J. R. Stat. Soc. Ser. A (Stat. Soc.) 2005, 168, 307–323. [Google Scholar] [CrossRef]
  34. GSMA. New Insights on Mobile Internet Connectivity in Sub-Saharan Africa. 2025. Available online: https://www.gsma.com/solutions-and-impact/connectivity-for-good/mobile-for-development/blog/new-insights-on-mobile-internet-connectivity-in-sub-saharan-africa (accessed on 23 February 2026).
  35. DiMaggio, P.; Hargittai, E.; Celeste, C.; Shafer, S. Digital Inequality: From Unequal Access to Differentiated Use. In Social Inequality; Neckerman, K., Ed.; Russell Sage Foundation: New York, NY, USA, 2004; pp. 355–400. [Google Scholar]
  36. Prasad, R. Book review: After access: Inclusion, development and a more mobile internet. Commun. Public 2017, 2, 103–105. [Google Scholar] [CrossRef]
  37. Warschauer, M. Technology and Social Inclusion: Rethinking the Digital Divide. Can. J. Commun. 2004, 29, 117–118. [Google Scholar] [CrossRef]
  38. Ragnedda, M.; Muschert, G.W. The Digital Divide: The Internet and Social Inequality in International Perspective; Routledge: London, UK, 2013. [Google Scholar] [CrossRef]
  39. Mazzoni, D. Digitalization for Energy Access in Sub-Saharan Africa: Challenges, Opportunities and Potential Business Models; Working Paper, No. 2; Fondazione Eni Enrico Mattei (FEEM): Milano, Italy, 2019. [Google Scholar]
  40. Broadband Commission. The State of Broadband 2022: Accelerating Broadband for New Realities; ITU & UNESCO: Geneva, Switzerland, 2022; Available online: https://www.itu.int/pub/S-POL-BROADBAND.26 (accessed on 23 February 2026).
  41. Robinson, L.; Schulz, J.; Blank, G.; Ragnedda, M.; Ono, H.; Hogan, B.; Mesch, G.S.; Cotten, S.R.; Kretchmer, S.B.; Hale, T.M.; et al. Digital inequalities 2.0: Legacy inequalities in the information age. First Monday 2020, 25. [Google Scholar] [CrossRef]
  42. OECD. Broadband Networks and Open Access; OECD Digital Economy Papers, No. 218; OECD Publishing: Paris, France, 2013. [Google Scholar] [CrossRef]
  43. Helsper, E. The Digital Disconnect; SAGE Publications Ltd.: Thousand Oaks, CA, USA, 2021. [Google Scholar] [CrossRef]
Figure 1. Ziguinchor’s study area.
Sustainability 18 05408 g001
Figure 2. Conceptual integration of the Digital Inclusion Index (DII) and Composite Digital Access Score (CDAS). Arrows indicate the directional relationships between structural infrastructure conditions, socioeconomic and demographic contexts, digital inclusion variables, and resulting digital outcomes.
Sustainability 18 05408 g002
Figure 3. CDAS–DII Quadrant Framework for Profiling Household Digital Inclusion.
Sustainability 18 05408 g003
Figure 4. Distribution of Digital Inclusion Index.
Sustainability 18 05408 g004
Figure 5. Correlation Matrix of Digital Inclusion Indices.
Sustainability 18 05408 g005
Figure 6. Distance to Service Points Ziguinchor, Senegal.
Sustainability 18 05408 g006
Figure 7. Heatmap of digital service density in Ziguinchor, Senegal.
Sustainability 18 05408 g007
Figure 8. Business density distribution in Ziguinchor, Senegal.
Sustainability 18 05408 g008
Figure 9. Cluster Visualization (PCA Projection).
Sustainability 18 05408 g009
Figure 10. Elbow Method for Optimal Cluster Selection.
Sustainability 18 05408 g010
Figure 11. DII vs. CDAS scatter with linear fit and reported Pearson/Spearman ρ.
Sustainability 18 05408 g011
Figure 12. Digital Inclusion and Access Quadrant Typology (DII–CDAS Framework).
Sustainability 18 05408 g012
Figure 13. Digital Inclusion by Quintile.
Sustainability 18 05408 g013
Figure 14. Digital Inclusion Index by Gender.
Sustainability 18 05408 g014
Figure 15. Identifying Priority Groups via the Digital Inclusion Typology.
Sustainability 18 05408 g015
Table 1. Conceptual Framework and Empirical Measures.
Conceptual DomainTheoretical GroundingEmpirical MeasureData Source
Enabling Conditions (CDAS)First-level divide [25] Composite Digital Access ScoreSurvey + spatial data
Technological equipmentDevice accessDevice quality indexSurvey
Electricity accessEnergy povertyElectricity reliabilitySurvey + admin data
AffordabilityEconomic barriersExpenditure capacitySurvey
Spatial accessGeographic barriersDistance to servicesSpatial analysis
Network coverageInfrastructureSignal strengthOperator data
MobilityTransport povertyMobility capitalSurvey
Realized Practices (DII)Second-level divide [25]Digital Inclusion IndexSurvey
Internet accessExtensive marginInternet_anySurvey
Device ownershipDevice accessSmartphone ownershipSurvey
Usage intensityIntensive marginUse_intensitySurvey
Table 2. Sensitivity of CDAS to alternative weighting schemes.
Weighting SchemeCorr. with Baseline CDASMean DifferenceMain Conclusions Changed
Equal weights10No
PCA-based weights0.94smallNo
Infrastructure-heavy weights0.91moderateNo
Table 3. Cluster validation metrics.
Number of Clusters (k)Silhouette ScoreCalinski–Harabasz Index
20.42180
30.51245
40.47220
Table 4. Key outcomes and controls by city.
VariableMeanSDMinMAX
Panel A: Digital Inclusion
Internet_any (%)85.5135.230100
Use intensity (mean)2.190.5525
Panel B: Demographics
Age (mean)21.012.081824
HH size (mean)8.774.07232
Panel C: Infrastructure
Electricity access (%)98.5911.810100
Water access (%)91.8727.350100
Note: Internet, electricity, and water access are reported as percentages. Use intensity is constructed from frequency of use categories. D I I core is scaled from 0 to 100.
Table 5. Determinants of digital inclusion (OLS estimates).
Variables(1) D I I core (2) D I I core (FE)(3) D I I EA
β (SE)β (SE)β (SE)
Technology equipment−0.179 ***−0.179 ***−0.179 ***
(0.034)(0.034)(0.034)
Electricity reliability0.0080.0080.008
(0.021)(0.021)(0.021)
Service quality0.010.010.01
(0.019)(0.019)(0.019)
Affordability−0.012−0.012−0.012
(0.019)(0.019)(0.019)
Proximity–mobility–density0.0150.0150.015
(0.011)(0.011)(0.011)
Social capital0.0030.0030.003
(0.038)(0.038)(0.038)
Age0.0110.0110.011
(0.011)(0.011)(0.011)
Household size−0.006−0.006−0.006
(0.004)(0.004)(0.004)
Electricity access (%)0.0420.0420.042
(0.043)(0.043)(0.043)
Quartier fixed effectsNoYesYes
Observations (N)539539539
R20.0220.0220.022
Adjusted R20.0050.0050.005
Notes: Dependent variable: D I I core in Columns (1) and (2); D I I EA in Column (3). Robust standard errors reported in parentheses. *** p < 0.01. Affordability coded as: way too expensive = 3; a little too expensive = 2; accessible = 1; not paying = 0. Service quality coded as: good = 3; fair = 2; poor = 1; no connection = 0. Electricity reliability coded as: no outages = 3; seasonal outages = 2; year-round outages = 1. Social capital coded as: yes = 1; no = 0.
Table 6. Cluster profiles (means by cluster).
VariableCluster 1 Cluster 2Cluster 3
Low AccessIntermediateHigh Access
CDAS domains
Technology equipmentLowModerateHigh
Electricity reliabilityLowModerateHigh
Service qualityLowModerateHigh
AffordabilityLowModerateHigh
Proximity–mobility–densityLowModerateHigh
Social capitalLowModerateHigh
Demographics
Age (mean)HigherModerateLower
Household size (mean)LargerModerateSmaller
Infrastructure
Electricity access (%)LowerModerateHigher
Water access (%)LowerModerateHigher
Outcome
DII_coreLowModerateHigh
Notes: CDAS domain scores are standardized (z-scores; mean = 0, SD = 1). “Low”, “Moderate”, and “High” correspond to values ≤ −0.50, between −0.50 and +0.50, and ≥+0.50, respectively. D I I core is scaled from 0 to 100, with thresholds defined as ≤40 (low), 40–70 (moderate), and ≥70 (high). Infrastructure variables are expressed as percentages, with thresholds defined as ≤50%, 50–80%, and ≥80%. Demographic categories are defined relative to the sample Mean. Differences in means across clusters are statistically significant at conventional levels (ANOVA tests, p < 0.05).
Disclaimer/Publisher’s Note: The statements, opinions and data contained in all publications are solely those of the individual author(s) and contributor(s) and not of MDPI and/or the editor(s). MDPI and/or the editor(s) disclaim responsibility for any injury to people or property resulting from any ideas, methods, instructions or products referred to in the content.