Article

Spatiotemporal Heterogeneity of the Synergistic Effects and Driving Factors of Pollution Reduction and Carbon Mitigation: Evidence from Beijing–Tianjin–Hebei Urban Agglomeration

College of Economics and Management, Beijing University of Technology, Beijing 100124, China
*
Author to whom correspondence should be addressed.
Sustainability 2026, 18(11), 5395; https://doi.org/10.3390/su18115395
Submission received: 8 April 2026 / Revised: 22 May 2026 / Accepted: 23 May 2026 / Published: 27 May 2026
(This article belongs to the Section Air, Climate Change and Sustainability)

Abstract

Understanding the synergistic effects of pollution reduction (PR) and carbon mitigation (CM) and their driving factors is essential for achieving environmental improvement and dual-carbon targets. On the basis of panel data from 13 cities in the Beijing–Tianjin–Hebei (BTH) urban agglomeration from 2010 to 2023, this study analyzed the spatiotemporal evolution of air pollutant and carbon emissions. The synergistic effects of PR and CM were quantified using the co-control effect coordinate system and vector angle analysis, and their underlying driving mechanisms were examined using a geographically and temporally weighted regression model. Results showed that air pollutant emissions in the BTH region declined substantially over the study period, whereas carbon emissions increased in all cities, except Beijing. The spatial patterns of air pollutant and carbon emissions were largely consistent, with Tangshan being a high-emission hotspot and northern Hebei cities being low-emission areas. Most cities were in a “pollution reduction but carbon increase” stage, but the overall synergistic degree gradually improved. The synergistic effects were positively driven by green travel and technological R&D and negatively influenced by economic development, energy utilization, and transportation structure. The positive effect of industrial structure on PR and CM weakened, and spatial heterogeneity was evident. Economic development and technological R&D exerted strong influences in southern Hebei. Energy utilization and transportation structure had pronounced effects in northern Hebei. Industrial structure had remarkable effects in cities surrounding Beijing and Tianjin. Moreover, green travel demonstrated spatial heterogeneity, exerting a facilitative effect on emissions in southern Hebei cities. These findings provide policy implications for promoting the synergistic effects of PR and CM in the BTH urban agglomeration.

1. Introduction

Climate change and air pollution constrain global sustainable development [1]. They share common emission sources and exhibit complex interactions [2]. Specifically, industrial activities and fossil fuel combustion are the primary sources of air pollutants (e.g., sulfur dioxide [SO2], nitrogen oxide [NOx], and particulate matter [PM]) and greenhouse gases, providing a fundamental basis for the coordinated control of air pollution and carbon emissions. Accordingly, measures aimed at reducing air pollution often yield climate co-benefits through concurrent reductions in carbon emissions, and vice versa [3,4,5]. Consequently, the synergistic promotion of pollution reduction (PR) and carbon mitigation (CM) has emerged as an important direction in global environmental governance [6].
As the world’s largest carbon emitter, China plays an increasingly prominent role in global climate governance. To fulfill its responsibilities as a major country in addressing climate change, China has pledged to peak its carbon emissions before 2030 and achieve carbon neutrality by 2060 (collectively known as dual-carbon targets). Unlike some developed countries that have largely completed the stage of environmental pollution control [7], China remains in a critical phase where air pollution abatement and CM must be advanced simultaneously [8]. Under the dual constraints of PR and CM, China’s environmental governance paradigm has gradually shifted from single-pollutant control to the integrated promotion of PR and CM [9]. Building on this transition, the Chinese government has issued the Implementation Plan for Synergistic Enhancement of Pollution Reduction and Carbon Mitigation [10], which emphasizes the quantitative assessment of the synergistic degree at the city level, providing a clear empirical context for this study.
The Beijing–Tianjin–Hebei (BTH) region, as a major population and economic hub in China, is one of the country’s most environmentally stressed areas. Over the years, PM2.5 concentrations in several cities within the region have consistently ranked among the highest nationwide, underscoring the severity of air pollution management challenges. Following the announcement of China’s dual-carbon targets, the BTH region has been further prioritized as a key area for low-carbon transition. Notably, since being designated a pilot zone under the Beautiful China initiative in 2025, the region has been tasked with serving as a demonstration area for the synergistic governance of PR and CM, highlighting its leading role in advancing coordinated governance pathways. To achieve this synergistic effect, the region must accelerate its formulation of targeted policies. However, substantial heterogeneity in resource endowment and economic development across cities leads to diverse driving factors of PR and CM, rendering uniform policies insufficient to meet local needs. Therefore, the synergistic effects of PR and CM across the BTH urban agglomeration must be quantified, and the key drivers and their spatiotemporal variation need to be identified.
Against this background, on the basis of panel data from 13 cities in the BTH urban agglomeration from 2010 to 2023, this study characterized the spatiotemporal evolution of air pollutants and carbon emissions by using kernel density estimation and spatial visualization techniques. Then, the synergistic effects of PR and CM and their driving factors were examined through the co-control effect coordinate system (CCECS), vector angle analysis, and the geographically and temporally weighted regression (GTWR) model. The findings provide a scientific basis for designing differentiated policies for enhancing the coordinated promotion of PR and CM.
The potential marginal contributions of this study are as follows: First, on the basis of CCECS, this study proposed a vector-based approach to evaluate the synergistic degree of PR and CM. This method captures the direction and magnitude of the synergistic effect and can be readily extended to other regions worldwide. Second, by distinguishing PR and CM as separate dependent variables, this study uncovered the heterogeneity in the driving factors of PR and CM, thereby providing new insights into the underlying mechanisms of synergy and tradeoffs between the two. Finally, the findings highlight the importance of differentiated policy design and offer practical implications for tailoring environmental and climate strategies to diverse regional contexts. These insights are particularly valuable for rapidly developing urban agglomerations across the globe that face similar dual challenges of PR and CM.
The remainder of this paper is organized as follows: Section 2 reviews relevant literature, Section 3 describes the research methods, Section 4 presents the empirical results and discussion, and Section 5 concludes the study and provides policy suggestions.

2. Literature Review

2.1. Research on the Synergistic Effect of Pollution Reduction and Carbon Mitigation

How to accurately characterize the relationship between PR and CM and effectively quantify their synergistic effects has become a central issue in current research. On the basis of differences in evaluation approaches, existing research can be broadly classified into three categories.
The first category is based on an input–output perspective. Studies in this category typically regard air pollutants and carbon emissions as undesirable outputs and employ data envelopment analysis models to measure the synergistic efficiency of PR and CM [11,12,13]. This approach captures the overall efficiency of the PR and CM process. However, it has a limitation: the inability to directly reveal whether actual reductions in air pollution and carbon emissions have been achieved.
The second category involves comprehensive evaluation on the basis of indicator systems. Relevant studies have constructed indicator systems encompassing carbon emissions, air pollutants, economic development, and energy use and employed the coupling coordination degree model to assess the coordination level across different spatial scales, including urban agglomerations [14], provinces [15,16], and cities [17]. Although this approach captures the economic, environmental, and social outcomes of PR and CM, it tends to obscure the direct synergistic relationship between the two.
The third category is based on CCECS. This approach constructs a 2D coordinate system by using carbon emission and air pollutant reduction rates to directly determine if synergy between PR and CM is achieved [18,19]. Compared with the aforementioned methods, CCECS offers more intuitive insights into the synergistic relationship between PR and CM. Therefore, it has been increasingly applied in recent studies. For instance, Zhang et al. applied CCECS to examine the synergistic effects of PR and CM on Hebei Province [20]. Wang and Fang utilized this method to characterize the synergy between PR and CM across Chinese cities [21].

2.2. Research on the Influence Factors of the Synergistic Effect of Pollution Reduction and Carbon Mitigation

The synergistic effects of PR and CM are jointly driven by multiple factors. Existing studies have indicated that socioeconomic factors, including population density, economic development level, industrial structure, and technological innovation [15,22,23], as well as natural factors, such as precipitation and vegetation cover [24,25], substantially influence these synergistic effects. Given the existence of the environmental Kuznets curve (EKC) between economic growth and the environment, the influence of economic development on synergistic effects exhibits an inverted-U pattern, initially inhibiting and subsequently promoting synergy [26]. The optimization of industrial and energy structures can reduce carbon and air pollutant emissions at their sources, thereby enhancing the coordinated promotion of PR and CM [27,28]. In addition, emerging digital economy factors have gradually become important drivers influencing synergistic effects. For example, the development of digital trade can enhance regional innovation capacity, which in turn promotes the synergy between PR and CM [29]. Meanwhile, the continuous diffusion of green technology can facilitate industrial green upgrading and provide critical technological support for the coordinated governance of PR and CM [30].
The spatial heterogeneity of influencing factors is a central issue in the study of regional synergistic effects. Existing research has shown that regions with high economic development level are likely to adopt and implement advanced pollution control technologies, thereby remarkably enhancing the synergy between PR and CM [31]. By contrast, in regions with undeveloped industrial structures and weak economic foundations, the introduction of green and low-carbon industries for industrial restructuring tends to generate pronounced emission reduction effects [32]. Moreover, the differences in technological innovation capacity and energy intensity between cities further exacerbate the spatial differentiation of synergistic effects [15,33].

2.3. Limitations of Existing Studies

Existing studies on the synergistic effects of PR and CM have achieved important progress, providing important support for this study. However, several limitations remain.
First, although existing studies have examined the synergistic effects of PR and CM across different spatial scales, these studies have focused on measuring coupling coordination degrees (CCD) of PR and CM [16,34,35]. Although some studies have applied CCECS to investigate the coordinated emission reduction effects of greenhouse gases and air pollutants in Hebei Province [20], systematic research on the dynamic relationship between PR and CM within the BTH urban agglomeration remains limited.
Second, existing studies on the driving factors of PR and CM usually adopted integrated evaluation results (i.e., CCD) as the dependent variable and conducted empirical analyses via the geographic detector model [9,30], spatial Durbin model [35], LMDI model [33], and panel quantile regression model [21]. However, the potentially different effects of driving factors on PR and CM cannot be easily distinguished through this practice, thus limiting the ability to identify their spatiotemporal heterogeneity.
Although some studies have introduced geographically weighted regression (GWR) and GTWR models to examine the driving factors of PR and CM [31,36], these studies focused on national provinces and cities and only characterized the spatial heterogeneity of the driving factors. The spatiotemporal non-stationarity of the influencing factors of PR and CM in the BTH urban agglomeration has not yet been fully addressed.

3. Theoretical Mechanism and Research Hypotheses

The synergistic effects of PR and CM are influenced by various socio-economic factors. The Implementation Plan for Synergistic Enhancement of Pollution Reduction and Carbon Mitigation emphasizes a comprehensive green, low-carbon transformation of socio-economic systems and proposes coordinated governance pathways involving energy transition, transportation optimization, green travel, and technological research and development (R&D). Building on this policy framework, this study developed a theoretical mechanism framework to explain how different socio-economic factors influence the synergistic effects of PR and CM.

3.1. Effect of Economic Development on Pollution Reduction and Carbon Mitigation

The EKC hypothesis suggests that an inverted U-shaped relationship may exist between economic development and environmental pollution as well as carbon emissions [37,38]. Therefore, the influence of economic development on PR and CM could be nonlinear [26]. At the early stage of economic development, economic growth is often accompanied by rapid industrialization and a substantial increase in energy consumption. Increased fossil fuel consumption and the agglomeration of energy-intensive industries lead to simultaneous increases in carbon and air pollutant emissions. Meanwhile, under pressure for economic growth, local governments tend to prioritize short-term economic gains and relax environmental regulatory enforcement [39]. Therefore, economic development is generally unfavorable for PR and CM.
As the economic development level continues to improve, its negative effect on PR and CM gradually weakens. A high level of economic development implies strong fiscal capacity, enabling governments to allocate abundant resources to energy-saving and environmental protection projects, green infrastructure development, and technological R&D. Therefore, regions with high levels of economic development are generally likely to form green and low-carbon development pathways and exhibit strong synergistic effects on PR and CM [31].
On the basis of the analysis above, the following research hypothesis is proposed.
H1. 
Economic development exerts a negative impact on PR and CM, while this negative effect may gradually weaken as the level of economic development increases.

3.2. Effect of Industrial Structure on Pollution Reduction and Carbon Mitigation

Industrial structure optimization affects PR and CM through two main pathways. First, industrial structure optimization can reduce the economy’s dependence on energy-intensive industries and fossil fuel. Traditional industrial structures dominated by heavy industries are characterized by high energy consumption and high emission intensity [38]. By contrast, the tertiary sector, dominated by service- and technology-intensive industries, exhibits low energy consumption intensity and high value-added potential [26]. Therefore, industrial structure optimization essentially represents a transition from a high-emission-driven industrial system to a low-carbon, high-efficiency industrial system. As the share of the tertiary sector increases, overall energy use efficiency improves, and the economy’s path reliance on energy-intensive industries gradually weakens, thereby promoting carbon emission reduction [40].
Moreover, industrial structure optimization can promote green technological innovation and improve resource allocation efficiency. Industrial upgrading facilitates the reallocation of production factors, such as capital, labor, and technology, to efficient and low-emission sectors, thereby reducing inefficient production capacity [41]. Meanwhile, the development of high-tech industries can accelerate green technological innovation and the diffusion of clean production technologies, facilitating the coordinated advancement of pollution control and low-carbon transition.
On the basis of this analysis, the following research hypothesis is proposed.
H2. 
Industrial structure optimization has a positive influence on the synergistic effects of PR and CM.

3.3. Effect of Energy Utilization on Pollution Reduction and Carbon Mitigation

Energy utilization is a key factor influencing the synergistic effects of PR and CM. Its mechanisms are mainly reflected in two aspects: energy consumption scale and energy structure. Fossil energy is a major source of air pollutants and carbon dioxide emissions [42]. For a long time, China’s energy consumption has been dominated by fossil fuels, such as coal. Therefore, the extensive consumption of high-carbon energy not only directly increases carbon dioxide emissions but is also accompanied by emissions of air pollutants, such as SO2, NOx, and PM2.5.
Energy structure optimization can alleviate the emission pressure associated with energy utilization. As the share of renewable energy consumption increases, the emission intensity per unit of energy use declines, reducing carbon emissions [43]. In particular, the substitution of fossil fuels by clean energy sources, such as wind and solar power, directly reduces carbon and air pollutant emissions generated during energy combustion. However, the current energy structure in the BTH region remains dominated by fossil fuels, and the substitution effect of clean energy is still insufficient to offset the emission pressure driven by large-scale energy consumption. Accordingly, we propose the following research hypothesis.
H3. 
Energy utilization has a negative influence on the synergistic effects of PR and CM.

3.4. Effect of Green Travel on Pollution Reduction and Carbon Mitigation

Green travel refers to transportation modes that have low environmental effects. Common forms of green travel mainly include walking, cycling, public transportation, and the use of new energy vehicles. These modes generally have low per capita energy consumption intensity. Therefore, promoting green travel can reduce the frequency of private vehicle use, thereby lowering air pollutant and greenhouse gas emissions from the transportation sector at the source [44]. Meanwhile, the promotion of new energy vehicles, particularly the development of public transport electrification, can further substantially reduce carbon emissions [45].
However, the development of green travel may also generate certain indirect negative effects. The expansion of public transportation and improvements in transport accessibility may intensify population agglomeration, thereby increasing transportation demand and energy consumption, which may in turn lead to high carbon emissions to some extent [46]. Moreover, the emission reduction effect of public transport electrification is closely related to the regional power structure [47]. Therefore, the effect of green travel on PR and CM is complex, and its actual emission reduction effect still requires further verification.
On the basis of the analysis above, the following research hypothesis is proposed.
H4. 
Green travel has a positive influence on the synergistic effects of PR and CM.

3.5. Effect of Transportation Structure on Pollution Reduction and Carbon Mitigation

With rapid socio-economic development, the flow of production factors has become increasingly frequent, leading to continuous growth in freight turnover demand and a substantial increase in transportation activities. Therefore, the transportation sector has become a major source of air pollutants and carbon emissions [48]. Different transportation modes exert varying environmental effects because substantial differences exist in energy consumption and emission intensity per unit of turnover. Railway transportation has advantages, such as large carrying capacity, low energy consumption, and environmental friendliness [49]. By contrast, road freight transportation mainly relies on fossil fuels and exhibits high energy consumption and emission intensities per unit of freight turnover. Therefore, a transportation structure dominated by road freight further stimulates fossil fuel consumption and increases carbon emissions [50].
With continuous technological progress, the potential for low-carbon transformation in the transportation sector has been stimulated. For example, the application of intelligent transportation systems can optimize traffic operation efficiency and reduce energy consumption and transportation-related carbon emissions [51]. In addition, the promotion and application of new energy and electrification technologies help reduce the transportation sector’s dependence on traditional fossil fuels and improve energy efficiency, thereby effectively alleviating the pressures of carbon and air pollutant emissions from the transportation sector.
Accordingly, the following research hypothesis is proposed.
H5. 
Transportation structure optimization has a positive influence on the synergistic effects of PR and CM.

3.6. Effect of Technological R&D on Pollution Reduction and Carbon Mitigation

Technological R&D is a key driver of PR and CM. First, technological R&D can promote technological progress in the energy sector and facilitate the development of new energy projects, thereby improving energy efficiency and reducing carbon emissions [52]. Second, technological R&D can enhance the synergistic effects of PR and CM by promoting industrial upgrading [30]. As firms increase their R&D investment, they are incentivized to develop clean production and low-carbon energy utilization technologies, which help reduce pollutant and carbon emissions at the source.
In addition, the mechanisms of technology transfer and diffusion further strengthen intercity collaborative governance capacity. Green technologies from advanced regions can spread to neighboring areas through regional cooperation. This process helps enhance local emission control capacity [53].
Accordingly, the following research hypothesis is proposed.
H6. 
Technological R&D has a positive influence on the synergistic effects of PR and CM.

4. Materials and Methods

4.1. Accounting for Air Pollutant Equivalent

In this study, air pollutants include SO2, NOx, and PM (i.e., PM2.5 and PM10). On the basis of the pollutant equivalent method stipulated in the Environmental Protection Tax Law of the People’s Republic of China, the four air pollutants are converted into pollutant equivalents to comprehensively represent the overall level of air pollution.
A P i , t = E S O 2 i , t / 0.95 + E N O x i , t / 0.95 + E P M 2.5 i , t / 2.18 + E P M 10 i , t / 2.18
where APi,t represents the air pollutant equivalent in city i in the tth year. E S O z i , t , E N O x i , t , E P M 2.5 i , t , and E P M 10 i , t denote the emissions of SO2, NOx, PM2.5, and PM10 in city i in the tth year, respectively.

4.2. Kernel Density Estimation

Kernel density estimation is an important nonparametric method derived from the histogram framework [54]. It enables the inference of the underlying distribution of a population from a limited sample, there by revealing the data concentration regions. Let x i i = 1 , 2 , n denote independent and identically distributed samples and f is the probability density function. Kernel density estimation can be expressed as follows:
f ^ ( x ) = 1 N b i = 1 N K ( x x i b )
where N denotes the sample size, b is the bandwidth, and K (·) represents the selected kernel function. Common kernel functions include the Epanechnikov kernel, the Biweight kernel, and the Gaussian kernel. Existing studies have shown that the choice of kernel function has a negligible effect on estimation results [55].
In this study, the Gaussian kernel was selected because of its widespread application in the literature [56,57]. The Gaussian kernel is defined as follows:
K ( x ) = 1 2 π exp 1 2 x 2

4.3. Measurement Methods for Synergistic Effects

4.3.1. Co-Control Effect Coordinate System

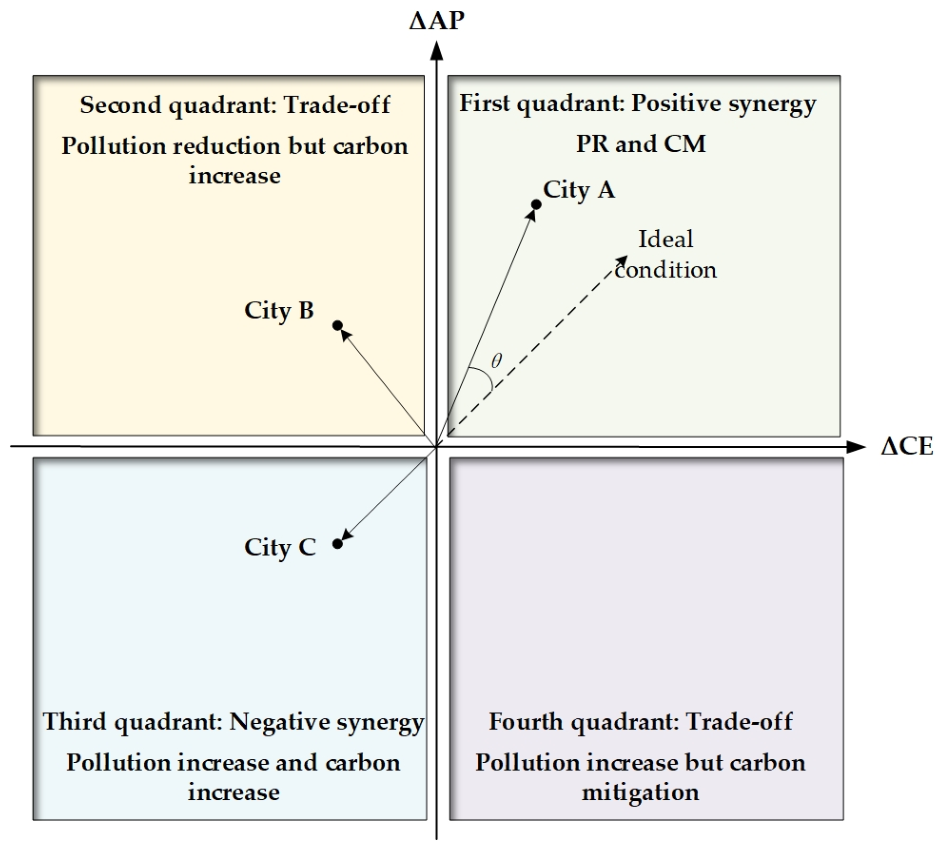
CCECS is a two-dimensional geometric analytical framework designed to characterize the synergistic relationship between PR and CM. Specifically, CCECS is constructed as a rectangular coordinate system in which the horizontal axis represents the carbon emission reduction rate, and the vertical axis denotes the air pollutant reduction rate. Within this framework, each city in a given year is represented as a point in CCECS as follows: P i , t = Δ C E i , t , Δ A P i , t , where Δ C E i , t and Δ A P i , t indicate the reduction rate in carbon and air pollutant emissions, respectively. Δ C E i , t and Δ A P i , t can be calculated as:
Δ C E i , t = C E i , t 0 C E i , t / C E i , t 0
Δ A P i , t = A P i , t 0 A P i , t / A P i , t 0
where CEi,t denotes the carbon emissions in city i in the tth year. C E i , t 0 and A P i , t 0 denote the carbon and air pollutant emissions in city i in the base year, respectively.
The position of this point in the coordinate space reflects the city’s characteristics in terms of the synergistic state of PR and CM (Figure 1). The four quadrants of CCECS provide a clear interpretation of a different synergistic relationship between PR and CM.
  • First quadrant ( Δ C E i , t > 0 , Δ A P i , t > 0 ): Carbon emissions and air pollutants are reduced, indicating a positive synergistic effect of PR and CM.
  • Second quadrant ( Δ C E i , t < 0 , Δ A P i , t > 0 ): Air pollutants are reduced, whereas carbon emissions increase, suggesting a tradeoff.
  • Third quadrant ( Δ C E i , t < 0 , Δ A P i , t < 0 ): Carbon emissions and air pollutants increase, indicating a lack of effective control and a negative synergistic outcome.
  • Fourth quadrant ( Δ C E i , t > 0 , Δ A P i , t < 0 ): Carbon emissions are reduced, whereas air pollutants increase, reflecting a tradeoff.

4.3.2. Vector Angle

An effective way to quantify the synergistic effect of PR and CM within the CCECS framework is the vector angle method, which captures the direction and coordination degree between PR and CM. For each city i in year t, a 2D vector is constructed from the origin to point Pi,t. The vector can be expressed as V i , t = Δ C E i , t , Δ A P i , t , which represents the joint change in carbon emissions and air pollutants. The key idea is to measure the angle between this vector and the 45° reference line, that is, line y = x, which represents a state of perfectly balanced and synchronized reductions in PR and CM. The most ideal state can be expressed as normalized reference vector V * = 1 , 1 , which indicates equal contributions from both dimensions. Accordingly, actual performance vector V i , t for city i in year t can be compared with ideal vector V * by calculating the angle between them as follows:
cos θ i , t = V i , t V * V i , t V * = Δ C E i , t 1 + Δ A P i , t 1 Δ C E i , t 2 + Δ A P i , t 2 1 2 + 1 2
A small angle θ i , t (i.e., a cosine value close to 1) indicates that the actual vector is closely aligned with the ideal direction, reflecting a high degree of synergy between PR and CM. Conversely, a large angle implies substantial deviation from the optimal coordination path. When θ approaches 90° (i.e., a cosine value close to 0), the synergy between PR and CM weakens. If θ exceeds 90°, PR and CM move in opposite directions, suggesting a tradeoff or conflict between them.

4.4. Geographically and Temporally Weighted Regression Model

4.4.1. Variables Selection

(1) Dependent variables
Unlike previous studies that integrated PR and CM into a single composite indicator, this study regarded PR and CM as separate dependent variables in the GTWR model. This treatment enables a clear identification of the common and differentiated drivers of PR and CM, thereby providing direct evidence for synergistic mechanism analysis.
(2) Explanatory variables
On the basis of theoretical mechanism analysis, this study selected six driving factors, including economic development, industrial structure, energy consumption, transportation structure, green travel, and technological R&D. Gross domestic product (GDP) was used to characterize economic development. The proportion of the tertiary industry was adopted to measure industrial structure. Total energy consumption was selected to represent energy utilization. The number of operating public transport vehicles was used to measure green travel. The total road freight volume was employed to characterize transportation structure. Technological R&D was measured by the ratio of science and technology expenditure to the general financial budget.
The driving factors are given in Table 1.

4.4.2. Model Setting

The GTWR model is a commonly used tool for analyzing the spatial heterogeneity of influencing factors [58,59]. By introducing a temporal dimension to the conventional GWR framework, the GTWR model can capture dynamic variations in parameter estimates across space and time [60]. Accordingly, this study used the GTWR model to investigate the effects of driving factors on the synergy of PR and CM in the BTH urban agglomeration and reveal their spatiotemporal heterogeneity. According to Huang et al. [60], the GTWR model can be expressed as:
y i = β 0 u i , v i , t i + k = 1 m β k u i , v i , t i X i k + ε i
where yi is the dependent variable, Xik is the kth explanatory variable in the ith city, m is the number of explanatory variables, u i , v i , t i represents the time–space coordinates of the ith city, β 0 u i , v i , t i is the regression constant, β k u i , v i , t i denotes the regression coefficient, and ε i is the error term.

4.5. Data Sources

Carbon and air pollutant emissions (PM2.5, PM10, SO2, and NOx) were obtained from the Emissions Database for Global Atmospheric Research (EDGAR), which provides gridded data at a 0.1° × 0.1° resolution. EDGAR data have been widely used in global and regional emission studies, providing a consistent basis for cross-regional comparison [21]. The emission values for the BTH urban agglomeration were extracted from these grids by using ArcGIS 10.6 software. The data for the explanatory variables were from the Wind database, the China City Statistical Yearbook, the China Urban Construction Statistical Yearbook, and statistical yearbooks of relevant cities. Missing data were supplemented via interpolation methods.

5. Results and Discussion

5.1. Spatiotemporal Evolution of Air Pollutant and Carbon Emissions

5.1.1. Temporal Dynamic Change

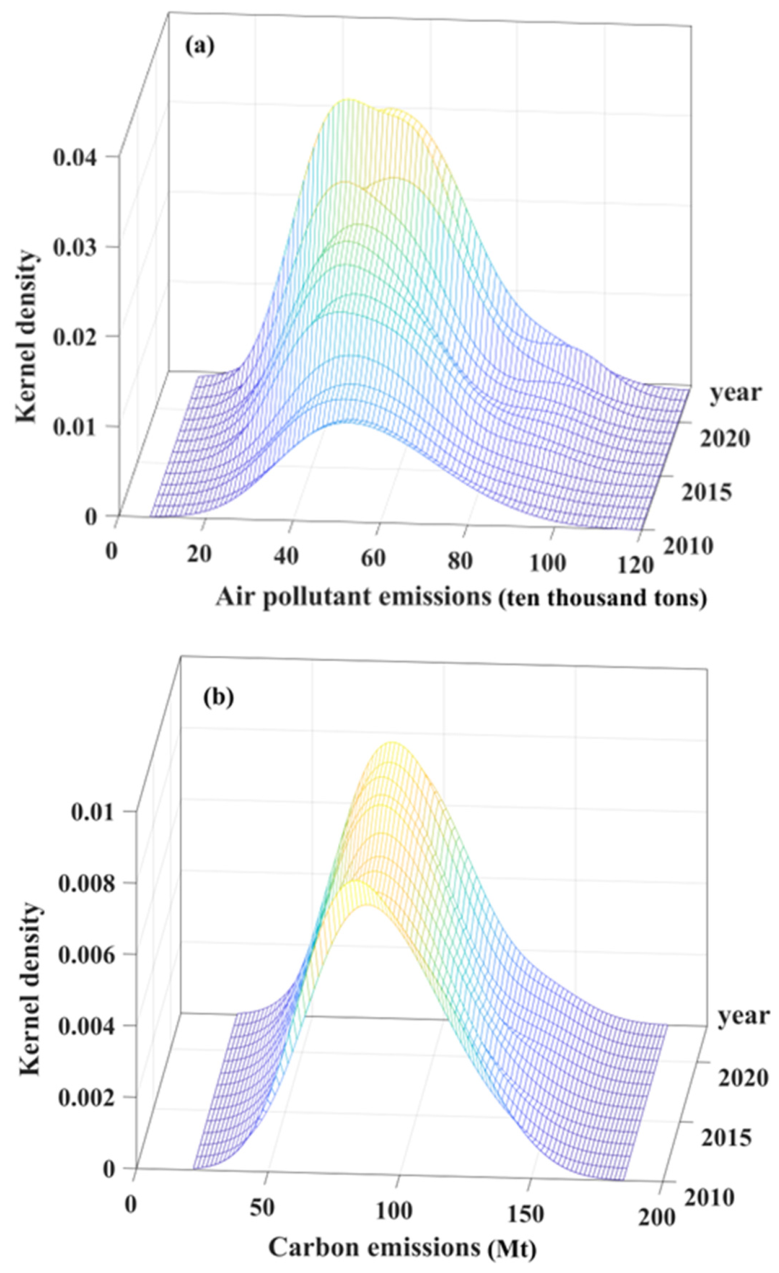
On the basis of the kernel density estimation method, this study employed MATLAB R2021a to plot the kernel density curves of air pollutant and carbon emissions in the BTH urban agglomeration from 2010 to 2023, as shown in Figure 2.
As presented in Figure 2a, the kernel density curves of air pollutant equivalent exhibited a main peak primarily within the range of 40–60 ten thousand tons throughout the study period. Over time, this peak progressively shifted leftward, reflecting a sustained decline in regional air pollutant emissions. Concurrently, the main peak became increasingly sharp and high, indicating that the distribution of air pollutant emissions became highly concentrated and that intercity disparities gradually narrowed. Moreover, the single peak distribution characteristic suggests an absence of pronounced polarization in urban air pollutant emission levels.
In terms of carbon emissions (Figure 2b), the main peak was concentrated within the 80–90 Mt range and shifted rightward over time, reflecting an increase in carbon emission levels. The peak broadened, and its height followed a decline-then-rise pattern, indicating a gradual widening of intercity differences. The unimodal nature further suggests that carbon emissions have not yet evolved into a pronounced multipolar distribution.
Figure 2a,b show a clear divergence in distributional dynamic change. This divergence may be attributed to the heterogeneous effects of environmental policies across air pollutant emissions and carbon emissions. Over the long term, air pollution control has remained a key priority in China’s environmental governance. Between 2013 and 2023, China introduced a series of air pollution prevention and control policies, and the BTH region also implemented a coordinated regional air pollutant joint prevention and control mechanism. The effective implementation of these policies has significantly reduced air pollutant emissions and, to some extent, promoted convergence in regional environmental governance. However, although these policies also exhibit certain co-benefits for carbon reduction, carbon emissions remain strongly constrained by economic growth and the energy structure, resulting in a relatively lagged process of carbon emissions reduction.

5.1.2. Spatial Distribution Characters

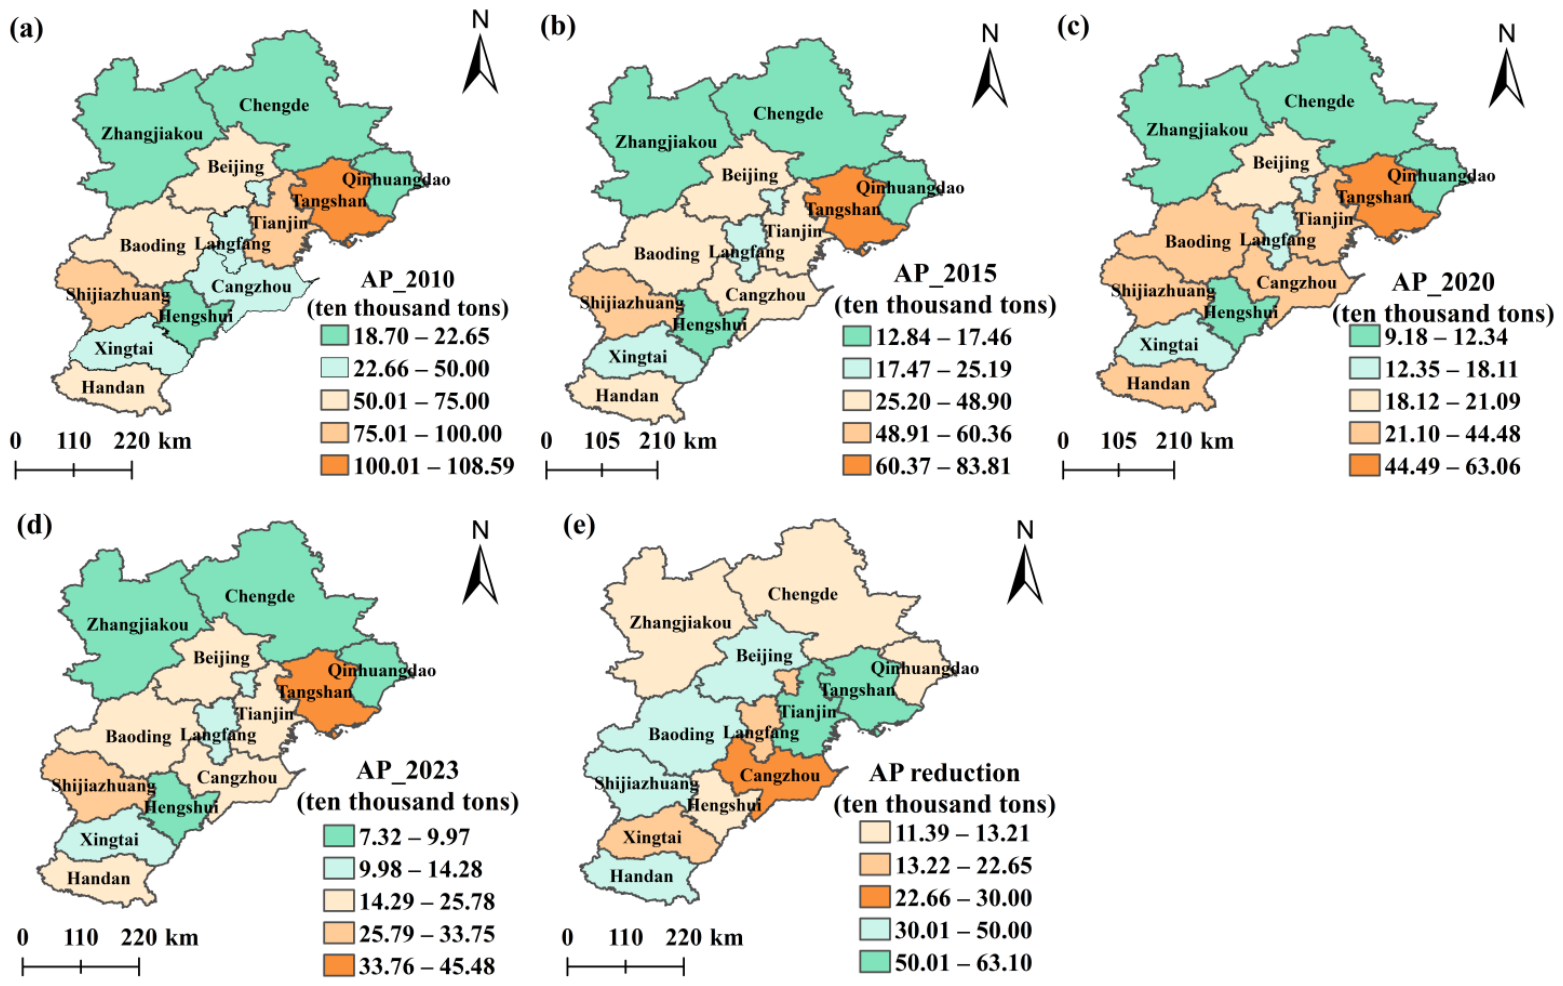
As shown in Figure 3a–d, the spatial distribution of air pollutant emissions in the BTH urban agglomeration remained stable over time. Tangshan consistently recorded the highest emission levels, followed by Shijiazhuang. Their high-level emissions were largely due to the reliance on energy-intensive industries, such as steel and petrochemicals. By contrast, cities in northern Hebei and Hengshui maintained low emission levels, accounting for only 0.16–0.20 times those of Tangshan, thereby forming a stable low-emission cluster. This phenomenon is largely attributable to their small share of heavy industry and their ecological functional positioning. Figure 3e shows that the air pollutant emissions declined markedly across all the cities during the study period. Tangshan and Tianjin experienced the most pronounced reductions, both exceeding 50 ten thousand tons, whereas northern cities and Hengshui witnessed small decrements that ranged from 11.39 ten thousand tons to 13.21 ten thousand tons. This result suggests that cities with high initial emission levels tend to achieve good emission reduction outcomes.
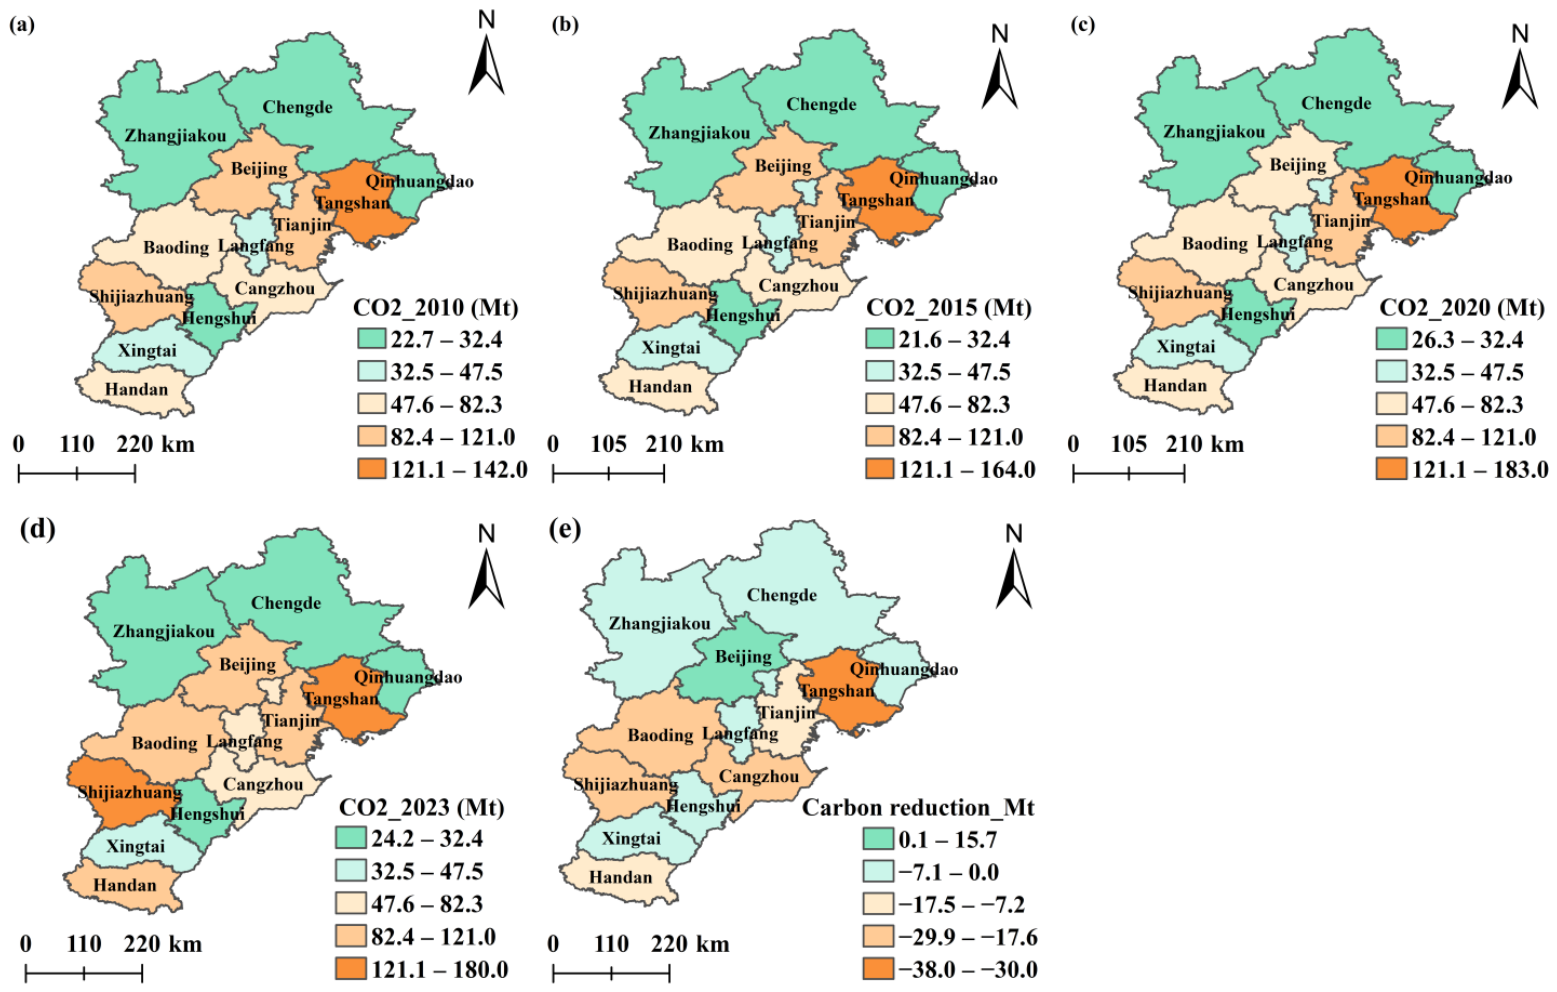
Figure 4a–d show that the spatial distribution pattern of carbon emissions closely paralleled that of air pollutant emissions. From 2010 to 2023, Tangshan exhibited the highest carbon emission, reaching a peak of 183 Mt. Tangshan was followed by economically developed cities, such as Beijing, Tianjin, and Shijiazhuang, where carbon emissions also remained high (all exceeding 82.3 Mt). In Hengshui, Xingtai, and cities in northern Hebei, the carbon emissions were low, ranging from 22.7 Mt to 47.5 Mt, accounting for only 0.12–0.26 times those of Tangshan. Figure 4e illustrates that the changes in carbon emissions across the cities in the BTH urban agglomeration exhibited pronounced divergence between 2010 and 2023. Beijing experienced a substantial decrease, with a cumulative reduction of 15.7 Mt, reflecting progress in its low-carbon transition. By contrast, the other cities showed varying degrees of emission growth. Tangshan demonstrated the largest increase, reaching 38 Mt, highlighting the remarkable carbon reduction challenges faced by heavy industry-dominated cities. Northern Hebei cities as well as Langfang, Xingtai, and Hengshui experienced modest increments (below 7.1 Mt). These patterns suggest that cities with high initial carbon emissions tend to exhibit high absolute growth in emissions.

5.2. Synergistic Effect of Pollution Reduction and Carbon Mitigation

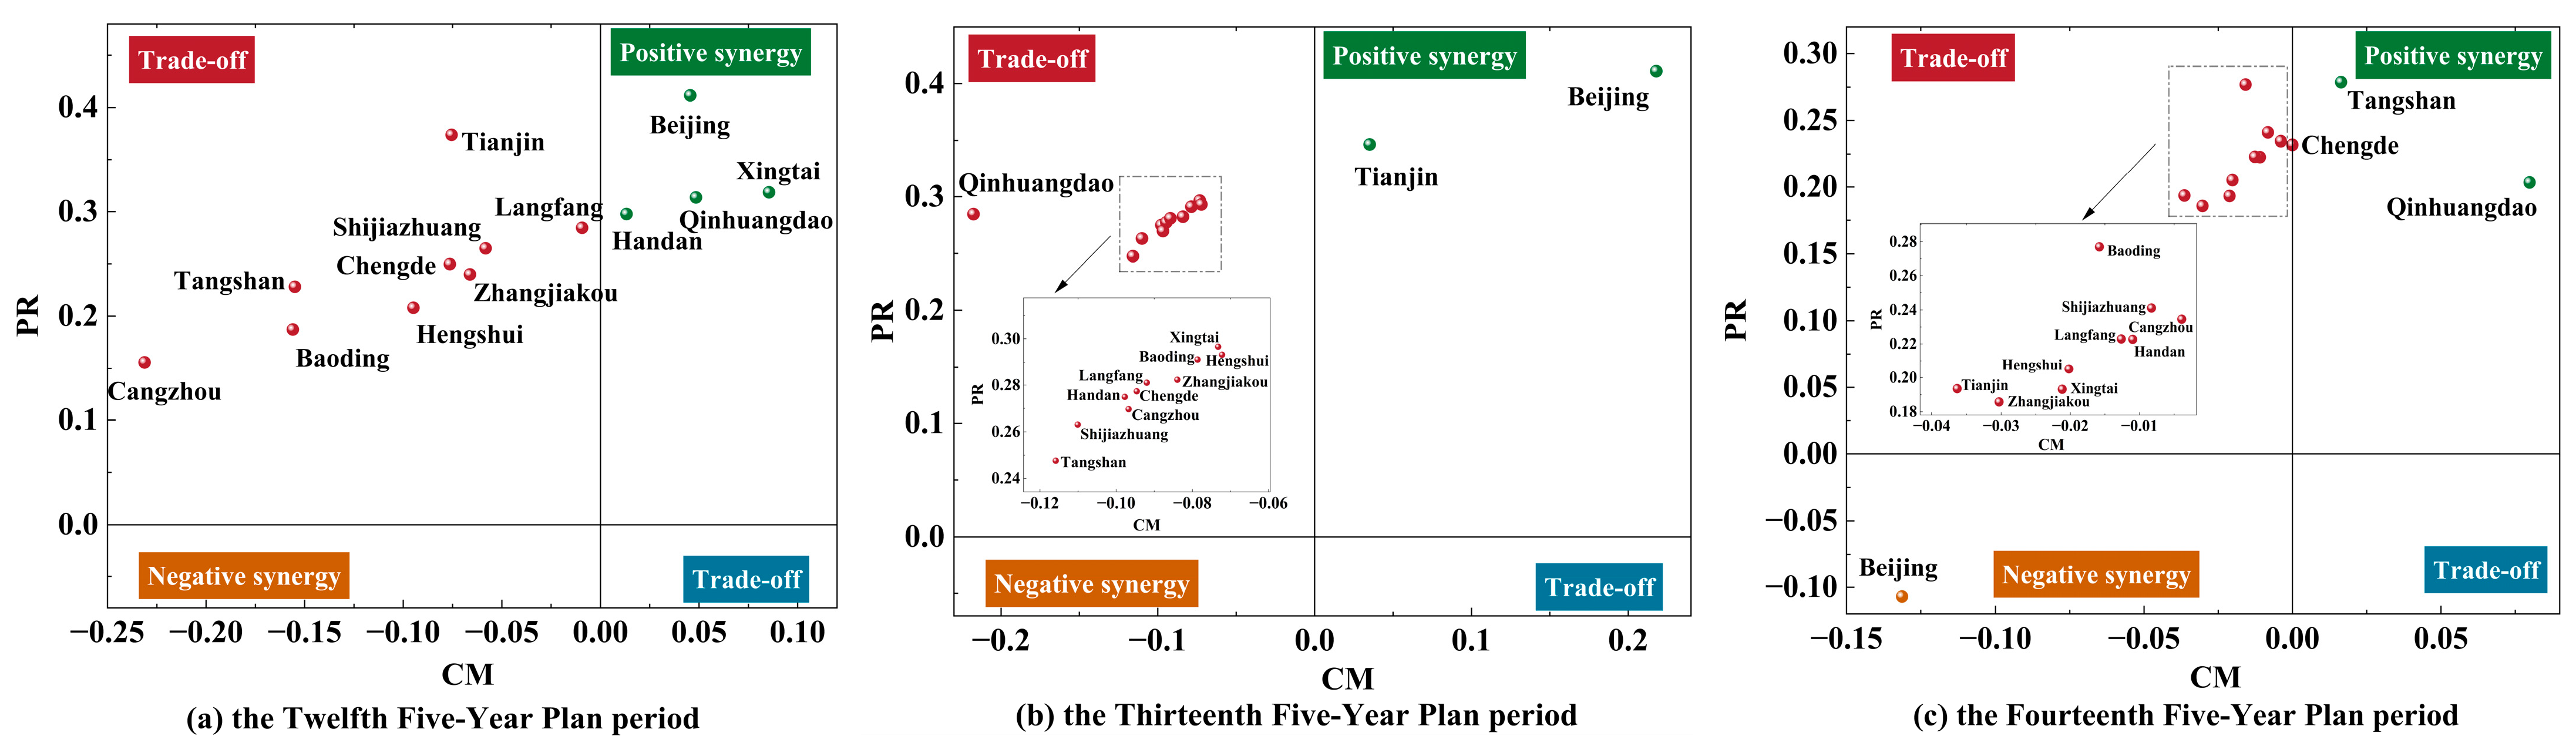
This study explored the dynamic evolution of the synergistic effect between PR and CM across three major phases: the 12th, 13th, and 14th Five-Year Plan periods. CCECS analysis (Figure 5) and the synergistic degree (Table 2) revealed that across the 12th, 13th, and 14th Five-Year Plan periods, the BTH urban agglomeration showed a clear evolutionary trajectory in the synergy between PR and CM, transitioning from tradeoffs to coordination.
During the 12th Five-Year Plan period, Beijing, Qinhuangdao, Xingtai, and Handan were located in the first quadrant, indicating simultaneous reductions in air pollutant and carbon emissions, and the remaining cities were scattered in the second quadrant, distant from the axes. Correspondingly, the synergistic degree varied widely. Xingtai (0.866), Qinhuangdao (0.807), Beijing (0.781), and Handan (0.738) possessed a high synergistic degree, and Cangzhou (−0.191), Baoding (0.090), and Tangshan (0.188) exhibited low or negative synergy. This pattern indicates that pollution reduction was the primary policy focus, and stable synergy between PR and CM had yet to emerge. This phenomenon can be attributed to policy and technological constraints. Environmental governance during this period primarily centered on air pollution control, whereas carbon emissions had not yet been subjected to binding constraints, leading to tradeoffs between the two objectives. Meanwhile, the end-of-pipe measures successfully reduced air pollutants, and their effect on controlling carbon emissions remained limited. Notably, traditional industrial cities, such as Xingtai and Han-dan, which faced severe air pollution, exhibited high marginal environmental benefits from policy interventions, achieving a certain degree of synergy between PR and CM.
During the 13th Five-Year Plan period (Figure 2b), Beijing and Tianjin moved into the first quadrant, achieving synergy between PR and CM, whereas cities in Hebei Province remained in the second quadrant, corresponding to a “pollution reduction but carbon increase” stage. Compared with the situation in 12th Five-Year Plan period, the number of cities achieving synergistic emission reduction decreased, displaying an overall pattern of “core cities leading, peripheral cities lagging.” Beijing and Tianjin leveraged industrial upgrading and digital technologies to enhance energy utilization efficiency, enabling simultaneous declines in carbon and pollutant emissions. By contrast, most Hebei cities remained dominated by energy-intensive and high-emission sectors, such as steel, cement, and chemicals. The slow pace of industrial restructuring in these cities caused CM to lag behind PR, thereby sustaining the “pollution reduction but carbon increase” development pathway. The synergistic degree confirmed this trend. Beijing (0.956) and Tianjin (0.775) exhibited increased synergy, Cangzhou’s synergy increased to positive, and Qinhuangdao and Handan experienced temporary declines.
By the 14th Five-Year Plan period, under the guidance of the dual-carbon targets, Qinhuangdao and several resource-dependent cities, such as Tangshan and Chengde, achieved a transition from “PR but carbon increase” to “PR and CM” through capacity reduction and green transformation. Their synergistic degrees exceeded 0.7, reflecting the substantial improvements. By contrast, Beijing experienced a short-term rebound in emissions, with its synergistic degree sharply declining from 0.956 to −0.995, indicating temporary negative synergy between PR and CM driven by economic recovery and rising energy demand. Other cities in Hebei remained in the second quadrant but shifted toward the first quadrant eventually, with their synergistic degrees exceeding 0.6, demonstrating that with ongoing structural adjustment and technological progress, the synergistic effect of PR and CM is gradually forming and strengthening. These findings indicate that the BTH urban agglomeration is progressing from fragmented and pollution-focused governance toward coordinated and multiobjective environmental management.

5.3. Spatiotemporal Heterogeneity of Driving Factors

5.3.1. Variable Testing and Model Comparation

Prior to model estimation, the multicollinearity among the explanatory variables should be tested. The variance inflation factor (VIF) is a widely used measure to detect multicollinearity among variables, with the most common value of 10 [61]. VIF greater than 10 indicates severe multicollinearity. As presented in Table 3, all VIF values are well below the commonly accepted threshold, with a mean value of 5.27, indicating no serious multicollinearity. Therefore, the regression estimates are unlikely to be distorted by collinearity issues, ensuring the robustness and reliability of the regression results.
Three regression models, namely, ordinary least squares (OLS), GWR, and GTWR, were implemented in ArcGIS 10.6 software to determine the appropriate model. The model fitting results are summarized in Table 4. Compared with OLS and GWR, the GTWR model achieved higher R2 and lower AICc, demonstrating it characterized the spatiotemporal heterogeneity of the explanatory variables more effectively. Therefore, the GTWR model was employed to examine the spatiotemporal variations of the driving factors of PR and CM in the BTH urban agglomeration.

5.3.2. Temporal Variation of Driving Factors

(1) Economic development
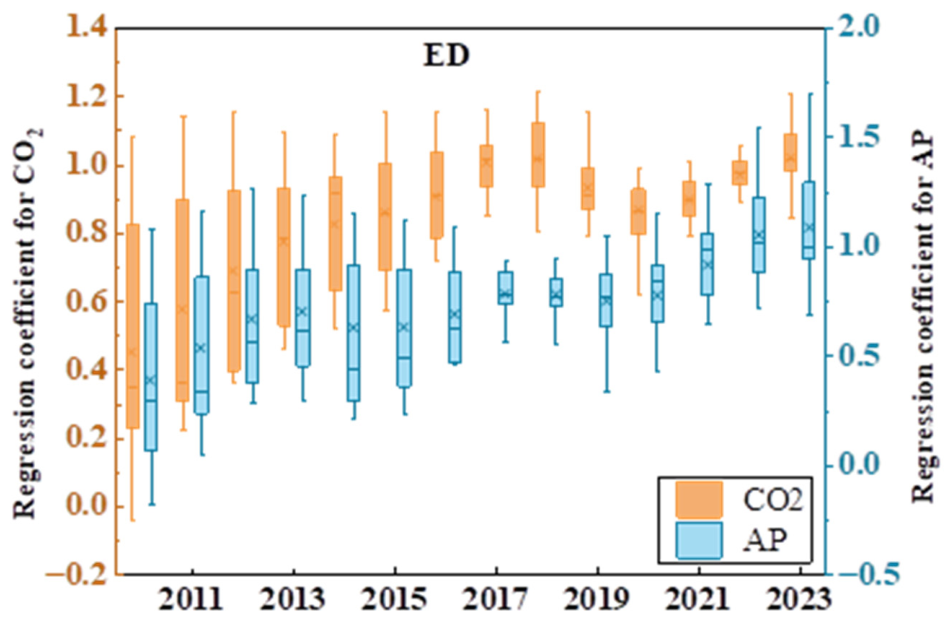
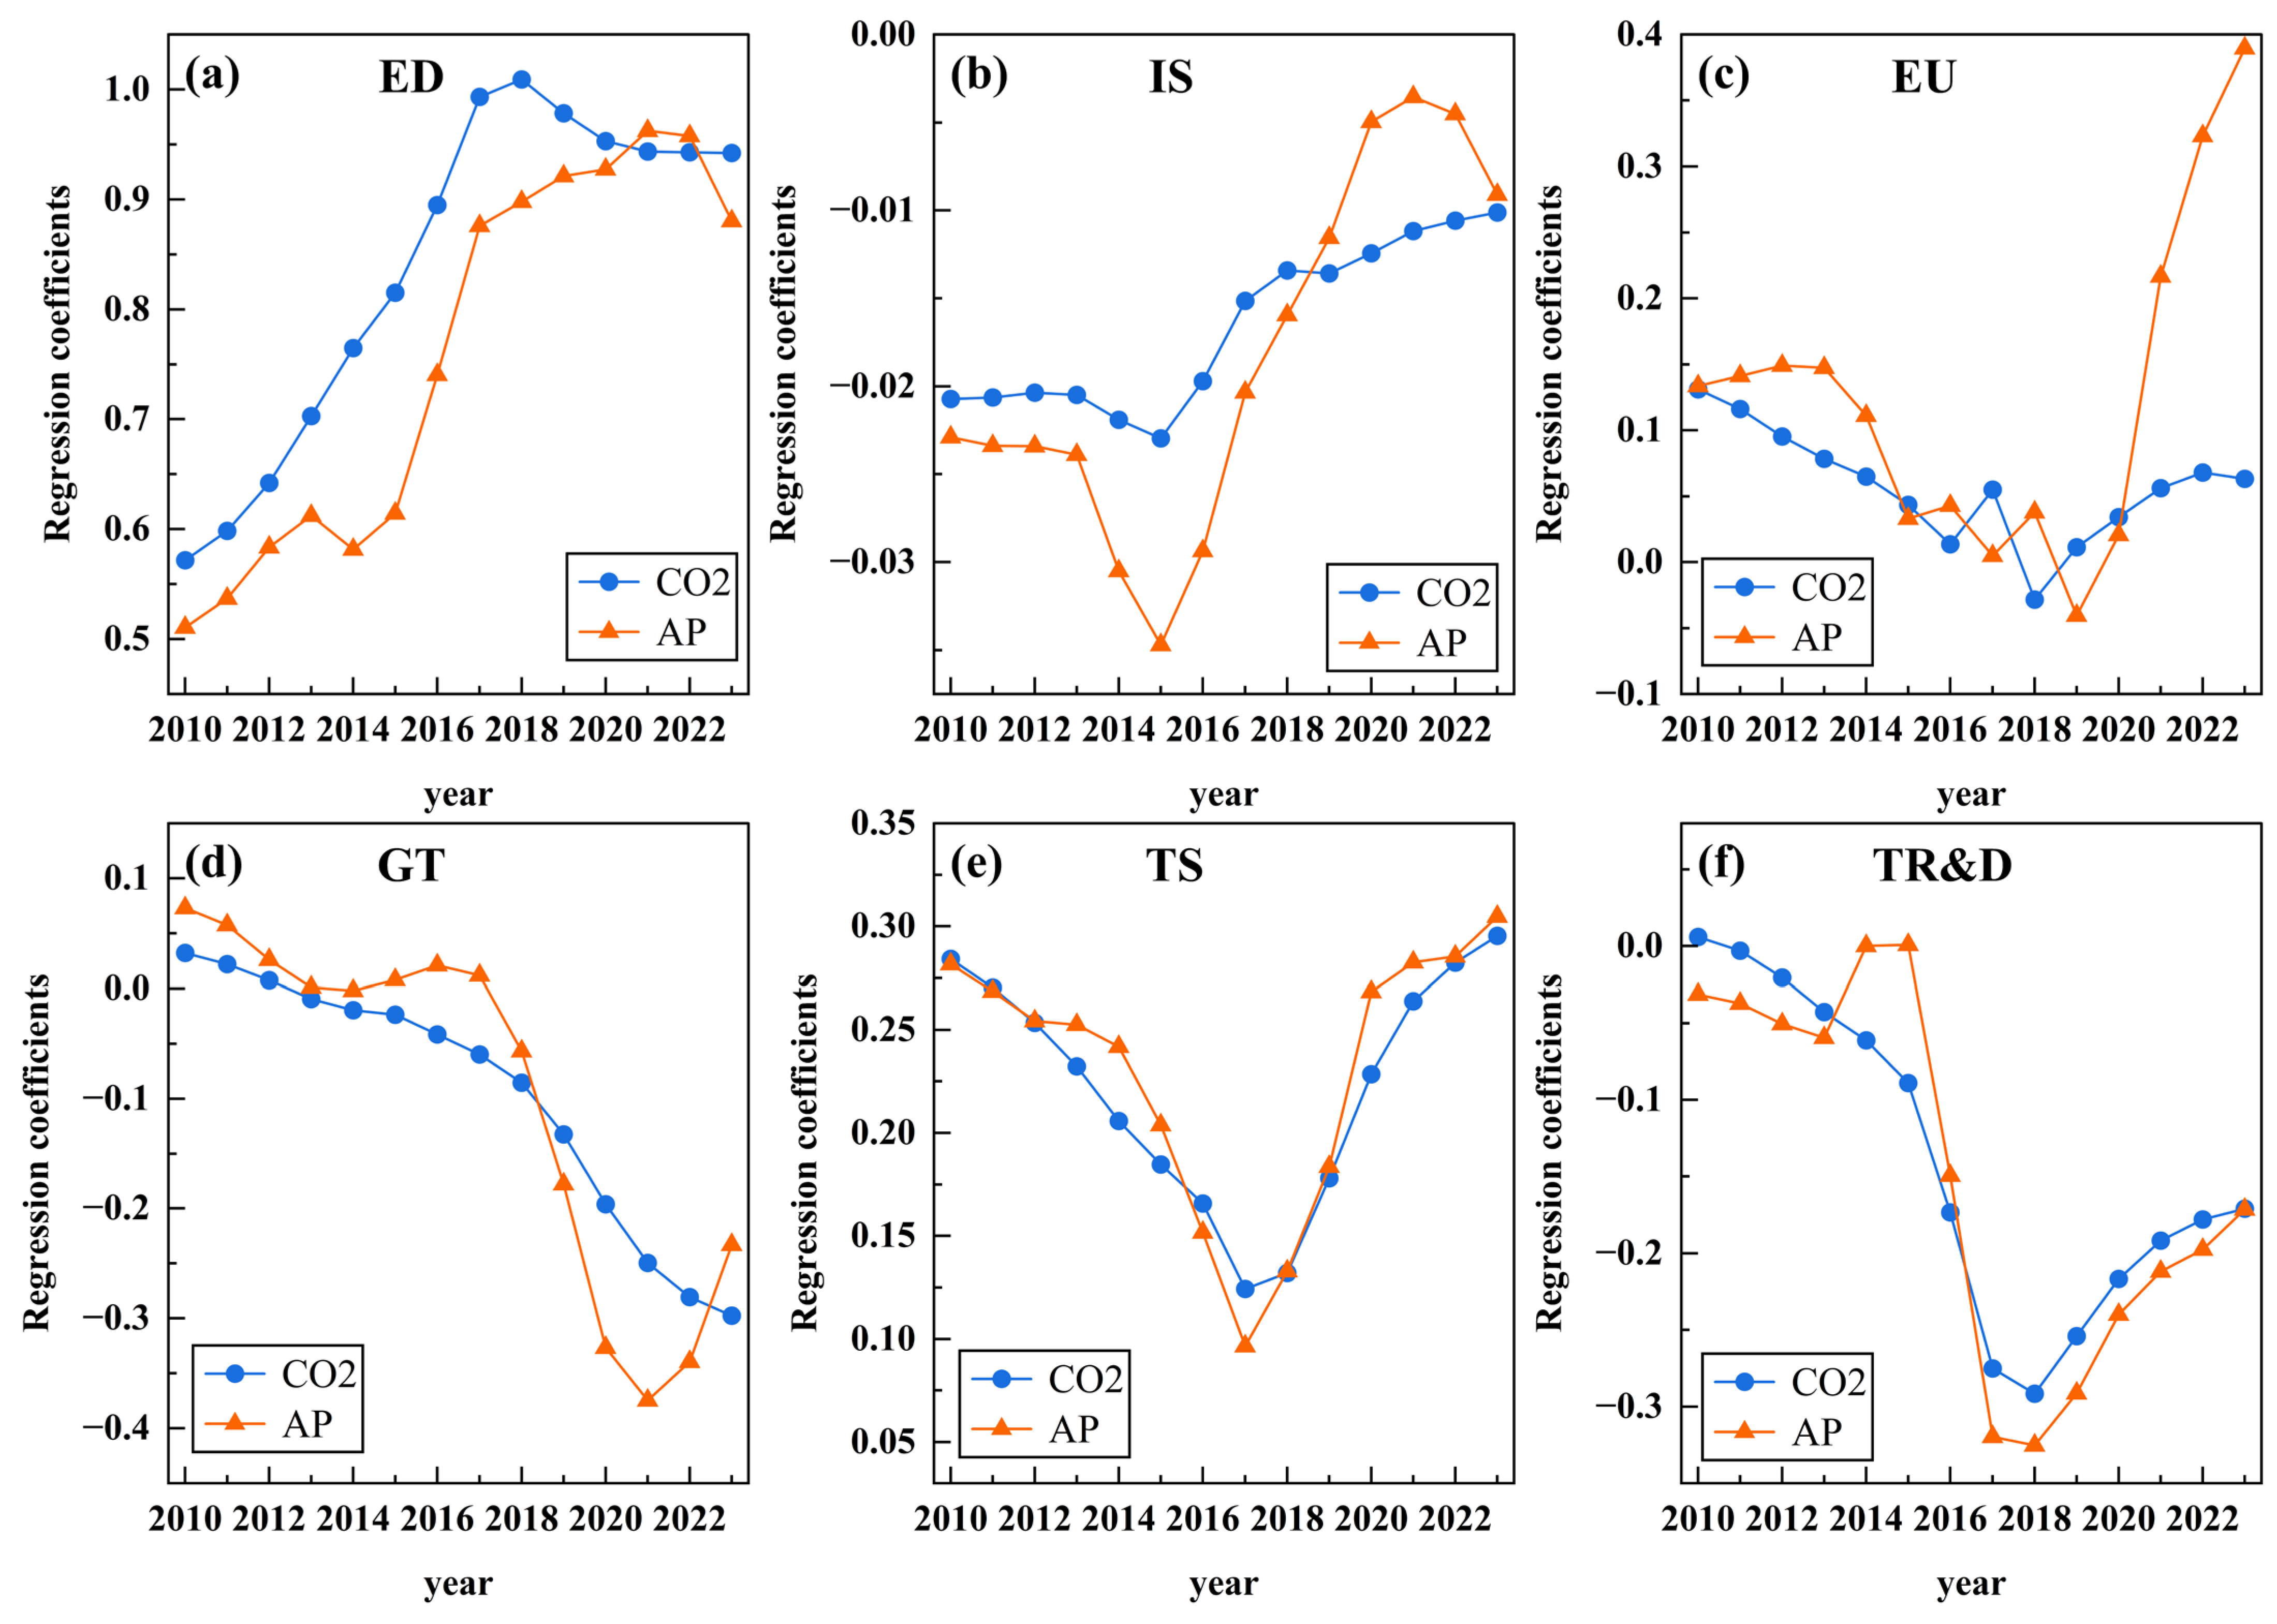
Figure 6 illustrates the temporal variation of the regression coefficient of economic development. The results indicate that throughout the study period, economic development exerted a remarkable positive effect on carbon and air pollutant emissions. This finding is generally consistent with those of previous studies [62], which suggested that economic growth may hinder the improvement of the synergy level of PR and CM. In the BTH urban agglomeration, economic development still relies heavily on energy-intensive production activities. The rapid expansion of the economic scale has caused increased energy consumption, leading to high levels of regional carbon and air pollutant emissions. Therefore, promoting green economic transformation is essential for achieving the synergistic effects of PR and CM.
From the perspective of temporal trends, although the positive driving effect of economic development persisted throughout the study period, its influence intensity weakened during 2018–2020 possibly because with the deepening of green development concepts and the strengthening of environmental regulations, the regional economic development model gradually shifted from extensive growth to an intensive, sustainable pattern, resulting in substantial improvements in energy efficiency. Meanwhile, regional industrial structure upgrading mitigated, to a certain extent, the negative effect of economic growth on emissions [63]. These findings provide empirical support for H1.
However, although the BTH region has achieved certain progress in green and low-carbon transition, absolute decoupling between economic growth and environmental pressure has not yet been realized. After 2021, the rapid recovery of economic activity and industrial production led to a notable rise in energy demand, further strengthening the promoting effect of economic development on carbon and air pollutant emissions. Therefore, future efforts should further promote the transformation of economic development from scale expansion to a green, low-carbon growth model.
(2) Industrial structure
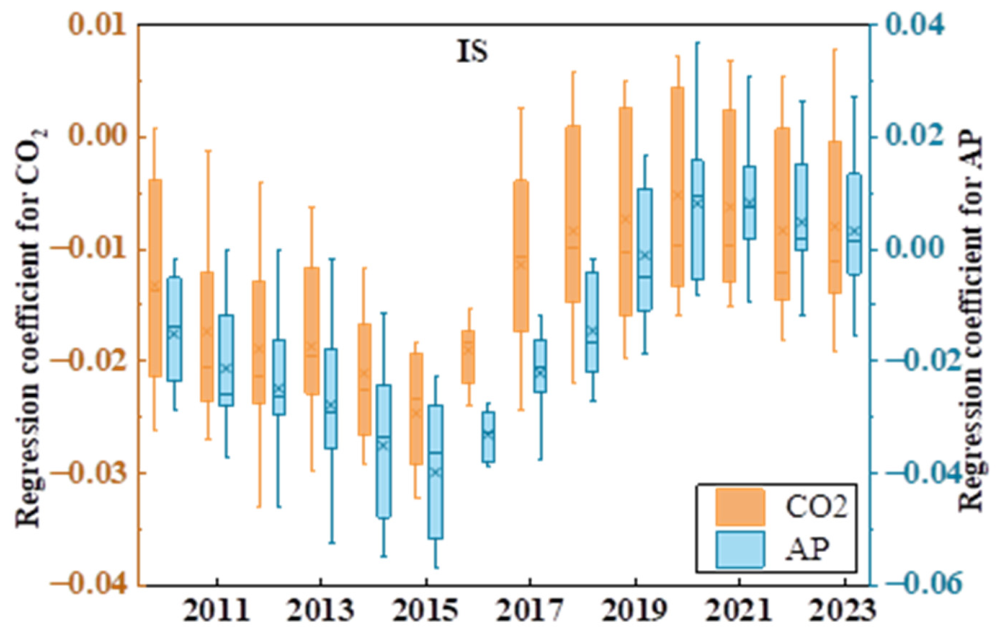
Figure 7 illustrates the temporal variation in the effect of industrial structure on carbon and air pollutant emissions. At the early stage of the study period, the influence coefficients of industrial structure on carbon and air pollutant emissions were negative, indicating that industrial structure optimization had emission reduction effects. Industrial structure optimization implies a gradual shift in economic development from the secondary sector, characterized by high energy consumption and high emissions, toward the low-emission tertiary sector. This transition helps reduce the dependence of economic development on resource-intensive industries [28,40], thereby mitigating carbon and air pollutant emissions at the source.
However, at the late stage of the study period, the inhibitory effect of industrial structure optimization on emissions weakened. A similar finding was also reported by Li and Zhou [64]. In some cities, the regression coefficients of industrial structure were positive, indicating that industrial structure exerted a promoting effect on carbon and air pollutant emissions in certain regions. This finding is consistent with the results reported by Zhang et al. [65]. A possible explanation is that at the initial stage of industrial structure adjustment, the process was mainly characterized by an increase in the proportion of the tertiary industry and a decrease in some high-energy-consuming and high-emission industries. At this stage, industrial structure adjustment generated a strong structural dividend effect, which could directly reduce energy consumption intensity and emission levels. However, as the industries that were easy to adjust gradually completed their transformation, the difficulty of pursuing further industrial structure optimization increased, and the corresponding emission reduction effects tended to weaken. Notably, the tertiary sector is not entirely composed of clean industries and still includes high-energy-consumption services. The expansion of traditional service sectors, such as transportation, the logistics industry, and consumer services, can lead to rapid increases in energy consumption and pollutant emissions, which may prevent industrial structure optimization from achieving the intended emission reduction effects [31]. Therefore, industrial structure adjustment should place great emphasis on green, low-carbon transformation within the service sector and focus on increasing the proportion of modern service and green industries. Overall, these findings provide partial support for H2.
(3) Energy utilization
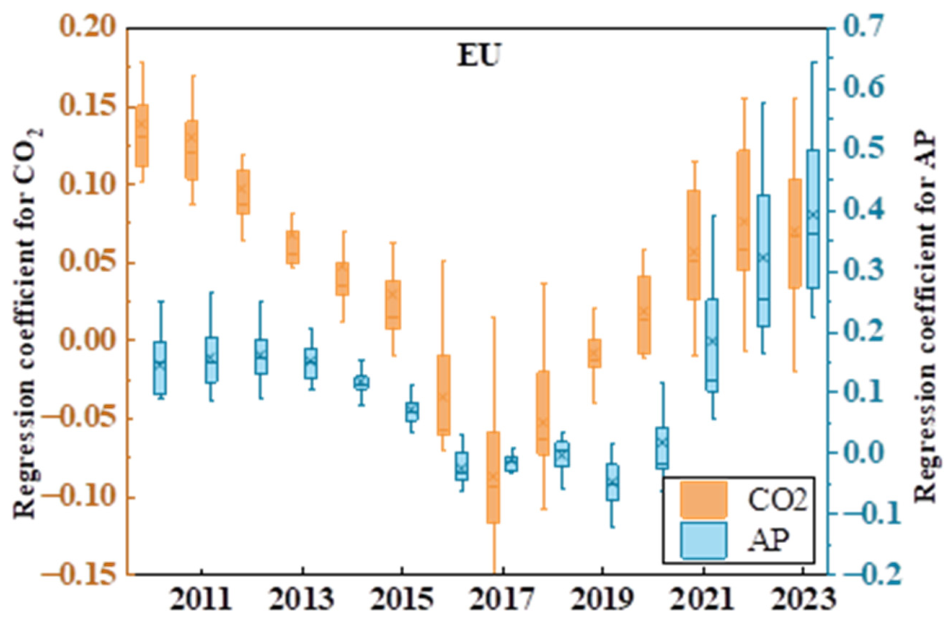
As shown in Figure 8, the regression coefficients of energy consumption were generally positive, indicating that energy consumption exerted a remarkable positive effect on carbon and air pollutant emissions. This finding is broadly consistent with those of previous studies emphasizing the dominant role of energy consumption in driving regional environmental pressure and carbon emissions [62]. An unreasonable energy structure is the key constraint on the synergistic effect of PR and CM [66]. As the primary source of air pollutants and greenhouse gases, fossil fuels still dominate the energy consumption structure in the BTH region. The growth of urban energy consumption directly leads to a simultaneous increase in carbon and air pollutant emissions.
Different from previous studies [9,67], this study revealed the temporal variation in the effect of energy consumption on PR and CM; the variation exhibited a pattern of initial decline followed by a subsequent increase. The decline in the regression coefficients can largely be attributed to the implementation of the Air Pollution Prevention and Control Action Plan. During the policy implementation period (2013–2017), the BTH urban agglomeration strengthened its control on total coal consumption and intensified the regulation of energy-intensive industries. By eliminating outdated production capacity and promoting projects that involved changing coal into gas and electricity, the BTH region achieved phased progress in controlling the growth of coal consumption. Meanwhile, stringent environmental regulations compelled enterprises to upgrade production technologies, thereby improving energy efficiency and reducing emissions. These combined measures mitigated, to some extent, the promoting effect of energy consumption on carbon and air pollutant emissions.
However, with the continued advancement of coal control policies, the potential for further reducing energy consumption gradually narrowed, and the marginal environmental benefits began to weaken. Given the continuous expansion of the regional energy demand, the scale effect of energy consumption once again became dominant. Although clean energy substitution continued to advance, it was not sufficient to fully offset the emission increases driven by economic expansion and additional energy consumption, leading to a rebound in the regression coefficients. On the whole, these findings provide strong support for H3, confirming that the expansion of energy utilization is detrimental to the synergy of PR and CM. This finding emphasizes the importance of energy transition and demonstrates that improving energy efficiency and expanding renewable energy utilization are critical pathways for coordinated pollution and carbon reduction.
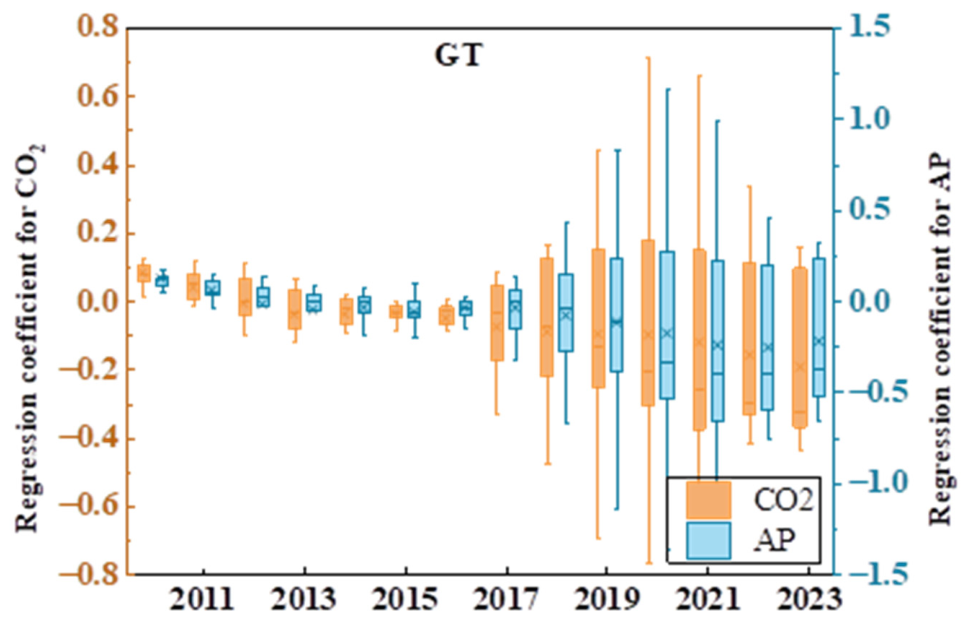
(4) Green travel
As shown in Figure 9, during the initial stage of the study period, the regression coefficients of green travel were predominantly positive, indicating that green travel exhibited certain increasing effects on carbon and air pollutant emissions at the early stage. Over time, however, the regression coefficients gradually became negative, suggesting that the synergistic effect of PR and CM of green travel progressively emerged and continuously strengthened.
This transition reflects the distinct stage characteristics of the effect of green travel on PR and CM. During the early stage of the study period, urban public transportation in the BTH region was still dominated by conventional diesel- and gasoline-powered vehicles. Although the expansion of public transportation improved transport service capacity, it also increased fuel consumption and exhaust emissions, generating a temporary emission-increasing effect. In addition, the early development of new-energy vehicles and green public transportation required substantial infrastructure investment and energy consumption, which may have further increased emissions in the short term.
However, as the green transportation system gradually matures, its long-term environmental benefits are expected to become increasingly remarkable, and the PR and CM effects of green travel will progressively emerge. The implementation of public transportation policies, such as oil-to-electricity and oil-to-gas transitions, has promoted the gradual replacement of conventional fuel vehicles with new- and clean-energy vehicles. The substitution of clean energy in public transportation has achieved synergistic reductions in carbon emissions and air pollutants [68]. Moreover, the continuous improvement in urban public transportation networks and the growing public acceptance of green travel concepts have further strengthened the substitution effect of public transportation on high-carbon travel modes, such as private motor vehicles. Therefore, the empirical results generally support H4, which posits that green travel can promote the synergistic effects of PR and CM.
Although transportation electrification can reduce vehicle exhaust emissions, some pollutants may be shifted to the power generation sector [69]. Therefore, the clean level of the urban power system directly affects the synergistic effects of PR and CM of public transportation electrification [47]. This situation also explains why the synergistic effects of green travel on PR and CM have not yet been fully realized in some cities. Therefore, while continuously advancing transportation electrification of public transportation, extensive efforts should be made to accelerate the development of a clean energy-dominated power system to fully realize the synergistic effects of green travel on PR and CM.
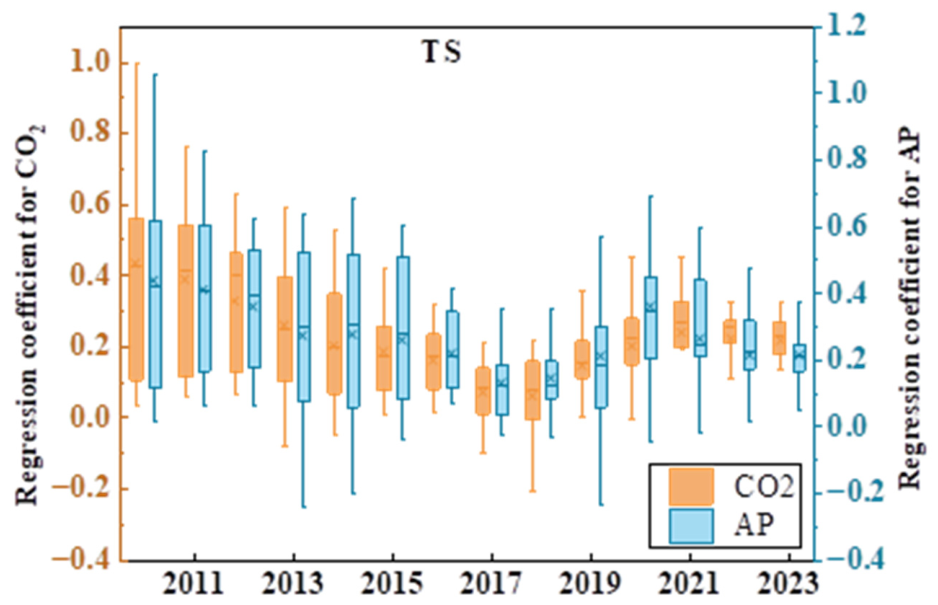
(5) Transportation structure
As shown in Figure 10, the regression coefficients of transportation structure were predominantly positive, indicating that the transportation system dominated by road freight transport substantially promoted the increase in carbon and air pollutant emissions. In the BTH urban agglomeration, industries, such as steel production, equipment manufacturing, and port logistics, are highly concentrated, generating substantial demand for large-scale interregional freight transportation. Given the high energy consumption intensity of road freight transport, its emissions per unit of freight turnover are very high [70]. Consequently, a transportation structure dominated by road freight intensifies energy consumption and further increases carbon and air pollutant emissions, exerting a remarkable negative effect on the coordinated governance of PR and CM in the region. These findings provide empirical support for H5, confirming that transportation structure exerts a notable influence on PR and CM. These findings also confirm that reducing the proportion of road freight transportation and optimizing the transportation structure can promote PR and CM.
Overall, the regression coefficients of the transportation structure showed a downward trend, indicating that its promoting effect on carbon and air pollutant emissions is gradually weakening. This change can be attributed to technological progress and policy interventions. First, advances in intelligent transportation systems and optimized logistics management have improved overall transport efficiency and reduced empty-load rates, considerably lowering emission intensity per unit of freight turnover. Second, initiatives, such as the road-to-rail modal shift and multimodal transportation, have effectively reduced carbon and air pollutant emissions [71]. This highlights the practical necessity of promoting multimodal transportation systems and increasing the proportion of railway freight transport.
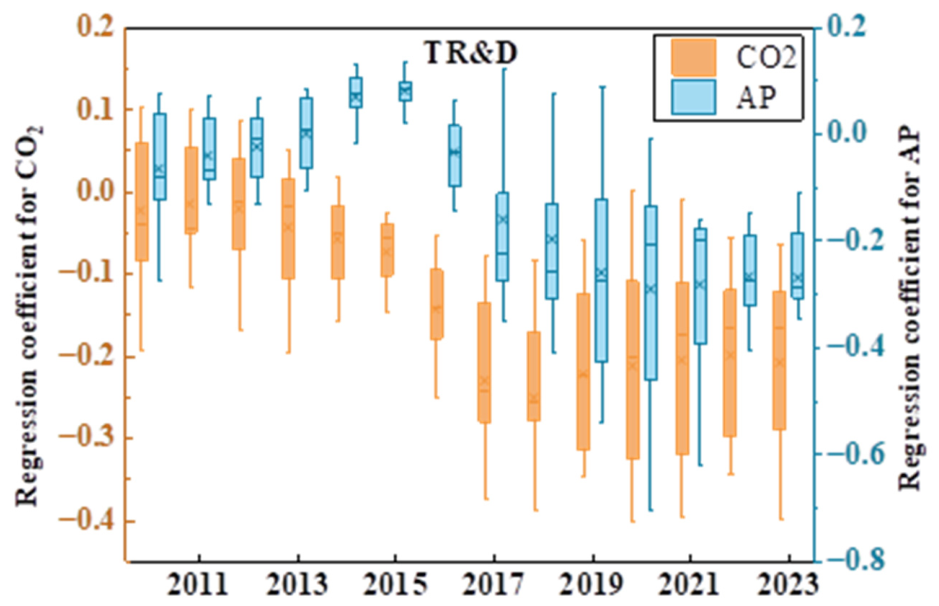
(6) Technology R&D
As shown in Figure 11, the effects of technological R&D on carbon and air pollutant emissions exhibited clear stage-specific characteristics. During the early study period (2010–2014), the regression coefficients of the influence of technological R&D on carbon and air pollutant emissions fluctuated between positive and negative values, indicating that the effects of technological R&D on PR and CM were unstable. In some regions, technological R&D even showed certain emission-increasing effects. This phenomenon is mainly related to the investment structure of technological R&D and the transformation of research achievements at the early stage. During the early study period, technological R&D activities in the BTH region were primarily oriented toward industrial expansion and economic growth. Under such circumstances, although technological progress improved production efficiency, it also generated an energy rebound effect through the expansion of the production scale, thereby exerting a positive promoting effect on carbon and air pollutant emissions. This finding is consistent with that of Jiang et al. [31]. Moreover, the low efficiency of R&D resource allocation and the insufficient capacity for transforming scientific and technological achievements in some regions weakened the emission reduction effects of technological R&D to a certain extent.
After 2015, the influence of technological R&D on carbon emissions became negative, and the effect on air pollutant emissions became predominantly negative, indicating that the emission reduction effects of technological R&D had gradually emerged. After 2020, all regression coefficients became negative, suggesting that the positive influence of technological R&D on the synergistic effects on PR and CM had become stable and substantial. The reason for this change is that with the gradual improvement of the green technology system, technological innovation was redirected toward clean production, energy substitution, and other low-carbon technologies. The strengthened development and application of green technologies considerably improved energy use efficiency, enabling reductions in carbon and air pollutant emissions at the source. In addition, increased investment in technology R&D stimulated the rapid development of emerging industries, such as clean energy, energy conservation, and environmental protection, which further enhanced the synergistic effects of PR and CM.
Overall, the inhibitory effects of technological R&D on air pollutant and carbon emissions exhibited a certain time lag. The long-term emission reduction effects were remarkable. This conclusion is generally consistent with those of previous studies [72]. The empirical results generally support H6, which posits that technological R&D can promote the synergistic effects of PR and CM, although such positive effects tend to materialize over the long term through technological accumulation, diffusion, and industrial application. Thess findings suggest that long-term and targeted support for green innovation is crucial for achieving sustainable environmental benefits.

5.3.3. Spatial Heterogeneity of Driving Factors

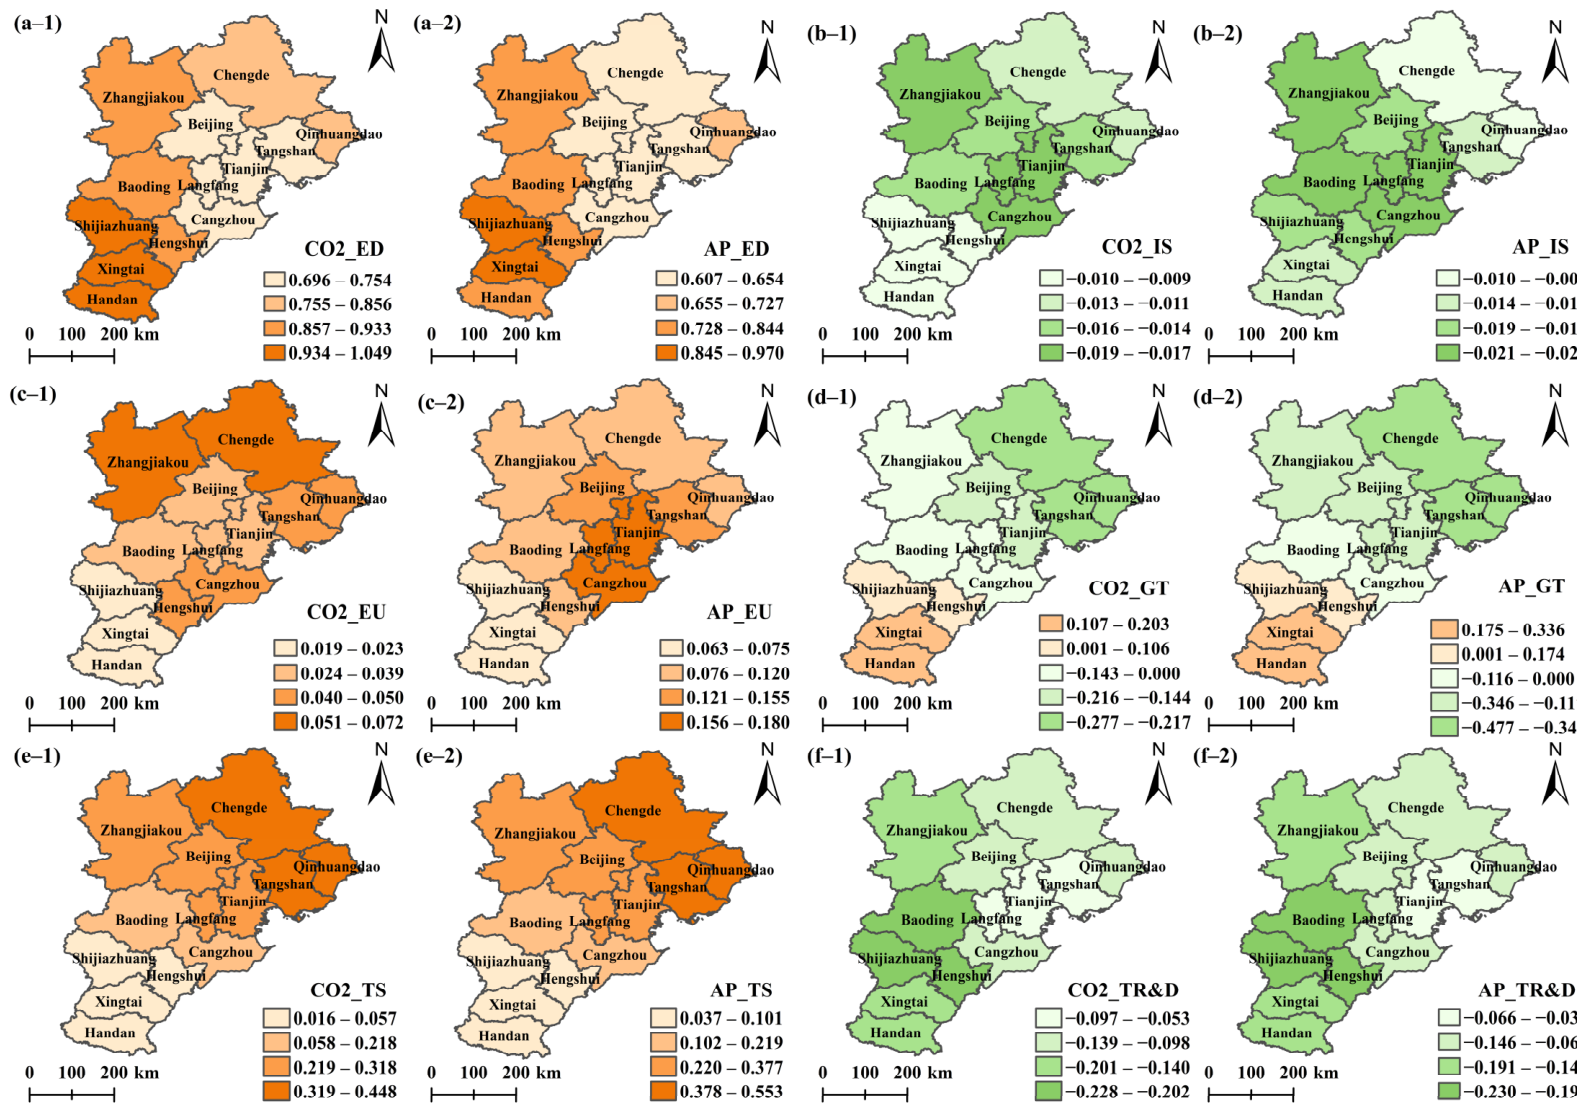
The spatial distribution of the mean regression coefficients for each factor over the study period was mapped using ArcGIS 10.6, as shown in Figure 12, to investigate the spatial heterogeneity of the effects of driving factors on PR and CM in the BTH urban agglomeration.
(1) Economic development
Figure 12a indicates that the promoting effect of economic development on carbon and air pollutant emissions in the BTH urban agglomeration demonstrates a spatial distribution characteristic of strong effects in southern cities and weak effects in eastern cities. This pattern is closely related to the differences in development stages, industrial structures, and functional orientations across cities. In southern cities, such as Shijiazhuang, Xingtai, and Handan, economic growth is heavily dependent on chemicals, cement, steel and other energy-intensive industries, resulting in a strong coupling between growth and emissions. By contrast, in Beijing, Tianjin, and Langfang, economic development is primarily driven by high-value-added services and high-tech manufacturing, with limited dependence on high-emission sectors. Chengde, as an important ecological support area, focuses on the development of tourism and green agriculture, with a small scale of high-energy and high-emission industries, leading to a weak stimulative effect of economic growth on emissions.
Tangshan also shows a comparatively modest effect. Although heavy industries remain dominant, Tangshan’s development pattern is gradually shifting from scale-driven expansion to upgrading toward high-end industrial and value chains. This transition promotes quality-oriented development and enhances resource use efficiency. Its robust economic base further supports R&D activities and large-scale deployment of green technologies, enabling firms to accelerate technological innovation, reduce pollutant and carbon intensity, and strengthen environmental performance.
(2) Industrial structure
Figure 12b shows that the emission reduction effect of industrial structure optimization displays a spatial pattern of strong in the central cities and weak in the northern and southern area. In core cities, such as Beijing and Tianjin, the share of service and high-tech industries has steadily risen, and traditional energy-intensive sectors have undergone upgrading or accelerated their exit. This greening of the industrial structure effectively reduces air pollutant and carbon emissions, enhancing the synergistic effect of PR and CM. Surrounding cities, including Langfang, Baoding, Cangzhou, and Zhangjiakou, leverage their proximity to the core areas to attract industrial transfers and technology spillovers, extend the industrial chain, and facilitate green industry clusters and clean technology adoption, further strengthening the emission reduction benefits of industrial structure optimization. By contrast, northern cities, such as Chengde and Qinhuangdao, constrained by resource endowments and development orientation, have limited scope for industrial upgrading, leading to modest emission reduction effects. Similarly, southern cities, including Handan, Xingtai, and Hengshui, remain dominated by steel, building materials, and other traditional industries, with slow industrial transformation that constrains the effectiveness of structural adjustments in controlling emissions.
(3) Energy utilization
Figure 12c indicates that the promoting influence of energy utilization on carbon and air pollutant emissions shows spatial differentiation. In Chengde and Zhangjiakou, energy utilization has the greatest enhancing effect on carbon emission, whereas in Tianjin, Langfang, and Cangzhou, it most strongly drives air pollutant emissions. As the major power supply hubs for the BTH region, Zhangjiakou and Chengde are responsible for transmitting large-scale electricity to Beijing, Tianjin, and surrounding areas. During the power generation and transmission process, unavoidable energy losses reduce the overall energy efficiency and further increase the total carbon emissions. Moreover, the construction of green grids and renewable power generation infrastructure brings additional energy use, temporarily promoting carbon emissions. In the long term, however, increasing the share of clean energy and improving transmission efficiency can reduce the overall regional carbon emissions. Eastern coastal cities have a strong industrial base with high energy consumption, resulting in substantial industrial air pollutant emissions. Furthermore, frequent logistics and travel activities around the Beijing–Tianjin region increase vehicle exhaust emissions, further amplifying the promoting effect of energy consumption on air pollutant emissions.
(4) Green travel
As shown in Figure 12d, the effect of green travel on air pollutant and carbon emissions in the BTH urban agglomeration exhibits clear regional heterogeneity. In Shijiazhuang, Hengshui, Xingtai, and Handan, green travel temporarily increases emissions, whereas in other cities, it demonstrates a negative inhibitory effect. This divergence can be attributed to differences in policy implementation, technological development, and power sector structure. In these southern cities, green travel policies remain in a transitional phase with limited adoption of clean transport, and public transport systems still rely on fuel-based vehicles. This expansion of conventional public transport may temporarily increase fuel consumption and emissions. By contrast, in developed cities, the accelerated application of public transport electrification and intelligent transport systems has improved energy efficiency and reduced emission intensity per unit of transport service. Another factor is the cleanliness of the power supply. In Beijing, Tianjin, and northern Hebei, a large share of electricity is from clean electricity generated from Zhangjiakou and Chengde, helping lower the indirect emissions of public transport. In southern cities, electricity energy remains predominantly coal-based, generating hidden emissions from electric public transport, reducing the emission reduction benefits of green travel.
(5) Transportation structure
As shown in Figure 12e, the influence of transportation structure on air pollutant and carbon emissions presents a clear increasing spatial gradient pattern from south to north. This spatial heterogeneity likely reflects differences in transport demand intensity. Northern coastal and interprovincial cities, such as Qinhuangdao, Tangshang, and Chengde, experience dense freight activities and rely on heavy trucks for road transport, amplifying the promoting effects. Meanwhile, central inland cities with small transport volumes and predominantly intercity logistics face comparatively weak emission pressures from transportation activities. Moreover, Shijiazhuang, Handan, and Xingtai, historically the most polluted cities nationwide, are subject to strict environmental regulations. Strong and harsh diesel truck control measures have effectively reduced vehicular emissions, further mitigating the transport-related contribution to air pollutant and carbon emissions.
(6) Technology R&D
As shown in Figure 12f, technological R&D exerts a broadly negative effect on carbon and air pollutant emissions in the BTH urban agglomeration. In southern Hebei, R&D investment demonstrates a strong emission reduction effect mainly because these cities remain at an industrialization stage, where R&D activities focus on industrial process upgrading, and pollution treatment can directly enhance energy efficiency and reduce industrial emissions. A similar pattern was observed in Zhangjiakou, where R&D of renewable energy technologies further strengthens the mitigation effect. In eastern coastal cities, such as Tianjin and Tangshan, the emission reduction effect is weak. In these cities, technological progress, while improving production efficiency, is often accompanied by industrial scale expansion and increased energy demand, which can partially offset environmental benefits. These findings suggest that the effectiveness of R&D in achieving the synergistic effect of PR and CM depends not only on investment intensity but also on the direction of technological innovation.

5.4. Robustness Analysis

5.4.1. Addressing the Model Selection Problem

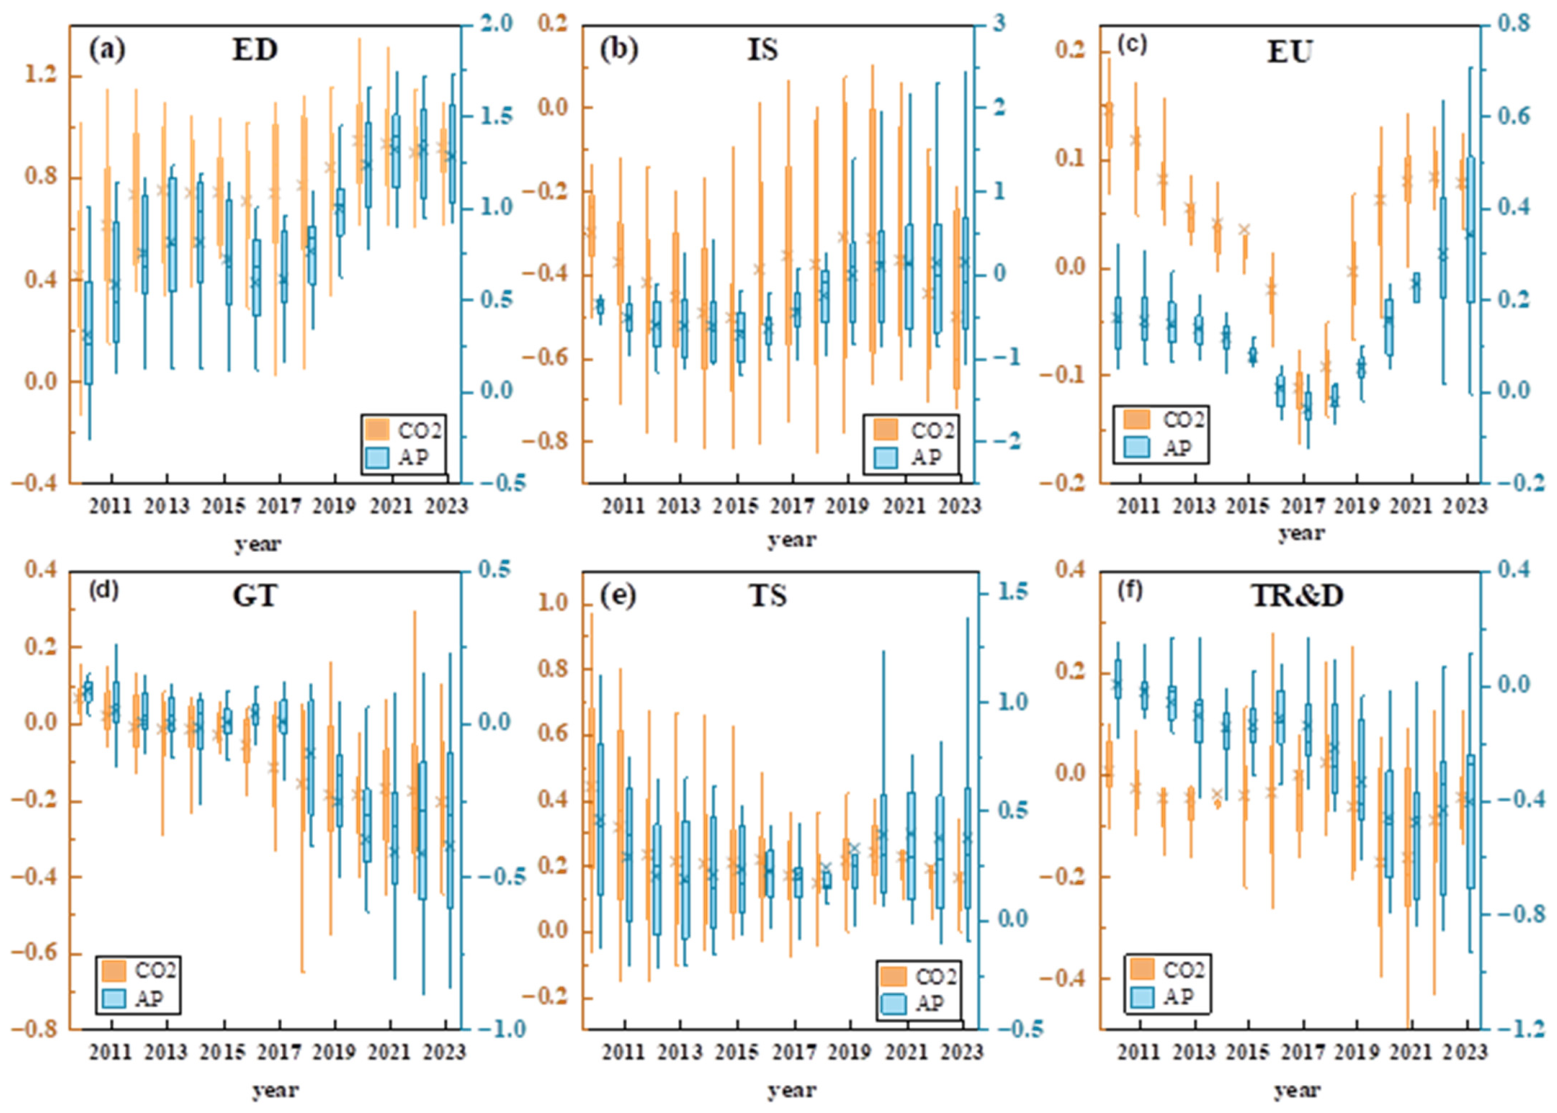
To ensure the robustness and reliability of the empirical findings, this study conducts a robustness test by replacing the baseline GTWR model with a temporally weighted regression (TWR) model. Compared with GTWR, the TWR model relaxes the spatial heterogeneity assumption and focuses on capturing temporal variation in parameter estimates. The same set of explanatory variables, sample period, and model parameters are retained in both models to ensure comparability.
As shown in Figure 13, the results indicate that the temporal evolution patterns and the signs of the regression coefficients derived from the TWR model are highly consistent with those obtained from the GTWR model. Although slight differences in coefficient magnitudes exist in some periods, the overall direction and dynamic trends remain unchanged. These findings confirm that the empirical results are robust to model specification changes and enhance the reliability of our conclusions regarding the influencing factors of the synergistic effect of PR and CM.

5.4.2. Addressing the Variable Selection Problem

An additional robustness test is conducted by substituting alternative explanatory variables. Specifically, the industrial structure is redefined as the ratio of tertiary industry output to secondary industry output. This alternative indicator better reflects the relative level of industrial structure upgrading. In addition, the number of authorized patents is used as a proxy indicator for technological R&D, thereby capturing regional technological R&D capacity in terms of innovation output. After replacing the original variables, the GTWR model is re-estimated using the same sample period and estimation procedures to ensure comparability.
The estimation results based on the alternative explanatory variables are presented in Figure 14. After replacing the explanatory variables, the estimated coefficients of industrial structure, technological R&D, and other driving factors exhibit temporal evolution patterns and directional characteristics similar to those in the benchmark model. This finding indicates that the empirical conclusions are not sensitive to variable measurements, thereby confirming the robustness and reliability of the baseline results.

6. Conclusions, Policy Suggestions, and Limitation

6.1. Conclusions

On the basis of the panel data of 13 cities in the BTH urban agglomeration from 2010 to 2023, this study investigated the spatiotemporal evolution of air pollutant and carbon emissions. The synergistic effects of PR and CM were quantified using CCECS combined with vector angle measurement. Furthermore, the GTWR model was employed to examine the spatiotemporal heterogeneity of the driving factors of PR and CM. The main findings are summarized as follows:
First, air pollutant emissions in the BTH urban agglomeration showed a remarkable downward trend during the study period, accompanied by gradually narrowing intercity disparities. By contrast, carbon emissions continued to increase in most cities, and regional disparities further expanded. The spatial distributions of air pollutant and carbon emissions exhibited strong consistency. Tangshan consistently served as a high-emission hotspot, whereas northern Hebei cities remained to be low-emission areas. Although all cities achieved substantial reductions in air pollutant emissions, only Beijing realized a decline in carbon emissions.
Second, most cities were located in the second quadrant, remaining at the stage of pollution reduction but carbon increase. However, the synergistic degree of PR and CM in the BTH urban agglomeration increased, indicating a gradual improvement of the synergistic effects of PR and CM during the study period.
Third, economic development, energy utilization, and transportation structure consistently promoted carbon and air pollutant emissions. Industrial structure upgrading initially promoted coordinated emission reduction; however, its environmental benefits weakened in some periods. Green travel and technological R&D demonstrated clear lagged environmental benefits, gradually shifting from emission-increasing effects to emission-reduction effects.
Fourth, the effects of driving factors on PR and CM exhibited substantial spatial heterogeneity. Economic development exerted strong emission-enhancing effects in southern Hebei. The synergistic effects of industrial structure on PR and CM were highly pronounced in the central areas surrounding Beijing and Tianjin. The emission-increasing effects of energy utilization and transportation structure gradually increased from south to north. The influence of green travel demonstrated notable spatial heterogeneity. In southern Hebei cities, green travel presented emission-increasing effects, whereas in other cities, it contributed to PR and CM. The emission-reducing effect of technological R&D was strong in southern Hebei. These findings imply that uniform environmental governance policies may fail to achieve optimal synergistic outcomes. Therefore, differentiated and region-specific governance strategies are essential for promoting coordinated PR and CM.
Although this study focused on the BTH urban agglomeration, the analytical framework and key findings have broad applicability. Regions undergoing rapid industrialization and urbanization may encounter similar tradeoffs between PR and CM. Therefore, the proposed approach can serve as a useful reference for policymakers and researchers in other parts of the world.

6.2. Policy Suggestions

The findings of this study provide practical implications for regional environmental governance and low-carbon transition in the BTH urban agglomeration. The significant spatial and temporal heterogeneity of driving factors suggests that differentiated governance strategies should be adopted across cities. Policymakers should avoid one-size-fits-all environmental policies and instead formulate targeted measures based on local industrial structure, energy consumption patterns, transportation systems, and technological development levels. Accordingly, several policy implications are proposed to promote the coordinated advancement of PR and CM in the BTH urban agglomeration.
First, economic development and industrial upgrading policies should be adjusted to local conditions. Southern Hebei should accelerate the transition from heavy-industry dependence to green, low-carbon development by restricting high-energy-consuming industries and promoting clean production technologies. By contrast, Beijing, Tianjin, and surrounding central cities should further develop advanced service industries and strategic emerging industries while strengthening regional green technology diffusion and industrial coordination.
Second, optimizing the energy structure remains critical. Extensive efforts should be made to develop renewable energy systems in northern Hebei. Regional green electricity trading mechanisms should be established simultaneously. Cities in northern Hebei province, where energy consumption exerts strong emission-enhancing effects, should further reduce their coal dependence and expand renewable energy utilization through differentiated energy policies and regional energy cooperation.
Third, green travel policies should consider local infrastructure and socioeconomic conditions. Southern Hebei should improve its public transportation systems and clean-energy transport infrastructure to enhance the environmental benefits of green mobility. Further efforts should be exerted to promote public transport electrification and intelligent transportation systems to enhance the emission reduction effects of green travel. Moreover, governments should encourage low-carbon travel behavior through subsidies and public awareness campaigns.
Fourth, the BTH urban agglomeration should accelerate the development of integrated green transportation systems. Particularly, northern cities with high transportation-related emission pressures should prioritize railway freight substitution, multimodal freight transport, and the electrification of heavy-duty vehicles.
Fifth, strengthening regional collaborative innovation is crucial. Governments should increase their support for low-carbon technologies, clean production technologies, renewable energy applications, and carbon capture technologies. Furthermore, regional collaborative innovation networks and technology-sharing platforms should be established to reduce technological disparities and improve the transformation rate of scientific research achievements.

6.3. Research Limitations

This study still has several limitations. First, although EDGAR provides high-resolution and widely validated emission estimates, uncertainties may still exist due to the differences between domestic and international emission factors and activity data. Future studies could further validate the results by using domestic databases (such as Carbon Emission Accounts and Datasets). Second, the GTWR model focuses on spatiotemporal heterogeneity and does not fully address potential spatial spillover effects among cities. Future studies could integrate spatial econometric models and multisource datasets to further explore the dynamic interaction mechanisms underlying coordinated PR and CM.

Author Contributions

Conceptualization, H.C.; methodology, H.C.; software, H.C.; validation, Y.L. and H.C.; formal analysis, H.C.; investigation, H.C.; resources, Y.L.; writing—original draft preparation, H.C.; writing—review and editing, Y.L. and H.C.; visualization, H.C.; supervision, Y.L.; project administration, Y.L.; funding acquisition, Y.L. All authors have read and agreed to the published version of the manuscript.

Funding

This study was supported by the Major Project of Beijing Social Science Fund, grant number 24GLA007.

Institutional Review Board Statement

Not applicable.

Informed Consent Statement

Not applicable.

Data Availability Statement

The original contributions presented in this study are included in the article. Further inquiries can be directed to the corresponding author.

Conflicts of Interest

The authors declare no conflicts of interest.

Abbreviations

The following abbreviations are used in this manuscript:
PRPollution reduction
CMCarbon mitigation
BTHBeijing–Tianjin–Hebei
CCECSCo-control Effect Coordinate System
GTWRGeographically and Temporally Weighted Regression
GWRGeographically Weighted Regression
OLSOrdinary Least Squares
EDEconomic development
ISIndustrial structure
EUEnergy utilization
GTGreen travel
TSTransportation structure
R&DResearch and development
EDGAREmissions Database for Global Atmospheric Research
VIFVariance Inflation Factor
MtMillion tons

References

  1. Afifa; Arshad, K.; Hussain, N.; Ashraf, M.H.; Saleem, M.Z. Air pollution and climate change as grand challenges to sustainability. Sci. Total Environ. 2024, 928, 172370. [Google Scholar] [CrossRef]
  2. Swart, R.; Amann, M.; Raes, F.; Tuinstra, W. A good climate for clean air: Linkages between climate change and air pollution. An editorial essay. Clim. Change 2004, 66, 263–269. [Google Scholar] [CrossRef]
  3. Danish; Ulucak, R.; Khan, S.U.D.; Baloch, M.A.; Li, N. Mitigation pathways toward sustainable development: Is there any trade-off between environmental regulation and carbon emissions reduction? Sustain. Dev. 2020, 28, 813–822. [Google Scholar] [CrossRef]
  4. Thompson, T.M.; Rausch, S.; Saari, R.K.; Selin, N.E. A systems approach to evaluating the air quality co-benefits of US carbon policies. Nat. Clim. Change 2014, 4, 917–923. [Google Scholar] [CrossRef]
  5. Yang, J.; Zhao, Y.; Cao, J.; Nielsen, C.P. Co-benefits of carbon and pollution control policies on air quality and health till 2030 in China. Environ. Int. 2021, 152, 106482. [Google Scholar] [CrossRef]
  6. Yi, H.; Zhao, L.; Qian, Y.; Zhou, L.; Yang, P. How to achieve synergy between carbon dioxide mitigation and air pollution control? Evidence from China. Sustain. Cities Soc. 2022, 78, 103609. [Google Scholar] [CrossRef]
  7. Will-Wolf, S.; Jovan, S.; Amacher, M.C. Lichen elemental content bioindicators for air quality in upper Midwest, USA: A model for large-scale monitoring. Ecol. Indic. 2017, 78, 253–263. [Google Scholar] [CrossRef]
  8. Liu, K.; Ren, G.; Dong, S.; Xue, Y. The synergy between pollution reduction and carbon reduction in Chinese cities and its influencing factors. Sustain. Cities Soc. 2024, 106, 105348. [Google Scholar] [CrossRef]
  9. Dong, M.; Duan, W.; Cheng, S.; Wang, C.; Hou, X. Synergistic effects and their driving factors of air pollution and carbon emissions in the Beijing-Tianjin-Hebei region during 2018–2022. Atmos. Environ. 2026, 365, 121674. [Google Scholar] [CrossRef]
  10. Ministry of Ecology and Environment of the People’s Republic of China. Implementation Plan for Synergistic Enhancement of Pollution Reduction and Carbon Mitigation. Available online: https://www.mee.gov.cn/xxgk2018/xxgk/xxgk03/202206/t20220617_985879.html (accessed on 10 May 2026).
  11. Hou, M.; Xie, Y.; Lu, W.; Cui, X.; Xi, Z.; Han, Y. Green finance drives the synergy of pollution control and carbon reduction in China: Dual perspective of effect and efficiency. Energy 2025, 330, 136873. [Google Scholar] [CrossRef]
  12. Song, P.; Mao, X.; Li, Z.; Tan, Z. Study on the optimal policy options for improving energy efficiency and co-controlling carbon emission and local air pollutants in China. Renew. Sustain. Energy Rev. 2023, 175, 113167. [Google Scholar] [CrossRef]
  13. Li, Q.; Chai, S.; Chen, S. Evaluation of the environmental efficiency of China’s power generation industry considering carbon emissions and air pollution: An improved three-stage SBM-SE-DEA model. Environ. Dev. Sustain. 2025, 1–22. [Google Scholar] [CrossRef]
  14. Chen, X.; Di, Q.; Jia, W.; Hou, Z. Spatial correlation network of pollution and carbon emission reductions coupled with high-quality economic development in three Chinese urban agglomerations. Sustain. Cities Soc. 2023, 94, 104552. [Google Scholar] [CrossRef]
  15. Meng, Q.; Chen, X.; Wang, H.; Shen, W.; Duan, P.; Liu, X. Spatiotemporal evolution and driving factors of the synergistic effects of pollution control and carbon reduction in China. Ecol. Indic. 2025, 170, 113103. [Google Scholar] [CrossRef]
  16. Nie, C.; Lee, C.-C. Synergy of pollution control and carbon reduction in China: Spatial–temporal characteristics, regional differences, and convergence. Environ. Impact Assess. Rev. 2023, 101, 107110. [Google Scholar] [CrossRef]
  17. Li, R.; Xu, J.; Yang, X.; Yan, L.; Ouyang, Q. Synergizing the reduction of pollution and carbon emissions in chinese cities: Spatiotemporal distribution, regional disparities and convergence. Energy Strategy Rev. 2026, 64, 102143. [Google Scholar] [CrossRef]
  18. Mao, X.; Yang, S.; Liu, Q.; Tu, J.; Jaccard, M. Achieving CO2 emission reduction and the co-benefits of local air pollution abatement in the transportation sector of China. Environ. Sci. Policy 2012, 21, 1–13. [Google Scholar] [CrossRef]
  19. Zeng, A.; Mao, X.; Hu, T.; Xing, Y.; Gao, Y.; Zhou, J.; Qian, Y. Regional co-control plan for local air pollutants and CO2 reduction: Method and practice. J. Clean. Prod. 2017, 140, 1226–1235. [Google Scholar] [CrossRef]
  20. Zhang, H.; Liu, B.; Cai, A.; Zhao, Z.; Wang, X.; Li, R. Study on synergistic emission reduction in greenhouse gases and air pollutants in Hebei province. Sustainability 2023, 15, 16790. [Google Scholar] [CrossRef]
  21. Wang, K.; Fang, C. A three-step synergy analysis framework for carbon mitigation and pollution reduction in China. J. Environ. Manag. 2025, 386, 125814. [Google Scholar] [CrossRef]
  22. Sun, G.; Liu, Y.; Li, B.; Guo, L. Road to sustainable development of China: The pursuit of coordinated development between carbon emissions and the green economy. J. Clean. Prod. 2024, 434, 139833. [Google Scholar] [CrossRef]
  23. Zha, Q.; Liu, Z.; Wang, J. Spatial pattern and driving factors of synergistic governance efficiency in pollution reduction and carbon reduction in Chinese cities. Ecol. Indic. 2023, 156, 111198. [Google Scholar] [CrossRef]
  24. Chen, T.; Chen, A.; Liu, L.; Shi, C.; Zhang, J. Synergistic effects of pollution reduction and carbon mitigation from socioeconomic factors, land use and urban innovation: A case study of Wuhan metropolitan area. Front. Environ. Sci. 2024, 12, 1511026. [Google Scholar] [CrossRef]
  25. Sun, Y.; Xie, Y.; Wang, B.; Hu, J.; Wu, K.; Yan, W. Synergistic evolution and mechanism analysis of pollution and carbon reduction: A cross-basin perspective from China. J. Clean. Prod. 2026, 542, 147629. [Google Scholar] [CrossRef]
  26. Yue, L.; Huang, C.; Ren, W. Performance evaluation and driver analysis of pollution control and carbon reduction in China: Based on a new analytical framework. Environ. Sci. Pollut. Res. 2023, 30, 84368–84385. [Google Scholar] [CrossRef] [PubMed]
  27. Qian, H.; Xu, S.; Cao, J.; Ren, F.; Wei, W.; Meng, J.; Wu, L. Air pollution reduction and climate co-benefits in China’s industries. Nat. Sustain. 2021, 4, 417–425. [Google Scholar] [CrossRef]
  28. Shi, W.; Wang, W.; Tang, W.; Qiao, F.; Zhang, G.; Pei, R.; Zhang, L. How environmental regulation affects pollution reduction and carbon reduction synergies—An empirical analysis based on Chinese provincial data. Sustainability 2024, 16, 5331. [Google Scholar] [CrossRef]
  29. Zhou, F.; Li, L.; Lee, C.-C. Stimulate synergistic efficiency of pollution-carbon Co-control in the digital era: The role of digital trade in cities. Socioecon. Plan. Sci. 2026, 105, 102474. [Google Scholar] [CrossRef]
  30. Chen, S.; Tan, Z.; Mu, S.; Wang, J.; Chen, Y.; He, X. Synergy level of pollution and carbon reduction in the Yangtze River Economic Belt: Spatial-temporal evolution characteristics and driving factors. Sustain. Cities Soc. 2023, 98, 104859. [Google Scholar] [CrossRef]
  31. Jiang, F.; Chen, B.; Li, P.; Jiang, J.; Zhang, Q.; Wang, J.; Deng, J. Spatio-temporal evolution and influencing factors of synergizing the reduction of pollution and carbon emissions—Utilizing multi-source remote sensing data and GTWR model. Environ. Res. 2023, 229, 115775. [Google Scholar] [CrossRef]
  32. Yang, X.; Ran, G. Factors influencing the coupled and coordinated development of cities in the Yangtze River Economic Belt: A focus on carbon reduction, pollution control, greening, and growth. J. Environ. Manag. 2024, 370, 122499. [Google Scholar] [CrossRef]
  33. Duman, Z.; Mao, X.; Cai, B.; Zhang, Q.; Chen, Y.; Gao, Y.; Guo, Z. Exploring the spatiotemporal pattern evolution of carbon emissions and air pollution in Chinese cities. J. Environ. Manag. 2023, 345, 118870. [Google Scholar] [CrossRef] [PubMed]
  34. Chen, X.; Di, Q.; Liang, C. Analysis of the coupling relationship and influencing factors between pollution reduction and carbon reduction and economy from the perspective of urban agglomeration. Environ. Dev. Sustain. 2026, 1–33. [Google Scholar] [CrossRef]
  35. Xu, Y.; Liu, Z.; Walker, T.R.; Adams, M.; Dong, H. Spatio-temporal patterns and spillover effects of synergy on carbon dioxide emission and pollution reductions in the Yangtze River Delta region in China. Sustain. Cities Soc. 2024, 107, 105419. [Google Scholar] [CrossRef]
  36. Li, Y.; Cui, H. Coupling coordination of carbon cutting, pollution reduction, and economic growth in China: Spatiotemporal evolution, regional differences, and influence factors. Sustainability 2025, 17, 5052. [Google Scholar] [CrossRef]
  37. Chang, H.; Wang, W.; Yu, J. Revisiting the environmental Kuznets curve in China: A spatial dynamic panel data approach. Energy Econ. 2021, 104, 105600. [Google Scholar] [CrossRef]
  38. Zhu, Q.; Li, X.; Li, F.; Wu, J.; Sun, J. Analyzing the sustainability of China’s industrial sectors: A data-driven approach with total energy consumption constraint. Ecol. Indic. 2021, 122, 107235. [Google Scholar] [CrossRef]
  39. Zhong, Q.; Wen, H.; Lee, C.-C. How does economic growth target affect corporate environmental investment? Evidence from heavy-polluting industries in China. Environ. Impact Assess. Rev. 2022, 95, 106799. [Google Scholar] [CrossRef]
  40. Zhao, J.; Jiang, Q.; Dong, X.; Dong, K.; Jiang, H. How does industrial structure adjustment reduce CO2 emissions? Spatial and mediation effects analysis for China. Energy Econ. 2022, 105, 105704. [Google Scholar] [CrossRef]
  41. Zhu, X. Have carbon emissions been reduced due to the upgrading of industrial structure? Analysis of the mediating effect based on technological innovation. Environ. Sci. Pollut. Res. Int. 2022, 29, 54890–54901. [Google Scholar] [CrossRef]
  42. Li, S.; Wang, S.; Wu, Q.; Zhao, B.; Jiang, Y.; Zheng, H.; Wen, Y.; Zhang, S.; Wu, Y.; Hao, J. Integrated benefits of synergistically reducing air pollutants and carbon dioxide in China. Environ. Sci. Technol. 2024, 58, 14193–14202. [Google Scholar] [CrossRef]
  43. Koondhar, M.A.; Shahbaz, M.; Ozturk, I.; Randhawa, A.A.; Kong, R. Revisiting the relationship between carbon emission, renewable energy consumption, forestry, and agricultural financial development for China. Environ. Sci. Pollut. Res. 2021, 28, 45459–45473. [Google Scholar] [CrossRef]
  44. Jing, Q.-L.; Liu, H.-Z.; Yu, W.-Q.; He, X. The impact of public transportation on carbon emissions—From the perspective of energy consumption. Sustainability 2022, 14, 6248. [Google Scholar] [CrossRef]
  45. Miraftabzadeh, S.M.; Ranjgar, B.; Niccolai, A.; Longo, M. Comparative analysis of sustainable electrification in mediterranean public transportation. Sustainability 2024, 16, 2645. [Google Scholar] [CrossRef]
  46. Xie, R.; Fang, J.; Liu, C. The effects of transportation infrastructure on urban carbon emissions. Appl. Energy 2017, 196, 199–207. [Google Scholar] [CrossRef]
  47. Alimujiang, A.; Jiang, P. Synergy and co-benefits of reducing CO2 and air pollutant emissions by promoting electric vehicles—A case of Shanghai. Energy Sustain. Dev. 2020, 55, 181–189. [Google Scholar] [CrossRef]
  48. Zeng, Q.-H.; He, L.-Y. Study on the synergistic effect of air pollution prevention and carbon emission reduction in the context of “dual carbon”: Evidence from China’s transport sector. Energy Policy 2023, 173, 113370. [Google Scholar] [CrossRef]
  49. da Fonseca-Soares, D.; Eliziário, S.A.; Galvincio, J.D.; Ramos-Ridao, A.F. Greenhouse Gas Emissions in Railways: Systematic Review of Research Progress. Buildings 2024, 14, 539. [Google Scholar] [CrossRef]
  50. Tian, Y.; Zhu, Q.; Lai, K.-H.; Lun, Y.V. Analysis of greenhouse gas emissions of freight transport sector in China. J. Transp. Geogr. 2014, 40, 43–52. [Google Scholar] [CrossRef]
  51. Wang, M.; Wang, Y.; Chen, L.; Yang, Y.; Li, X. Carbon emission of energy consumption of the electric vehicle development scenario. Environ. Sci. Pollut. Res. Int. 2021, 28, 42401–42413. [Google Scholar] [CrossRef]
  52. Jin, L.; Duan, K.; Shi, C.; Ju, X. The impact of technological progress in the energy sector on carbon emissions: An empirical analysis from China. Int. J. Environ. Res. Public Health 2017, 14, 1505. [Google Scholar] [CrossRef]
  53. Zhao, X.; Shao, B.; Su, J.; Tian, N. Exploring synergistic evolution of carbon emissions and air pollutants and spatiotemporal heterogeneity of influencing factors in Chinese cities. Sci. Rep. 2025, 15, 2657. [Google Scholar] [CrossRef] [PubMed]
  54. Zambom, A.Z.; Dias, R. A review of Kernel Density Estimation with applications to econometrics. Int. Econon. Rev. 2013, 5, 20–42. [Google Scholar]
  55. Węglarczyk, S. Kernel density estimation and its application. In Proceedings of the ITM Web of Conferences; EDP Sciences: Les Ulis, France, 2018; Volume 23, p. 00037. [Google Scholar] [CrossRef]
  56. Han, Q.; Ma, S.; Wang, T.; Chu, F. Kernel density estimation model for wind speed probability distribution with applicability to wind energy assessment in China. Renew. Sustain. Energy Rev. 2019, 115, 109381. [Google Scholar] [CrossRef]
  57. Tiwari, C.; Mishra, M. Testing the CO2 emissions convergence: Evidence from Asian countries. IIM Kozhikode Soc. Manag. Rev. 2016, 6, 67–72. [Google Scholar] [CrossRef]
  58. You, J.; Li, Y.; Song, Y. Urban pollution–carbon coordination in China: Spatial spillovers and non-equilibrium dynamics. Urban Clim. 2026, 65, 102765. [Google Scholar] [CrossRef]
  59. Yu, J.; Jiang, X.; Jiang, C.; Li, P. Spatio-Temporal Heterogeneity of Regional Carbon Emission Drivers in China: Evidence from an Integrated Random Forest and GTWR Model. Sustainability 2026, 18, 2507. [Google Scholar] [CrossRef]
  60. Huang, B.; Wu, B.; Barry, M. Geographically and temporally weighted regression for modeling spatio-temporal variation in house prices. Int. J. Geogr. Inf. Sci. 2010, 24, 383–401. [Google Scholar] [CrossRef]
  61. O’brien, R.M. A caution regarding rules of thumb for variance inflation factors. Qual. Quant. 2007, 41, 673–690. [Google Scholar] [CrossRef]
  62. Yang, F.; Zhen, J.; Chen, X. The spatial association network structure and influencing factors of pollution reduction and carbon emission reduction synergy efficiency in the Yellow River Basin. Sustainability 2025, 17, 2068. [Google Scholar] [CrossRef]
  63. Zhu, E.; Qi, Q.; Chen, L.; Wu, X. The spatial-temporal patterns and multiple driving mechanisms of carbon emissions in the process of urbanization: A case study in Zhejiang, China. J. Clean. Prod. 2022, 358, 131954. [Google Scholar] [CrossRef]
  64. Li, Z.; Zhou, Q. Research on the spatial effect and threshold effect of industrial structure upgrading on carbon emissions in China. J. Water Clim. Change 2021, 12, 3886–3898. [Google Scholar] [CrossRef]
  65. Zhang, T.; Zhang, Z.; Zhang, X.; Zhou, L.; Yao, J. Study on the spatial–temporal characteristics and influencing factors of the synergistic effect of pollution and carbon reduction: A case study of the Chengdu–Chongqing region, China. Sustainability 2025, 17, 8365. [Google Scholar] [CrossRef]
  66. Wang, Z.; Di, Z.; Zhang, D. Assessing the synergy level of air pollution and carbon reduction and its influencing factors in “2 + 36” cities, China. Water Air Soil Pollut. 2025, 236, 740. [Google Scholar] [CrossRef]
  67. Luo, Q.; Wang, J. Analysis of the coupling coordination spatial network and driving factors of urban pollution and carbon emissions in China. Environ. Res. Commun. 2025, 7, 035011. [Google Scholar] [CrossRef]
  68. Wu, X.; Harrison, R.M.; Yan, J.; Wu, T.; Shen, Y.; Cui, Y.; Liu, X.; Yi, H.; Shi, Z.; Xue, Y. Present and future emission characteristics of air pollutants and CO2 from the Beijing transport sector and their synergistic emission reduction benefits. Atmos. Pollut. Res. 2023, 14, 101844. [Google Scholar] [CrossRef]
  69. Pietrzak, K.; Pietrzak, O. Environmental effects of electromobility in a sustainable urban public transport. Sustainability 2020, 12, 1052. [Google Scholar] [CrossRef]
  70. Wen, L.; Song, Q. Simulation study on carbon emission of China’s freight system under the target of carbon peaking. Sci. Total Environ. 2022, 812, 152600. [Google Scholar] [CrossRef]
  71. Liu, L.; Liu, Y.; Zhu, Y.; Mommens, K.; Wang, H. Co-benefits in carbon reduction from freight mode shifts under China’s ‘Clean Air Action’. Environ. Res. Lett. 2024, 19, 124082. [Google Scholar] [CrossRef]
  72. Wen, X.; Wang, S.; Li, S.; Cheng, L.; Li, K.; Zheng, Q.; Zhang, B. Impact factors of industrial pollution and carbon reduction under the “Dual Carbon” target: A case study of urban aggregation in the Pearl River Delta and Yangtze River Delta. Sustainability 2024, 16, 1879. [Google Scholar] [CrossRef]
Figure 1. Co-control effect coordinate system.
Sustainability 18 05395 g001
Figure 2. Kernel density curves of air pollutant and carbon emissions. (a) Kernel density curves of air pollutant emissions and (b) kernel density curves of carbon emissions.
Sustainability 18 05395 g002
Figure 3. Spatial distribution of air pollutant emissions in BTH urban agglomeration. (a) Spatial pattern in 2010, (b) spatial pattern in 2015, (c) spatial pattern in 2020, (d) spatial pattern in 2023, and (e) air pollutant emission reduction.
Sustainability 18 05395 g003
Figure 4. Spatial distribution of carbon emissions in BTH urban agglomeration. (a) Spatial pattern in 2010, (b) spatial pattern in 2015, (c) spatial pattern in 2020, (d) spatial pattern in 2023, and (e) carbon emission reduction.
Sustainability 18 05395 g004
Figure 5. Co-control effect coordinate system between air pollutants and carbon emissions in the BTH urban agglomeration. Results in the (a) 12th Five-Year Plan period, (b) 13th Five-Year Plan period, and (c) 14th Five-Year Plan period.
Sustainability 18 05395 g005
Figure 6. Boxplot of the regression coefficients of economic development.
Sustainability 18 05395 g006
Figure 7. Boxplot of the regression coefficients of industrial structure.
Sustainability 18 05395 g007
Figure 8. Boxplot of the regression coefficients of energy utilization.
Sustainability 18 05395 g008
Figure 9. Boxplot of the regression coefficients of green travel.
Sustainability 18 05395 g009
Figure 10. Boxplot of the regression coefficients of transportation structure.
Sustainability 18 05395 g010
Figure 11. Boxplot of the regression coefficients of technology research and development.
Sustainability 18 05395 g011
Figure 12. Spatial distribution of regression coefficients for the effects of driving factors on carbon and air pollutant emissions. Regression coefficients of (a) economic development, (b) industrial structure, (c) energy utilization, (d) green travel, (e) transportation structure, and (f) technological R&D.
Sustainability 18 05395 g012
Figure 13. Regression coefficients of driving factors based on the TWR model. Regression coefficients of (a) economic development, (b) industrial structure, (c) energy utilization, (d) green travel, (e) transportation structure, and (f) technological R&D.
Sustainability 18 05395 g013
Figure 14. Regression coefficients after replacing variables. Regression coefficients of (a) economic development, (b) industrial structure, (c) energy utilization, (d) green travel, (e) transportation structure, and (f) technological R&D.
Sustainability 18 05395 g014
Table 1. Driving factors of synergistic effect of PR and CM.
Driving FactorsIndicator DefinitionAbbreviation
Economic developmentGross domestic productED
Industrial structureProportion of the tertiary industryIS
Energy utilizationTotal energy consumptionEU
Green travelNumber of operating public transport vehiclesGT
Transportation structureTotal road freight volumeTS
Technological R&DRatio of science and technology expenditure to the general financial budgetTR&D
Table 2. Synergistic degree in the BTH urban agglomeration.
Cities12th Five-Year Plan Period13th Five-Year Plan Period14th Five-Year Plan Period
Beijing0.7810.956−0.995
Tianjin0.5530.7750.564
Shijiazhuang0.5390.3790.682
Tangshan0.1880.3410.747
Qinhuangdao0.8070.1320.917
Handan0.7380.4290.671
Xingtai0.8660.5170.626
Baoding0.0900.4980.666
Zhangjiakou0.4940.4760.584
Chengde0.4690.4410.707
Cangzhou−0.1910.4270.695
Langfang0.6840.4520.666
Hengshui0.3500.5180.634
Table 3. Multicollinearity test results.
VariablesEDISEUGTTSTR&D
VIF9.943.211.226.223.397.63
Table 4. Model fitting parameters.
ParameterCO2AP
OLSGWRGTWROLSGWRGTWR
R20.9210.9850.9920.8090.9120.981
R2-Adjusted/0.9840.992/0.9090.980
AICc−111.225−205.420−210.30366.84732.756−42.984
Disclaimer/Publisher’s Note: The statements, opinions and data contained in all publications are solely those of the individual author(s) and contributor(s) and not of MDPI and/or the editor(s). MDPI and/or the editor(s) disclaim responsibility for any injury to people or property resulting from any ideas, methods, instructions or products referred to in the content.