Article

The Green Total Factor Productivity Effect of Computing Infrastructure: Evidence from China’s Supercomputing Centers

School of Economics, North Minzu University, Yinchuan 750030, China
*
Author to whom correspondence should be addressed.
Sustainability 2026, 18(11), 5383; https://doi.org/10.3390/su18115383
Submission received: 15 April 2026 / Revised: 17 May 2026 / Accepted: 18 May 2026 / Published: 27 May 2026

Abstract

As a strategic infrastructure supporting high-quality economic and social development, computing infrastructure plays a pivotal role in enabling green transitions. Using panel data from Chinese prefecture-level cities spanning 2007 to 2023 and leveraging the staggered commissioning of 12 National Supercomputing Centers as a quasi-natural experiment, this paper employs a time-varying difference-in-differences (DID) approach to estimate the effect of computing infrastructure on urban green total factor productivity (GTFP). The results indicate that the operation of supercomputing centers has a statistically significant positive effect on urban GTFP, with a magnitude equivalent to approximately 0.83 times the sample standard deviation of GTFP, a finding that remains robust to alternative dependent variable specifications, the exclusion of other policy shocks, and placebo tests. Mechanism analysis reveals that computing infrastructure facilitates green development through three channels: fostering green technological innovation, optimizing energy efficiency, and strengthening environmental regulation. Heterogeneity analysis shows that the positive effect is more pronounced in coastal cities, small-to-medium-sized cities, and regions with weaker digital infrastructure. Spatial analysis further uncovers a distance-decay pattern, with a siphoning effect within a 50 km radius and a spillover effect between 50 km and 200 km from the supercomputing center. This study provides empirical evidence on the environmental consequences of the computing economy and offers policy implications for optimizing computing infrastructure deployment to facilitate green transitions.

1. Introduction

Amidst escalating global climate challenges, accelerating regional green and low-carbon transitions has emerged as a critical priority worldwide. As the world’s largest carbon emitter, China announced its “dual carbon” goals in 2020—pledging to peak carbon emissions by 2030 and achieve carbon neutrality by 2060—placing it at the center of the global climate response. However, traditional total factor productivity (TFP) measures fail to incorporate negative externalities such as resource depletion and environmental pollution, thereby offering an incomplete picture of genuine economic performance. By integrating energy inputs and undesirable outputs like pollutant emissions into the analytical framework, green total factor productivity (GTFP) provides a more comprehensive measure of production efficiency under the constraints of ecological civilization construction (Zhou et al., 2024) [1]. As China advances its ‘dual carbon’ goals, identifying key drivers of green transitions has become a shared focus of policy and academic research.
In parallel, the rapid rise of the digital economy, driven by big data and artificial intelligence, is profoundly reshaping socio-economic development. Computing power has transcended its conventional role to become a critical new factor of production in the digital era (Yang and Wang, 2023) [2]. As the strategic public foundation supporting digital society, computing infrastructure has been deployed at an accelerating pace across China, forming a nationwide computing network. While the role of computing infrastructure in enabling industrial digital transformation and supporting scientific research is widely recognized, existing studies have largely concentrated on its effects on macroeconomic growth (Obringer et al., 2021; Tang et al., 2021) [3,4] and enterprise digital transformation (Cheng et al., 2024) [5]. Although a strand of research has examined the impact of digitalization on GTFP (Gu et al., 2022; Yu et al., 2023) [6,7], computing power is typically treated as a generalized background factor, and dedicated causal identification studies that treat computing infrastructure—particularly National Supercomputing Centers—as a core treatment variable remain scarce. This gap is especially consequential under the “dual carbon” framework, because computing infrastructure simultaneously embodies high energy consumption and strong enabling potential, rendering its net effect on GTFP theoretically ambiguous (Jiang et al., 2021) [8]. Existing empirical evidence, however, is largely correlational, and rigorous identification leveraging exogenous policy shocks is notably lacking.
This paper addresses these gaps by exploiting the staggered establishment of China’s National Supercomputing Centers as a quasi-natural experiment. Unlike data centers built through local government investment, National Supercomputing Centers are jointly funded by the Ministry of Science and Technology and provincial governments, with siting decisions guided primarily by national strategic scientific priorities rather than local economic considerations. This institutional feature renders their location decisions largely exogenous to city-level economic conditions and environmental policy choices. Moreover, the 12 centers were commissioned in phases between 2010 and 2023, generating a staggered treatment structure well-suited to a time-varying DID approach for identifying the green effects of computing deployment.
Using panel data from 284 Chinese prefecture-level cities from 2007 to 2023, we apply a time-varying DID estimator to identify the impact of computing infrastructure on urban GTFP. Empirical results indicate that supercomputing center operations significantly enhance urban GTFP, a finding robust to alternative dependent-variable specifications, the exclusion of confounding policy shocks, and placebo tests. Mechanism analysis reveals three transmission channels: fostering green technological innovation, improving energy utilization efficiency, and strengthening environmental regulation. We further document significant synergies between computing infrastructure and low-carbon and innovative-city pilot policies. Heterogeneity analysis indicates that the positive effect is more pronounced in coastal, small-to-medium-sized cities, and regions with weaker digital infrastructure, pointing to a ‘digital gap-filling’ role. Finally, spatial analysis uncovers a distance-decay pattern: a siphoning effect within 50 km and positive spillovers between 50 and 200 km of the supercomputing center.
This study makes two primary contributions to the literature. First, in terms of research design, we disaggregate computing infrastructure from broader digital infrastructure and exploit the staggered commissioning of National Supercomputing Centers as an exogenous policy shock. To the best of our knowledge, this is among the first studies to provide quasi-experimental evidence on how high-end computing infrastructure shapes urban green transitions in a developing-country context. Second, in terms of theoretical mechanism, we develop and empirically test a unified “Technology–Efficiency–Institution” framework that traces three interdependent channels through which computing deployment enables green development: green technological innovation (capability),energy utilization efficiency(pressure), and environmental regulation(institution).Beyond these core contributions, the heterogeneity and spatial analyses serve as natural extensions, offering supplementary insights into the differentiated effects and spatial boundaries of computing infrastructure deployment.

2. Literature Review

The literature has not yet reached a consensus on the impact of digital infrastructure construction on urban green transitions. It is worth noting that supercomputing centers, as a core and high-end segment of digital infrastructure, share an inherent unity with general digital infrastructure: both belong to the category of computing infrastructure, rely on hardware deployment and network interconnection to exert functional value, and their environmental effects (whether positive or negative) are essentially driven by computing power operation and resource consumption. This unity lays a theoretical foundation for drawing on the existing literature on digital infrastructure to analyze the environmental impact of supercomputing centers. Two competing strands of research have emerged, offering contrasting predictions regarding the net environmental effect of computing deployment.
A substantial body of studies finds that digital infrastructure brings significant positive incentives for urban green development. At the macro level, computing power enhances industrial energy efficiency and reduces carbon emissions by strengthening green technological innovation and industrial structure upgrading (Wang & Shao, 2024; Zhang et al., 2023) [9,10]; public data openness improves urban land use efficiency through innovation and agglomeration effects (Li et al., 2025) [11]; and the application of digital technologies in the energy sector further demonstrates significant carbon reduction benefits by optimizing production models and resource allocation (Yang et al., 2025) [12]. At the micro level, digital infrastructure significantly improves the innovation quality of manufacturing firms and enables the development of new productive forces by easing financing constraints (Rao, 2025; Chen et al., 2025; Chen et al.,2024) [13,14,15]. Moreover, empirical studies on smart city pilots confirm that digital infrastructure can drive urban green growth by alleviating resource misallocation and improving carbon productivity (Chen et al.,2024; Liu & Zhang, 2023) [15,16], which echoes the spatial spillover findings of this study and reinforces the universality and relevance of digitalization in enabling green development.
A parallel strand of research, however, identifies potential negative impacts of digital infrastructure construction. In particular, computing infrastructure is characterized by high energy consumption; electricity consumption during operation accounts for a large share of emissions. Large data center clusters have even been likened to “non-smoking factories,” with massive energy use and greenhouse gas emissions posing serious challenges to global carbon neutrality goals (Masanet et al., 2020; Uddin & Rahman, 2012) [17,18]. Drawing on the Jevons paradox, efficiency gains may induce larger rebound effects in computing demand (Yu et al., 2024) [19]. The construction boom of large-scale data centers is also accompanied by substantial land use—occupying forests and farmland—and generates non-negligible ecological footprints (Gates, 2025) [20]. The mass production of digital devices and computing hardware also makes the digital industry a major consumer of materials, generating large volumes of e-waste that may release harmful gases (Guo et al., 2022; Bianchini et al., 2023) [21,22]. Additionally, digital infrastructure may increase industrial wastewater discharge, worsen ecological welfare performance (Yu et al., 2024) [19], and trigger social and ecological issues such as “green gentrification” and wetland degradation (Yazar et al., 2020; Dhyani et al., 2018) [23,24]. Some studies also find that the promotion effect of computing deployment on green development may exhibit diminishing marginal returns across regions and is constrained by the uneven distribution of heterogeneous computing power and the lack of “computing-electricity coordination” mechanisms (Kong et al., 2024) [25]. Similarly, these studies on the negative environmental effects of digital infrastructure are applicable to supercomputing centers, as supercomputing centers, as a high-performance type of computing infrastructure, have the same core environmental cost drivers as general digital infrastructure, while their intensity is even higher.
In summary, existing literature offers valuable insights from both positive and negative perspectives, yet three limitations leave room for further exploration in this paper. First, in terms of research subjects, most studies treat digitalization as an aggregate variable and fail to distinguish the essential differences between supercomputing centers and other digital infrastructure in terms of energy intensity and institutional arrangements. Causal identification studies specifically taking supercomputing centers as the treatment variable are extremely scarce. Second, regarding identification strategies, existing conclusions are mainly based on correlation analysis or single-period policy shocks, while studies adopting exogenous events for causal inference under the staggered treatment setting remain rare. Third, in terms of measurement methods, most studies measure environmental performance by carbon emission intensity or single pollutant indicators. Research that systematically captures the quality of green transformation from the perspective of input-output efficiency using the BML index is relatively limited, and there is still room for improvement in the transparency of GTFP measurement and robustness tests. This paper attempts to make supplementary contributions from the above three aspects.

3. Policy Background and Theoretical Analysis

3.1. Policy Background: Construction of National Supercomputing Centers

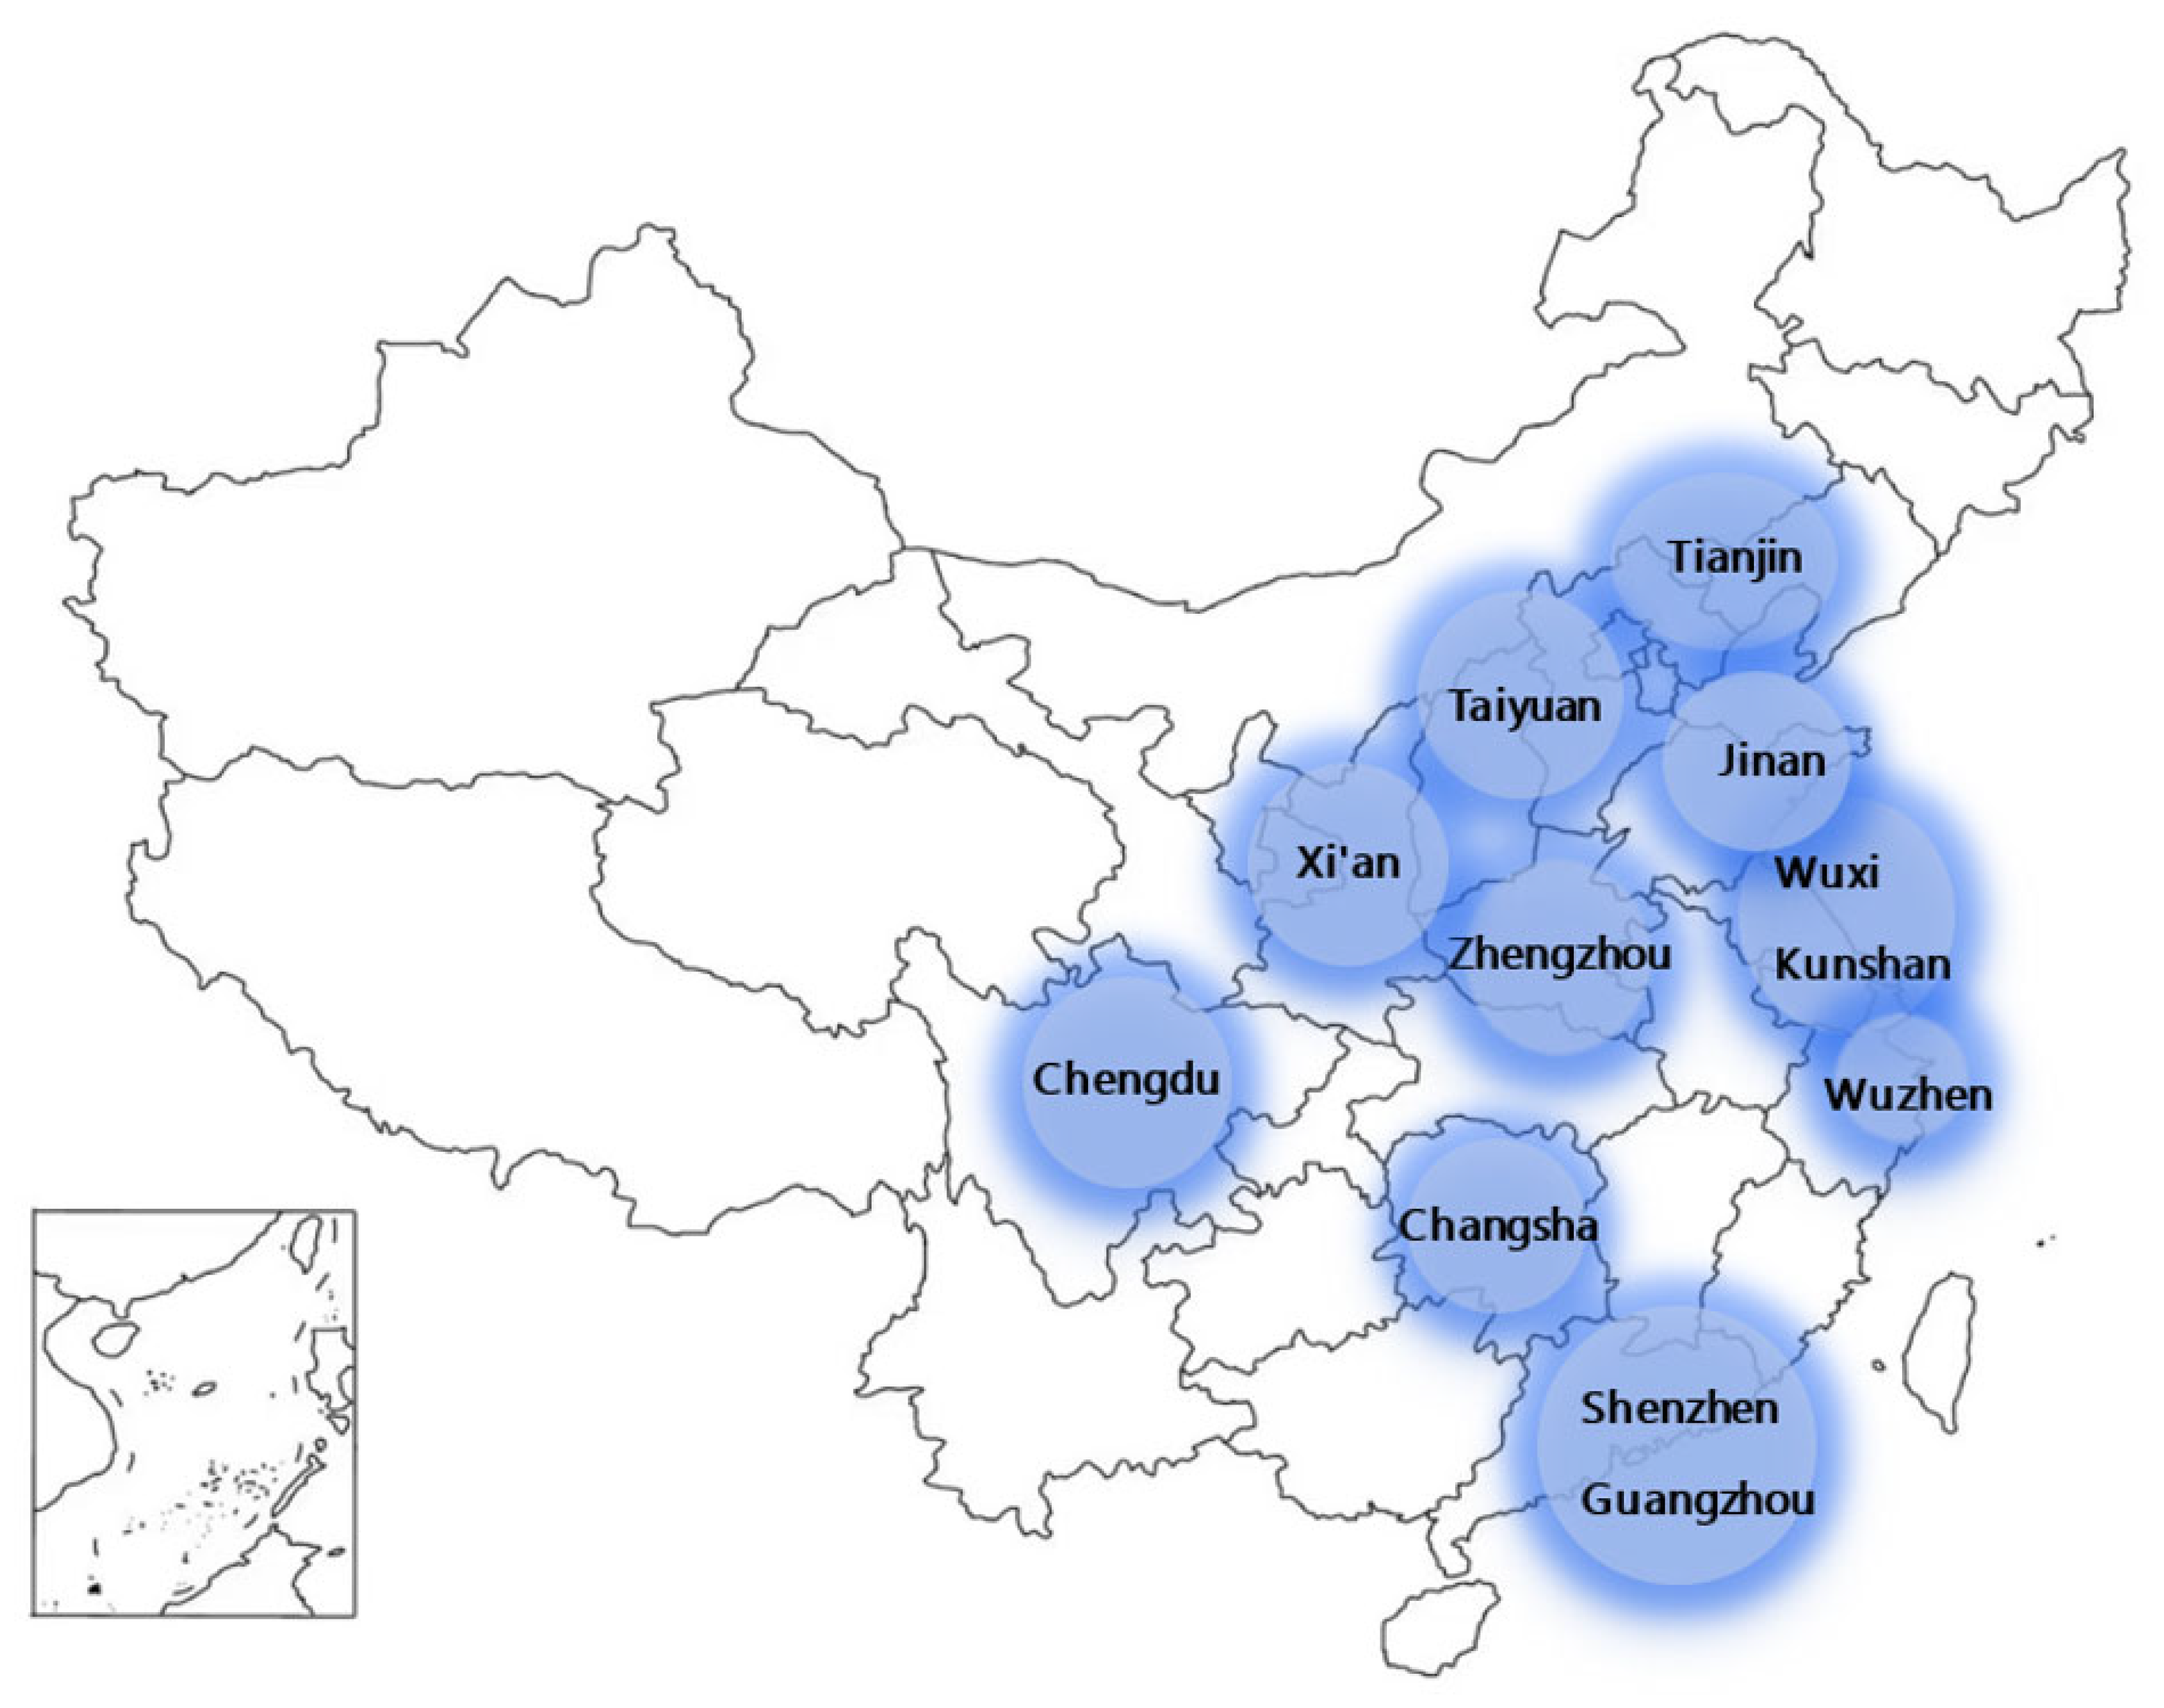
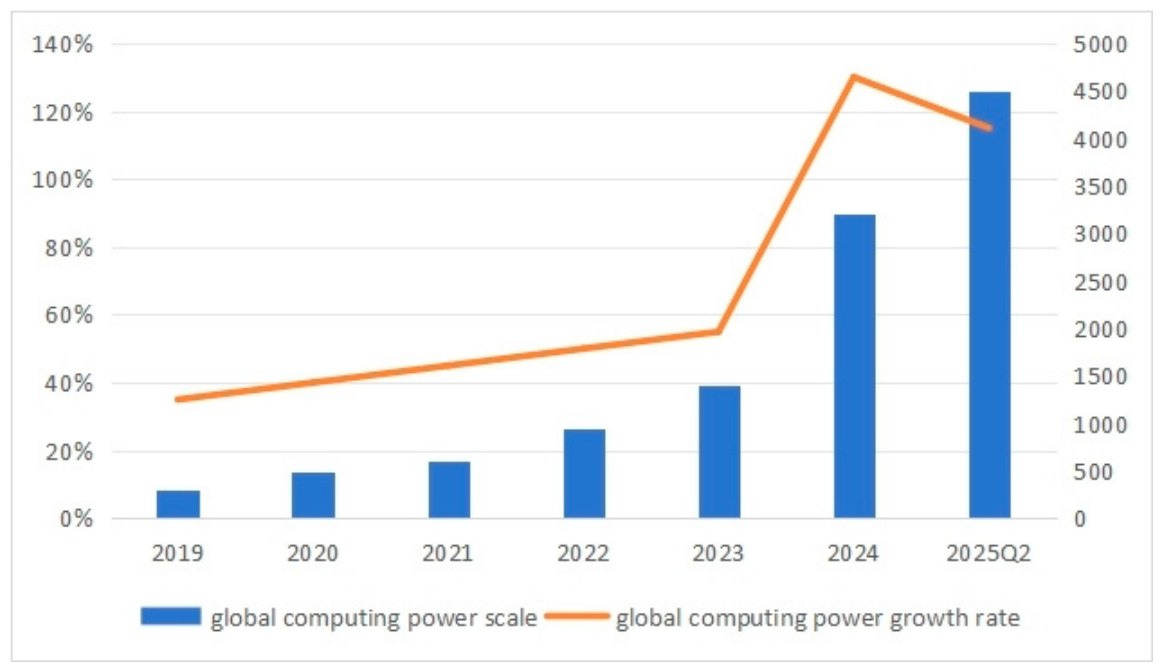
As competition for computing power intensifies globally, computing has become a strategic resource that reshapes national competitiveness and drives digital transformation. As shown in Figure 1, global computing power is experiencing explosive growth: between 2019 and 2025, total scale surged from under 500 EFLOPS to 4495 EFLOPS, with growth exceeding 130% in 2024 alone; supercomputing power reached 52 EFLOPS, a year-on-year increase of 63%. It is projected that over the next five years, global computing power will grow at a rate exceeding 60%, surpassing 50 ZFLOPS by 2030. In this global race, China has achieved a leap from follower to leader. As illustrated in Figure 2, since the inauguration of the Tianjin Center in 2010, China has built a network of 12 National Supercomputing Centers covering core economic zones such as Beijing–Tianjin–Hebei, the Yangtze River Delta, the Pearl River Delta, and Chengdu–Chongqing, forming a spatial pattern of east–west linkage and north–south coordination. Together with intelligent computing centers, these supercomputing centers form the core pillar of China’s computing infrastructure, supporting breakthroughs in cutting-edge fields such as climate modeling, new drug discovery, and artificial intelligence. According to the China Academy of Information and Communications Technology (CAICT), China’s data center service market is expected to reach RMB 307.5 billion by 2027.
Unlike general-purpose digital infrastructure such as broadband or 5G networks, China’s National Supercomputing Centers possess three distinguishing institutional characteristics that are central to evaluating their environmental effects. First, functional hybridity. Co-built by the Ministry of Science and Technology and provincial or municipal governments, these centers not only provide large-scale computing services but also host joint laboratories with universities, research institutes, and industrial partners, creating open innovation hubs that integrate industry, academia, and research. This feature is directly relevant to the green technology innovation transmission pathway. Second, the high-energy-consumption attribute. Individual centers can consume hundreds of millions of kilowatt-hours annually, meaning their operation inevitably reshapes regional energy consumption patterns. This makes energy efficiency an inescapable core dimension of any environmental assessment and fundamentally distinguishes supercomputing centers from less energy-intensive digital infrastructure. Third, staggered deployment. The 12 centers were established in phases between 2010 and 2023, a rollout rhythm driven by national strategic planning rather than local economic conditions. Consequently, the establishment timing of a supercomputing center in a given city is largely exogenous to that city’s own economic conditions and environmental policy choices, which supports the key identifying assumption of the staggered DID design. Furthermore, the spatial distribution of centers across different regions also provides a foundation for examining potential spatial spillover effects. Together, these institutional features—functional hybridity, the high-energy-consumption attribute, and staggered deployment—form the analytical anchors from which the theoretical framework and empirical design of this paper are derived. With its globally leading computing scale and technological capabilities, China provides robust computing support for green and low-carbon technology breakthroughs, serving as an important bridge connecting computing supply and urban green transition demand.

3.2. Theoretical Analysis of Baseline Mechanisms

As a core carrier of new productive forces, computing infrastructure is reshaping urban economic geography and driving green transitions. From the perspective of general-purpose technological progress, computing power substitutes digital penetration for traditional factors, reducing transaction costs and information frictions, optimizing factor allocation, and minimizing resource misallocation and waste (Goldfarb & Tucker, 2019) [26]. Combined with directed technical change theory, its strong spillover effects can reconfigure production functions, guiding factors from high-energy-consuming industries to low-carbon, high-value-added sectors, thereby decoupling economic growth from resource depletion (Acemoglu et al., 2016) [27]. Compared with traditional capital-driven models, computing power enhances urban digital dispatch capabilities, leveraging data analytics to optimize spatial layouts and factor flows, reducing the negative environmental externalities of development. Moreover, through network and knowledge spillovers, computing networks transcend geographical constraints, accelerating the diffusion of low-carbon technologies and green management practices, thereby strengthening urban green symbiotic systems and enhancing endogenous resilience under resource constraints. Empirical studies have also confirmed that digital infrastructure can reshape industrial and governance models, increase GTFP, and solidify the foundation for high-quality, sustainable urban development (Liu et al., 2022; Xiao et al., 2024) [28,29]. This enabling effect not only optimizes production processes but also restructures growth logic, building a green productivity system powered by computing and facilitating a profound transition from extensive expansion to ecologically intensive development.
Yet, this enabling narrative remains incomplete without acknowledging the countervailing force. As noted earlier, supercomputing centers are themselves high-energy-consumption facilities. Their operation directly increases local energy demand, and if the regional power mix remains fossil-fuel-intensive, the resulting emissions may partially offset the gains from technology empowerment and efficiency optimization. The net effect of computing infrastructure on urban GTFP is therefore theoretically indeterminate—a trade-off between positive enabling channels and the direct environmental burden of its own energy consumption. Resolving this ambiguity is precisely the empirical task of this paper. Based on this, we propose the following hypothesis:
H1: 
Computing infrastructure can promote urban green transitions.

3.3. Theoretical Analysis of Mediating Mechanisms

As the core computing carrier in the digital economy era, supercomputing centers not only directly reshape urban production modes and growth patterns, but also indirectly empower urban green transition through a set of interrelated mediating mechanisms. Drawing on the analytical logic of the “Technology–Efficiency–Institution” framework, we argue that the impact of computing deployment on urban GTFP does not operate through isolated channels, but unfolds along three interdependent pathways. Among them, green innovation provides the capability foundation for transition, energy efficiency constitutes the direct pressure transmission, and environmental regulation supplies the institutional guarantee that channels the first two toward green outcomes. These three form an integrated whole, jointly determining the net environmental effect of computing deployment.
(1)
Green innovation—emphasizing low-carbon, resource-conserving technological paradigm shifts—can restructure urban industrial structures and foster synergy between economic growth and environmental improvement (Luo et al., 2023) [30]. As a provider of high-performance computing resources, computing infrastructure accelerates green technology R&D, processes massive environmental data via machine learning, reduces trial-and-error costs, and enhances green patent output efficiency (Brynjolfsson et al., 2017) [31]. Meanwhile, computing networks break down traditional geographical barriers, facilitating the diffusion of green knowledge across urban clusters and forming open innovation communities that lower innovation thresholds (Gao et al., 2026) [32]. Furthermore, computing deployment directs capital toward low-carbon projects through data-driven governance mechanisms, creating positive feedback loops (Bresnahan & Yin, 2017) [33]. Collectively, these mechanisms not only increase the scale and quality of urban green innovation but also enhance urban adaptability to climate change, injecting endogenous momentum into green transitions.
(2)
Energy efficiency—the pressure pathway. Supercomputing centers are inherently high-energy-consumption facilities; their operation inevitably reshapes the scale and structure of regional energy consumption, constituting the most direct physical mechanism through which computing deployment influences green growth. Improving energy efficiency can ease resource constraints, reduce carbon emissions, and achieve the decoupling of energy use from economic growth (Lin & Zhu, 2019) [34]. Computing-enabled IoT and big data analytics enable real-time monitoring and predictive optimization of urban energy systems, dynamically adjusting energy distribution to reduce peak-valley differences and idle waste (Brynjolfsson et al., 2017) [31]. Second, computing infrastructure facilitates the digital transformation of energy markets: blockchain- and AI-based energy trading platforms enable precise matching of distributed energy resources, reducing transmission losses and encouraging demand response mechanisms (Majumder & Chowdhury, 2025) [35]. Recent empirical studies show that in China’s first-tier cities, computing deployment helps improve energy efficiency and reduces industrial energy consumption through predictive maintenance (Xu, 2023) [36]. These pathways not only optimize existing energy infrastructure but also accelerate the structural shift from fossil fuels to clean energy.
(3)
Environmental regulation—through standard setting, enforcement, and incentive mechanisms—internalizes pollution externalities and guides firms toward greener practices (Fan et al., 2022; Coase, 2013) [37,38]. Computing-enabled remote sensing and satellite data analytics can build city-level environmental monitoring networks, enabling real-time tracking and early warning of pollutant emissions, precisely identifying violation sources via AI algorithms, reducing enforcement costs, and improving response speeds (Goldfarb & Tucker, 2019) [26]. Simultaneously, computing infrastructure optimizes the dynamic design of regulatory regimes, using big data to simulate policy impacts and evaluate the effects of carbon taxes or emissions trading schemes, thereby designing more precise incentive mechanisms (Majumder & Chowdhury, 2025) [35]. Moreover, computing networks strengthen public participation and information disclosure, enhancing social oversight through open data platforms and fostering a multi-stakeholder regulatory ecosystem (Aghion et al., 2020) [39]. These mechanisms collectively improve regulatory deterrence and efficiency, providing a solid governance foundation for urban green transitions. The relationship among the three pathways can be summarized as follows: the capability pathway provides the transition momentum, the pressure pathway captures the direct physical impact, and the institutional pathway determines the direction of convergence. The three are interdependent rather than independent, jointly forming the complete transmission chain through which computing deployment influences urban GTFP. Based on the above analysis, we propose:
H2: 
Computing infrastructure promotes urban green transitions by improving urban green innovation levels (green innovation effect), energy utilization efficiency (energy utilization effect), and government environmental regulation levels (environmental regulation effect).

4. Research Design

4.1. Model Specification

Based on the exogenous policy shock of supercomputing center construction, this paper empirically examines the impact of computing infrastructure on urban green total factor productivity (GTFP), and constructs a staggered difference-in-differences model as follows:
G T F P i t = β 0 + β 1 S u a n l i i t + β 2 C o n t r o l s i t + C i t y i + Y e a r t + ε i t
where G T F P i t denotes the green total factor productivity of city i in year t; S u a n l i i t is a dummy variable indicating the construction of a supercomputing center; C o n t r o l s i t represents control variables; β 0 is the constant term; β 1 is the coefficient of the explanatory variable; β 2 is the vector of coefficients for control variables; C i t y i denotes city fixed effects; Y e a r t denotes year fixed effects; and ε i t is the random error term.Given that the establishment of supercomputing centers spanned from 2010 to 2023, the standard two-way fixed effects estimator may suffer from bias due to heterogeneous treatment effects under staggered treatment (Goodman-Bacon, 2021) [40]. The baseline regression of this paper adopts the staggered DID estimator proposed by Callaway and Sant’Anna (2021) [41]. Taking cities that have not yet received treatment or never received treatment as the control group, it calculates and weighted aggregates the group-period average treatment effects, thereby effectively avoiding the negative weight problem.

4.2. Variable Definitions

4.2.1. Dependent Variable

Following Wang et al. (2020) [42], this paper measures urban GTFP using the biennial Malmquist–Luenberger (BML) productivity index based on the directional distance function, which avoids infeasible solutions in conventional Malmquist and Malmquist–Luenberger index decompositions, does not require recalculation when new data are added, and precludes technological regress. Set the direction vector as **g = (y, −b)**, which means keeping the desirable output unchanged and reducing the undesirable output in the same proportion. The BML index can be further decomposed into the efficiency change index and the technological progress index. Input variables include capital, labor, and energy consumption (see Table 1). Capital stock is used as a proxy for capital input, estimated following Hall and Jones (1999) [43] with minor adjustments. Labor input is approximated by the number of employed persons in urban units. Energy input is proxied by urban electricity consumption. Output variables include desirable and undesirable outputs. Desirable output is measured by urban GDP, deflated to the 2007 base year. Undesirable outputs include urban SO2 emissions, soot emissions, and wastewater discharge.

4.2.2. Explanatory Variable

Following standard DID practice, two dummy variables are constructed: a treatment variable treat (cities with an operational supercomputing center = 1, otherwise 0) and a time variable post (years after the center’s operation = 1, before = 0). Their interaction term, did (i.e., treat × post), is the core explanatory variable capturing the impact of computing infrastructure construction.

4.2.3. Control Variables

To address endogeneity from omitted variables, the following controls are selected: ① Economic development level (GDP): measured by the natural logarithm of per capita GDP. ② Financial development level (FDL): ratio of total annual deposits and loans of financial institutions to GDP. ③ Openness level (Openup): ratio of actual utilized foreign capital to GDP. ④ Government intervention (DGI): ratio of local general public budget expenditure to GDP. ⑤ Industrial structure (AIS): ratio of tertiary industry value added to secondary industry value added. ⑥ Education expenditure level (Eduexp): ratio of education expenditure to general government fiscal expenditure. ⑦ Human capital level (HCI): ratio of university student enrollment to total year-end population. Variable definitions and measurements are summarized in Table 2.

4.2.4. Data Sources and Processing

The sample consists of 284 Chinese cities from 2007 to 2023. Data are processed according to standard classification systems. GTFP inputs are estimated as described above. Control variable data are mainly from the China City Statistical Yearbook, CEIC database, CNRDS, and official city statistical bureau websites. All variables are adjusted to the 2007 base year; missing data are supplemented through official channels or linear interpolation. Descriptive statistics are presented in Table 3.

5. Empirical Analysis

5.1. Baseline Regression

To examine the impact of computing infrastructure (Suanli_it) on urban green total factor productivity (GTFP), based on regression model (1), Column (1) reports the results without control variables, while Column (2) reports the results with control variables (see Table 4). The results show that the coefficient of Suanli_it is significantly positive at the 5% level regardless of whether control variables are included. After controlling for other potential confounding factors, the coefficient rises from 0.074 to 0.081, indicating that the net promoting effect of computing infrastructure on urban green transition becomes more pronounced once the mixed effects of economic development stages and industrial structure characteristics are excluded. In terms of effect magnitude, this coefficient corresponds to approximately 0.83 times the sample standard deviation of GTFP, suggesting economic significance. These empirical results verify Hypothesis H1, demonstrating that computing infrastructure can indeed effectively promote urban green transition.

5.2. Parallel Trends and Dynamic Effects

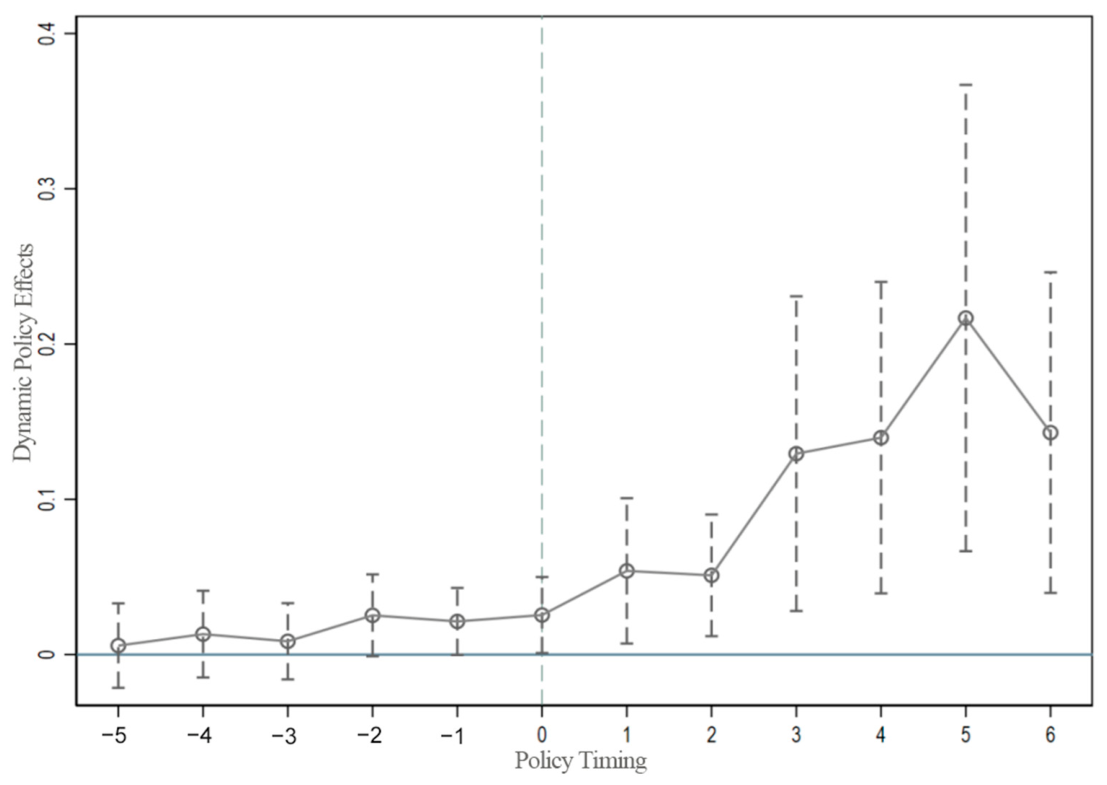
A key identifying assumption of DID is the parallel trends assumption—that treatment and control groups followed similar trends prior to the policy shock. Using data on 284 Chinese cities from 2007 to 2023, policy implementation years vary across centers (2010, 2012, 2014, 2015, 2016, 2021, 2022, 2023). Consequently, the possible event periods include {−16, −15, −14, −13, −12, −11, −10, −9, −8, −7, −6, −5, −4, −3, −2, −1, 0, 1, 2, 3, 4, 5, 6, 7, 8, 9, 10, 11, 12, 13}, where -i denotes the i-th period before policy implementation and i denotes the i-th period after. To prevent excessive disparities in sample sizes across periods, we consolidate pre-event periods 16 through 5 into a single pre-event period −5, retain the current period as period 0, and aggregate post-event periods 6 through 13 into a single post-event period 6. Thus, the “event” periods are set as {−5, −4, −3, −2, −1, 0, 1, 2, 3, 4, 5, 6} relative to the policy, with pre-event period −5 serving as the baseline. Employing an event study approach to conduct the parallel trends test (Tian et al., 2025) [44], we specify the following model (2):
G T F P it = β 0 + β n 5 6 T r e a t i × Post t n + Controls it + Year t + City i + ε it
Figure 3 presents the regression results, revealing that in the five periods preceding policy implementation, the dummy variable coefficients for each pre-event time point contain zero within the 95% confidence interval and fail to pass the significance test. This indicates no systematic differences in urban green total factor productivity (GTFP) between the treatment and control groups prior to the construction of supercomputing centers, thereby satisfying the parallel trends assumption. In the six periods following policy implementation, the dynamic effect coefficients exhibit an overall upward trend and all pass the significance test, demonstrating that the policy has generated a significant positive impact on GTFP in the short term. In summary, the results validate the positive promoting effect of the supercomputing center pilot policy on GTFP, further corroborating the robustness of the baseline regression findings.

5.3. Robustness Checks

(1)
Replacement of the Dependent Variable
To further validate the empirical findings, this study employs the SBM model with undesirable outputs, which adequately accounts for pollutant emissions and other adverse output factors (Du et al., 2010) [45], thereby ensuring estimation accuracy. Meanwhile, the GML index, which measures the rate of change in total factor productivity (i.e., the ML index) using a global reference DEA approach (Charnes et al., 1978; Oh, 2010) [46,47], effectively resolves the vertical incomparability problem arising from shifting production frontiers across different periods. Accordingly, the EFF model in Column (1) of Table 5 adopts the SBM model with undesirable outputs and the GML index framework. The baseline urban GTFP level is determined using stochastic frontier analysis, which is then cumulatively multiplied by the annual GTFP change indices to derive the final urban green total factor productivity.
(2)
PSM-DID
To mitigate the interference of sample selection bias on the research conclusions, this paper introduces the propensity score matching (PSM) method to systematically evaluate the impact of supercomputing centers on urban green transitions. Based on the dummy variable indicating whether a city is affected by supercomputing center construction, GTFP is treated as the dependent variable, while a series of control variables serve as explanatory variables in a Logit regression to compute the propensity score for each sample entering the treatment group. On this basis, a 1:1 nearest-neighbor matching method with replacement is adopted to select, for each treated city, a control city with the closest propensity score, thereby constructing a new sample that is highly comparable in terms of covariate distributions. After matching, regression estimation is re-conducted using Model (2). It should be noted that in panel settings with fixed effects, PSM-DID may discard information and cannot fully address unobserved confounding. Therefore, this paper treats PSM-DID only as supplementary evidence, while the core robustness inference relies primarily on alternative dependent variable specifications and the modern staggered DID estimator. The results in Column (2) of Table 5 show that the coefficient direction and statistical significance of supercomputing center construction (Suanli_it) remain consistent with those before matching, indicating that the baseline regression results are robust. This finding further corroborates the positive role of computing infrastructure deployment in promoting urban GTFP and provides empirical evidence for optimizing relevant policies and advancing urban green development practices.
(3)
Excluding Interference from Other Policies
Considering that the public data openness policy (GovDID) and the key atmospheric control zone policy (Atmocon) have implementation timelines similar to that of supercomputing center construction and are both aimed at promoting urban green development, potentially affecting GTFP, this paper further incorporates interaction terms for these two policies into the baseline regression model (1) to exclude potential interference from these concurrent policies. These interaction terms are constructed, respectively, from the dummy variables for pilot cities of each policy and their implementation time dummies. Column (3) of Table 5 reports the regression results after controlling for these policy variables, showing that the estimated coefficient of supercomputing center construction (Suanli_it) remains consistent with the baseline regression in both direction and significance. This approach confirms that, after effectively isolating the overlapping effects of other related policies, the promoting effect of computing infrastructure deployment on urban GTFP remains significant, thereby further strengthening the robustness of the core conclusions of this study.
(4)
Placebo Test
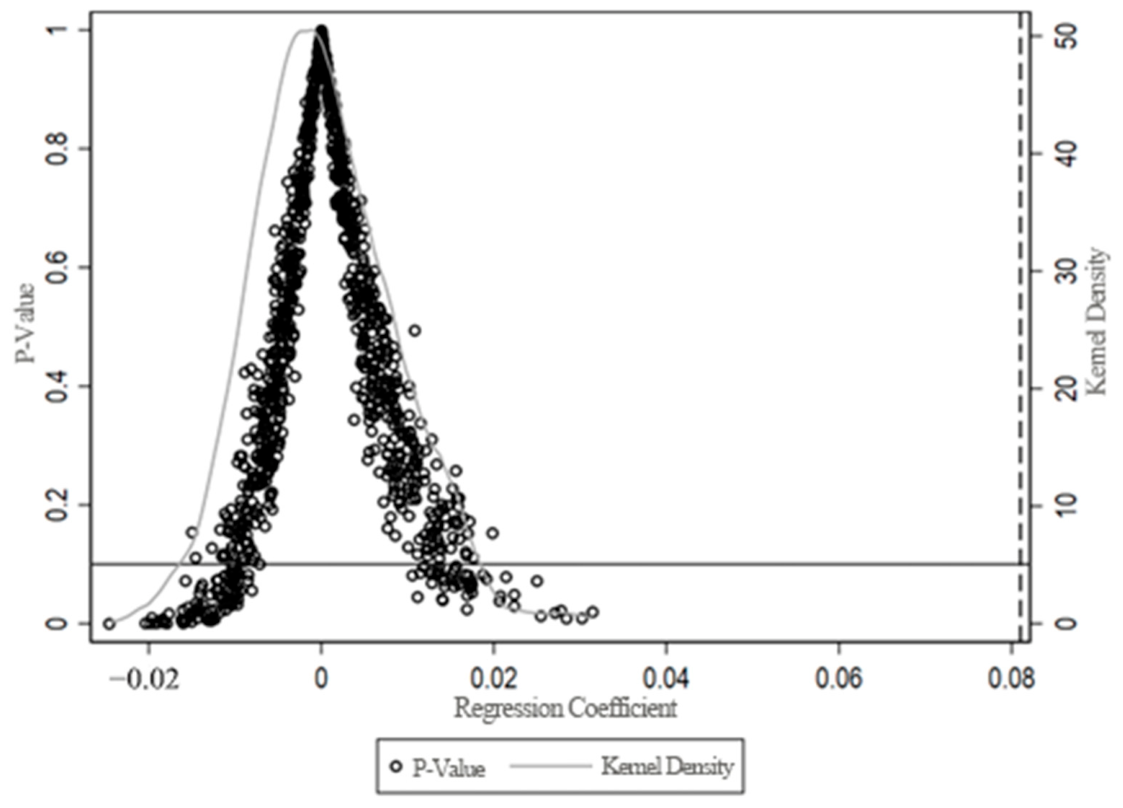
To rule out the interference of unobservable factors or model misspecification on the baseline regression results, this paper conducts a placebo analysis by randomly assigning the regions and years in which supercomputing centers were constructed (Figure 4). Specifically, we randomly draw 12 cities from the full sample to construct a fictitious treatment group and re-perform the regression estimation based on this pseudo-sample. The underlying logic of this test is that if the model specification suffers from identification bias due to omitted variables, the estimated coefficient of the interaction term may exhibit statistical significance even with a randomly generated treatment group. Conversely, if the coefficient does not significantly deviate from zero, it suggests that the baseline results are not driven by latent confounding factors. Figure 4 displays the kernel density distribution of the estimated coefficients from 1000 random simulations along with the distribution of their corresponding p-values. The results show that the mean of these simulated coefficients is close to zero, and the vast majority of p-values exceed the 0.1 significance level, indicating that the randomly generated variables produce no systematic effects. Moreover, none of the simulated coefficients surpass the black dashed line in the figure representing the true policy effect, which stands in stark contrast to the baseline regression results, thereby providing counterfactual evidence supporting the baseline conclusions. Hence, the test results confirm the validity of the baseline regression specification and demonstrate that the observed findings are robust, ruling out the possibility that omitted variables or research design flaws drive spurious causal relationships.
Overall, although the above robustness tests cannot completely rule out all endogeneity threats, the placebo test eliminates the interference of unobservable random factors. The results obtained by replacing the explained variables and controlling for other policy shocks remain robust, which enhances the credibility of the conclusions of this paper.

5.4. Mediation Mechanism Tests

Within the framework of empirical analysis, mediation effect testing plays a crucial role in uncovering the intrinsic mechanisms through which supercomputing centers promote urban green total factor productivity (GTFP). Following the methodology of Celli (2022) [48], this study employs a rigorous two-step approach to verify the mediation transmission process. First, based on Model (1), urban GTFP is taken as the dependent variable and the supercomputing center indicator (Suanli_it) as the core explanatory variable, aiming to directly assess the direct impact of computing infrastructure construction on urban GTFP. Subsequently, to further explore the specific pathways through which supercomputing centers affect urban GTFP performance, this paper constructs Model (3), in which the mediator variable (Mediator) serves as the dependent variable while retaining Suanli_it as the explanatory variable. In this model, we focus on the regression coefficient of the supercomputing center on the mediator. A positive coefficient indicates that the supercomputing center promotes urban GTFP by enhancing the mediator; a negative coefficient implies that it exerts its effect by reducing the mediator.
Mediator it = β 0 + β 1 Suanli _ it it + Controls it + Year t + City i + ε it
Green technological innovation not only directly improves urban environmental performance but also drives substantial progress in overall green transition performance by internalizing sustainable development concepts as core competitiveness. Accordingly, following Qi et al. (2018) [49], this paper measures urban green innovation level (Green) using the logarithm of one plus the number of green invention patent applications filed by enterprises in a given year, and incorporates it as the dependent variable into Model (3) for regression analysis.
The empirical results in Column (1) of Table 6 show that the regression coefficient of the core explanatory variable, Suanli_it, on Green is statistically significantly positive, indicating that the supercomputing center construction policy effectively stimulates urban green technological innovation activities. Thus, it can be inferred that computing infrastructure, by providing information support and innovation orientation, incentivizes urban green inventions, thereby integrating environmental responsibility into long-term development strategies and ultimately enhancing overall GTFP.
Following the research approach of Feng et al. (2009) [50], this paper uses the logarithm of urban energy consumption per unit GDP to measure energy consumption intensity (Energycon) and incorporates it as a mediator into the analytical framework. The regression results presented in Column (2) of Table 6 show that the coefficient of supercomputing centers on energy consumption intensity is significantly negative, indicating that the operation of supercomputing centers significantly reduces energy consumption per unit of GDP in host cities. This finding supports the transmission pathway through which computing infrastructure empowers green transition by improving energy efficiency: the data analytics and intelligent scheduling technologies supported by supercomputing centers optimize the operational efficiency of urban energy systems, reducing energy consumption per unit of output. The improvement in energy efficiency thus constitutes a key mediating channel through which computing infrastructure promotes urban GTFP.
Furthermore, government environmental regulation is a key institutional factor influencing the diffusion and application of green technologies. Remote sensing analysis and real-time emission tracking supported by supercomputing centers make environmental violations precisely visible, significantly lowering governments’ information cost in identifying pollution sources. This enhanced transparency alters local officials’ incentive structure—when pollution becomes quantifiable and attributable, higher-level governments can exercise accountability based on precise data, raising the weight of environmental performance in evaluation. Officials’ increased inclusion of environmental terms in government reports is thus both a response to accountability pressure and a strategic signal of governance commitment. Following Kunrong and Gang (2020) [51], this paper constructs an environmental regulation intensity indicator (Environregul) using the log of one plus the frequency of environment-related terms in city government work reports, and examines its mediating role. Column (3) of Table 6 shows that supercomputing centers significantly strengthen environmental regulation. This enhanced regulation internalizes pollution externalities and guides firms toward green practices, forming an institutional channel through which computing infrastructure promotes urban GTFP.
In summary, computing infrastructure promotes urban green transitions through three significant mediating pathways: first, the green innovation effect, which enhances green technology R&D capabilities; second, the energy utilization effect, which optimizes energy allocation and usage efficiency; and third, the environmental regulation effect, which strengthens government environmental monitoring and enforcement effectiveness. These three channels collectively constitute the key mechanisms through which computing infrastructure facilitates green transitions. Research hypothesis H2 thus receives empirical support.

5.5. Policy Synergy Effects

Beyond the baseline effect, the data also reveal policy synergies between supercomputing centers and several pilot programs. Column (1) of Table 7 shows a significantly positive interaction coefficient between supercomputing center construction and the low-carbon city (LCC) pilot policy, indicating that computing infrastructure and low-carbon policy environments jointly promote urban green technology R&D and application. Column (2) shows a significantly positive interaction coefficient with the carbon emissions trading scheme (ETS), revealing a complementary relationship where supercomputing centers enable real-time emission monitoring, allowance optimization, and carbon price prediction (Ma et al., 2025) [52]. Column (3) shows a significantly positive interaction coefficient with the national innovative city (NIC) pilot policy, indicating that the combination significantly enhances urban innovation capacity by lowering R&D thresholds for small and medium-sized enterprises and facilitating cross-disciplinary collaboration (Masanet et al., 2020) [17]. It should be noted, however, that pilot policies such as low-carbon cities, carbon emissions trading schemes, and innovative cities are not randomly assigned; a city’s selection into these pilots may be correlated with its economic development level, industrial structure, and environmental governance capacity. Therefore, although the above interaction coefficients are significantly positive, they identify conditional associations rather than causal complementarity in the strict sense. This paper treats the policy synergy findings as exploratory evidence, and more rigorous identification of complementarity awaits future research under more complete instrumental variable or doubly robust estimation frameworks.

5.6. Heterogeneity Analysis

5.6.1. Regional Heterogeneity

Given regional disparities in economic development and resource endowments, this paper divides the sample cities into coastal and non-coastal groups following the classification of Liu and Zhu (2022) [53] to examine how geographic location moderates the effect of supercomputing center pilots (Table 8). Columns (1) and (2) of Table 8 show that the impact of supercomputing center pilots on urban GTFP is only significant in the coastal group. This finding suggests that non-coastal areas may lag in digital infrastructure, talent pools, and policy support related to supercomputing, resulting in weaker spillovers of supercomputing technology and thus an insignificant GTFP improvement. In contrast, coastal regions possess superior digital infrastructure and more vibrant innovation ecosystems, enabling supercomputing technology to penetrate productive activities more effectively and enhance GTFP.

5.6.2. City Size Heterogeneity

A review of the literature indicates that the time–space compression effect generated by supercomputing centers varies with city size. To address whether supercomputing centers exert heterogeneous effects on GTFP across different city sizes, this paper classifies the sample into large and non-large cities following Cheng et al. (2022) [54]. Columns (3) and (4) of Table 8 reveal that the effect of supercomputing center pilots on urban GTFP is significant only in the non-large city group. Specifically, the coefficient for the non-large city group is 0.019 and statistically significant at the 1% level, while the coefficient for the large city group is 0.055 but does not pass the significance test. In terms of statistical significance, therefore, the effect is present only in the non-large city group. It should be noted, however, that the coefficient for non-large cities is smaller in economic magnitude than that for coastal cities (0.080), indicating that despite its statistical significance, the actual effect size is relatively modest. The relatively weaker industrial base and resource endowments of non-large cities may make them more sensitive to the technological empowerment and policy signals provided by supercomputing centers, thereby enabling a more effective translation of data and computing support into actual improvements in green production efficiency. This sensitivity, however, is reflected primarily in statistical detectability rather than in a superior effect magnitude. Conversely, large cities already possess mature computing infrastructure and innovation networks, leading to diminishing marginal returns from pilot policies. Moreover, the complex economic structures and overlapping multiple policies in large cities may dilute the utilization efficiency of supercomputing resources, further weakening their targeted contribution to GTFP enhancement.

5.6.3. Digital Infrastructure Heterogeneity

The core objective of computing infrastructure deployment is to improve regional computing capacity and thereby facilitate urban green transitions. However, differences in digital infrastructure conditions across regions directly influence policy implementation effectiveness. Accordingly, this paper adopts the classification system of Peng et al. (2024) [55] to divide the sample into regions with strong digital infrastructure and regions with weak digital infrastructure. Columns (5) and (6) of Table 8 show that the positive effect of supercomputing center pilots on urban GTFP is statistically significant only in regions with relatively weak digital infrastructure. This result may reveal a “leveling-up” or “gap-filling” effect of supercomputing centers in promoting GTFP. In digitally weak regions, the introduction of supercomputing centers may fill critical gaps in high-end computing power, data processing capabilities, and technological innovation, enabling these regions to more effectively leverage new technologies to address environmental issues and optimize production processes, thereby achieving significant GTFP improvements. Conversely, regions with strong digital infrastructure already possess well-established network and computing systems, making the incremental contribution of pilot policies nearly saturated. Their marginal benefits, supported by the overall digital ecosystem, fail to stand out as a direct and significant driver of GTFP, or their role is absorbed by other existing mature digital technologies. In summary, the differential effects of supercomputing center pilot policies under varying digital infrastructure conditions underscore the importance of tailoring computing deployment to local conditions in conjunction with urban green transitions, providing differentiated and targeted practical guidance for subsequent policymaking.

6. Further Analysis: Spatial Heterogeneity

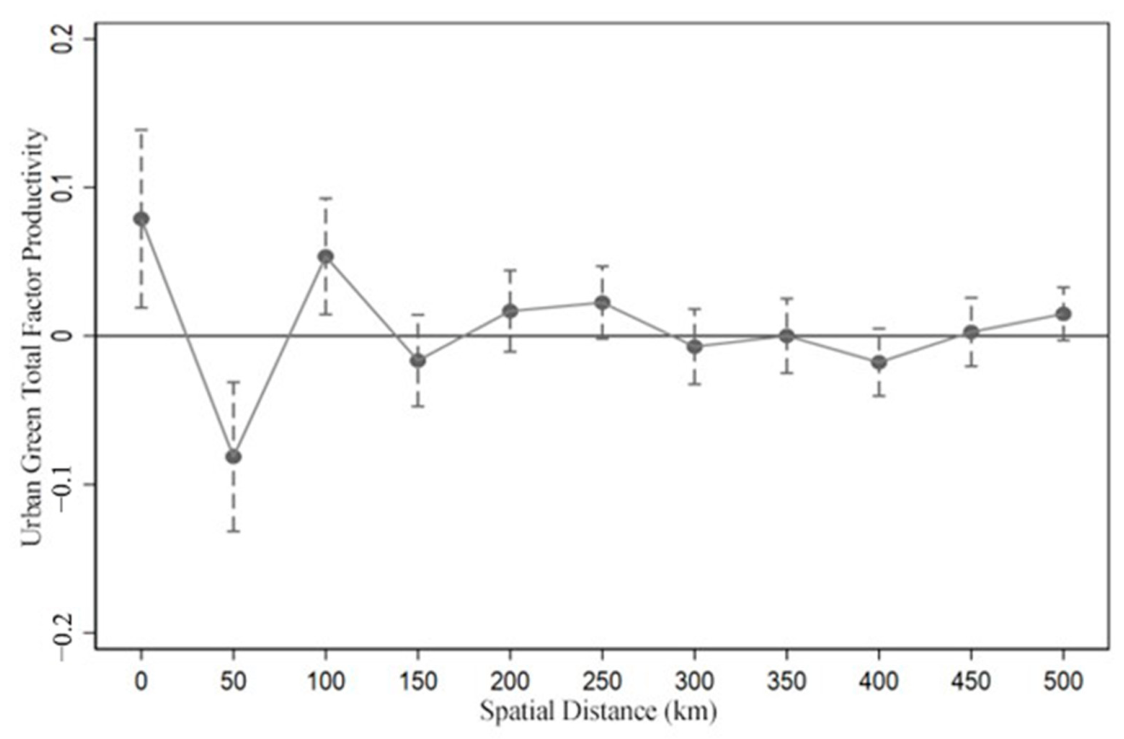
Drawing on agglomeration economy theory, this section examines whether the green effects of supercomputing centers follow the distance-decay pattern typically observed in knowledge spillovers. Prior research has shown that high-level innovation resources tend to generate agglomeration shadows in their immediate vicinity, with positive spillovers emerging only beyond a certain distance threshold (Combes & Gobillon, 2015; Rosenthal & Strange, 2004) [56,57]. Whether the spatial pattern of computing infrastructure’s green effects conforms to this theoretical expectation is an open empirical question. Within the framework of regional economic theory, spatial distance is not a simple linear variable but regulates the spatial flow of resource factors and technology through an “area-source effect.” As an area-source formed by the agglomeration of high-density computing resources, a supercomputing center exerts a clear distance-threshold effect on green total factor productivity (GTFP). The empirical results shown in Figure 5 indicate that as the spatial distance from the supercomputing center increases, its driving effect on the economic growth of surrounding cities follows an S-shaped evolution: first declining, then rising, and finally weakening. Specifically, within a 0–50 km radius of the host city, the supercomputing center exhibits a siphoning effect on the green development of surrounding cities, consistent with agglomeration economic theory. Cities too close to the supercomputing center show insignificant green development promotion, due to the agglomeration shadow effect. As shown in Figure 5, although the agglomeration shadow covers the 50 km radius around the center, the siphoning effect within this range fails the significance test. This indicates that the supercomputing center’s driving effect on regional green development comes from net growth rather than existing resource reallocation. The siphoning effect coefficient is negative but not statistically significant; while consistent with the agglomeration shadow hypothesis, this does not firmly confirm the siphoning effect, and the observed pattern is merely suggestive rather than conclusive. Once the spatial distance exceeds the critical threshold of 50–100 km, the impact of the supercomputing center on urban GTFP turns from negative to positive and continuously releases positive spatial spillovers within its effective radiation range, becoming a key driver of regional green development. This interval is the core range where the supercomputing center significantly promotes the green development of surrounding cities, and as distance increases within this range, the nearby factor siphoning effect gradually weakens. When the distance exceeds 250–300 km, the driving effect on surrounding urban economic growth becomes insignificant again, confirming the central tenet of agglomeration economic theory: only by escaping the constraint of the agglomeration shadow can a supercomputing center release a significant positive driving effect, and when the distance is too great, the driving effect flattens out, with noticeable fluctuations, and gradually converges to zero. These findings further validate the spatially heterogeneous nature of the supercomputing center’s driving effect on regional green development.
It should be noted that the presence of these spatial spillover effects raises a potential concern for the validity of the DID framework. If supercomputing centers exert spillover influences on neighboring cities, then some control cities may be indirectly affected by the treatment, potentially violating the Stable Unit Treatment Value Assumption (SUTVA) on which the DID identification relies. The spatial analysis presented here is conducted separately from the baseline DID estimation and does not embed spatial dependence within the core identification framework. Consequently, the baseline treatment effects reported in this paper should be interpreted as total effects that may incorporate local spillover influences, while the distance-decay patterns reported here offer a reference for understanding the spatial boundaries of these effects.

7. Conclusions and Policy Implications

7.1. Research Conclusions

Against the backdrop of intensifying global climate change and China’s advancement of its “dual carbon” goals, green total factor productivity (GTFP) has become a core indicator for measuring urban sustainable development. However, as a new factor of production, the net effect of computing infrastructure on urban green transitions remains unclear, with a notable gap in existing research. Based on panel data from Chinese prefecture-level cities spanning 2007 to 2023 and employing the staggered commissioning of 12 National Supercomputing Centers as a quasi-natural experiment, this study systematically investigates the impact of computing infrastructure on urban GTFP using a time-varying difference-in-differences approach. The results show that supercomputing center operation has a statistically significant positive association with urban GTFP, a finding that remains robust across multiple robustness checks. This effect operates through three pathways: strengthening green technological innovation, optimizing energy utilization efficiency, and enhancing environmental regulatory effectiveness. Heterogeneity analysis reveals that the positive effect is more pronounced in coastal cities, small-to-medium-sized cities, and regions with weak digital infrastructure. Spatially, supercomputing centers exhibit a siphoning effect within 0–50 km, release positive spillovers within 50–200 km, and show significant decay at longer distances. Moreover, supercomputing centers have significant synergistic effects with green development policies and innovative city pilot policies. These findings provide empirical reference for governments to optimize computing infrastructure layout and providing empirical evidence from China for understanding the green effects of computing infrastructure. At the same time, given the methodological limitations discussed—including potential endogeneity concerns, the reliance on correlational mechanism analysis, and possible spatial spillover effects—these conclusions should be interpreted with appropriate caution, and more rigorous causal identification awaits further research.

7.2. Policy Implications

First, guide the layout of computing infrastructure and strengthen policy synergy to fully realize the positive enabling effect of supercomputing centers on urban GTFP. Based on the baseline findings of this study, supercomputing center operation significantly promotes urban GTFP and exhibits notable synergies with low-carbon, carbon trading, and innovative city pilot policies, conclusions that remain robust after multiple rounds of robustness checks. Given China’s current “dual carbon” goals and the construction of a national integrated computing network, it is advisable to coordinate computing infrastructure layout in light of local demand and resource endowments, leveraging the national hub nodes of the “East Data, West Computing” project, and to reduce homogeneous redundant construction. Specifically, targeted investment in supercomputing center construction could be increased, and the supporting system for computing infrastructure could be improved. Where conditions permit, supercomputing centers may be more closely aligned with existing low-carbon and innovation policies, and the possibility of incorporating computing-enabled green development indicators into local ecological civilization assessment systems may be explored. At the same time, implementing relevant green computing facility standards, disseminating best practices in green computing infrastructure construction, and improving the energy efficiency of supercomputing centers themselves would help ensure the full realization of their positive effects and deepen the integration of the digital economy with ecological civilization construction.
Second, focus on the core transmission mechanisms to reinforce the internal drivers through which supercomputing centers enhance urban GTFP. The mechanism analysis in this paper confirms that supercomputing centers promote urban GTFP primarily through three pathways: strengthening green technological innovation, optimizing energy utilization efficiency, and enhancing environmental regulatory effectiveness. These constitute the core logic of computing infrastructure’s green enabling role. Currently, electricity consumption by computing facilities in China continues to rise, and the efficiency of green technology transformation remains insufficient, constraining the full play of computing’s enabling effects. In light of this, several measures may be considered. Specifically, open access to supercomputing centers for research institutions and enterprises could be expanded, and dedicated computing support programs for green technology R&D may be encouraged. Furthermore, cities with the requisite conditions may explore the use of supercomputing data processing capabilities to support energy dispatch optimization and environmental monitoring. Meanwhile, encouraging existing supercomputing centers to adopt advanced energy-saving technologies, drawing on green computing retrofit experience, would help reduce the energy consumption of computing facilities themselves—a foundational condition for realizing their green enabling effects.
Third, implement differentiated computing support policies to enhance the precision and effectiveness of policy implementation while balancing regional and industrial coordinated development. The heterogeneity analysis of this study shows that the positive effect of supercomputing centers on urban GTFP is more pronounced in coastal cities, small-to-medium-sized cities, and regions with weak digital infrastructure, and exhibits spatial spillover characteristics: a siphoning effect within 0–50 km and positive spillovers within 50–200 km. Given the reality of unbalanced regional development and uneven digital infrastructure distribution in China, policy implementation could consider differentiated approaches based on local conditions. Specifically, for coastal cities, supercomputing centers may be integrated with marine economy and green manufacturing needs to deepen computing application scenarios. For small-to-medium-sized cities and regions with weak digital infrastructure, investment in computing infrastructure could be moderately increased, while accounting for local industrial carrying capacity and power supply conditions. In terms of spatial coordination, the radiation range of supercomputing centers exhibits a certain distance threshold, suggesting that cross-regional computing collaboration may be prioritized within the effective radiation distance. However, more precise optimal layout design awaits further systematic spatial economic analysis.

7.3. Research Limitations

Like any empirical study, this research has several limitations. First, the data are limited to Chinese prefecture-level cities, without county-level or cross-country data for further evaluation. Thus, the impact of computing infrastructure on GTFP at the county level and in international contexts awaits further investigation. Second, although this study examines the local spatial spillover effects of supercomputing centers, it does not comprehensively extend to larger regional scales nor systematically investigate the spatial spillover mechanisms and heterogeneous spatial impacts of computing infrastructure on regional GTFP growth by incorporating differences in computing infrastructure layout and environmental governance levels in surrounding cities. Third, like all studies exploring the role of computing in enabling green development, we cannot infer all potential channels through which urban GTFP may be promoted. Our analysis focuses on only three mechanisms: green technological innovation, energy utilization efficiency, and environmental regulatory effectiveness. Moreover, it should be acknowledged that the current mediation analysis relies on a two-step estimation approach, which identifies conditional associations rather than establishing causal mediation in the strict sense. More rigorous causal mediation identification using instrumental variables or experimental designs awaits future research. We believe that more in-depth analysis of these issues can yield persuasive conclusions and open a referable path for future research. As with any empirical study, and particularly as one focusing on China—a developing country context—our work also has these limitations.


Author Contributions

Conceptualization, Z.Z.; Methodology, Z.Z.; Validation, Z.Z.; Investigation, Z.Z.; Resources, Z.L.; Writing—original draft, Z.Z.; Writing—review & editing, Z.L.; Supervision, Z.L.; Funding acquisition, Z.L. All authors have read and agreed to the published version of the manuscript.

Funding

National Natural Science Foundation of China (NSFC), Grant No.: 42061024.

Institutional Review Board Statement

Not applicable.

Informed Consent Statement

Not applicable.

Data Availability Statement

The original contributions presented in this study are included in the article. Further inquiries can be directed to the corresponding author.

Conflicts of Interest

The authors declare no conflict of interest.

References

  1. Zhou, L.; Fan, J.; Hu, M.; Yu, X. Clean air policy and green total factor productivity: Evidence from Chinese prefecture-level cities. Energy Econ. 2024, 133, 107512. [Google Scholar] [CrossRef]
  2. Yang, H.; Wang, G. The impact of computing infrastructure on carbon emissions: An empirical study based on China national supercomputing center. Environ. Res. Commun. 2023, 5, 095015. [Google Scholar] [CrossRef]
  3. Obringer, R.; Rachunok, B.; Maia-Silva, D.; Arbabzadeh, M.; Nateghi, R.; Madani, K. The overlooked environmental footprint of increasing Internet use. Resour. Conserv. Recycl. 2021, 167, 105389. [Google Scholar] [CrossRef]
  4. Tang, C.; Xu, Y.; Hao, Y.; Wu, H.; Xue, Y. What is the role of telecommunications infrastructure construction in green technology innovation? A firm-level analysis for China. Energy Econ. 2021, 103, 105576. [Google Scholar] [CrossRef]
  5. Cheng, H.; Ruan, P.; Wang, P. The impact of surging computing power on enterprise digital transformation—Based on quasi-natural experiments set up by the National Supercomputing Center. Finance Res. Lett. 2024, 65, 105496. [Google Scholar] [CrossRef]
  6. Gu, B.; Liu, J.; Ji, Q. The effect of social sphere digitalization on green total factor productivity in China: Evidence from a dynamic spatial Durbin model. J. Environ. Manag. 2022, 320, 115946. [Google Scholar] [CrossRef] [PubMed]
  7. Yu, B.; Fang, D.; Pan, Y.; Jia, Y. Countries’ green total-factor productivity towards a low-carbon world: The role of energy trilemma. Energy 2023, 278, 127894. [Google Scholar] [CrossRef]
  8. Jiang, S.; Li, Y.; Lu, Q.; Hong, Y.; Guan, D.; Xiong, Y.; Wang, S. Policy assessments for the carbon emission flows and sustainability of Bitcoin blockchain operation in China. Nat. Commun. 2021, 12, 1938. [Google Scholar] [CrossRef] [PubMed]
  9. Wang, L.; Shao, J. The energy saving effects of digital infrastructure construction: Empirical evidence from Chinese industry. Energy 2024, 294, 130778. [Google Scholar] [CrossRef]
  10. Zhang, W.; Fan, H.; Zhao, Q. Seeing green: How does digital infrastructure affect carbon emission intensity? Energy Econ. 2023, 127, 107085. [Google Scholar] [CrossRef]
  11. Li, Y.; Li, B.; Chen, J.; Zhang, Y.; Hu, Y.; Li, C. Data-Driven Green Transformation: How Public Data Openness Fuels Urban Land Use Eco-Efficiency in Chinese Cities. Land 2025, 14, 990. [Google Scholar] [CrossRef]
  12. Yang, X.; Razzaq, A.; Ozturk, I. Mechanisms of digitalization in reshaping the green transformation of energy firms in China. J. Environ. Manag. 2025, 393, 127047. [Google Scholar] [CrossRef]
  13. Rao, B. Does Digital Infrastructure Construction Serve as a New Engine for Green Sustainable Innovation? A Quasi-Natural Experiment Based on the” Broadband China” Pilot Policy. Pol. J. Environ. Stud. 2025, 34, 4363–4376. [Google Scholar] [CrossRef]
  14. Chen, J.; Lv, Y.; Yang, P.; Zheng, Y. New evidence in sustainable development: Does digital infrastructure improve energy utilization efficiency? J. Knowl. Econ. 2025, 16, 15072–15100. [Google Scholar] [CrossRef]
  15. Chen, C.; Li, S.E.; Wang, L. Can smart cities reduce labor misallocation? Evidence from China. Technol. Forecast. Soc. Change 2024, 201, 123264. [Google Scholar] [CrossRef]
  16. Liu, X.M.; Zhang, Y.Q. Study on the impact of intelligent city pilot on green and low-carbon development. Environ. Sci. Pollut. Res. 2023, 30, 57882–57897. [Google Scholar] [CrossRef]
  17. Masanet, E.; Shehabi, A.; Lei, N.; Smith, S.; Koomey, J. Recalibrating global data center energy-use estimates. Science 2020, 367, 984–986. [Google Scholar] [CrossRef]
  18. Uddin, M.; Rahman, A.A. Energy efficiency and low carbon enabler green IT framework for data centers considering green metrics. Renew. Sustain. Energy Rev. 2012, 16, 4078–4094. [Google Scholar] [CrossRef]
  19. Yu, S.; Liu, D.; Gao, J. Can’t have your cake and eat it too? The impact of digital infrastructure construction on urban ecological welfare performance—A quasi-natural experiment based on the “broadband China” strategy. Land 2024, 13, 2125. [Google Scholar] [CrossRef]
  20. Gates, K. Infrastructure Photography and the AI Data Center Building Boom. Photogr. Cult. 2025, 18, 263–279. [Google Scholar] [CrossRef]
  21. Guo, J.; Wang, L.; Zhou, W.; Wei, C. Powering green digitalization: Evidence from 5G network infrastructure in China. Resour. Conserv. Recycl. 2022, 182, 106286. [Google Scholar] [CrossRef]
  22. Bianchini, S.; Damioli, G.; Ghisetti, C. The environmental effects of the “twin” green and digital transition in European regions. Environ. Resour. Econ. 2023, 84, 877–918. [Google Scholar] [CrossRef]
  23. Yazar, M.; Hestad, D.; Mangalagiu, D.; Saysel, A.K.; Ma, Y.; Thornton, T.F. From urban sustainability transformations to green gentrification: Urban renewal in Gaziosmanpaşa, Istanbul. Clim. Change 2020, 160, 637–653. [Google Scholar] [CrossRef]
  24. Dhyani, S.; Lahoti, S.; Khare, S.; Pujari, P.; Verma, P. Ecosystem based Disaster Risk Reduction approaches (EbDRR) as a prerequisite for inclusive urban transformation of Nagpur City, India. Int. J. Disaster Risk Reduct. 2018, 32, 95–105. [Google Scholar] [CrossRef]
  25. Kong, F.; Wang, Q.; Liu, X.; Wen, C.; He, Q. Green development effect assessment and driving force analysis of the new infrastructure construction in China. Environ. Dev. Sustain. 2024, 1–31. [Google Scholar] [CrossRef]
  26. Goldfarb, A.; Tucker, C. Digital economics. J. Econ. Lit. 2019, 57, 3–43. [Google Scholar] [CrossRef]
  27. Acemoglu, D.; Autor, D.; Dorn, D.; Hanson, G.H.; Price, B. Import competition and the great US employment sag of the 2000s. J. Labor Econ. 2016, 34, S141–S198. [Google Scholar] [CrossRef]
  28. Liu, Y.; Yang, Y.; Li, H.; Zhong, K. Digital economy development, industrial structure upgrading and green total factor productivity: Empirical evidence from China’s cities. Int. J. Environ. Res. Public Health 2022, 19, 2414. [Google Scholar] [CrossRef]
  29. Xiao, X.; Liu, C.; Li, S. How the digital infrastructure construction affects urban carbon emissions—A quasi-natural experiment from the “Broadband China” policy. Sci. Total Environ. 2024, 912, 169284. [Google Scholar] [CrossRef]
  30. Luo, G.; Guo, J.; Yang, F.; Wang, C. Environmental regulation, green innovation and high-quality development of enterprise: Evidence from China. J. Clean. Prod. 2023, 418, 138112. [Google Scholar] [CrossRef]
  31. Brynjolfsson, E.; Rock, D.; Syverson, C. Artificial Intelligence and the Modern Productivity Paradox: A Clash of Expectations and Statistics; No. w24001; National Bureau of Economic Research: Cambridge, MA, USA, 2017. [Google Scholar]
  32. Gao, H.; Li, F.; Zhang, J.; Shi, W.; Sun, Y. Digital Infrastructure and Industrial Decarbonization: Evidence from the Dual Perspectives of Green Innovation and Digital Coordination in China. Econ. Anal. Policy 2026, 90, 1220–1237. [Google Scholar] [CrossRef]
  33. Bresnahan, T.; Yin, P.L. Adoption of new information and communications technologies in the workplace today. Innov. Policy Econ. 2017, 17, 95–124. [Google Scholar] [CrossRef]
  34. Lin, B.; Zhu, J. Impact of energy saving and emission reduction policy on urban sustainable development: Empirical evidence from China. Appl. Energy 2019, 239, 12–22. [Google Scholar] [CrossRef]
  35. Majumder, A.; Chowdhury, L. Digital Transformation in Energy Sector Sustainability: Accelerating Sustainable Energy Solutions through AI and Blockchain in Emerging Markets. Master’s Thesis, University of Vaasa, Vaasa, Finland, 2025. [Google Scholar]
  36. Xu, X. Does green finance promote green innovation? Evidence from China. Environ. Sci. Pollut. Res. 2023, 30, 27948–27964. [Google Scholar] [CrossRef] [PubMed]
  37. Fan, M.; Yang, P.; Li, Q. Impact of environmental regulation on green total factor productivity: A new perspective of green technological innovation. Environ. Sci. Pollut. Res. 2022, 29, 53785–53800. [Google Scholar] [CrossRef]
  38. Coase, R.H. The problem of social cost. J. Law Econ. 2013, 56, 837–877. [Google Scholar] [CrossRef]
  39. Aghion, P.; Antonin, C.; Bunel, S.; Jaravel, X. What are the labor and product market effects of automation? New evidence from France. Res. Br. Econ. Policy 2020, 225, 1–2. [Google Scholar]
  40. Goodman-Bacon, A. Difference-in-differences with variation in treatment timing. J. Econom. 2021, 225, 254–277. [Google Scholar] [CrossRef]
  41. Callaway, B.; Sant’Anna, P.H. Difference-in-differences with multiple time periods. J. Econom. 2021, 225, 200–230. [Google Scholar] [CrossRef]
  42. Wang, K.L.; Pang, S.Q.; Ding, L.L.; Miao, Z. Combining the biennial Malmquist–Luenberger index and panel quantile regression to analyze the green total factor productivity of the industrial sector in China. Sci. Total Environ. 2020, 739, 140280. [Google Scholar] [CrossRef]
  43. Hall, R.E.; Jones, C.I. Why do some countries produce so much more output per worker than others? Q. J. Econ. 1999, 114, 83–116. [Google Scholar] [CrossRef]
  44. Tian, L.H.; Li, Z.; Shi, B.Z. Cloud adoption and corporate innovation: Insights from data as a factor of production. J. World Econ. 2025, 48, 178–210. [Google Scholar]
  45. Du, J.; Liang, L.; Zhu, J. A slacks-based measure of super-efficiency in data envelopment analysis: A comment. Eur. J. Oper. Res. 2010, 204, 694–697. [Google Scholar] [CrossRef]
  46. Charnes, A.; Cooper, W.W.; Rhodes, E. Measuring the efficiency of decision making units. Eur. J. Oper. Res. 1978, 2, 429–444. [Google Scholar] [CrossRef]
  47. Oh, D.H. A global Malmquist-Luenberger productivity index. J. Product. Anal. 2010, 34, 183–197. [Google Scholar] [CrossRef]
  48. Celli, V. Causal mediation analysis in economics: Objectives, assumptions, models. J. Econ. Surv. 2022, 36, 214–234. [Google Scholar] [CrossRef]
  49. Qi, S.; Lin, S.; Cui, J. Do environmental rights trading schemes induce green innovation? Evidence from listed firms in China. Econ. Res. J. 2018, 53, 129–143. [Google Scholar]
  50. Feng, T.; Sun, L.; Zhang, Y. The relationship between energy consumption structure, economic structure and energy intensity in China. Energy Policy 2009, 37, 5475–5483. [Google Scholar] [CrossRef]
  51. Kunrong, S.; Gang, J. The policy effects of the environmental governance of Chinese local governments: A study based on the progress of the River Chief System. Soc. Sci. China 2020, 41, 87–105. [Google Scholar] [CrossRef]
  52. Ma, H.; Huang, Z.; Lu, G.; Fu, D.; Shi, C. Greening Edge AI: Optimizing Inference Accuracy and Reducing Carbon Emissions With Renewable Energy. IEEE Internet Things J. 2025, 12, 24300–24312. [Google Scholar] [CrossRef]
  53. Liu, P.; Zhu, B. Temporal-spatial evolution of green total factor productivity in China’s coastal cities under carbon emission constraints. Sustain. Cities Soc. 2022, 87, 104231. [Google Scholar] [CrossRef]
  54. Cheng, L.; Mi, Z.; Sudmant, A.; Coffman, D.M. Bigger cities better climate? Results from an analysis of urban areas in China. Energy Econ. 2022, 107, 105872. [Google Scholar] [CrossRef]
  55. Peng, H.R.; Ling, K.; Zhang, Y.J. The carbon emission reduction effect of digital infrastructure development: Evidence from the broadband China policy. J. Clean. Prod. 2024, 434, 140060. [Google Scholar] [CrossRef]
  56. Combes, P.P.; Gobillon, L. The empirics of agglomeration economies. In Handbook of Regional and Urban Economics; Elsevier: Amsterdam, The Netherlands, 2015; Volume 5, pp. 247–348. [Google Scholar]
  57. Rosenthal, S.S.; Strange, W.C. Evidence on the nature and sources of agglomeration economies. In Handbook of Regional and Urban Economics; Elsevier: Amsterdam, The Netherlands, 2004; Volume 4, pp. 2119–2171. [Google Scholar]
Figure 1. Global computing power scale and growth rate (Source: China Academy of Information and Communications Technology, IDC, Gartner, TOP500).
Sustainability 18 05383 g001
Figure 2. Regional Distribution of China’s National Supercomputing Centers.
Sustainability 18 05383 g002
Figure 3. Parallel Trend Test.
Sustainability 18 05383 g003
Figure 4. Placebo Test.
Sustainability 18 05383 g004
Figure 5. Spatial Heterogeneity.
Sustainability 18 05383 g005
Table 1. Indicator System for Measuring Green Total Factor Productivity (GTFP) at Prefecture Level.
First-Level IndicatorsSecond-Level IndicatorsThird-Level IndicatorsIndicator Description
Input IndicatorsLabor FactorNumber of employees in municipal districtsUnit: 10,000 persons
Capital FactorCapital stockCalculated via the perpetual inventory method; Unit: 10,000 yuan
Resource FactorTotal urban electricity consumptionUnit: kWh; Used to measure resource consumption
Output IndicatorsDesirable OutputEconomic BenefitsBased on GDP at constant 2007 prices, measured by the natural logarithm of per capita GDP
Undesirable OutputPollutant EmissionsIndustrial wastewater discharge
Industrial sulfur dioxide (SO2) emissions
Industrial smoke and dust emissions
Table 2. Variable Symbols, Variable Names and Measurement Methods.
Variable SymbolVariable NameVariable Measurement
GTFPGreen Total Factor ProductivityBML productivity index
Suanli_itDID analysis of supercomputing center constructiontreat × post
GDPEconomic development levelper capita regional GDP (natural logarithm)
FDLFinancial development levelTotal deposits and loans/GDP
OpenupOpenness levelActual utilized foreign direct investment/Regional GDP
DGIGovernment interventionGeneral budgetary expenditure of local government/Regional GDP
AISIndustrial structureTertiary industry added value/Secondary industry added value
EduexpEducation expenditure levelEducation expenditure/General government fiscal expenditure
HCIHuman capital levelNumber of students enrolled in regular institutions of higher education/Total population at year-end
Table 3. Descriptive Statistical Results.
NMeanP50SDMinMax
GTFP48281.0261.0220.0980.5701.666
Suanli_it48280.0140.0000.1170.0001.000
GDP482810.60610.5640.7898.12613.185
FDL48282.4862.1541.2830.56021.301
DGI48280.1920.1650.1020.0441.027
Openup48280.0030.0020.0030.0000.029
AIS48281.0370.8980.5980.0946.387
Eduexp48280.1790.1770.0430.0150.792
HCI48280.0190.0100.0250.0000.185
Table 4. Benchmark Regression Results.
VARIABLESGTFP
(1)(2)
Suanli_it0.074 **0.081 **
(0.033)(0.035)
GDP 0.051 ***
(0.018)
FDL −0.000
(0.003)
DGI −0.254 ***
(0.053)
Openup −0.518
(1.137)
AIS 0.019
(0.014)
Eduexp −0.106
(0.075)
HCI −0.808 **
(0.381)
Constant1.025 ***0.553 ***
(0.000)(0.205)
Observations48284828
R-squared0.6320.652
yearfixYESYES
idfixYESYES
Note: t-values are shown in parentheses; **, and *** indicate significance at the 5%, and 1% levels, respectively. The same applies below.
Table 5. Robustness Test: Controlling for Other Policy Shocks.
(1)(2)(3)
Alternative DVPSM-DIDPolicy-Controlled
VARIABLESEFFGTFPGTFP
Suanli_it0.057 **0.087 **0.081 **
(0.025)(0.043)(0.036)
GovDID −0.014 **
(0.007)
Atmocon 0.009
(0.006)
ControlsYesYesYes
Constant0.433 ***0.885 **0.508 **
(0.166)(0.361)(0.209)
Observations482820914828
R-squared0.6550.6850.654
yearfixYESYESYES
idfixYESYESYES
Note: t-values are shown in parentheses; **, and *** indicate significance at the 5%, and 1% levels, respectively. The same applies below.
Table 6. Mediating Effect Test.
(1)(2)(3)
VARIABLESGreenEnergyconEnvironregul
Suanli_it0.158 **−0.034 ***0.119 **
(0.072)(0.010)(0.047)
ControlsYesYesYes
Constant−2.853 ***0.762 ***1.901 **
(1.000)(0.235)(0.899)
Observations482848284613
R-squared0.9530.5770.456
yearfixYESYESYES
idfixYESYESYES
Note: t-values are shown in parentheses; **, and *** indicate significance at the 5%, and 1% levels, respectively. The same applies below.
Table 7. Synergy Effect Analysis.
(1)(2)(3)
VARIABLESGTFPGTFPGTFP
Suanli_it × LCC0.091 **
(0.045)
Suanli_it × ETS 0.186 ***
(0.060)
Suanli_it × NIC 0.082 **
(0.034)
ControlsYesYesYes
Constant0.738 ***0.708 ***0.648 ***
(0.214)(0.209)(0.211)
Observations482848284777
R-squared0.6520.6570.654
yearfixYESYESYES
idfixYESYESYES
Note: t-values are shown in parentheses; **, and *** indicate significance at the 5%, and 1% levels, respectively. The same applies below.
Table 8. Heterogeneity Analysis.
(1)(2)(3)(4)(5)(6)
CoastalNon-
Coastal
Large CitiesNon-Large CitiesStrong Digital InfrastructureWeak Digital Infrastructure
VARIABLESGTFPGTFPGTFPGTFPGTFPGTFP
Suanli_it0.080 *0.0260.0550.019 ***0.0590.020 **
(0.042)(0.022)(0.040)(0.005)(0.037)(0.010)
ControlsYesYesYesYesYesYes
Constant0.583 *0.3340.7860.662 ***0.2570.648 ***
(0.317)(0.261)(0.855)(0.200)(0.348)(0.244)
Observations19212908595423413943435
R-squared0.5560.6970.5730.6750.6270.672
yearfixYESYESYESYESYESYES
idfixYESYESYESYESYESYES
Note: t-values are shown in parentheses; *, **, and *** indicate significance at the 10%, 5%, and 1% levels, respectively. The same applies below.
Disclaimer/Publisher’s Note: The statements, opinions and data contained in all publications are solely those of the individual author(s) and contributor(s) and not of MDPI and/or the editor(s). MDPI and/or the editor(s) disclaim responsibility for any injury to people or property resulting from any ideas, methods, instructions or products referred to in the content.