1. Introduction
The global food system is facing mounting pressure to reduce greenhouse gas emissions, land use intensity, and biodiversity impacts while ensuring protein security. Global meat demand trajectories suggest that consumption growth is closely associated with economic development. There is evidence of plateau effects above certain income thresholds [
1]. In this context, cultured meat has been posited as a potentially pertinent component of the broader protein transition. However, the sustainability contribution of cultured meat remains contingent on production pathways, energy sources, and scaling assumptions, and therefore cannot be regarded as automatically superior in all scenarios [
2,
3,
4]. Broader reviews of alternative protein technologies further highlight that regulatory uncertainty, production costs, and incomplete life-cycle assessments remain unresolved challenges across the sector [
5]. Within this broader protein transition framework, alternative protein technologies—including plant-based, fermentation-derived, and cultivated proteins—are increasingly discussed as candidate components of a sustainable food system, capable of addressing food security and environmental pressures simultaneously [
6]. The sustainability contribution of cultured meat in particular needs to be evaluated jointly across environmental, social, and technological–economic dimensions rather than reduced to any single axis [
7].
Demographic and dietary context further sharpens the relevance of this question for Chad. Chad has one of the world’s youngest population structures, with a median age of approximately 15–16 years and respondents aged 18–34 years constituting approximately 27% of the total population (within a total population of approximately 20.3 million in 2024) [
8]. Per capita meat consumption is among the lowest globally, estimated at approximately 13–15 kg per year, well below the African average of approximately 19 kg and the global average of approximately 43 kg [
9]. Conventional meat supply is dominated by smallholder pastoralism, with formal-sector production limited and import dependence pronounced in urban demand centres. This demographic-dietary structure positions any large-scale uptake of cultivated proteins as conditional on price competitiveness and on the availability of culturally legitimised channels of supply, both of which fall outside the strict food technology remit and into broader sustainability-governance considerations.
Notwithstanding advances in technology, consumer acceptance continues to be a significant impediment to market adoption. Recent evidence consistently indicates that acceptance is not solely determined by technological feasibility, but rather by psychological appraisals such as perceived naturalness, disgust, trust, perceived risk, and perceived product quality [
10,
11,
12]. A 2025 meta-analysis further demonstrated that perceptions specific to cultured meat (e.g., ethicality, expectations regarding taste, and disgust) tend to explain the willingness to consume more strongly than stable individual traits [
13]. Multi-country survey evidence further indicates that consumer acceptance of novel sustainable food technologies is shaped by interlocking psychological, ethical, and pragmatic considerations rather than by technological merit alone, with substantial between-country variation in the relative weight of these considerations [
14].
Cross-cultural studies have confirmed substantial between-country heterogeneity in acceptance profiles and in the relative importance of predictors, indicating that context-sensitive evidence is essential [
15,
16,
17]. A European systematic review further demonstrates that macro-regional and urban–rural differences systematically shape alternative protein adoption intentions, with Scandinavian countries showing markedly different patterns from Central-Eastern and Southern Europe [
18]. In the context of low- and middle-income settings, particularly in African contexts, the extant evidence base remains comparatively limited and concentrated in specific populations or countries [
19,
20,
21]. This is a critical gap because consumption practices, food norms, and trust structures are likely to differ from those observed in high-income countries. Analyses of regional food systems also indicate that emerging technologies should be assessed in relation to nutrition security realities rather than in isolation from local constraints [
22]. Comparable evidence from emerging-market settings—including a Chinese assessment of cultivated and artificial meat as a route to food security and reduced resource-environment pressure—similarly highlights between-country and within-country heterogeneity in consumer readiness, reinforcing the need for context-specific evidence in low- and middle-income contexts [
23].
This contextual issue is of particular relevance to Chad. Agriculture continues to represent a significant component of the economy [
24], and online recruitment may structurally select more connected urban subpopulations in settings where internet penetration remains limited [
25]. Therefore, it is imperative that empirical evidence from Chad is interpreted within the context of the specific social, economic, and digital-access conditions that prevail within the country, as opposed to being extrapolated directly from samples originating from Europe or North America. Furthermore, Chad’s predominantly Muslim population introduces religious acceptability considerations relevant to cultured meat, since halal compatibility depends on production process characteristics that remain under active scientific and theological discussion [
26,
27].
In this context, an analytical focus on younger, educated, urban respondents who consume meat is methodologically justified as an early entry segment for a novel meat technology. Multi-country African evidence has explicitly examined younger, urban, educated consumers as those most exposed to, and potentially engaged with, cultured meat concepts [
19]. The findings of the South African segmentation and choice-model studies indicate a higher level of openness among younger groups, including a higher relative preference among respondents under 28 years of age [
20,
21]. In addition, further evidence demonstrates that older cohorts tend to exhibit a lower willingness to try and higher neophobia-related barriers [
28,
29]. Evidence from African meat-eater samples further suggests that education level is associated with willingness to consume cultured meat in early-stage contexts [
30]. However, it is important to note that this segment should not be interpreted as uniformly accepting, as youth-focused studies also document persistent resistance related to disgust and unnaturalness [
31,
32]. The present study therefore treats young, educated, urban respondents who consume meat as a plausible early-adoption group, not as a proxy for the full Chadian population.
The extant literature has established a broad evidence base concerning the correlates of acceptance of cultured meat. However, four gaps remain particularly salient for the present investigation.
The initial lacuna pertains to geographical specificity. Evidence from Chad and from other Sub-Saharan African contexts with a high level of livestock importance and rapidly urbanising young populations remains limited. Existing African studies are informative but not fully transferable, because they are often geographically restricted or based on specific subpopulations [
19,
20,
21,
30]. Evidence from other developing-country contexts, such as South India, further indicates that food neophobia and perceived meat importance can remain major barriers, whereas animal welfare concerns and favourable sensory-health evaluations can facilitate acceptance [
33]. Furthermore, low-income and structurally underrepresented groups may require adapted designs to reduce systematic omission from consumer research [
34]. Recent SEM-based evidence from Nigeria (
n = 701) further confirms that disgust and food technology neophobia constitute robust barriers, while environmental motives and social norms emerge as dominant facilitators in another Sub-Saharan African setting [
35]. Comparable findings from emerging-market consumers also indicate that environmental concerns and product-quality perceptions are central to early-stage acceptance in low- and middle-income contexts [
36].
The second gap pertains to the transferability of constructs across different domains. A substantial body of literature documents general correlates of acceptance; however, relatively few studies directly test whether conventional meat purchasing logic translates into cultured meat acceptance. This distinction is of consequence because conventional meat choices are often anchored in habitual and sensory routines, whereas cultured meat acceptance may depend more strongly on technology-related and value-related appraisals. Evidence from South Africa and Europe indicates that the overlap between these domains is partial and context-dependent [
37,
38]. Experimental evidence further demonstrates that messaging anchored in conventional meat shortcomings can shift cultured meat evaluations independently of habitual meat preferences, supporting the analytical separation of these domains [
39].
The third gap pertains to the integration of models. Despite the consistent reporting of disgust, neophobia and unnaturalness as barriers, and perceived safety and benefits as facilitators, there is a paucity of studies estimating their relative explanatory contribution within a single hierarchical framework that simultaneously includes knowledge and socio-demographic controls [
10,
15,
17]. Evidence from the African context indicates that the nature of barriers can vary depending on the circumstances, with concerns regarding quality occasionally surpassing broader moral or social objections [
28,
29]. Comparative European evidence further indicates that initial perceived barriers can outweigh perceived motives in shaping willingness to eat cultured meat as a substitute, justifying joint modelling of barrier and motive blocks alongside knowledge and demographic factors [
40].
The fourth gap pertains to proximal evaluative synthesis. Judgments that are oriented towards value are a topic that is increasingly being discussed in the alternative protein literature. However, there remains a paucity of evidence regarding whether perceived need, relative advantage, and personal value fit exhibit greater explanatory relevance than other predictor blocks in young consumers from developing-country settings. Existing studies on social norms, dietary identity and moral foundations suggest that value-laden evaluations are likely to be central, but findings remain fragmented across conceptual frameworks [
11,
41,
42].
In light of the aforementioned background, the present study aims to test a theory-informed, block-structured model of cultured meat adoption intention among young adults (18–34 years) in Chad.
From a sustainability-governance perspective, identifying whether adoption intention is shaped primarily by habitual meat consumption routines, knowledge deficits, product beliefs, affective risk barriers, or perceived value fit is essential for designing culturally sensitive and socially legitimate transition strategies. The five hypotheses formulated below operationalise this question and provide the basis for the block-structured inferential model.
The objective of the present study is to elucidate the factors that influence the adoption of cultured meat among young adults who consume meat in Chad. To this end, a multifaceted model will be employed to analyse conventional meat behaviour, knowledge and awareness, product beliefs, affective risk barriers, and need–advantage–value fit evaluations. The inferential scope was defined a priori as respondents declaring meat consumption (Q4 = Yes;
n = 290). The full sample (
n = 304) was retained exclusively for descriptive sample profiling (see
Table 1), with the exclusion of comparative inferential testing against the meat-eater analytical sample. It is acknowledged that the formulation of hypotheses is predicated on a foundation of prior evidence and the identification of research gaps. In this particular instance, five hypotheses were formulated. For the purpose of clarity in notation, all questionnaire codes utilised henceforth (Q1–Q31) are mapped to the full item wording and response scales in the
Supplementary Material (see
Table S1).
H1. Conventional meat consumption frequency and conventional meat purchasing priorities (Q5, Q7.1–Q7.8) have no robust evidence of incremental predictive contribution for cultured meat adoption intention (Q30).
Cross-cultural evidence indicates that acceptance is driven primarily by technology-specific appraisals rather than by routine meat consumption variables alone [
10,
15,
17]. Meta-analytic findings similarly demonstrate that perceptions specific to cultured meat explain willingness more strongly than broad consumer traits [
13]. Evidence from South Africa and Poland further suggests only partial correspondence between conventional meat logic and cultured meat orientations [
37,
38].
H2. Higher awareness and self-reported knowledge of cultured meat (Q1–Q3, primarily Q2) are associated with higher adoption intention (Q30).
It is evident from previous research that familiarity and informed understanding have the capacity to reduce uncertainty and increase openness to novel protein technologies [
11,
13,
43]. Intervention and tasting studies support familiarity as a modifiable determinant of acceptance [
43,
44]. Further evidence from South Africa suggests a correlation between a lack of knowledge and a reduced propensity to consume cultured meat. The manner in which information is presented has been demonstrated to influence preferences for alternative meat products [
28,
37].
H3. More favourable beliefs about safety, healthiness, and expected taste of cultured meat (Q10–Q12) are positively associated with adoption intention (Q30).
Product-level evaluations, particularly those pertaining to expected sensory quality and health-related quality, are consistently identified as proximal predictors of willingness to consume [
13,
15,
44]. As reported in the relevant literature on African studies, quality expectations have been demonstrated to be of central importance in the context of early-stage acceptance judgments [
29,
30]. Laboratory evidence has also been cited which indicates favourable levels of digestibility and amino acid profiles for cultured meat relative to selected comparator proteins. This supports the relevance of health-oriented product beliefs [
45].
H4. Lower disgust (Q13; higher score = lower disgust) and lower perceived risk/unnaturalness (Q18.1–Q18.5; higher score = lower concern) are associated with higher adoption intention (Q30).
Disgust, perceived unnaturalness, and technology-related risk concerns have been identified as the most robust barriers reported across countries [
10,
11,
12]. It is evident that neophobia and purity-based moral concerns have the capacity to systematically suppress acceptance, as evidenced by additional research [
11,
28,
29]. Evidence from South India lends further support to the notion that food neophobia is a significant negative predictor of alternative protein acceptance, thereby corroborating the cross-context relevance of affective barriers [
33].
H5. Perceived need, relative advantage, and value congruence (Q19–Q21) are the strongest predictors of adoption intention (Q30), beyond socio-demographics and other attitude blocks.
Emerging evidence indicates that broad evaluative judgments, including perceived necessity, relative advantage, and personal value fit, can integrate multiple beliefs and operate as proximal drivers of intention in multivariable models [
38,
42,
46]. Research conducted on the subject of social norms, dietary identity and moral foundations lends further support to the importance of value-congruent and identity-congruent appraisal for the willingness of consumers to trial cultured meat [
11,
41].
The present study makes a contribution to the extant literature by providing context-specific evidence from Chad, testing a hierarchical model that compares predictor blocks within one framework, and clarifying whether value fit variables outperform conventional consumption and belief-based predictors in explaining adoption intention among young adults.
2. Materials and Methods
2.1. Study Design and Reporting Framework
The study used a cross-sectional online survey design to evaluate determinants of cultured meat adoption intention among young adults in Chad. The analytical workflow was predefined before model estimation and explicitly separated into confirmatory and exploratory components in order to limit specification drift and post hoc reinterpretation of effects. Confirmatory analyses were designated as the basis for hypothesis testing, whereas exploratory analyses were designated as supplementary robustness and pattern discovery procedures.
Reporting was aligned with CHERRIES recommendations for internet surveys. The questionnaire was implemented as an online instrument distributed through web-based recruitment, and the analytical dataset comprised submitted questionnaires meeting predefined eligibility criteria and data quality requirements (
n = 304). Survey scope, eligibility, and inferential restrictions are reported explicitly in
Section 2.2,
Section 2.3 and
Section 2.4, together with model-level missing data handling and complete-case estimation rules.
Platform paradata required for full CHERRIES response-flow metrics (unique site visitors, questionnaire starts, and non-completion at each stage) were not available in the archived analytical export; therefore, view rate, participation rate, and completion rate could not be computed retrospectively. Likewise, server-side identifiers for duplicate entry diagnostics (e.g., IP address, cookie ID, device fingerprint) were not available in the final dataset used for analysis. These gaps represent a meaningful limitation for an online non-probability survey conducted in a low-connectivity setting (Chad’s internet penetration was approximately 7–9% during the study period [
25]). Without response-flow metrics, the degree of self-selection cannot be quantified, and the resulting sample is likely to over-represent digitally connected, educated, urban respondents relative to the general young adult population. This structural selection bias limits external validity and should be considered when interpreting the absolute levels of acceptance and the generalisability of predictor effects. All inferential claims are therefore framed explicitly as conditional on the recruited sample composition, and findings should not be extrapolated to populations outside the sampled segment without independent replication. Specifically, the unmet CHERRIES items in the present submission are: (i) view rate (unique site visitors/questionnaire starts not retained in the platform export); (ii) participation rate (questionnaire starts/completes not retained); (iii) completion rate (item-level abandonment not retained); (iv) duplicate entry diagnostics (no IP, cookie, or device fingerprint in the analytical export); and (v) timing distribution (no per-respondent submission timestamp). All other CHERRIES items (survey design and pretesting, recruitment channel, voluntary participation, informed consent, item presentation order, conditional branching logic, response-format specification, and analytical handling) are documented in
Section 2.2,
Section 2.3,
Section 2.4 and
Section 2.5 and in
Supplementary Table S1.
Because internet-based surveys in low-connectivity settings may be vulnerable to under-coverage and self-selection, all inferential claims were framed with explicit attention to sampling constraints and external validity boundaries.
2.2. Participants, Recruitment, and Eligibility
The analytical dataset comprised 304 respondents aged between 18 and 34 years residing in Chad. The target population was defined as young adults, consistent with the study objective of examining early-stage adoption potential for a novel food technology. Respondents who satisfied the specified age and residency criteria and who provided valid data for the core outcome block were eligible for inclusion.
As variables describing conventional meat behaviour are interpretable only among meat consumers, inferential analyses were restricted a priori to the meat-eater analytical sample (Q4 = Yes; n = 290). The full sample (n = 304) was used exclusively for descriptive characterisation of the recruited cohort. This design successfully avoided structural missingness artefacts in models including Q5 and Q7.1–Q7.8, thereby preserving construct validity for H1 and preventing pseudo-comparative interpretations between largely overlapping groups.
The analytical emphasis on younger, educated, urban respondents should be interpreted as an early-adoption segment focus rather than a nationally representative frame.
Age (Q23) was an eligibility-stage filter offered with three response bands (18–34, 35–54, 55+ years); respondents outside the youngest band (18–34 years) were screened out at recruitment in accordance with the pre-specified early-adoption focus of the present study, and the analytical dataset therefore contains a single age band by design. The wider age bands were retained in the recruitment instrument for compatibility with parallel studies and do not appear as a predictor variable in any model reported here.
The questionnaire was administered in French, one of the two official languages of Chad and the dominant language of formal education, urban communication, and digital interaction in the country, through the KASI Insight online recruitment platform. No formal back-translation procedure was undertaken into Arabic (Chad’s second official language) or into national vernaculars, and item wording was not subjected to a separate qualitative pre-validation in the Chadian sociocultural context. This restricts the recruited frame to French-literate respondents, a sample composition feature consistent with the educated, urban, early-adopter framing applied throughout the inferential analyses; semantic non-equivalence for technical constructs (e.g., perceived unnaturalness, value fit, food technology neophobia) in French translation cannot be ruled out and is acknowledged as a measurement limitation in
Section 4.4.
2.3. Survey Instrument and Measures
The primary outcome was adoption intention for cultured meat (Q30), which was treated as a continuous variable. In the finalised data dictionary, Q30 corresponds to the intention construct derived from the intention block (Q17.1–Q17.5), with higher values indicating stronger adoption intention.
As a sensitivity endpoint, a dichotomous willingness indicator (Q31) was analysed using logistic models to evaluate the robustness of conclusions under binary outcome specification. In the context of the study, the variable Q31 was assigned a value of 1 (willing) in instances where the mean intention score (Q30) exceeded the neutral midpoint (Q30 > 3). Conversely, in instances where the mean intention score did not exceed the neutral midpoint, the variable was assigned a value of ‘0’. The conventional meat behaviour model was operationalised by two factors: frequency of meat consumption (Q5) and purchase priorities (Q7.1–Q7.8). The primary function of this block was to test the hypothesis, designated as H1, and its estimation was conducted exclusively on the meat-eating subsample.
Conventional meat behaviour was operationalised by meat consumption frequency (Q5) and general meat purchase priorities (Q7.1–Q7.8). Items Q7.1–Q7.8 invited respondents to indicate the importance they attach to each attribute when buying meat in general—covering price (Q7.1), nutritional value (Q7.2), caloric content (Q7.3), taste (Q7.4), appearance (Q7.5), smell (Q7.6), environmental impact (Q7.7), and animal welfare (Q7.8)—without distinguishing between raw and processed meat categories or between packaged and unpackaged supply channels. The instrument therefore measured general meat purchasing priorities at the level of the consumer’s dominant purchase context, not evaluative attributes of a specific raw or processed product at the point of sale. The operational context dependency of the Q7 items (e.g., that nutritional information items are more interpretable for packaged products carrying labels than for unpackaged supply at open-market stalls) is acknowledged as a measurement-context limitation in
Section 4.4. The Q5/Q7 block was used to test H1 and was estimated on the meat-eater subsample only.
The extent of respondents’ knowledge and awareness of cultured meat was measured using a scale ranging from Q1 to Q3, incorporating both awareness status and self-reported knowledge.
Product-level beliefs were captured by Q10–Q12, which probe positive product expectations: Q10 (“cultured meat is safe”, positive safety belief), Q11 (“cultured meat is healthy”, positive health belief), and Q12 (“cultured burgers will be as tasty as traditional burgers”, anticipated sensory quality). Q12 was deliberately framed as a hypothetical expectation rather than as a direct sensory rating: cultured meat is not yet available for purchase or consumption in Chad and respondents could not have provided a sensory evaluation based on direct experience, so the item measures expected (anticipated) sensory quality—an established proxy for sensory-belief structure in early-stage acceptance research.
The measurement of affective risk barriers was conducted using the Q13 and Q18.1–Q18.5 scales. The process of coding was harmonised with the objective of preserving directionally consistent interpretation of regression coefficients across models. Specifically, Q13 was treated as a disgust-related indicator with reversed interpretation where required, and Q18.1–Q18.5 were aligned to represent lower perceived risk/unnaturalness at higher values.
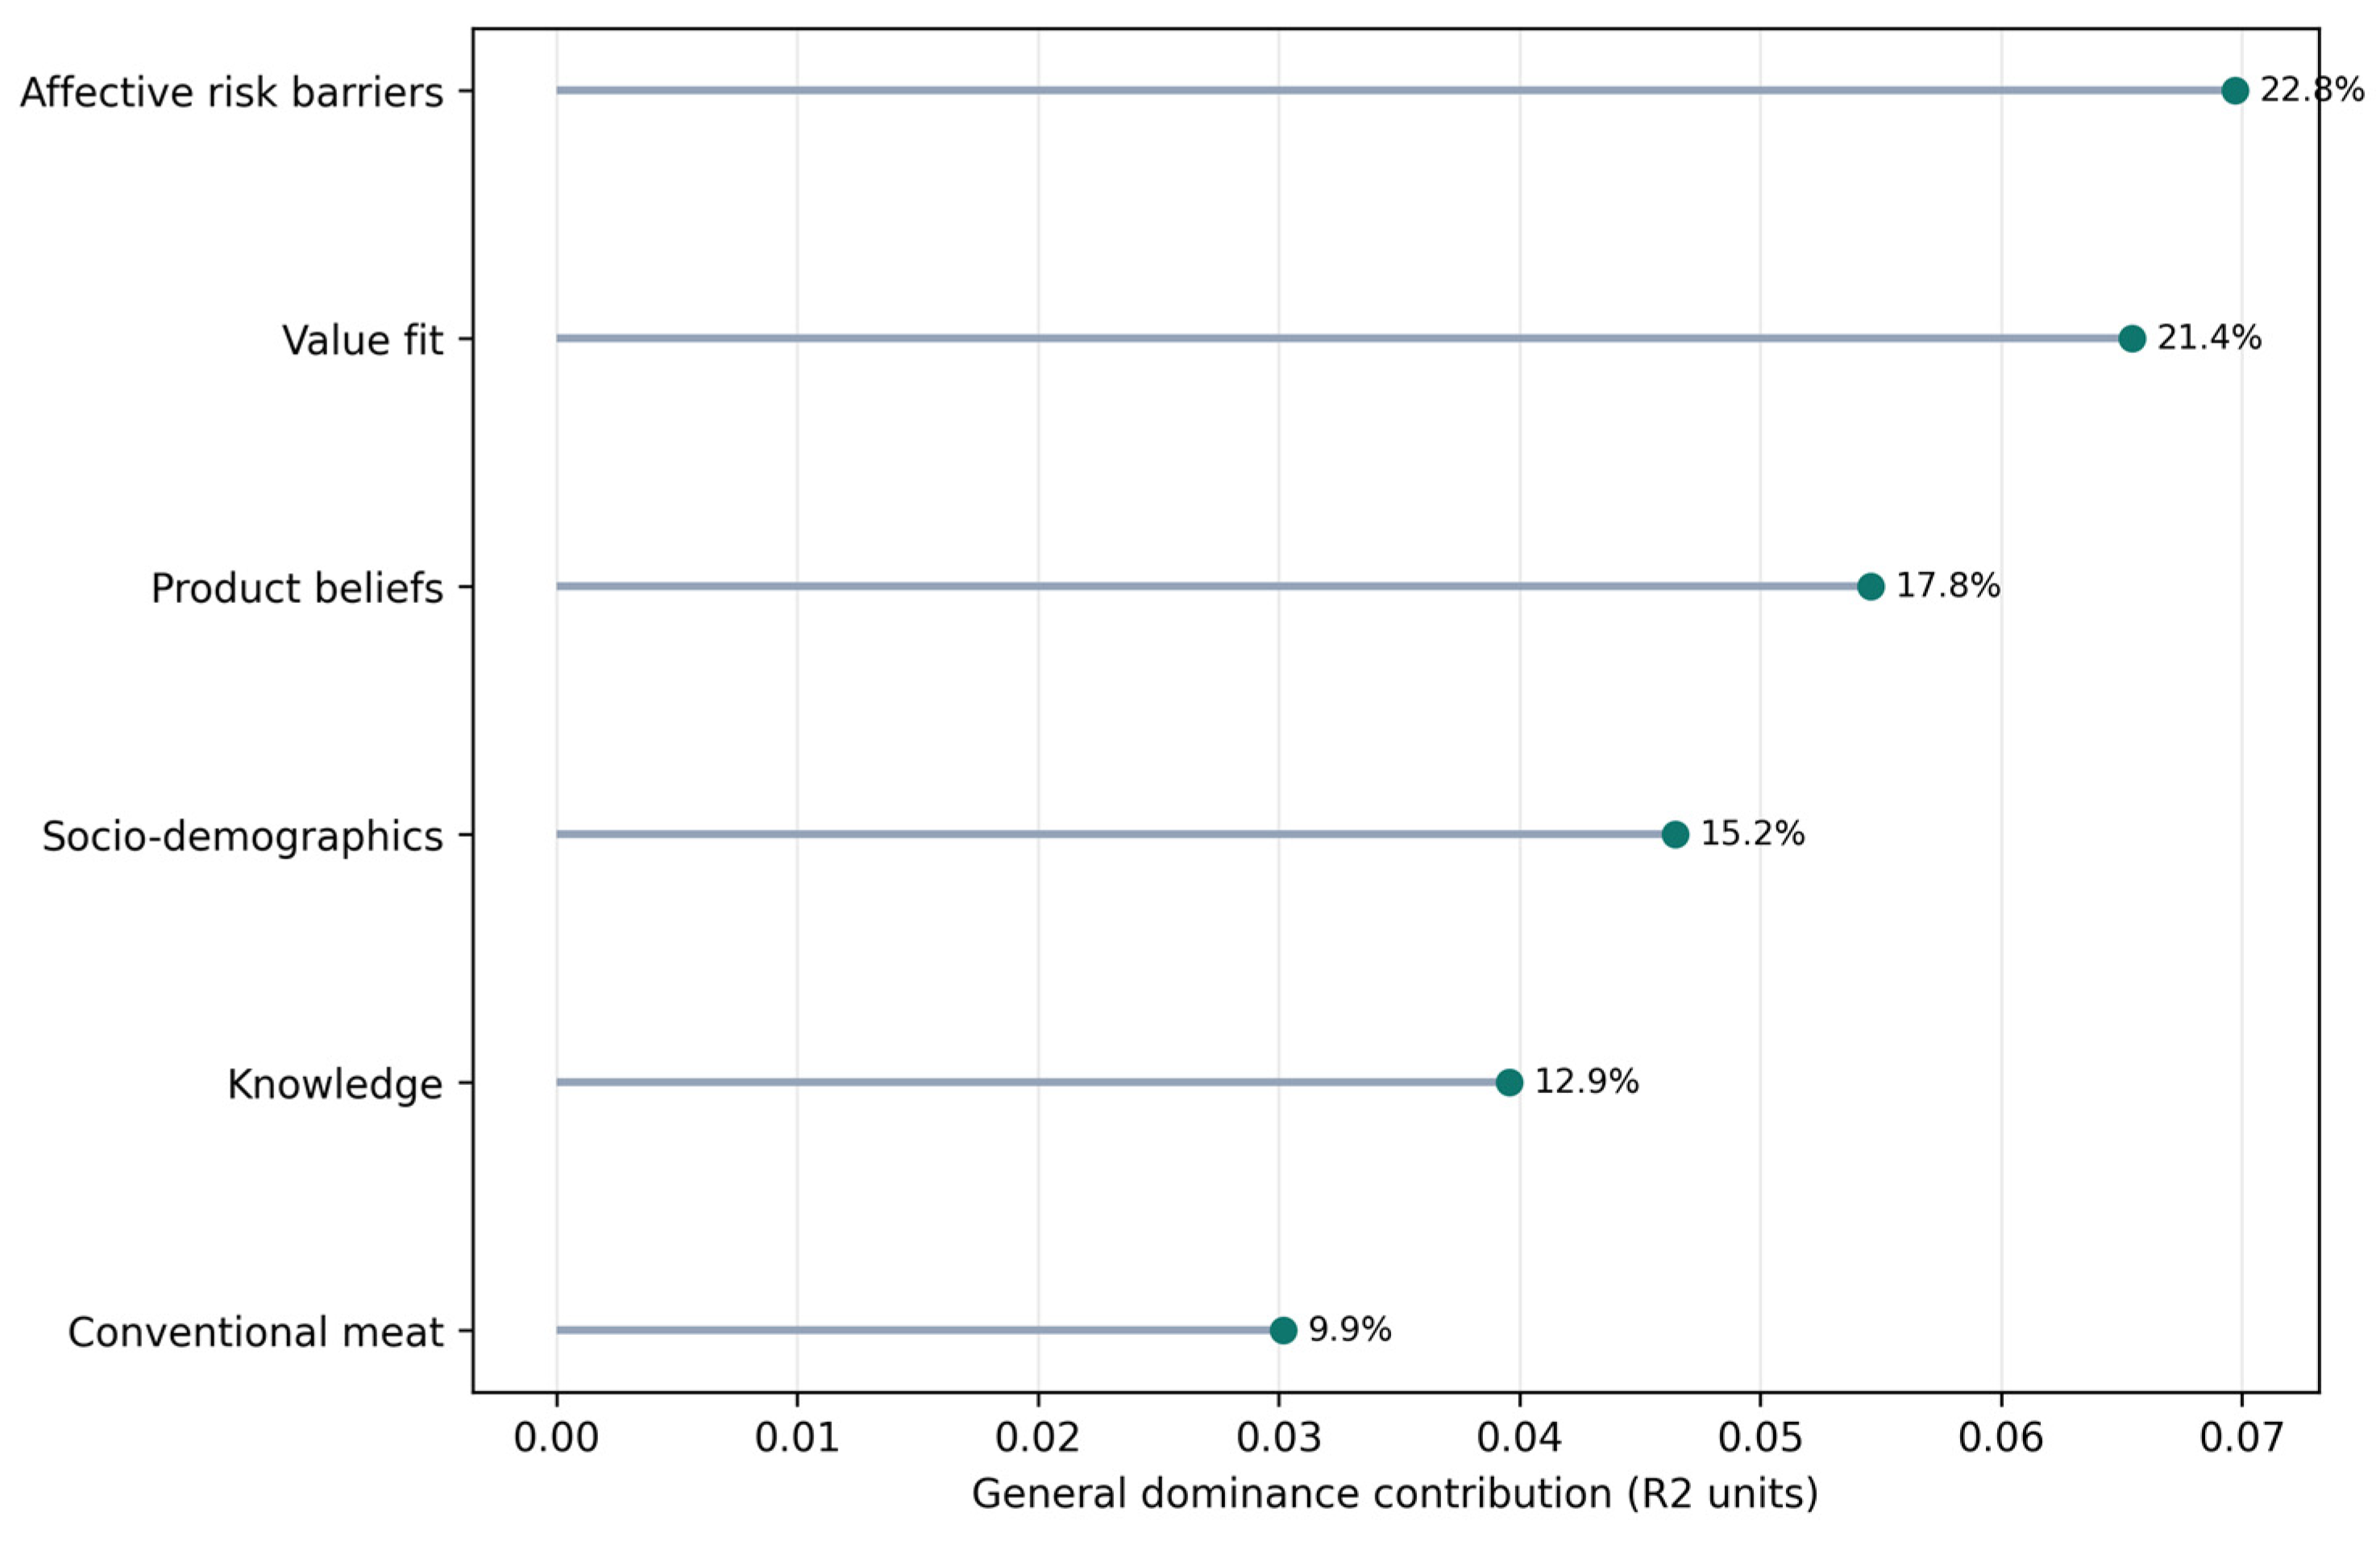
Although items in the product beliefs block (Q10–Q12) and items in the affective risk barriers block (Q18.1–Q18.5) include surface-level content overlap on the safety and health domains (notably Q10 vs. Q18.1 “eating cultured meat can be unsafe for health”, and Q11 vs. Q18.5 “I am concerned that cultured meat may have long-term negative health effects”), the two blocks measure conceptually distinct psychological constructs and are not duplicate measurements of a single underlying belief. Product beliefs items (Q10–Q12) probe positive product expectations on safety, healthiness, and anticipated sensory quality; affective risk items (Q18.1–Q18.5) probe a different psychological dimension—namely risk perception, food technology neophobia (Q18.2, “I don’t trust new foods”), naturalness concerns (Q18.3, “new technologies reduce the naturalness of food”; Q18.4, “cultured meat is unnatural”), and specifically long-term health uncertainty under absent evidence (Q18.5). The intentional pairing of positively phrased product beliefs with reverse-phrased risk concerns serves three measurement purposes: (1) it allows convergent and discriminant validity to be assessed across the positive-expectation and negative-concern poles of the safety and health constructs; (2) it reduces acquiescence bias by introducing scale-direction heterogeneity; and (3) it captures the well-documented psychological asymmetry whereby respondents can simultaneously endorse a positive belief and a negative concern (cognitive ambivalence), a pattern that single-pole measurement misses. Items were therefore retained in their respective blocks corresponding to the pre-specified hypotheses H3 (product belief facilitator effect) and H4 (affective risk barrier effect); empirical evidence for the conceptual distinction is provided by the block-level dominance hierarchy, in which affective risk barriers (22.8% of full model R2) outrank product beliefs (17.8%). This pattern supports the analytical separation of the positive product belief and affective risk item sets, although it should not be interpreted as definitive evidence of discriminant validity.
The need–advantage–value fit was measured by Q19–Q21 and used to test H5, with dominance analysis pre-specified as the primary confirmatory test for block-level predominance.
The socio-demographic controls comprised the variables Q22 and Q24–Q28. Categorical predictors were dummy-coded with predefined reference categories documented in the codebook. The first block in all hierarchical models was thus entered as socio-demographic data.
Gender (Q22) was administered with two response options (‘male’/‘female’). This binary operationalisation represents a limitation of the demographic measurement because it did not allow respondents to select non-binary, other/self-described, or prefer-not-to-say options. Future replications should employ more inclusive gender-identity response sets where culturally and ethically appropriate.
In order to enhance the interpretability of the variable labels employed in the models, a comprehensive mapping of questionnaire symbols (Q1–Q31) to the original item wording and response scales is provided in the
Supplementary Material (see
Table S1).
2.4. Data Preparation
The data were processed through a pre-specified cleaning protocol. Prior to the estimation of the model, a verification process was conducted to ensure the consistency of item coding, the accuracy of value labels, and the directionality of the data. This verification process involved a comparison with the established questionnaire dictionary. Data preparation included: (a) harmonisation of response scales and ordered coding for Likert-type items, (b) construction/verification of derived outcome variables (Q30, Q31) and binary-threshold coding (Q31 = 1 for Q30 > 3, else 0), (c) coding direction harmonisation for affective risk items (Q13, Q18.1–Q18.5), (d) creation of the inferential predictor matrix for the meat-eater analytical sample (Q4 = Yes), (e) complete-case estimation at model level for non-structural missingness, and (f) no imputation for structural missingness by design (e.g., meat-only items among non-meat-eaters). Likert-type items were treated as continuous numeric predictors in OLS and logistic models, which is a standard approximation in consumer acceptance research and is supported by the absence of strong functional form misspecification (RESET p = 0.575); categorical predictors were dummy-coded with reference categories specified as: Q22 = Female; Q24 = primary; Q25 = village; Q26 = not working; Q27 = no children; Q28 = high income; Q1/Q3 = “Not sure”; Q5 = “daily”.
Decisions regarding scale aggregation (composite score vs. item-level entry) were made subsequent to psychometric diagnostics. In instances where the reliability and dimensionality criteria were not met, item-level modelling was employed in lieu of forced aggregation.
2.5. Statistical Analysis
All analyses were preclassified as confirmatory (main inferential layer) or exploratory (supplementary). Confirmatory results form the basis of hypothesis evaluation; exploratory results are reported as supportive patterns.
Software environment
Confirmatory analyses were executed in R (v4.5.0) utilising the following libraries: readr, dplyr, tidyr (data management); psych (α/ω, EFA, KMO, Bartlett, parallel analysis); lavaan (CFA/ULMC when triggered); car (VIF, nested model Wald testing); sandwich (HC3 covariance estimators); lmtest (diagnostic tests); domir (dominance analysis); stats (lm, glm, p.adjust Holm correction); brms andbridgesampling (exploratory Bayes factors); party andpermimp (optional conditional random forest). Exploratory machine learning analyses were executed in Python (v3.13.3) utilising libraries (pandas, numpy [data management]; scikit-learn [ElasticNetCV, preprocessing and cross-validation]; matplotlib, seaborn [exploratory visualisations]).
Descriptive and psychometric diagnostics
Descriptive statistics were employed, incorporating counts and proportions for categorical variables and means, standard deviations, medians, and interquartile ranges for continuous and ordinal variables. Prior to the estimation of the block model, psychometric diagnostics were conducted to ascertain the internal consistency of the data. Cronbach’s α and McDonald’s ω (with a primary preference for ω) were used to analyse the item diagnostics, which included the following: corrected item-total correlations and α-if-item-deleted.
The dimensionality was explored using exploratory factor analysis (oblimin), parallel analysis, MAP, KMO, Bartlett, and conditional procedures (triggered only when needed). The present study employs the WLSMV (lavaan) CFA, in conjunction with CR/AVE/HTMT checks for multifactor solutions, and optional method bias diagnostics (ULMC) for reviewer-requested sensitivity.
For confirmatory use, reliability thresholds prioritised ω ≥ 0.70. Values ranging from 0.60 to 0.69 were considered conditionally acceptable, contingent upon the execution of explicit sensitivity analyses and the presentation of substantiating evidence. Blocks falling below a value of 0.50 were flagged as psychometrically insufficient for composite aggregation; in such cases, item-level entry was used and block-level hypothesis tests were interpreted as assessing the joint contribution of thematically grouped items rather than of reflective latent constructs. As the primary outcome (Q30) demonstrated marginal reliability (ω~0.60), observed predictor–outcome associations are susceptible to attenuation bias. Consequently, reported R2 values should be interpreted as lower bounds of the true explained variance that would be observed under error-free measurement of the intention construct.
Confirmatory hypothesis testing
The primary inferential models employed were hierarchical OLS with HC3 heteroskedasticity-robust standard errors.
The confirmatory model was estimated in the meat-eater analytical sample (Q4 = Yes; n = 290), and the following six sequential steps were used:
socio-demographics;
conventional meat behaviour (Q5, Q7.1–Q7.8)—H1;
knowledge/awareness (Q1–Q3)—H2;
product beliefs (Q10–Q12)—H3;
affective risk barriers (Q13, Q18.1–Q18.5)—H4;
need–advantage–value fit (Q19–Q21)—H5.
The block-level inference employed robust nested model comparisons and ΔR2 reporting. The coefficients were presented as standardised effects, with robust 95% confidence intervals.
Dominance analysis
The primary confirmatory test for H5 was conducted using dominance analysis, a test which is not dependent on arbitrary block entry order. The estimation of general, conditional, and complete dominance metrics was conducted. The OLS ΔR2 for the value fit block was retained as supporting (order-dependent) evidence only.
Sensitivity analysis for binary outcome
Sensitivity models utilised logistic regression on Q31, employing the same six-block structure as the OLS confirmatory model in the meat-eater analytical sample. The reporting of results incorporated odds ratios with 95% confidence intervals, model improvement metrics (deviance-based block comparisons), and pseudo-R2 summaries.
Multiplicity and decision rules
In order to undertake multiple-testing control for confirmatory block-level tests, the Holm–Bonferroni correction was employed for one predefined confirmatory family (H1-H5) in the meat-eater analytical sample. The familywise α level was set at 0.05. Exploratory analyses were explicitly designated as non-primary, and when p-values were documented, the Benjamini–Hochberg false discovery rate (FDR) method was employed.
Sensitivity power analysis
A post hoc sensitivity power analysis was conducted to evaluate the minimum detectable ΔR2 for each hypothesis block, given the realised sample size (n = 290), the full model predictor count (p = 42), the observed R2 (0.306), and the block-specific numerator degrees of freedom. Power was computed for the non-central F distribution at both α = 0.05 (least conservative Holm step) and α = 0.01 (most conservative Holm step) to bracket the range under multiplicity correction. The target power threshold was set at 0.80. The objective of this analysis was to provide a contextual framework for non-significant block tests, with a focus on distinguishing between findings that are likely to reflect true nulls and those that may be indicative of insufficient power for small effects.
Model diagnostics and robustness criteria
The following diagnostic procedures were applied in order to evaluate the adequacy of the model. Initially, multicollinearity was assessed using variance inflation factors (VIFs). Subsequently, the assumption of linearity and the general residual structure were examined through inspection of residual patterns. Heteroskedasticity was also evaluated; however, heteroskedasticity-consistent HC3 standard errors were retained in all models, regardless of the test outcomes. Furthermore, residual distributions were assessed using Q–Q plots, while formal normality tests were regarded as supplementary rather than decisive criteria. Finally, where residual diagnostics indicated potential concerns, additional screening for influential observations was conducted. If diagnostics indicated instability in block-level estimates, sensitivity models using alternative coding or reduced predictor sets were reported in
Supplementary Materials.
Exploratory supplementary analyses
Three exploratory analyses were predetermined to provide supplementary validation to the primary confirmatory framework. Firstly, a Bayesian nested model comparison was planned for H1 using brms in combination with bridgesampling, with interpretation based on BF01 and supplemented by prior sensitivity analyses. Secondly, the elastic-net regularisation implemented via the scikit-learn’s ElasticNetCV was utilised to examine data-driven patterns of variable retention. Thirdly, an optional conditional random forest analysis, estimated with the party: cforest and permimp functions, was included to explore variable-importance structures that might reflect nonlinear associations and interaction-sensitive effects.
For the Bayesian models, convergence and sampling quality were assessed using standard diagnostic criteria. These included potential scale reduction factors (Rhat), which approached 1.00, with values below 1.01 being considered acceptable, as well as adequate bulk and tail effective sample sizes. In addition, model diagnostics necessitated the absence of divergent transitions and satisfactory trace-plot mixing upon visual inspection. Bayes factors were interpreted according to predefined evidence thresholds, with BF01 > 3 indicating moderate support for the restricted model and BF01 > 10 indicating strong support.
It is important to note that all exploratory results were treated as triangulating evidence only. The utilisation of these findings was intended to provide contextual depth and to assess the robustness of the primary conclusions, rather than to substitute or contradict the confirmatory conclusions.
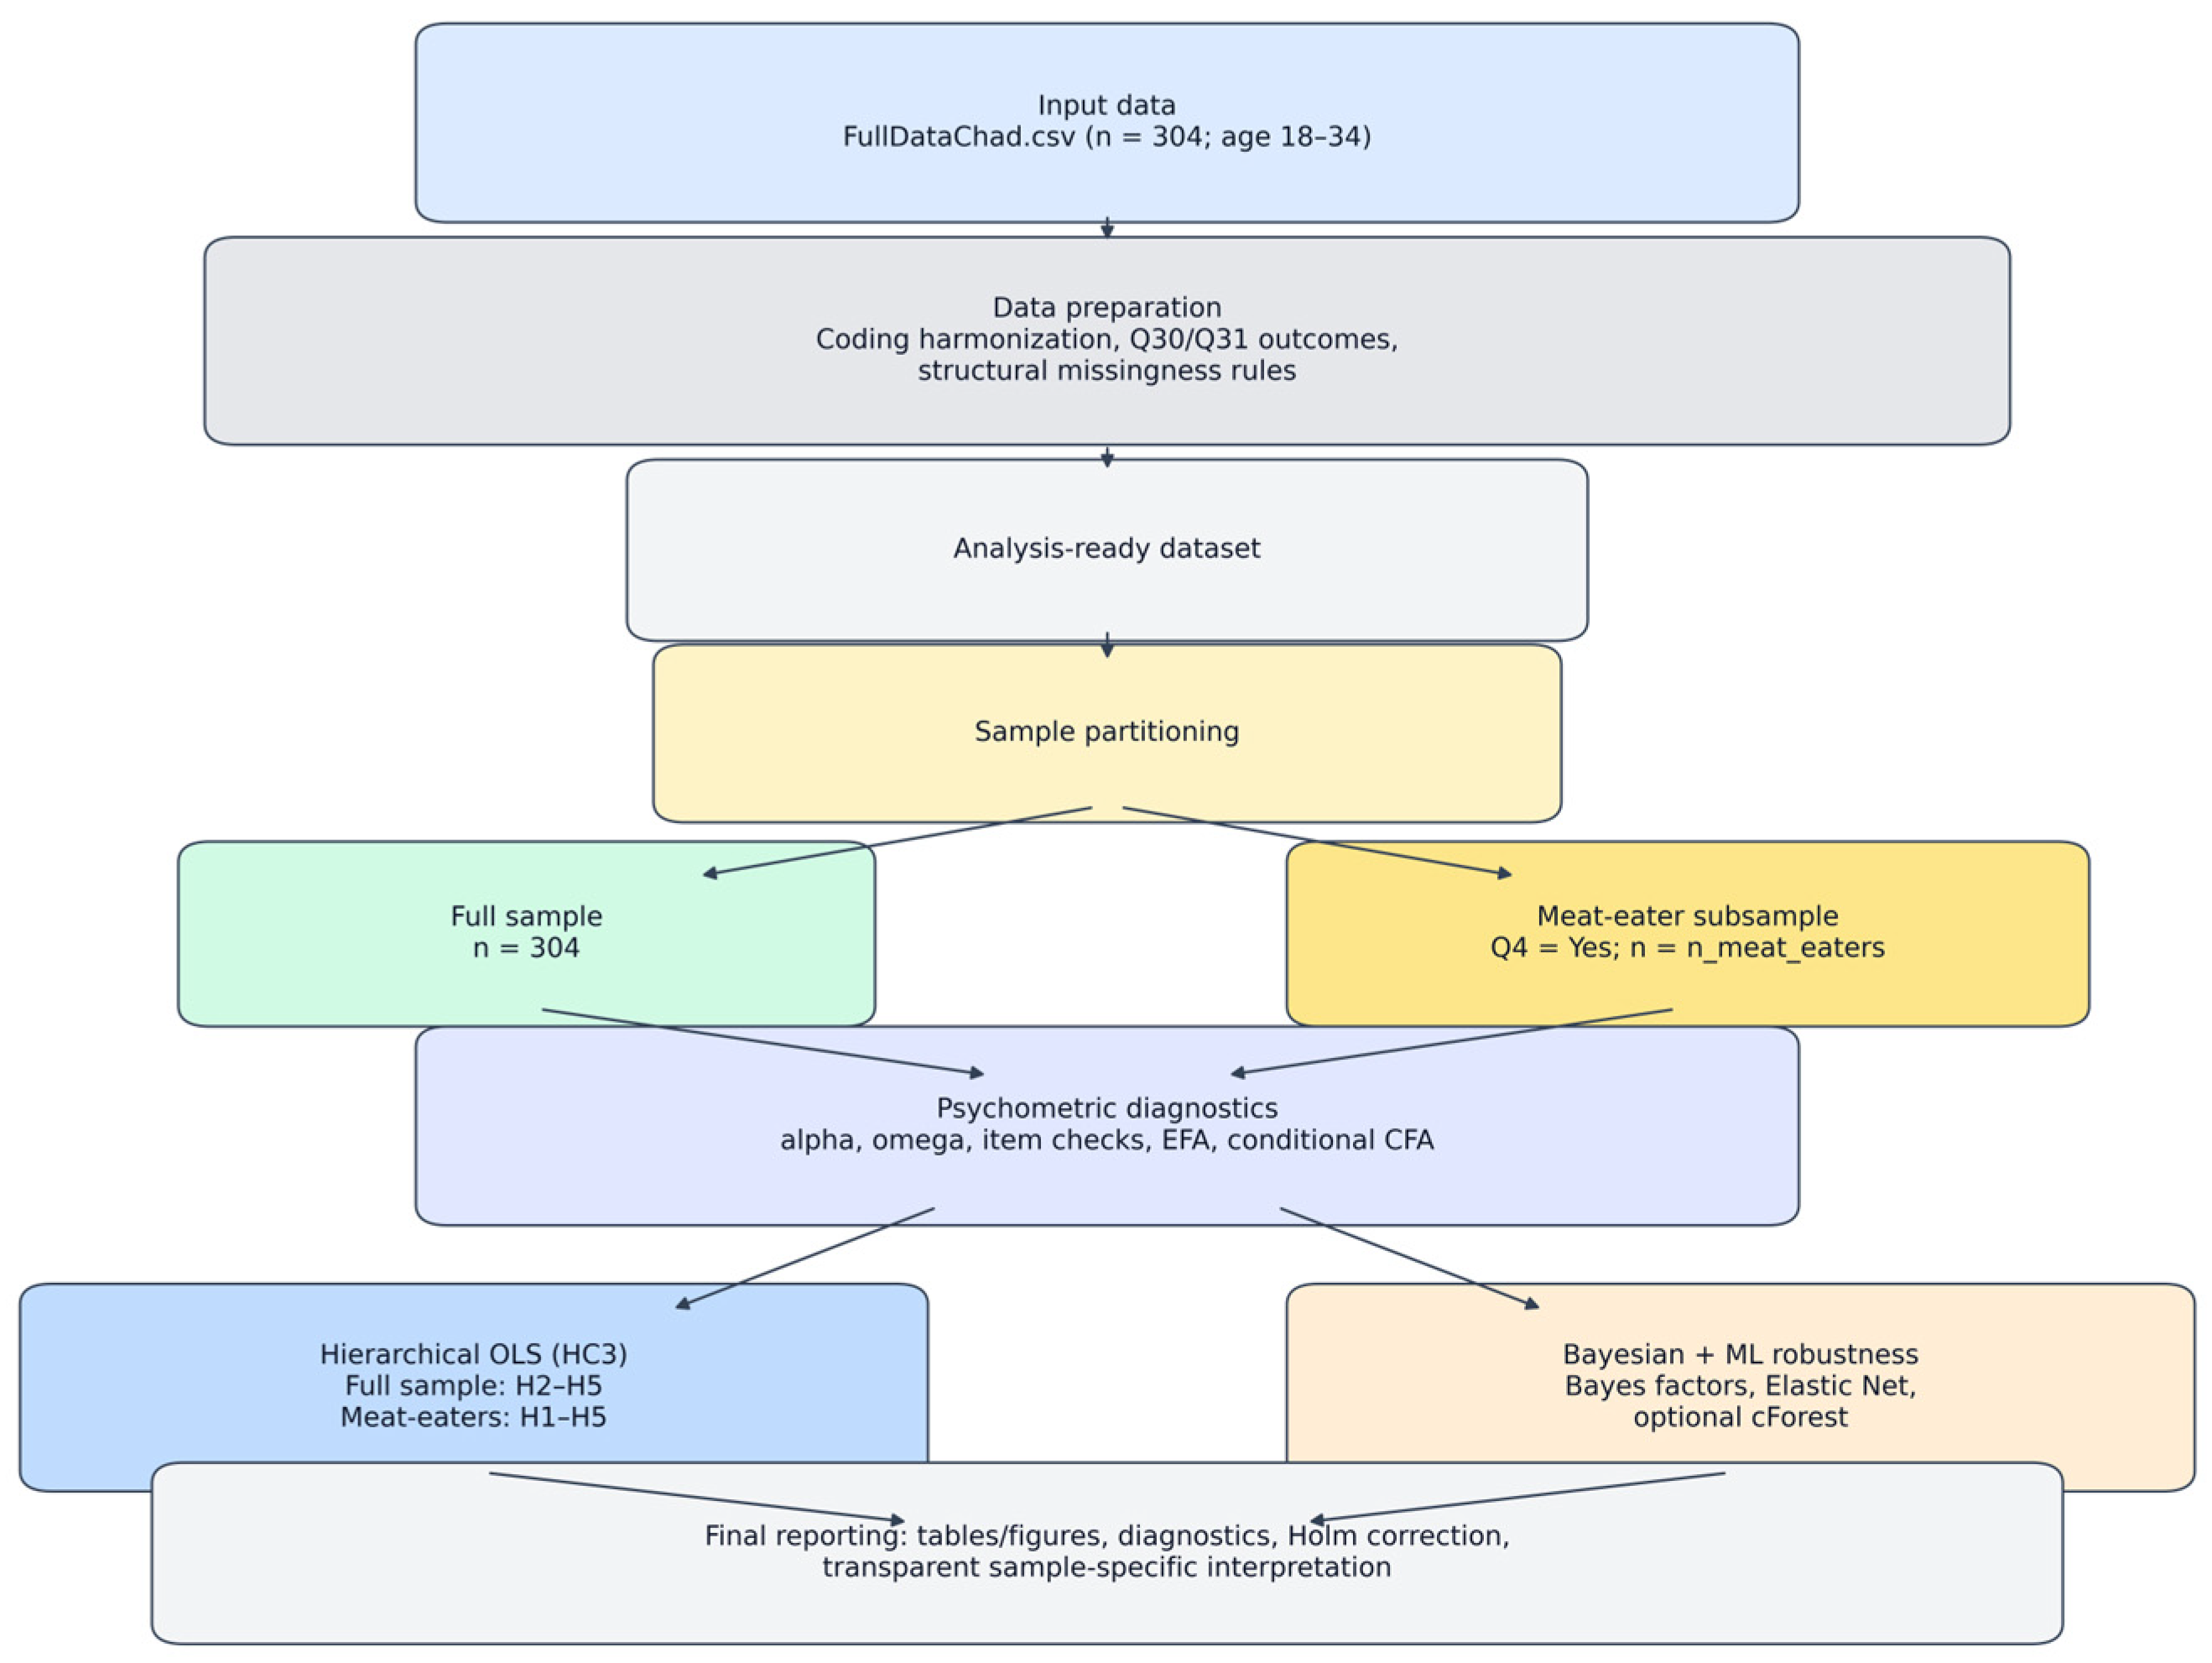
The research workflow diagram illustrates the end-to-end analytical process, encompassing sample partitioning, confirmatory analyses, exploratory analyses, and reporting outputs (
Figure 1).
4. Discussion
4.1. Principal Findings
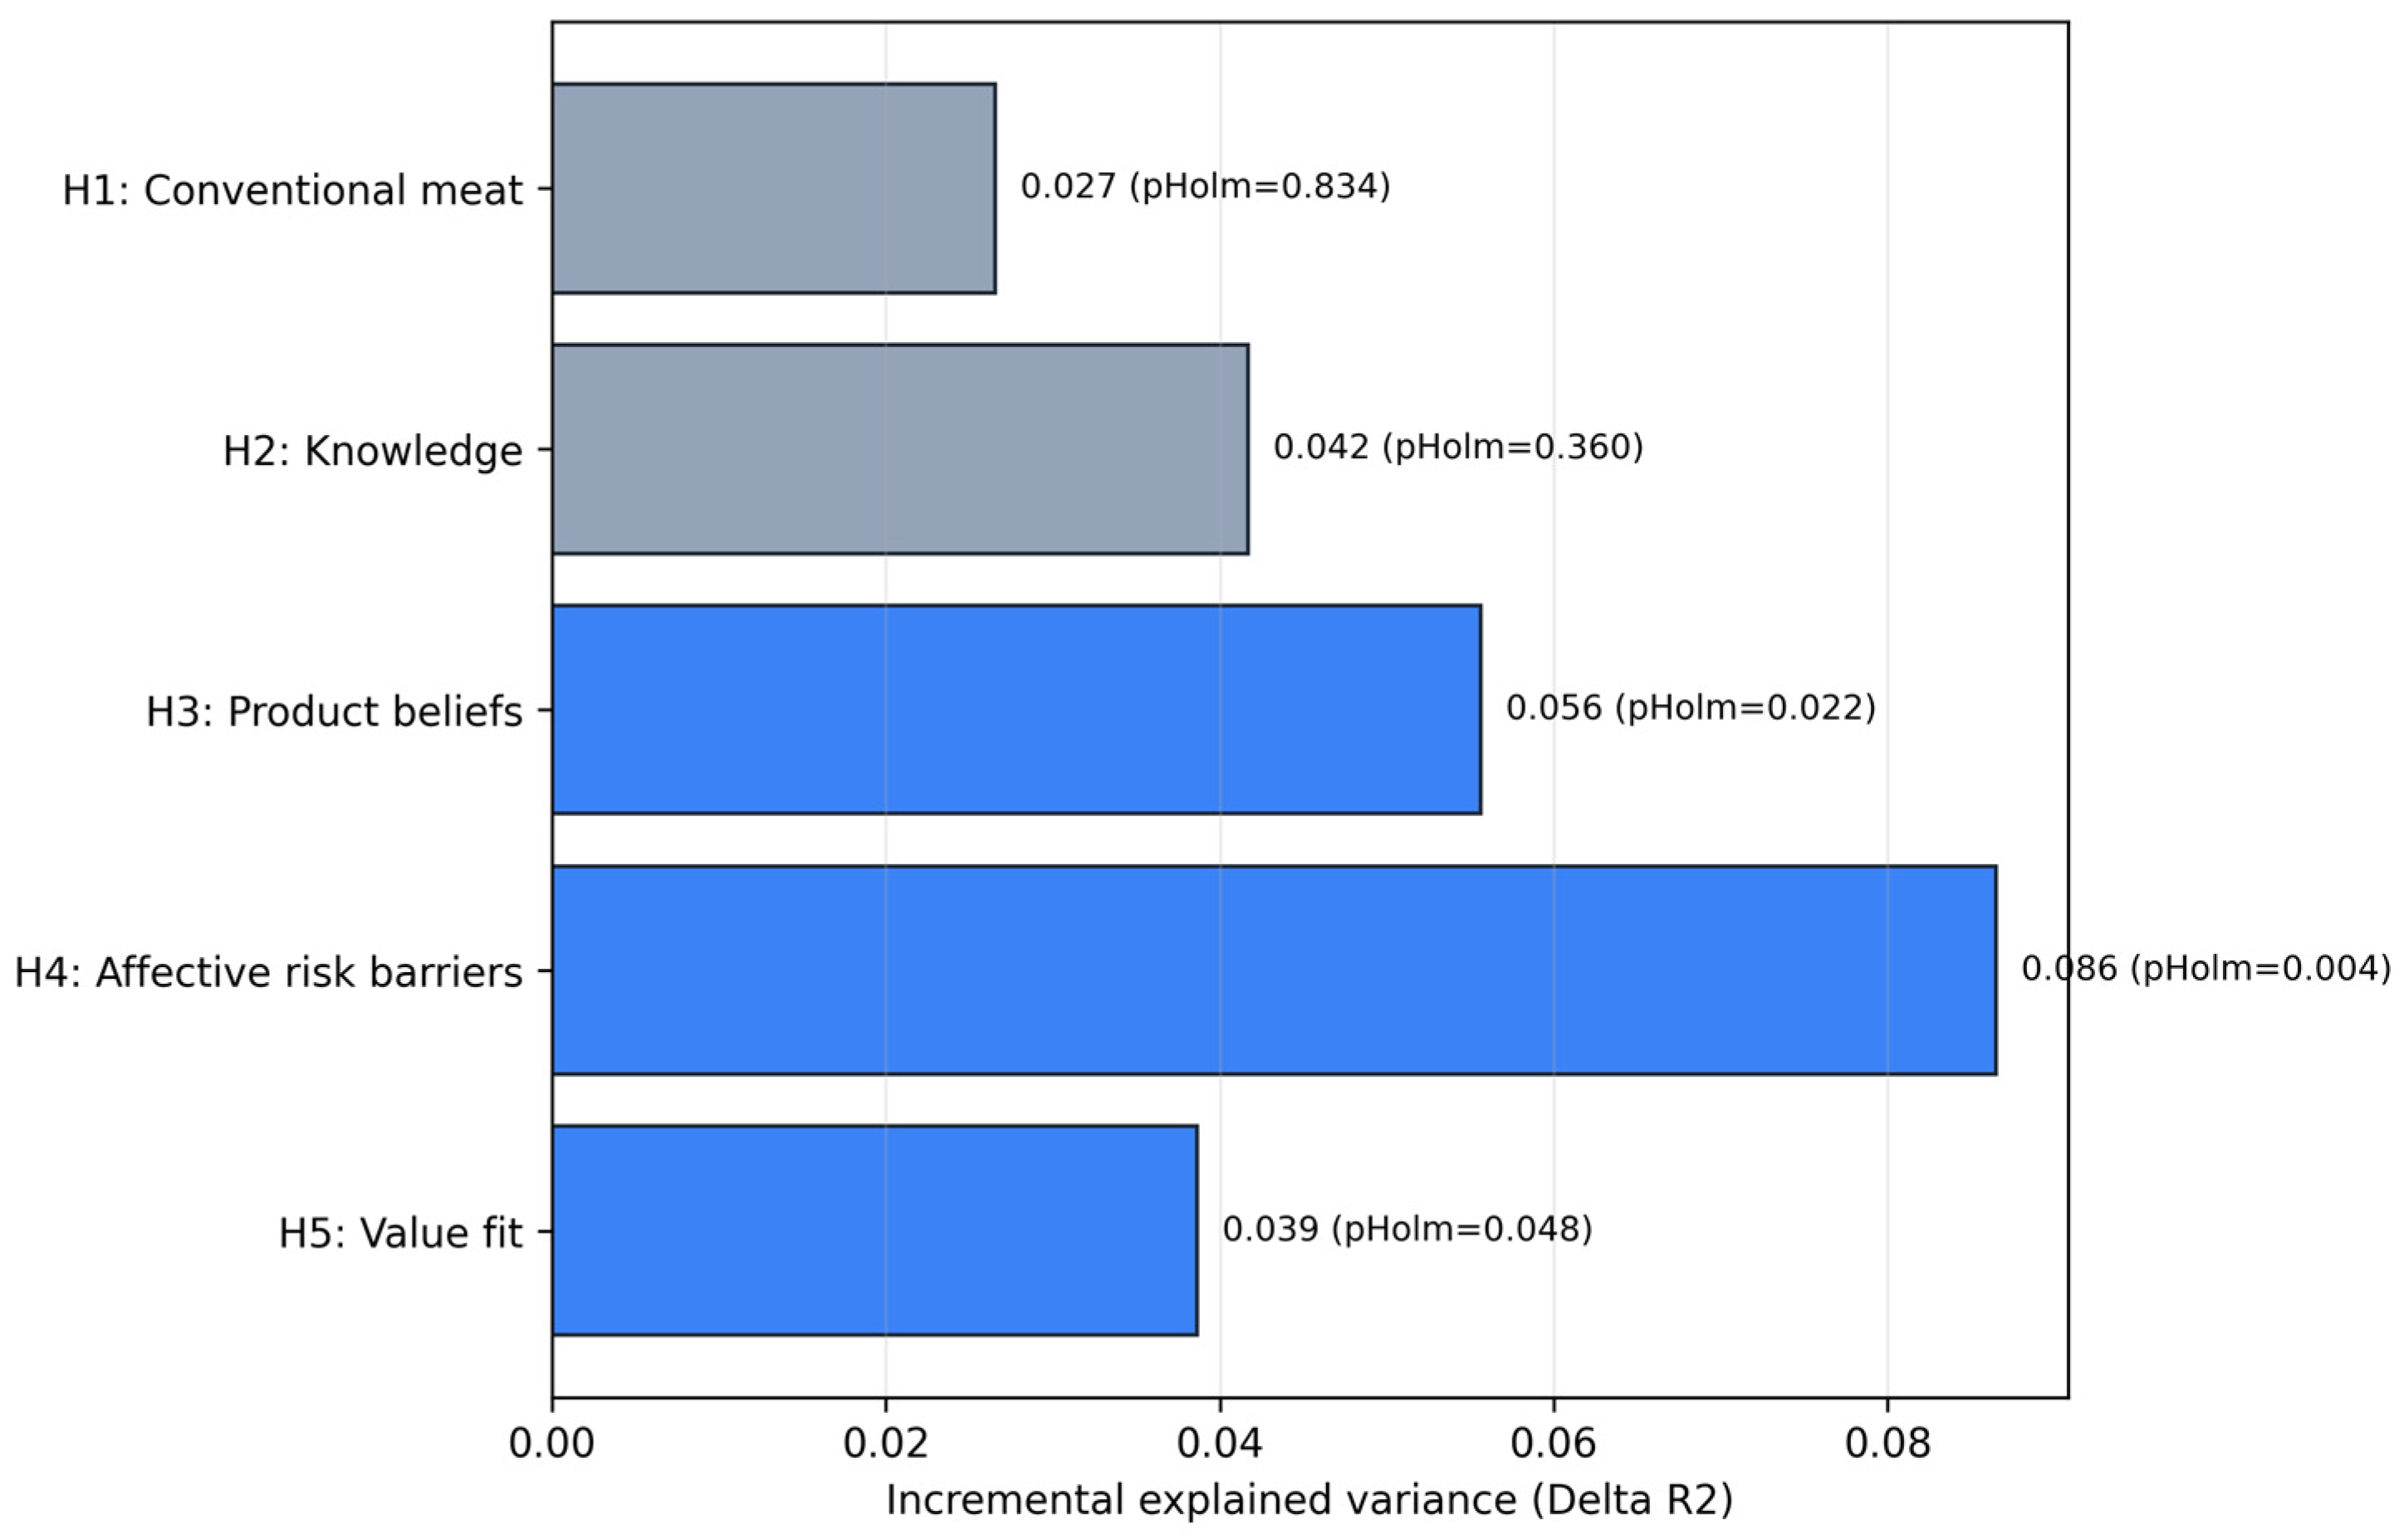
The confirmatory analyses indicated that cultured meat intention in the meat-eating analytical sample was primarily explained by affective risk and value fit domains, whereas conventional meat purchasing variables added limited incremental information. At the descriptive level, approximately half of the respondents indicated a readiness to engage with cultured meat. This supports the interpretation of this group as a plausible early-adoption segment rather than a uniformly receptive population. This pattern was reinforced in supplementary exploratory analyses: The Bayesian nested model comparison yielded substantial evidence in favour of the model that excluded the conventional-meat block (see
Table S8). Furthermore, the posterior intervals for conventional-meat predictors intersected with zero (see
Table S9; Figure S2). Additionally, both elastic-net shrinkage and conditional random forest importance rankings placed greater emphasis on broader evaluative and psychosocial predictors in comparison to conventional-meat items (see
Tables S10 and S11; Figures S1 and S3). When considered as a whole, the combined evidence supports an interpretation that does not allow for transferability. This means that the factors influencing intention to consume cultured meat cannot be explained by conventional logic relating to the consumption of meat.
4.2. Interpretation in Relation to the Previous Literature
The observed non-transferability between conventional meat purchase logic and cultured meat intention is consistent with evidence that product-specific appraisals, rather than broad consumption habits, are the strongest correlates of willingness to consume cultured meat [
13]. This pattern is consistent with cross-country findings that demonstrate acceptance is highly context-dependent and cannot be inferred from conventional meat attachment alone [
15,
17]. In the context of African evidence, the present findings are consistent with studies suggesting that individuals’ propensity to engage with cultured meat is influenced by specific psychosocial factors and does not simply extend existing meat choice routines [
21,
28]. Evidence from young adult consumer studies in Asia demonstrates that cultural attitudes towards meat can vary considerably depending on the context, even within samples consisting of individuals of the same age. This finding underscores the necessity for local inferences rather than direct extrapolation across different settings [
47]. Convergent SEM-based evidence from Nigeria similarly identifies disgust and technology neophobia as the strongest barriers, with environmental motives outperforming animal welfare concerns as facilitators, supporting a wider Sub-Saharan pattern in which targeted psychosocial appraisals dominate over routine meat consumption logic [
35].
The robust role of affective risk barriers is consistent with prior research identifying disgust, perceived unnaturalness, and technology-related concern as robust constraints on acceptance [
10,
11,
12]. The current ranking of predictors also aligns with African studies, in which product quality and risk-related concerns remain pivotal to early-stage acceptance judgments [
29,
30]. Conversely, the non-significant adjusted contribution of the knowledge block is consistent with evidence that demographics and broad familiarity indicators frequently exert weaker effects than direct evaluations of cultured meat attributes [
13], although exploratory models suggest that knowledge may still contribute at a secondary level when combined with attitudinal variables. This interpretation is consistent with intervention-oriented studies in which the development of familiarity and experience-based exposure has been demonstrated to improve acceptance, despite initially neutral or hesitant baselines [
43,
44]. Furthermore, it aligns with TPB-based evidence that intention can be shaped by attitudinal and control-related pathways that extend beyond simple awareness status [
48].
Direct comparison with the multi-country African evidence base further sharpens the present findings. A pan-African survey of more than 12,000 educated urban consumers across 12 countries reported an average willingness-to-try of approximately 47%, with substantial between-country heterogeneity ranging from South Africa (most accepting) to Ghana (least accepting) [
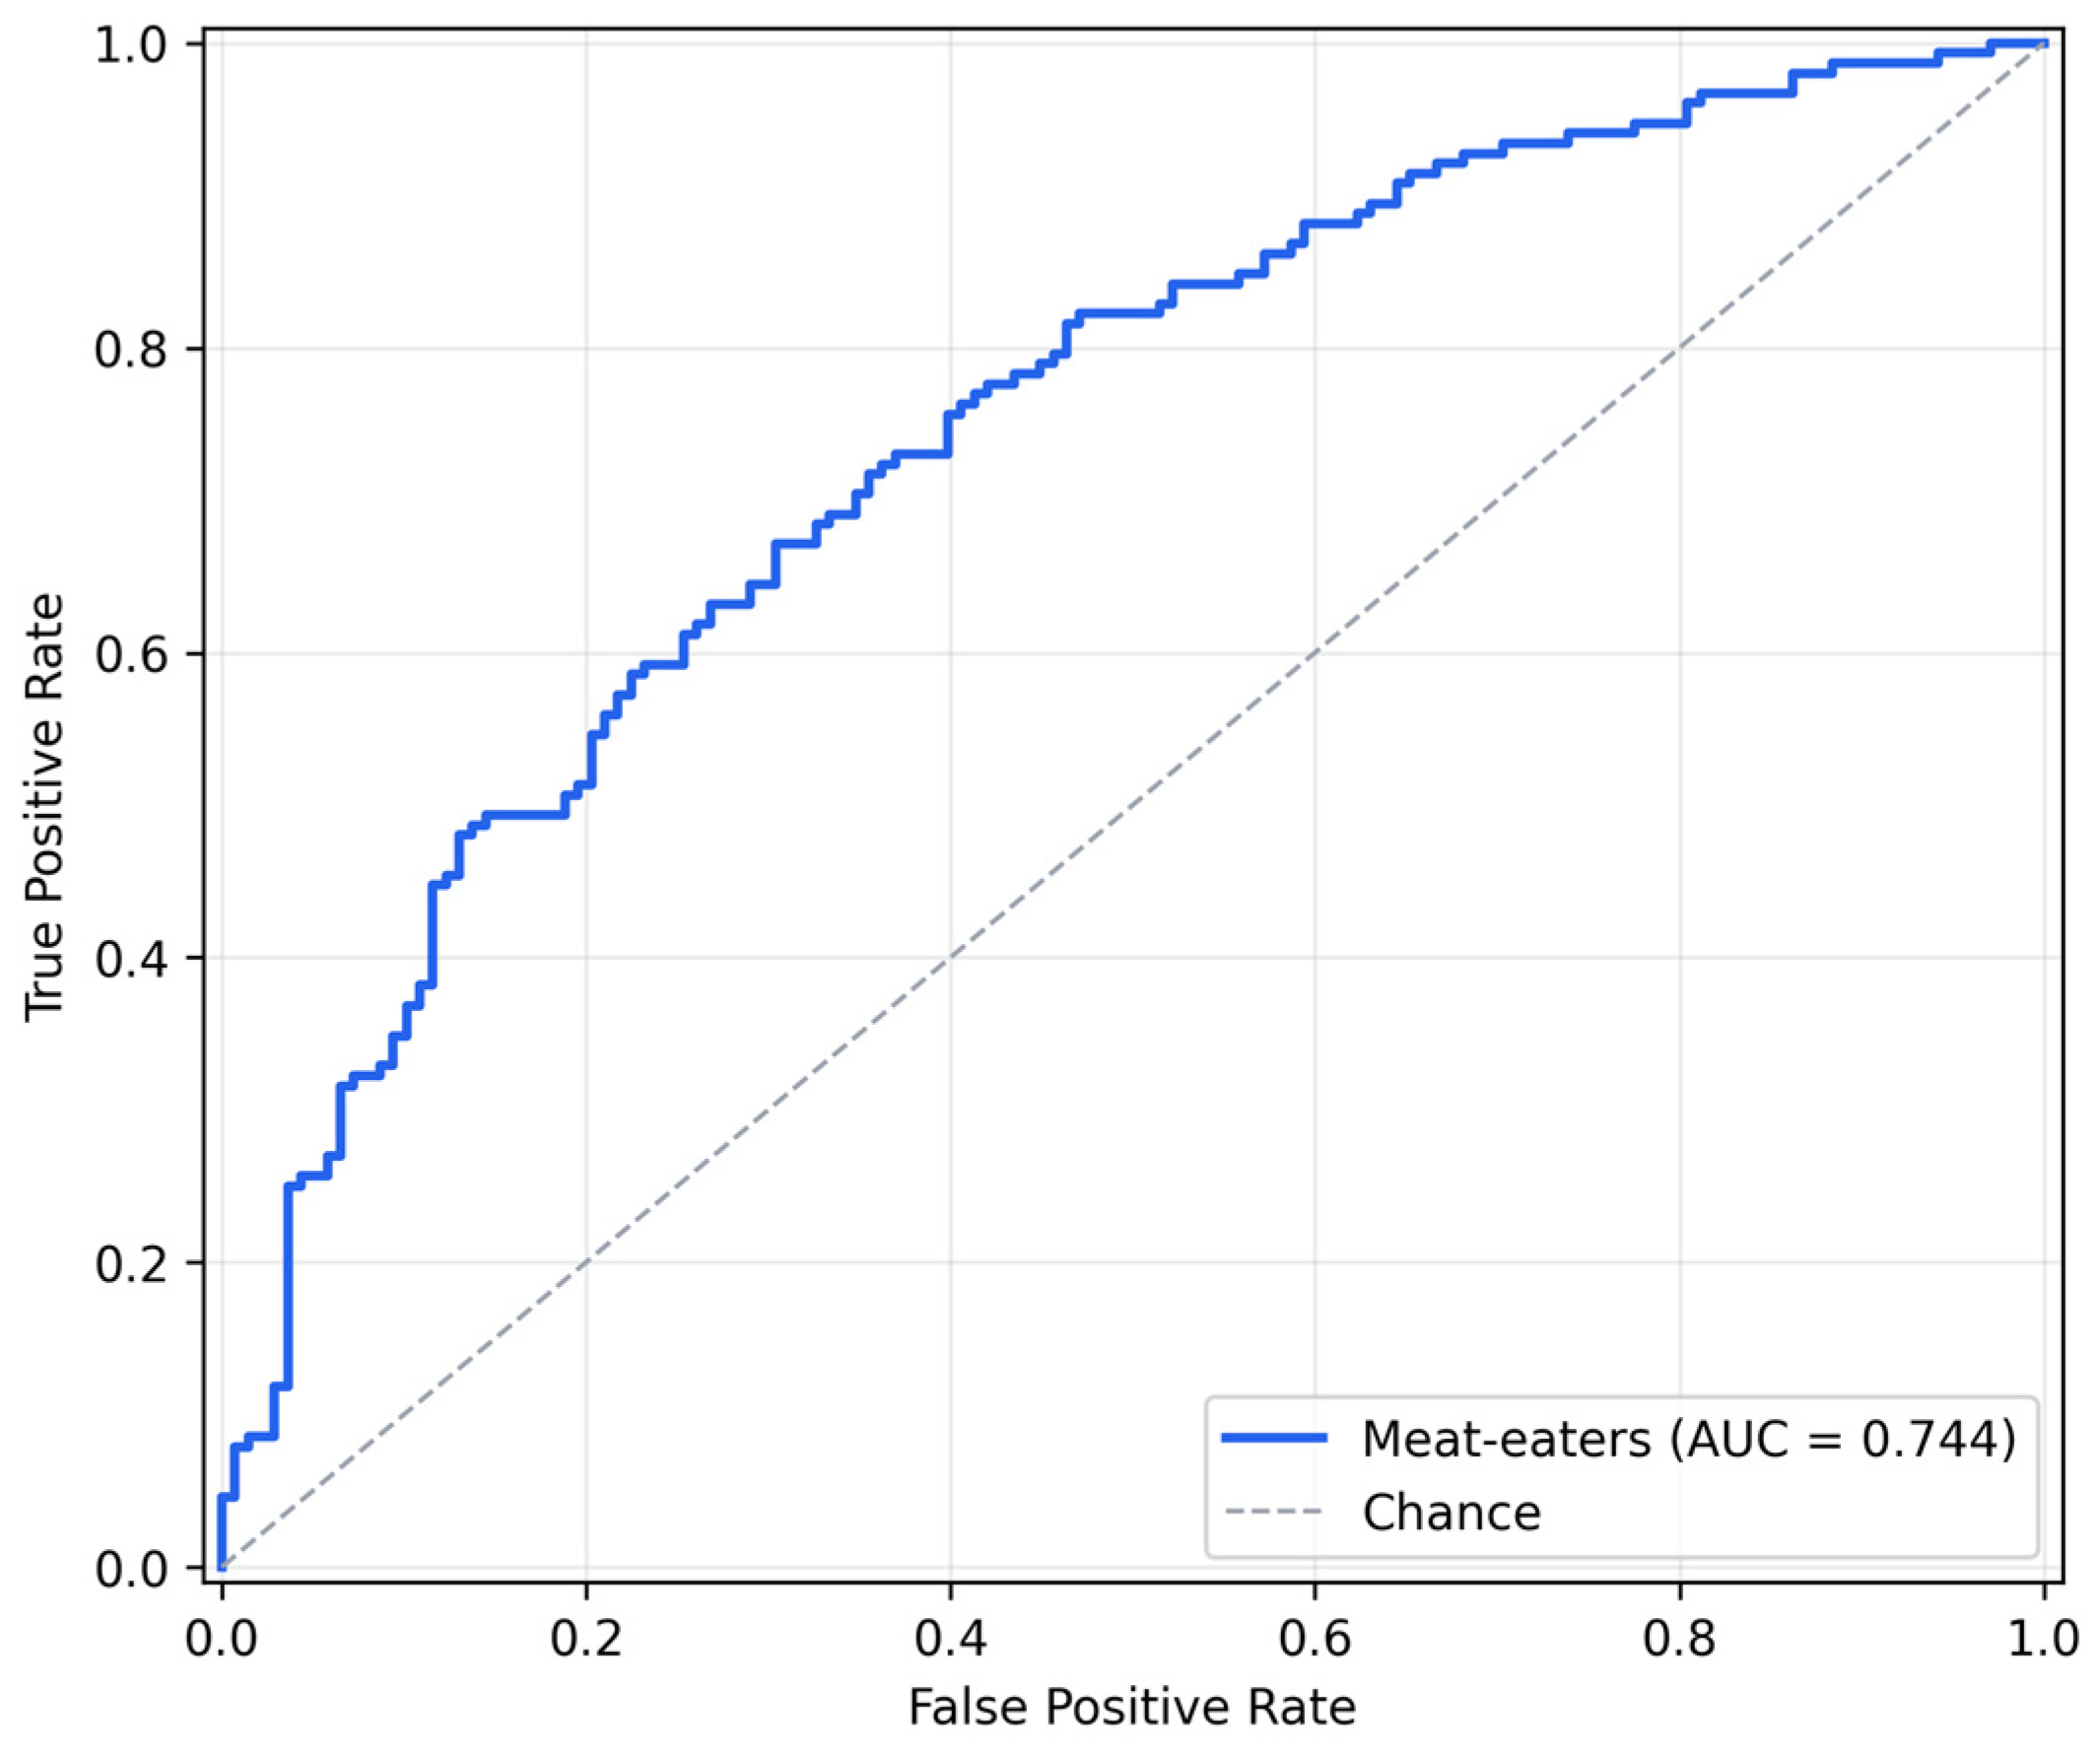
19]. The willingness-to-try level observed in the present Chadian sample (52.4%) falls within this range and is broadly consistent with the educated, urban, early-adoption pattern documented across the continent. The pan-African evidence also indicates that approximately 65% of African respondents are willing to pay less than for conventional meat, while only 11–13% would pay more [
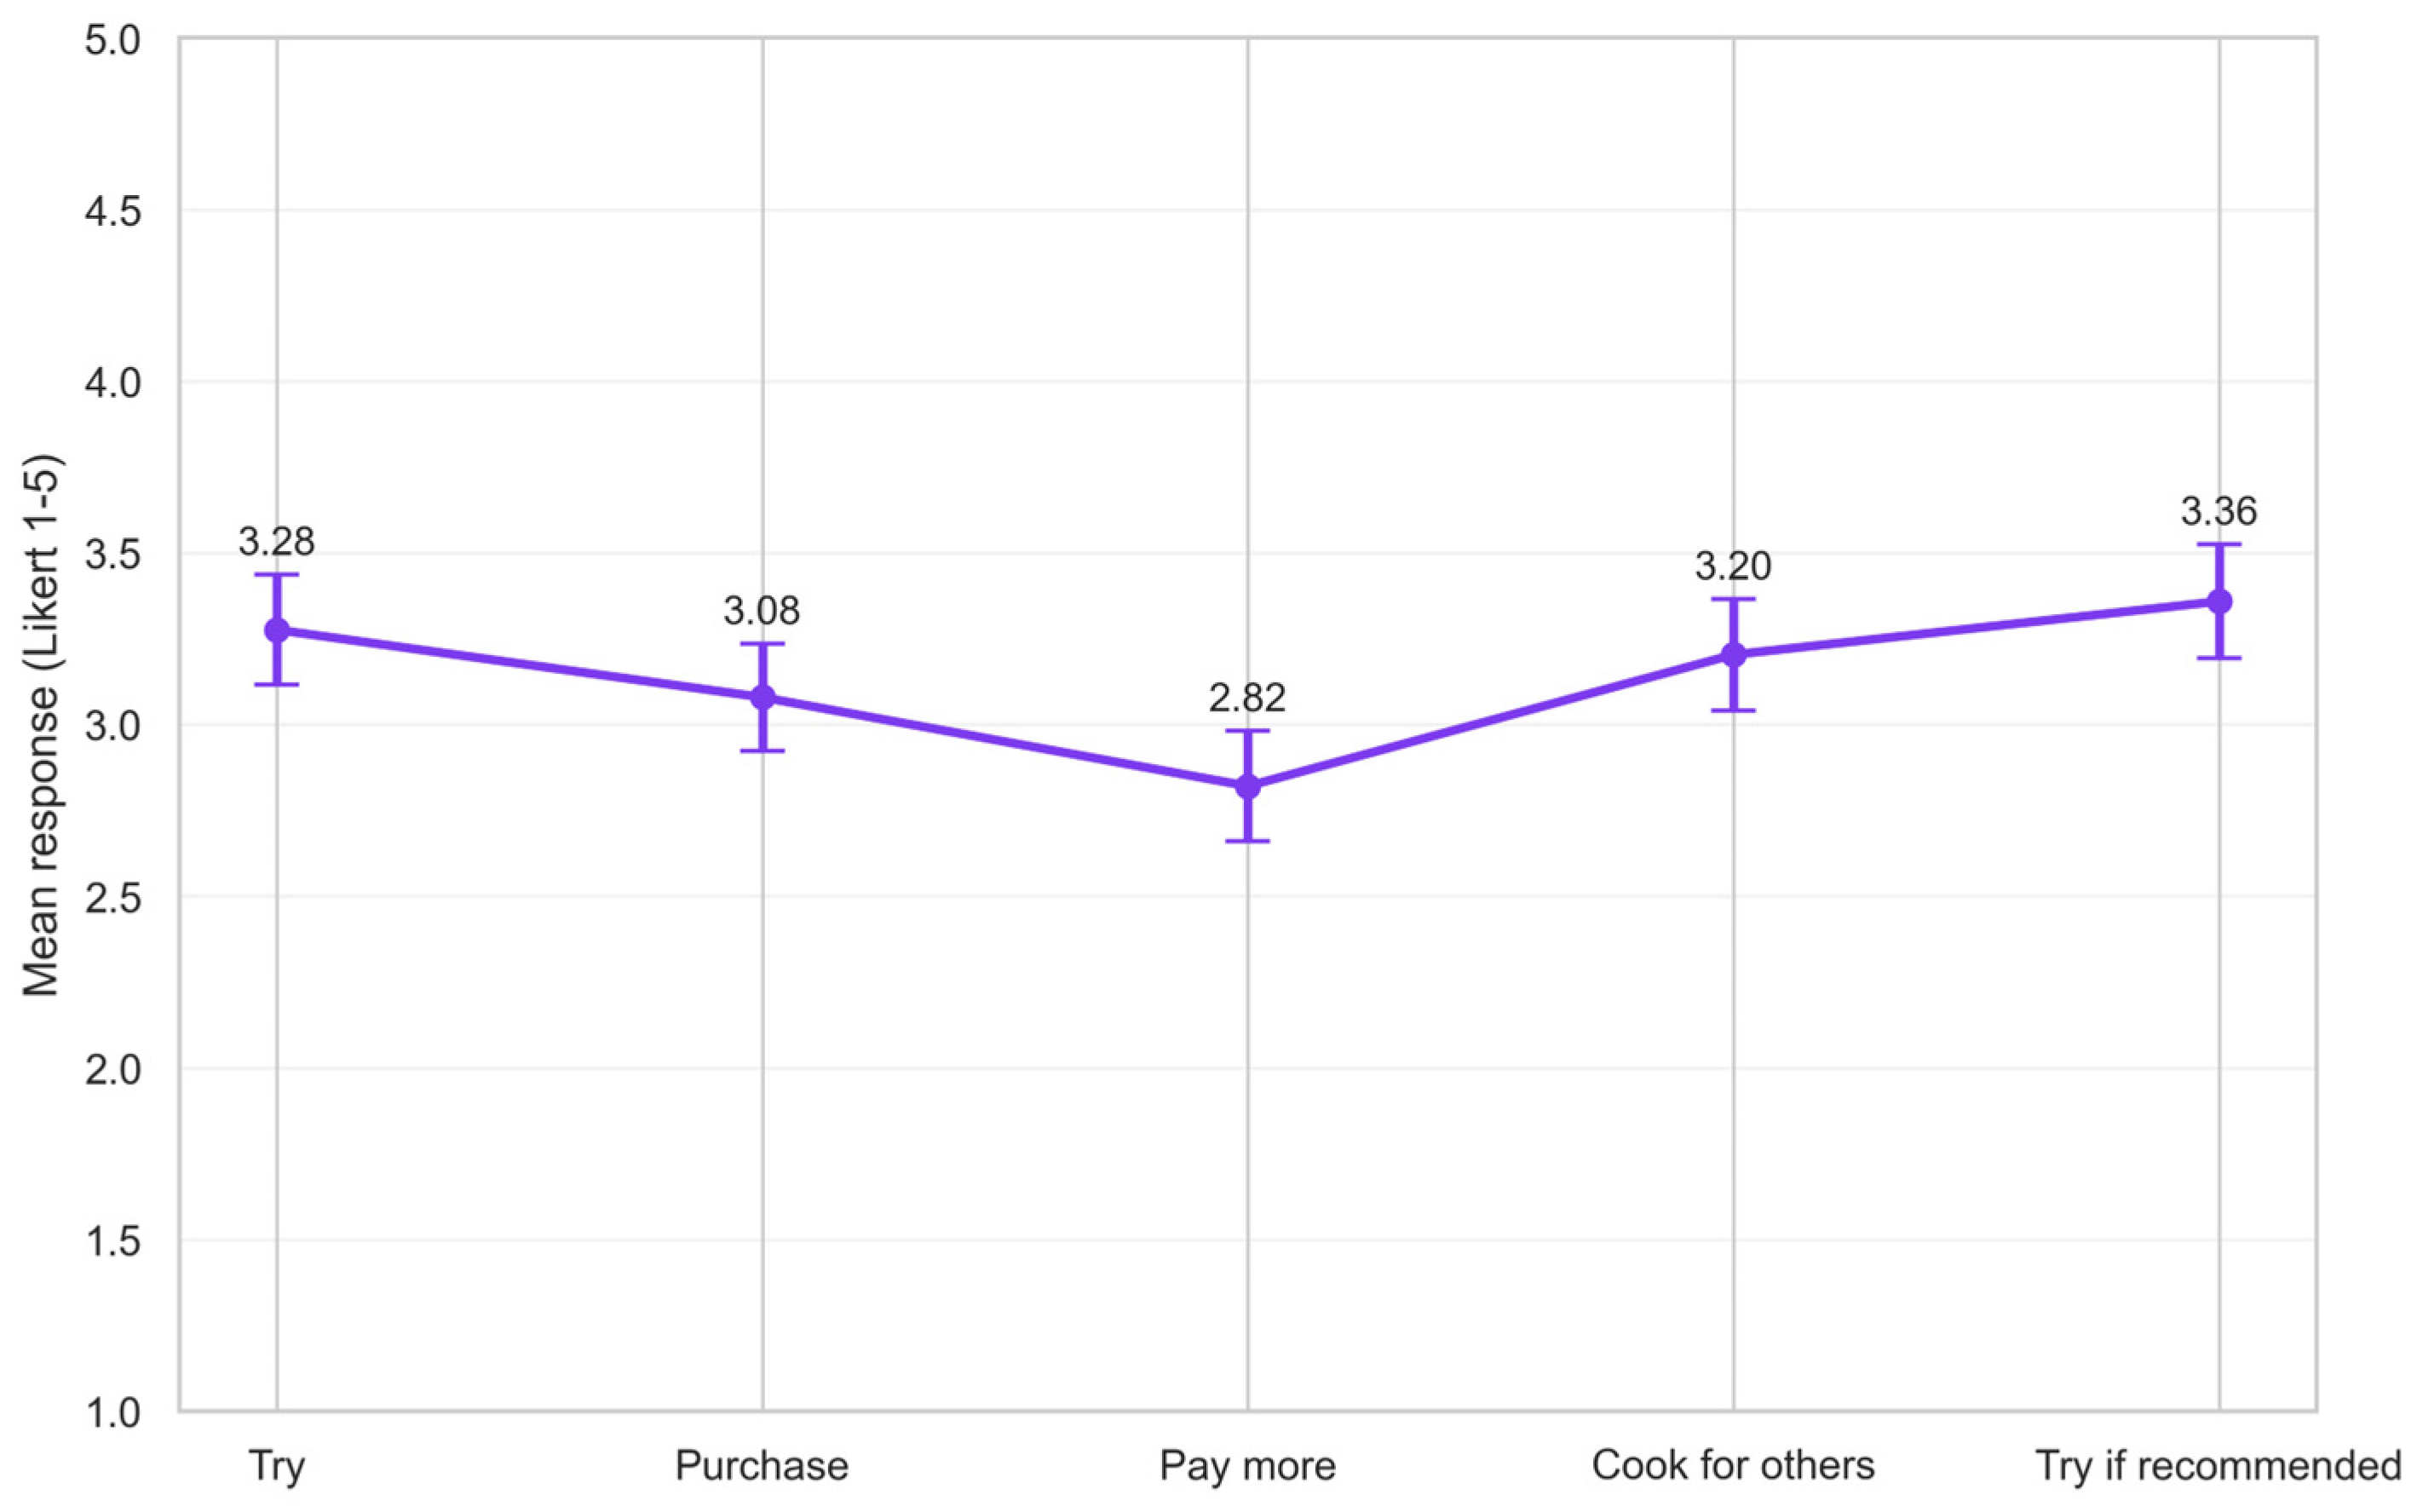
19]. This finding directly converges with the price premium constraint identified in the present study, where willingness-to-pay-more (Q17.3) emerged as the most constrained component of the intention gradient. The lower level of emotional resistance reported in African samples (~19%) compared to European or American consumers further suggests that African early-adopter segments are not constrained primarily by visceral disgust responses but rather by affordability, perceived necessity, and trust-related considerations [
19]. These convergent patterns reinforce the position that the determinants of cultured meat intention in African contexts cluster around affective risk and value fit domains rather than around outright emotional rejection, and that pricing strategy should be treated as a first-order rather than a secondary concern in any market entry planning targeted at African meat-eating consumer segments. Beyond the African comparison, a recent Italian consumer study has independently identified disgust, perceived unnaturalness, and price as the dominant barriers to cultivated-meat acceptance, alongside environmental and ethical motivators as principal drivers—a barrier-driver structure that closely mirrors the affective risk and value fit emphases of the present results and supports the cross-context relevance of this dual structure [
49].
Choice experiment evidence from South Africa adds a methodologically complementary perspective. In a discrete choice experiment with 649 South African consumers, lab-cultured beef captured an estimated 38% market share at constant prices (125 ZAR/400 g), compared with 21% for plant-based alternatives combined and 40% for conventional beef, with the cultured meat share remaining robust at 35–36% across sustainability and technology information treatments [
21]. Under sustainability framing, lab-cultured meat additionally captured a small but positive willingness-to-pay premium over conventional beef. These revealed-preference findings provide a more conservative behavioural anchor than self-reported intentions, and suggest that intention-based estimates such as the present 52.4% willingness indicator should be interpreted as upper bounds of plausible behavioural conversion rather than as direct market share predictions. The South African evidence also documents substantial within-country heterogeneity by ethnic background, with cultured meat market share reaching 47% among Black South African respondents versus 19% among White South African respondents in the no-information control condition [
21]; this parallels the cross-country heterogeneity reported in pan-African survey work [
19] and reinforces the need for population-specific inference rather than aggregate continental claims. Taken together, intention-based, structural equation, and choice-based evidence across Sub-Saharan settings—Chad in the present study, Nigeria [
35], and South Africa [
21]—converges on a shared determinant structure in which affective risk barriers, value fit appraisals, and price sensitivity occupy the principal explanatory positions, while socio-demographic moderators operate against this common backbone.
The partial support for value fit dominance that has been observed serves to refine expectations derived from value-based and identity-based frameworks. The importance of value fit variables was consistent, yet they did not surpass affective risk predictors in the confirmatory dominance hierarchy. This finding suggests that value congruence and perceived necessity, rather than replacing existing risk-emotion processes, jointly influence the shaping of adoption intention [
11,
41,
42]. This interpretation is also consistent with extended-TPB evidence from Southern Italy demonstrating that sustainable-diet drivers and value-laden evaluations jointly predict alternative protein acceptance beyond standard attitude norms control variables, positioning value fit as part of a wider sustainable consumption motivational structure rather than an isolated identity construct [
50].
4.3. Theoretical and Practical Implications
The findings support a layered interpretation of the adoption of cultured meat, in which technology-specific appraisals are more informative than conventional meat consumption heuristics. In principle, this tendency is more likely to support block-structured models that differentiate routine meat behaviour from product beliefs, affective risk responses, and value fit judgments, particularly in emerging market contexts where adoption pathways may differ from those observed in high-income settings. Positioned within the broader protein transition discourse, the present findings imply that the uptake of cultured meat in Sub-Saharan early-adopter segments will depend less on environmental promise per se than on whether prospective consumers can reconcile that promise with affective concerns about novelty, safety, and value alignment [
3,
4,
7].
In practice, communication and market entry strategies should prioritise the reduction in affective risk barriers and the reinforcement of concrete product beliefs, especially around safety, healthiness, and expected eating quality. It is evident that messaging which is anchored exclusively in sustainability narratives is unlikely to be sufficient when concerns regarding disgust and unnaturalness remain salient. The observed intention gradient also indicates that the willingness to pay a price premium is the weakest component of readiness. Therefore, in the context of early commercialisation scenarios, it is advisable to avoid premium-only positioning. Instead, the combination of affordability signals with trust-building interventions is recommended.
The results of the study indicate that transparent regulatory communication, visible safety standards, and credible quality assurance may be critical for reducing uncertainty in first-wave consumer segments, in the context of policy and stakeholder governance. In economies that are relevant to livestock production, such measures may be of particular importance in preventing polarised framing and in supporting a public discussion of cultivated protein options that is grounded in evidence. In Muslim-majority contexts such as Chad, halal compatibility represents an additional salient evaluative dimension that warrants transparent communication, given ongoing theological and regulatory discussions about the permissibility of cultured meat production processes [
26,
27].
Beyond the general implications above, several Chadian-specific contextual considerations warrant explicit articulation. First, livestock farming and pastoralism carry substantial economic and symbolic value in Chad, where animal agriculture supports both household livelihoods and cultural identity, particularly in rural and pastoralist communities; cultivated-protein communication that is perceived as devaluing this base is likely to provoke resistance irrespective of product attributes. Second, Chad’s predominantly Muslim population places halal compatibility at the centre of any plausible market trajectory, since the permissibility of cultured meat under Islamic law depends on production process characteristics (e.g., the source of starter cells and the composition of culture media) that are still under active scientific and theological discussion [
26,
27]. Third, affordability constraints are dominant in low-income settings: the willingness-to-pay-more shortfall identified for the present sample (Q17.3) is consistent with broader pan-African evidence that approximately 65% of African consumers expect to pay less than for conventional meat for cultivated meat alternatives [
19], and any premium-positioning strategy is therefore unlikely to gain traction in this market segment. Fourth, the digitally mediated recruitment used here selects for connected urban respondents in a setting where internet penetration remains structurally limited [
25]; rural, older, and lower-connectivity populations are not represented in the present data and will require dedicated mixed-mode designs. Fifth, exposure to biotechnology and food innovation in Chadian education and media is comparatively limited, which suggests that information framing and trusted-messenger strategies (rather than information volume alone) will likely be the principal levers for shifting risk perceptions during early-stage market entry.
4.4. Strengths and Limitations
The present study has several strengths. Initially, evidence was presented for an underrepresented context (young adults in Chad), where research on consumers of cultured meat is limited. Secondly, a theory-informed hierarchical design was combined with dominance analysis, sensitivity checks, and exploratory triangulation, enabling convergence assessment across multiple modelling families. Thirdly, the inferential scope was explicitly restricted to meat-eating respondents, thereby preserving construct validity for conventional-meat predictors and avoiding pseudo-comparisons with a very small non-meat-eating subgroup.
It is imperative to acknowledge the significant limitations associated with this approach. The online, non-probability sample limits external validity and is likely to over-represent younger, educated, urban, internet-connected participants. Consequently, it is imperative to generalise findings primarily to this subgroup and refrain from generalising to the broader Chadian population, particularly in regard to rural, older, or low-connectivity populations. The cross-sectional self-report design also precludes the drawing of causal inferences and remains vulnerable to social-desirability and common-method effects. Furthermore, the willingness-to-try, willingness-to-purchase, and willingness-to-pay-more items employed here are hypothetical self-report measures; intention-behaviour gaps in food choice are well-documented and tend to be larger than for non-food domains, and the affective risk and price-sensitivity patterns reported here should therefore be replicated in incentive-compatible discrete choice experiments to better quantify the price premium constraint identified for the present sample. Several constructs that are likely to matter for cultured meat acceptance in this context were not directly measured by the questionnaire: a dedicated religious-norm or halal-acceptability item, a measure of identification with pastoralist livelihoods and the symbolic role of livestock, and items capturing trust in regulatory bodies and the scientific establishment more broadly. Future instruments tailored to Sub-Saharan contexts should incorporate these dimensions explicitly. Additionally, the French-language instrument was not subjected to a formal back-translation procedure into Arabic or local vernaculars, nor to a qualitative cognitive debriefing pretest with Chadian respondents; semantic non-equivalence for technical constructs such as perceived unnaturalness, value fit, and food technology neophobia cannot be excluded and should be addressed in any subsequent replication through forward and back translation by independent bilingual translators followed by cognitive interviewing. Likewise, the general meat purchase priority items (Q7.1–Q7.8) were administered in a context-free wording that did not distinguish between raw and processed meat or between packaged and unpackaged supply channels; the interpretation of individual items (notably Q7.2 nutritional value, Q7.3 caloric content, and Q7.4 taste) consequently varied with the dominant purchase context of the respondent, and future instruments should ideally separate raw/processed and packaged/unpackaged supply contexts to permit context-specific evaluation of meat purchase priorities.
The significant discrepancy between R2 (0.306) and adjusted R2 (0.188) in the final model underscores the elevated predictor-to-observation ratio (42 predictors for n = 290), suggesting that a proportion of the explained variance might be attributable to capitalisation on chance. This issue is mitigated by the convergent pattern observed across modelling families (OLS, logistic, elastic net, Bayesian, random forest), yet the absolute magnitude of explained variance should be interpreted with caution. The predominantly ridge-like elastic-net solution (l1_ratio = 0.10) further suggests that the predictor space contains redundancy that inflates the full model R2 relative to what would replicate in an independent sample.
Sensitivity power analysis indicated that the study had adequate power (≥0.80 at α = 0.05) to detect block-level increments of approximately ΔR2 ≥ 0.031 for three-predictor blocks and ΔR2 ≥ 0.051 for the twelve-predictor conventional-meat block. Utilising the most conservative Holm-adjusted α level of 0.01, detectable increments were observed to increase to a minimum of 0.044 and 0.070, respectively. The observed value of ΔR2 for the conventional-meat block (0.027) fell below the detectable threshold, even at an α level of 0.05 (estimated power = 0.47). This finding indicates that the non-significant result for H1 is consistent with both a true null hypothesis and an underpowered test of a small effect. Conversely, the knowledge block (observed ΔR2 = 0.042) approached but did not attain the 80% power threshold at α = 0.05 (estimated power = 0.78), indicating that its non-significance may be partly attributable to limited statistical power rather than the absence of effect. The significant blocks (product beliefs, affective risk, value fit) had estimated power exceeding 0.88, thereby supporting the inferential reliability of these findings.
Furthermore, the implementation of item-level modelling resulted in an increase in collinearity within specific components of the specification. Despite the application of robust/block-level inference and complementary diagnostics, it is imperative that coefficient-level interpretation remains cautious. The low internal consistency of several predictor blocks (product beliefs: ω = 0.296; value fit: ω = 0.496) means that block-level hypothesis tests assessed the joint contribution of thematically related items rather than of unitary latent constructs, limiting construct-level generalisation. The marginal reliability of the intention outcome (ω = 0.607) further implies that observed R2 values are attenuated by measurement error and represent lower-bound estimates of true explained variance. Finally, behavioural intention was measured under hypothetical conditions; no revealed choice or real purchase behaviour was observed.
4.5. Future Research Directions
Future research endeavours should prioritise the incorporation of more extensive sampling frames, encompassing rural and peri-urban communities, lower-connectivity populations, and older age groups. The utilisation of mixed-mode recruitment techniques, such as the combination of online and in-person approaches, is recommended to mitigate potential biases arising from digital selection. The integration of cross-country African designs with harmonised instruments would facilitate the identification of context-specific versus regionally stable determinants.
Methodologically, experimental studies should test causal effects of communication strategies (e.g., safety framing, naming, social norm cues) and sensory exposure on willingness outcomes. In order to quantify adoption under affordability constraints, particularly given the identified premium price barrier, discrete choice and willingness-to-pay designs with realistic price ranges are required. Longitudinal designs would provide further clarification as to whether intention trajectories change after repeated exposure to information and market familiarisation.
In essence, future models ought to incorporate trust in institutions, regulatory confidence, and perceived distributional consequences for local livestock systems. These factors may hold particular relevance in economies where animal agriculture possesses high social and economic salience.