


Abstract
Although climate adaptation has become increasingly visible in agricultural policy across OECD countries, it remains unclear to what extent this orientation is reflected in agricultural support through more sustainability-oriented instruments. This study examines whether climate adaptation capacity conditions the relationship between drought stress and the climate orientation of agricultural support. Using a balanced panel of 11 OECD policy units over 2005–2023 (N = 209), we estimate two-way fixed-effects models interacting a three-pillar Adaptation Capacity Index (ACI), governance, risk management, and financial/implementation capacity, with the 12-month Standardized Precipitation–Evapotranspiration Index (SPEI-12). Adaptation capacity does not display a systematic association with the climate-aligned share of agricultural support under average conditions but becomes more consequential under drought conditions. Under severe drought, a one-unit increase in overall capacity is associated with a 0.73 percentage-point increase in the climate-aligned support share (p < 0.01). Governance capacity displays a more gradual marginal-effect profile, whereas risk management and financial/implementation capacity exhibit stronger non-linear patterns concentrated at higher levels of institutional maturity. In lower-capacity contexts, drought conditions are not associated with a stronger climate-aligned support share, suggesting more limited adaptation-oriented adjustment within the support system. Overall, the findings suggest that the climate orientation of agricultural support depends not only on expenditure composition itself, but also on the institutional capacity context through which climatic stress is translated into policy adjustment.
1. Introduction
In the context of climate change, agriculture occupies a distinctive dual position: on the one hand, it is a major source of greenhouse gas emissions; on the other, it is among the sectors most exposed to the impacts of climate change. Agriculture, forestry, and other land use together account for around 22% of global greenhouse gas emissions, which places the sector at the centre of climate policy in both mitigation and adaptation terms [1,2]. At the same time, rising temperatures, shifting precipitation patterns, and more frequent drought events are placing increasing pressure on agricultural productivity, farm incomes, and rural livelihoods [1,3]. According to the IPCC, water-related risks and the likelihood of agricultural drought increase with each additional increment of warming; in some regions, extreme agricultural droughts are projected to become at least twice as likely at 1.5 °C warming and 150–200% more likely at 2 °C [1]. In this context, where climate pressure is expected to intensify further, the need to redesign agricultural support systems not only for income and production stability but also in ways that strengthen adaptation capacity is becoming increasingly visible. This dual pressure has brought agriculture to the centre of national climate governance.
Governments’ responses to this pressure have expanded noticeably in recent years, at least at the level of formal policy documents. Following the Paris Agreement, all OECD member countries submitted nationally determined contributions that referred, to varying degrees, to agricultural adaptation, and many countries also prepared national adaptation plans or strategy documents identifying agriculture as a priority area of risk [4,5]. Comprehensive inventory studies compiling adaptation measures across 54 countries identify nearly six hundred distinct programmes and areas of intervention. Yet the extent to which this institutional and strategic framework has been reflected in the actual structure of agricultural support systems remains unclear.
In this respect, the reorientation of agricultural support away from more distortionary transfers and toward broader sustainability-oriented public goods is important not only for climate adaptation, but also for the long-term sustainability of food systems. Such a reallocation speaks directly to wider sustainability concerns, including food security, resilience, and the capacity of agricultural systems to cope with intensifying climatic pressures.
Existing evidence suggests that a pronounced mismatch still persists between climate commitments and the composition of agricultural support. According to OECD data, the share of total support devoted to general services that could strengthen adaptation capacity—such as research infrastructure, agrometeorological services, and early warning systems—declined from around 16% in 2000–2002 to 12.5% in 2020–2022 [5]. By contrast, market price support and transfers more directly linked to production continue to account for the largest share of the approximately USD 842 billion in annual support provided to producers [6]. The literature likewise suggests that the environmental and climate performance of agricultural policy depends not only on the overall level of support, but also on the design, calibration, and targeting of the instruments through which that support is delivered [7,8]. This suggests that the observed misalignment cannot be explained by funding levels alone; policy design, institutional functioning, and the structural characteristics of support instruments must also be taken into account.
At this point, adaptation capacity offers an important explanatory framework. In the broader literature, adaptation capacity is understood as the underlying infrastructure that enables an effective response to climate pressures, including institutional arrangements, governance structures, risk management tools, and implementation resources [9,10,11]. One might therefore expect countries with greater adaptation capacity to translate climate commitments into more effective policy instruments. Yet how this relationship should be measured empirically remains contested. Many of the indicators used to capture adaptation capacity are designed less to explain the composition of public expenditure or specific policy instruments than to reflect countries’ vulnerability, preparedness, or broader adaptive potential. Consequently, they do not necessarily translate directly into observable policy outputs or implementation patterns [12,13]. Similarly, much of the existing literature has concentrated on general adaptation capacity or levels of vulnerability rather than on the actual composition of agricultural support, making it difficult to identify which institutional dimensions matter most in shifting support systems toward more climate-aligned instruments [14,15,16].
Agricultural policies often display considerable inertia, since entrenched support structures, budgetary commitments, and politically organised interests make rapid reform difficult [17,18]. Yet marked climate shocks such as drought can unsettle this relatively stable structure and reopen questions of policy priority. In such times, some countries may turn to more short-term and compensatory instruments, while others may undertake more structural adjustments in their support portfolios. As Hurlbert [19] argues, under conditions of weak institutional preparedness, climate shocks often reinforce short-term responses, whereas stronger institutional infrastructures can allow the same pressure to be channelled into longer-term, adaptation-oriented instruments. The issue, therefore, is not simply whether drought produces a policy response, but to what extent and through which institutional mechanisms climate adaptation capacity matters in shifting agricultural support toward more climate-aligned instruments under drought conditions.
Taken together, the existing literature still leaves three important gaps regarding the relationship between institutional adaptation capacity, climatic stress, and agricultural support composition. First, while existing studies have examined the determinants of adaptation policy adoption at the national level [13,20], far less attention has been paid to how institutional capacity is reflected in the actual composition of agricultural support instruments. Second, studies on agricultural support composition show that the environmental and climate implications of support depend strongly on the type, design, and conditionality of policy instruments [21,22], but they rarely examine how institutional conditions moderate the relationship between climatic stress and support reallocation. Third, most composite adaptation capacity indices are designed to capture vulnerability or preparedness rather than the policy-implementation dimensions most relevant to agricultural support composition [12,23]. Addressing these gaps requires moving beyond vulnerability-based capacity measures toward a policy-oriented framework capable of examining how institutional capacity conditions the relationship between climatic stress and agricultural support composition.
This study examines how climate adaptation capacity shapes the orientation of agricultural support toward more sustainability-oriented and climate-aligned instruments in selected OECD policy units, and whether this role becomes more visible under drought conditions. To do so, the study uses a balanced panel dataset covering ten OECD member countries and the European Union over the period 2005–2023. A three-pillar Adaptation Capacity Index (ACI), consisting of governance, risk management, and financial/implementation capacity, is analysed together with the SPEI-12 drought indicator to assess how capacity operates under drought conditions. The study makes four main contributions to the literature. First, it proposes a comparative framework that measures adaptation capacity through institutional dimensions more directly related to agricultural policy, rather than through general vulnerability-based indicators. Second, rather than treating adaptation capacity as a direct and unconditional determinant of support composition, it examines whether capacity conditions the association between drought stress and the climate orientation of agricultural support, thereby connecting the adaptation capacity literature to the agricultural support composition literature. Third, instead of treating total capacity as a single composite score, it disaggregates it into governance, risk management, and financial/implementation dimensions, thereby making it possible to see how these components are associated with support composition under drought conditions. Finally, it contributes to debates on sustainable agricultural policy by showing that the climate orientation of support systems depends not only on expenditure levels or drought exposure, but also on the institutional capacity context in which support instruments are designed and adjusted.
The remainder of the article is organised as follows. Section 2 reviews the relevant literature and presents the hypotheses. Section 3 describes the dataset, variables, and empirical strategy. Section 4 reports the findings. Section 5 discusses these findings in light of the literature and broader policy debates.
2. Literature Review and Hypotheses
2.1. Agricultural Support Composition and Climate Adaptation
From the perspective of agricultural climate policy, the central issue is not simply how much support governments provide, but through which instruments that support is delivered. The OECD Producer Support Estimate (PSE) framework offers an important analytical basis for distinguishing the structure of support instruments and their potential environmental effects. DeBoe [21] shows that broad transfers and market price support, which are widely used across OECD countries, tend to display weak and often inconsistent relationships with environmental outcomes, whereas agri-environmental payments and results-based instruments have greater potential in terms of climate adaptation. Similarly, Henderson and Lankoski [22] identify support tied to the unrestricted use of variable inputs as among the more environmentally problematic instruments, while suggesting that instruments that are more decoupled from production or subject to greater conditionality may generate lower environmental pressure. For this reason, assessing the climate orientation of agricultural policy requires attention not only to the overall level of support, but also to the composition of the support portfolio.
At the same time, a considerable gap remains between declared climate commitments and actual support structures. Laborde et al. [24] show that a substantial share of the roughly USD 600 billion in annual agricultural subsidies generates adverse climate and environmental effects, making the redirection of support toward climate-smart instruments one of the highest-leverage areas for reform. The persistence of this misalignment is not accidental. Heyl et al. [25] and Springmann and Freund [26] show that producer groups and entrenched interest networks benefiting from existing support systems continue to exert strong influence over budget allocations, whereas the actors who would benefit from longer-term climate adaptation are often more diffuse and politically weaker. Jansson et al. [27] likewise emphasise that agricultural support has historically been shaped around income stability and production objectives, so that even when climate goals become stronger, the underlying instrument structure does not easily change.
The key question left open by this literature is under what conditions support shifts toward more climate-aligned instruments. Much of the existing work classifies PSE instruments according to their environmental performance, often in a cross-sectional way, or discusses the likely effects of reform scenarios. By contrast, there has been much more limited attention to when and under what kinds of pressure the composition of agricultural support actually changes. Recent evidence suggests that where institutional preparedness is weak, climate shocks do not necessarily produce a shift toward more adaptation-oriented instruments; in some cases, they may instead reinforce existing reactive and compensatory support structures [28,29]. The issue, then, is not simply whether drought triggers a reorientation, but under which institutional conditions such a shift becomes possible.
2.2. Adaptation Capacity: Conceptual Foundations and Measurement Challenges
Adaptation capacity is generally defined as the ability of a system to adjust to climatic pressures, reduce potential harm, and respond to emerging opportunities [9,30]. Yet the concept often refers not to a directly observed outcome, but to a latent or underlying capacity for preparedness that becomes visible under particular conditions. As Engle [11] notes, adaptation capacity is often not the response itself, but the institutional and structural basis that makes such a response possible. Its effects therefore become more visible especially when external pressures intensify. Bartelet et al. [31] similarly show that in explaining adaptation behaviour, not only pre-defined capacity indicators but also the severity of the experienced impact and the broader contextual conditions are decisive.
Measuring this concept empirically, however, involves major methodological difficulties. Siders [23] shows that the literature includes a large number of adaptation capacity indices, but that these do not converge around a common measurement framework. Adger and Vincent [32] note that because capacity is not directly observable, researchers often rely on proxy indicators, yet such indicators cannot always be directly validated against actual adaptation responses. More recent studies likewise suggest that the choice of indicators in capacity measurement is shaped not only by theoretical considerations, but also by data availability [12,33]. This makes it difficult to interpret composite capacity indices as direct and unconditional determinants of policy outcomes.
Even so, the comparative literature on national adaptation capacity repeatedly highlights certain dimensions. In a cross-country assessment, Berrang-Ford et al. [20] find that institutional capacity and governance quality are among the factors most strongly associated with adaptation policy outputs. Yohe and Tol [15], meanwhile, argue that capacity is often constrained by its weakest component, drawing attention to the importance of imbalance across dimensions. Eakin et al. [34] also stress the need to distinguish between general capacity and the more specific capacities that enable responses to particular climate threats. Against this background, disaggregating adaptation capacity into governance, risk management, and financial/implementation dimensions offers a more informative approach both conceptually and empirically.
2.3. Capacity-Conditioned Policy Adjustment Under Climatic Stress
Because adaptation capacity often becomes visible only under particular pressures, the key question concerns under what conditions that capacity translates into concrete policy change. The literature on agricultural policy change offers a mixed picture in this respect. On the one hand, external pressures such as drought can expose the limits of existing policy arrangements and, where institutional conditions are favourable, create conditions associated with incremental reorientation of support instruments [35]. On the other hand, agricultural support systems are known to be strongly path dependent, and organised interest groups together with concerns over income stability can constrain reform [18,36]. Belmin et al. [37], considering these two dynamics together, show that climate pressures may bring new instruments onto the agenda, but that these often remain incremental additions to existing structures rather than leading to a full transformation of the support portfolio.
Findings specific to drought make this debate more concrete. Where institutional preparedness is weak, drought pressure often pushes governments toward short-term assistance and compensatory instruments. Goodwin et al. [28] show that during drought periods, governments may rely more heavily on instruments such as input subsidies, compensation transfers, and price supports. Hrozencik and Perez-Quesada [29] similarly note that drought assistance often operates less as a structural transformation of the support portfolio than as an additional layer of transfers added onto the existing system. Hurlbert and Gupta [38] distinguish between reactive crises responses and more institutionalised processes of reallocation prepared in advance, arguing that the latter are only possible when the appropriate institutional infrastructure is already in place. The policy effect of drought therefore appears to depend not only on the severity of the shock itself, but also on the level of institutional preparedness.
This pattern is also supported by studies conducted at different scales. Vanschoenwinkel et al. [39] show that farms with higher capacity respond differently, and often more resiliently, to climate variability. Birthal and Hazrana [40] find that the effects of climate shocks vary depending on the adaptation strategies already available to producers. Williges et al. [41], meanwhile, show that regions with stronger institutional capacity are better placed to develop proactive responses, whereas reactive mechanisms tend to dominate where capacity is limited. Taken together, these studies suggest that adaptation capacity does not by itself generate a particular policy orientation; rather, it conditions which kinds of responses are more likely to emerge when shocks occur.
2.4. Institutional Channels: Governance, Risk Management, and Financial Capacity
The multidimensional character of adaptation capacity makes it necessary to consider whether governance, risk management, and financial/implementation capacity affect support composition in the same way. Because each dimension corresponds to a different institutional function, they may be expected to operate differently under drought pressure.
Governance capacity is primarily associated with coordination, policy coherence, and implementation capability. Stronger governance structures may facilitate inter-institutional coordination, reduce the transaction costs of reform, and provide a more systematic basis for integrating climate objectives into agricultural policy instruments. Berrang-Ford et al. [20] show that governance quality plays a central role in the emergence of adaptation policies. Hurlbert and Gupta [19] further emphasise that multi-level coordination structures can be decisive in shaping the difference between reactive interventions and more proactive adjustments. Jaisridhar et al. [42] also identify institutional fragmentation and weak coordination as among the main constraints on adaptation implementation. Governance capacity can therefore be seen as an important channel through which drought pressure is translated into changes in the support portfolio.
Risk management capacity, by contrast, is more directly related to the recognition, monitoring, and management of climate risks. Where this capacity is weak, drought shocks may produce short-term responses within the existing set of instruments rather than a shift toward more adaptation-oriented support. Miao [43] shows that poorly designed risk instruments can in some cases reinforce existing dependencies rather than strengthen adaptation. Choquette-Levy et al. [44] likewise argue that the mere existence of formal risk instruments does not in itself imply more effective risk management; institutional functioning and accessibility also matter. Once risk management capacity reaches a certain level of maturity, however, drought pressure may be addressed through more structured and pre-established instruments. For this reason, the role of risk management capacity may be nonlinear and may involve threshold-like effects.
Financial and implementation capacity refers not simply to the availability of resources, but to the extent to which those resources can be translated into functioning instruments and programmes. Khan et al. [45] show that financial capacity is often one of the weakest links in adaptation. Varangis et al. [46] likewise argue that effective agricultural risk management and resilience instruments require not only funding, but also appropriate market and public infrastructure. The effect of financial capacity, therefore, is linked less to the overall size of the budget than to the extent to which that budget can be institutionally converted into workable instruments.
Taken together, these three dimensions suggest that treating adaptation capacity as a single, homogeneous characteristic may obscure important differences in how it operates. Governance capacity may produce a more gradual and widely distributed effect, whereas risk management and financial/implementation capacity may operate through clearer thresholds. This distinction is important for understanding why climate shocks such as drought lead to a more adaptation-oriented reallocation of support in some settings, while in others they are absorbed within more short-term and compensatory structures.
2.5. Hypotheses
Against this background, the following hypotheses are developed in order to test the extent to which, and through which institutional mechanisms, climate adaptation capacity influences the orientation of agricultural support toward climate-aligned instruments under drought conditions.
H1.
Drought conditions are associated with changes in the share of climate-aligned agricultural support.
H2.
Adaptation capacity may not display a strong or systematic relationship with the share of climate-aligned agricultural support under average conditions.
H3.
Adaptation capacity conditions the relationship between drought conditions and the share of climate-aligned agricultural support.
H4.
Governance capacity is one of the main institutional mechanisms shaping the relationship between drought conditions and the share of climate-aligned agricultural support.
H5.
Risk management capacity may play a nonlinear role in the relationship between drought conditions and the share of climate-aligned agricultural support.
H6.
Financial/implementation capacity is one of the main institutional mechanisms through which agricultural support shifts toward more climate-aligned instruments under drought conditions.
3. Materials and Methods
3.1. Data and Sample
The study is based on a balanced panel dataset covering ten OECD member countries and the European Union: Australia, Canada, Chile, the European Union, Japan, Mexico, New Zealand, Norway, Switzerland, Türkiye, and the United States. The analysis spans the period 2005–2023 and includes a total of 209 observations. These cases were selected on the basis of three considerations: the availability of comparable agricultural support data within the OECD PSE/CSE framework, the presence of institutional structures through which climate adaptation policies can be tracked, and sufficient institutional variation to make it possible to examine capacity effects. The period begins in 2005 primarily because this is the first year for which the key data series overlap consistently.
This sample does not represent the full population of OECD members. Accordingly, the study should not be read as a general survey of all OECD countries, but rather as an analysis of selected policy units for which consistent agricultural support data, comparable country-year coding of adaptation capacity, and sufficient variation in both institutional capacity and drought exposure can be observed over the study period. The findings should therefore be interpreted within the boundaries of this comparative sample, rather than as automatically generalizable to the OECD as a whole.
The European Union is included as a single policy unit because OECD agricultural support data (PSE/TSE framework) are compiled and published for the EU collectively under the Common Agricultural Policy framework, without country-level disaggregation of comparable quality for the full 2005–2023 period. The EU’s ACI score is therefore constructed at the aggregate policy-unit level, drawing on CAP governance documents, EU-level climate adaptation strategies, and OECD reporting. It should be interpreted as an approximation of the EU’s collective institutional capacity rather than as a measure that is homogeneous across all member states, whose individual adaptation capacities vary considerably. To assess whether this coding choice influences the main findings, a robustness specification excluding the EU is estimated and reported in Appendix A Table A5.
3.2. Dependent Variable: Climate-Aligned Agricultural Support Share
As shown in Equation (1), the dependent variable, Aligned_Shareit, is derived from the OECD Producer Support Estimate (PSE) framework and measures the share of the Total Support Estimate (TSE) accounted for by agricultural support instruments that can be regarded as relatively more consistent with climate adaptation objectives. The analysis therefore focuses not on the overall level of support, but on the extent to which support is oriented toward climate-aligned instruments. This focus on support composition rather than aggregate expenditure reflects the fact that the climate relevance of agricultural spending depends less on how much is spent than on the types of instruments through which support is delivered [6,21,22].
Aligned_Shareit = (F1it + F2it + F3it + H1it + H2it + J1it)/TSEit
The classification draws on the OECD support taxonomy and on the literature discussing the environmental performance of different policy instruments. On this basis, agri-environmental and non-commodity payments (F1–F3), support for agricultural knowledge and innovation systems (H1–H2), and hydraulic infrastructure (J1) are treated as relatively more climate-aligned categories, whereas market price support, transfers linked to commodities or production, and unrestricted input subsidies are considered less closely aligned with climate objectives.
Because the OECD support classification was not originally designed as a climate adaptation index, this distinction necessarily involves a degree of analytical judgement. To keep that judgement as consistent as possible, some categories were excluded from the core definition where their content may vary substantially across countries and where they are therefore difficult to classify in a uniform way. It should be noted that the OECD PSE support categories are not designed as a direct climate-alignment taxonomy. Accordingly, the climate-aligned support share is interpreted as a proxy measure capturing the share of agricultural support with stronger potential relevance for climate adaptation and sustainability, rather than as a direct indicator of climate effectiveness. Some support categories may exhibit heterogeneous climate relevance across countries and time periods. To assess the sensitivity of the results to the specific construction of this variable, robustness checks using three alternative definitions of the dependent variable are reported in Appendix A Table A6. Supplementary Table S1 reports the support-item mapping used in the construction of the dependent variable.
3.3. Main Explanatory Variable: Adaptation Capacity Index (ACI)
To measure national adaptation capacity, this study develops an original Adaptation Capacity Index (ACI). Many existing composite indices are designed to capture climate vulnerability or general preparedness, whereas policy-oriented, country-year measures better suited to explaining governments’ ability to redirect agricultural support composition under climate stress remain more limited [12,23]. The ACI is therefore designed not to measure vulnerability, but to capture the institutional and implementation-oriented capacity that makes it possible for climate adaptation to be reflected in agricultural policy and support structures.
The ACI consists of three main pillars: governance capacity (ACI_GOV), risk management capacity (ACI_RISK), and financial/implementation capacity (ACI_FIN). Each pillar includes four sub-indicators, and each sub-indicator is coded on a 0–2 scale. Pillar scores therefore range from 0 to 8, and the total index ranges from 0 to 24. Equal weighting was adopted because the three pillars are conceptually complementary and no strong theoretical basis exists for assigning one pillar systematically greater importance across all country-year observations. To assess the sensitivity of the results to this assumption, three alternative weighting schemes are estimated, assigning a double weight to each pillar in turn, and three leave-one-pillar-out specifications are also reported. The results of these sensitivity checks are presented in Appendix A Table A3 and Table A4 and confirm that the main interaction term is negative and statistically significant across all alternative specifications. The coding logic is the same across all sub-indicators: 0 indicates that the relevant structure is absent or exists only in a fragmented, project-based form; 1 indicates partial development or limited institutionalisation; and 2 indicates a clearly established and operational structure.
Since the ACI is partly based on qualitative institutional coding, researcher discretion cannot be fully eliminated. To reduce this risk, the scoring rules, source documents, break years, and country-level justifications are documented in the coding inventory. A formal inter-coder reliability statistic could not be calculated because the coding was conducted by a single author. This limitation is acknowledged explicitly. As a basic face-validity check, the country-level ACI scores are broadly consistent with independent assessments of institutional adaptation capacity within the sample. Policy units with higher scores, such as Norway, Switzerland, and the European Union, are generally characterised by more developed climate governance and risk-management infrastructures, whereas lower-scoring units such as Mexico and Chile display more limited institutionalisation of adaptation frameworks. Although this does not constitute formal statistical validation, it provides additional support that the index captures meaningful cross-country variation in institutional capacity. To improve transparency and reproducibility, the revised manuscript provides detailed coding rules, source documentation, and the sensitivity checks described above. The ACI may also partly capture policy visibility, administrative documentation capacity, or institutional maturity rather than actual implementation effectiveness. The results should therefore be interpreted as conditional associations rather than causal effects.
The indicators included in each pillar and the institutional mechanism they represent are summarised in Table 1. Country-level period averages of the total ACI are presented in Figure 1, while the indicators used for each pillar, source documents, and break-year justifications are provided in Supplementary Table S2.
Table 1.
Structure of the Adaptation Capacity Index (ACI): Dimensions, Indicators, and Institutional Mechanisms.
Figure 1.
ACI_TOTAL score trajectories by country and sample mean (2005–2023). Note: Thick black line = unweighted sample mean. Dashed horizontal lines at scores 8 (low) and 16 (medium) indicate broad capacity tiers. Dashed vertical lines indicate key structural reference periods: 2008 Global Financial Crisis (GFC), 2015 Paris Agreement, and Post-COVID recovery (2021 onward). Source: Authors’ ACI construction (Supplementary Table S2).
3.4. Drought Indicator: SPEI-12
To represent climatic pressure, the analysis uses the 12-month Standardized Precipitation–Evapotranspiration Index (SPEI-12). SPEI is a widely used drought indicator in the climate variability literature, measuring the standardised deviation of the balance between precipitation and potential evapotranspiration [47]. A 12-month accumulation window was chosen in order to capture medium-term hydrological stress relevant to agricultural production cycles and policy response timing, rather than short-term meteorological fluctuations. Positive values indicate wetter conditions, whereas negative values indicate drier conditions. The data were obtained from the Global SPEI database, aggregated at the country level using weighted averages, and converted into annual series [48] and presented in Figure 2 by country.
Figure 2.
Annual SPEI-12 values by country (2005–2023). Standardized Precipitation–Evapotranspiration Index, 12-month accumulation. Note: Negative SPEI-12 values indicate drier-than-average conditions (drought), while positive values indicate wetter-than-average conditions. Dark shading marks drought periods (SPEI-12 < 0). Dotted lines at ±1.0 indicate the moderate threshold. Source: Global SPEI Database [47].
3.5. Control Variables
Three structural control variables are included in the models. First, GDP per capita (2021 PPP, international USD) is used to capture income level adjusted for purchasing power parity, reflecting the literature suggesting that lower income levels may constrain the capacity for policy reform [20]. Second, the share of agriculture in GDP (%) is included to reflect the political economy context within which support systems operate. Finally, the food system performance index (ND-GAIN food score) is included to control for the possible influence of food system preparedness on support composition; these data were obtained from the Notre Dame Global Adaptation Initiative database.
3.6. Econometric Model
The empirical strategy is based on a two-way fixed-effects panel model including both country and year fixed effects. Country fixed effects control for time-invariant unobserved heterogeneity such as institutional traditions and historical policy architecture, while year fixed effects account for common temporal shocks, including global commodity conditions.
The baseline equation is specified as follows in Equation (2):
where Aligned_Shareit denotes the country’s climate-aligned agricultural support share; αi country fixed effects; γt year fixed effects; ACIit the total adaptation capacity index or its sub-pillars; SPEI12it the 12-month SPEI value; Xit the control variables; and εit the error term.
Aligned_Shareit = αi + γt + β1ACIit + β2SPEI12it + β3(ACI × SPEI12)it + δXit + εit
The central coefficient is β3, which captures the conditioning role of adaptation capacity in shaping the orientation of support composition under drought conditions. Four separate model specifications are estimated, using ACI_TOTAL, ACI_GOV, ACI_RISK, and ACI_FIN, respectively, to test Hypotheses 3–6.
Standard errors are clustered at the country level [49]. Given the limited number of clusters in the sample, statistical inference is interpreted with caution. Although the dependent variable is a bounded share variable, the linear fixed-effects model was retained as the main specification because of its interpretability and transparency in a small-sample panel setting. The estimates are therefore interpreted as conditional associations rather than definitive causal effects.
Since the main specification models a contemporaneous relationship between drought and support composition, agricultural policy responses to climatic shocks may be subject to institutional delays. To address this concern, two additional specifications are estimated, replacing the contemporaneous SPEI-12, with its one-year (t − 1) and two-year (t − 2) lags.
Wild Cluster Bootstrap-t p-values are also computed for the main interaction terms using the boottest command with Webb weights, which provide a suitable small sample correction for very small numbers of clusters. The annual SPEI-12 value used in all specifications was calculated as the unweighted average of monthly SPEI-12 observations within each calendar year. Additional robustness checks are reported in Section 4.5 and Appendix A Table A1, Table A2, Table A3, Table A4, Table A5 and Table A6. These include lagged drought specifications replacing the contemporaneous SPEI-12 with one- and two-year lags (Appendix A Table A1), Wild Cluster Bootstrap corrections for small-sample inference (Appendix A Table A2), alternative ACI weighting schemes (Appendix A Table A3), leave-one-pillar-out specifications (Appendix A Table A4), a specification excluding the European Union as a policy unit (Appendix A Table A5), and alternative definitions of the climate-aligned support share (Appendix A Table A6).
The findings should also be interpreted with caution in relation to potential endogeneity and measurement limitations. Although the fixed-effects structure controls for time-invariant country characteristics and common temporal shocks, the models do not fully eliminate the possibility that institutional capacity and support composition evolve jointly over time. In addition, the ACI indicators are based on policy-document coding and therefore may capture formal institutional commitment more effectively than actual implementation quality or policy effectiveness.
4. Results
4.1. Descriptive Statistics
Descriptive statistics for the main variables used in the analysis are presented in Table 2 (N = 209). The mean value of the climate-aligned agricultural support share (Aligned_Share_t) is 16.6% (Table 2; see also Figure 3A). The fact that values range from 3% to 50%, with a standard deviation of 13.84, points to substantial variation both across countries and over time.
Table 2.
Descriptive statistics of key variables (N = 209).
Figure 3.
Country-level period averages: climate-aligned agricultural support share (Panel (A)) and institutional adaptation capacity—ACI_TOTAL (Panel (B)), 11 OECD policy units, 2005–2023. Note: Bars are sorted in ascending order within each panel. The dashed vertical line indicates the unweighted sample mean. Panel A reports Aligned Share (%) from the OECD APME database. Panel B reports ACI_TOTAL from the authors’ index (scale: 0–24). Period averages are calculated over 2005–2023.
The mean value of the total adaptation capacity index (ACI_TOTAL) is 14.1, within a theoretical range from 0 to 24 (Figure 3B). Looking at the sub-components, the mean score is 5.34 for financial capacity, 5.04 for risk management capacity, and 3.72 for governance capacity. This pattern suggests that, within the sample, governance tends to remain at a lower average level than the other two capacity pillars.
The drought indicator, SPEI-12, ranges from −1.44 to +1.40, with a sample mean of −0.08. This distribution indicates that the study period includes both marked drought conditions and relatively wetter periods, providing sufficient climatic variation for testing the interaction models.
4.2. Pairwise Correlations
Table 3 reports the Pearson correlations between the climate-aligned support share, the adaptation capacity indicators, and the drought variable. The first point that stands out is the strong co-movement among the capacity indicators themselves. Correlations between ACI_TOTAL and the sub-components range from 0.857 to 0.950, while correlations among the sub-components themselves range from 0.698 to 0.816 (p < 0.01). This high degree of association suggests that including governance, risk management, and financial capacity in the same model would increase the risk of multicollinearity. For that reason, examining these components in separate model specifications appears analytically more appropriate.
Table 3.
Pearson correlation matrix.
Second, the bivariate relationships between Aligned_Share and the adaptation capacity indicators appear weak. The correlation coefficients between Aligned_Share and the adaptation-capacity indicators range from −0.062 to +0.101, and none indicates a statistically meaningful relationship. This suggests that higher adaptation capacity, on its own, does not necessarily correspond to a higher climate-aligned support share.
By contrast, the relationship between Aligned_Share and SPEI-12 is comparatively stronger. The negative and statistically significant correlation between the two variables (r = −0.297; p < 0.01) suggests that drier conditions tend to coincide with higher observed shares of climate-aligned support. The weak but statistically significant negative correlation between SPEI-12 and the financial capacity component (r = −0.181; p < 0.01) likewise suggests that the financial channel warrants closer attention in the interaction models.
4.3. Panel Fixed-Effects Estimates
The four models reported in Table 4 estimate the interaction between drought and, respectively, the total capacity index and its three sub-components. Taken together, the results point to a common pattern: neither the capacity indicators nor drought on their own display a strong and systematic effect; rather, the main relationship emerges through the interaction between climate adaptation capacity and drought conditions.
Table 4.
Climate-aligned agricultural support share: panel fixed-effects estimates.
Across all four models, the standalone effects of the capacity indicators are limited, unstable in sign, and statistically insignificant. This suggests that under average conditions, higher adaptation capacity does not automatically translate into a higher share of climate-aligned support. The standalone effect of SPEI-12 is likewise positive in all specifications, but not statistically significant (p > 0.10). This, in turn, suggests that drought does not operate in a simple linear way on its own; rather, its effect appears to depend on the institutional context in which it occurs.
By contrast, the interaction terms are negative and statistically significant at the 5% level in all four models. Given that lower values of SPEI-12 indicate drier conditions, these coefficients imply that as capacity increases, the association between drought and a higher climate-aligned support share becomes stronger. Capacity therefore appears to function not as an independently determining factor, but as a conditioning institutional mechanism that becomes consequential when agricultural support is reoriented under drought.
A comparison across the sub-pillar models is also instructive. The interaction coefficients for risk-management and financial/implementation capacity (−1.356 and −1.334, respectively) are larger in magnitude than that for governance capacity (−0.870), suggesting that these dimensions may become more operationally relevant under drought conditions. By contrast, governance capacity appears to play a more gradual conditioning role, consistent with the idea that institutional coordination and strategic planning influence the broader direction of support adjustment over longer time horizons rather than through rapid short-term responses.
4.4. Average Marginal Effects
The average marginal effects reported in Table 5 make it easier to see not only the statistical significance of the interaction terms, but also their substantive and institutional meaning. These estimates show the extent to which the effect of climate adaptation capacity becomes more visible under drought conditions, and how this effect differs across capacity levels and sub-dimensions.
Table 5.
Average marginal effects from interaction models.
Panel A shows the marginal effect of drought at different levels of total adaptation capacity (Figure 4). When capacity is low (ACI_TOTAL = 6), the effect of drought is positive and statistically insignificant, suggesting that in low-capacity settings drought pressure does not generate a systematic shift toward climate-aligned support. By contrast, once capacity approaches a mid-range level (ACI_TOTAL = 14), the effect turns negative and becomes statistically significant. At a high capacity level (ACI_TOTAL = 22), the effect is strongly negative and significant, suggesting that in policy settings with stronger institutional capacity, drought conditions are associated with a more pronounced reorientation of the support portfolio toward climate-aligned instruments. Panel B presents a similar but more gradual pattern for governance capacity. Panel C points to a more distinct threshold-like pattern in the case of financial capacity, with the effect becoming statistically significant only at higher capacity levels. Panel D reveals a similarly capacity-dependent differentiation for risk management. These sub-index marginal-effect patterns are illustrated in Figure 5A–C.
Figure 4.
Marginal effect of drought (SPEI-12) on climate-aligned agricultural support share at different ACI_TOTAL levels. Note: Average marginal effects (AME) from the panel fixed-effects interaction model (N = 209). Ninety-five percent confidence intervals are estimated using the delta method. Filled circles indicate statistical significance at p < 0.10. The dashed vertical line at ACI_TOTAL = 14 marks the estimated capacity threshold. Generated using Stata 17 (StataCorp LLC, College Station, TX, USA).
Figure 5.
Marginal effect of drought (SPEI-12) on aligned share by ACI sub-index level ((Panel (A)): Governance Capacity; (Panel (B)): Financial Capacity; (Panel (C)): Risk Management Capacity). Note: Average marginal effects (AME) from separate panel fixed-effects interaction models for each sub-index (N = 209 in each case). Ninety-five percent confidence intervals are estimated using the delta method. Filled circles indicate p < 0.10. The FIN and RISK sub-indices display the steepest AME gradients at high capacity levels. Generated using Stata 17 (StataCorp LLC, College Station, TX, USA).
Taken together, the sub-index AME profiles suggest that the three capacity dimensions do not operate symmetrically. Governance capacity shows a more continuous gradient, whereas risk-management and financial/implementation capacity display steeper profiles concentrated at higher capacity levels. This asymmetry suggests that governance capacity may begin to condition support adjustment at earlier stages of institutional development, whereas risk-management and financial/implementation capacities appear to become more pronounced at higher levels of institutional maturity. This distinction provides an important basis for the discussion of capacity-building priorities.
Panel E of Table 5 shows the effect of total capacity under different climatic conditions: under severe drought, a one-unit increase in ACI_TOTAL is associated with a 0.73 percentage-point increase in the climate-aligned support share, whereas under average conditions the effect is not statistically significant. This marginal-effect pattern is illustrated in Figure 6. This asymmetry suggests that the role of capacity is context-sensitive, and that in the absence of drought it does not generate the same degree of adaptation-oriented reallocation. A less intuitive finding also emerges under above-normal wet conditions: higher ACI_TOTAL is associated with a lower climate-aligned support share at SPEI-12 = +1 and +2. This pattern should be interpreted cautiously. It may reflect the fact that adaptation capacity becomes most policy-relevant when climatic pressure is salient, or it may capture compositional changes in total support during wetter years rather than a direct reduction in climate-oriented instruments.
Figure 6.
Marginal effect of institutional capacity (ACI_TOTAL) on climate-aligned support share at different drought conditions (SPEI-12 levels). Note: Average marginal effect (AME) from the panel fixed-effects interaction model (N = 209). Ninety-five percent confidence intervals are shown. The positive and statistically significant effect under severe drought (SPEI-12 = −2) indicates that capacity disciplines rather than simply expands climate-aligned support under drought stress. The shaded area denotes the drought zone (SPEI-12 < −0.5). Generated using Stata 17 (StataCorp LLC, College Station, TX, USA).
4.5. Robustness Checks
Several robustness checks were conducted to assess the stability of the main interaction result. First, lagged SPEI-12 specifications were estimated to account for possible administrative and budgetary delays in agricultural support adjustment. The interaction between adaptation capacity and SPEI-12 remains negative when one-year and two-year lagged drought indicators are used, although the contemporaneous specification provides the strongest statistical evidence (Appendix A Table A1). This suggests that the baseline model should be interpreted as capturing contemporaneous conditional associations rather than definitive evidence of a delayed policy response.
Second, given the limited number of policy-unit clusters, Wild Cluster Bootstrap inference was applied to the main interaction terms. The ACI_TOTAL × SPEI-12 interaction remains statistically significant under Webb weights, providing additional support that the baseline result is not driven solely by conventional cluster-robust inference (Appendix A Table A2). The pillar-level interactions remain directionally consistent, although the financial/implementation interaction shows weaker statistical precision under bootstrap correction.
Third, alternative ACI weighting schemes and leave-one-pillar-out specifications were estimated to evaluate whether the results are sensitive to the equal-weighting assumption or driven by a single ACI pillar. The interaction remains negative and statistically significant across these specifications, suggesting that the main finding is not an artefact of the baseline index construction (Appendix A Table A3 and Table A4).
Fourth, excluding the EU policy unit leaves the main interaction negative and statistically significant, indicating that the result is not driven by treating the EU as a single aggregate observation (Appendix A Table A5). Finally, alternative definitions of the climate-aligned support share were estimated. The no-J1 specification is particularly important because hydraulic infrastructure may have heterogeneous climate relevance across countries. The interaction remains negative when J1 is excluded and when only F1–F3 support categories are used, although statistical precision is weaker than in the baseline model (Appendix A Table A6).
Overall, these robustness checks support the stability of the capacity-conditioned association between drought stress and support composition, while reinforcing the need to interpret the findings as conditional associations rather than causal estimates.
5. Discussion
5.1. The Conditional Role of Adaptation Capacity Under Drought Stress
The findings of this study show that climate adaptation capacity does not directly and automatically determine whether agricultural support shifts toward more climate-aligned instruments under average conditions. Rather, its role becomes visible primarily under drought conditions, suggesting that more sustainability-oriented policy adjustment depends not only on drought exposure itself, but also on the institutional capacity through which drought pressure is governed and translated into policy change.
This result is consistent with the literature that treats adaptation capacity not as a fixed characteristic producing direct outcomes, but as a potential that becomes visible under particular conditions of stress. Earlier studies have shown that capacity often refers less to actual behaviour itself than to the institutional infrastructure that makes such behaviour possible, and that its effects vary depending on context, climatic pressure severity, and implementation conditions [9,11,31,32,33,50]. In a similar way, this study suggests that the key issue is not simply whether capacity exists, but the extent to which that capacity becomes relevant for the climate orientation of agricultural support under drought conditions.
At the same time, this should not be read as meaning that capacity alone is sufficient. The existence of adaptation plans or strategy documents does not automatically ensure that they will be translated into actual policy instruments. Leiter [51] shows that implementation and monitoring structures remain limited in many countries, while Roelfsema et al. [52] identify substantial gaps between declared climate commitments and concrete policy outcomes. What emerges here, therefore, is not a direct output mechanism, but a conditional institutional attribute whose relevance for support composition becomes apparent primarily under drought stress.
5.2. Total Adaptation Capacity and Support Composition Under Drought
The findings for total adaptation capacity suggest that its association with support composition is neither linear nor constant, but becomes more visible at higher levels of institutional maturity. At low levels of capacity, drought pressure does not appear to generate a meaningful shift in support composition. As capacity strengthens, however, drought becomes more clearly associated with a move toward climate-aligned instruments. This suggests that capacity matters not simply as a quantitative increase, but because different institutional components begin to function together in a more coherent way.
This finding is in line with studies arguing that institutional capacity requires a minimum degree of internal coherence before it can translate into policy outcomes. Berrang-Ford et al. [20] show that governance capacity often works as a precondition, and that where this foundation is weak, other dimensions of capacity also remain constrained. Andrijevic et al. [53] likewise suggest that higher adaptation capacity alone is not enough, since weak governance can continue to act as a binding constraint. The pattern observed here similarly indicates that when the institutional infrastructure remains weak or fragmented, drought pressure is less likely to be associated with a structural reorientation within the support system.
In this sense, drought may be understood not only as a crisis, but also as a pressure that reveals the limits of the existing support system. Gruère et al. [54] show that drought has, in some OECD countries, opened windows of opportunity for reform in agricultural and water policy, although such openings depend strongly on institutional context. Tambet and Stopnitzky [55] further note that single-year and multi-year droughts can generate different policy responses, with more persistent stress more likely to be associated with structural adaptation debates. Taken together, these studies support the interpretation that drought does not produce automatic policy change, but that where institutional capacity is sufficiently developed, it can become associated with a more adaptation-oriented shift in support composition.
At the same time, the presence of high total capacity does not mean that the support system becomes fully climate-aligned. Siebenhüner et al. [56] show that even in high-capacity contexts, tendencies toward delay, waiting, and limited intervention may persist. Albizua et al. [57] and Belmin et al. [37] similarly argue that climate pressures often produce incremental adjustments layered onto existing systems rather than full institutional transformation. The relationship observed here should therefore not be interpreted as evidence that capacity guarantees transformation, but rather that it creates a stronger institutional basis for movement in that direction.
This interpretation helps explain why adaptation capacity does not appear as a simple standalone effect in the models. Its policy relevance appears to depend on whether governance, risk-management, and implementation capacities are sufficiently aligned to convert climatic pressure into observable changes in the support portfolio, a pattern that becomes more visible at higher levels of overall institutional maturity.
5.3. Governance Capacity: The Channel of Coordination and Policy Coherence
The results for governance capacity suggest that this dimension may be one of the channels through which drought pressure becomes associated with support composition. As governance capacity increases, the relationship between drought and the climate-aligned support share becomes more pronounced. This points to the importance of coordination, decision-making, and implementation coherence in shaping how support systems respond under climatic stress. In this sense, governance capacity appears not merely as an abstract indicator of institutional quality, but as a practical institutional condition through which climate objectives may be translated more or less effectively into agricultural support instruments.
This interpretation is consistent with the literature on multi-level governance and climate adaptation. Hurlbert and Gupta [19] emphasise that effective adaptation policy depends heavily on multi-level coordination and institutional coherence. Mullin and Rubado [58] likewise show that, particularly under drought conditions, institutional infrastructures shape both the speed and the form of policy response. Bednar et al. [59], however, note that while network governance may facilitate agenda setting, coordination alone is not enough where implementation capacity remains weak. Against this background, the more gradual and regular pattern observed here for governance capacity suggests that this dimension operates as an enabling channel within the broader policy system. This may also help explain why the governance interaction displays a more continuous gradient across capacity levels than the steeper profiles observed for risk-management and financial/implementation capacity.
The importance of governance is also closely tied to the problem of integration between climate and agricultural policy. Schmidt [60] shows that in many settings climate policy and agricultural policy continue to function as separate institutional domains, weakening policy coherence. England et al. [61] similarly argue that while agriculture and water policy may converge under short-term crisis conditions, their integration remains much more limited in relation to longer-term adaptation goals. Governance capacity therefore matters not only because it improves coordination, but also because it affects the extent to which climate objectives can actually be translated into agricultural policy instruments. The findings suggest that policy designs aimed at transforming support systems need to focus not only on financial tools, but also on institutional linkages, coordination, and implementation architecture.
5.4. Risk Management Capacity: From Reactive Assistance to More Systematic Adaptation Instruments
The findings for risk management capacity point to a strongly non-linear pattern. Where risk management capacity is very weak, drought does not appear to increase the share of climate-aligned support and may even be associated with the opposite tendency. This suggests that risk management capacity should be understood not simply in terms of whether instruments exist, but also in terms of how effectively they function. As capacity strengthens, the relationship between drought pressure and the shift toward more climate-aligned support becomes more evident, reinforcing this interpretation. In this sense, the non-linear pattern observed for risk management capacity suggests that drought exposure alone is insufficient to induce a more sustainability-oriented policy shift; what matters is whether countries possess the institutional risk architecture needed to translate climatic stress into more durable and preventive forms of support.
This pattern resonates strongly with the literature on agricultural risk management. Goodwin and Vado [62] show that reactive public transfers may, in some cases, create new long-term dependencies rather than reducing income risk in a lasting way. Glauber et al. [63] further argue that publicly supported risk instruments can crowd out private risk-reduction investments, while Miao [43] notes that subsidised insurance systems may under some conditions weaken more innovative and resilience-enhancing forms of behaviour. These studies suggest that the mere presence of risk management instruments does not automatically imply stronger adaptation; what matters is how those instruments are designed and embedded institutionally. The findings therefore support the distinction between risk-management systems that primarily stabilise short-term losses and those that contribute more directly to longer-term adaptive restructuring.
The positive sign observed in this study under very low risk capacity is meaningful in that respect. It suggests that where risk management infrastructure is weak, drought is not associated with a stronger climate-aligned support share and may instead be consistent with continued reliance on short-term or compensatory support patterns. Hurlbert and Gupta [19] argue that ex ante risk tools become effective only when they are embedded in a broader governance structure, while Cobourn [64] shows that risk management programmes across OECD countries often support medium-term adjustment but remain more limited in their capacity to generate deeper transformation. Popp’s [65] observations on path dependency in OECD countries point in the same direction. In that sense, stronger risk management capacity does not simply imply the presence of more instruments, but rather institutional conditions under which support systems may become less dependent on reactive compensation and more capable of supporting systematic adaptation-oriented measures. The results do not directly identify whether low-capacity countries shift toward compensatory instruments; they only indicate that drought conditions are not associated with a stronger climate-aligned support share in these contexts. This may reflect policy inertia, fiscal constraints, or reliance on reactive transfers, but these mechanisms require further empirical testing.
5.5. Financial and Implementation Capacity: From the Existence of Resources to Operational Instruments
The results for financial and implementation capacity suggest that a more climate-aligned support composition under drought depends not simply on the availability of resources, but on the extent to which those resources can be translated into operational instruments. The fact that drought produces no meaningful reorientation at low levels of financial capacity suggests that budgetary presence alone is not sufficient. Once capacity reaches a higher level, however, the relationship between drought and the use of more climate-aligned support instruments becomes stronger.
This finding is consistent with the literature on public finance and climate adaptation. Catalano et al. [66] show that preventive adaptation investments can yield high long-term returns, yet governments often continue to rely on reactive instruments when fiscal and institutional space is limited. Monsod et al. [67] likewise argue that even where fiscal space appears to exist in principle, liquidity constraints, governance failures, and implementation problems can still restrict proactive adaptation investment. Financial capacity should therefore not be understood merely in terms of budget size; what matters is whether those resources can actually be channelled through suitable instruments, programmes, and delivery mechanisms. In this respect, the document-based structure of the financial/implementation capacity measure used in this study is important. What is captured here is not simply spending levels, but the visibility of climate- and environment-oriented instruments in formal policy documents, the maturity of risk instruments, the institutionalisation of resilience-related infrastructure investment, and the presence of multi-year implementation programmes. The findings therefore suggest that financial capacity should be interpreted not simply as “more money,” but as financially backed capacity linked to operational policy instruments. DeBoe [21] and Lankoski and Lankoski [68] similarly show that whether resources generate environmental or adaptation-related outcomes depends to a large extent on instrument design and conditionality. At the same time, the financial/implementation interaction displays greater sensitivity to small-sample bootstrap correction than the governance and risk-management interactions, suggesting that the magnitude of the estimated effect should be interpreted with additional caution, although the overall pattern remains directionally consistent.
5.6. From a Composite Index to Disaggregated Capacity: A Methodological Contribution
A large part of the adaptation capacity literature measures capacity through composite indices and then relates those indices to broader policy outcomes or vulnerability measures [14,15]. Although this approach is useful for comparative analysis, it often leaves unclear which institutional channels connect capacity to particular outcomes. Adger and Vincent [32] and Hinkel [16] stress that there is an important distinction between the explanatory reach of composite indicators and their ability to guide concrete policy design. Chapagain et al. [12] similarly note that the mechanisms linking capacity to actual implementation are still not sufficiently clear.
One of the main contributions of this study is therefore that it retains a total capacity index while also examining governance, risk management, and financial/implementation capacity separately. The findings show that these three dimensions differ not only in institutional substance, but also in how they are associated with support adjustment under drought conditions. Governance capacity follows a more gradual pattern, whereas risk management and financial capacity display more strongly non-linear relationships. This suggests that adaptation capacity is not a single, uniform characteristic, but a multi-component structure made up of different institutional functions. Without this disaggregation, the distinct institutional roles of coordination, risk management, and implementation capacity would remain difficult to identify empirically.
This is also consistent with the distinction, increasingly emphasised in the literature, between general capacity and more specific capacities. Lemos et al. [69] note that there is a difference between broad governance or institutional strength and the kinds of capacities that can actually be mobilised in response to particular threats. A similar point emerges here: the different pillars of capacity do not relate to drought pressure in the same way. In that sense, the findings move the discussion beyond the question of whether capacity is simply high or low, and toward the more policy-relevant question of which component of capacity matters, under which conditions, and through which institutional pathways.
6. Conclusions
This study shows that, in selected OECD policy settings, climate adaptation capacity does not play a constant and automatic role in shifting agricultural support toward climate-aligned instruments; rather, its effect becomes visible primarily under drought conditions and is closely tied to the sustainability orientation of support systems. The findings indicate that drought, on its own, is not a sufficient driver of policy reallocation. What matters is whether countries possess the institutional capacity needed to translate climatic stress into a shift toward more climate-aligned and sustainability-oriented support instruments. In this sense, adaptation capacity operates less as a continuously active driver than as a conditional institutional attribute whose association with support composition becomes consequential under drought conditions. This study does not claim that drought automatically triggers agricultural support reform; rather, it shows that the relationship between drought stress and support composition depends on the institutional capacity context in which drought occurs. This suggests that the climate and sustainability orientation of agricultural support depends not only on the intensity of climatic pressure, but also on the quality of the institutional infrastructure through which that pressure is translated into policy instruments.
A second main finding is that adaptation capacity cannot be treated as a single and homogeneous structure. Governance, risk management, and financial/implementation capacity do not operate in the same way under drought conditions. While governance capacity follows a more gradual pattern, risk management and financial/implementation capacity display more strongly non-linear dynamics. This indicates that policy orientation is shaped not simply by a general increase in capacity, but by the extent to which particular institutional components become operational. In this respect, the study treats adaptation capacity not as an abstract indicator of preparedness, but through concrete institutional dimensions linked to observed policy outcomes. The stronger non-linear patterns identified especially for risk management and financial/implementation capacity suggest that more sustainability-oriented policy adjustment appears more likely at higher levels of institutional maturity, where drought pressure can be translated into preventive and resilience-enhancing forms of support.
From a policy perspective, the most important implication is that making agricultural support more climate-aligned and more sustainability-oriented cannot be achieved simply by increasing public expenditure. What matters is how resources are allocated, through which instruments they are channelled, and within what kind of institutional framework those instruments operate. The findings suggest that, particularly where risk management and implementation capacity remain weak, drought pressure is more likely to reinforce short-term and compensatory transfers than to produce a reallocation toward climate-aligned instruments. For that reason, climate adaptation should be treated not as a secondary objective added onto agricultural support systems after the fact, but as one of the organising principles of support design itself, alongside broader goals of sustainability, resilience, and long-term food system viability. In practical terms, this implies moving away from fragmented and project-based interventions toward a more permanent, system-oriented integration of adaptation into agricultural support architectures.
Against this background, three policy priorities stand out. First, stronger institutional coordination is needed across agriculture, climate, water, and risk management domains. The findings suggest that governance capacity appears to provide an important foundation for the effective functioning of the other capacity dimensions. Second, ex ante risk management infrastructures that reduce excessive reliance on ex post crisis assistance need to be strengthened. Early warning systems, agriculture-specific drought monitoring, agrometeorological services, and pre-defined risk-sharing instruments appear to be important institutional preconditions shaping the direction of support composition. Third, adaptation finance should not remain confined to fragmented, project-based interventions, but should become a more permanent and traceable component of agricultural support systems. Increasing the weight of instruments linked to information systems, resilience-enhancing infrastructure, water efficiency, and environmental conditionality would be important for enabling a gradual shift away from more distortionary forms of support. Together, these priorities suggest that capacity building should be understood not simply as adding more resources, but as creating the institutional, informational, and financial conditions under which drought pressure can be translated into more durable policy adjustment.
The disaggregated capacity findings also carry implications for the sequencing of policy interventions. Since governance capacity appears to condition support adjustment even at earlier stages of institutional development, investments in inter-ministerial coordination mechanisms, climate–agriculture strategy integration, and monitoring and evaluation frameworks may support adaptation-oriented policy adjustment across a wide range of country contexts. Risk-management and financial/implementation capacity, by contrast, appear to become more consequential once a higher level of institutional maturity has already been reached. This suggests that where governance foundations remain limited, strengthening coordination and implementation architecture may be an important precondition for broader adaptation-oriented reform. In settings where governance capacity is already stronger, additional investments in ex ante risk tools, agriculture-specific drought monitoring, and multi-year adaptation finance structures may be more likely to support measurable changes in support composition under drought conditions.
At the same time, the study has several limitations. The sample is restricted to selected OECD policy settings, and the findings should not be assumed to apply automatically to the OECD population as a whole. The adaptation capacity measure, while offering a strong comparative framework, is a document-based and rule-guided composite indicator and is therefore not entirely independent of coding choices. In addition, although the fixed-effects approach provides an important degree of control, it cannot fully eliminate reverse causality or broader endogeneity concerns. The findings should therefore be interpreted less as definitive causal estimates than as theoretically consistent and empirically robust conditional relationships.
Future research could examine whether the conditional pattern identified here holds across different country groups, alternative support classifications, and more detailed micro-level data. In particular, studies tracing how changes in support composition affect farmer behaviour, risk-reduction investment, and resilience outcomes would provide a more direct test of the mechanism proposed here.
Overall, this study suggests that the shift in agricultural support toward more sustainability-oriented and climate-adaptive forms is not an automatic consequence of growing climatic pressure. Rather, it is shaped by the configuration of institutional capacities that become operational, especially under drought conditions. The central issue is not simply how much support is provided, but under what institutional conditions and through which instruments that support can be made more climate-aligned, more resilient, and ultimately more sustainable.
Supplementary Materials
The following supporting information can be downloaded at: https://www.mdpi.com/article/10.3390/su18115378/s1, Table S1: Mapping of OECD support categories used in the construction of the dependent variable, based on the OECD Producer and Consumer Support Estimates Database [6]; Table S2: ACI Coding Inventory. Table S2 reports the documentary evidence, break years, and scoring rationales used for ACI indicator construction, including country-level governmental policy documents, national adaptation strategies, legislation, and institutional frameworks.
Funding
This research received no external funding.
Data Availability Statement
The OECD APME data used in this study are publicly available through the OECD database. SPEI-12 data were obtained from the Global SPEI Database. The coding inventory used to construct the Adaptation Capacity Index is provided in Supplementary Table S2.
Acknowledgments
During the preparation of this manuscript, the author used Claude (Anthropic, https://claude.ai, accessed 2025–2026), Elicit (Elicit Inc., https://elicit.com, accessed 2025–2026), and Consensus (Consensus NLP Inc., https://consensus.app, accessed 2025–2026) for literature search support, language assistance, and limited formatting support. All AI-assisted output was reviewed and edited by the author, who takes full responsibility for the scientific content, analytical decisions, and final wording of the manuscript.
Conflicts of Interest
The author declares no conflicts of interest.
Abbreviations
The following abbreviations are used in this manuscript:
| ACI | Adaptation Capacity Index |
| CAP | Common Agricultural Policy |
| EU | European Union |
| GDP | Gross Domestic Product |
| GSSE | General Services Support Estimate |
| ND-GAIN | Notre Dame Global Adaptation Initiative |
| OECD | Organisation for Economic Co-operation and Development |
| PPP | Purchasing Power Parity |
| PSE | Producer Support Estimate |
| SPEI | Standardized Precipitation-Evapotranspiration Index |
| TSE | Total Support Estimate |
Appendix A
The following robustness checks are reported in Table A1, Table A2, Table A3, Table A4, Table A5 and Table A6. All models include country and year fixed effects. Standard errors are clustered at the country (policy-unit) level. Significance levels: *** p < 0.01; ** p < 0.05; * p < 0.10.
Table A1.
Lagged SPEI-12 Robustness Specifications.
Table A2.
Wild Cluster Bootstrap Inference for Main Interaction Terms.
Table A3.
Alternative ACI Weighting Schemes.
Table A4.
Leave-One-Pillar-Out Sensitivity Analysis.
Table A5.
Robustness Check: European Union Excluded.
Table A6.
Alternative Definitions of Climate-Aligned Support Share.
References
- IPCC. Climate Change 2022: Impacts, Adaptation and Vulnerability. Contribution of Working Group II to the Sixth Assessment Report of the Intergovernmental Panel on Climate Change; Cambridge University Press: Cambridge, UK, 2022; Available online: https://www.ipcc.ch/report/ar6/wg2/ (accessed on 1 March 2025).
- FAO. The State of Food and Agriculture 2023: Revealing the True Cost of Food to Transform Agrifood Systems; Food and Agriculture Organization of the United Nations: Rome, Italy, 2023. [Google Scholar] [CrossRef] [Scilit]
- Wheeler, T.; von Braun, J. Climate change impacts on global food security. Science 2013, 341, 508–513. [Google Scholar] [CrossRef] [Scilit]
- UNFCCC. Paris Agreement; United Nations Framework Convention on Climate Change: New York, NY, USA, 2015; Available online: https://unfccc.int/sites/default/files/english_paris_agreement.pdf (accessed on 1 March 2025).
- OECD. Agricultural Policy Monitoring and Evaluation 2023: Adapting Agriculture to Climate Change; OECD Publishing: Paris, France, 2023. [Google Scholar] [CrossRef] [Scilit]
- OECD. Producer and Consumer Support Estimates Database; OECD: Paris, France, 2024; Available online: https://data-explorer.oecd.org/ (accessed on 1 April 2025).
- Grohmann, P.; Feindt, P.H. The importance of calibration in policy mixes: Environmental policy integration in the implementation of the European Union’s Common Agricultural Policy in Germany (2014–2022). Environ. Policy Gov. 2023, 34, 16–30. [Google Scholar] [CrossRef] [Scilit]
- Lankoski, J.; Thiem, A. Linkages between agricultural policies, productivity and environmental sustainability. Ecol. Econ. 2020, 178, 106809. [Google Scholar] [CrossRef] [Scilit]
- Smit, B.; Wandel, J. Adaptation, adaptive capacity and vulnerability. Glob. Environ. Change 2006, 16, 282–292. [Google Scholar] [CrossRef] [Scilit]
- Adger, W.N. Vulnerability. Glob. Environ. Change 2006, 16, 268–281. [Google Scholar] [CrossRef] [Scilit]
- Engle, N.L. Adaptive capacity and its assessment. Glob. Environ. Change 2011, 21, 647–656. [Google Scholar] [CrossRef] [Scilit]
- Chapagain, P.S.; Banskota, T.R.; Shrestha, S.; Khanal, N.R.; Yili, Z.; Yan, J.; Liu, L.; Paudel, B.; Rai, S.C.; Islam, M.N.; et al. Studies on adaptive capacity to climate change: A synthesis of changing concepts, dimensions, and indicators. Humanit. Soc. Sci. Commun. 2025, 12, 331. [Google Scholar] [CrossRef] [Scilit]
- Schulze, K.; Schoenefeld, J.J. Measuring climate change adaptation policy output: Toward a two-dimensional approach. Rev. Policy Res. 2023, 40, 1058–1092. [Google Scholar] [CrossRef] [Scilit]
- Brooks, N.; Adger, W.N.; Kelly, P.M. The determinants of vulnerability and adaptive capacity at the national level and the implications for adaptation. Glob. Environ. Change 2005, 15, 151–163. [Google Scholar] [CrossRef] [Scilit]
- Yohe, G.; Tol, R.S.J. Indicators for social and economic coping capacity—Moving toward a working definition of adaptive capacity. Glob. Environ. Change 2002, 12, 25–40. [Google Scholar] [CrossRef] [Scilit]
- Hinkel, J. ‘Indicators of vulnerability and adaptive capacity’: Towards a clarification of the science–policy interface. Glob. Environ. Change 2011, 21, 198–208. [Google Scholar] [CrossRef] [Scilit]
- Binswanger, H.P. Explaining agricultural and agrarian policies in developing countries. J. Econ. Lit. 1997, 35, 1958–2005. [Google Scholar]
- Vos, R.; Martin, W.; Resnick, D. The political economy of reforming agricultural support policies. In The Political Economy of Food System Transformation; Resnick, D., Swinnen, J., Eds.; Oxford University Press: Oxford, UK, 2023. [Google Scholar] [CrossRef] [Scilit]
- Hurlbert, M.A.; Gupta, J. An institutional analysis method for identifying policy instruments facilitating the adaptive governance of drought. Environ. Sci. Policy 2019, 93, 221–231. [Google Scholar] [CrossRef] [Scilit]
- Berrang-Ford, L.; Ford, J.D.; Lesnikowski, A.; Poutiainen, C.; Barrera, M.; Heymann, S.J. What drives national adaptation? A global assessment. Clim. Change 2014, 124, 441–450. [Google Scholar] [CrossRef] [Scilit]
- DeBoe, G. Impacts of Agricultural Policies on Productivity and Sustainability Performance in Agriculture: A Literature Review; OECD Food, Agriculture and Fisheries Papers, No. 141; OECD Publishing: Paris, France, 2020. [Google Scholar] [CrossRef]
- Henderson, B.; Lankoski, J. Evaluating the Environmental Impact of Agricultural Policies; OECD Food, Agriculture and Fisheries Papers, No. 130; OECD Publishing: Paris, France, 2019. [Google Scholar] [CrossRef]
- Siders, A.R. Adaptive capacity to climate change: A synthesis of concepts, methods, and findings in a fragmented field. WIREs Clim. Change 2019, 10, e573. [Google Scholar] [CrossRef] [Scilit]
- Laborde, D.; Mamun, A.; Martin, W.; Piñeiro, V.; Vos, R. Agricultural subsidies and global greenhouse gas emissions. Nat. Commun. 2021, 12, 2601. [Google Scholar] [CrossRef] [Scilit]
- Heyl, K.; Doring, T.; Garske, B.; Stubenrauch, J.; Ekardt, F. The common agricultural policy beyond 2020: A critical review in light of global environmental goals. Rev. Eur. Comp. Int. Environ. Law 2021, 30, 10–21. [Google Scholar] [CrossRef] [Scilit]
- Springmann, M.; Freund, F. Options for reforming agricultural subsidies from health, climate, and economic perspectives. Nat. Commun. 2022, 13, 82. [Google Scholar] [CrossRef] [Scilit]
- Jansson, T.; Nordin, I.; Wilhelmson, F.; Manevska-Tasevska, G.; Weiss, F.; Witzke, P. Coupled agricultural subsidies in the EU undermine climate efforts. Appl. Econ. Perspect. Policy 2021, 43, 1503–1519. [Google Scholar] [CrossRef] [Scilit]
- Goodwin, D.; Holman, I.; Pardthaisong, L.; Visessri, S.; Ekkawatpanit, C.; Hess, T. What is the evidence linking financial assistance for drought-affected agriculture and resilience in tropical Asia? A systematic review. Reg. Environ. Change 2022, 22, 12. [Google Scholar] [CrossRef] [Scilit]
- Hrozencik, R.A.; Perez-Quesada, G. Federal drought assistance and adaptation decisions in the U.S. livestock sector. Agric. Econ. 2025, 56, 924–939. [Google Scholar] [CrossRef] [Scilit]
- IPCC. Climate Change 2014: Impacts, Adaptation, and Vulnerability. Part A: Global and Sectoral Aspects; Cambridge University Press: Cambridge, UK, 2014. [Google Scholar]
- Bartelet, H.A.; Barnes, M.L.; Bakti, L.A.A.; Cumming, G.S. Testing the reliability of adaptive capacity as a proxy for adaptive and transformative responses to climate change. Glob. Environ. Change 2023, 81, 102700. [Google Scholar] [CrossRef] [Scilit]
- Adger, W.N.; Vincent, K. Uncertainty in adaptive capacity. Comptes Rendus Geosci. 2005, 337, 399–410. [Google Scholar] [CrossRef] [Scilit]
- Schubert, A.; von Streit, A.; Garschagen, M. Unravelling the capacity-action gap in flood risk adaptation. Nat. Hazards Earth Syst. Sci. 2025, 25, 1621–1653. [Google Scholar] [CrossRef] [Scilit]
- Eakin, H.; Lemos, M.C.; Nelson, D.R. Differentiating capacities as a means to sustainable climate change adaptation. Glob. Environ. Change 2014, 27, 1–8. [Google Scholar] [CrossRef] [Scilit]
- Sutherland, L.-A.; Burton, R.J.F.; Ingram, J.; Blackstock, K.; Slee, B.; Gotts, N. Triggering change: Towards a conceptualisation of major change processes in farm decision-making. J. Environ. Manag. 2012, 104, 142–151. [Google Scholar] [CrossRef] [Scilit]
- Kabir, M.; Ritter, T.; Dreyer, B.; Weltzien, E. Climate change mitigation policies in agriculture: An overview of sociopolitical barriers. WIREs Clim. Change 2024, 15, e916. [Google Scholar] [CrossRef] [Scilit]
- Belmin, R.; Paulin, M.; Malézieux, E. Adapting agriculture to climate change: Which pathways behind policy initiatives? Agron. Sustain. Dev. 2023, 43, 59. [Google Scholar] [CrossRef] [Scilit]
- Hurlbert, M.A.; Gupta, J. Adaptive governance, uncertainty, and risk: Policy framing and responses to climate change, drought, and flood. Risk Anal. 2016, 36, 339–356. [Google Scholar] [CrossRef] [Scilit] [PubMed]
- Vanschoenwinkel, J.; Moretti, M.; Van Passel, S. The effect of policy leveraging climate change adaptive capacity in agriculture. Eur. Rev. Agric. Econ. 2020, 47, 138–156. [Google Scholar] [CrossRef] [Scilit]
- Birthal, P.S.; Hazrana, J. Crop diversification and resilience of agriculture to climatic shocks: Evidence from India. Agric. Syst. 2019, 173, 345–354. [Google Scholar] [CrossRef] [Scilit]
- Williges, K.; Mechler, R.; Bowyer, P.; Balkovic, J. Towards an assessment of adaptive capacity of the European agricultural sector to droughts. Clim. Serv. 2017, 7, 47–63. [Google Scholar] [CrossRef] [Scilit]
- Jaisridhar, P.; Nirosha, R.; Jasimudeen, S.; Senthilkumar, M.; Ponsneka, I. Institutional dynamics in climate change adaptation—A bibliometric analysis. Front. Environ. Sci. 2025, 13, 1598908. [Google Scholar] [CrossRef] [Scilit]
- Miao, R. Climate, insurance and innovation: The case of drought and innovations in drought-tolerant traits in US agriculture. Eur. Rev. Agric. Econ. 2020, 47, 1826–1860. [Google Scholar] [CrossRef] [Scilit]
- Choquette-Levy, N.; Wildemeersch, M.; Santos, F.; Levin, S.; Oppenheimer, M.; Weber, E. Pro-social preferences improve climate risk management in subsistence farming communities. Nat. Sustain. 2024, 7, 282–293. [Google Scholar] [CrossRef] [Scilit]
- Khan, N.A.; Gao, Q.; Abid, M. Public institutions’ capacities regarding climate change adaptation and risk management support in agriculture: The case of Punjab Province, Pakistan. Sci. Rep. 2020, 10, 14111. [Google Scholar] [CrossRef] [Scilit]
- Varangis, P.; Larson, D.; Anderson, J.R. Agricultural Markets and Risks: Management of the Latter, Not the Former; Policy Research Working Paper No. 2793; World Bank: Washington, DC, USA, 2002. [Google Scholar] [CrossRef] [Scilit]
- Vicente-Serrano, S.M.; Beguéría, S.; López-Moreno, J.I. A multiscalar drought index sensitive to global warming: The Standardized Precipitation Evapotranspiration Index. J. Clim. 2010, 23, 1696–1718. [Google Scholar] [CrossRef] [Scilit]
- Beguéría, S.; Vicente-Serrano, S.M.; Reig, F.; Latorre, B. Standardized precipitation evapotranspiration index (SPEI) revisited: Parameter fitting, evapotranspiration models, tools, datasets and related applications. Int. J. Climatol. 2023, 34, 3001–3023. [Google Scholar] [CrossRef] [Scilit]
- Cameron, A.C.; Miller, D.L. A practitioner’s guide to cluster-robust inference. J. Hum. Resour. 2015, 50, 317–372. [Google Scholar] [CrossRef] [Scilit]
- Green, K.; Selgrath, J.; Satterfield, T.; Grimm, V.; Koldewey, H.; Schoeman, D.; Hofmann, G.; Rastrick, S.; Wilson, M.; Bhatt, A.; et al. How adaptive capacity shapes the Adapt, React, Cope response to climate impacts: Insights from small-scale fisheries. Clim. Change 2021, 164, 15. [Google Scholar] [CrossRef] [Scilit]
- Leiter, T. Do governments track the implementation of national climate change adaptation plans? An evidence-based global stocktake of monitoring and evaluation systems. Environ. Sci. Policy 2021, 125, 112–122. [Google Scholar] [CrossRef] [Scilit]
- Roelfsema, M.; Van Soest, H.; Harmsen, M.; Van Vuuren, D.; Bertram, C.; Elzen, M.; Höhne, N.; Iacobută, G.; Krey, V.; Kriegler, E.; et al. Taking stock of national climate policies to evaluate implementation of the Paris Agreement. Nat. Commun. 2020, 11, 2096. [Google Scholar] [CrossRef] [Scilit]
- Andrijevic, M.; Crespo Cuaresma, J.; Muttarak, R.; Schleussner, C.F. Governance in socioeconomic pathways and its role for future adaptive capacity. Nat. Sustain. 2019, 3, 35–41. [Google Scholar] [CrossRef] [Scilit]
- Gruère, G.; Ashley, C.; Cadilhon, J. Reforming Water Policies in Agriculture: Lessons from Six OECD Countries; OECD Food, Agriculture and Fisheries Papers, No. 120; OECD Publishing: Paris, France, 2018. [Google Scholar] [CrossRef]
- Tambet, H.; Stopnitzky, Y. Climate adaptation and conservation agriculture among Peruvian farmers. Am. J. Agric. Econ. 2021, 103, 900–922. [Google Scholar] [CrossRef] [Scilit]
- Siebenhüner, B.; Rodela, R.; Ecker, F. Lock-ins in climate adaptation governance. In Adaptiveness: Changing Earth System Governance; Cambridge University Press: Cambridge, UK, 2021. [Google Scholar]
- Albizua, A.; Corbera, E.; Pascual, U. Farmers’ vulnerability to global change in Navarre, Spain: Large-scale irrigation as maladaptation. Reg. Environ. Change 2019, 19, 1977–1990. [Google Scholar] [CrossRef] [Scilit]
- Mullin, M.; Rubado, M.E. Local response to water crisis: Explaining variation in usage restrictions during a Texas drought. Urban Aff. Rev. 2017, 53, 560–587. [Google Scholar] [CrossRef] [Scilit]
- Bednar, D.; Henstra, D.; McBean, G. The governance of climate change adaptation: Are networks to blame for the implementation deficit? J. Environ. Policy Plan. 2019, 21, 702–717. [Google Scholar] [CrossRef] [Scilit]
- Schmidt, M.N. Late bloomer? Agricultural policy integration and coordination patterns in climate policies. J. Eur. Public Policy 2020, 27, 893–911. [Google Scholar] [CrossRef] [Scilit]
- England, M.; Dougill, A.; Stringer, L.; Vincent, K.; Pardoe, J.; Kalaba, F.; Mkwambisi, D.; Namaganda, E.; Afionis, S. Climate change adaptation and cross-sectoral policy coherence in southern Africa. Reg. Environ. Change 2018, 18, 2059–2071. [Google Scholar] [CrossRef] [Scilit]
- Goodwin, B.K.; Vado, L.A. Public responses to agricultural disasters: Rethinking the role of government. Can. J. Agric. Econ. 2007, 55, 399–417. [Google Scholar] [CrossRef] [Scilit]
- Glauber, J.; Baldwin, K. Design Principles for Agricultural Risk Management Policies; OECD Food, Agriculture and Fisheries Papers, No. 157; OECD Publishing: Paris, France, 2021; Volume No. 157. [Google Scholar] [CrossRef]
- Cobourn, K. Climate Change Adaptation Policies to Foster Resilience in Agriculture: Analysis and Stocktake Based on UNFCCC Reporting Documents; OECD Food, Agriculture and Fisheries Papers, No. 202; OECD Publishing: Paris, France, 2023; Volume No. 202. [Google Scholar] [CrossRef] [Scilit]
- Popp, T. Explaining policy convergence and divergence through policy paradigm shifts: A comparative analysis of agricultural risk governance in OECD countries. J. Comp. Policy Anal. Res. Pract. 2019, 23, 310–327. [Google Scholar] [CrossRef] [Scilit]
- Catalano, M.; Forni, L.; Pezzolla, E. Climate-change adaptation: The role of fiscal policy. Resour. Energy Econ. 2020, 59, 101111. [Google Scholar] [CrossRef] [Scilit]
- Monsod, T.C.; Majadillas, M.A.; Gochoco-Bautista, M.S. Unlocking the flow of finance for climate adaptation: Estimates of fiscal space in climate-vulnerable developing countries. Clim. Policy 2023, 23, 735–746. [Google Scholar] [CrossRef] [Scilit]
- Lankoski, J.; Lankoski, L. Environmental sustainability in agriculture: Identification of bottlenecks. Ecol. Econ. 2023, 204, 107659. [Google Scholar] [CrossRef] [Scilit]
- Lemos, M.C.; Kirchhoff, C.J.; Ramprasad, V. Narrowing the climate information usability gap. Nat. Clim. Change 2013, 2, 789–794. [Google Scholar] [CrossRef] [Scilit]
- Roodman, D.; Nielsen, M.Ø.; MacKinnon, J.G.; Webb, M.D. Fast and wild: Bootstrap inference in Stata using boottest. Stata J. 2019, 19, 4–60. [Google Scholar] [CrossRef] [Scilit]
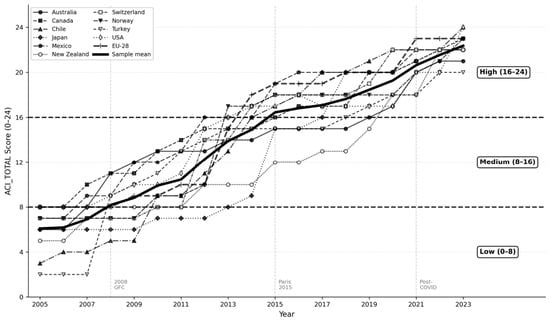
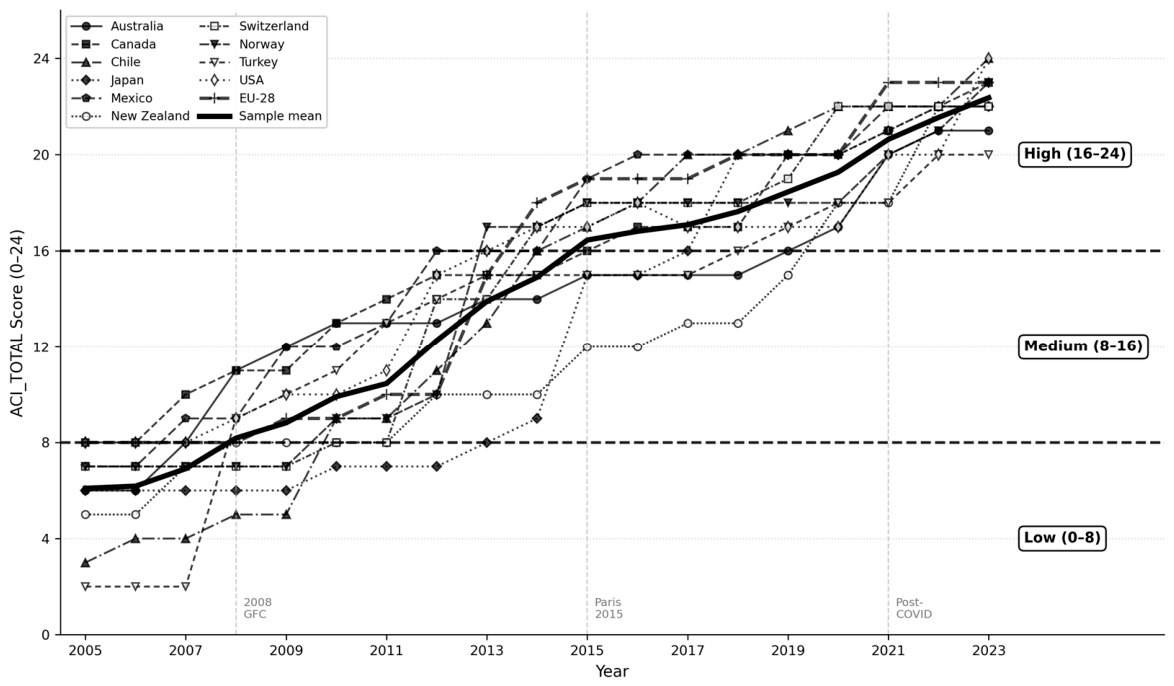
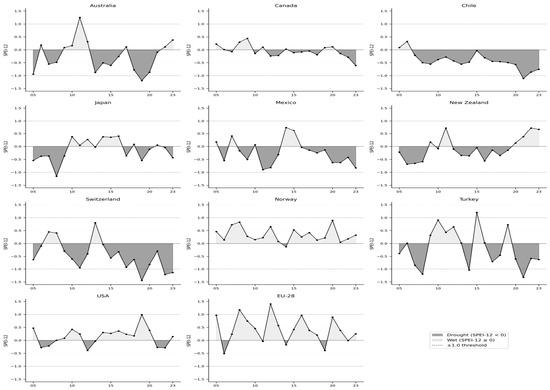
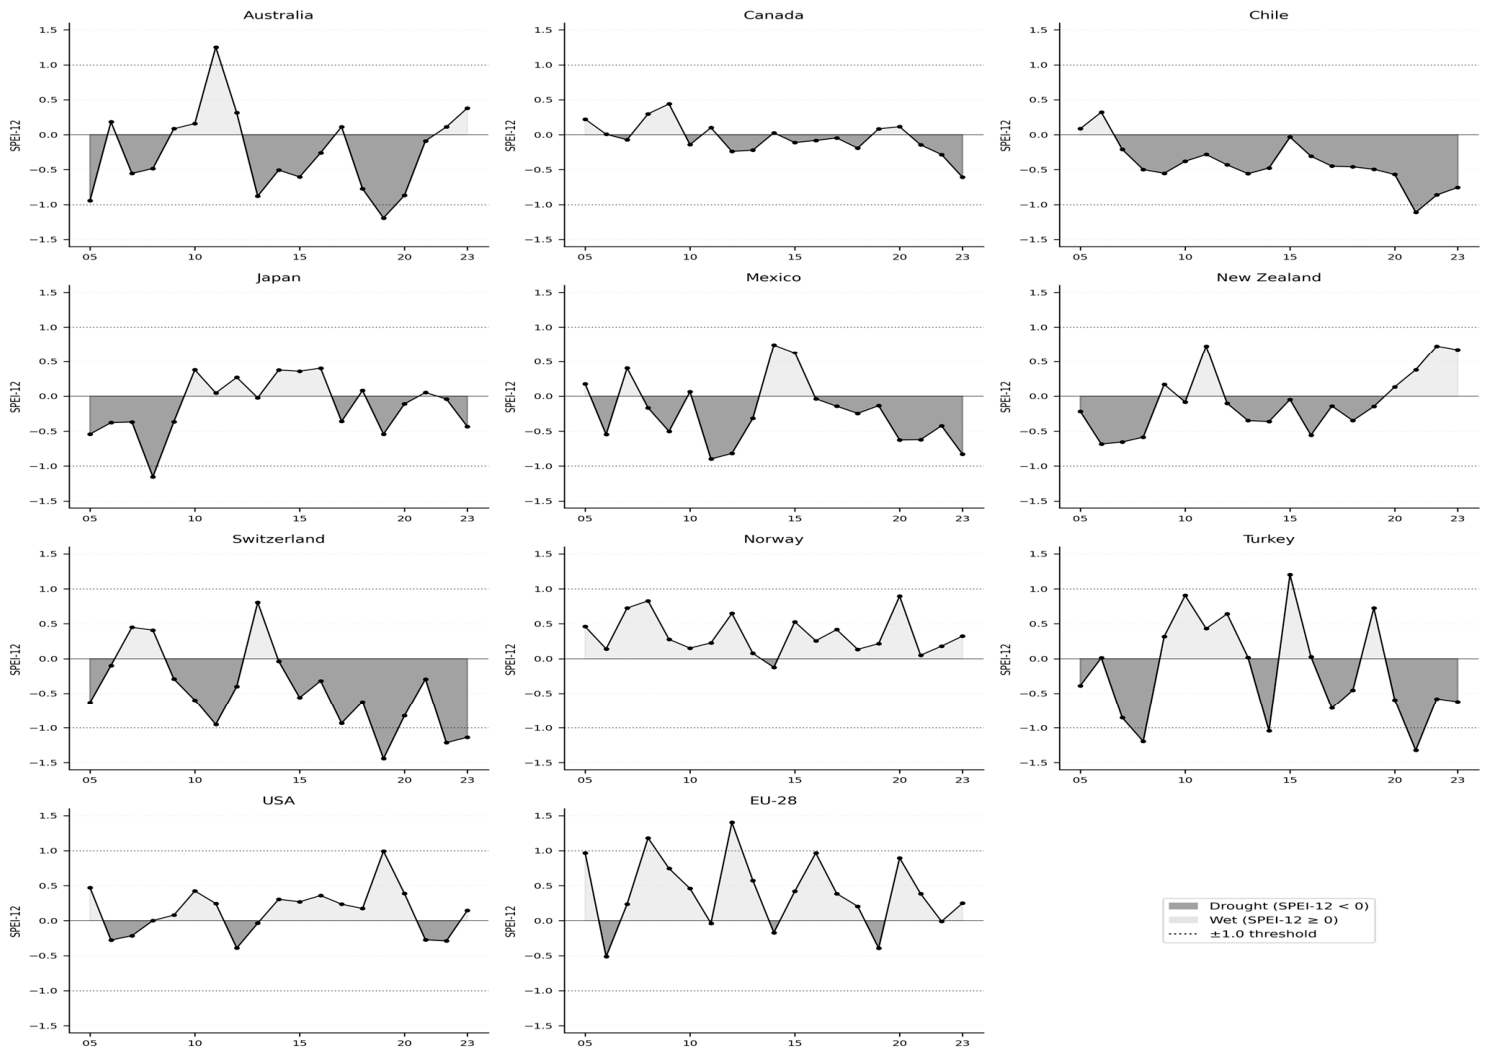
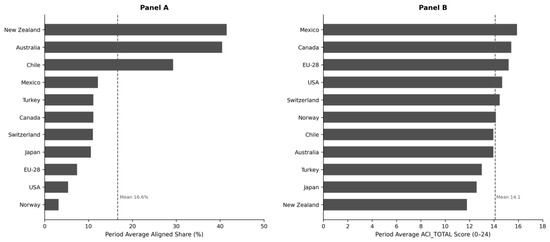
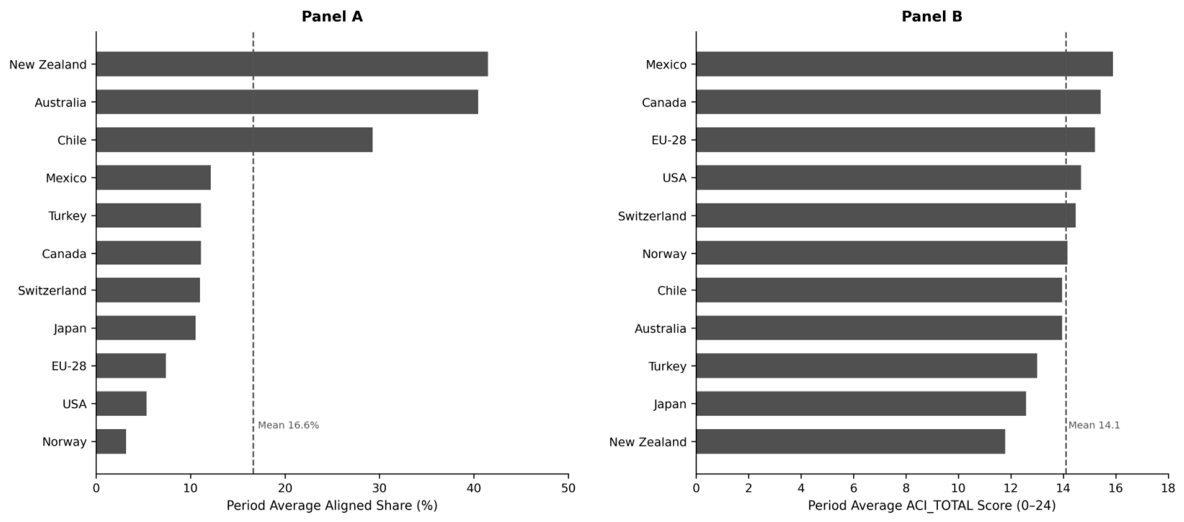
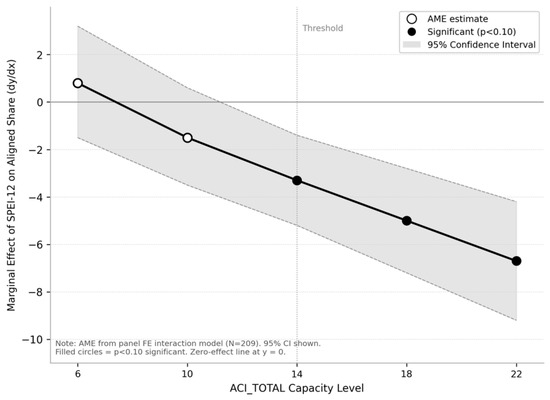
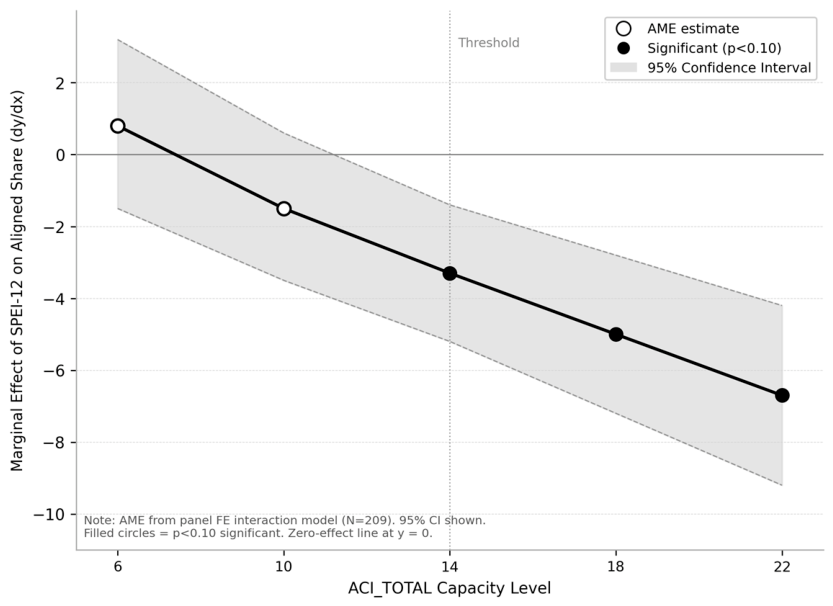
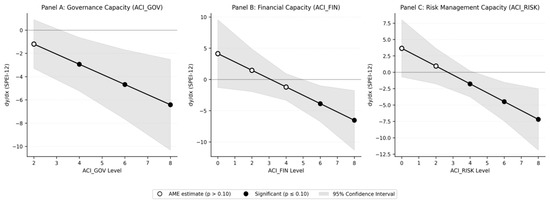
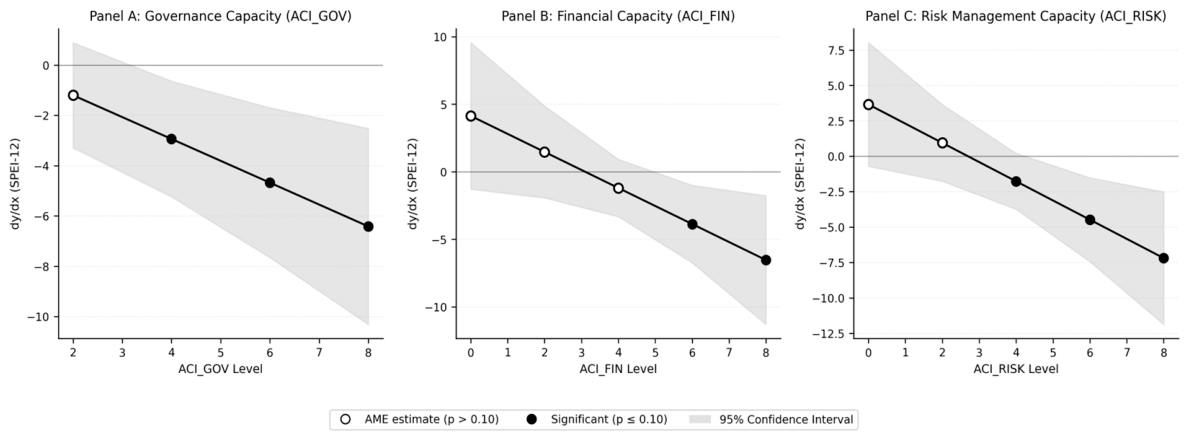
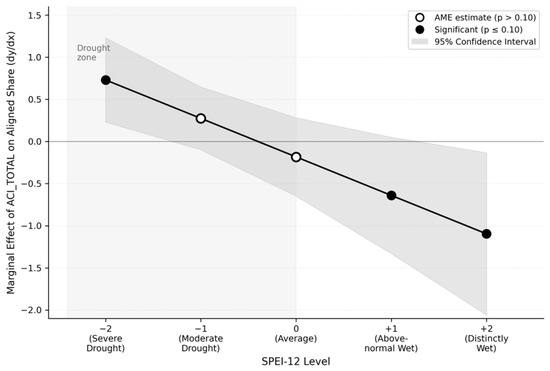
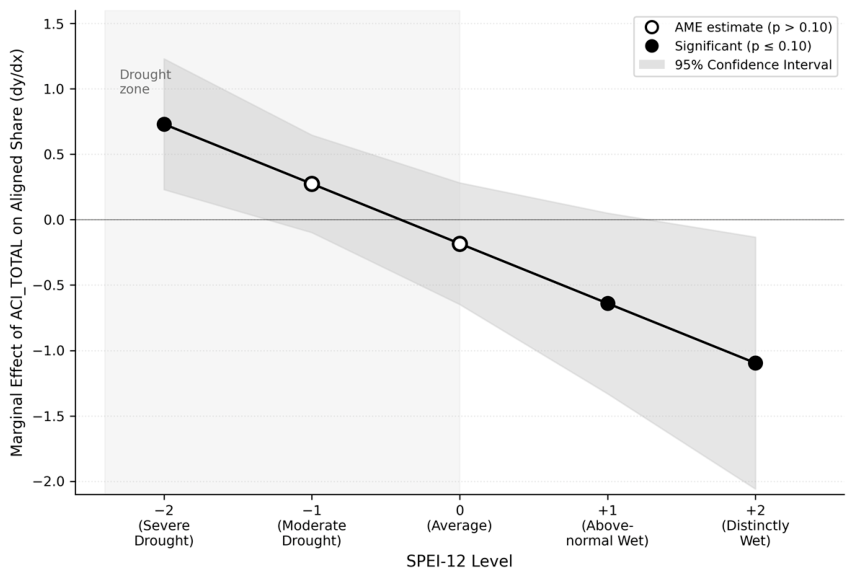

Disclaimer/Publisher’s Note: The statements, opinions and data contained in all publications are solely those of the individual author(s) and contributor(s) and not of MDPI and/or the editor(s). MDPI and/or the editor(s) disclaim responsibility for any injury to people or property resulting from any ideas, methods, instructions or products referred to in the content. |
© 2026 by the author. Licensee MDPI, Basel, Switzerland. This article is an open access article distributed under the terms and conditions of the Creative Commons Attribution (CC BY) license.