Does Environmental Governance Specialization Reduce Air Pollution? Evidence from a Staggered Difference-in-Differences Approach in China

Abstract
1. Introduction
2. Literature Review
2.1. Institutional Design for Environmental Governance
2.2. Environmental Policy and Air Pollution in China
2.3. Methodological Advances in Staggered DID
3. Materials and Methods
3.1. Data
3.1.1. Outcome Variable: Satellite-Derived PM2.5
3.1.2. Treatment Variable: Environmental Governance Specialization
3.1.3. Control Variables
- Urbanization rate (): Province-level urbanization rate (%).
- Industrial structure (): Ratio of secondary to tertiary industry output, capturing the relative importance of pollution-intensive industries.
- Government intervention (): Ratio of government expenditure to GDP, measuring the degree of government involvement in the economy.
- Environmental regulation intensity (): A composite index capturing the stringency of provincial environmental regulation.
- Economic development (): Province-level per capita GDP (in 10,000 yuan).
- Additional controls (in the full specification): Service sector share (), government fiscal capacity (), financial development (), carbon emissions intensity (), and solid waste disposal ().
3.1.4. Sample Construction
3.2. Identification Strategy
3.2.1. Why Not TWFE?
3.2.2. Callaway–Sant’Anna Estimator
- Control group: Never-treated cities (167 cities that had not established specialized environmental divisions by 2023 in the harmonized sample).
- Estimation method: Doubly robust (DR) with an intercept-only specification [24]. We do not include time-varying covariates in the propensity score or outcome regression models within the CS-DID framework, because city and year fixed effects already absorb level differences and common temporal shocks. This implies that identification relies on an unconditional parallel trends assumption, meaning that absent treatment, PM2.5 trends would have been parallel between treatment and control groups without conditioning on observables. The event study analysis (Section 4) provides direct evidence supporting this assumption. As a robustness check, we augment the CS-DID estimator with city-level baseline covariates through the outcome regression formula (reported in Section 4.5); the ATT attenuates only modestly and remains significant, confirming that the unconditional specification is not masking omitted variable bias. The TWFE specifications in Table 2 include province-level controls to maintain comparability with prior studies, not because a conditional parallel trends assumption is required for identification.
- Base period: Universal, which uses all pre-treatment periods for each cohort.
- Overall ATT: A weighted average across all group-time cells, representing the average treatment effect across all treated city-years.
- Dynamic ATT: Aggregated by event time (years relative to treatment), producing an event study that reveals the temporal pattern of treatment effects and tests for pre-trends.
- Group-specific ATT: Aggregated by treatment cohort, revealing heterogeneity across cohorts.
3.2.3. Goodman–Bacon Decomposition
4. Results
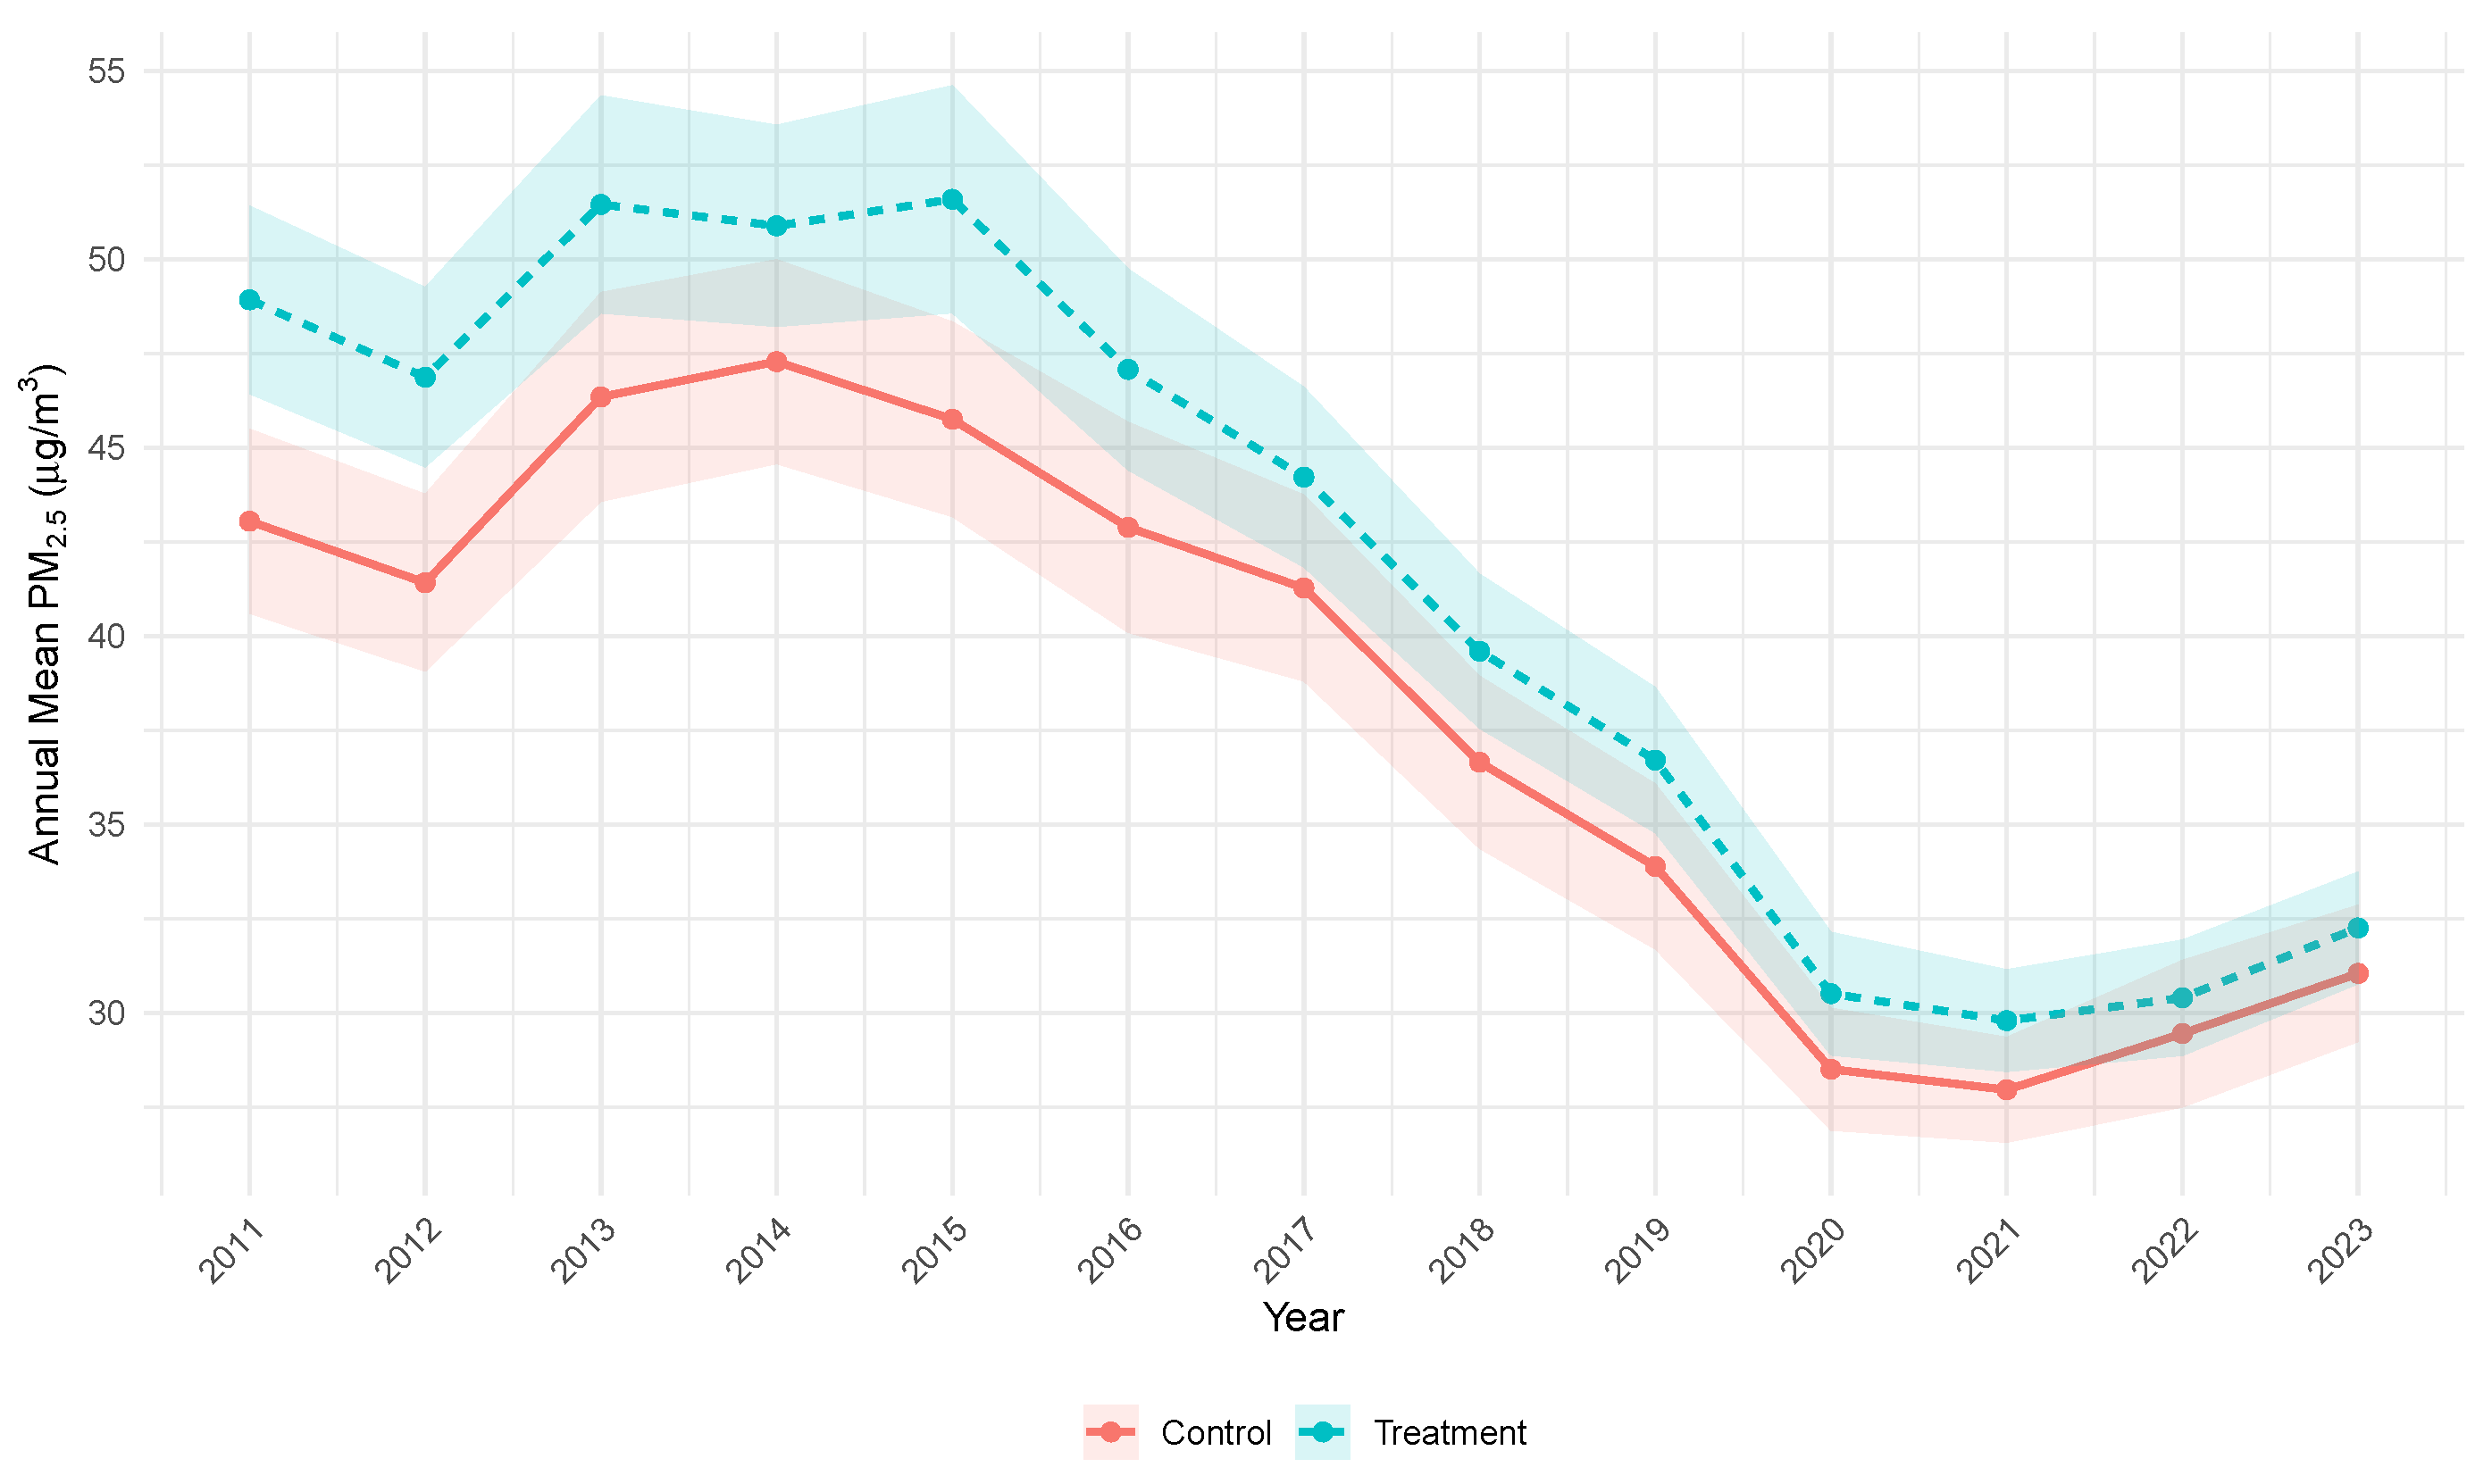
4.1. PM2.5 Trends: Treatment Versus Control Cities
4.2. TWFE Baseline Results
4.3. Callaway–Sant’Anna Main Results
4.4. Alternative Estimators
4.5. City-Level Control Robustness
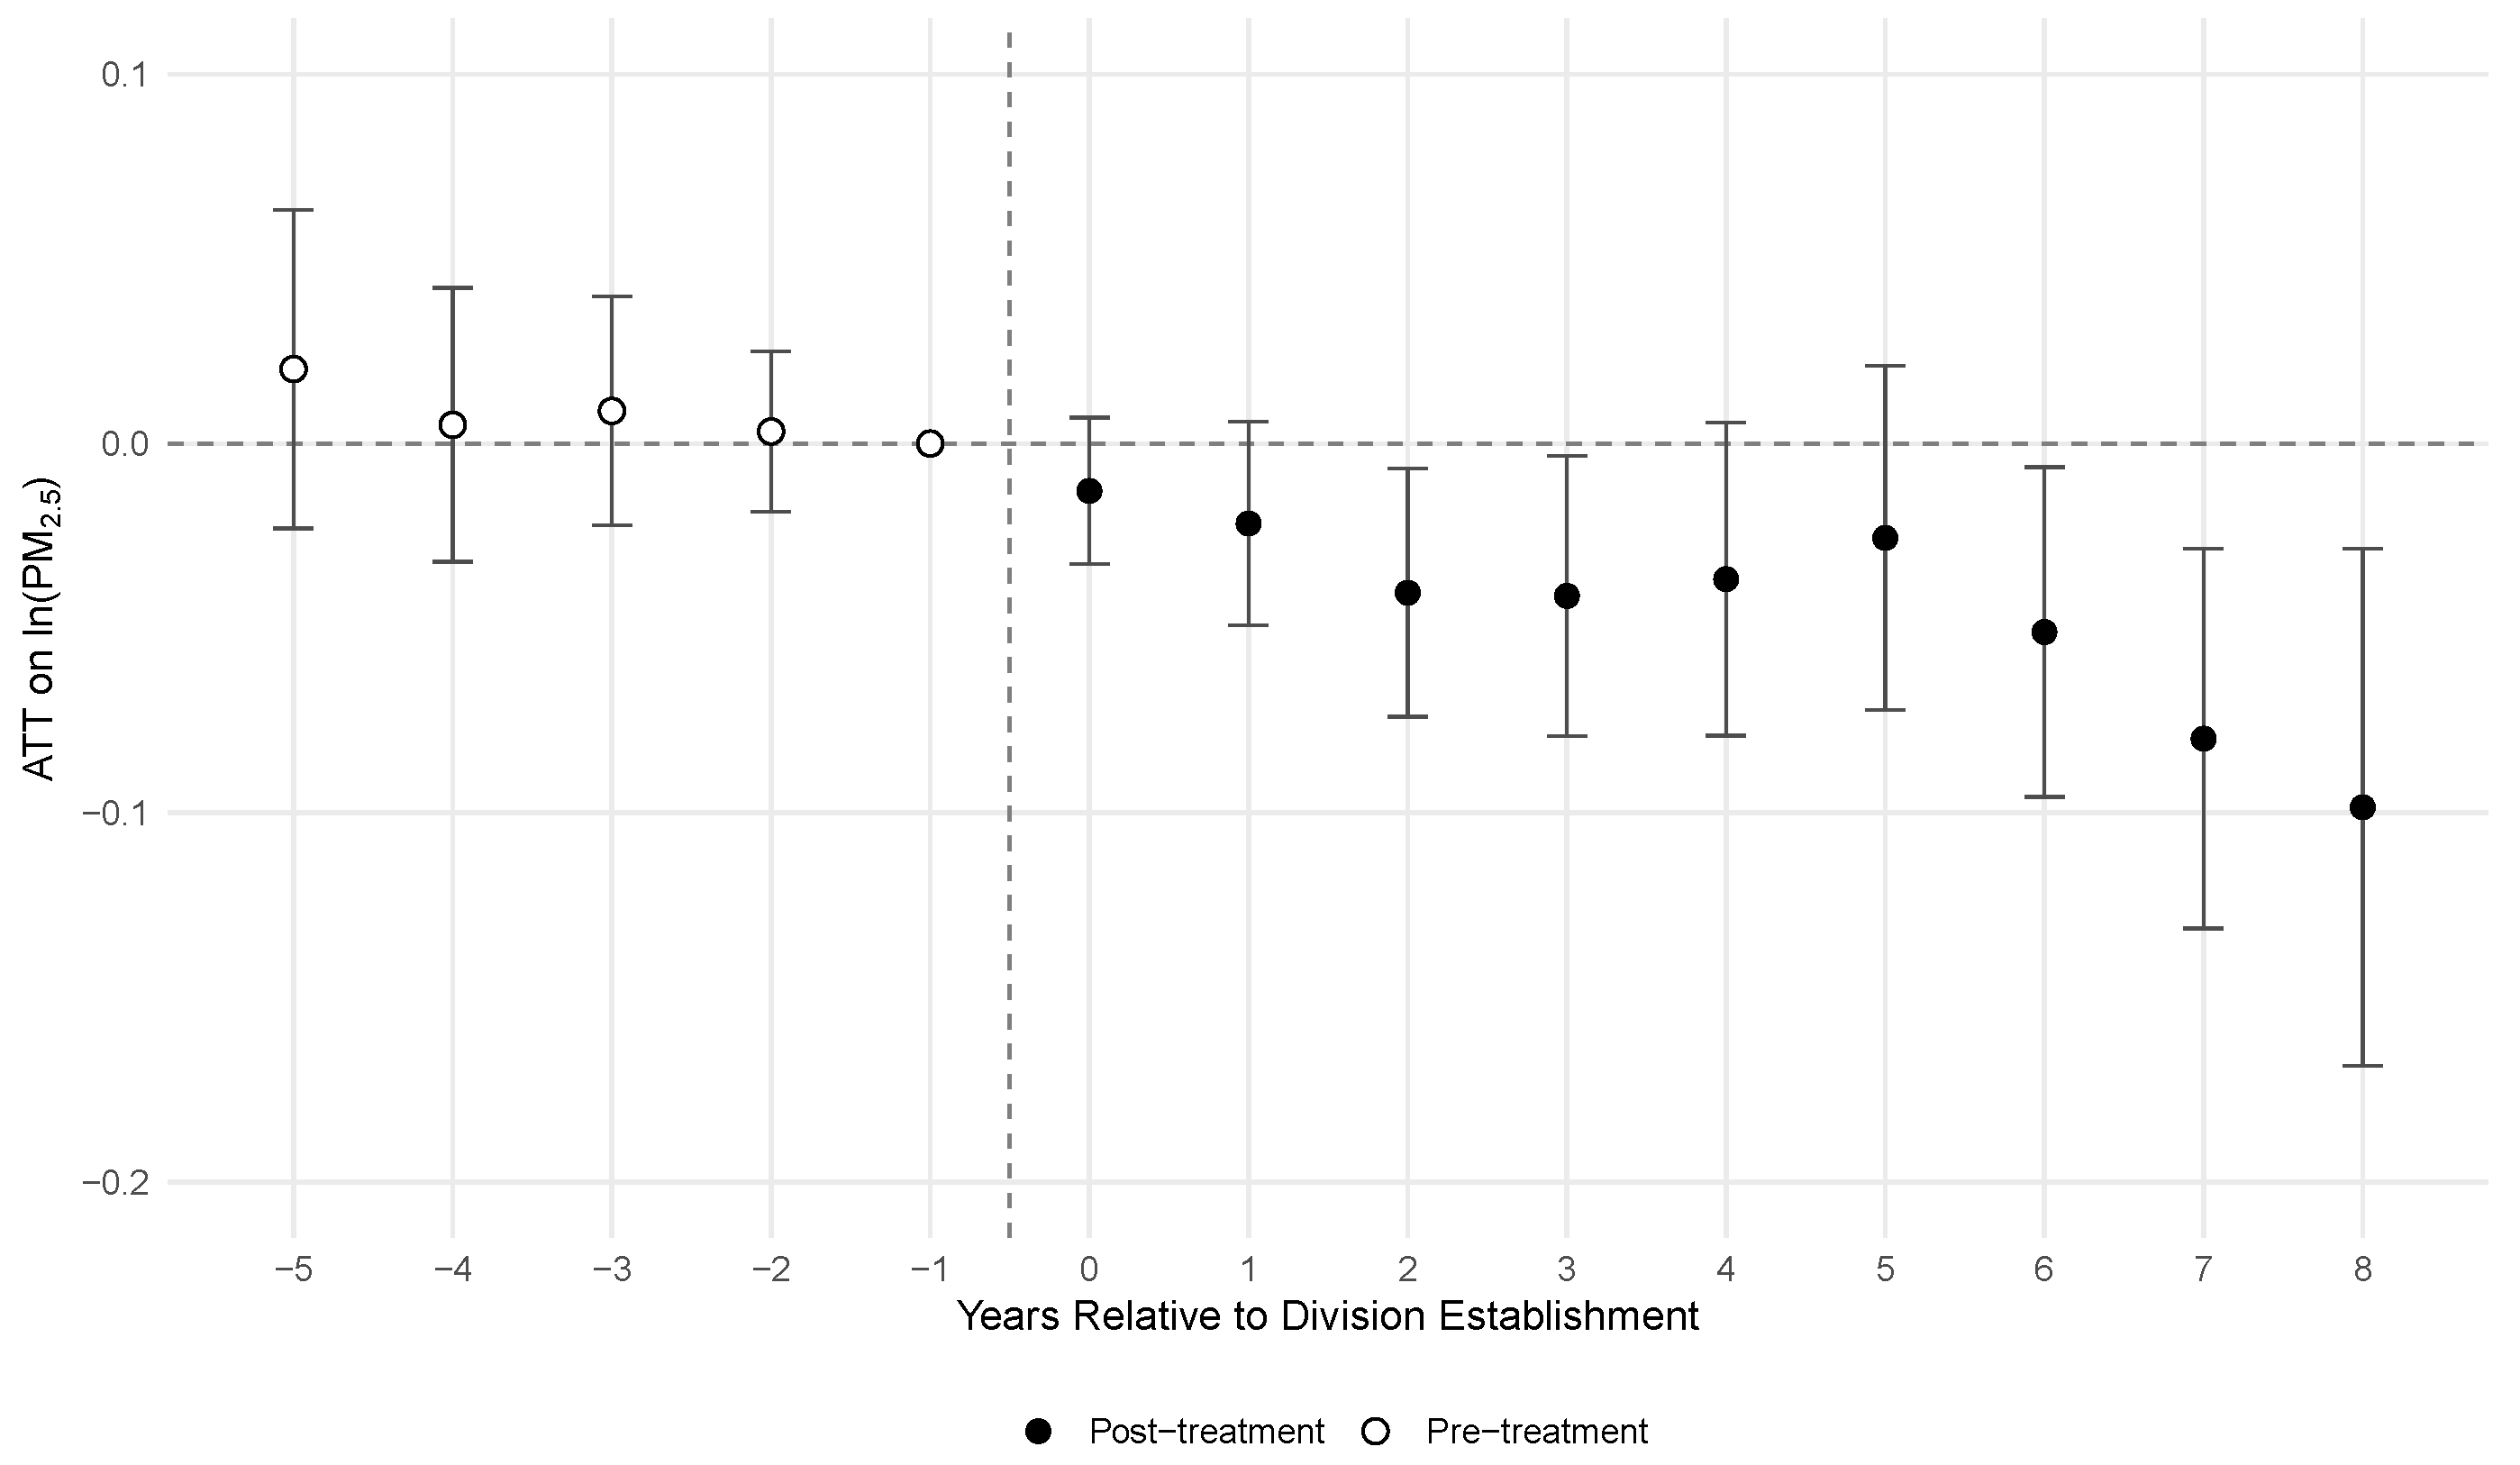
4.6. Event Study Analysis
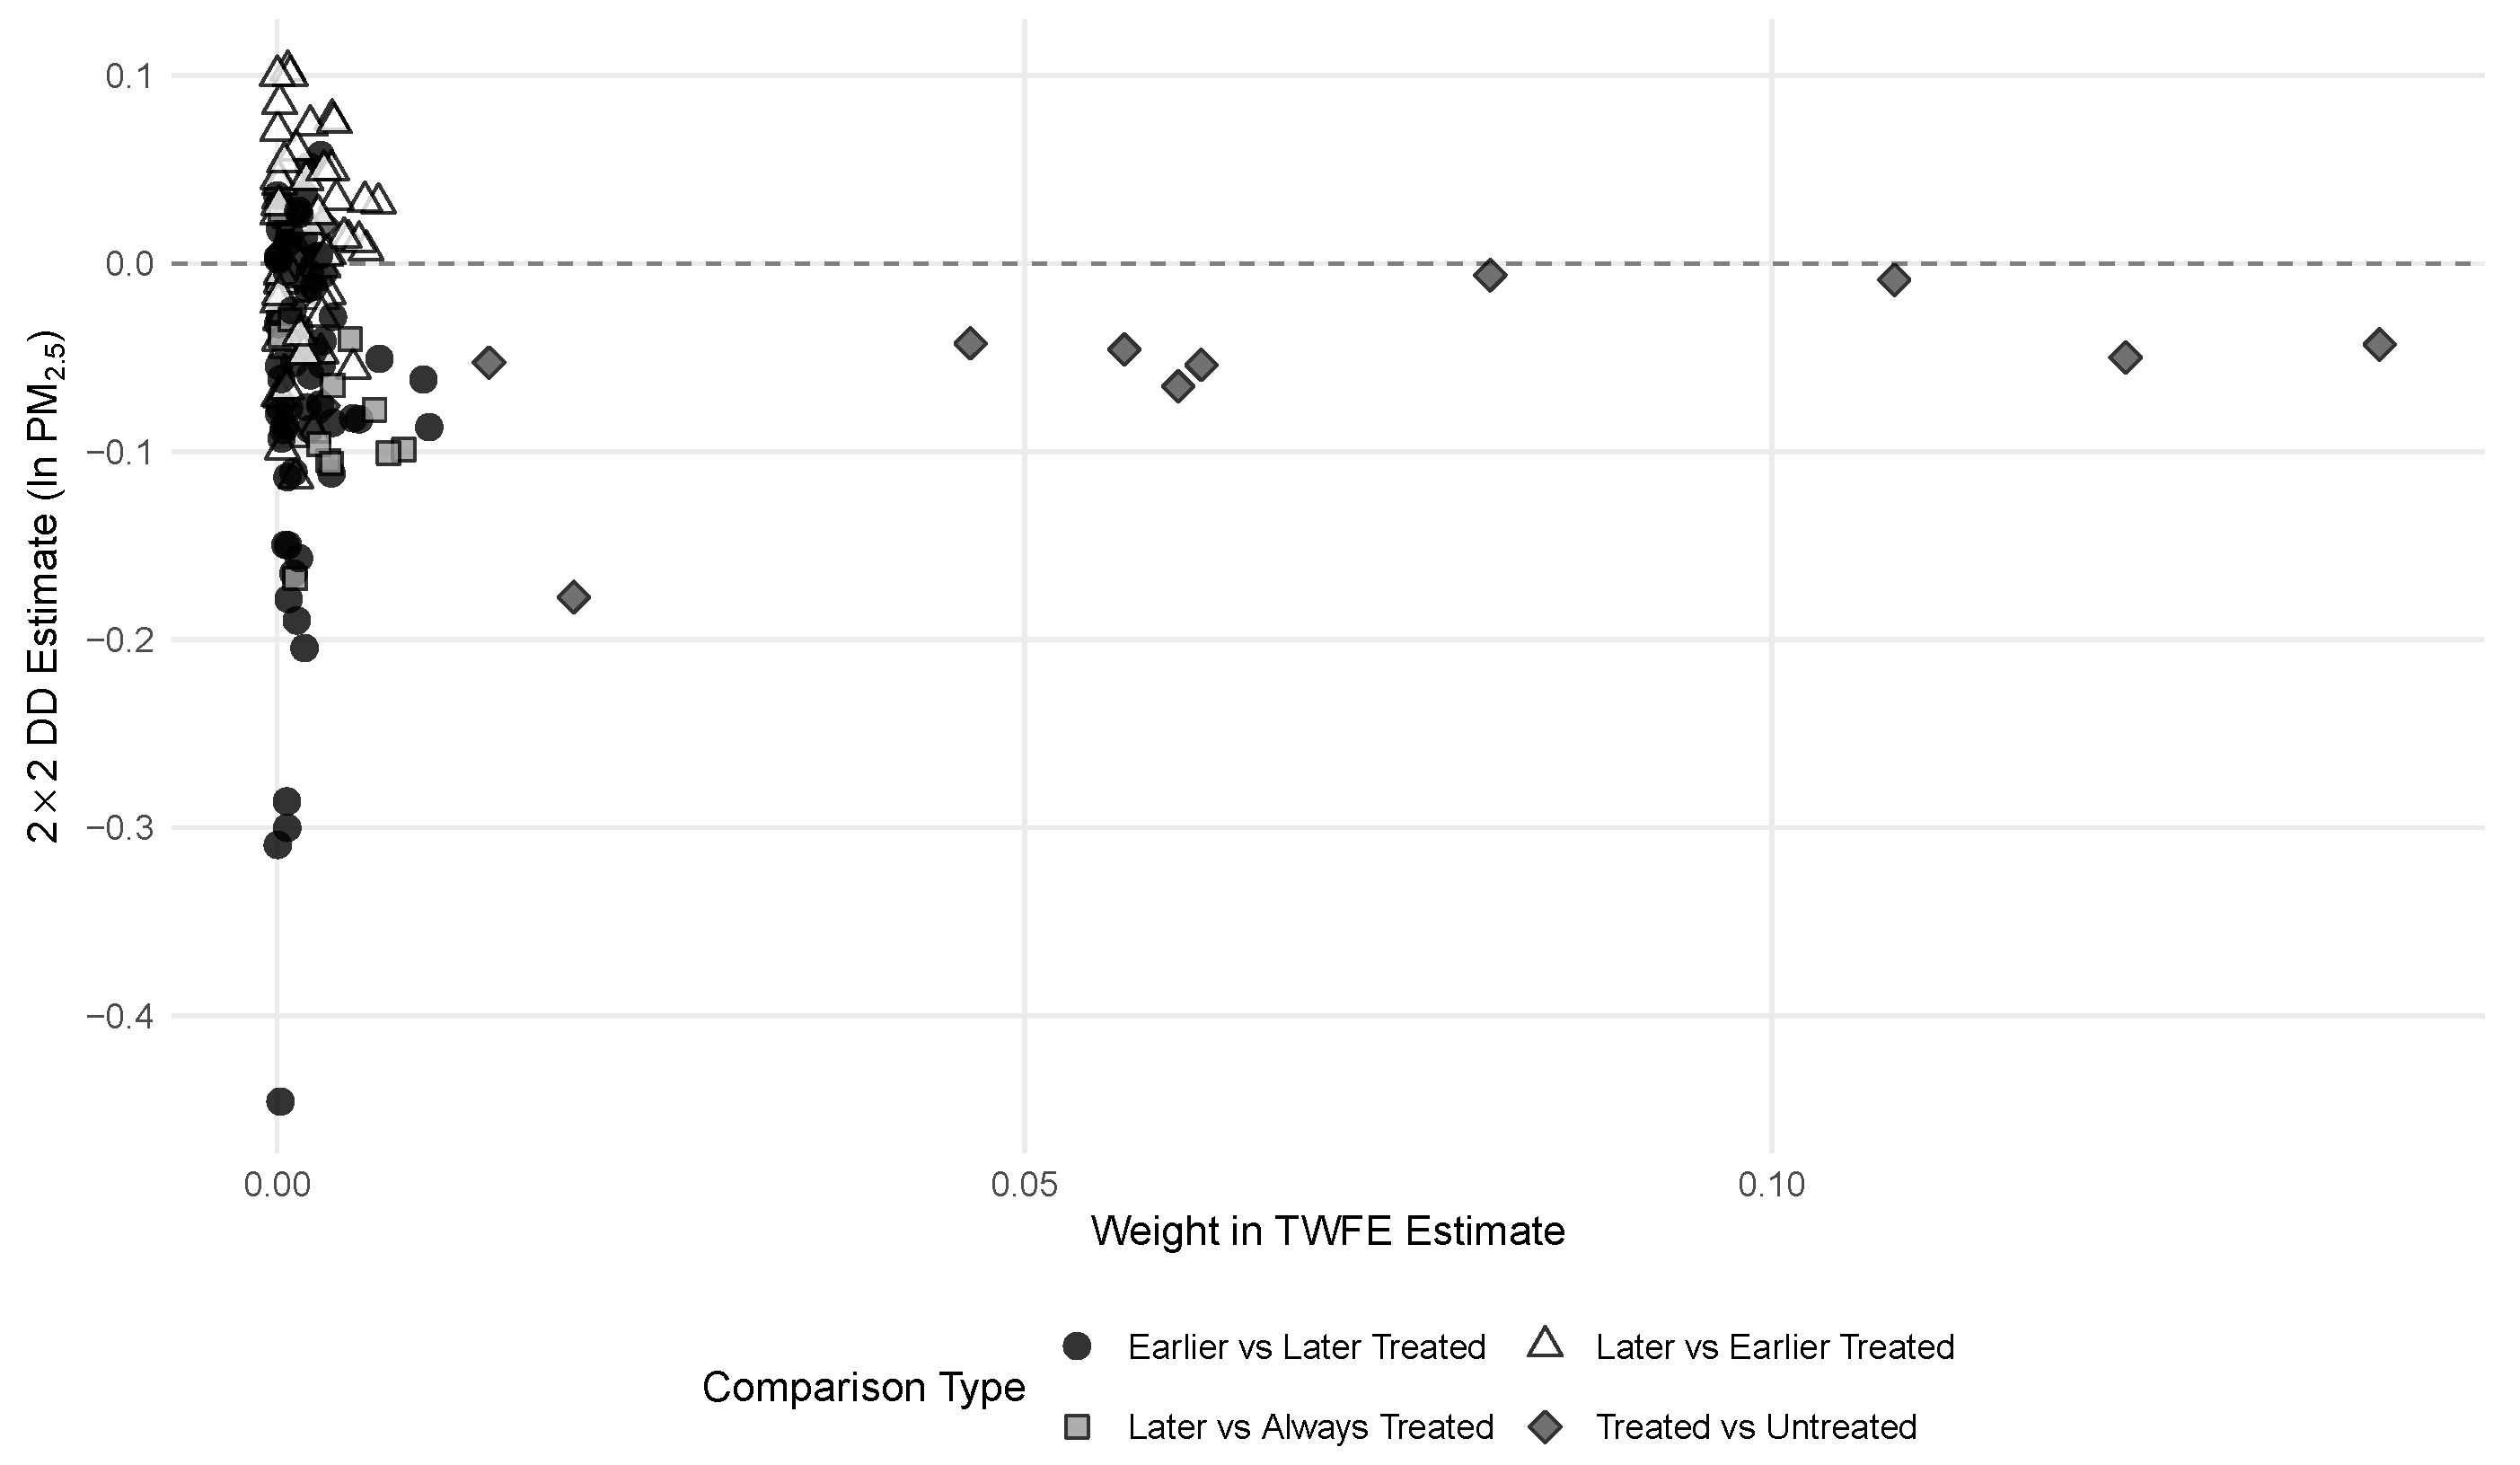
4.7. TWFE Weight Decomposition
4.8. Robustness Checks
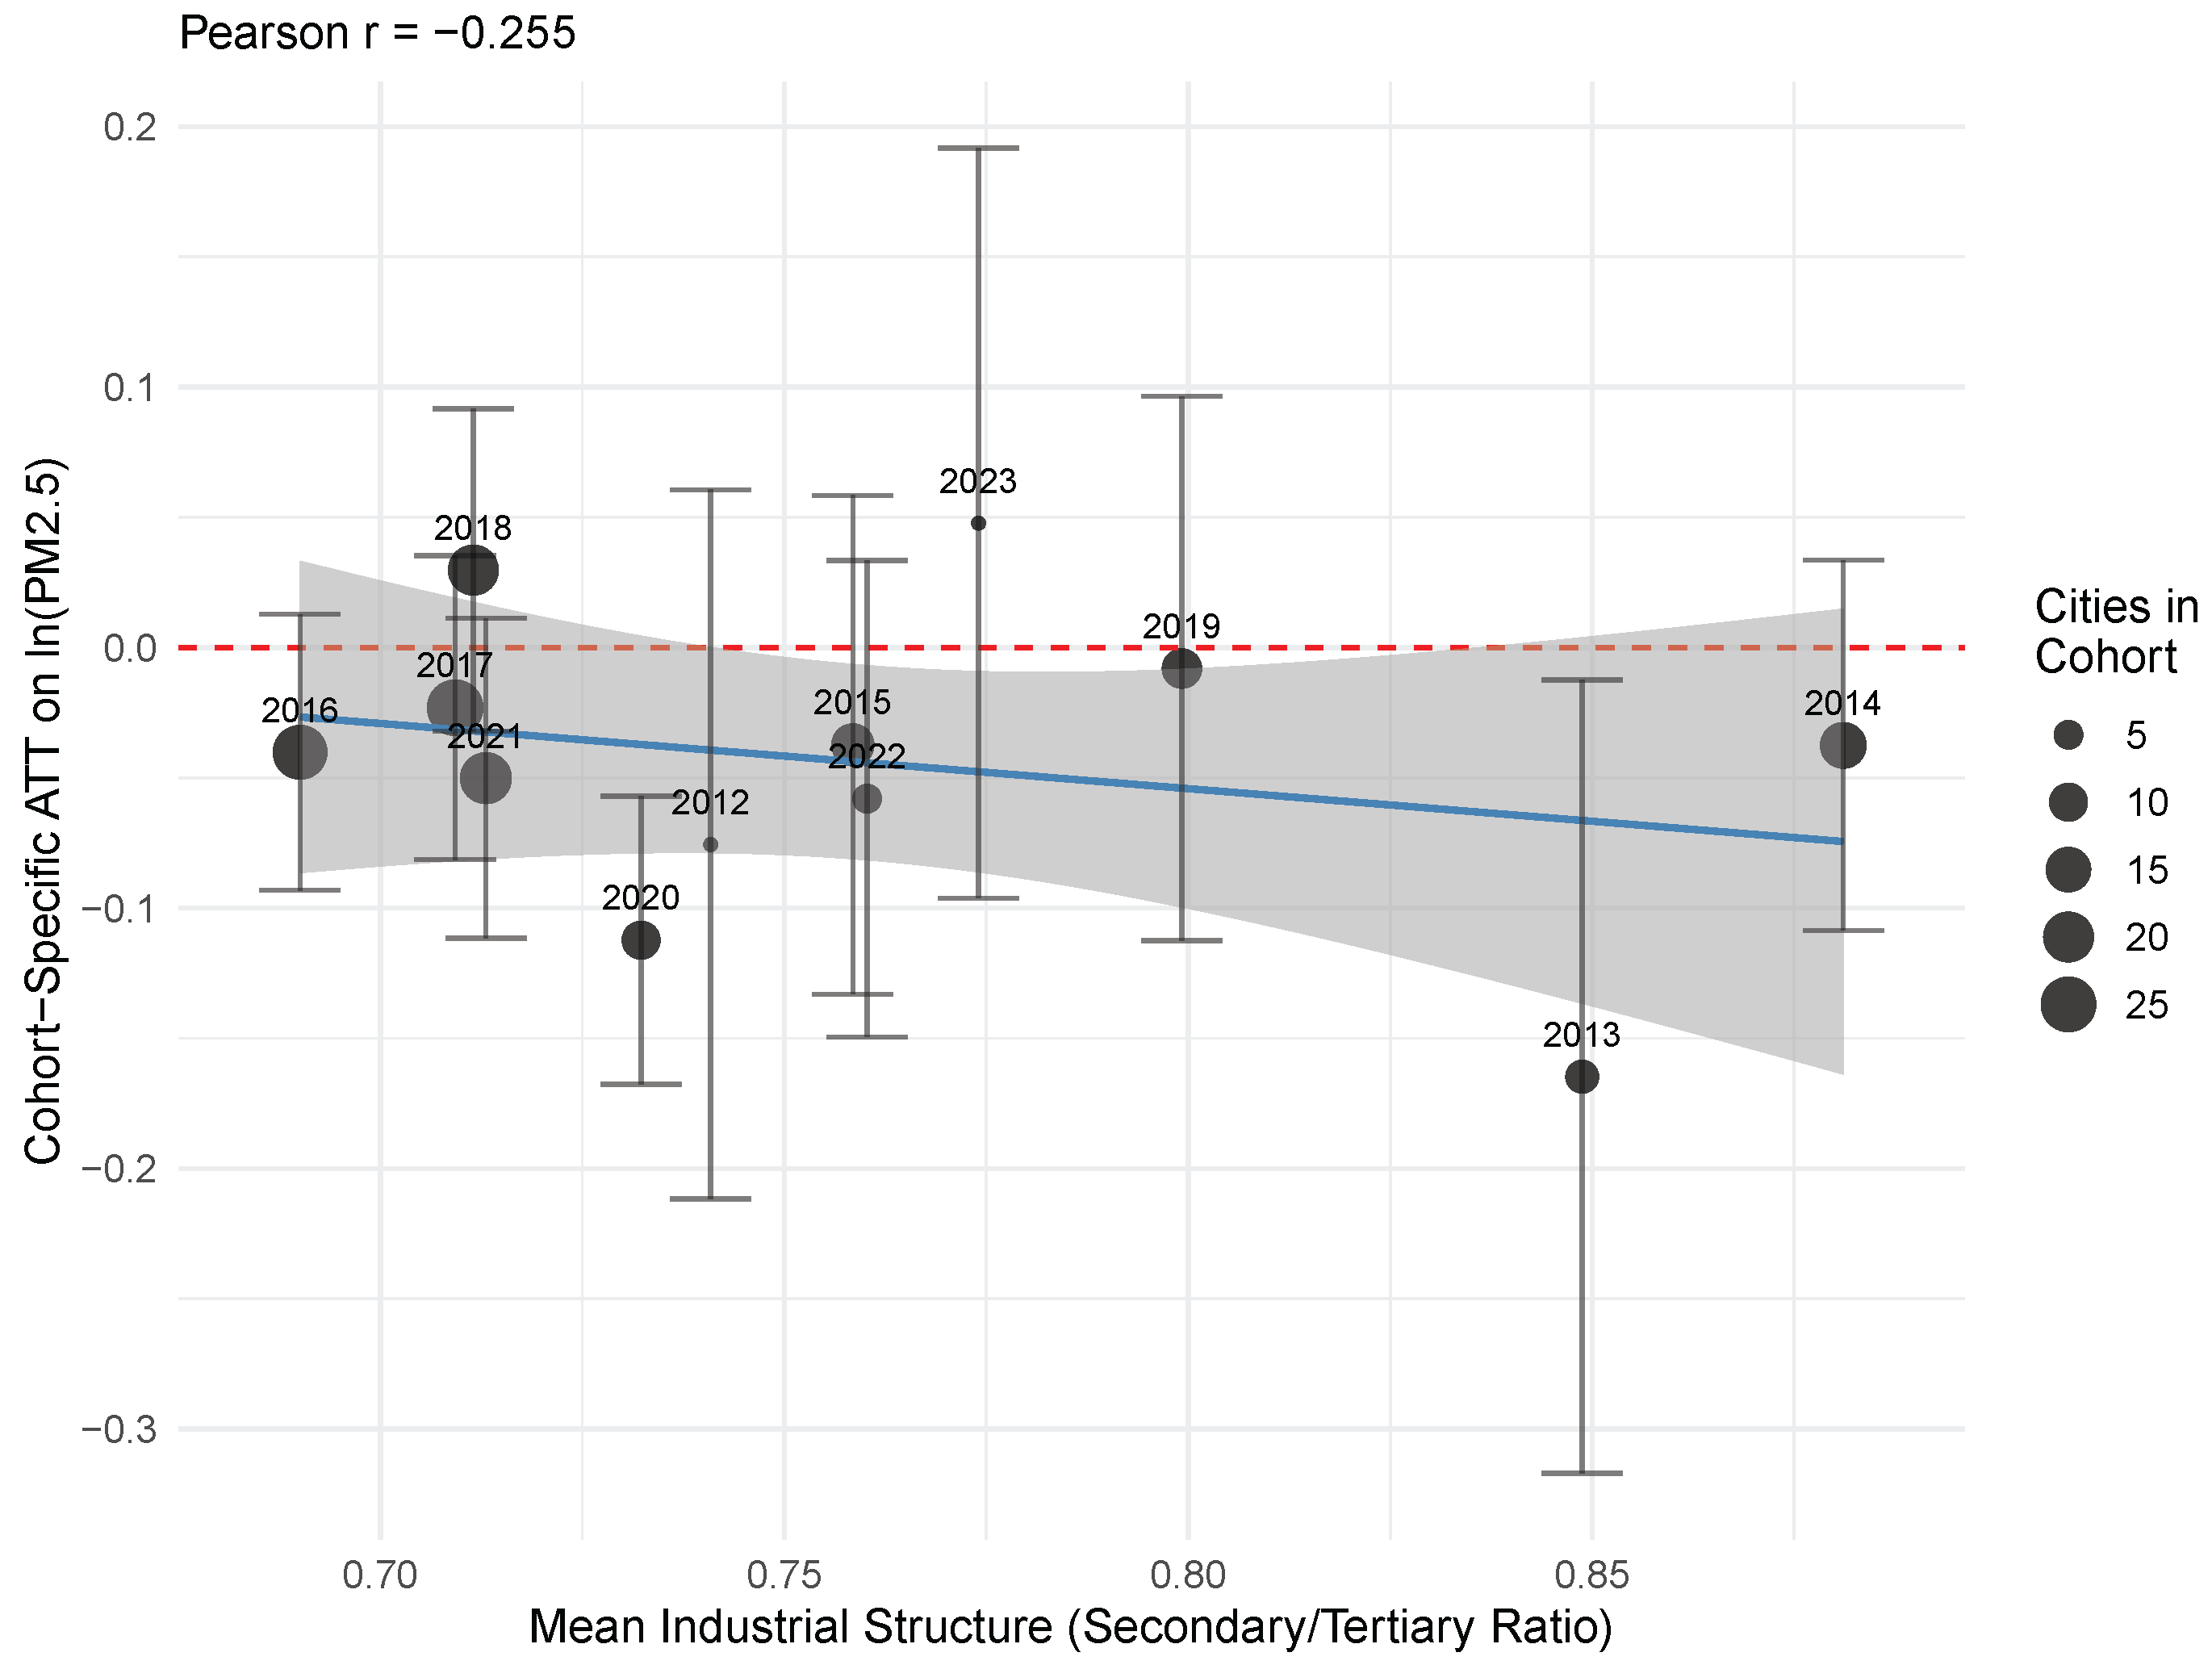
4.9. Heterogeneity Analysis
5. Discussion
5.1. Main Finding: Environmental Governance Specialization Reduces PM2.5
5.2. Methodological Implications: TWFE Versus Robust Estimators
5.3. Mechanisms and Channels
5.4. Addressing the 2015 Environmental Protection Law Confound
5.5. Comparison with Existing Literature
5.6. Limitations
5.7. Policy Implications
6. Conclusions
Supplementary Materials
Author Contributions
Funding
Institutional Review Board Statement
Informed Consent Statement
Data Availability Statement
Acknowledgments
Conflicts of Interest
Abbreviations
| PM2.5 | Particulate Matter with diameter ≤ 2.5 m |
| TWFE | Two-Way Fixed Effects |
| DID | Difference-in-Differences |
| CS-DID | Callaway–Sant’Anna Difference-in-Differences |
| ATT | Average Treatment Effect on the Treated |
| DR | Doubly Robust |
| EPL | Environmental Protection Law |
| EPIL | Environmental Public Interest Litigation |
| AQI | Air Quality Index |
| ACAG | Atmospheric Composition Analysis Group |
| SUTVA | Stable Unit Treatment Value Assumption |
References
- Geng, G.; Liu, Y.; Liu, Y.; Zheng, B.; Tong, D.; Li, M.; Zhang, Q.; He, K. Efficacy of China’s Clean Air Actions to Tackle PM2.5 Pollution between 2013 and 2020. Nat. Geosci. 2024, 17, 987–994. [Google Scholar] [CrossRef]
- He, G.; Wang, S.; Zhang, B. Watering Down Environmental Regulation in China. Q. J. Econ. 2020, 135, 2135–2185. [Google Scholar] [CrossRef]
- Markard, J.; Raven, R.; Truffer, B. Sustainability Transitions: An Emerging Field of Research and Its Prospects. Res. Policy 2012, 41, 955–967. [Google Scholar] [CrossRef]
- Zhang, Q.; Yu, Z.; Kong, D. The Real Effect of Legal Institutions: Environmental Courts and Firm Environmental Protection Expenditure. J. Environ. Econ. Manag. 2019, 98, 102254. [Google Scholar] [CrossRef]
- Zhang, L.; Su, L.; Liu, B.; Dai, Y. The Impact of Environmental Judicial Specialization on Corporate Greenwashing: Evidence from China. Sustainability 2026, 18, 1896. [Google Scholar] [CrossRef]
- Wu, W.; Chan, P.C.H.; Lin, X. Urban Pollution Governance, Prosecutor-led Environmental Public Interest Litigation and Regional Environmental Disparities in China: Evidence from 282 Cities. China Int. J. 2024, 22, 73–95. [Google Scholar] [CrossRef]
- Stern, R.E. Environmental Litigation in China: A Study in Political Ambivalence; Cambridge Studies in Law and Society, Cambridge University Press: New York, NY, USA, 2013. [Google Scholar] [CrossRef]
- Goodman-Bacon, A. Difference-in-Differences with Variation in Treatment Timing. J. Econom. 2021, 225, 254–277. [Google Scholar] [CrossRef]
- de Chaisemartin, C.; D’Haultfoeuille, X. Two-Way Fixed Effects Estimators with Heterogeneous Treatment Effects. Am. Econ. Rev. 2020, 110, 2964–2996. [Google Scholar] [CrossRef]
- Sun, L.; Abraham, S. Estimating Dynamic Treatment Effects in Event Studies with Heterogeneous Treatment Effects. J. Econom. 2021, 225, 175–199. [Google Scholar] [CrossRef]
- Roth, J.; Sant’Anna, P.H.C.; Bilinski, A.; Poe, J. What’s Trending in Difference-in-Differences? A Synthesis of the Recent Econometrics Literature. J. Econom. 2023, 235, 2218–2244. [Google Scholar] [CrossRef]
- Greenstone, M.; He, G.; Jia, R.; Liu, T. Can Technology Solve the Principal-Agent Problem? Evidence from China’s War on Air Pollution. Am. Econ. Rev. Insights 2022, 4, 54–70. [Google Scholar] [CrossRef]
- Callaway, B.; Sant’Anna, P.H.C. Difference-in-Differences with Multiple Time Periods. J. Econom. 2021, 225, 200–230. [Google Scholar] [CrossRef]
- Qi, X.; Wu, Z.; Xu, J.; Sha, B. Environmental justice and green innovation: A quasi-natural experiment based on the establishment of environmental courts in China. Ecol. Econ. 2023, 205, 107700. [Google Scholar] [CrossRef]
- United Nations Environment Programme. Environmental Courts and Tribunals—2021: A Guide for Policy Makers; Technical Report; UNEP: Nairobi, Kenya, 2021. [Google Scholar]
- Meng, Y.; Yang, X. Environmental Justice Specialization and Corporate ESG Performance: Evidence from China Environmental Protection Court. Sustainability 2024, 16, 9531. [Google Scholar] [CrossRef]
- Zheng, Y. Establishment of environmental protection courts, green finance, and corporate operating performance. Financ. Res. Lett. 2026, 90, 109301. [Google Scholar] [CrossRef]
- He, L.Y.; Qi, X.F. Environmental Courts, Environment and Employment: Evidence from China. Sustainability 2021, 13, 6248. [Google Scholar] [CrossRef]
- Deng, J.; Li, M.; Li, Y.; Lu, J. Effect of Environmental Courts on Pollution Abatement: A Spatial Difference-in-Differences Analysis. Sustainability 2024, 16, 1452. [Google Scholar] [CrossRef]
- Ebenstein, A.; Fan, M.; Greenstone, M.; He, G.; Zhou, M. New Evidence on the Impact of Sustained Exposure to Air Pollution on Life Expectancy from China’s Huai River Policy. Proc. Natl. Acad. Sci. USA 2017, 114, 10384–10389. [Google Scholar] [CrossRef]
- Chen, Y.; Ebenstein, A.; Greenstone, M.; Li, H. Evidence on the Impact of Sustained Exposure to Air Pollution on Life Expectancy from China’s Huai River Policy. Proc. Natl. Acad. Sci. USA 2013, 110, 12936–12941. [Google Scholar] [CrossRef]
- Barwick, P.J.; Li, S.; Lin, L.; Zou, E. From Fog to Smog: The Value of Pollution Information. Am. Econ. Rev. 2024, 114, 1338–1381. [Google Scholar] [CrossRef]
- Borusyak, K.; Jaravel, X.; Spiess, J. Revisiting Event-Study Designs: Robust and Efficient Estimation. Rev. Econ. Stud. 2024, 91, 3253–3285. [Google Scholar] [CrossRef]
- Sant’Anna, P.H.C.; Zhao, J. Doubly Robust Difference-in-Differences Estimators. J. Econom. 2020, 219, 101–122. [Google Scholar] [CrossRef]
- Hammer, M.S.; van Donkelaar, A.; Li, C.; Mudway, I.; Burnett, R.T.; van Erp, A.M.M.; Martin, R.V. Global Estimates and Long-Term Trends of Fine Particulate Matter Concentrations (1998–2018). Environ. Sci. Technol. 2020, 54, 7879–7890. [Google Scholar] [CrossRef] [PubMed]
- van Donkelaar, A.; Hammer, M.S.; Bindle, L.; Brauer, M.; Brook, J.R.; Garay, M.J.; Hsu, N.C.; Kalashnikova, O.V.; Kahn, R.A.; Lee, C.; et al. Monthly Global Estimates of Fine Particulate Matter and Their Uncertainty. Environ. Sci. Technol. 2021, 55, 15287–15300. [Google Scholar] [CrossRef] [PubMed]
- Wei, J.; Li, Z.; Cribb, M.; Huang, W.; Xue, W.; Sun, L.; Guo, J.; Peng, Y.; Li, J.; Lyapustin, A.; et al. Reconstructing 1-km-resolution High-Quality PM2.5 Data Records from 2000 to 2018 in China: Spatiotemporal Variations and Policy Implications. Remote Sens. Environ. 2021, 252, 112136. [Google Scholar] [CrossRef]
- Cameron, A.C.; Miller, D.L. A Practitioner’s Guide to Cluster-Robust Inference. J. Hum. Resour. 2015, 50, 317–372. [Google Scholar] [CrossRef]



| Variable | N | Mean | SD | Min | Max |
|---|---|---|---|---|---|
| PM2.5 (g/m3) | 4210 | 40.080 | 16.999 | 1.856 | 156.604 |
| ln(PM2.5) | 4210 | 3.596 | 0.458 | 0.618 | 5.054 |
| Treated | 4210 | 0.248 | 0.432 | 0 | 1 |
| Urbanization rate (%) | 4171 | 56.839 | 9.773 | 22.81 | 75.42 |
| Industrial structure | 4171 | 1.132 | 0.324 | 0.518 | 3.214 |
| Government intervention | 4171 | 0.220 | 0.157 | 0.083 | 1.232 |
| Environmental regulation | 4171 | 80.130 | 25.840 | 13 | 159 |
| Per capita GDP (10k yuan) | 4171 | 0.920 | 0.314 | 0.452 | 1.801 |
| (1) | (2) | |
|---|---|---|
| No Controls | Province Controls | |
| Treated | ** | * |
| City FE | Yes | Yes |
| Year FE | Yes | Yes |
| Province controls | No | Yes |
| Observations | 4210 | 4171 |
| Within | 0.004 | 0.016 |
| Estimator | ATT | SE | p-Value |
|---|---|---|---|
| TWFE | ** | ||
| Callaway–Sant’Anna (DR) | *** | ||
| Sun–Abraham | *** | ||
| Borusyak–Jaravel–Spiess | *** | ||
| Observations | 4210 | ||
| Specification | ATT | SE | Cities |
|---|---|---|---|
| (A) No covariates (baseline) | *** | 324 | |
| (B) + Firm density (2011) | ** | 313 | |
| (C) + GDP, tertiary, HDI (2013) | ** | 255 |
| Cohort | Cities | ATT | SE | p-Value | Mean IndStru | Mean PM2.5 |
|---|---|---|---|---|---|---|
| 2012 | 2 | 0.741 | 50.89 | |||
| 2013 | 7 | ** | 0.849 | 49.53 | ||
| 2014 | 16 | 0.881 | 47.46 | |||
| 2015 | 13 | 0.759 | 54.38 | |||
| 2016 | 24 | 0.690 | 54.43 | |||
| 2017 | 26 | 0.709 | 51.82 | |||
| 2018 | 20 | 0.712 | 43.76 | |||
| 2019 | 11 | 0.799 | 42.83 | |||
| 2020 | 10 | *** | <0.001 | 0.732 | 47.60 | |
| 2021 | 21 | 0.713 | 50.69 | |||
| 2022 | 5 | 0.760 | 48.66 | |||
| 2023 | 2 | 0.774 | 45.57 |
Disclaimer/Publisher’s Note: The statements, opinions and data contained in all publications are solely those of the individual author(s) and contributor(s) and not of MDPI and/or the editor(s). MDPI and/or the editor(s) disclaim responsibility for any injury to people or property resulting from any ideas, methods, instructions or products referred to in the content. |
© 2026 by the authors. Licensee MDPI, Basel, Switzerland. This article is an open access article distributed under the terms and conditions of the Creative Commons Attribution (CC BY) license.
Share and Cite
Chen, L.; Yang, Y.; Tang, Y. Does Environmental Governance Specialization Reduce Air Pollution? Evidence from a Staggered Difference-in-Differences Approach in China. Sustainability 2026, 18, 5374. https://doi.org/10.3390/su18115374
Chen L, Yang Y, Tang Y. Does Environmental Governance Specialization Reduce Air Pollution? Evidence from a Staggered Difference-in-Differences Approach in China. Sustainability. 2026; 18(11):5374. https://doi.org/10.3390/su18115374
Chicago/Turabian StyleChen, Lie, Yongxi Yang, and Yiliang Tang. 2026. "Does Environmental Governance Specialization Reduce Air Pollution? Evidence from a Staggered Difference-in-Differences Approach in China" Sustainability 18, no. 11: 5374. https://doi.org/10.3390/su18115374
APA StyleChen, L., Yang, Y., & Tang, Y. (2026). Does Environmental Governance Specialization Reduce Air Pollution? Evidence from a Staggered Difference-in-Differences Approach in China. Sustainability, 18(11), 5374. https://doi.org/10.3390/su18115374