Article

An Empirical Assessment of Greenhouse Gas Emissions and Environmental Performance of Hybrid Vehicles in the European Union


1
Doctoral School of Economics II, Bucharest University of Economic Studies, 010374 Bucharest, Romania
2
Research Center for Sustainable Development, Bucharest University of Economic Studies, 010374 Bucharest, Romania
*
Author to whom correspondence should be addressed.
Sustainability 2026, 18(11), 5341; https://doi.org/10.3390/su18115341
Submission received: 22 April 2026 / Revised: 16 May 2026 / Accepted: 22 May 2026 / Published: 26 May 2026

Abstract

This study provides an empirical assessment of greenhouse gas emissions and the environmental performance of hybrid vehicles in the European Union. The analysis integrates a macro-level examination of nitrous oxide (N2O) emission trends in EU Member States for road and pipeline transport with a micro-level econometric investigation of emissions generated by the internal combustion engines of hybrid vehicles. The empirical analysis is based on a large sample of hybrid vehicles of different brands and variants, including 1350 observations used to examine the relationship between CO2 emissions and fuel consumption per 100 km, and 123 observations to analyze nitrogen oxides (NOx) emissions. CO2 is assessed as the principal greenhouse gas emitted during vehicle operation, while NOx (NO and NO2) is examined as a major regulated atmospheric pollutant relevant to environmental performance. A bibliometric analysis of NOx-related publications further highlights increasing scientific attention to this pollutant, supporting the relevance of the current study. Results reveal significant heterogeneity across hybrid vehicle models in terms of fuel consumption and NOx emissions, indicating that environmental performance is strongly influenced by technological design and operational characteristics. Robust multiple regression models (R2 = 0.84 for vehicle with low CO2 emissions, 0.82 for high CO2 emissions and R2 = 0.72 for NOx emissions) revealed significant correlations between pollutant emissions and fuel consumption, providing valuable tools for predicting emissions and informing environmental policies and hybrid vehicle design. Overall, the findings indicate that hybrid vehicles can contribute to improved environmental performance and lower greenhouse gas emissions relative to conventional vehicles, while their effectiveness depends on model specific characteristics and broader sectoral emission dynamics in the EU. These insights provide evidence for policymakers and industry stakeholders to support the transition toward cleaner vehicle technologies and align climate neutrality targets in the European Union.

1. Introduction

Traffic problems, fuel consumption, greenhouse gas emissions, air pollution, and traffic jams are major urban challenges. Sustainable solutions are needed urgently. Diesel vehicles contribute over 30% of NOx emissions [1,2,3,4]. These emissions form tropospheric ozone and impact air quality [5,6], moreover, modern vehicle fleets continue to exhibit substantial reactive nitrogen output under varying operational conditions [7]. In Europe, road transport remains a significant NOx source in urban areas, often underestimated by current models [8,9]. This study examines the interplay between EU-wide N2O emission trends and real-world NOx/CO2 performance of hybrid vehicles, assessing their combined impact on EU decarbonisation efforts.
The primary objective of this study is to develop econometric models for estimating CO2 and NOx emissions from hybrid vehicles in the EU, thereby assessing their environmental performance and identifying key technological and operational factors influencing emissions to inform policy and industry strategies towards cleaner transportation in the European Union.
This study examines CO2 emissions determinants in vehicles, integrating EU-level N2O trends, experimental NOx data from the Romanian Auto Registry, and econometric modelling to assess how vehicle characteristics and emissions policies influence CO2 profiles across low and high emission groups. Macro-level EU trends (Eurostat) contextualise the environmental impact of hybrid vehicles, while micro-level analysis reveals specific patterns in CO2/NOx emissions. Together, these perspectives highlight the role of hybrid technologies in achieving EU emission targets. This study advances the understanding of hybrid vehicle environmental performance by integrating EU-wide N2O trend analysis with granular econometric models linking fuel consumption and greenhouse gas emissions, offering tailored policy implications for reducing CO2 and mitigating NOx in the EU transport sector, a critical step towards achieving climate neutrality targets.
Emissions vary with driving conditions, altitude, and temperature, requiring real-world measurements [10,11,12]. Though electric vehicles are growing, internal combustion engines will dominate until 2040 without a global ban. Sales of electric vehicles are constantly increasing, and their associated technologies are improving significantly [13,14].
Nitrogen oxides are highly reactive compounds containing nitrogen and oxygen in varying amounts. Most nitrogen oxides are colourless and odourless gases. Nitrogen oxides occur during the combustion process, when fuels are burned at high temperatures, but most often they are the result of road traffic, industrial activities, and electricity generation. Nitrogen oxides are responsible for the formation of smog, acid rain, deterioration of water quality, the greenhouse effect, and reduced visibility in urban areas [15].
Diesel electrification is inevitable; hybrids reduce fuel consumption and NOx [16,17].
Hybrids offer comparable power with 40–50% lower consumption [18]. Diesel vehicles have low consumption but face stricter emissions regulations. Real-world emissions often exceed limits, even for Euro 6 vehicles [19,20].
Hybridisation reduces fuel consumption and NOx emissions (31%) in trucks, but needs advanced control systems [21,22]. Several studies in Europe and China have revealed significant discrepancies between actual nitrogen oxide emissions and regulated emission limits, for both light and heavy diesel vehicles [23,24,25,26,27], as also highlighted by recent analyses on Euro 7 preparation and regulatory challenges [28]. This performance is closely linked to speed-specific power distributions and transient engine management [29]. Currently unregulated non-carbon chemicals such as ammonia and nitrous oxide will be considered for regulation with the introduction of EURO 7 emissions standards. UK cars emit 17× more NH3 than reported; data on NH3 and N2O from hybrids is limited [30,31,32]. Ammonia (NH3) is a secondary pollutant that is mainly generated inside the trivalent catalytic converter (TWC), through chemical reactions involving precursor species such as NO, CO, H2O, and H2. Existing studies show significant increases in NH3 emissions at the exhaust (after the TWC), especially during acceleration periods, a phenomenon correlated with the decrease in the lambda ratio, which favours the selectivity of the catalyst towards the formation of NH3 [33].
Nitrogen oxides are an important component of greenhouse gases generated by transport. In the European Union, climate policies have been aiming for several years to reduce these emissions by adopting more efficient technologies, expanding electrification, and applying increasingly strict regulations. However, the dynamics of emissions differ between Member States, depending on the infrastructure, energy mix, and traffic intensity [34]. This study analyses the statistical evolution of N2O emissions from land and pipeline transport for the period 2014–2023, using relevant descriptive indicators.
Over the past 20 years, increasing awareness of the economic and environmental concerns surrounding fuel combustion in the transport sector has led to increased focus on developing sustainable transport systems. The transport sector is one of the largest consumers of fossil fuels and one of the largest contributors to greenhouse gas emissions. Approximately 17% of all hydrocarbon fuels consumed and 23% of all carbon dioxide emissions to the atmosphere are accounted for by vehicles [35,36,37,38]. Electric vehicles suit regions with clean energy; hybrids fit areas with fossil fuel dependency [39].
In 2016, the total energy demand in the transport sector represented 48.80% of Ecuador’s energy consumption, and 89.87% of this value was attributed to road transport. Analysing sector evolution and sustainable measures is key [40].
Emerging electric vehicle car sharing systems have demonstrated their potential to reduce nitrogen oxide emissions and have attracted increasing public attention. The number of such systems is growing globally, particularly in metropolitan areas in developing countries, where air pollution is a major problem. Public acceptance is key for effective NOx reduction [41].
Micro mobility is often considered a sustainable solution to many urban mobility challenges, including reducing air pollution. Impact of e-scooters/bikes on NOx reduction is unclear due to varying conditions [42,43,44].
Researching pollutants requires complex methods and high-performance equipment for precise assessment. The composition of exhaust gases varies in relation to the value of the excess air coefficient, the values of which are determined by the mode of operation of the fuel system.
Regarding the literature gap, our study addresses the limited understanding of how hybrid vehicle design influences NOx and CO2 emissions in the EU context (e.g., [45,46]). Our findings on the correlation between fuel consumption and emissions (R2 = 0.84 for low CO2 vehicles, R2 = 0.82 for high CO2 vehicles, R2 = 0.72 for NOx) complement [47]’s work on hybrid vehicles in Latin America and confirm trends observed by [48] regarding fuel efficiency of hybrids.
Specifically, our analysis extends these studies by providing EU-specific empirical evidence on model-specific heterogeneity in emissions, supporting policymakers in refining climate targets.
Our study’s findings are supported by recent research on transport emissions and policy implications [49,50,51,52]. The correlation between fuel consumption and emissions aligns with studies on emission reduction strategies [53,54].
Research on NOx emissions and N2O sources [52,55,56] including comprehensive assessments of alternative fuel frameworks in hybrid powertrains [57] and CO2 reduction [58,59] further contextualises our EU-focused analysis of hybrid vehicles.
The increasingly stringent pollution standards imposed on polluting emissions make it mandatory for control techniques to satisfy the following requirements:
  • to ensure the shortest possible response time;
  • to involve the easiest possible way of working;
  • to be cheap, and to allow daily measurements with high reliability and precision.

2. Materials and Methods

The methodological approach of this study involves a two-stage analysis. First, a macro-level examination of N2O emission trends in EU Member States for road and pipeline transport was conducted. Second, a micro-level econometric investigation of CO2 and NOx emissions from hybrid vehicles was performed using multiple regression models. The analysis is based on a consistent sample of hybrid vehicles. Econometric modelling is used to quantify relationships between vehicle characteristics and emissions, testing hypotheses on factors influencing environmental performance. Specifically, we test the following: H1—fuel consumption predicts CO2 emissions; H2—vehicle and engine attributes influence NOx emissions. The dataset represents diverse EU-market models, allowing robust analysis of technology-performance relationships. Multiple regression was chosen for its ability to model relationships between emissions and influencing factors, enabling prediction and aligning with similar transportation studies. The study was carried out using the experimental database, obtained within the Romanian Automotive Register, which included hybrid cars, belonging to different brands, models, and construction variants. The database included experimental values regarding nitrogen oxide emissions and fuel consumption per 100 km, obtained according to standardised procedures, in accordance with the European legislative framework. All vehicles were tested under controlled conditions, which simulated real driving cycles, using measurement protocols, which ensure the comparability of results between models.
Econometric analysis was performed using EViews 12 (IHS Global Inc., Seal Beach, CA, USA) software. Bibliometric analysis and keyword network visualization were performed using VOSviewer 1.6.20 (Centre for Science and Technology Studies, Leiden University, Leiden, The Netherlands). Data visualization was performed using Tableau Desktop Public Edition 2024.3.0 (Salesforce, Inc., San Francisco, CA, USA). Data processing and preliminary analysis were performed using Microsoft Excel 365 Version 2604 (Microsoft Corporation, Redmond, WA, USA).
Data processing included descriptive statistical analyses and comparisons between brands, to track and identify variations in NOx emissions, as well as fuel efficiency. Graphical representations were made regarding NOx emissions and fuel consumption by brand, as well as the distribution of vehicles according to emission levels. Additional datasets were run to assess overall emission trends, including the evolution of N2O emissions in EU Member States for road and pipeline transport (in absolute values and CO2 equivalent), the share of NOx emissions by economic sector (2023), the share of hybrid cars in national car fleets (2024), and a Pareto analysis of new hybrid vehicle registrations in the EU (2024).
The bibliometric analysis was performed using VOSviewer software (version 1.6.20), applying the syntax “NOx emission” and “hybrid vehicle”, to identify research trends and collaboration networks. All data, figures, and processing scripts are available on request, without access restrictions. The analysed data represent the N2O emissions recorded annually for each EU-27 Member State. The dataset is a constant size for each year, ensuring inter-annual comparability. A statistical analysis was performed that included calculating the mean, median, standard error, standard deviation, variance, kurtosis, skewness, range of values, minimum, maximum, and total sum, followed by an interpretation of the evolution of each parameter.

2.1. Measurement of Nitrogen Oxides Concentration

NOx emissions are measured using infrared (up to 500 ppm) or chemiluminescence analysers. Water vapour is removed (cooling/filtering) to prevent interference with NO absorption spectrum.
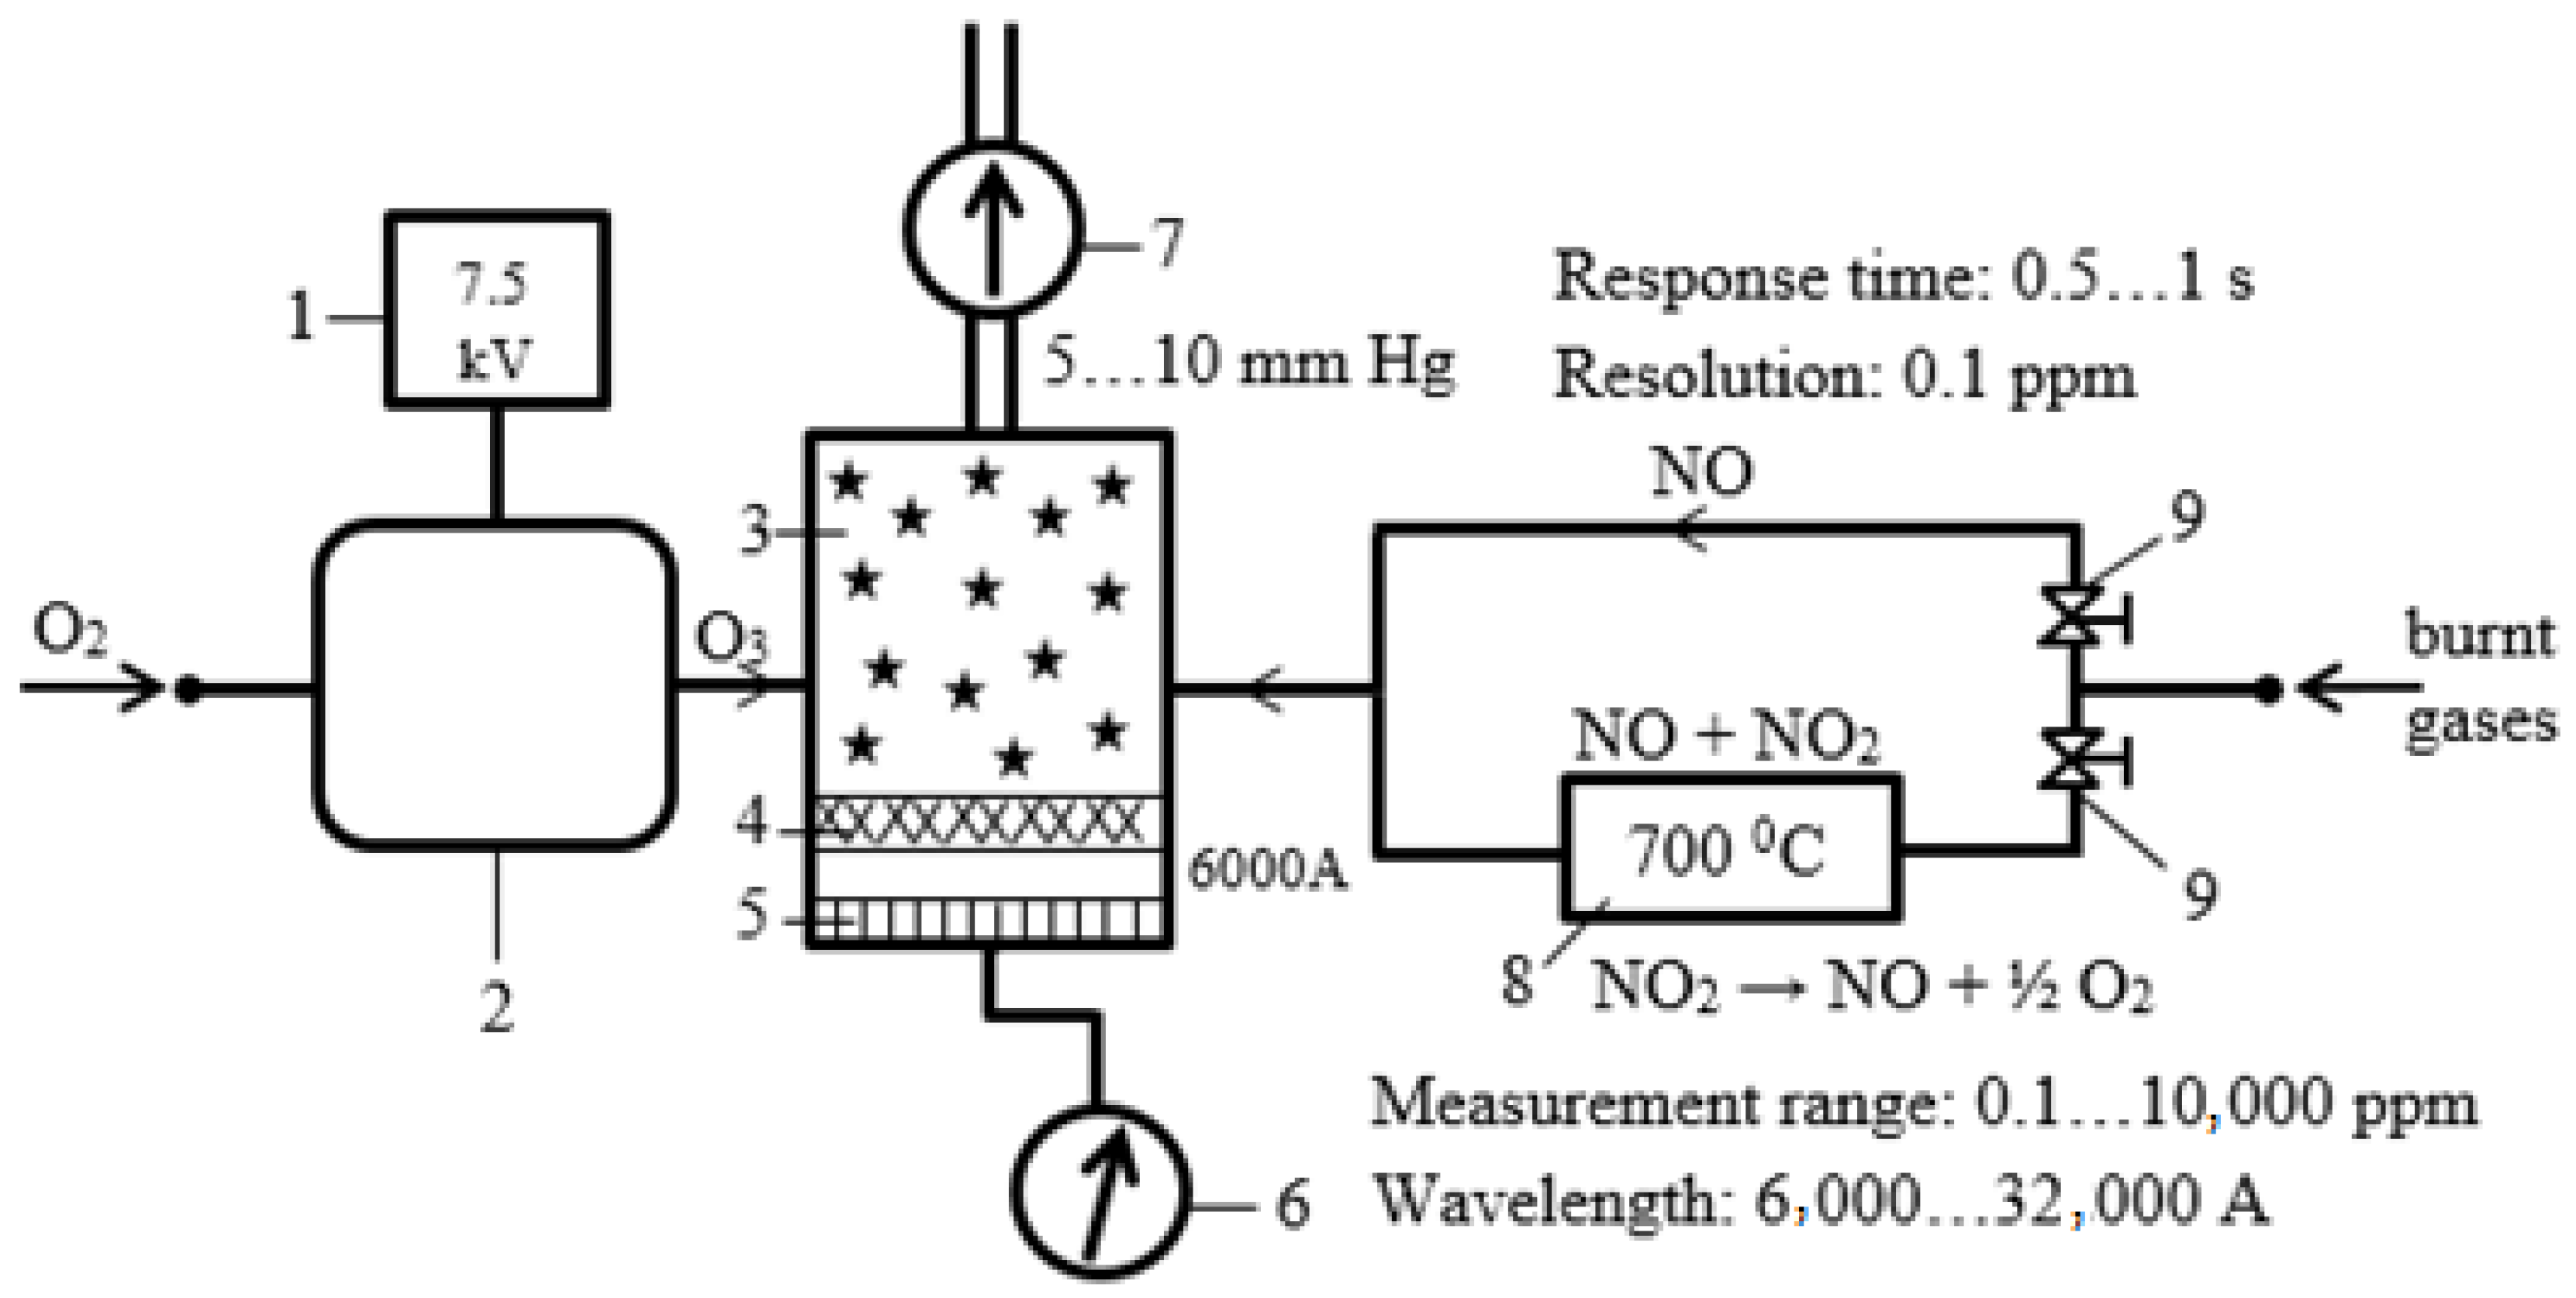
Figure 1 shows the schematic diagram for measuring NOx emissions based on the chemiluminescence principle. The chemiluminescence principle is based on the measurement of a luminous spark, which is produced in enclosure 3 due to the reactions.
N O + O 3 N O 2 * + O 2 N O 2 * N O 2 + h ν
where NO2*—energised nitrogen dioxide molecule and hv—characteristic luminescences emitted as the NO2 molecule decays to a lower energy state.
Oxygen is converted to ozone (O3) in the spark gap chamber. The instrument measures NO via reaction with O3, producing excited NO2* which emits near-infrared light proportional to NO concentration. A thermal reactor decomposes NO2 to NO, allowing total NOx (NO + NO2) measurement.

2.2. Bibliometric Analysis of NOx Emission

A bibliometric assessment was also performed using VOSviewer with the query “NOx emissions” and “hybrid vehicle”. We also identified patterns and trends in market capture and emission intensity, which suggest that vehicle hybridisation alone is not sufficient to achieve optimal NOx emission reduction. Based on the VOSviewer image and the analysis settings, the field of “NOx emissions” in the context of hybrid vehicles is multidimensional, addressing not only measurements but also engineering technologies, environmental and health impacts, as well as advanced testing methods.
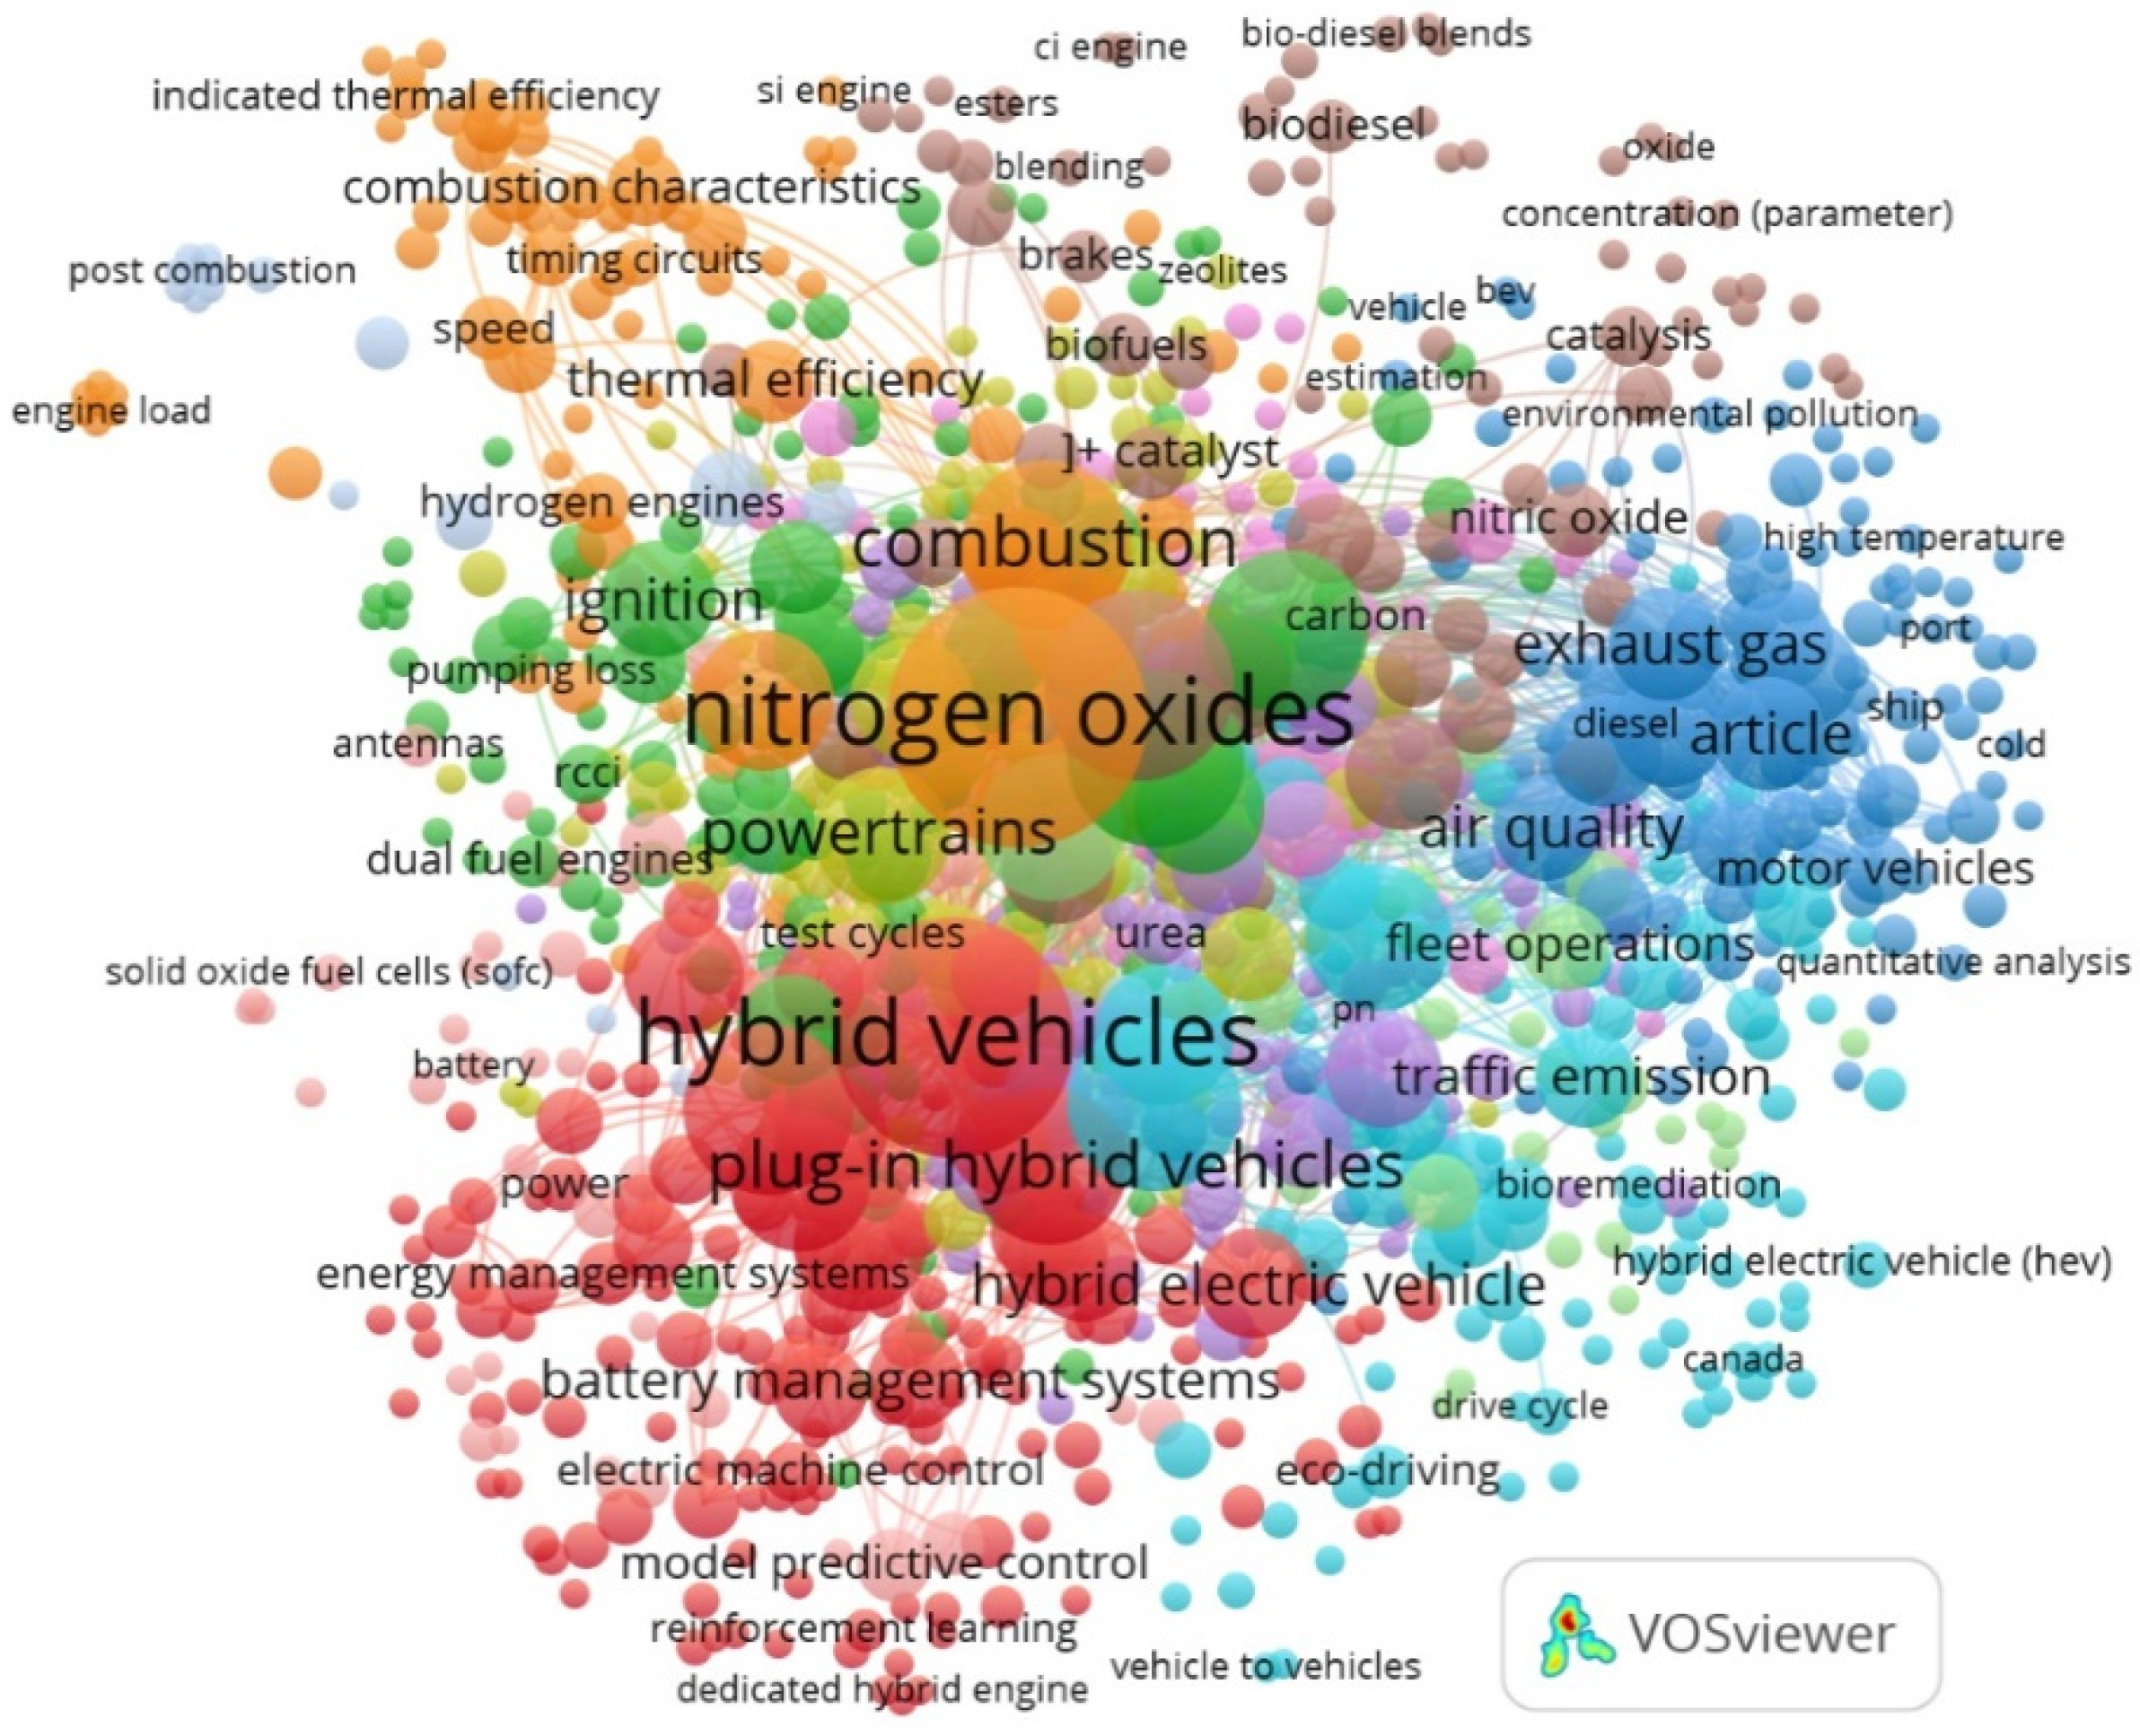
The central cluster confirms its role as a thematic core, where the terms “NOx emissions” and “hybrid vehicles” connect the technical, public policy, and experimental evaluation areas. There is a strong interest in technological solutions for NOx reduction, highlighted by the focus on engine types and after-treatment systems, while the socio-ecological dimension is well represented, with regulations, Euro standards, and urban air quality being essential themes. Testing and modelling methods have a transversal role, with a focus on RDE, simulations, and life cycle assessments, which shows that validation under real conditions is crucial for the credibility of the results.
Overall, the connections between the clusters indicate an interdisciplinary integration, where mechanical engineering, environmental sciences, public health, and computational modelling are combined to address the NOx problem in a holistic manner (Figure 2).
The nodes (points) represent the keywords used by the authors in the indexed articles. The size of the node indicates the frequency of occurrence of that keyword in the entire set of articles. The distance between the nodes and the links (lines) reflects how often the words appear together in the same articles. The colour of the clusters shows thematic clusters—topics or research directions associated with each other Figure 2.
The image in VOSviewer shows the co-occurrence network of keywords used by authors in the 262 articles indexed in Scopus, published between 2015 and 2024, resulting from a search for the syntax “NOx emission” and “hybrid vehicles”, with co-occurrence analysis, the unit of analysis being author keywords, and the counting method full counting.
The core of the network is formed by high-frequency terms such as “nitrogen oxides”, “hybrid vehicles”, “plug-in hybrid vehicles”, “hybrid electric vehicle”, and “powertrains”, indicating that the studies mainly focus on the direct link between hybrid technologies and the reduction of NOx emissions.
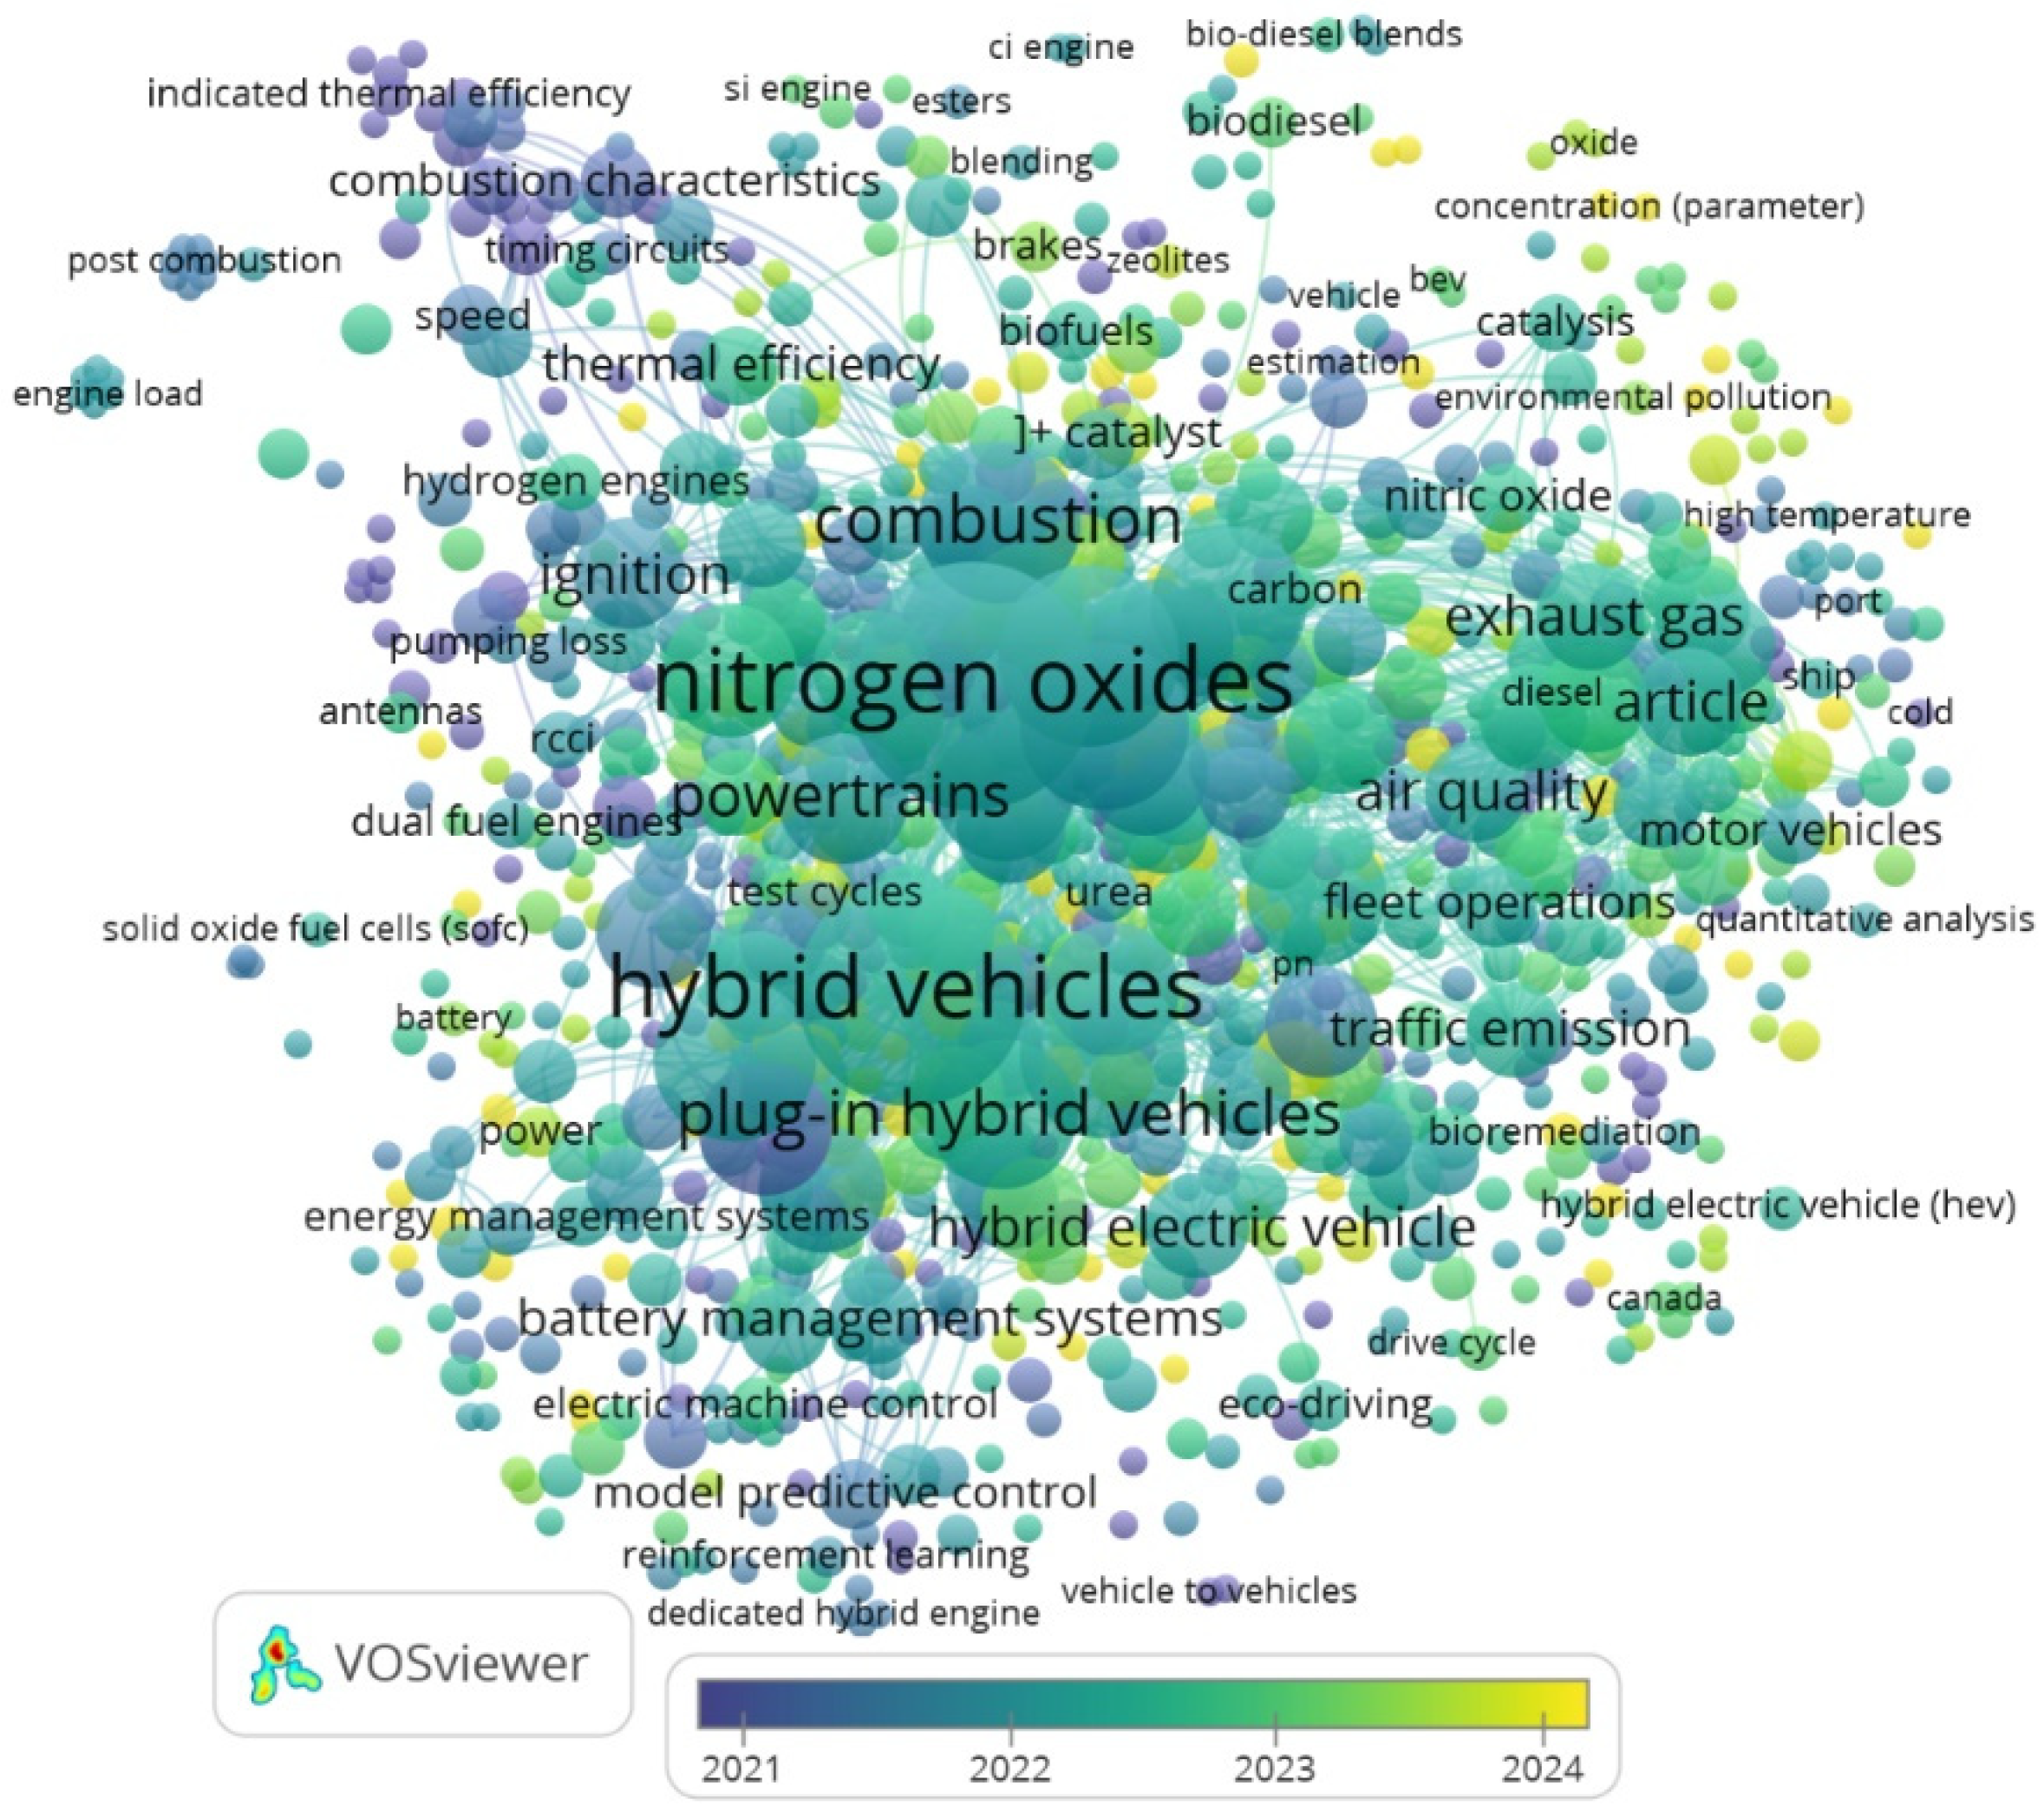
The colour palette, which reflects the average of the year of appearance, shows that basic technical terms (combustion, nitrogen oxides, hybrid vehicles) appear consistently since 2021, while notions related to regulations, environmental policies, and emerging technologies (biofuels, catalysis, eco-driving) are more recent, emphasising the increased interest from 2022 to 2024 for sustainable solutions and adaptation to strict emissions standards Figure 3.
The co-occurrence map generated in VOSviewer for the period 2015–2024 shows that the central themes in research on NOx emissions from hybrid vehicles are concentrated around the terms “nitrogen oxides”, “hybrid vehicles”, and “plug-in hybrid vehicles”, which indicates the core of interest in the field. Dense connections with terms such as “combustion”, “powertrains”, “battery management systems”, and “exhaust gas” highlight a strong technical orientation towards optimising propulsion systems and reducing emissions through controlling the combustion process and integrating electrical technologies Figure 3.
The presence of the terms “air quality”, “traffic emission”, and “environmental pollution” shows the direct link to the impact on the environment and public health, suggesting an interdisciplinary approach. The colour of the nodes shows that interest in environmental topics and emission control increased in the period 2022–2024, a sign of increasing pressure from regulations and climate goals. Overall, the results indicate an evolution of research from fundamental combustion and thermal efficiency studies towards the integration of hybrid and electric solutions with energy management methods and impact assessments, to achieve strict NOx reduction targets Figure 3.
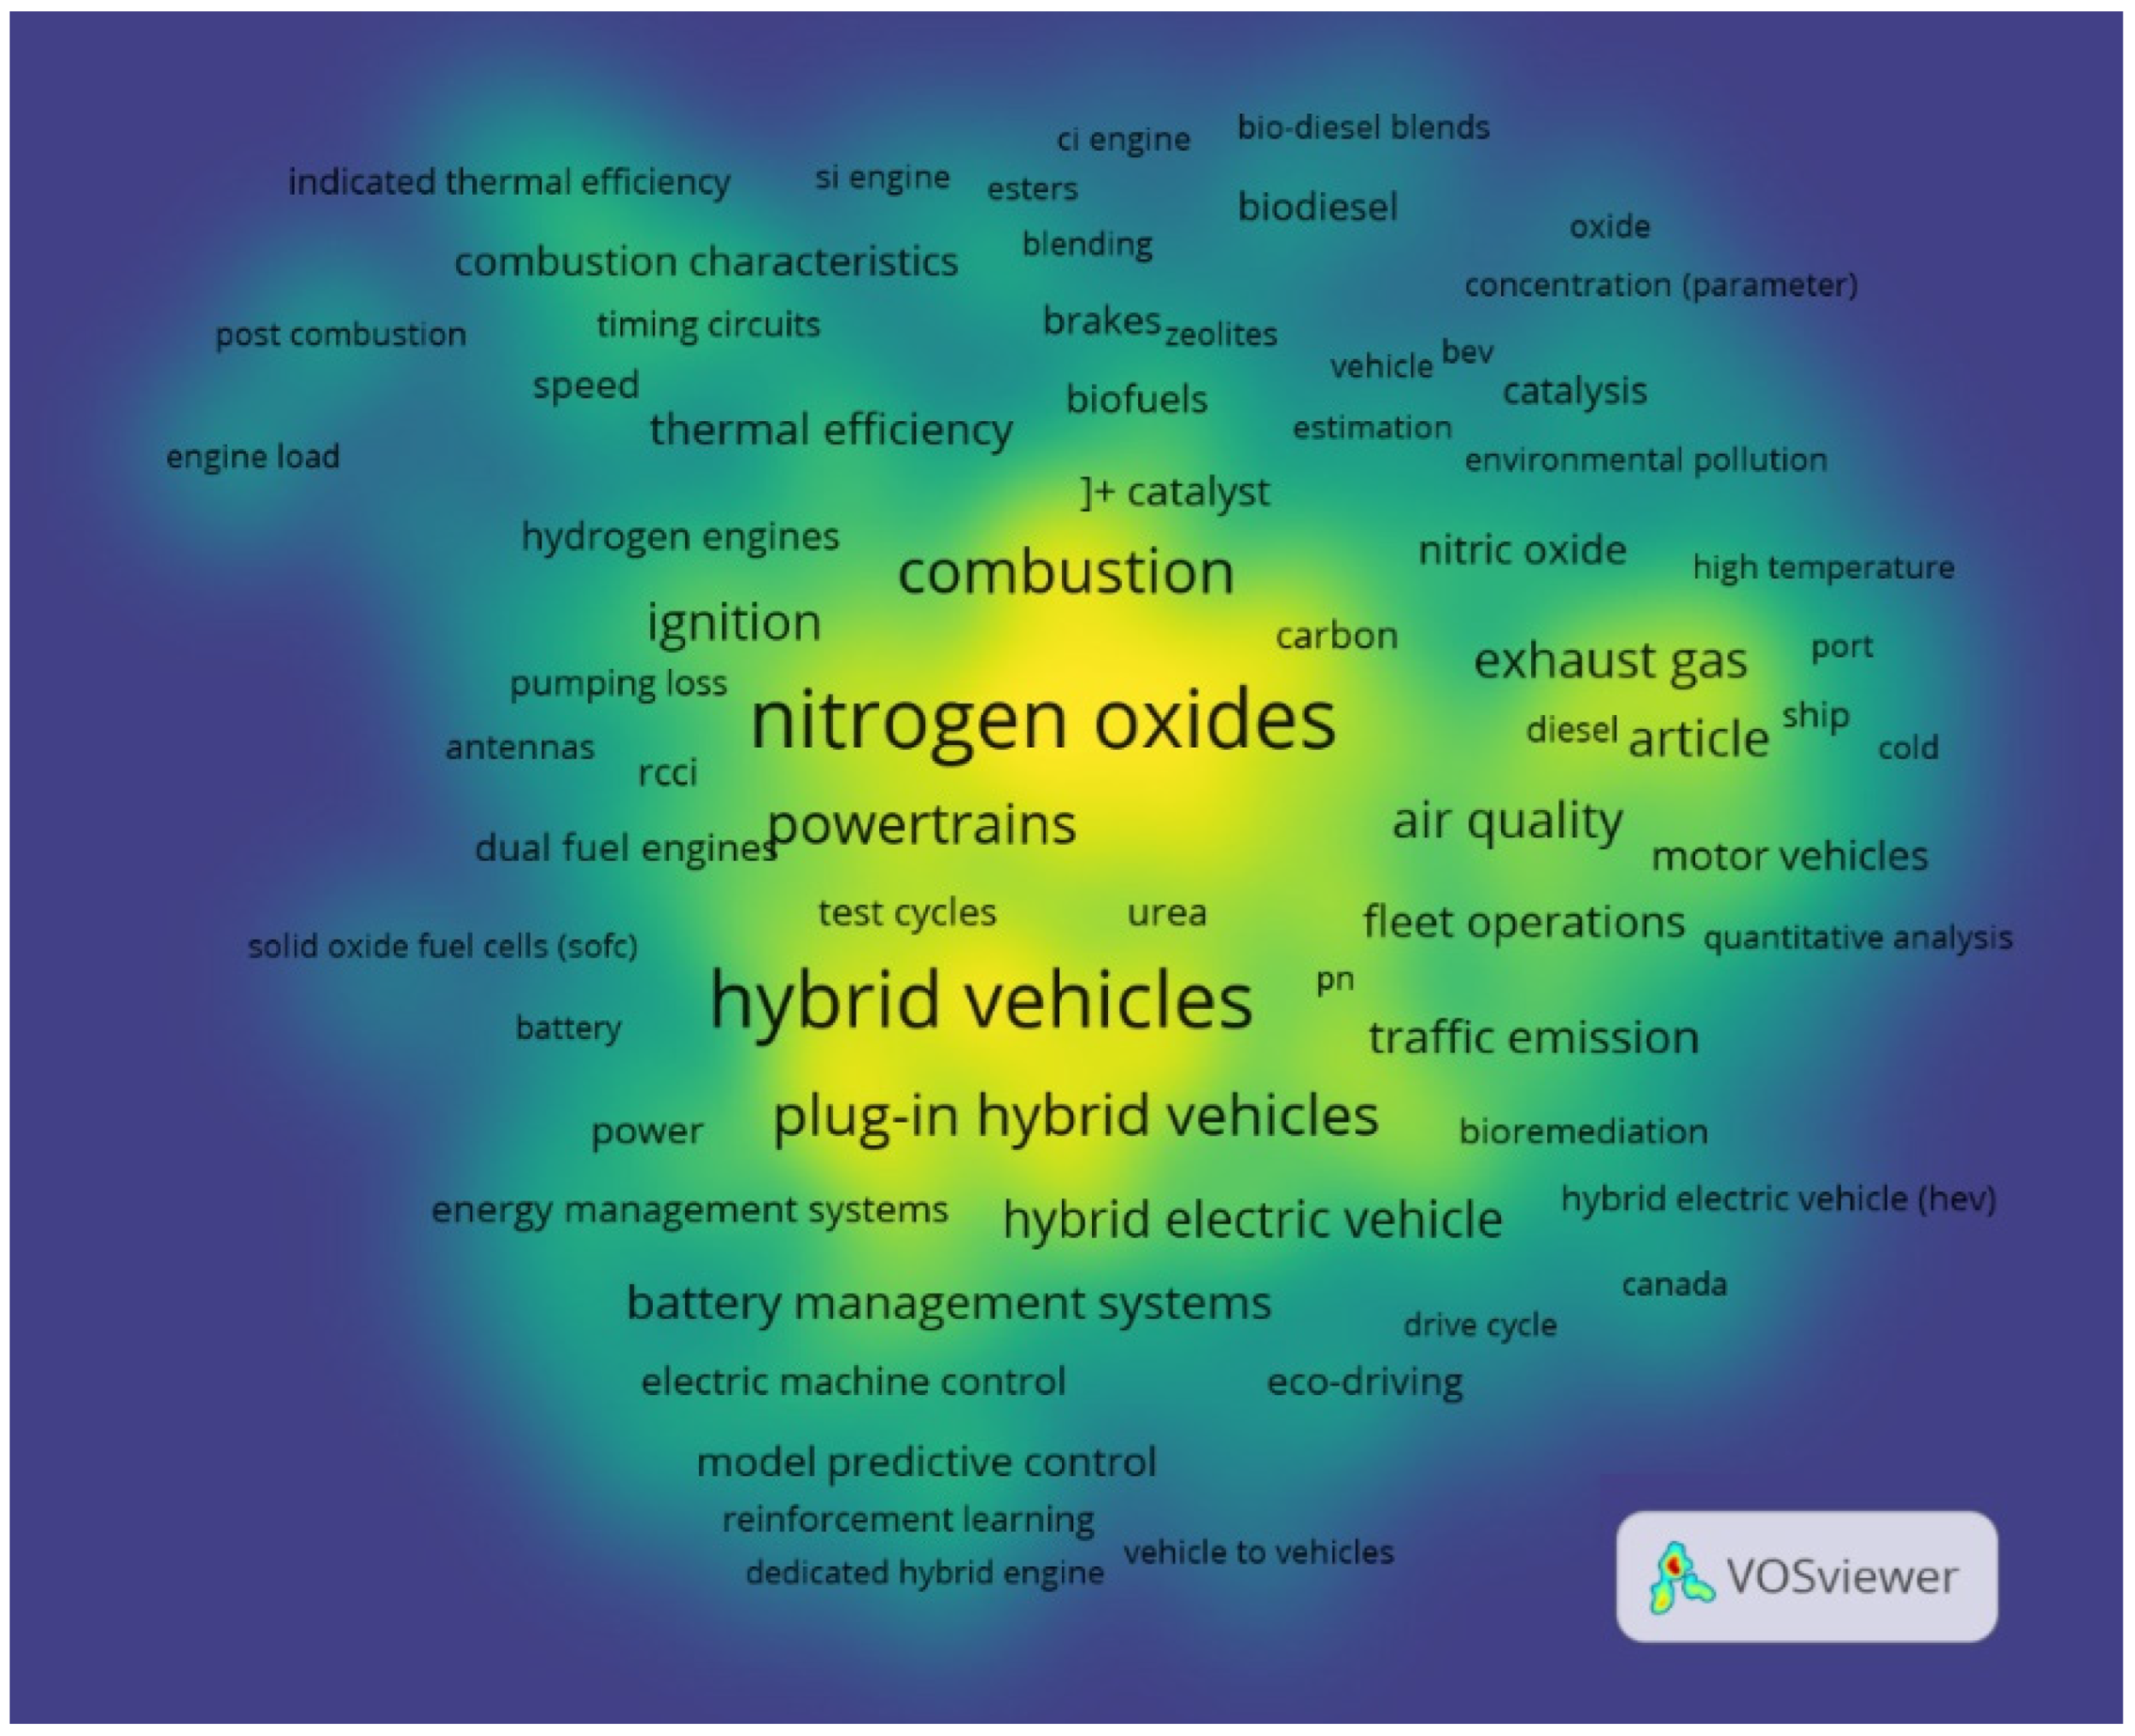
The yellow areas on the map mark high concentrations of terms, indicating the most frequently addressed topics, while the green and blue areas signal less frequent themes. The core terms with the highest density are “nitrogen oxides”, “hybrid vehicles”, “plug-in hybrid vehicles”, “combustion”, “air quality”, and “exhaust gas”, which shows that research focuses on the relationship between NOx emissions, hybrid technologies, and environmental impact. In addition to the thematic core, terms such as “battery management systems”, “eco-driving”, “biofuels”, “hydrogen engines”, or “reinforcement learning” appear, suggesting interest in optimising performance and reducing emissions through intelligent control, alternative fuels, and emerging technologies, as shown in Figure 4.
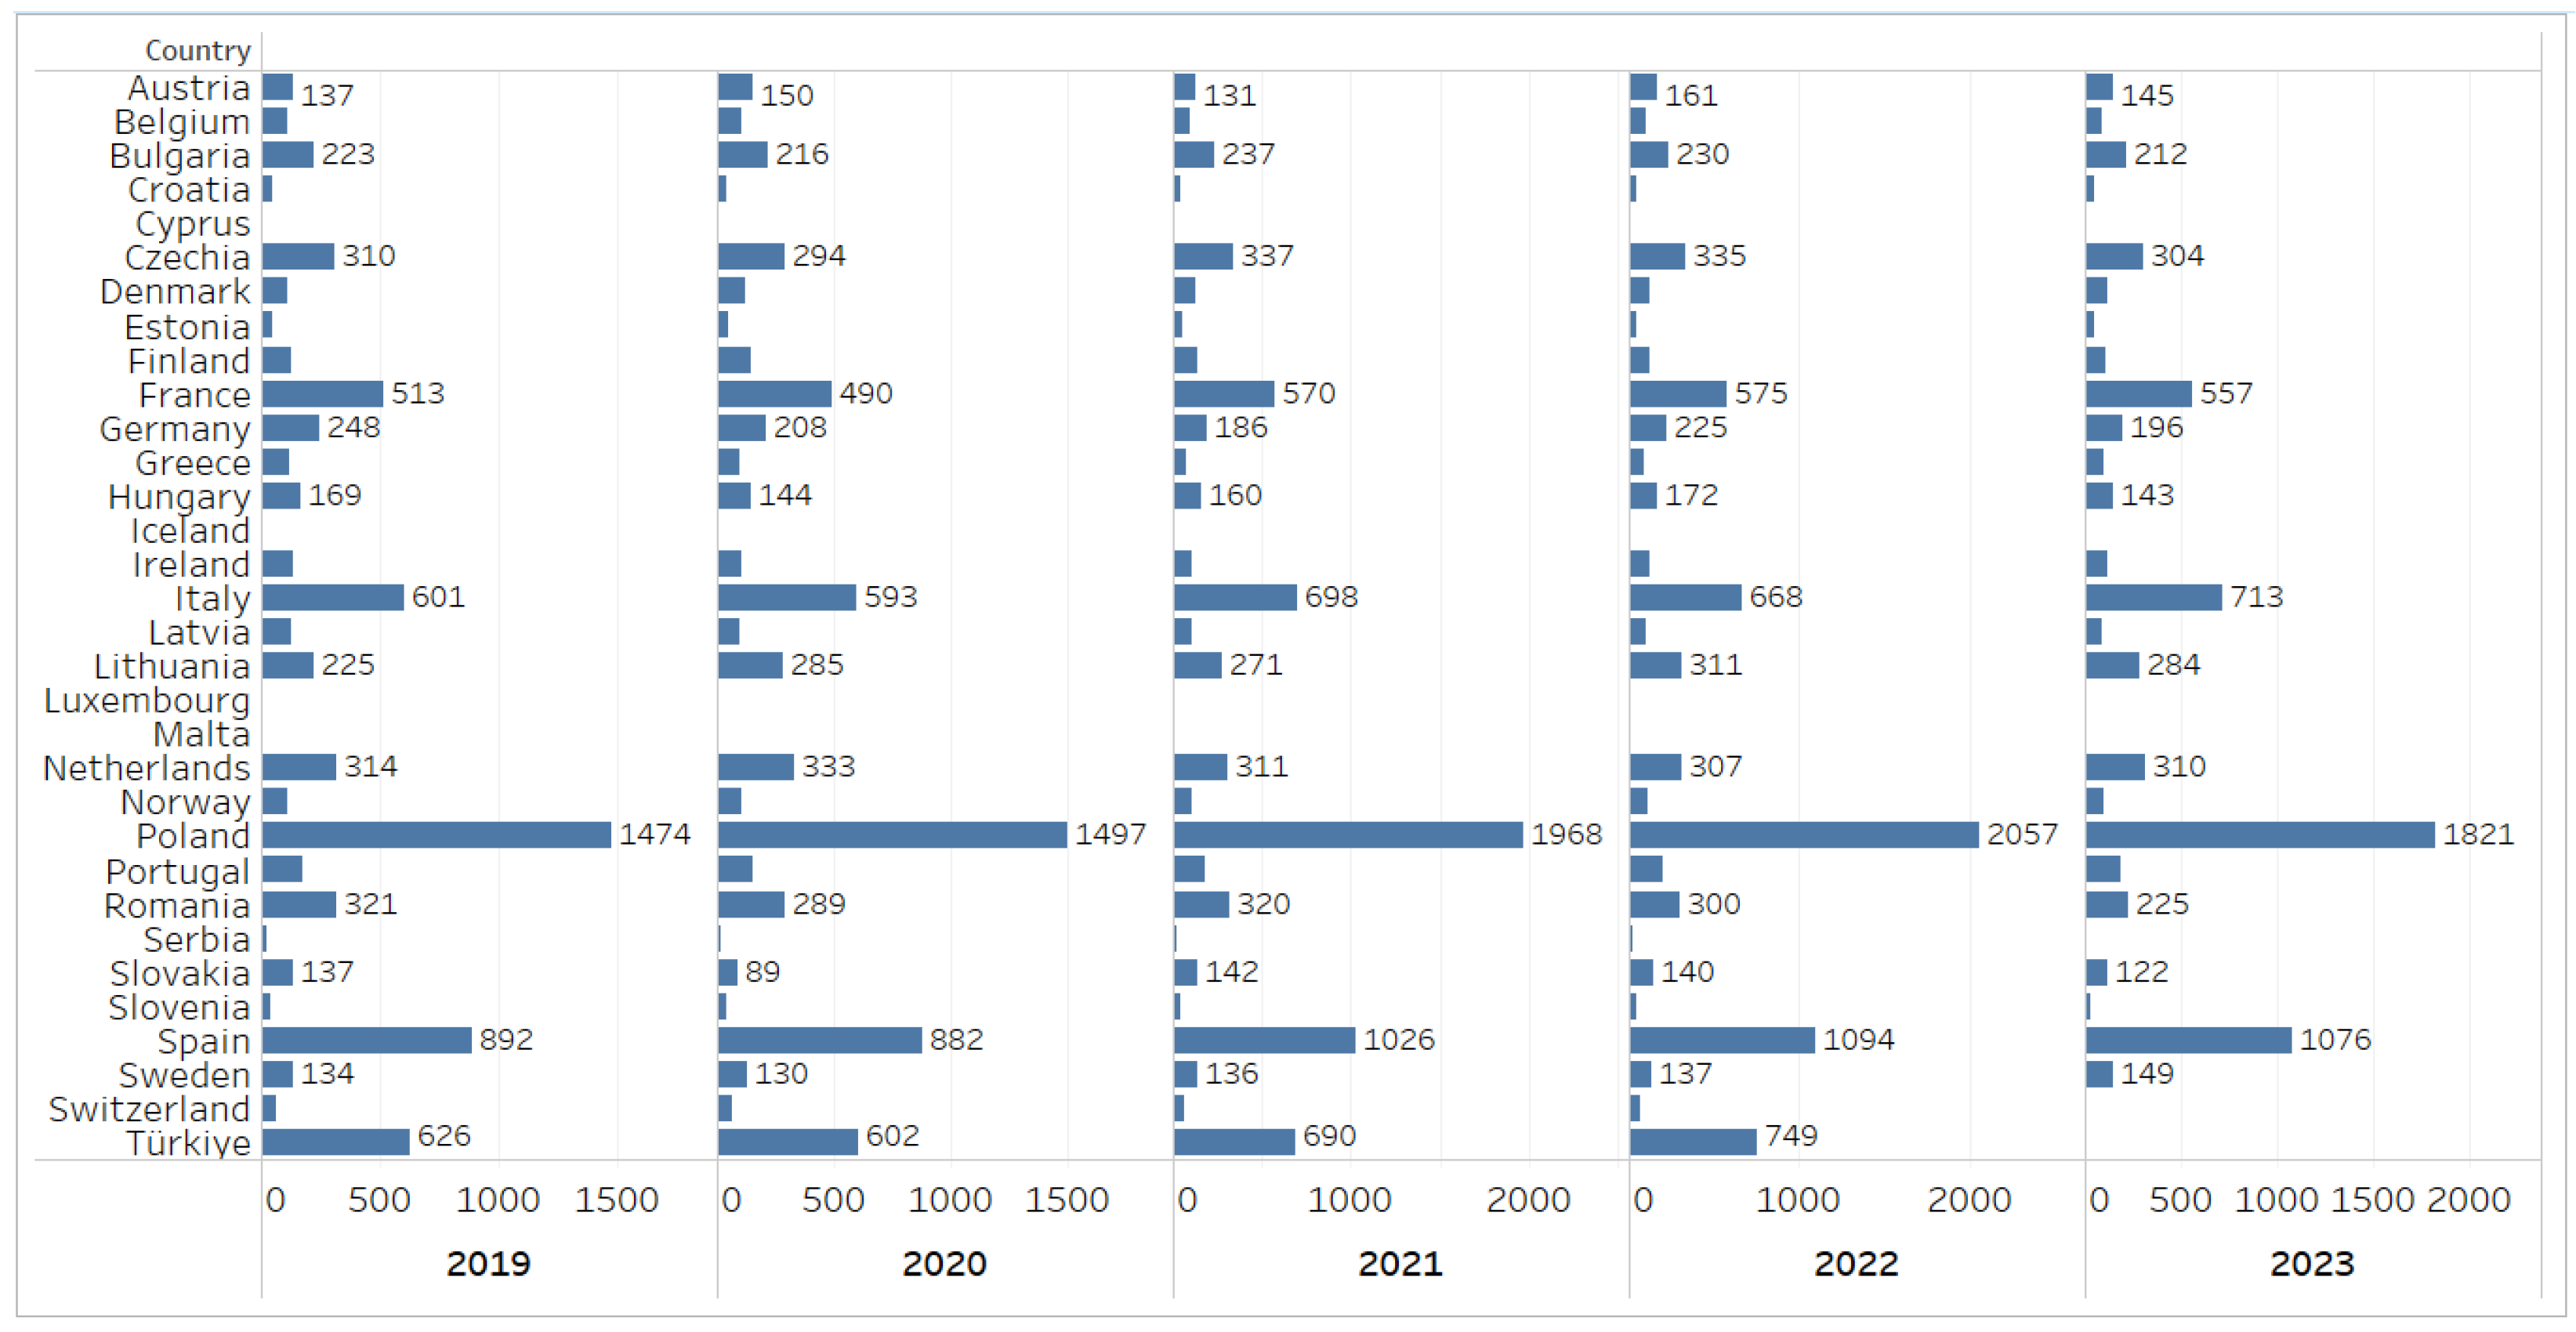
The graph highlights the dynamics of N2O emissions (expressed in tons) in several European countries between 2019 and 2023, outlining significant structural differences between countries, as shown in Figure 5.
Poland consistently records the highest values, with an increase from around 1474 tonnes in 2019 to a peak of around 2057 tonnes in 2022, which corresponds to an increase of around 39–40%. In 2023, a decrease to around 1821 tonnes is observed (11% compared to 2022), which is still more than 20% higher than in 2019. A second group of countries, including Spain, Italy, France, and Türkiye, show high levels, but significantly lower than Poland. In the case of Italy and France, the cumulative increases over the period 2019–2022 are estimated at around 15–20%, followed by a stabilisation or slight contraction in 2023, suggesting a possible effect of structural adjustments or emission reduction measures.
Overall, the period 2020–2022 is characterised by a generalised upward trend, with percentage growth rates in most cases between 10% and 30%, depending on the country. The year 2023 marks a partial reversal of the trend, with most countries recording decreases of between 5% and 15% compared to the previous year. Countries with low absolute emission levels, such as Luxembourg, Malta, and Iceland, show limited variations in absolute terms, but may show relatively more pronounced percentage fluctuations due to the low initial base. Structural differences remain considerable: in the peak year (2022), the emission level in Poland is around two to three times higher than in countries such as Romania or the Netherlands, indicating a strong polarisation of the distribution of N2O emissions at European level (Figure 5).
The EU average for N2O emissions is 266.4 t and represents 14.62% of Poland’s emissions in 2023. Compared to 2014, the EU average for N2O emissions has increased by 51.55%. N2O emissions from Spain, the second largest emitter, represent 58.81% of the emissions from the largest emitter, Poland, in 2023.
The annual average of N2O emissions reflects the central tendency of the data for all Member States. Its evolution shows an increase from 175.78 t in 2014 to a peak of 285.34 t in 2022, followed by a slight decrease in 2023 to 266.40 t. The long-term increase suggests the intensification of transport activities or the lack of effective measures to reduce emissions, and the decrease in the last year may be correlated with the implementation of green transition policies or temporary economic factors Table 1. The standard error, an indicator of the precision of the mean estimate, shows moderate values between 2014 and 2018, followed by a sharp increase after 2019, reaching over 80 in 2021–2022. This increase reflects a growing dispersion between national emission values and suggests an increase in heterogeneity within the European Union, which may signal significant differences in transport infrastructure, electrification levels, or environmental policies Table 1.
The median, less influenced by extreme values, is consistently below the arithmetic mean, indicating a positively skewed distribution; most states have emissions below the average, while a few states with very high values push the average up. The increase in the median since 2016 shows that not only the states at the top of the distribution, but also those in the central area have recorded increases in emissions. The standard deviation measures the dispersion of the data from the annual mean. Until 2018, the values were relatively stable (~160–190), but after this year an accelerated increase was observed, reaching 425.79 in 2022. This steep increase indicates an increased polarisation between states with low emissions and those with very high emissions, which can be interpreted as an imbalance in the adoption of emission reduction technologies, as shown in Table 1.
The variance, being the square of the standard deviation, numerically emphasises the variation between values. Its exponential increase after 2019 confirms and amplifies the conclusions related to the dispersion of the data, indicating that interstate differences in emissions have become a dominant feature of the recent period. Kurtosis describes the shape of the distribution of values relative to a normal distribution. In the period 2014–2016, values of 1.3–1.8 indicated platykurtic distributions, with values more evenly dispersed. After 2017, the jump to values above 8–11 indicates a leptokurtic distribution, characterised by pronounced peaks and the presence of extreme values that dominate the distribution. This change suggests the emergence of a small group of states with disproportionately high emissions, as shown in Table 1.
The positive skewness of the distribution is present throughout the period, with values increasing from 1.49 to over 3. This confirms that most states have emissions below average, but there are a few states that exceed this value several times. The increase in skewness after 2018 shows that the gap between these two groups has widened (Table 1).
The difference between the maximum and minimum increases steadily from 609.74 t in 2014 to over 2000 t in 2022, highlighting a widening gap between the most and least polluting states. The sharp increase after 2019 reflects the emergence of record emissions in states at the upper end of the distribution, while the minimum values have remained almost constant. The annual minimum value, located in the range of 0.96–1.57, indicates the constant presence of states with very low N2O emissions from transport. The stability of this indicator suggests an already optimised transport infrastructure and policies in these states, with limited possibilities for further reduction. The maximum value of emissions per state increases from 610.7 t in 2014 to over 2050 t in 2022, reflecting a disproportionate increase in countries at the upper end of the distribution. This development is responsible, together with the increase in the median, for the polarisation observed in the other dispersion indicators, as shown in Table 1.
The sum of emissions for all EU countries increases from 4746.12 t in 2014 to a peak of 7704.25 t in 2022, which represents an increase of over 62% in less than a decade. This aggregate trend indicates that, despite technological progress, the increase in the total volume of transport has exceeded the effects of emission reduction measures. The constant number of 27 confirms the stability of the dataset and the interannual comparability of the values. This aspect ensures the integrity of the analysis and the relevance of the statistical conclusions, as shown in Table 1.
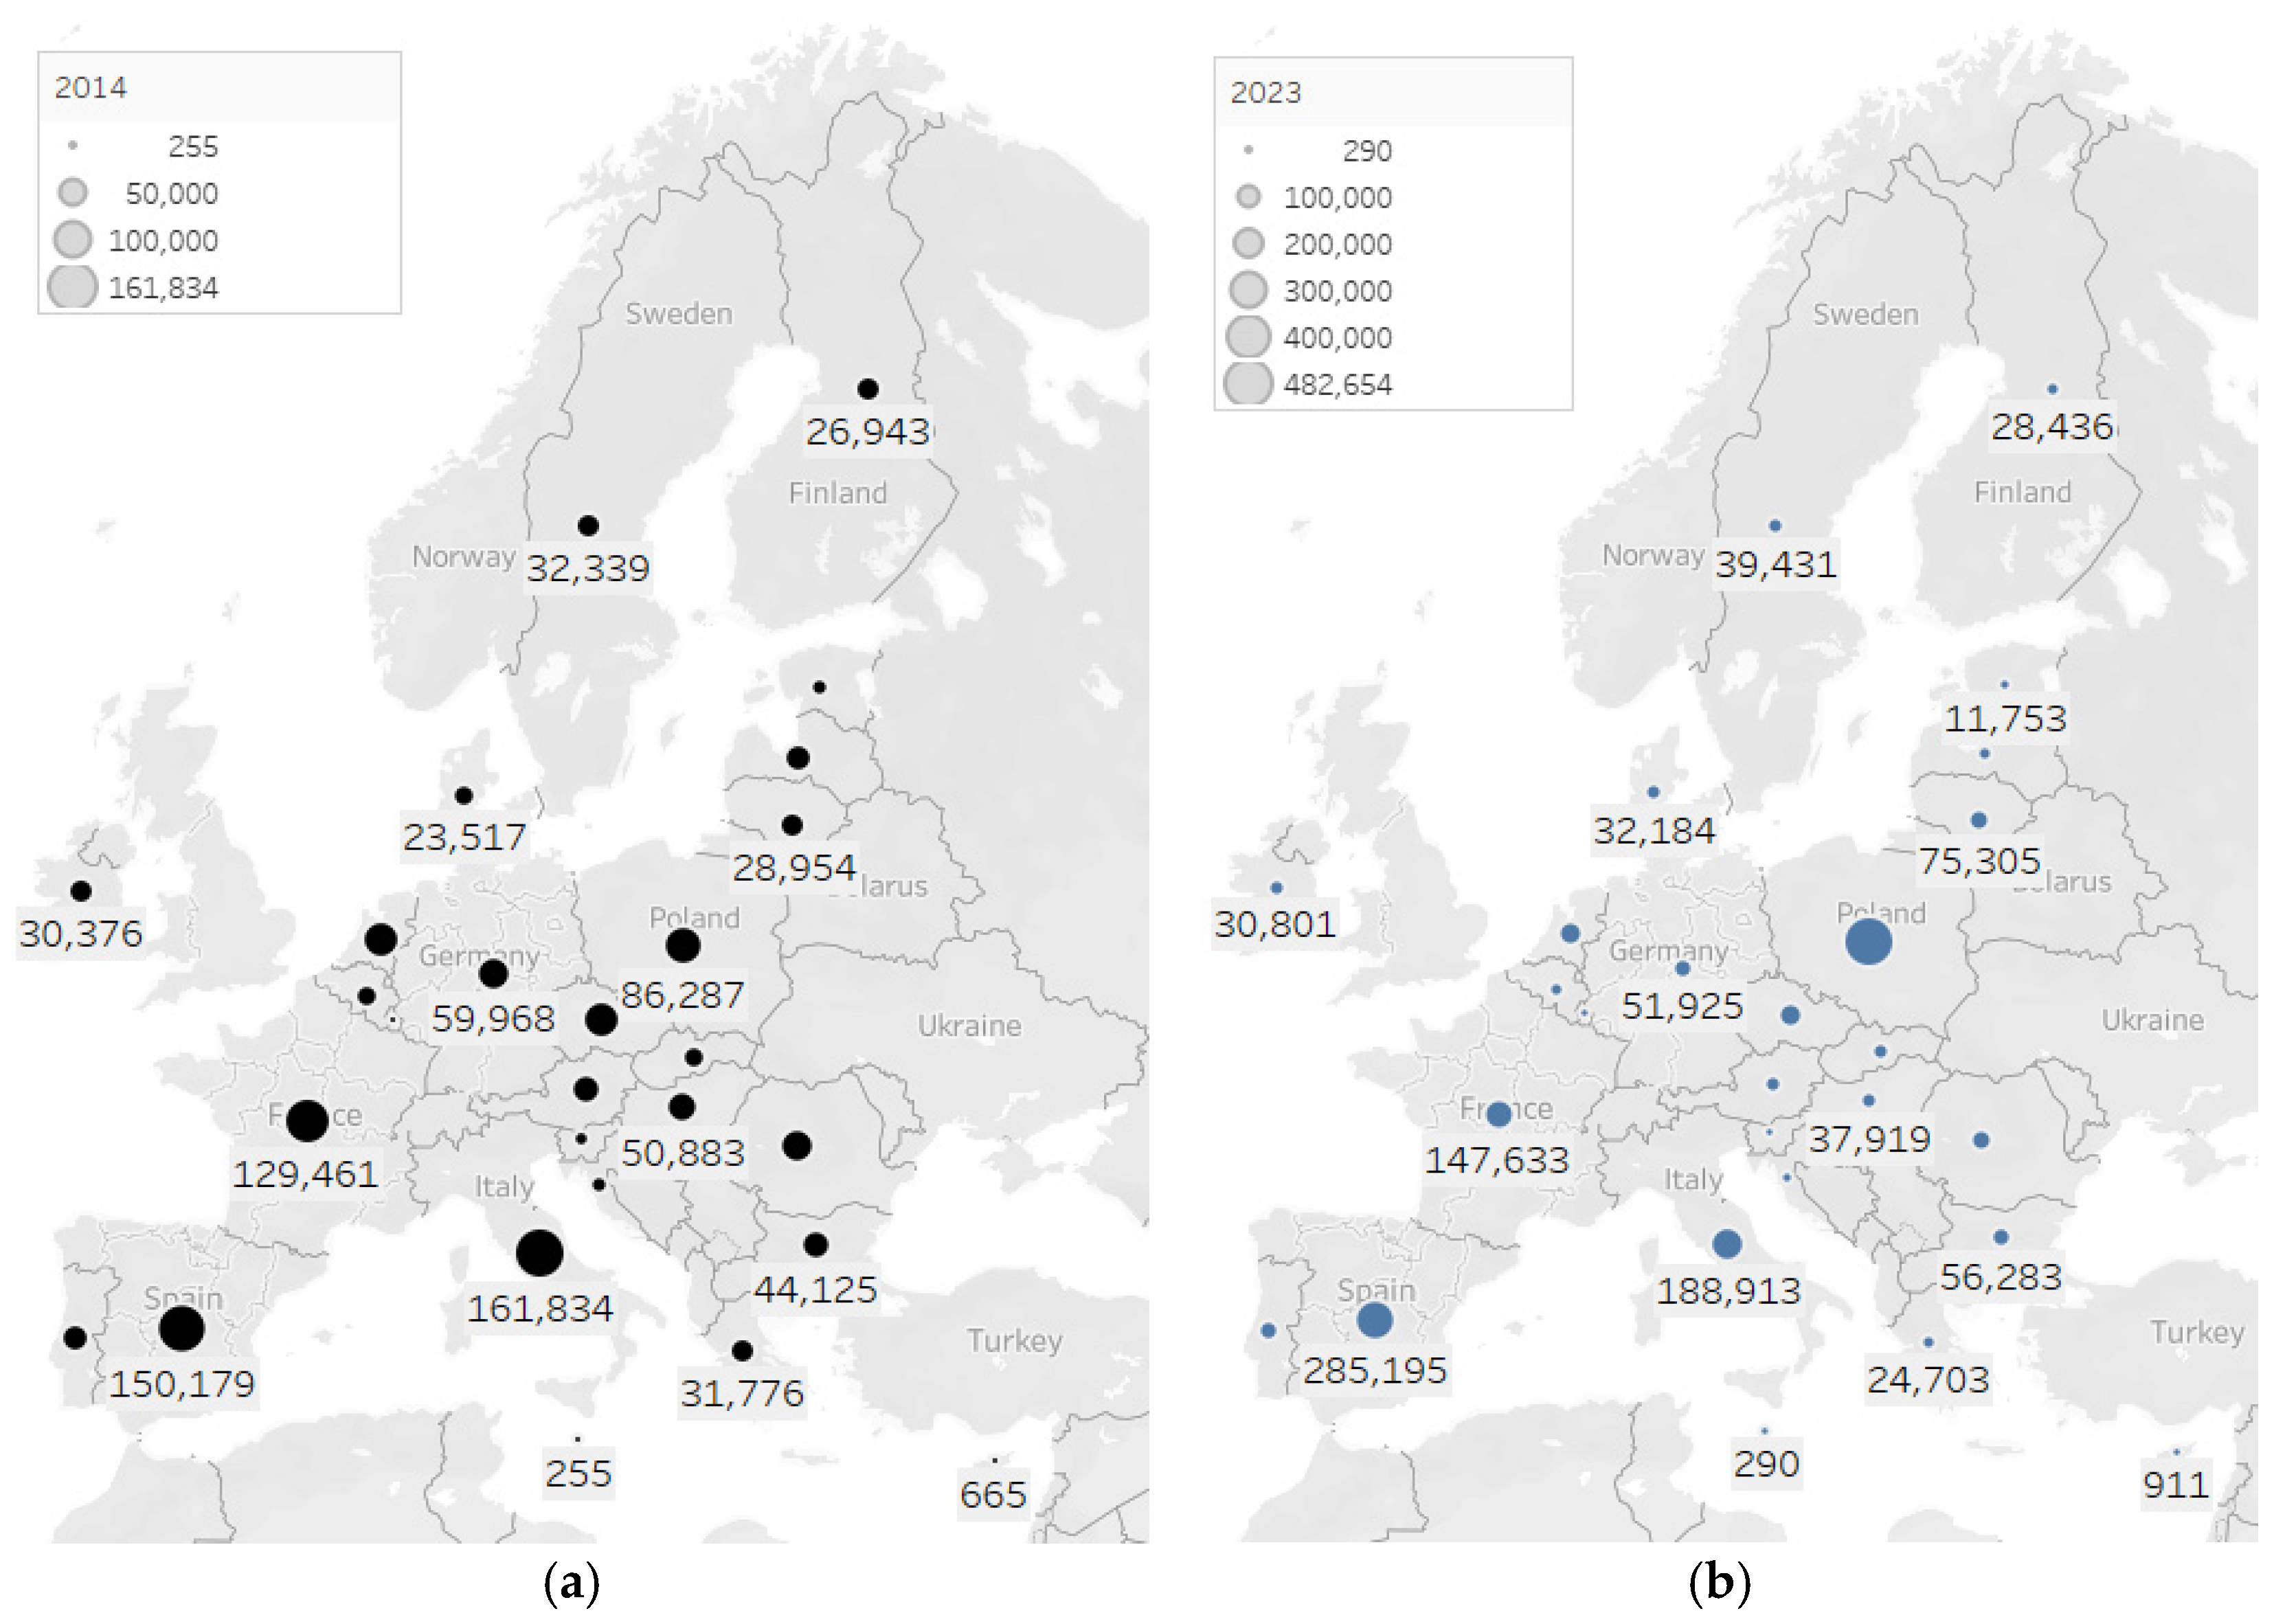
Figure 6 reveals a notable rise in N2O emissions (CO2 equivalent) from land transport and pipelines across most EU Member States between 2014 and 2023, signalling an intensification of transport-related pollution. Poland experienced the sharpest increase, reaching ~482,654 t CO2 eq., suggesting inefficient emission controls in its expanding road and pipeline infrastructure, which may require targeted policy interventions. Spain and Italy also show substantial growth, indicating that heavy vehicle traffic and pipeline expansion are major drivers of N2O emissions in these economies.
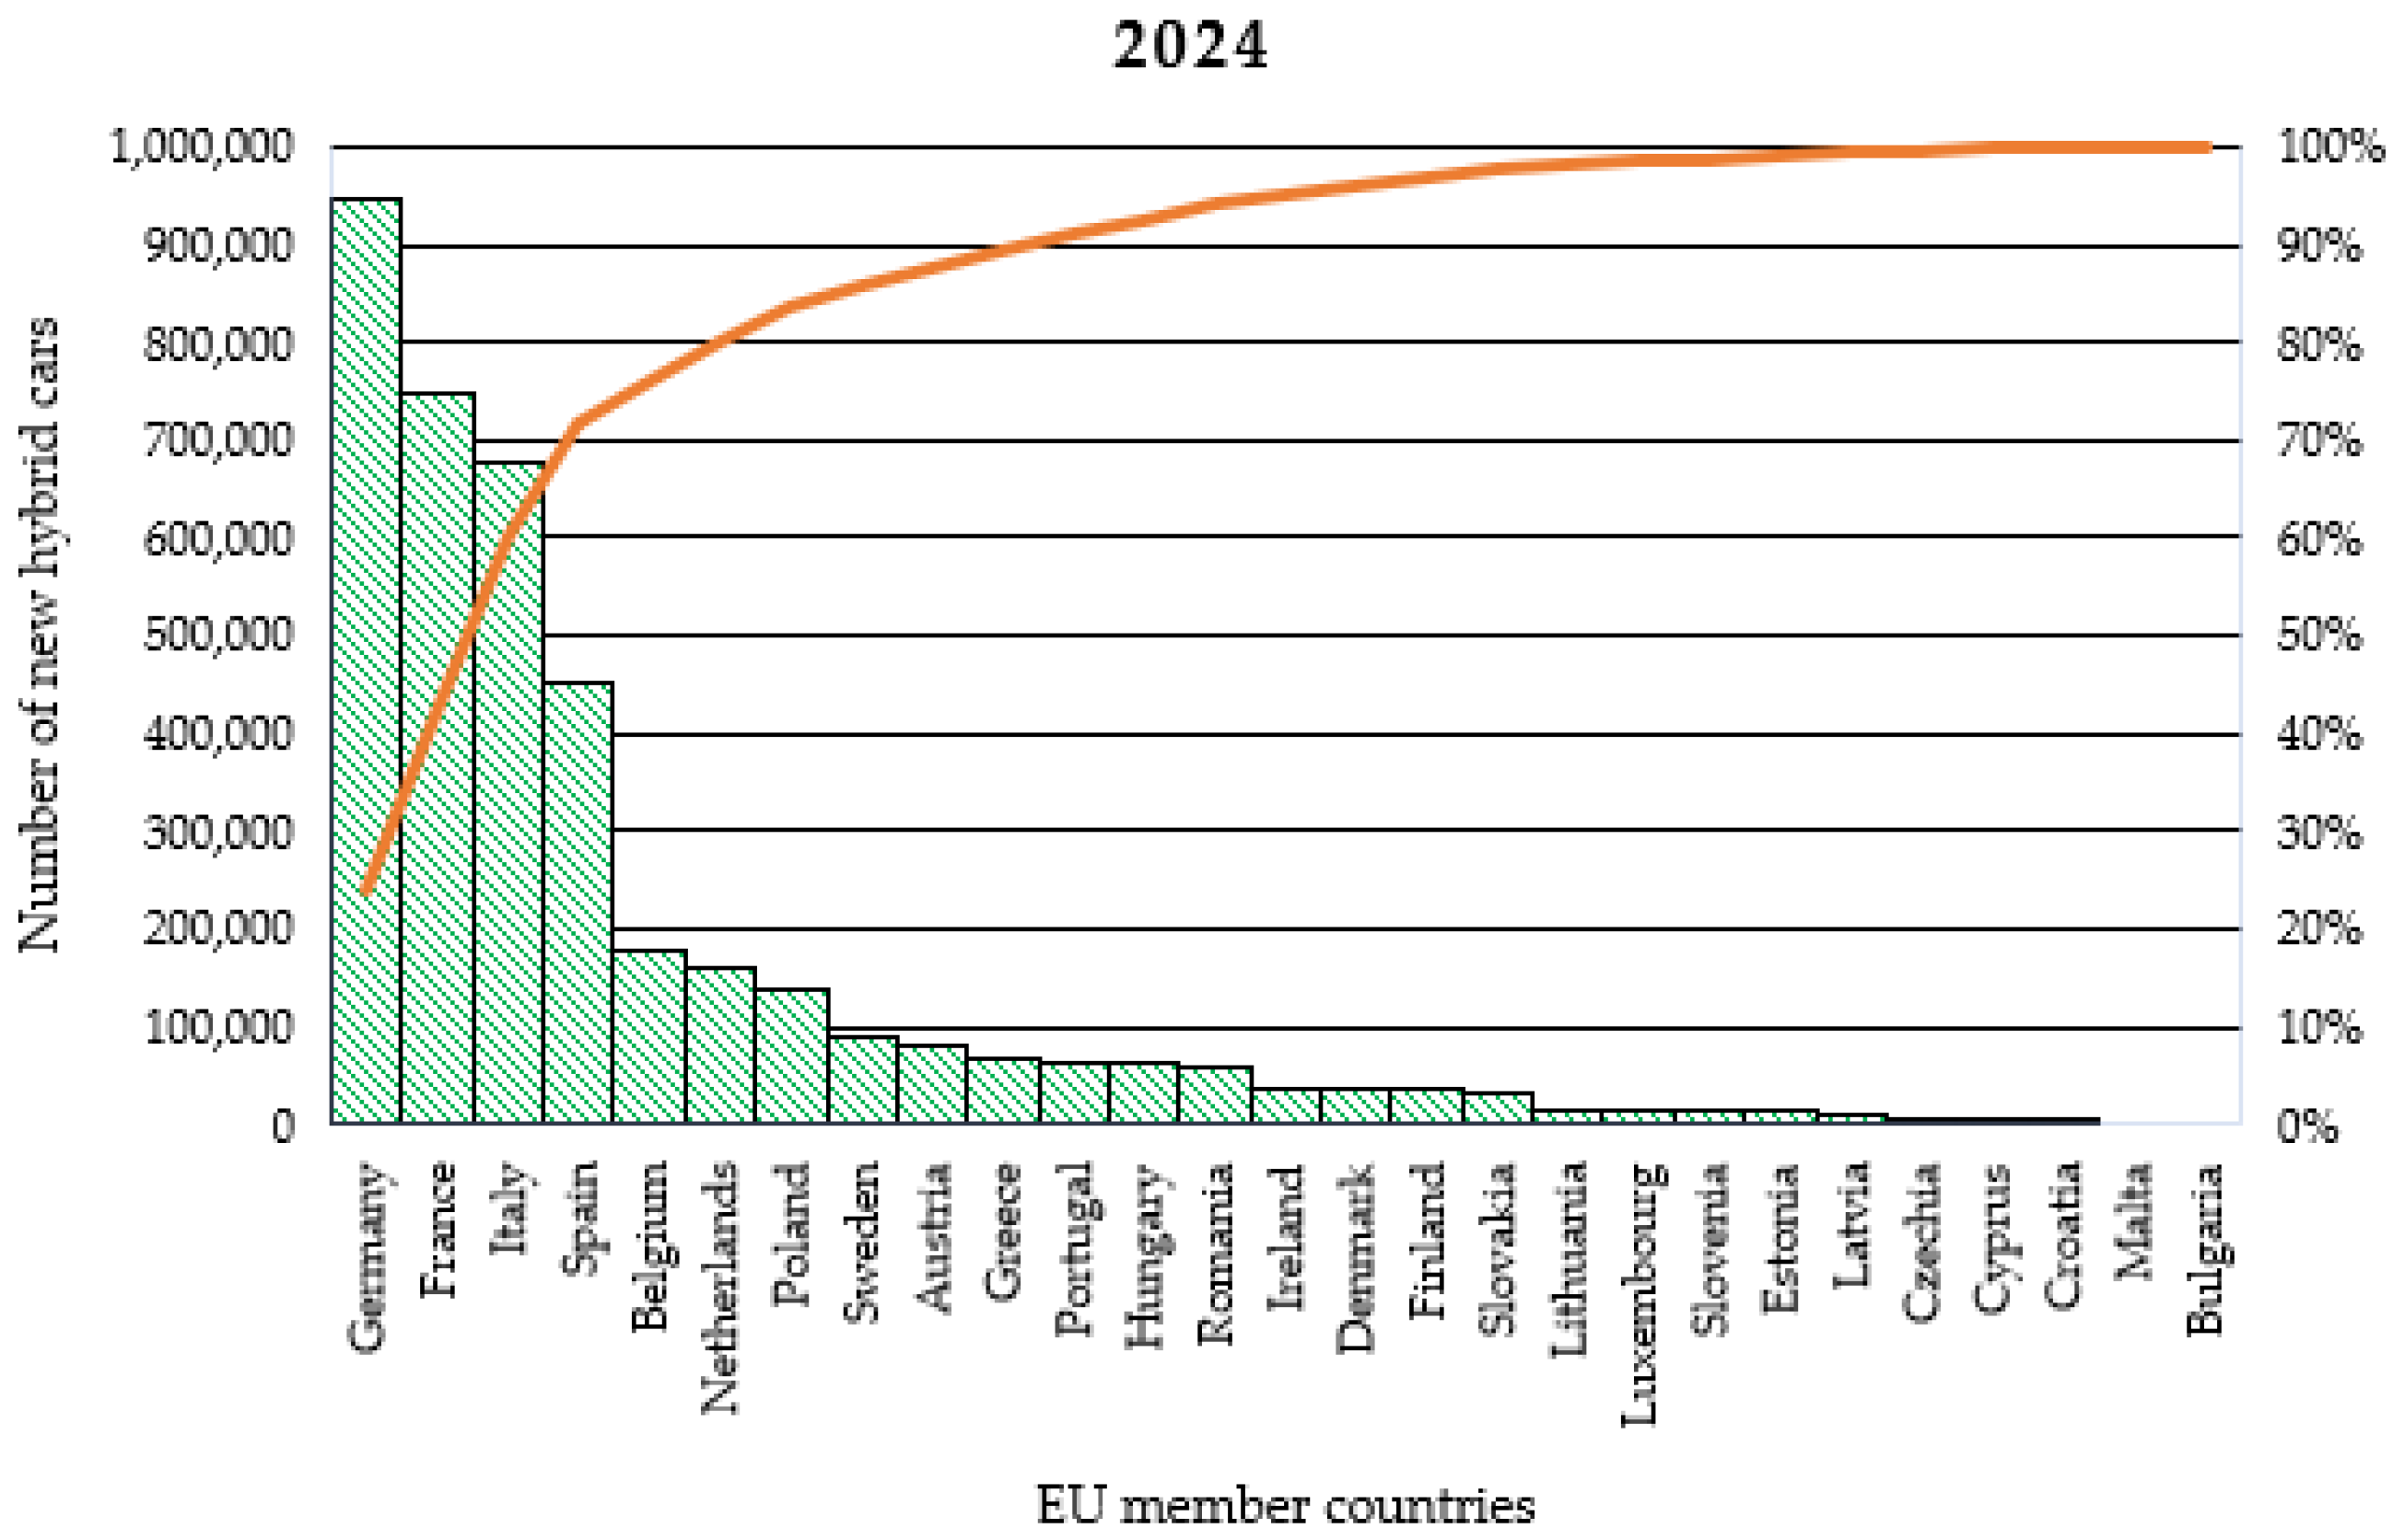
The spatial distribution underscores that emission trends are influenced by traffic intensity, heavy vehicle shares, and pipeline development. Notably, Malta, Luxembourg, and Cyprus maintain low emissions due to limited transport volumes and stricter national regulations, serving as benchmarks for emission management in smaller jurisdictions. These findings highlight the need for EU policies to address sector-specific mitigation strategies, especially in high-emitting countries Figure 6. In 2024, the EU’s hybrid vehicle market exhibits stark disparities, with Germany, France, and Italy dominating registrations (947,389, 746,816, and 675,313 units, respectively), accounting for over 65% of the total, as shown in Figure 7.
This concentration reflects structural advantages in Western Europe, including mature infrastructure, robust incentives, and higher purchasing power, which accelerate adoption. In contrast, Eastern Europe shows minimal uptake, likely due to weaker policy frameworks and economic constraints. The Pareto curve underscores this imbalance: a few states drive the transition, while others lag, necessitating targeted EU policies to address regional disparities and foster inclusive green mobility, as shown in Figure 7.
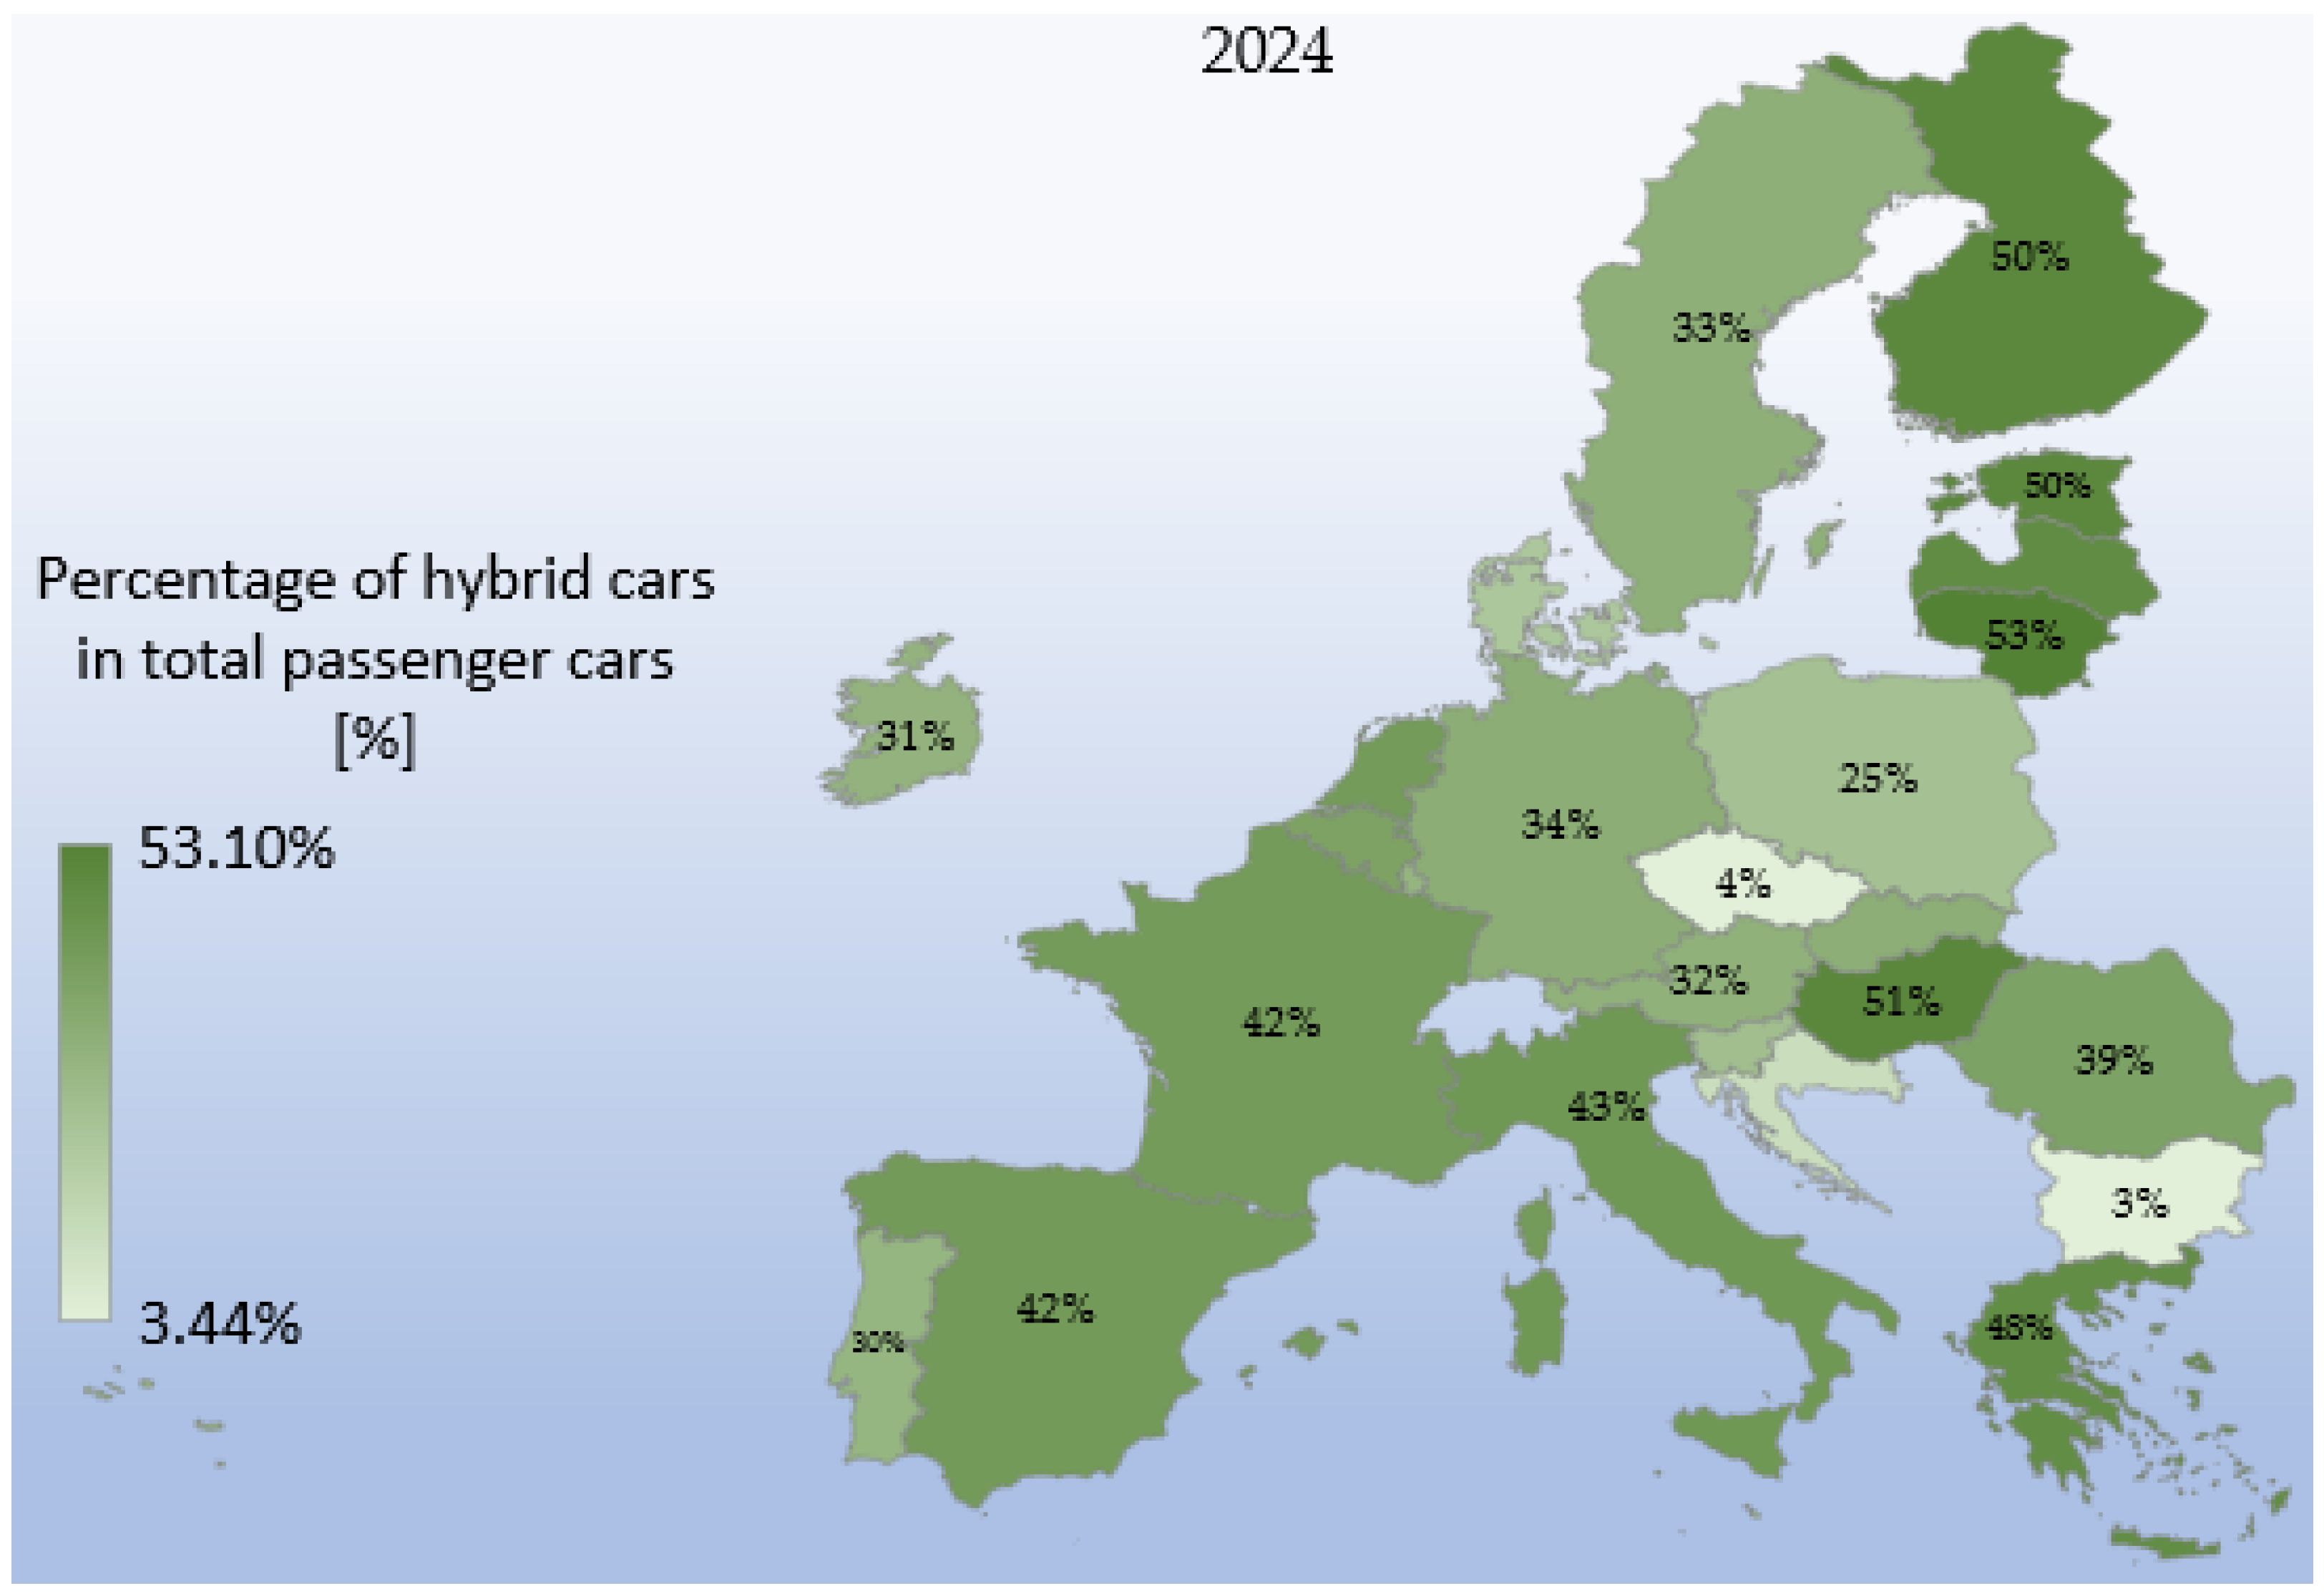
The Baltic states, Finland, Hungary, and Cyprus exceed EU averages (~50% hybrid share), driven by aggressive tax incentives, small fleet sizes enabling rapid shifts, and access to affordable Western used hybrids. This suggests policy agility and market adaptability can accelerate adoption in smaller or emerging markets, as shown in Figure 7.
In countries like Germany, Belgium, France, Spain, and the Netherlands (35–42% hybrid share), moderate hybrid adoption reflects strategic diversification amid a mature market and shifting focus to full electrification, where hybrids serve as transitional tools. Conversely, Bulgaria, Czechia, and Croatia (<15% hybrid) exemplify structural bottlenecks: low incomes, aging fleets reliant on cheap conventional imports, and underdeveloped infrastructure, highlighting the need for targeted EU investment and policy alignment to prevent a two-tier green transition, as shown in Figure 8.
In most countries, hybrids are not the end of the road, but an intermediate step towards full electrification.
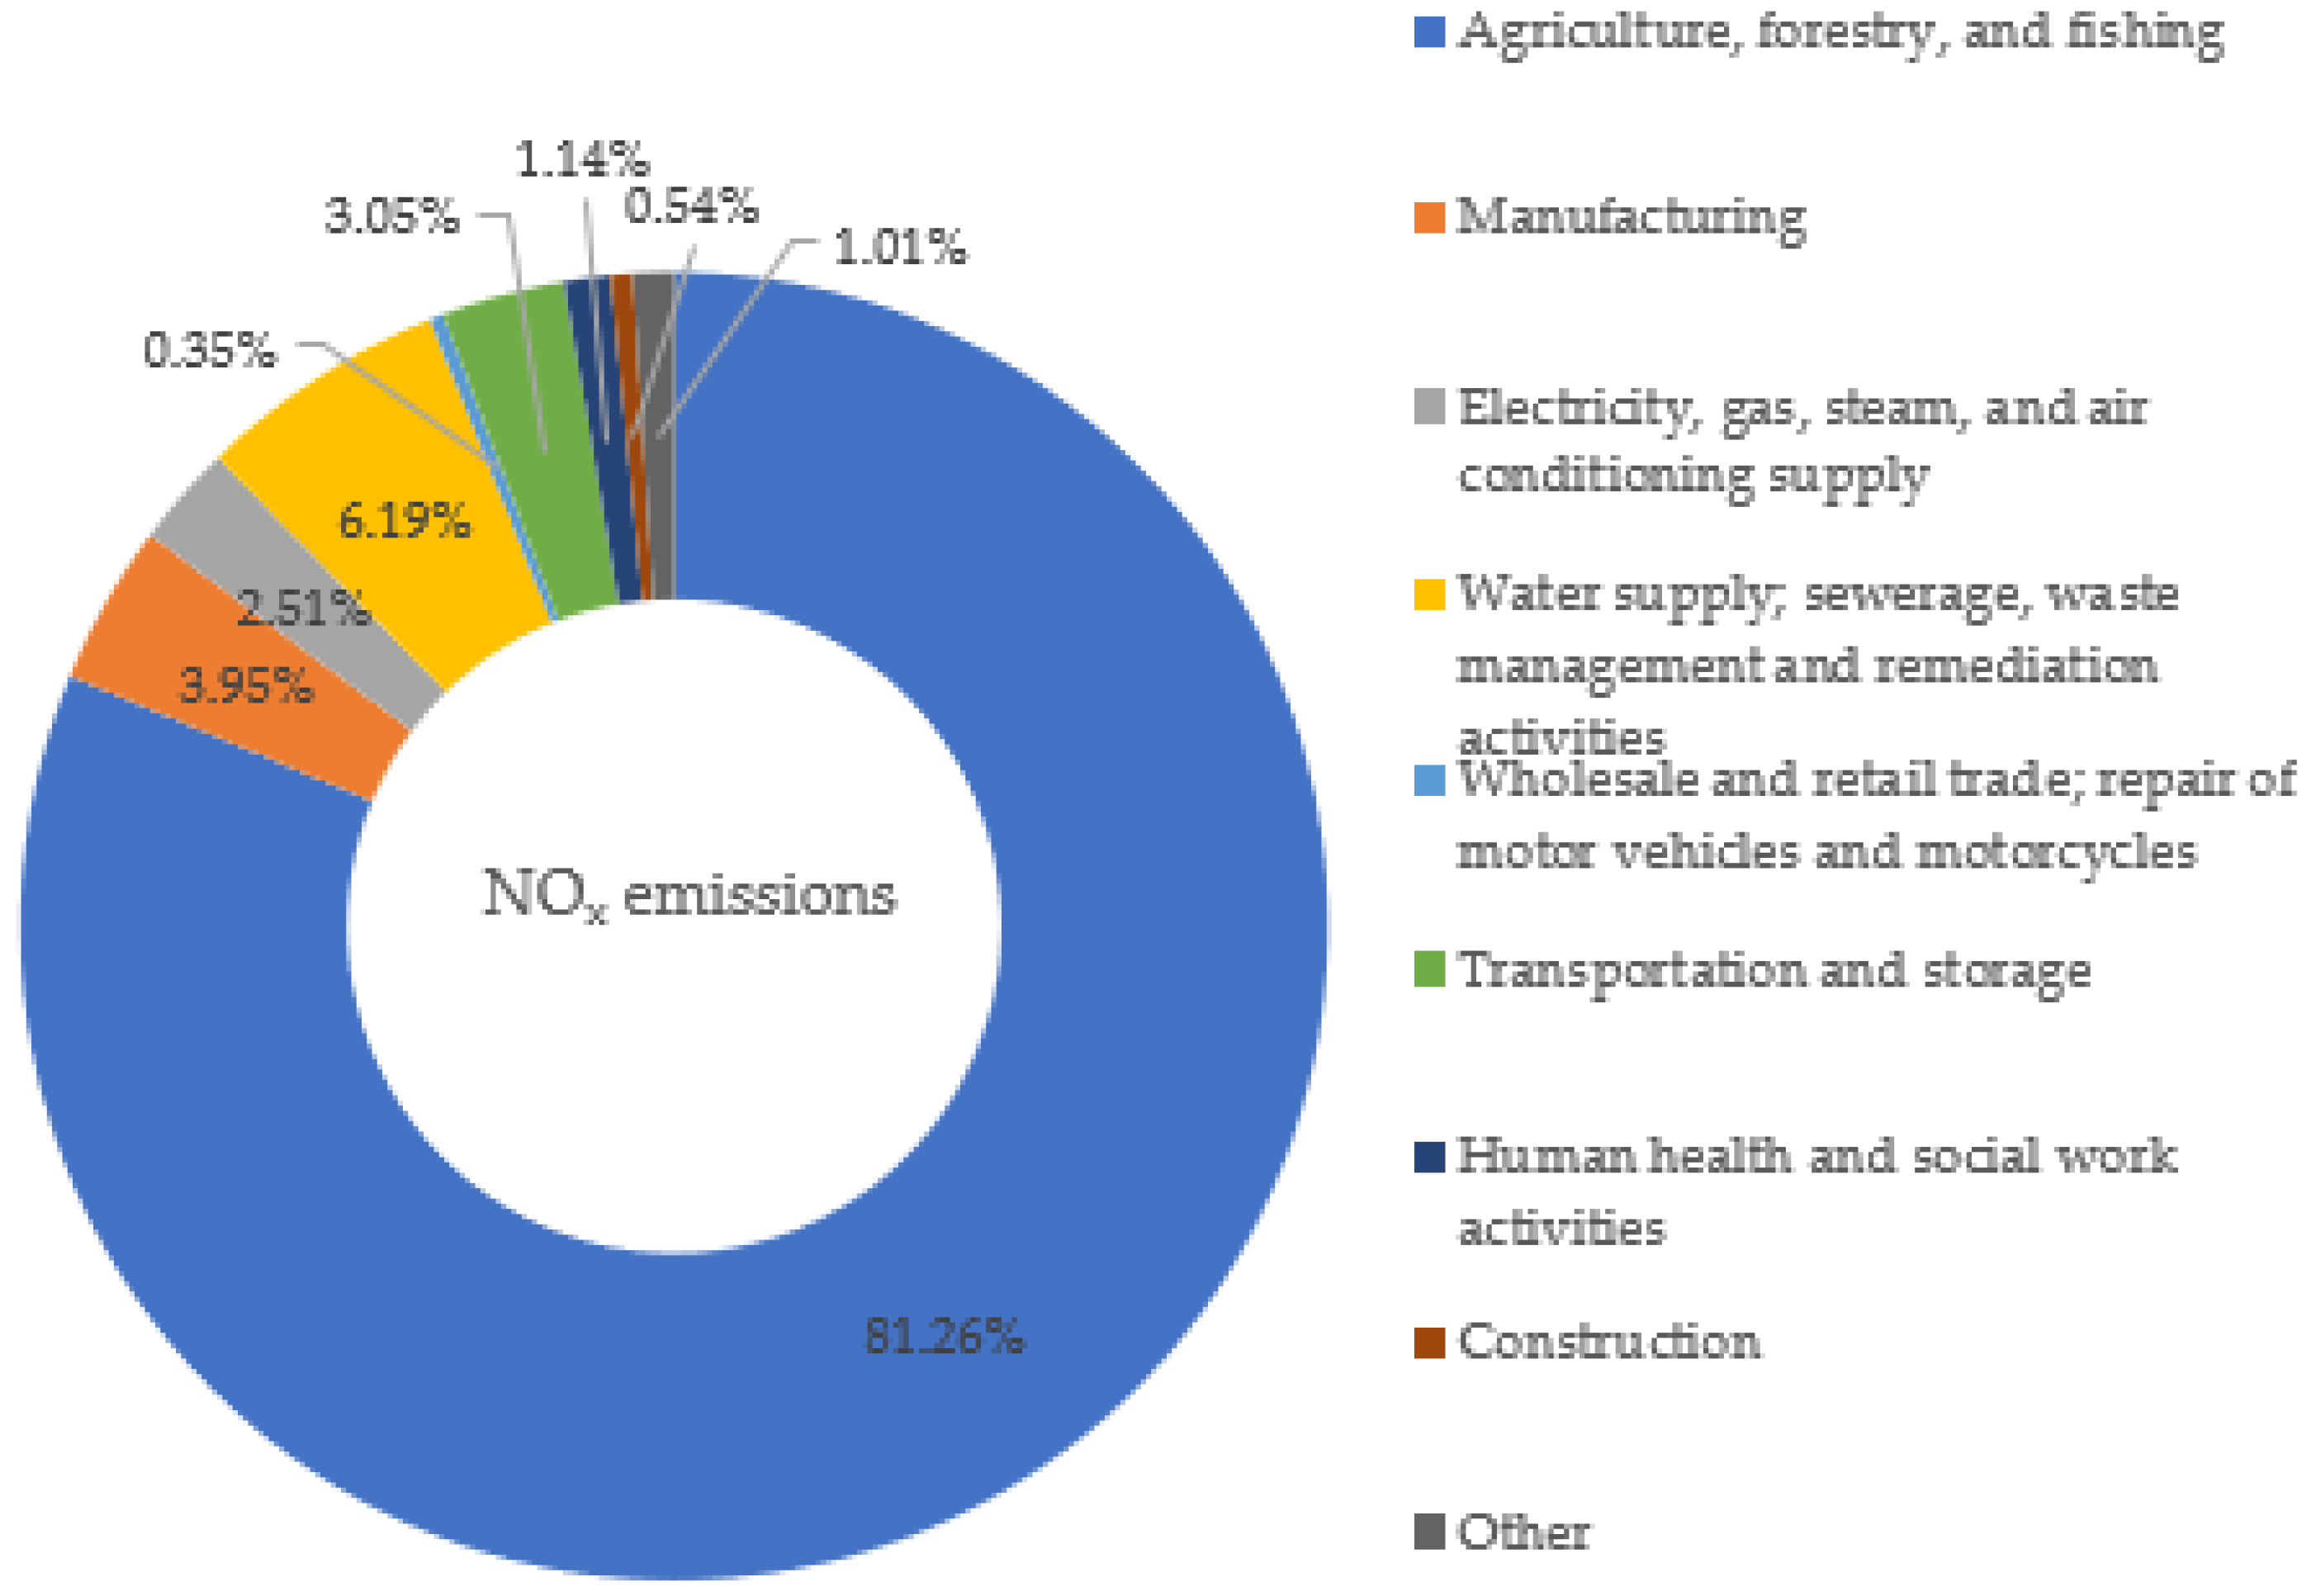
The sectoral breakdown of nitrogen oxides emissions reveals a highly skewed distribution, with “Agriculture, forestry, and fishing” accounting for an overwhelming 81.26% of total emissions. The high share most likely comes from agricultural activities, especially fertilizer application and animal waste management, processes that favour the formation of nitrogen oxides through microbial nitrification–denitrification mechanisms and through photochemical reactions in the atmosphere. The contributions of other sectors are considerably lower, the most visible being those of the “Water supply, sanitation, waste management and remediation activities” sector (6.19%) and the manufacturing industry (3.95%), mainly because of combustion and thermal treatment processes. The “Transport and storage” (3.05%) and “Electricity, gas, steam and air conditioning production and supply” (2.51%) sectors are correlated with the use of fossil fuels, while construction, retail trade, medical services, and other activities have values below 1.5%, as shown in Figure 9.
This distribution indicates that emissions reduction measures should be primarily focused on the agricultural sector, and these interventions should be complemented by technological upgrades and regulatory adjustments in industries and the energy sector, to achieve a significant reduction in total NOx emissions, as shown in Figure 9.
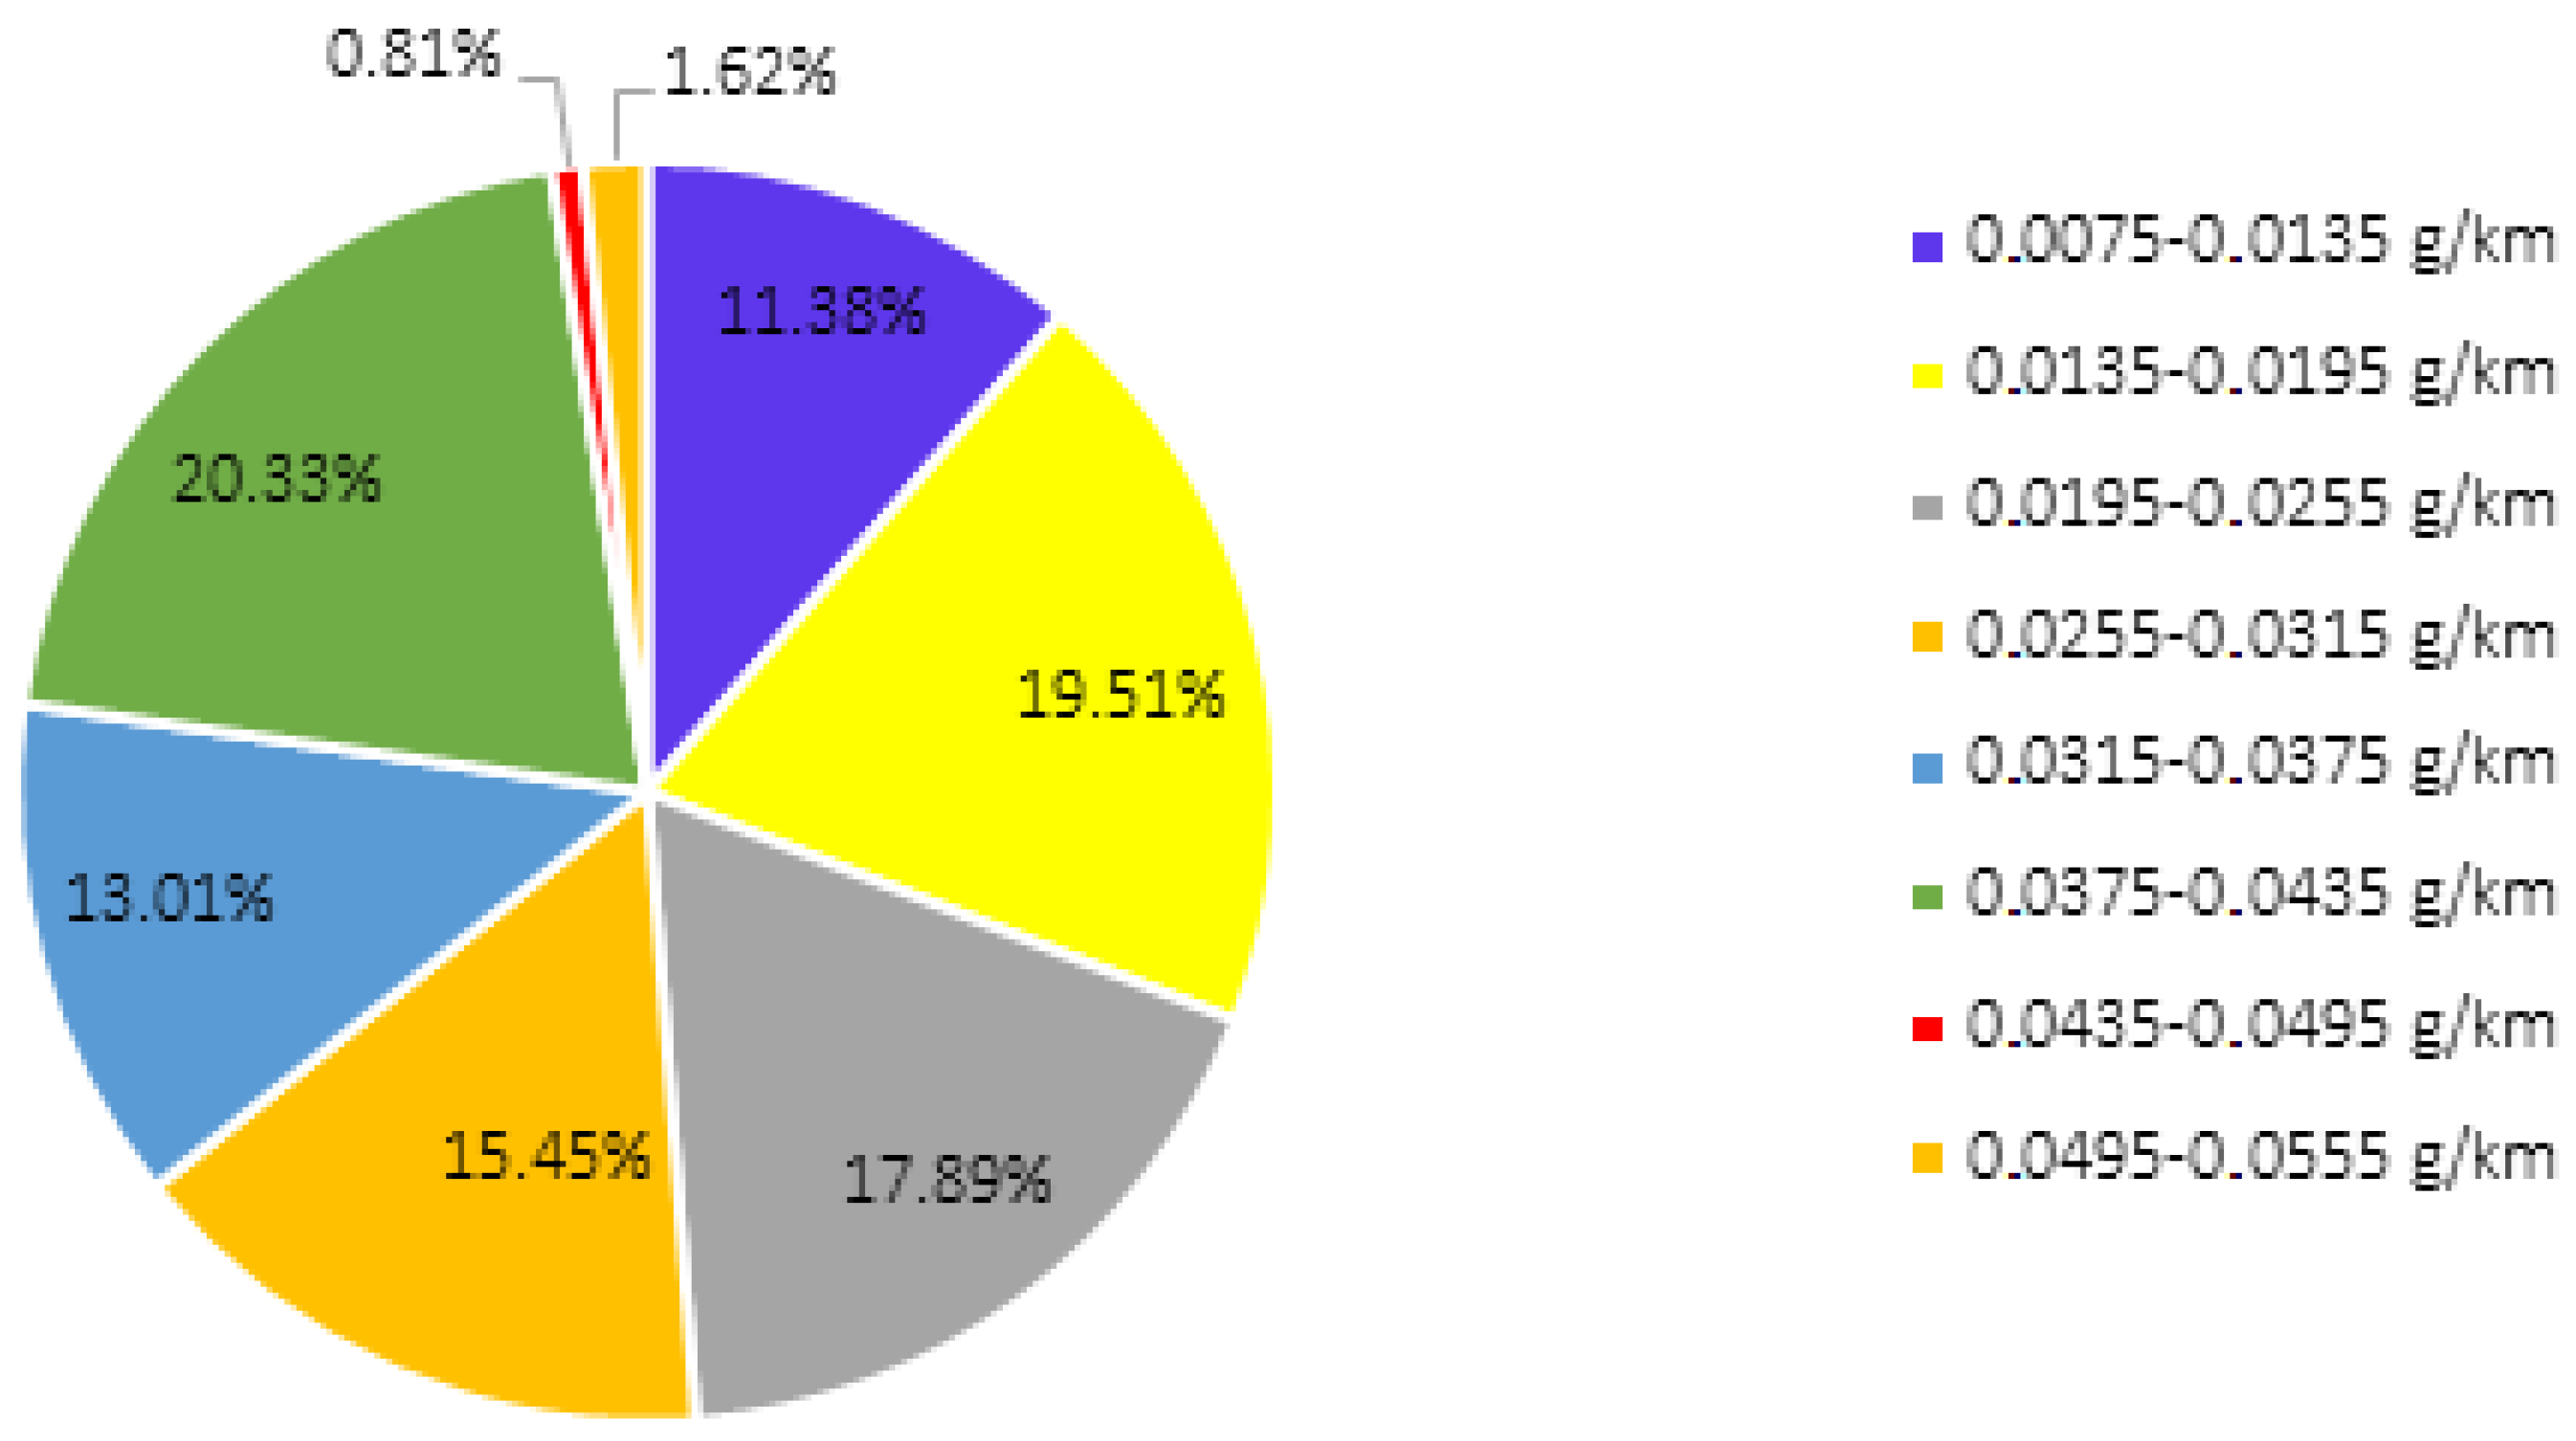
From a database obtained within the Romanian Auto Registry consisting of 123 hybrid car models, of the data that were collected through experimental determinations for several car brands—to homologate them—20.33% of them have NOx emissions in the range of 0.0375–0.0435 g/km Figure 10.
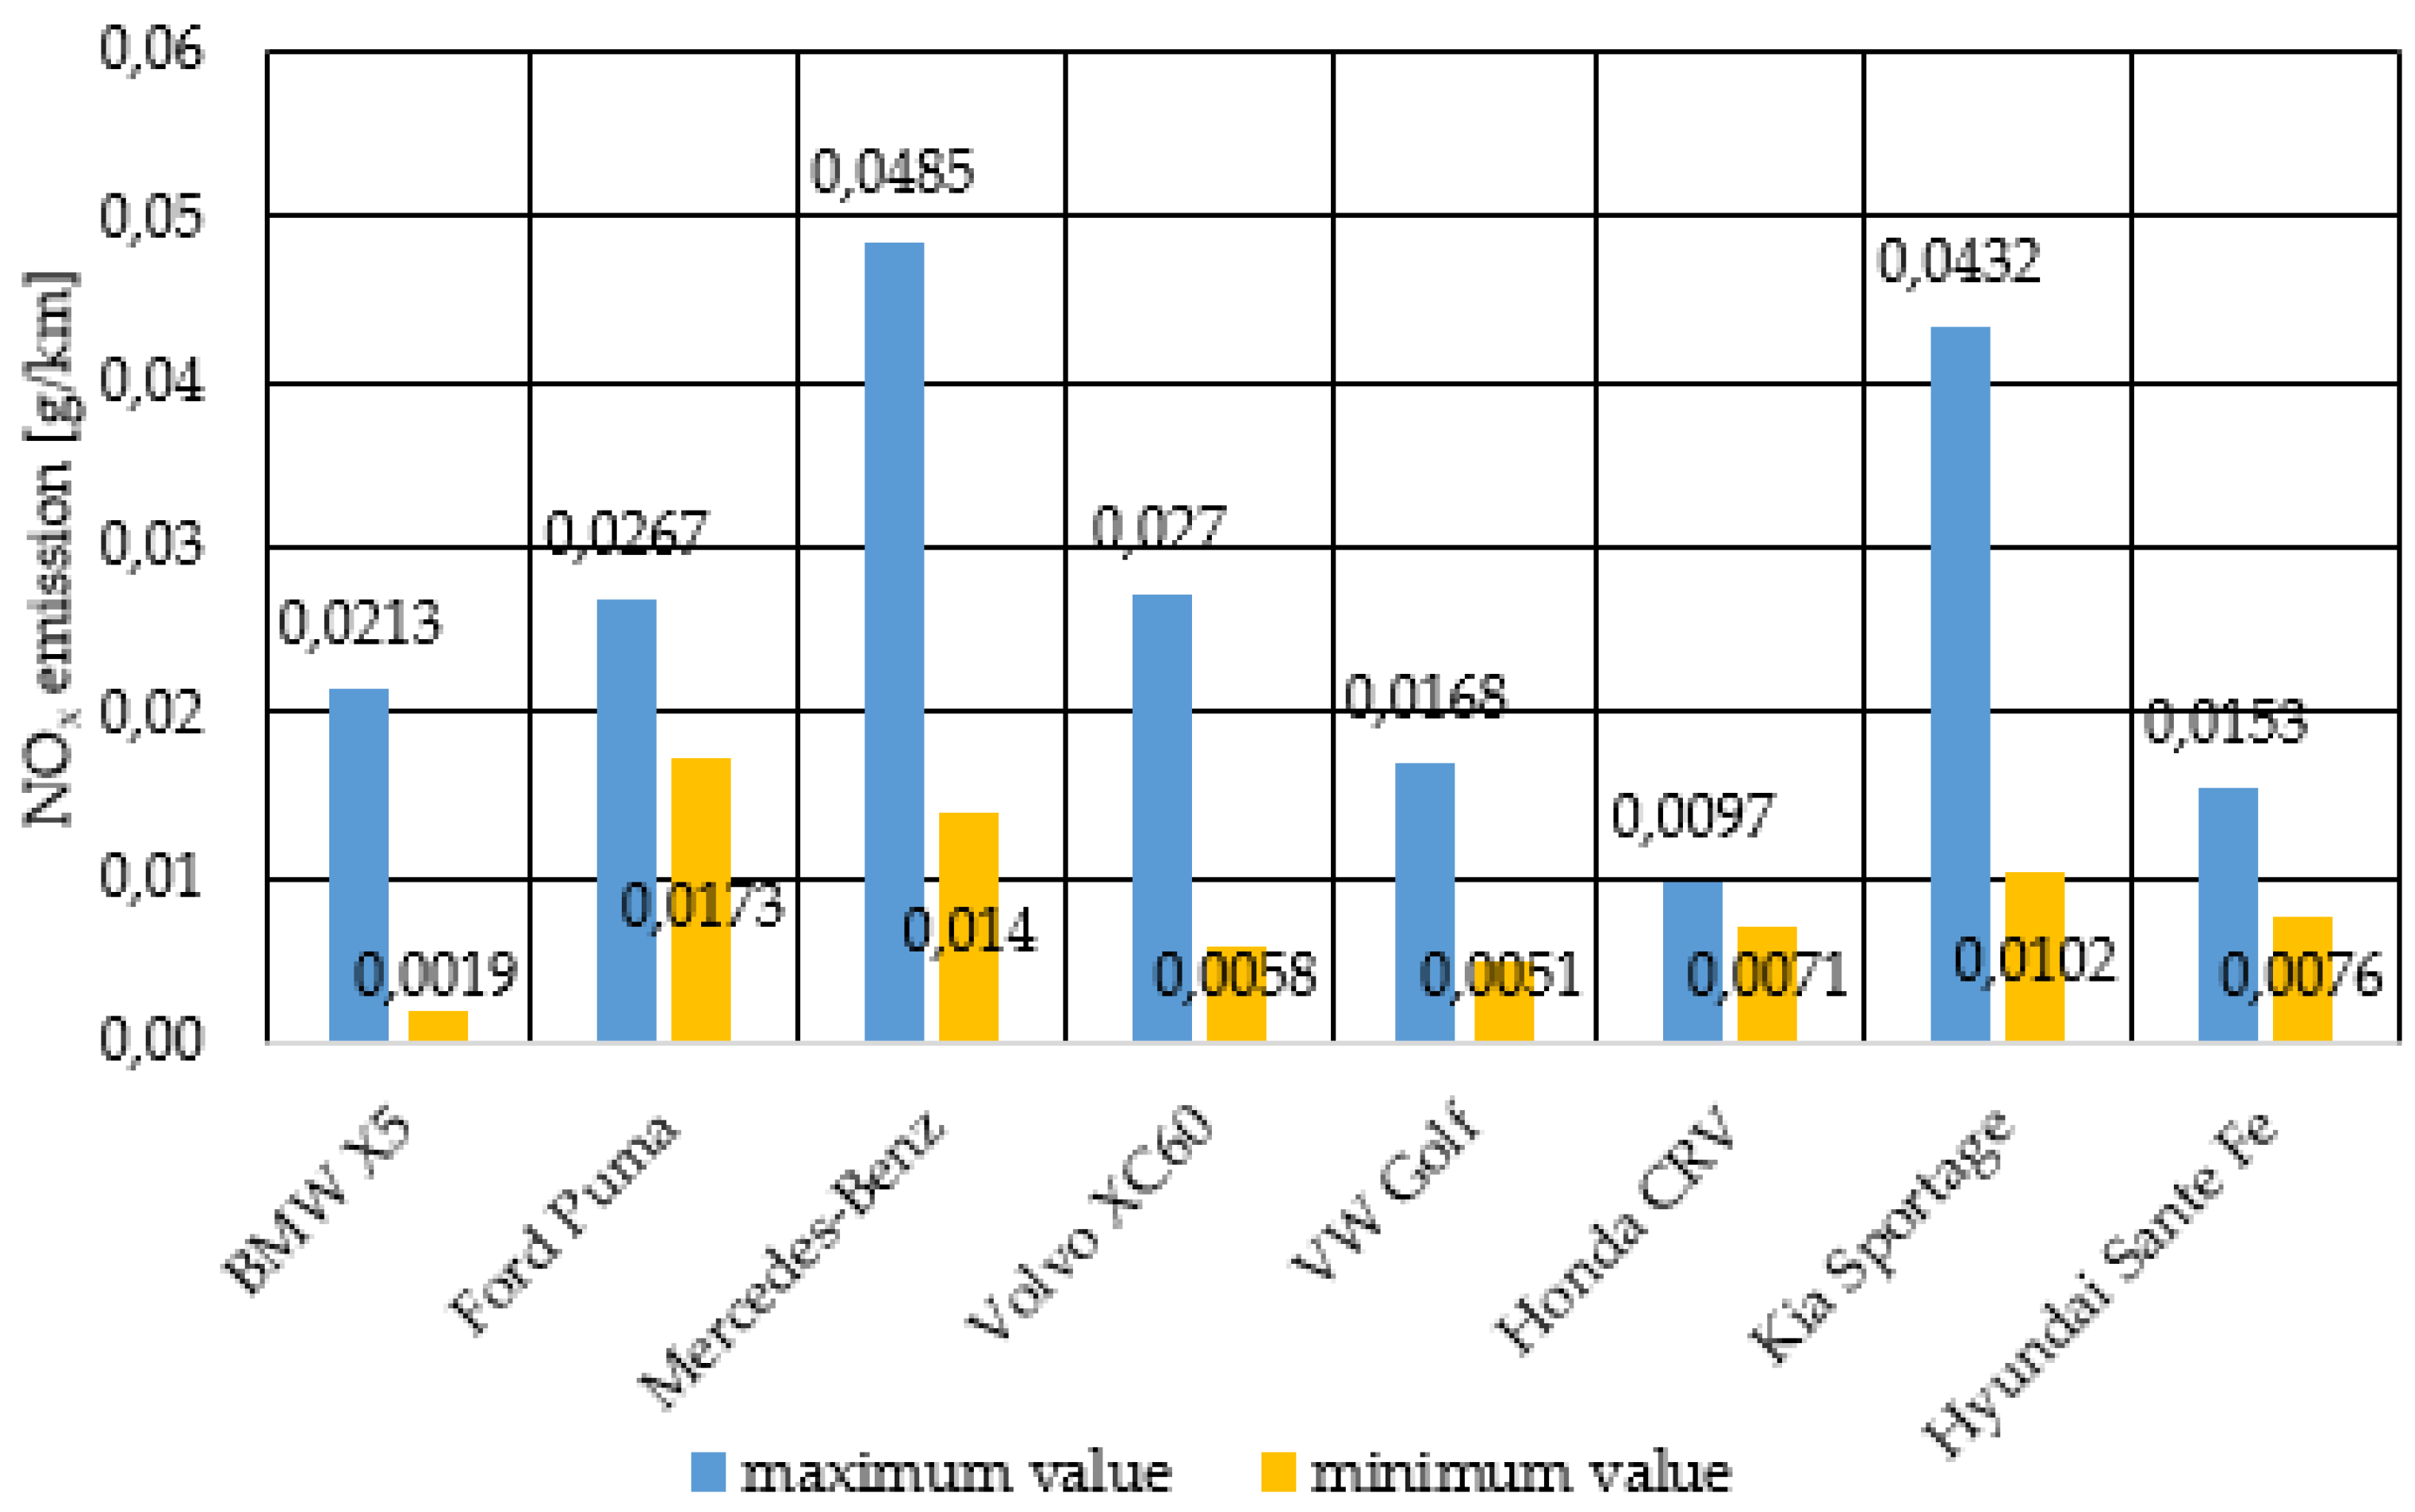
It is found that the hybrid car can successfully meet the Euro 6 pollution standards regarding NOx emissions. The highest recorded value of NOx emissions among the 59 different variants and versions analysed, from the Mercedes Benz GLE and GLS hybrid car models, was 0.0485 g/km, which means a lower value by 19.16% compared to the Euro 6 limit of 0.06 g/km Figure 11. It should be noted that this graph does not aim to make a comparison between the brands of hybrid cars that emit NOx; this cannot be done with the present data because they are cars that have different cylinder capacities, powers, maximum operating speeds, transmissions, depollution systems, combustion control procedures, etc., and all these factors influence NOx emissions.
This graph only aims to present a few NOx emission values found in the respective car brands, with the aim of highlighting that the hybrid car can more easily meet the pollution standards imposed by the pollution regulations, and from this point of view it can be more environmentally friendly, in terms of NOx emission. The upper limit of the y-axis (0.06 g/km) corresponds to the Euro 6 NOx emission limit for conventional spark-ignition vehicles, as shown in Figure 11.
The graph highlights notable differences between hybrid car brands in terms of nitrogen oxide emissions, both at minimum and maximum levels. For all models analysed, the minimum values are well below the maximum, suggesting a strong variability in emissions depending on driving conditions. Although all vehicles are hybrids, their NOx emission behaviour differs considerably from one model to another. Some brands such as Mercedes-Benz and Kia can reach quite high maximum values, close to the regulatory limits for conventional engines, while others such as Honda and VW stay at low levels, which makes them more suitable for reducing urban pollution. Analysing the values of nitrogen oxide emissions generated by the studied vehicles, there is potential for modifying the pollution norm, in the sense of lowering it below a value of 0.06 g/km; thus, a more restrictive pollution norm can be implemented, as shown in Figure 11.
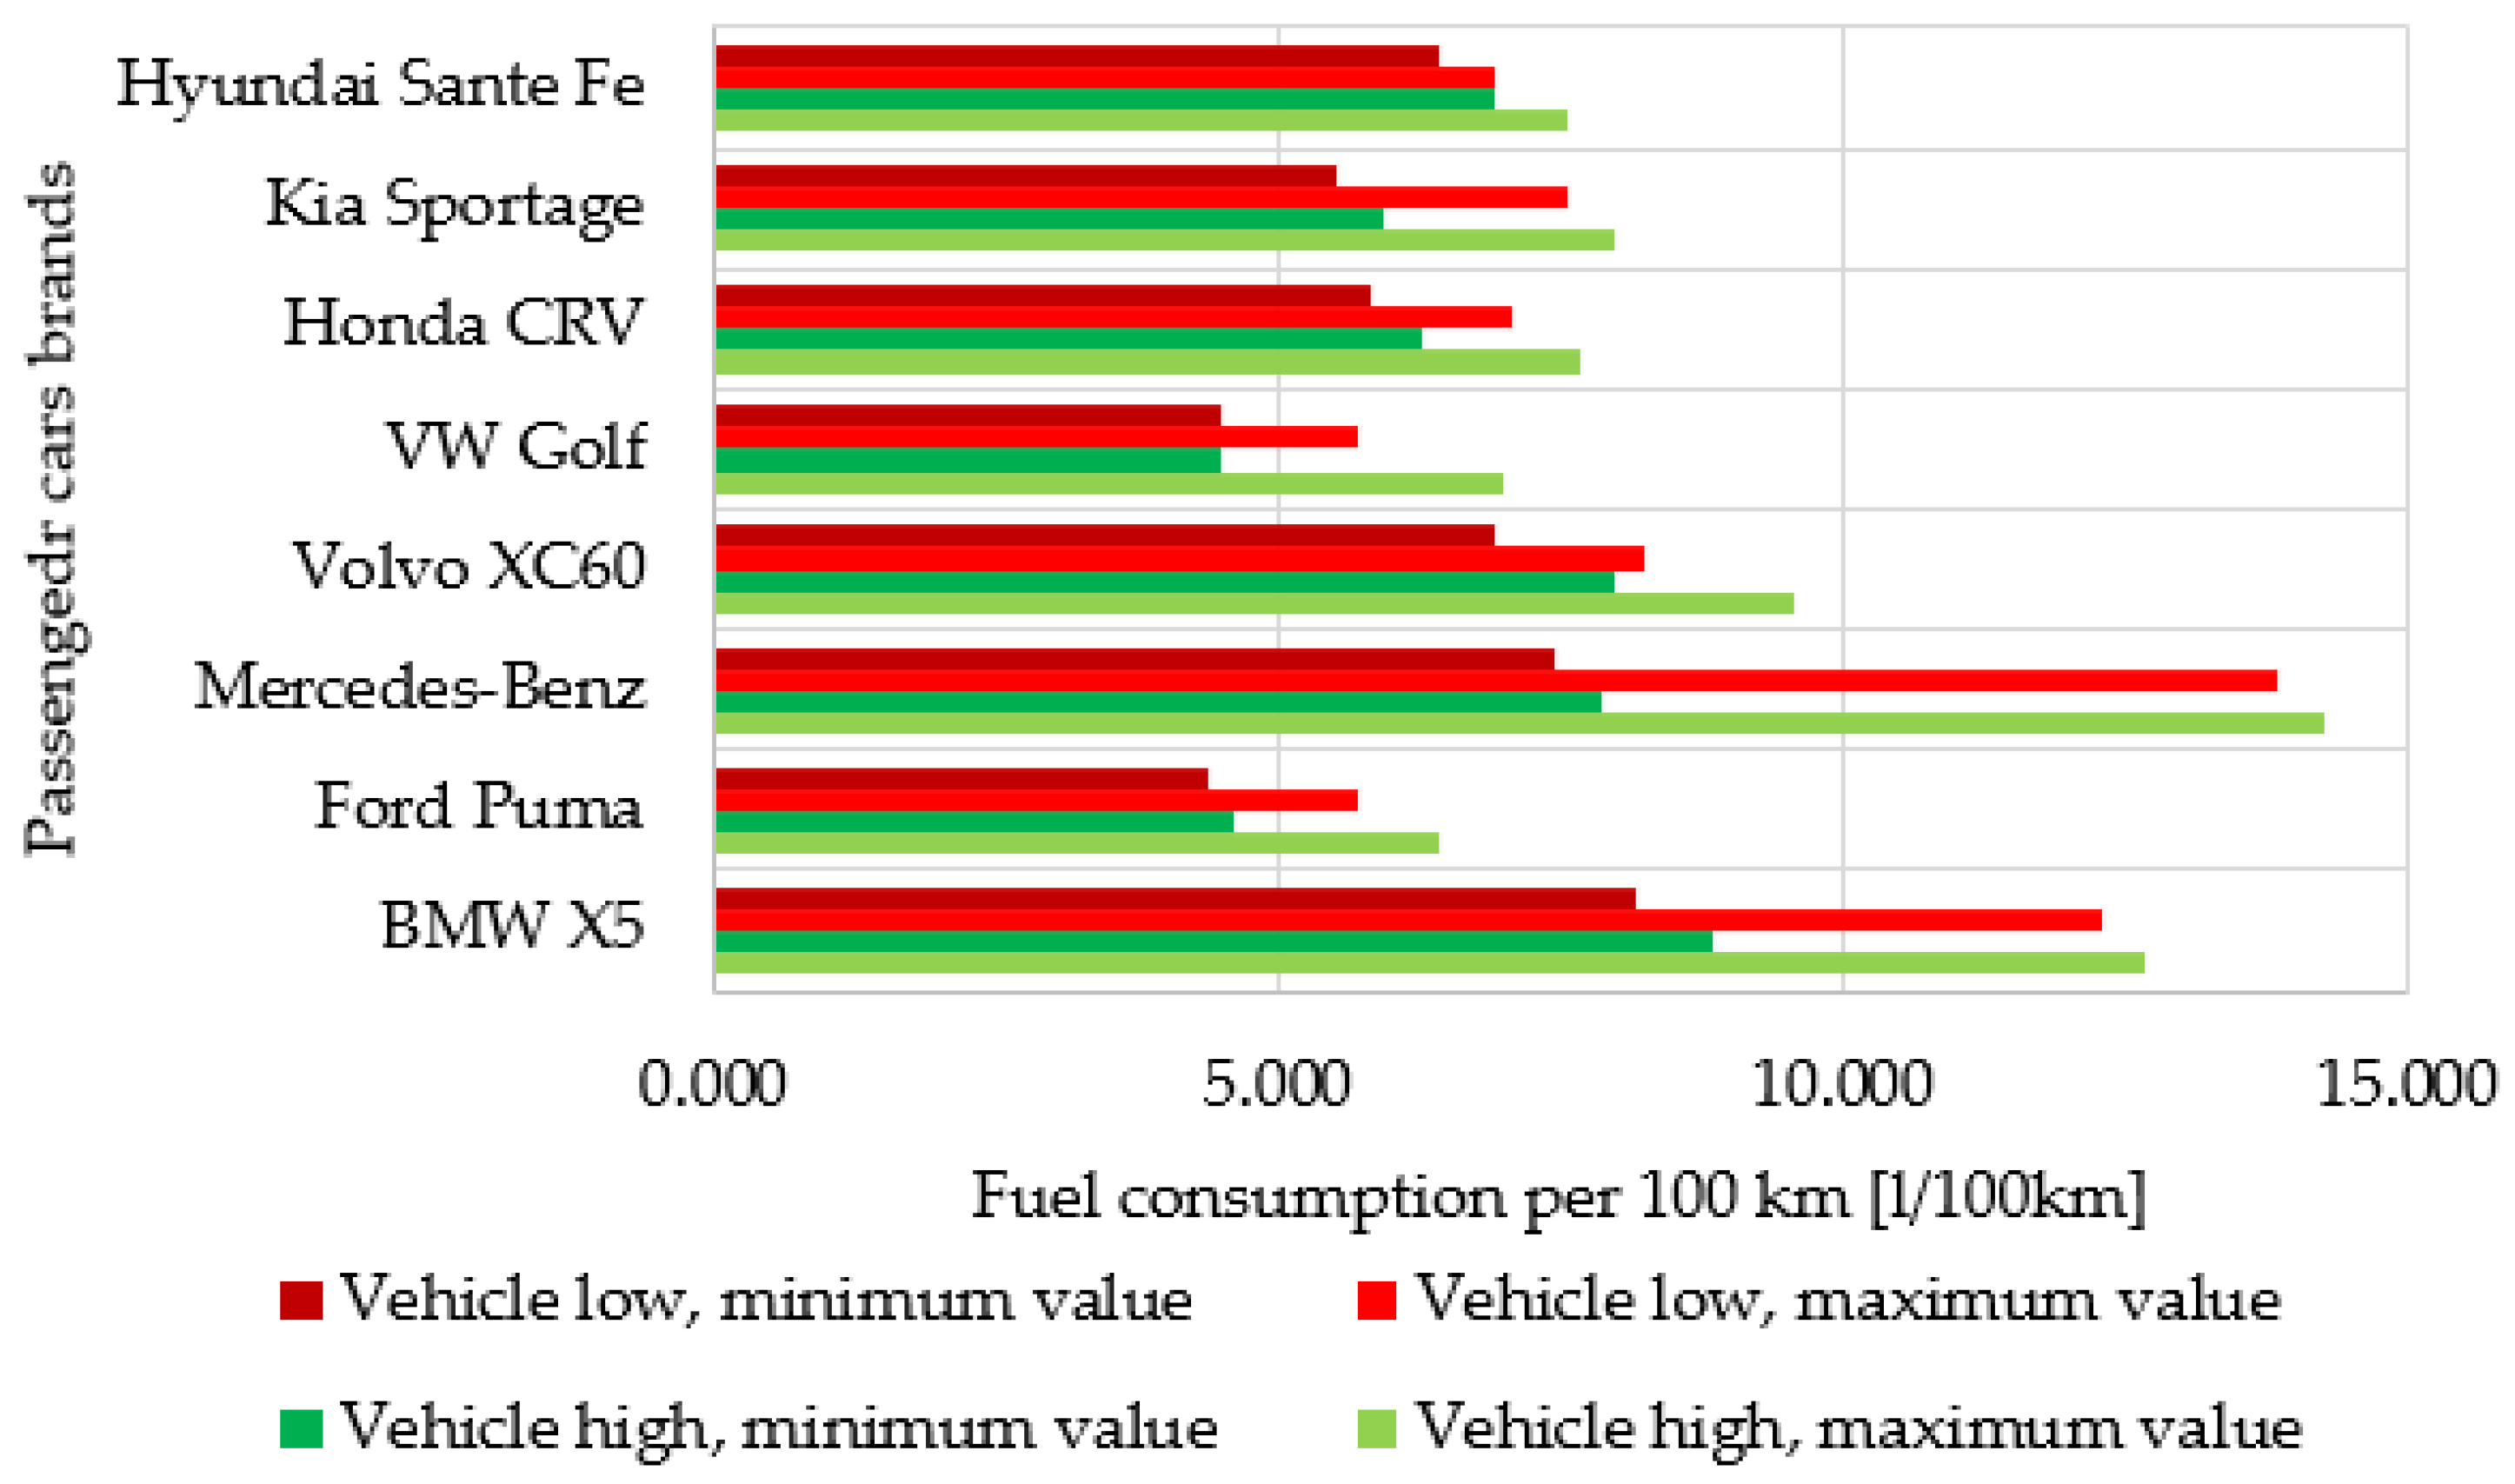
The graph illustrates the fuel consumption of hybrid cars in two distinct scenarios: Vehicle low (favourable driving conditions) and Vehicle high (demanding conditions), each with minimum and maximum measured values. It is observed that, in all cases, consumption is lower in the “low” scenario and increases visibly in the “high” scenario, which confirms the direct influence of driving conditions on energy efficiency Figure 12.
The maximum values in the “high” scenario are significantly higher, in some cases exceeding thresholds comparable to those of conventional vehicles, while the minimum values in the “low” scenario indicate very low consumption, specific to economical driving. The difference between the minimum and maximum values for the same scenario varies considerably from one model to another, which suggests a different sensitivity of vehicles to factors such as the load carried, the route profile or the driving style. In some cases, the increase in consumption between “low” and “high” is moderate, indicating a more consistent performance, while in others the jump is steep, showing a significant drop in efficiency under difficult conditions Figure 12.

2.3. Econometric Modelling of CO2 Emissions

2.3.1. Presentation of Descriptive Statistics and Discussion of Normality of Distribution

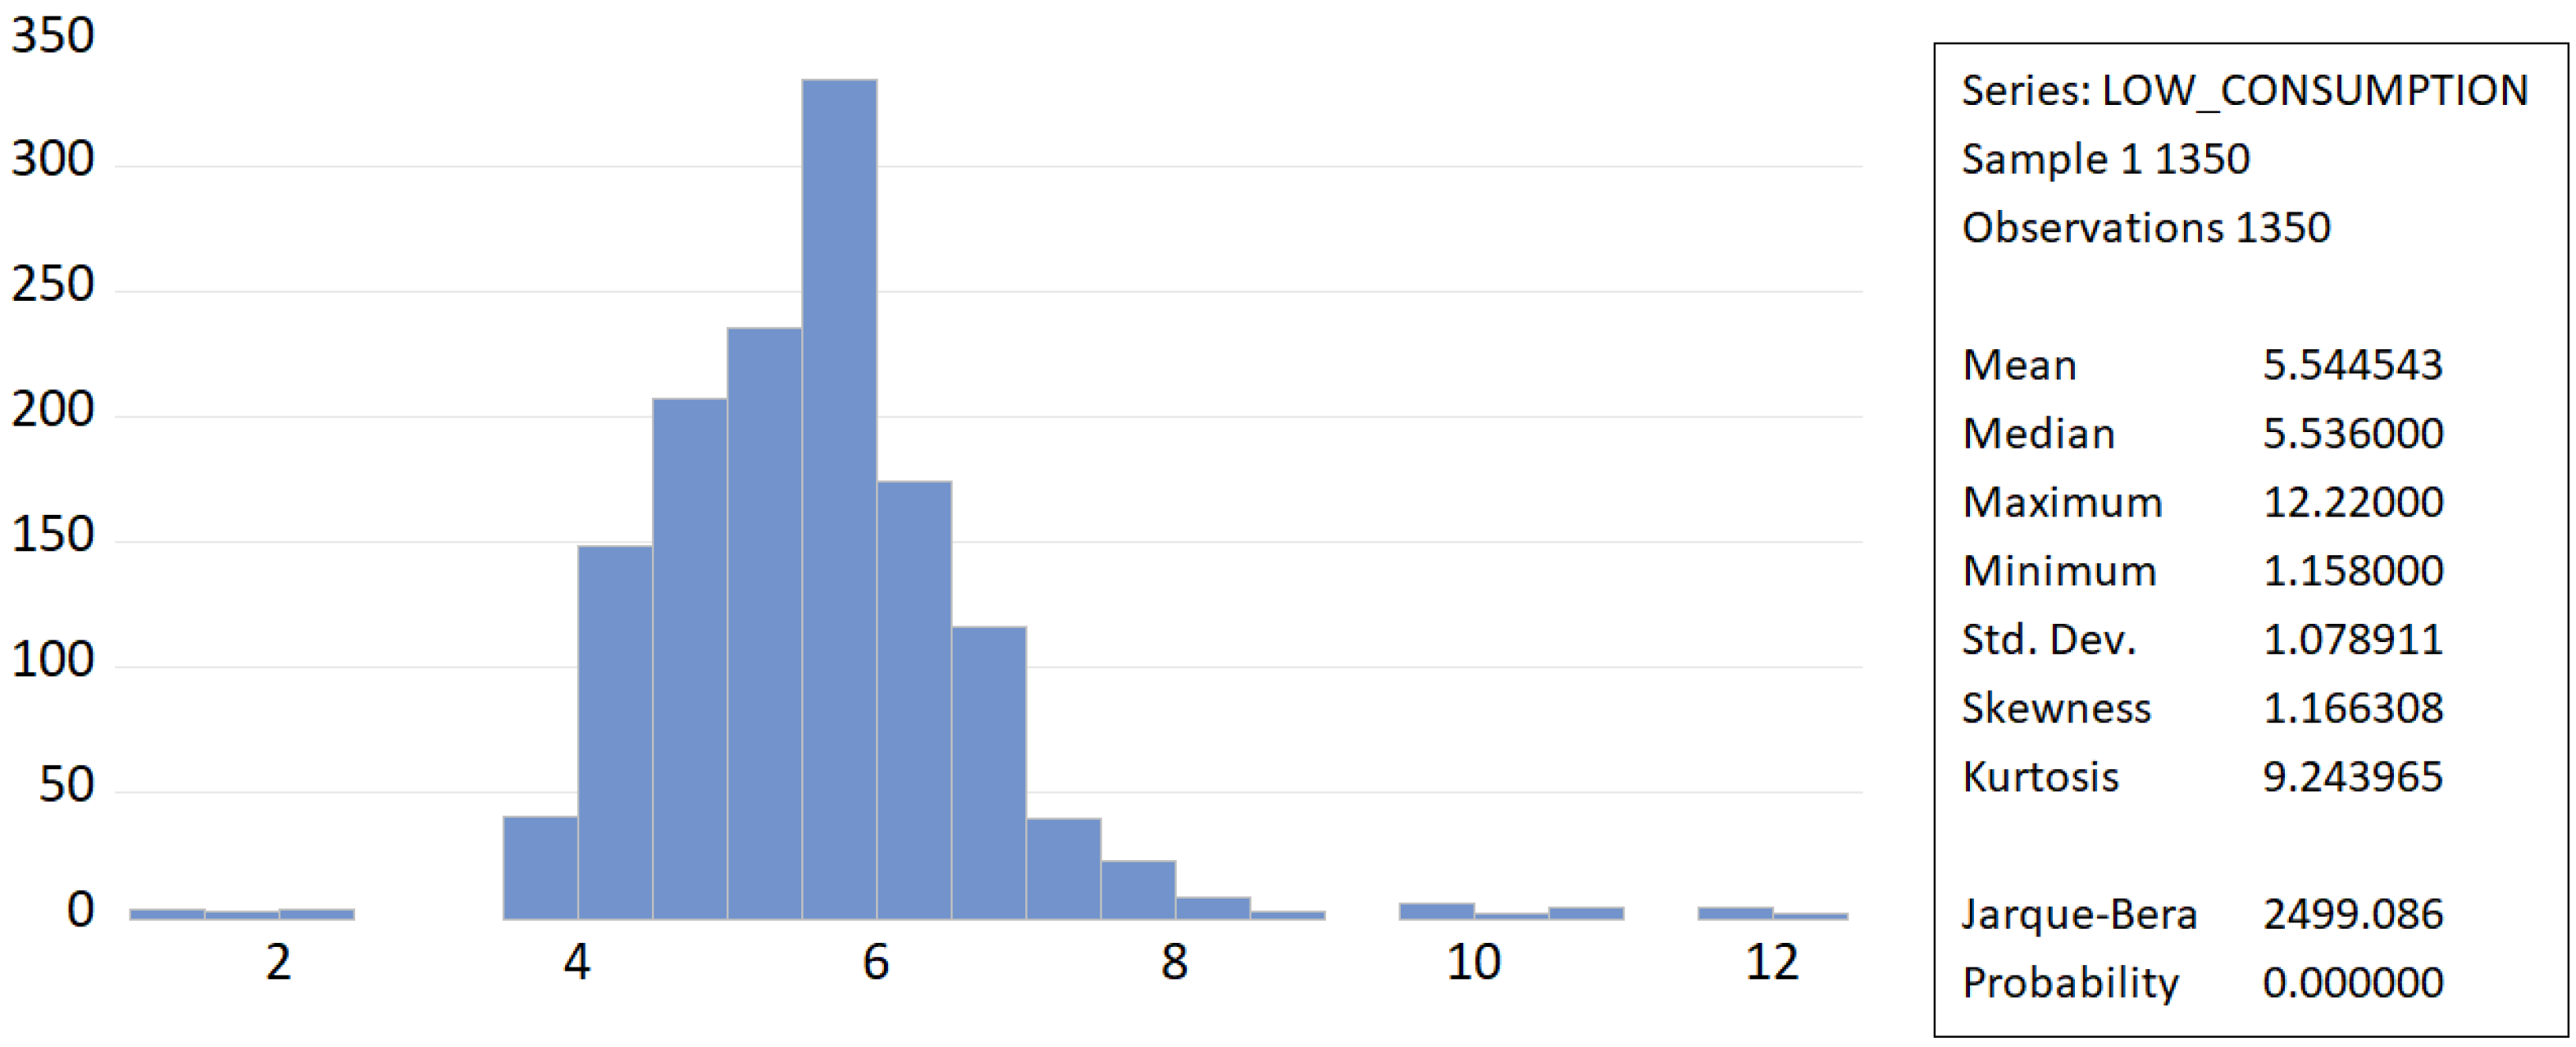
The skewness of the distribution density function of the series is determined using the skewness statistic. A positive value of the skewness statistic of 1.1663 means that the distribution has a longer right tail. The amplitude of the density function and its flattening in relation to the density function of the normal distribution is determined using the Kurtosis statistic. A positive value of the Kurtosis statistic of 9.2439 means that the distribution is leptokurtic since it is greater than 3. The type of distribution (H0—normal distribution and H1—abnormal distribution) is determined using the Jarque–Bera statistic. If the p-value is greater than 0.05, the null hypothesis is accepted. If the probability is less than 0.05, the null hypothesis is rejected, and the data must be transformed to present a normal distribution. The Jarque–Bera test yields a statistic of 2499.09 with a p-value of 0.000, leading to the rejection of the normality assumption. This pattern reflects a concentration of observations around the mean value of 5.54 L/100 km, with a longer right tail corresponding to higher consumption values up to 12.22 L/100 km Figure 13.
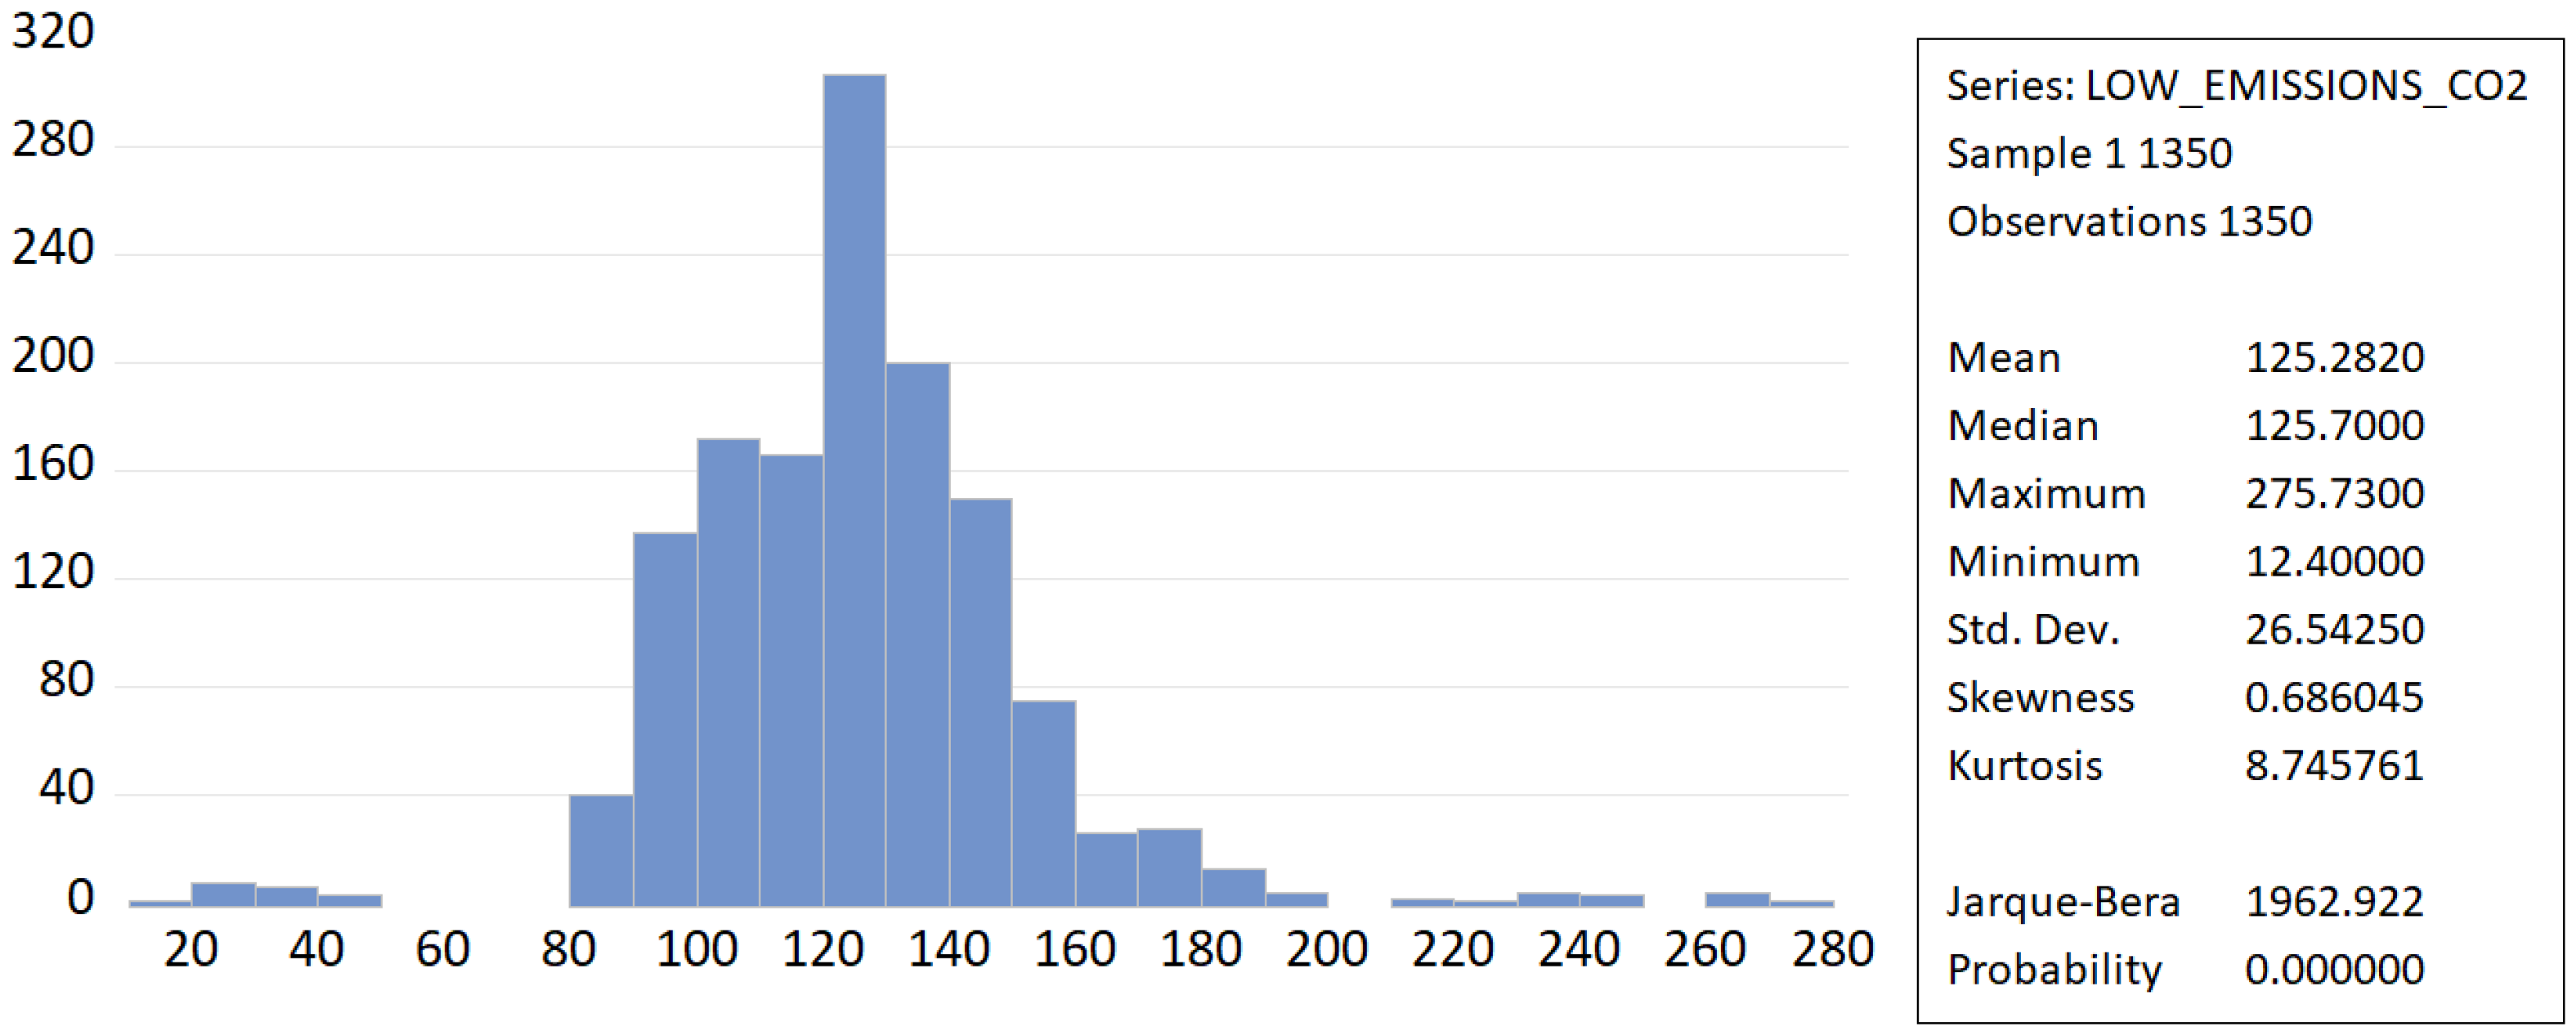
A positive skewness value of 0.6860 means the distribution is moderately positively skewed (or right skewed). The right tail of the distribution is longer than the left tail. Most observations are concentrated on the lower or middle values, with some relatively large values stretching the distribution to the right. The positive value of the Kurtosis statistic of 8.7457 means that the distribution is leptokurtic, because it is greater than 3. Since the associated probability value is zero, the null hypothesis that the series is normally distributed is rejected. The Jarque–Bera test yields a value of 1962.922 with a probability of 0.0000, indicating rejection of the null hypothesis of normality at the 1% significance level. This pattern reflects a concentration of observations around the mean of 125.28 g/km and the presence of higher emission values extending up to 275.73 g/km, as shown in Figure 14.

2.3.2. Development of CO2 Emission and Fuel Consumption Charts

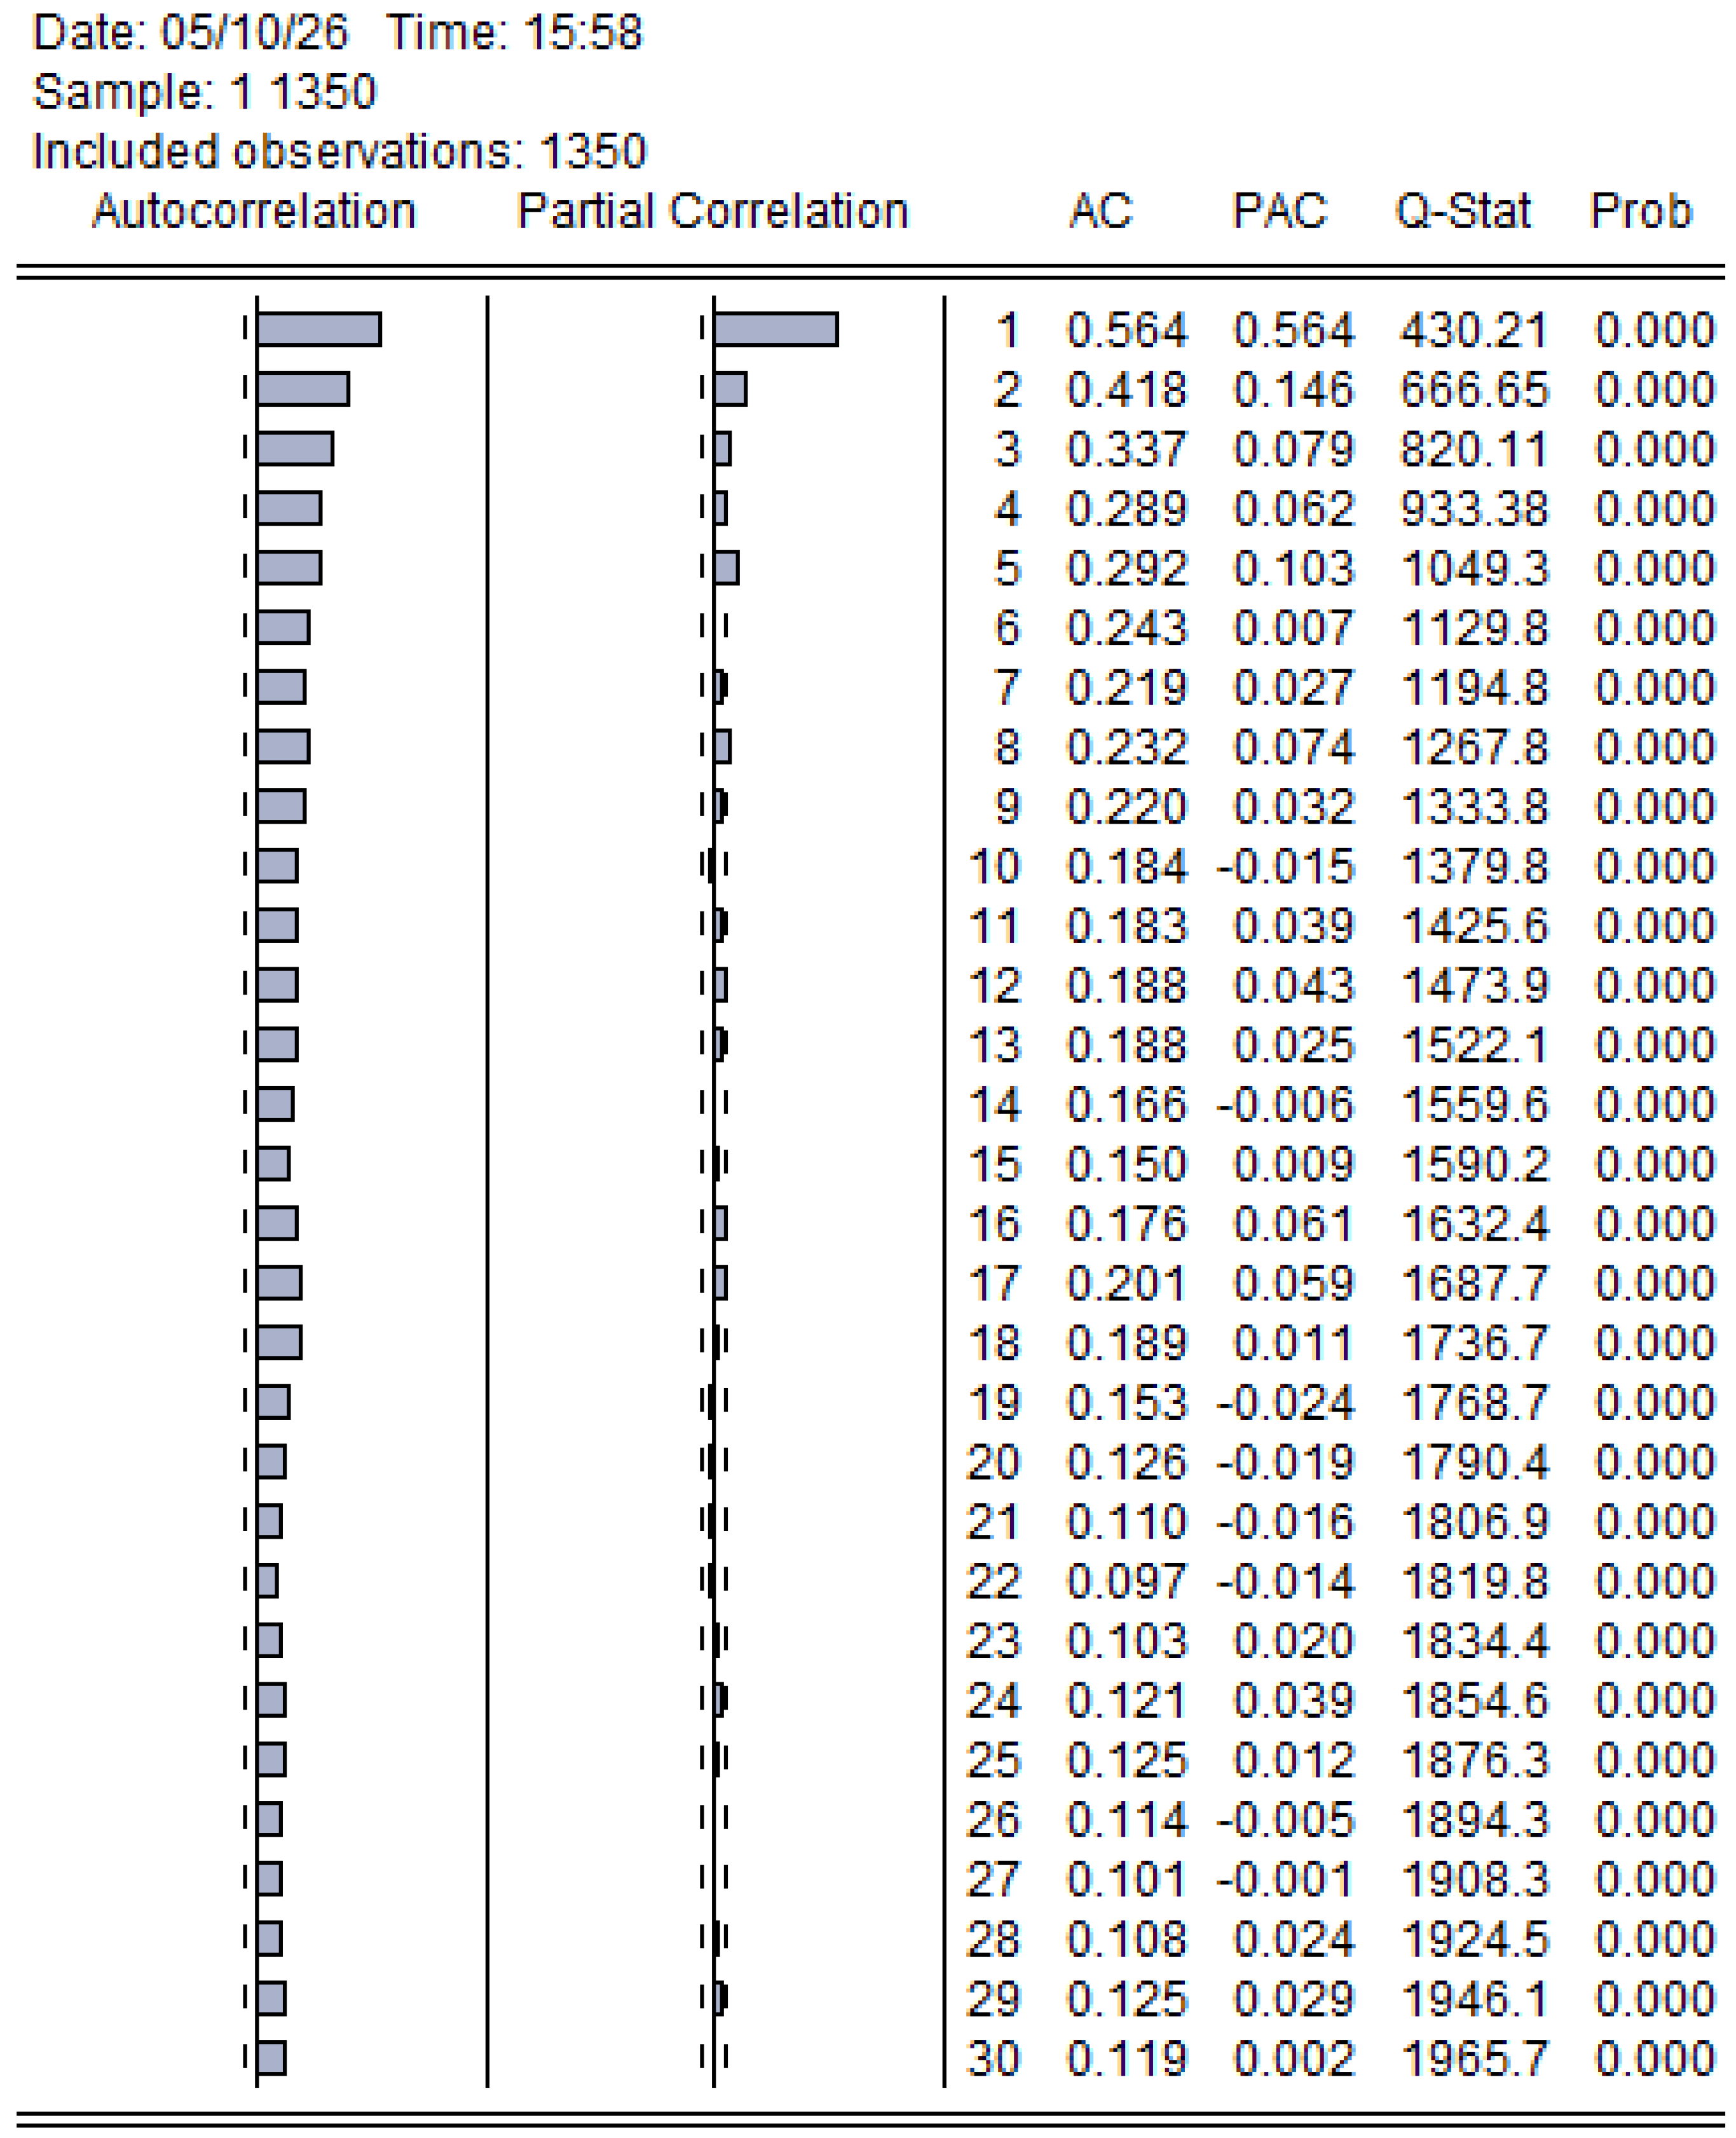
The correlogram analysis reveals significant and persistent autocorrelation (AC) for the first 30 lags, with values gradually declining from 0.564 at lag 1 to 0.119 at lag 30. The partial autocorrelation (PAC) indicates a strong direct influence at lag 1 (0.564) and minor effects at lag 5. The Q-Ljung-Box statistics are significant (p < 0.05) for all lags, demonstrating the presence of an autoregressive structure in the low CO2 emissions series, as shown in Figure 15.
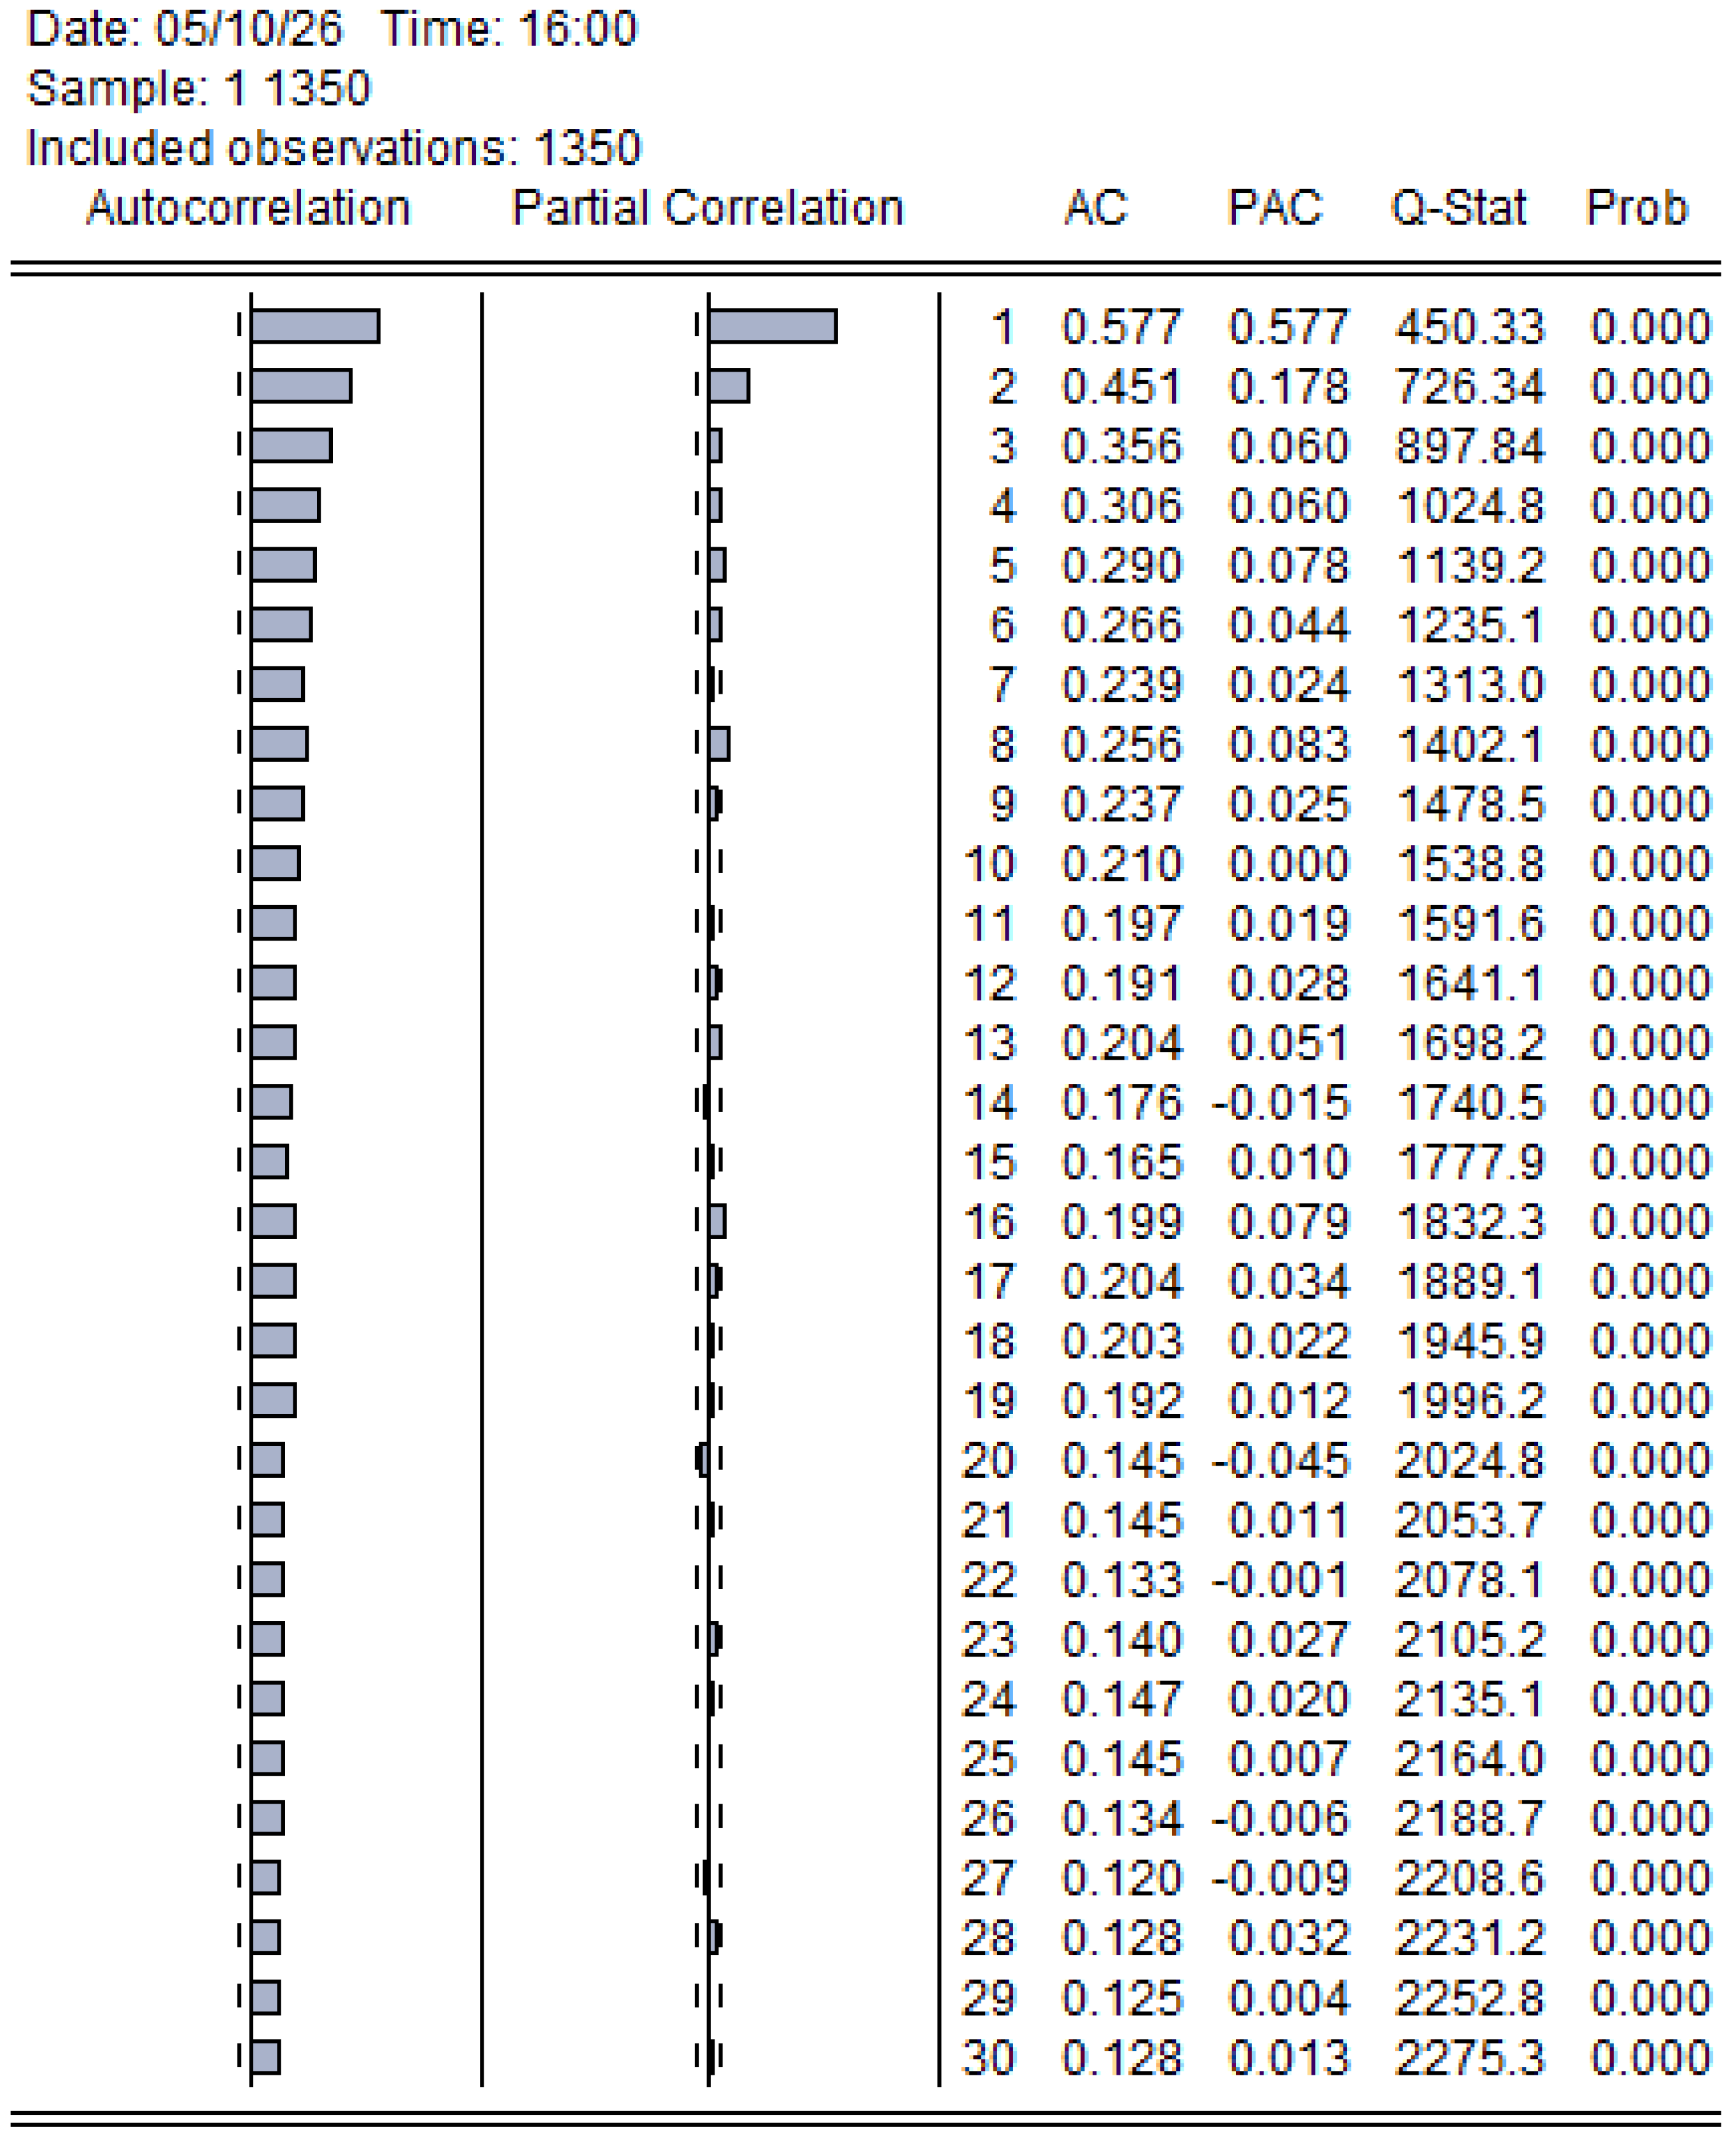
The correlogram analysis shows significant autocorrelation across 30 lags, with values decreasing slowly from 0.577 at lag 1 to 0.128 at lag 30. This slow decay indicates strong persistence and suggests the series is non-stationary or exhibits long memory. The partial autocorrelation is significant at lag 1 (0.577) and lag 2 (0.178), with smaller spikes at lags 5, 8, and 16. All Q-Ljung-Box statistics are significant (p < 0.05), rejecting the null hypothesis of no autocorrelation and confirming that the series contains predictable patterns, as shown in Figure 16.

2.3.3. Testing the Stationarity of Model Variables

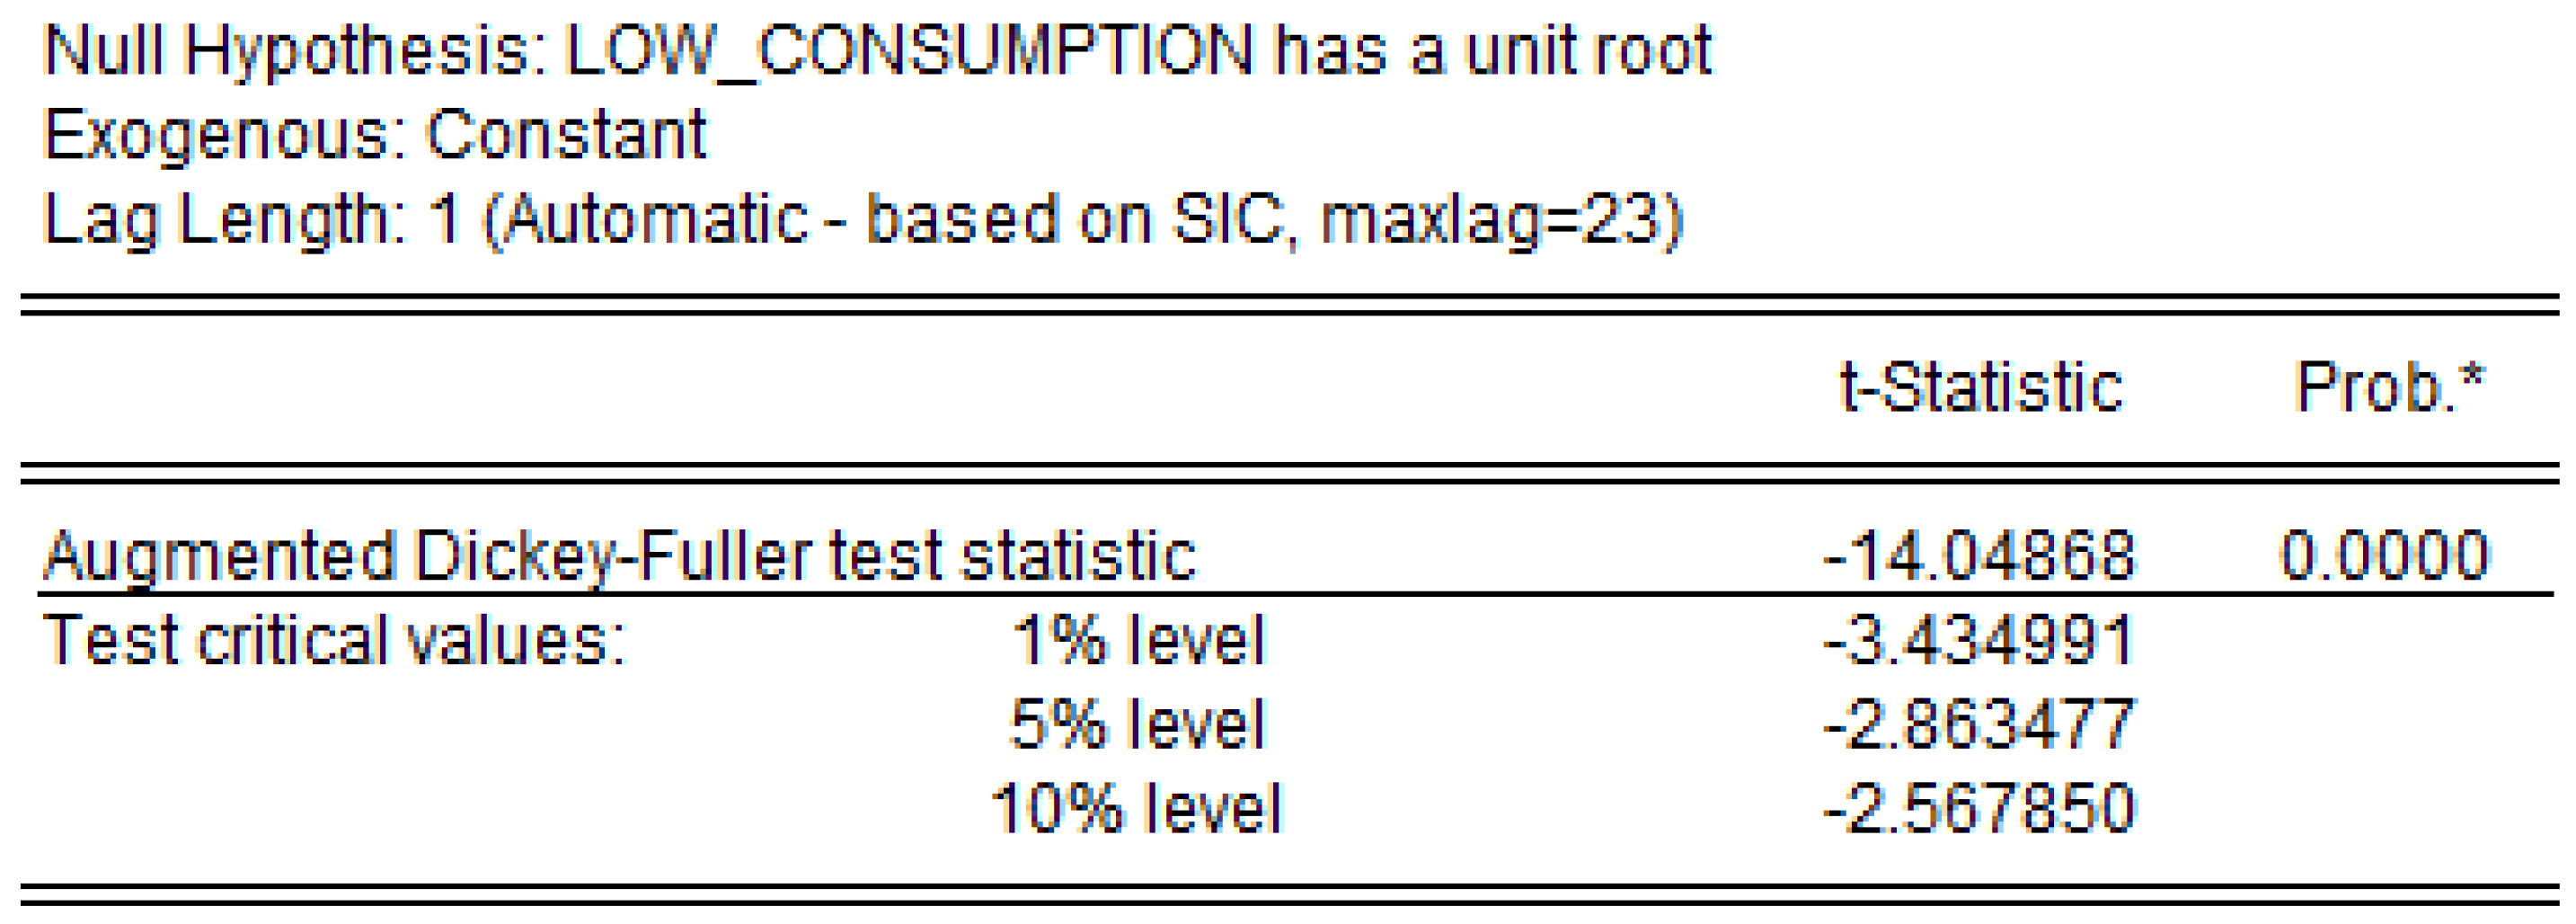
The augmented Dickey–Fuller test is used to test the stationarity of the model variables. The fuel consumption data are stationary, because the probability of the t-statistic is less than the threshold of 0.05 required to confirm the stationarity of the data, as shown in Figure 17.
Additionally, the mode value of the Dickey–Fuller test is greater than the three critical values of the mode of the test (test critical values) in the t-statistics column (|−14.0486| > |−3.4349| > |−2.8634| > |−2.5678|), which confirms that the null hypothesis of the existence of a unit root can be rejected, and the data are stationary, as shown in Figure 17.
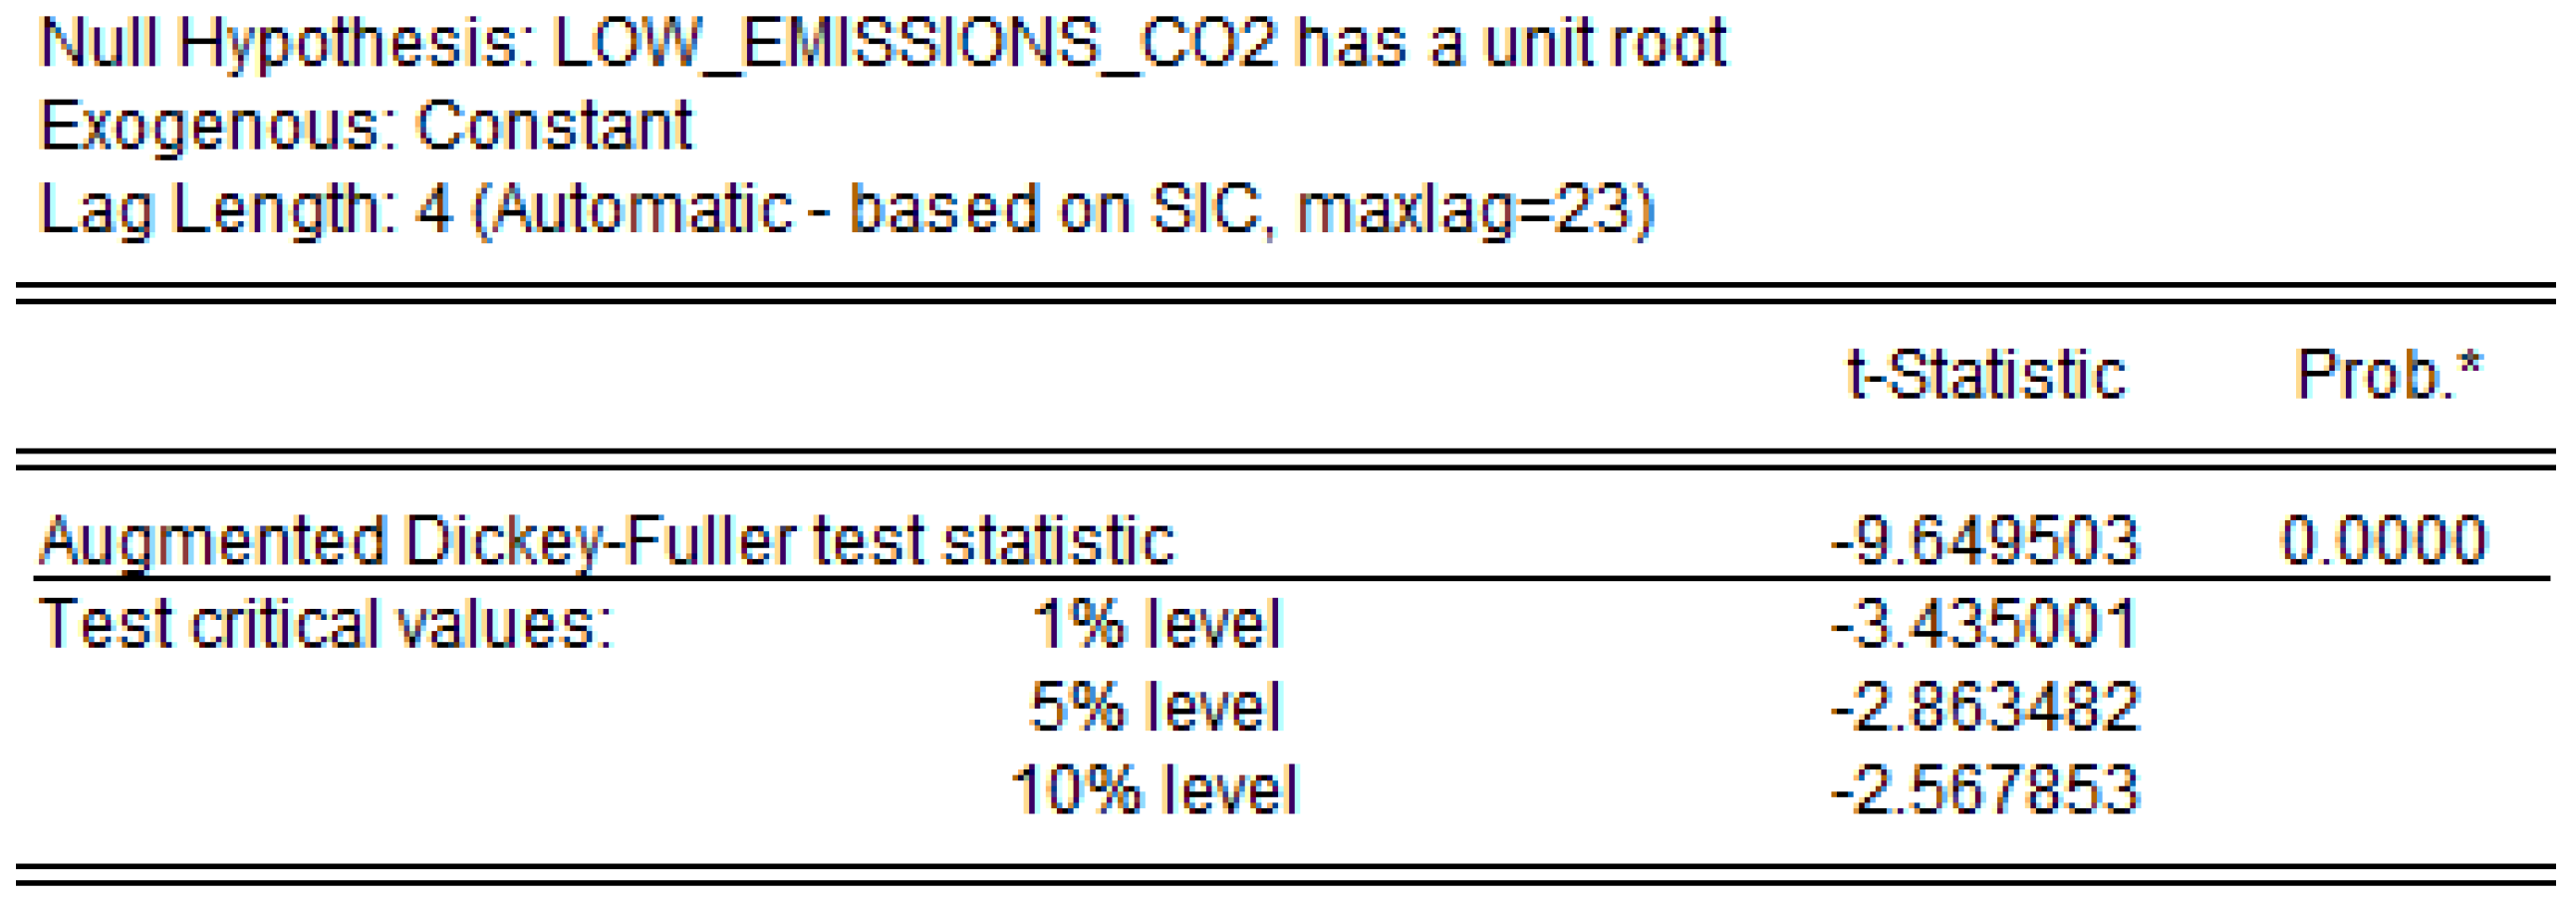
The CO2 emission data is stationary because the t-statistic probability is less than the 0.05 threshold required to confirm the stationarity of the data. Furthermore, the Dickey–Fuller test mode value is greater than the three critical test mode values (test critical values) in the t-statistics column (|−9.6495| > |−3.4350| > |−2.8634| > |2.5678|), which confirms that the null hypothesis of a unit root can be rejected, and the data are stationary, as shown in Figure 18.

2.3.4. Applying the Linear Multiple Regression Model and Interpreting the Results

Two datasets were analysed, each consisting of 1350 observations for vehicles with low CO2 emissions and vehicles with high CO2 emissions.
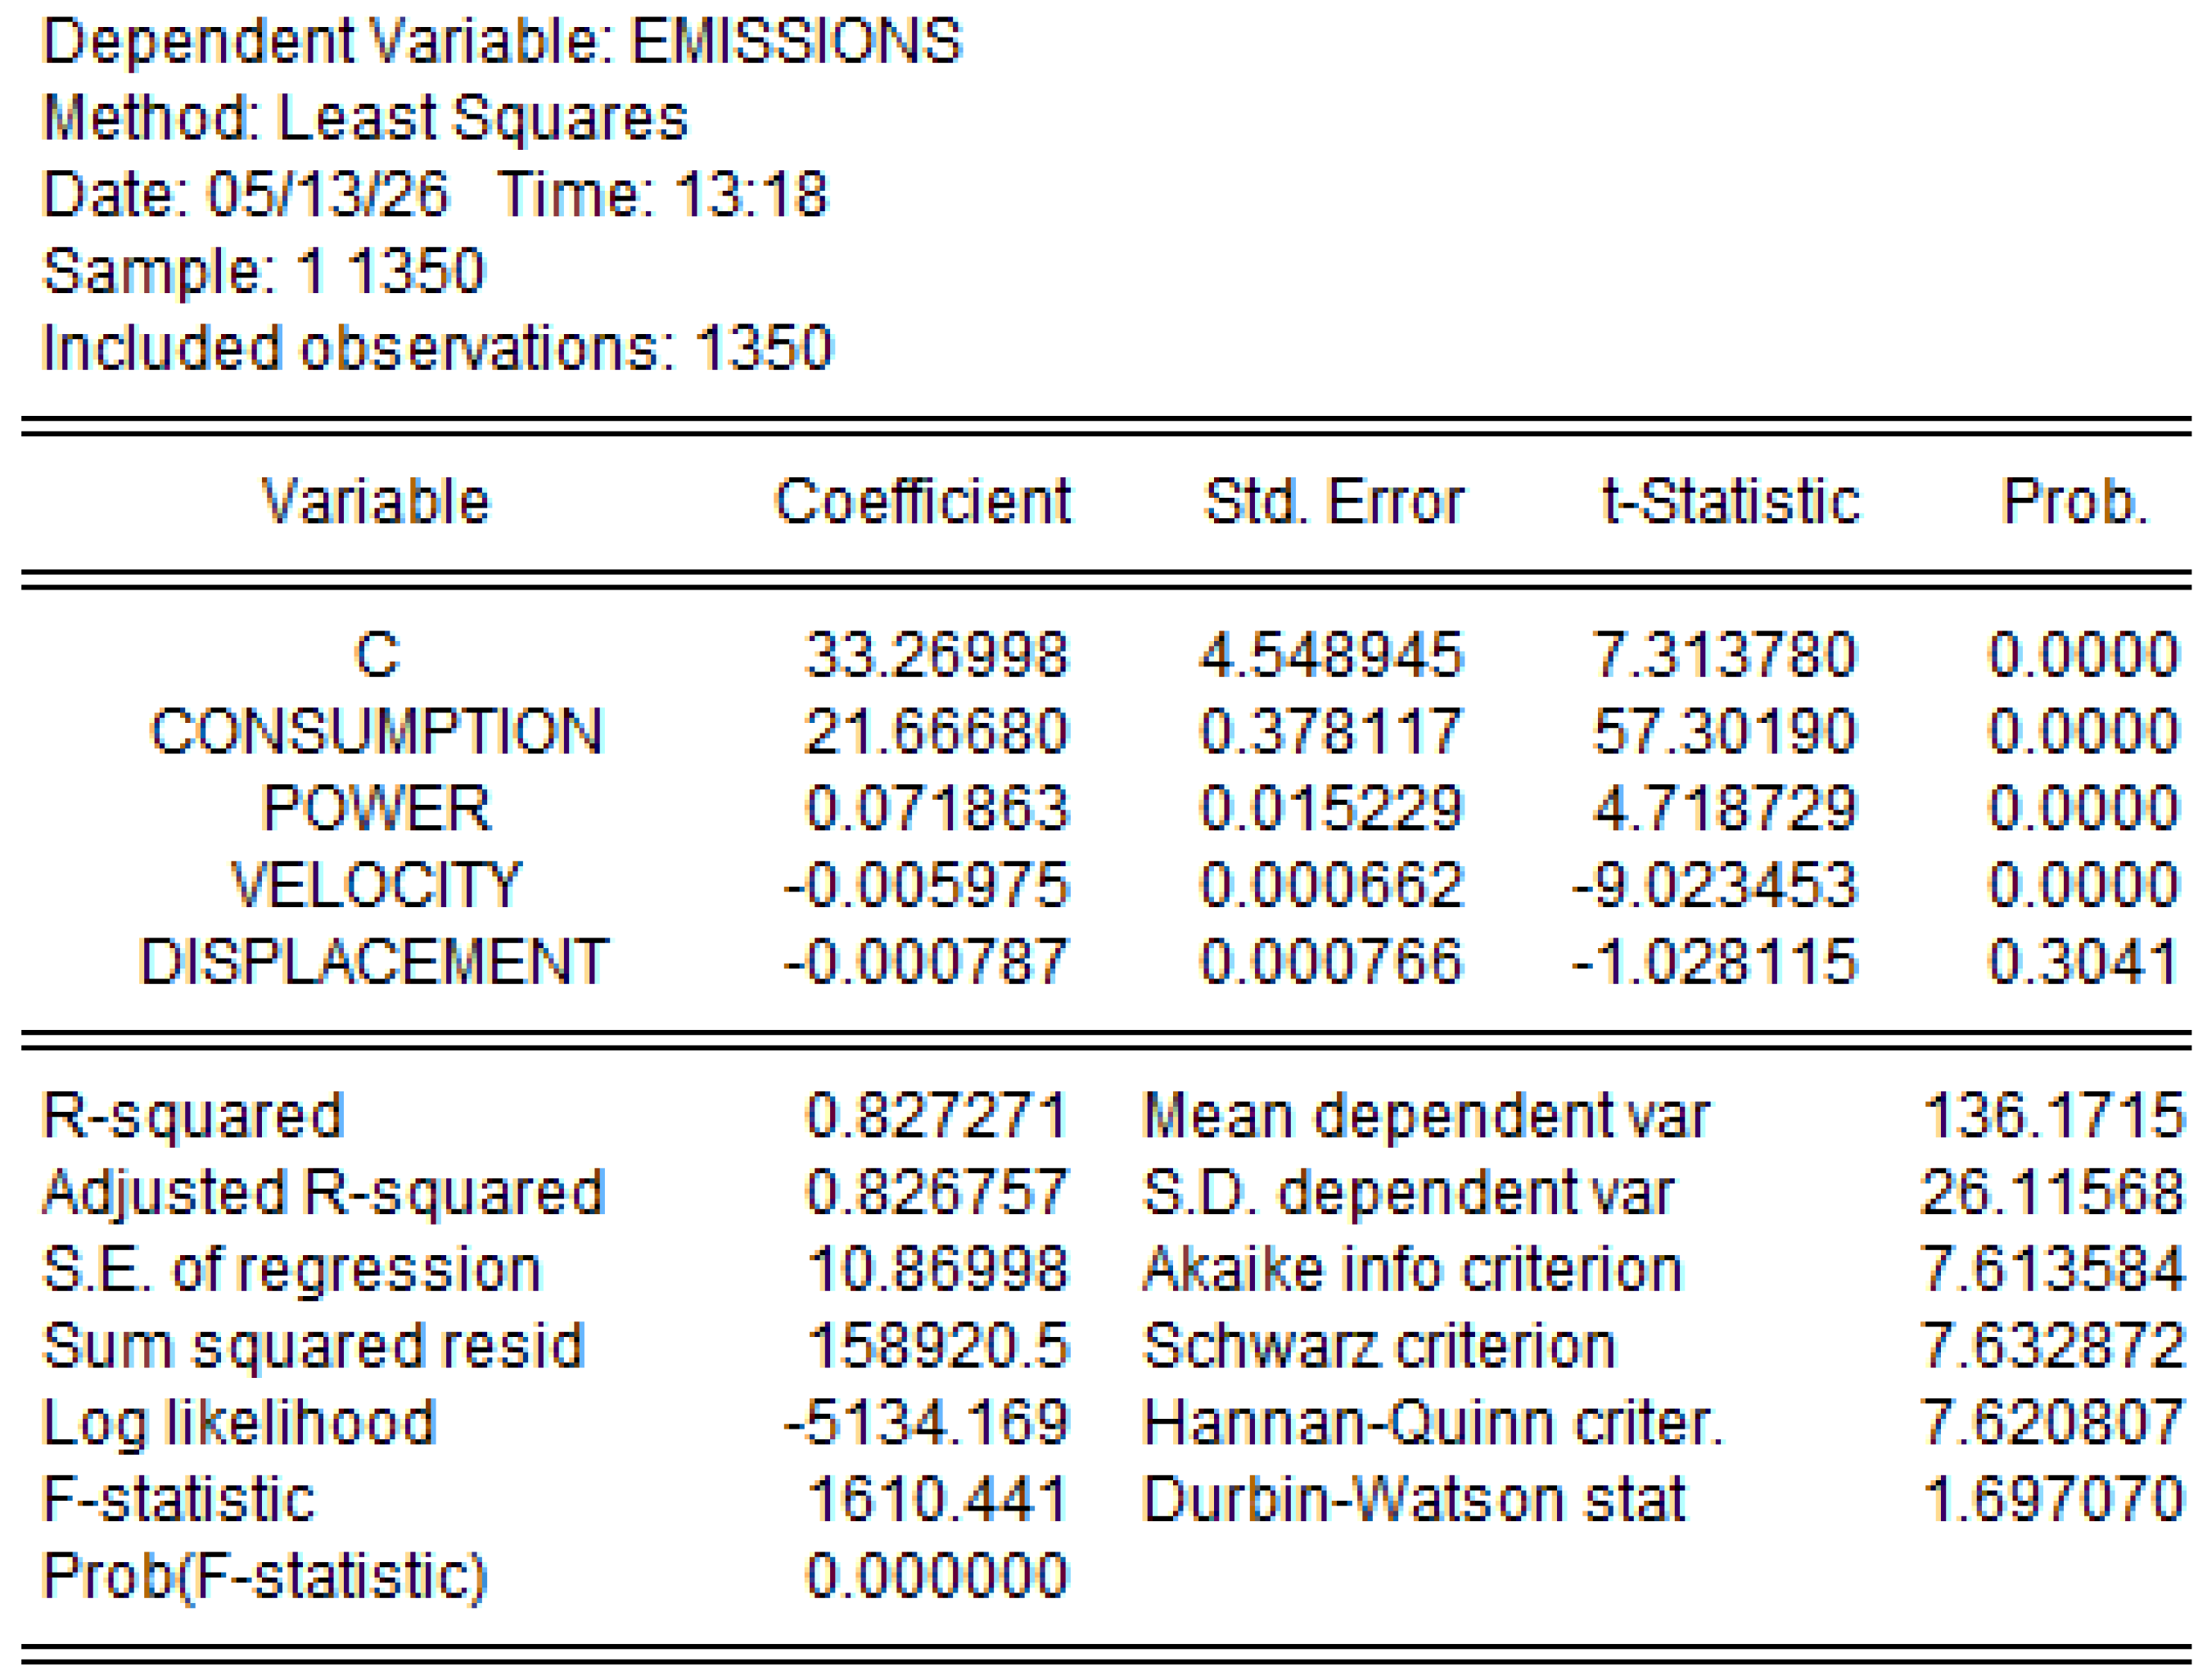
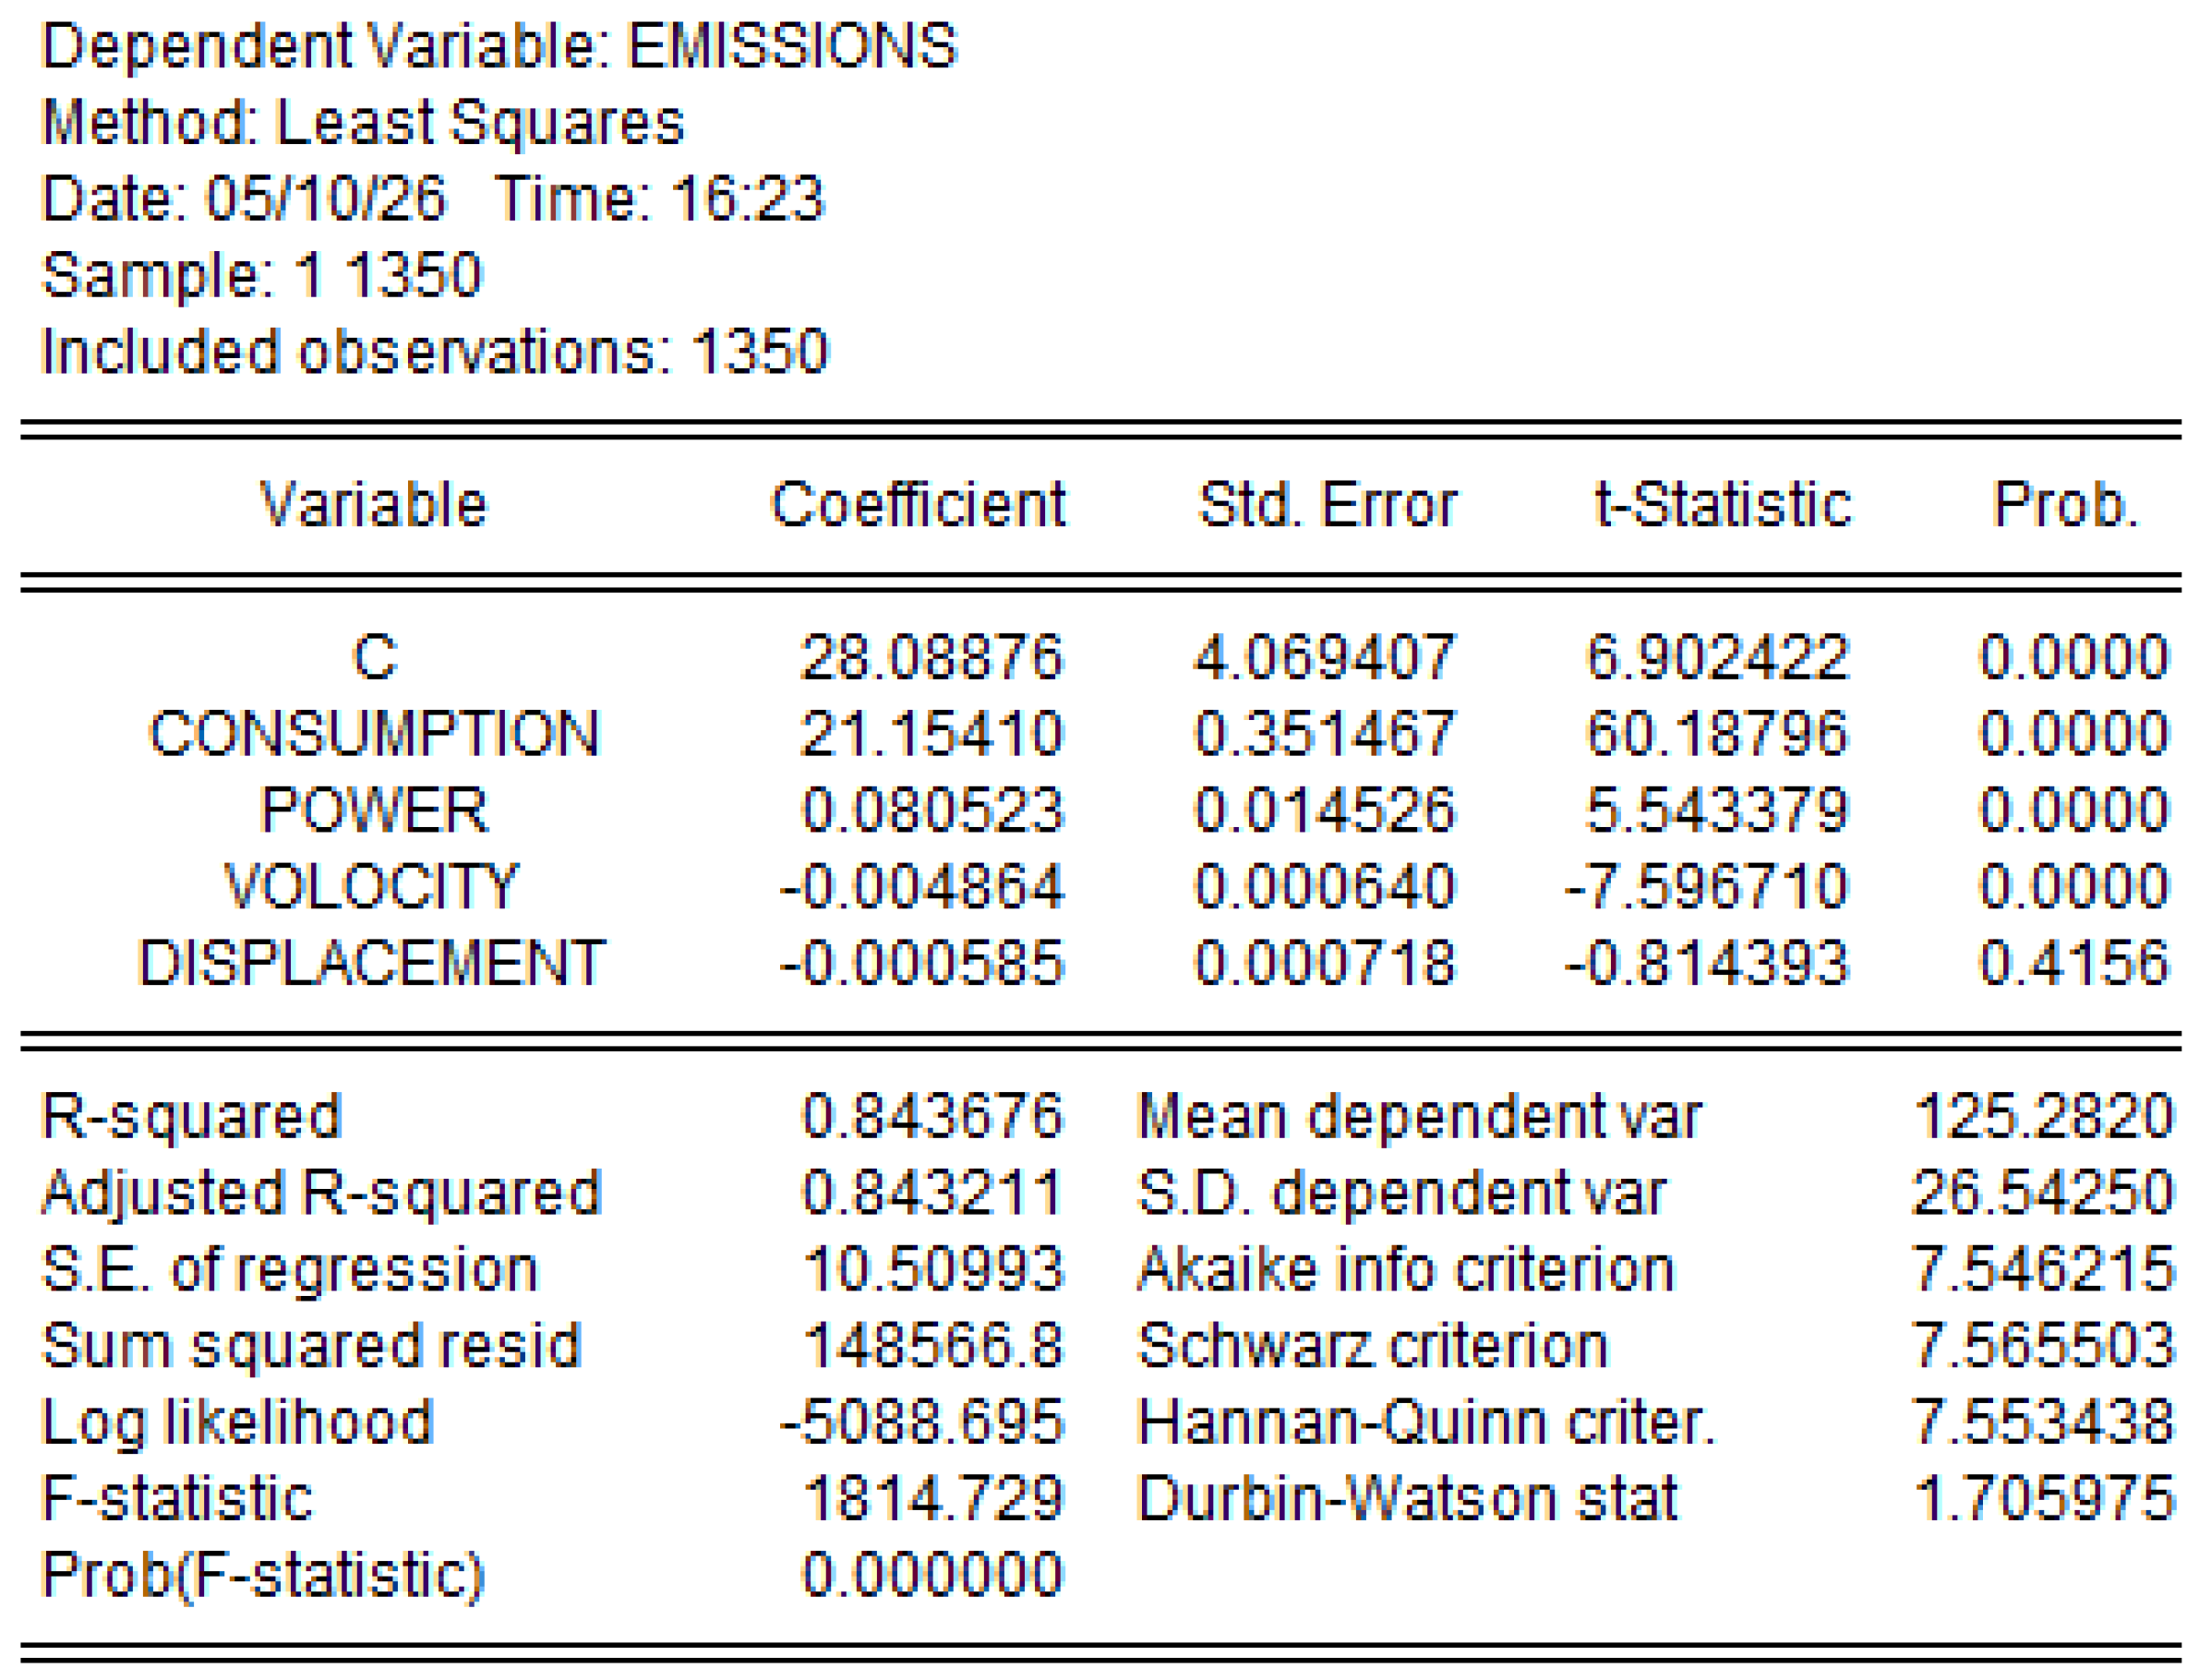
The probability of the t-statistics test is less than 0.05, which indicates that the variables introduced into the model are well chosen and produce effects on the endogenous variable. The value of R2 is 0.8436 for vehicles with low CO2 emissions and 0.8272 for vehicles with high CO2 emissions vehicles which indicates a strong influence of the independent variable (exogenous) on the dependent variable (endogenous). The probability of the F-statistics test is less than 0.05, which indicates that the model is valid. The Durbin–Watson test indicates the correlation between the model errors, as shown in Figure 19 and Figure 20.
The Durbin–Watson statistic for the regression model for vehicles with low CO2 emissions is 1.7059. With 1350 observations and four explanatory variables, this value is close to 2, indicating that there is only weak positive autocorrelation in the residuals. Since the statistics do not fall below the lower bound for serious autocorrelation at this sample size, it suggests that the assumption of no first-order serial correlation is not substantially violated, and the model’s error terms can be considered approximately independent, as shown in Figure 19 and Figure 20.
The Durbin–Watson statistic for the regression model for vehicles with high CO2 emissions is 1.6970. With 1350 observations and four explanatory variables, this value is slightly below 2, indicating the presence of mild positive autocorrelation in the residuals. The value remains within a range that does not suggest severe autocorrelation, implying that the assumption of independence of errors is not strongly violated for this model, as shown in Figure 19 and Figure 20.
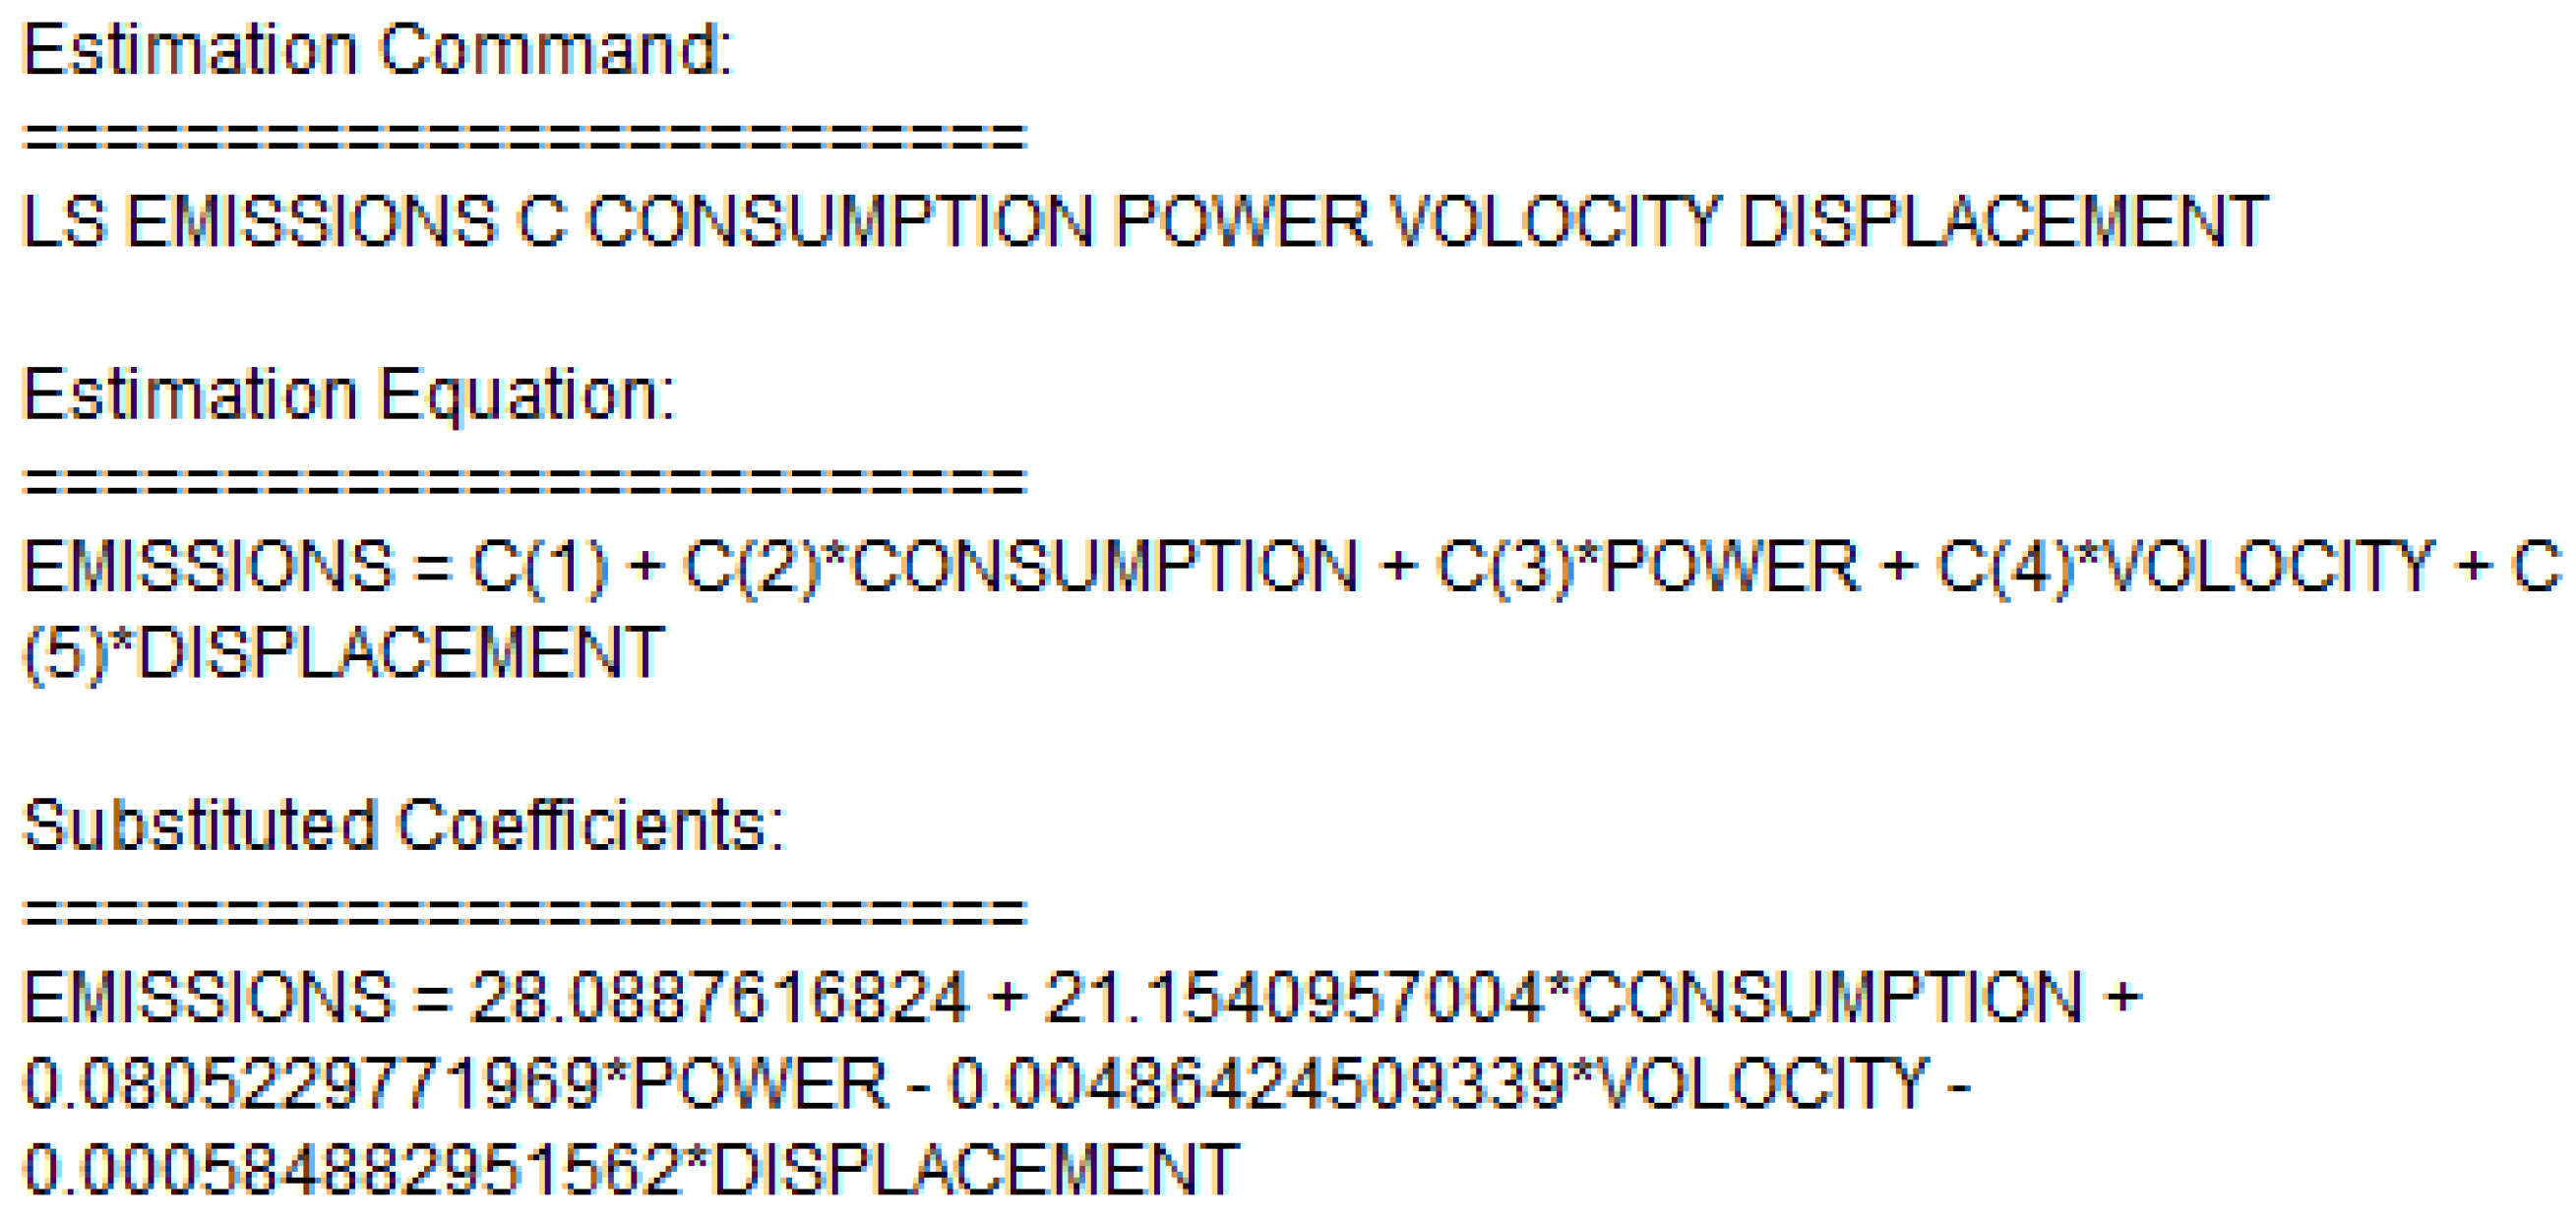
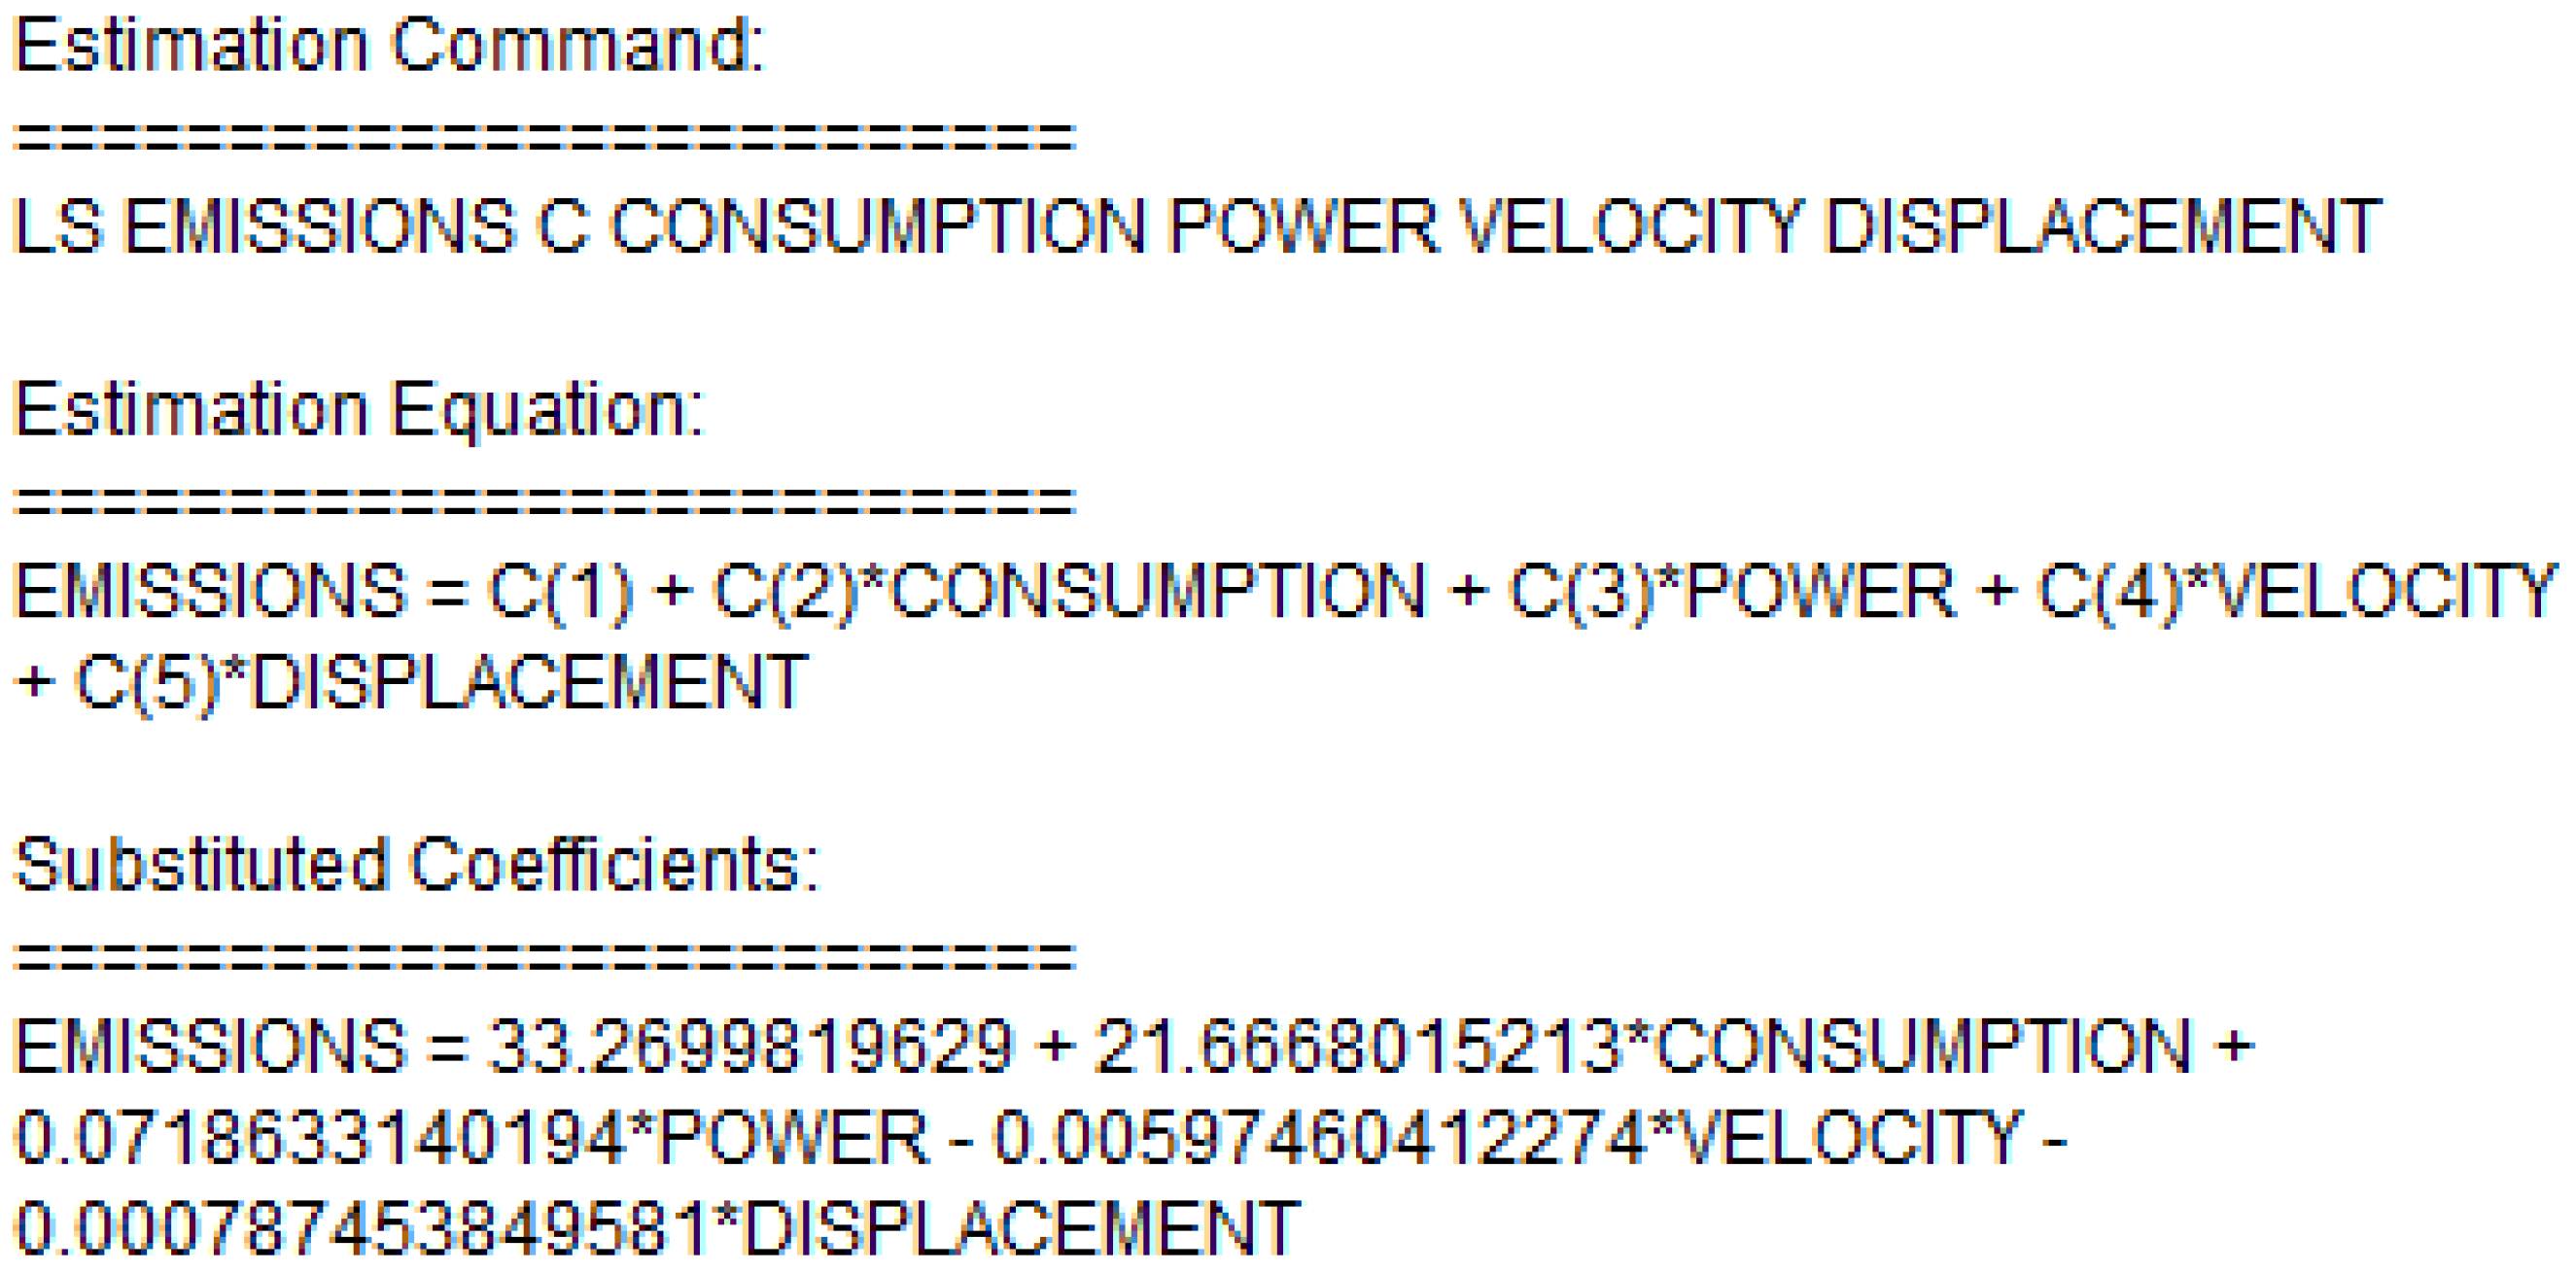
The mathematical representations of the multiple regression models are shown in Figure 21 and Figure 22.
The following model is considered:
y t = a · x 1 + b · x 2 + c · x 3 + d · x 4 + e
Following modelling, using the EViews 12 program, the multiple linear regression equation for vehicles with low CO2 emissions becomes:
y t = 21.1540 · x 1 + 0.0805 · x 2 0.0048 · x 3 0.0005 · x 4 + 28.0887
Following modelling, using the EViews 12 program, the multiple linear regression equation for high-emission vehicles becomes:
y t = 21.6668 · x 1 + 0.0718 · x 2 0.0059 · x 3 0.0007 · x 4 + 33.2699
The influence of other independent variables on the amount of CO2 emission, besides fuel consumption, was analysed, such as maximum engine power expressed in kW (x2), speed corresponding to maximum engine power expressed in rpm (x3), and total engine displacement expressed in cm3 (x4). Engine power reflects vehicle performance and influences fuel consumption and emissions. Total displacement indicates engine size and correlates with CO2 and NOx output. Engine speed affects engine efficiency. These parameters were selected for their significance in explaining emission patterns in hybrid vehicles, enabling a nuanced analysis of CO2 and NOx trends.
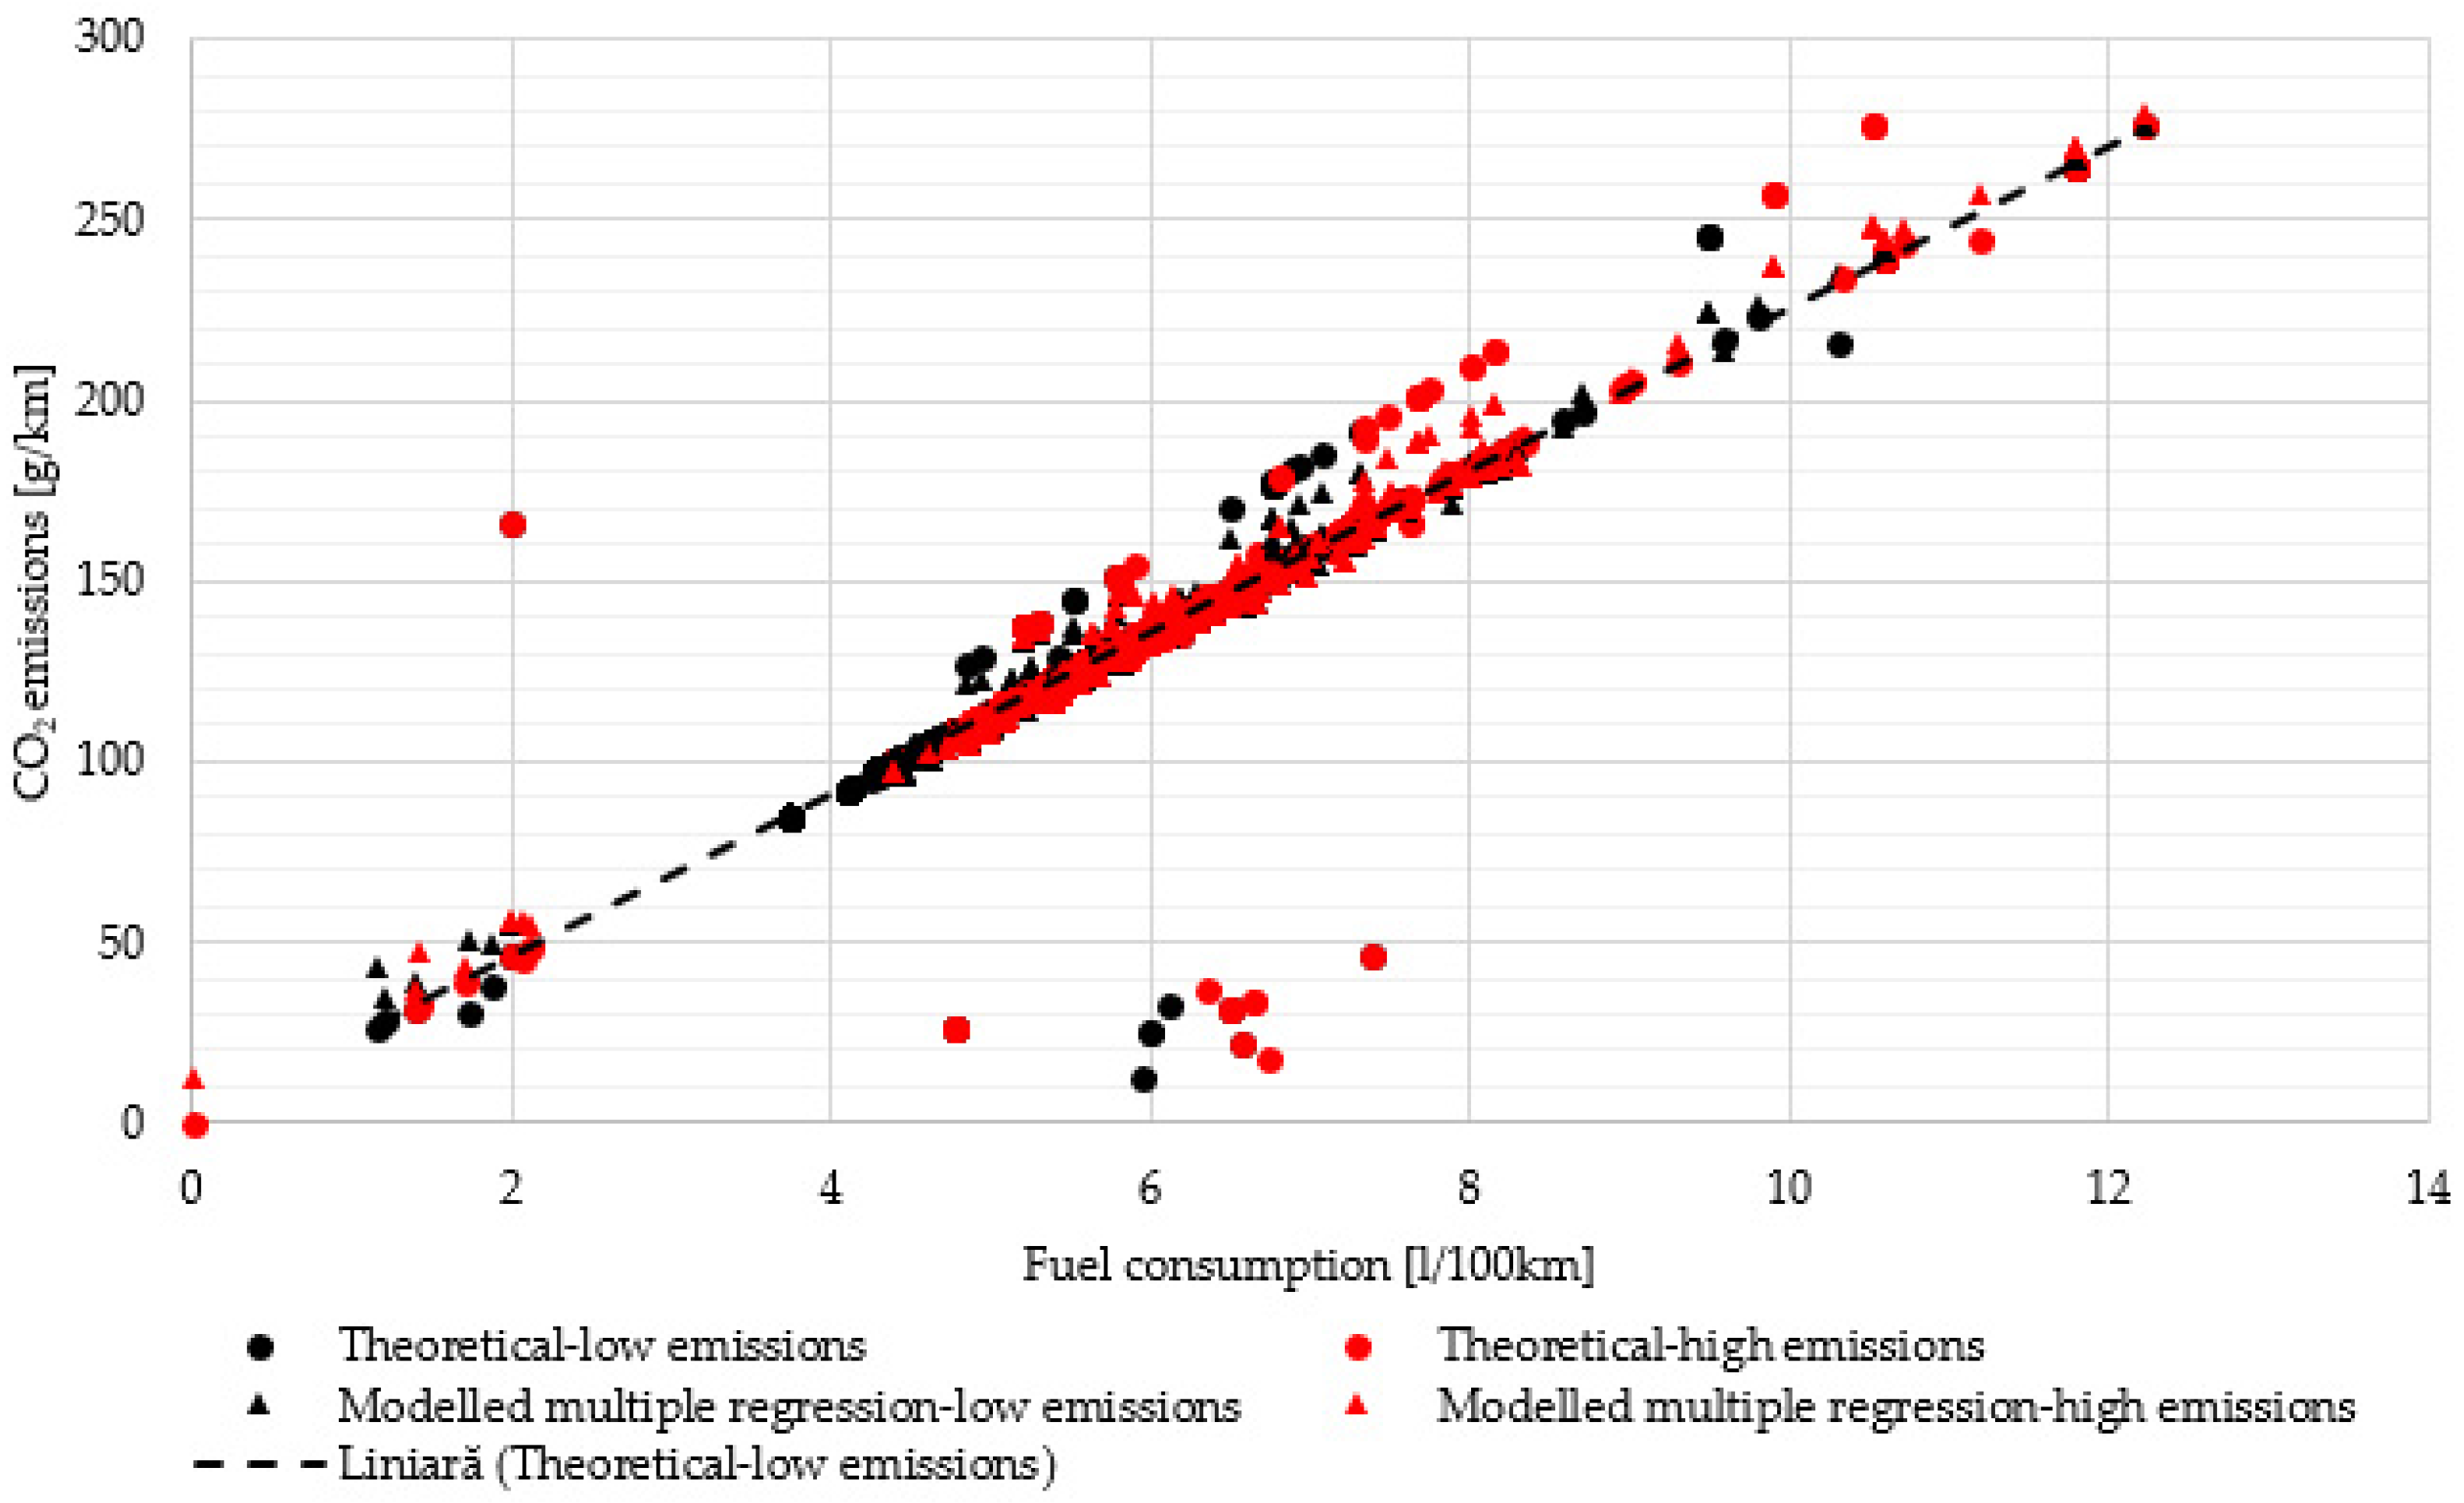
The graph shows a linear trend and a direct relationship between CO2 emissions and fuel consumption. If fuel consumption increases, CO2 emissions also increase. The distances from the points on either side of the regression line to the regression line are represented by the residuals. The smaller this distance is, the smaller the residuals are Figure 23.
The results of the multiple linear regression estimation for low-emission vehicles indicate that CO2 emissions variation is explained by 84.37% of the included independent variables (Adjusted R2 = 0.8432), the model being statistically valid (F = 1814.729; p < 0.001). Fuel consumption exerts the strongest positive impact on emissions, an increase of 1 L/100 km determining, ceteris paribus, an average increase of 21.15 units in emissions (β = 21.1541; p < 0.001). The maximum engine power also positively influences emission levels, the coefficient of 0.0805 indicating an average increase of 0.08 CO2 units for each additional kW (p < 0.001). In contrast, the RPM at maximum power shows a negative and statistically significant coefficient (β = −0.0049; p < 0.001), suggesting that an increase of 1 rpm is associated with an average reduction of 0.005 emission units, possibly due to superior thermodynamic efficiency at high RPM or a statistical compensation effect in the presence of multicollinearity. Total displacement records a negative coefficient of −0.0006, but the effect is not statistically significant (p = 0.4156), which does not allow rejecting the null hypothesis regarding its lack of influence on emissions. The 15.63% unexplained variation in CO2 emissions could be attributed to factors not included in the model, such as vehicle weight, fuel type, emission reduction technologies, vehicle age, driving style, or traffic conditions. Overall, the results highlight fuel consumption and engine power as the main determinants of emissions, while interpreting the effect of RPM and displacement requires caution, as shown in Figure 19, Figure 21 and Figure 23.
The multiple linear regression analysis for high-emission vehicles indicates that the independent variables explain 82.68% of the variation in CO2 emissions (adjusted R2 = 0.826757), with the model being statistically significant at the 1% level (F-statistic = 1610.441, Prob(F) = 0.0000). Fuel consumption is the primary determinant (β = 21.6668, p < 0.001), raising emissions by 21.67 units per 1 L/100 km increase. Engine power also positively influences emissions (β = 0.07186, p < 0.001), adding 0.072 units per kW. Maximum velocity has a small negative effect (β = −0.005975, p < 0.001), reducing emissions by 0.006 units per rpm increase, likely due to improved engine efficiency at higher speeds. Displacement shows a non-significant negative coefficient (β = −0.000787, p = 0.3041), meaning it does not materially affect emissions once consumption and power are controlled. The intercept (33.27, p < 0.001) represents the estimated emission level when all predictors are zero. The model leaves 17.32% of the CO2 emissions variation for high-emission vehicles unexplained. This proportion can be attributed to the unincluded factors, which are the same as in the previous case, as shown in Figure 20, Figure 22 and Figure 23.
The effect structure is very similar to the low-emission model. Consumption and power increase emissions, velocity decreases them, and displacement has no significant impact. The main difference is in the average emission level: the dependent variable mean is 136.17 for high emissions vs. a lower value in the first case.
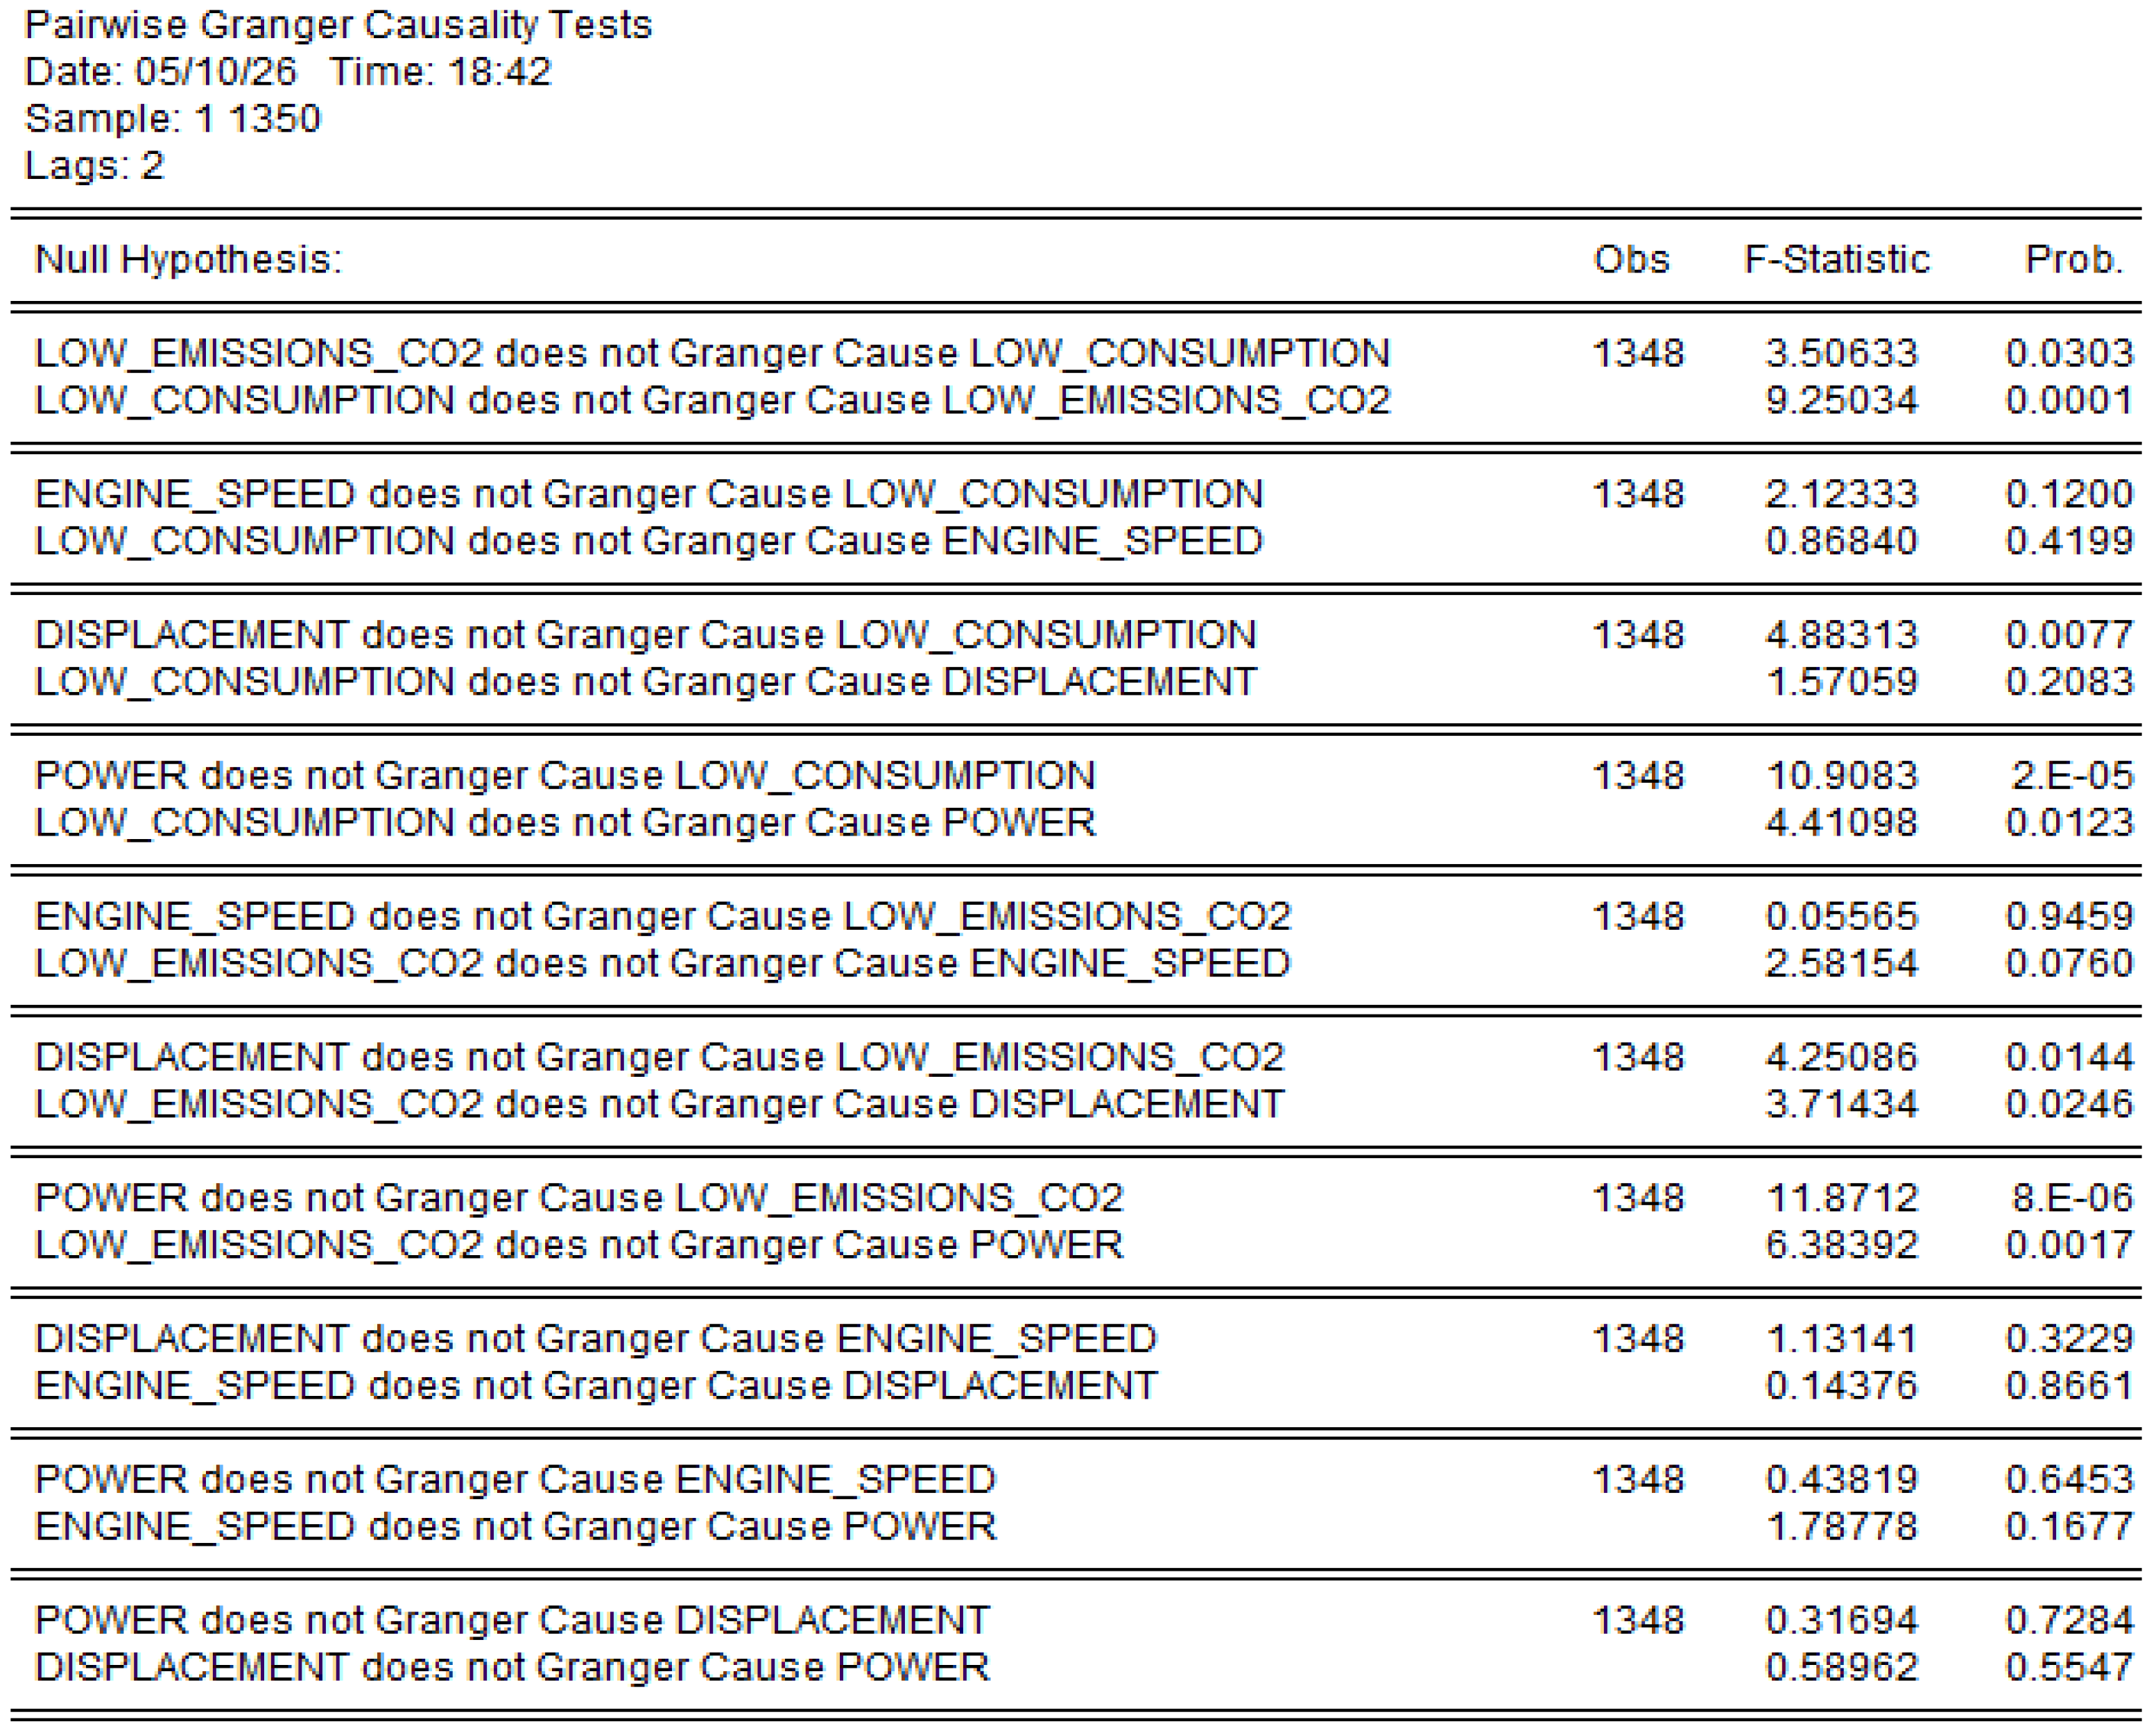
The results of the Pairwise Granger Causality Test highlight the existence of dynamic interdependencies and a strong predictive capacity among the analysed technical and environmental variables. The rejection of the null hypotheses at a high significance level (Prob < 0.05) confirms a bidirectional causal relationship between CO2 emissions, fuel consumption, and engine power, demonstrating that the historical evolution of these indicators provides essential statistical information for their mutual forecasting. Additionally, a unidirectional econometric link was validated from engine displacement to fuel consumption, alongside a bidirectional relationship with CO2 emissions. Conversely, engine speed proved to be completely isolated in terms of temporal causality regarding CO2 emissions (Prob = 0.9459), indicating that its past variations do not exert a direct predictive influence on the pollution indicator within the considered timeframe and selected lags, as shown in Figure 24.
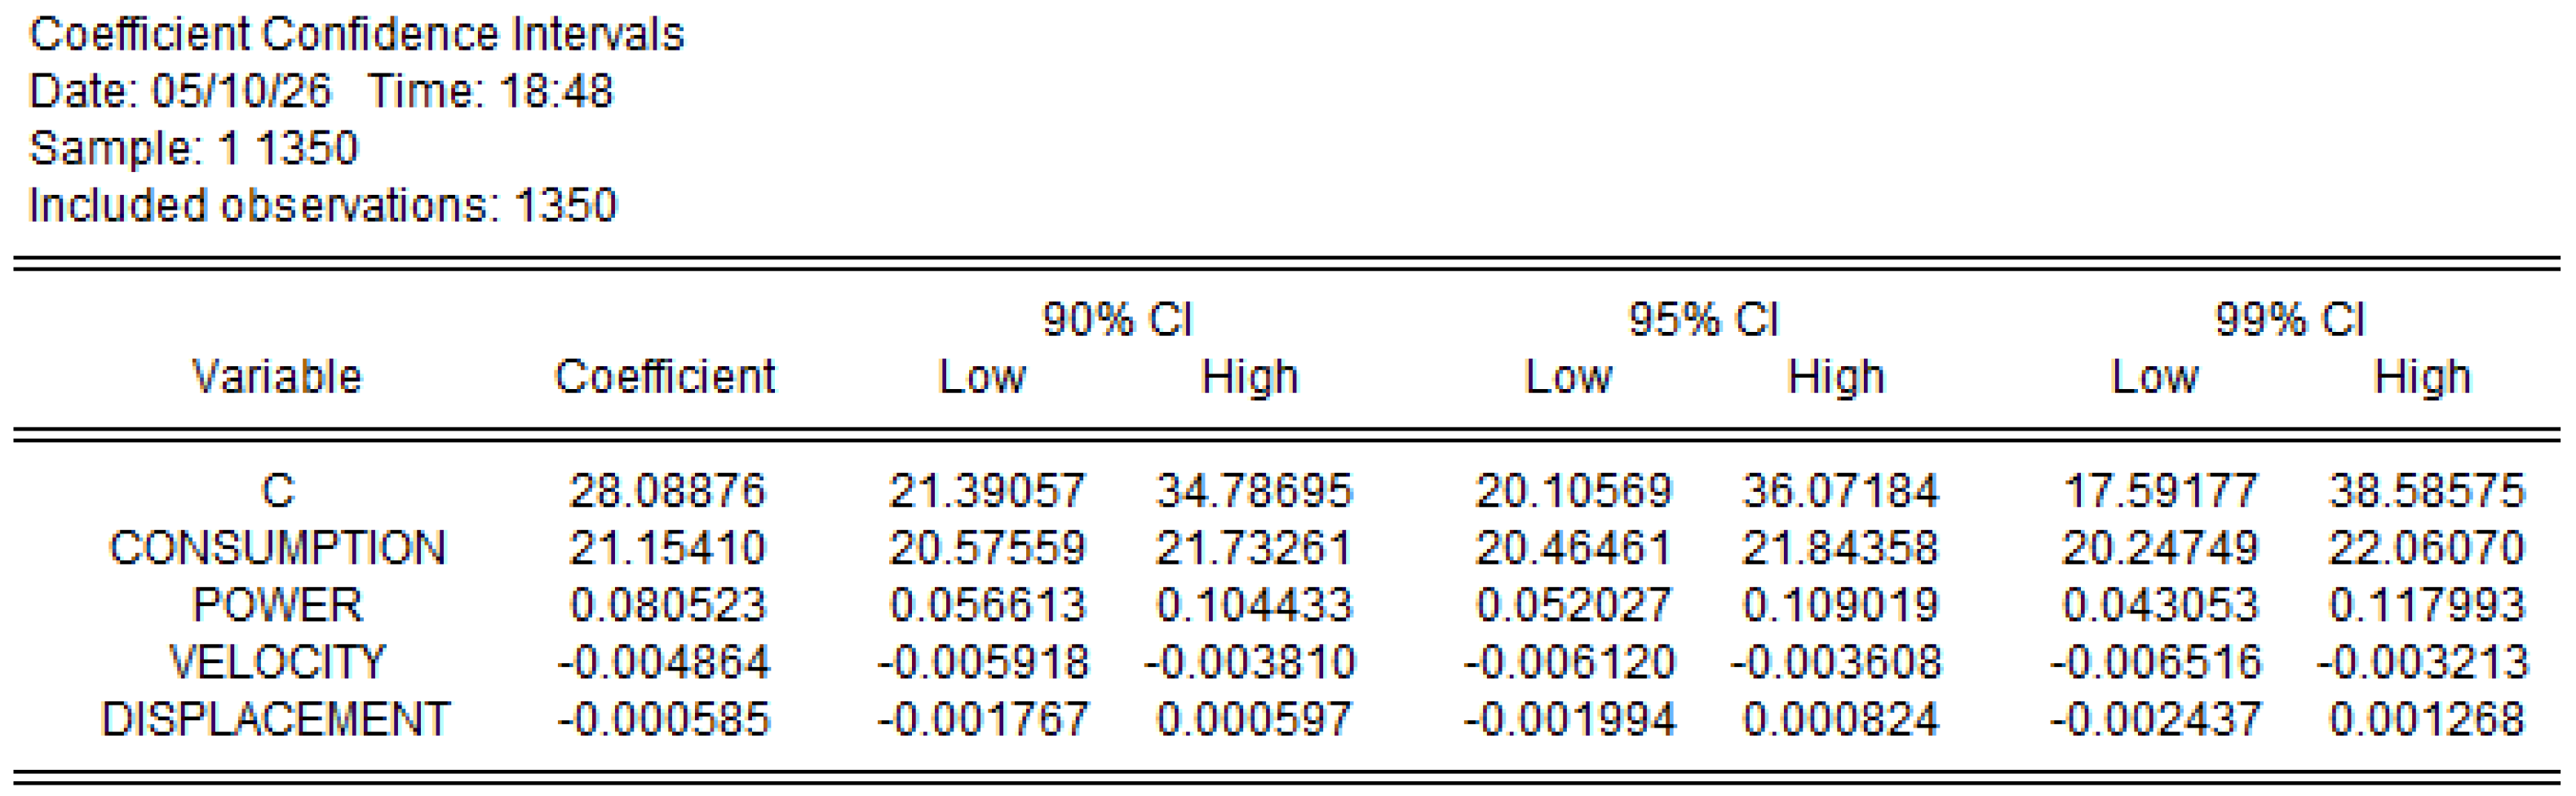
The confidence interval results for all variants analysed in the model are shown in Figure 25. The image shows the results of the econometric estimation generated with EViews 12, highlighting the confidence intervals at the 90%, 95%, and 99% levels for the model coefficients, which allows the assessment of the statistical significance and robustness of the parameters associated with the analysed variables.

2.3.5. Residue Analysis

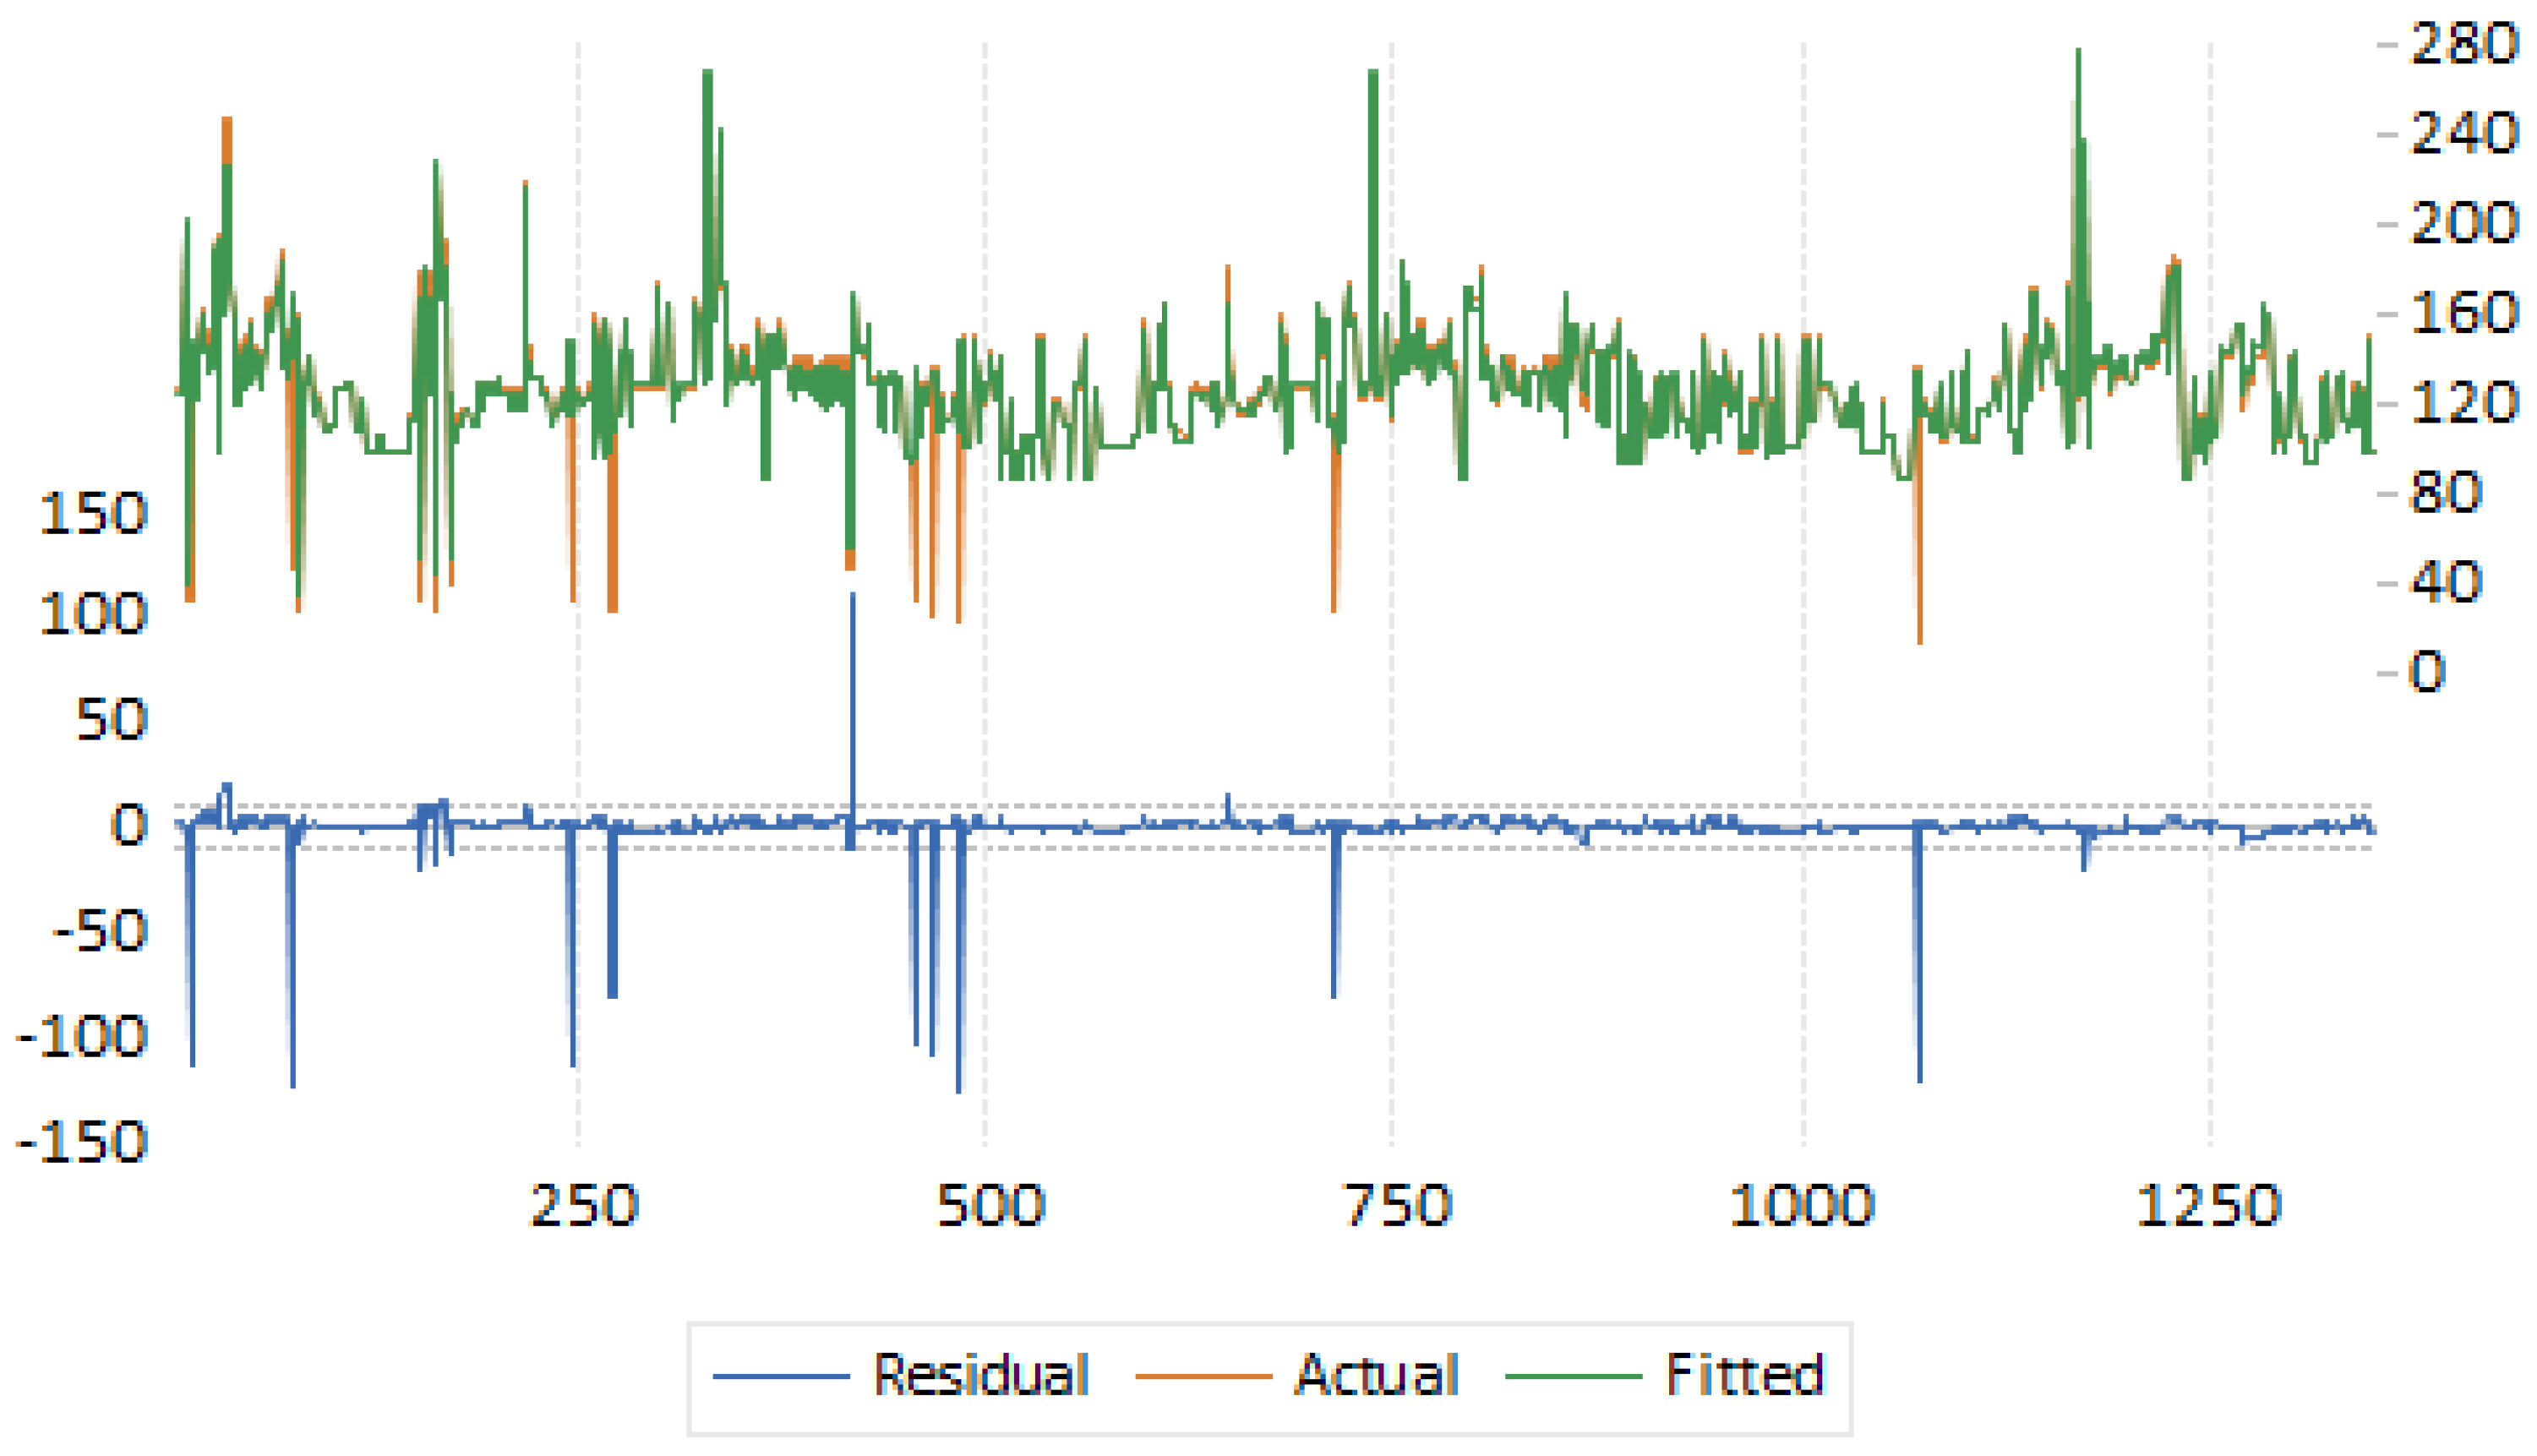
Figure 26 shows the residual analysis for the estimated model regarding vehicles with low CO2 emissions. There is an almost complete overlap between the actual values series (Actual) and the fitted values (Fitted), indicating a good ability of the model to capture the trend and level variations of the dependent variable. In the lower part, the residuals oscillate around zero, except for a few isolated peaks, suggesting the absence of a systematic error and a correct specification of the model.

3. Discussion

There is an urgent need for single policies at the European level to support less developed countries. EU funds are needed for charging infrastructure and to stimulate the purchase of hybrid vehicles. Car manufacturers should expand their networks and offerings in both Central and Eastern Europe. They should also adapt their product range to local purchasing power. In Eastern European countries, consumers still perceive hybrid vehicles as expensive or unnecessary, due to poor infrastructure. Information campaigns and “Rabla Plus” campaigns could change this perception. The distribution of hybrid vehicle registrations in the EU in 2024 reflects major inequalities between West and East. While technology is available, access to it is unequal. The European Union should reduce these gaps if it wants a fair and efficient green transition. If fuel prices remain high and EU emissions policies tighten, we may see a levelling out of the percentages, with a notable increase in the countries currently at the bottom of the ranking. Countries with already high percentages will gradually start to migrate towards fully electric vehicles, which could lead to stagnation or even a relative decline in the percentage of classic hybrids in 5–10 years. Overall, the data confirms that while hybrids can achieve very low consumption under optimal conditions, their performance can vary considerably depending on the operating mode. Taking Poland as a reference country, a quantity of 1821.34 t N2O from land transport and pipelines are the equivalent of 482,654.04 t CO2, which means that approximately 1 t of N2O emission = 265 t of CO2 equivalent emission.
Policy recommendations:
  • Differentiated measures according to national emissions profile: for countries with low emissions (e.g., Finland, Estonia), focus on maintaining performance and investing in emerging technologies. For high-emission countries, implement urgent and strict measures to limit major N2O sources.
  • Reducing interstate disparities: EU should introduce financial and technological support for countries with weak infrastructure, facilitating access to electrified transport and emission reduction technologies.
  • Targeted policies for large emitters: Interventions in countries with extreme emissions (e.g., progressive emission tax schemes, subsidies for zero-emission vehicles, modernisation of pipeline networks) could produce significant reductions.
  • Increasing the accuracy of monitoring: Harmonise emission measurement and reporting methodologies to ensure comparability and statistical reliability.
  • Integrating pipeline transport into decarbonisation strategies: Upgrade pipeline infrastructure and use low-carbon energy sources.
  • Closely monitoring policy effects: Distinguish between cyclical declines and sustainable structural changes.
  • Cooperation and exchange of good practices: Support tech transfer, expertise, and regulatory models from low-emission countries to others.
The EU’s green mobility agenda is mirrored in the recent literature, with a bibliometric analysis (2015–2024) revealing increased research on hybrid/electric vehicles, particularly in Western Europe. This aligns with our finding that countries like Germany and France lead hybrid adoption, likely due to stronger innovation ecosystems and policy support. Germany, for instance, has attracted significant investments in battery and EV manufacturing, reinforcing its market dominance. However, the geographic disparity in adoption underscores the need for targeted EU policies.
While countries like Finland and Estonia leveraged tax incentives and small fleet sizes to exceed EU averages in 2024, Eastern Europe lags due to infrastructure gaps and economic constraints. Bridging these divides is critical to achieving the EU’s Green Deal goals, as uneven transitions risk deepening regional inequalities. Future research should explore tailored strategies for Eastern Europe, focusing on affordable hybrid imports and public–private partnerships to accelerate fleet modernisation.
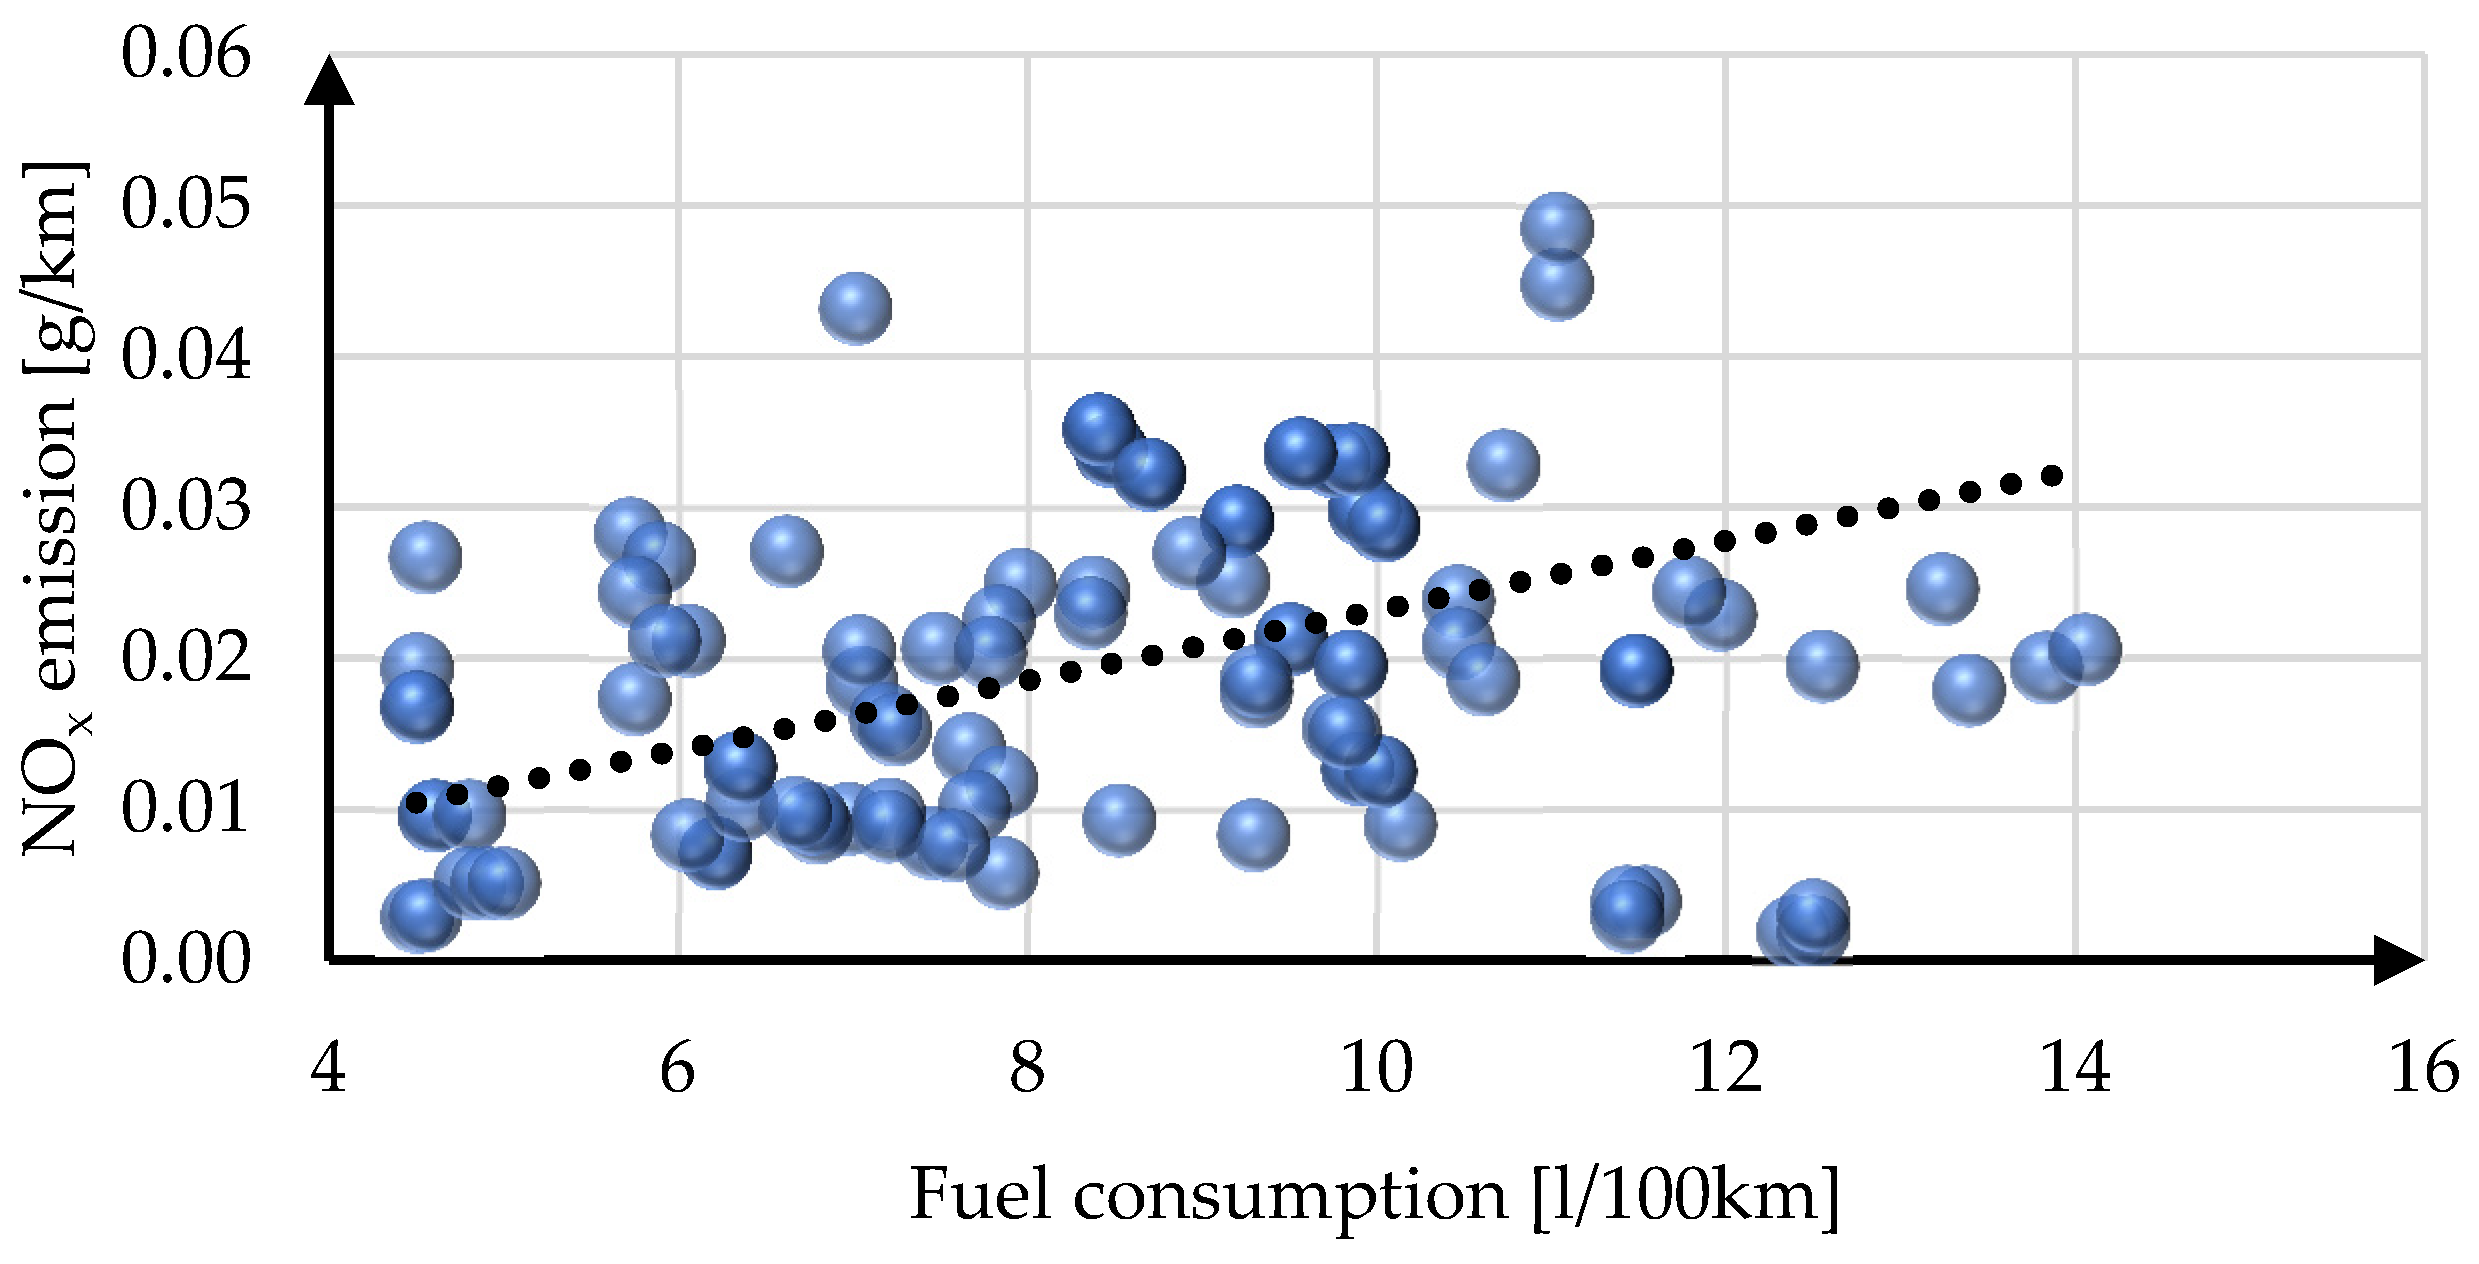
Although in theory there is a relationship between nitrogen oxide emissions and fuel consumption, actual data may present a different picture due to the variability and complexity of real systems, as shown in Figure 27.
Possible reasons why the theoretical relationship is not clearly reflected in these data include:
  • Influence of other factors: Emission control technologies, driving conditions, engine condition, and other parameters can mask the direct relationship between fuel consumption and NOx emissions.
  • High dispersion of the data: If the data is very dispersed or if there are many outliers, this can weaken the apparent correlation.
  • Lack of a linear relationship: The actual relationship between the variables may not be linear, which causes the linear correlation coefficient to not correctly capture the relationship between them.
  • Even after removing outliers, the R-squared value remains very small, still indicating a weak correlation between nitrogen oxide emissions and fuel consumption. It is possible that the relationship between these variables is more complex and requires further analysis or the inclusion of other factors to be better understood.
Given these considerations, we used a non-linear model to better approximate. Furthermore, in addition to fuel consumption, other variables such as maximum engine power, maximum power speed, and engine displacement as well as iterations were introduced into the model.
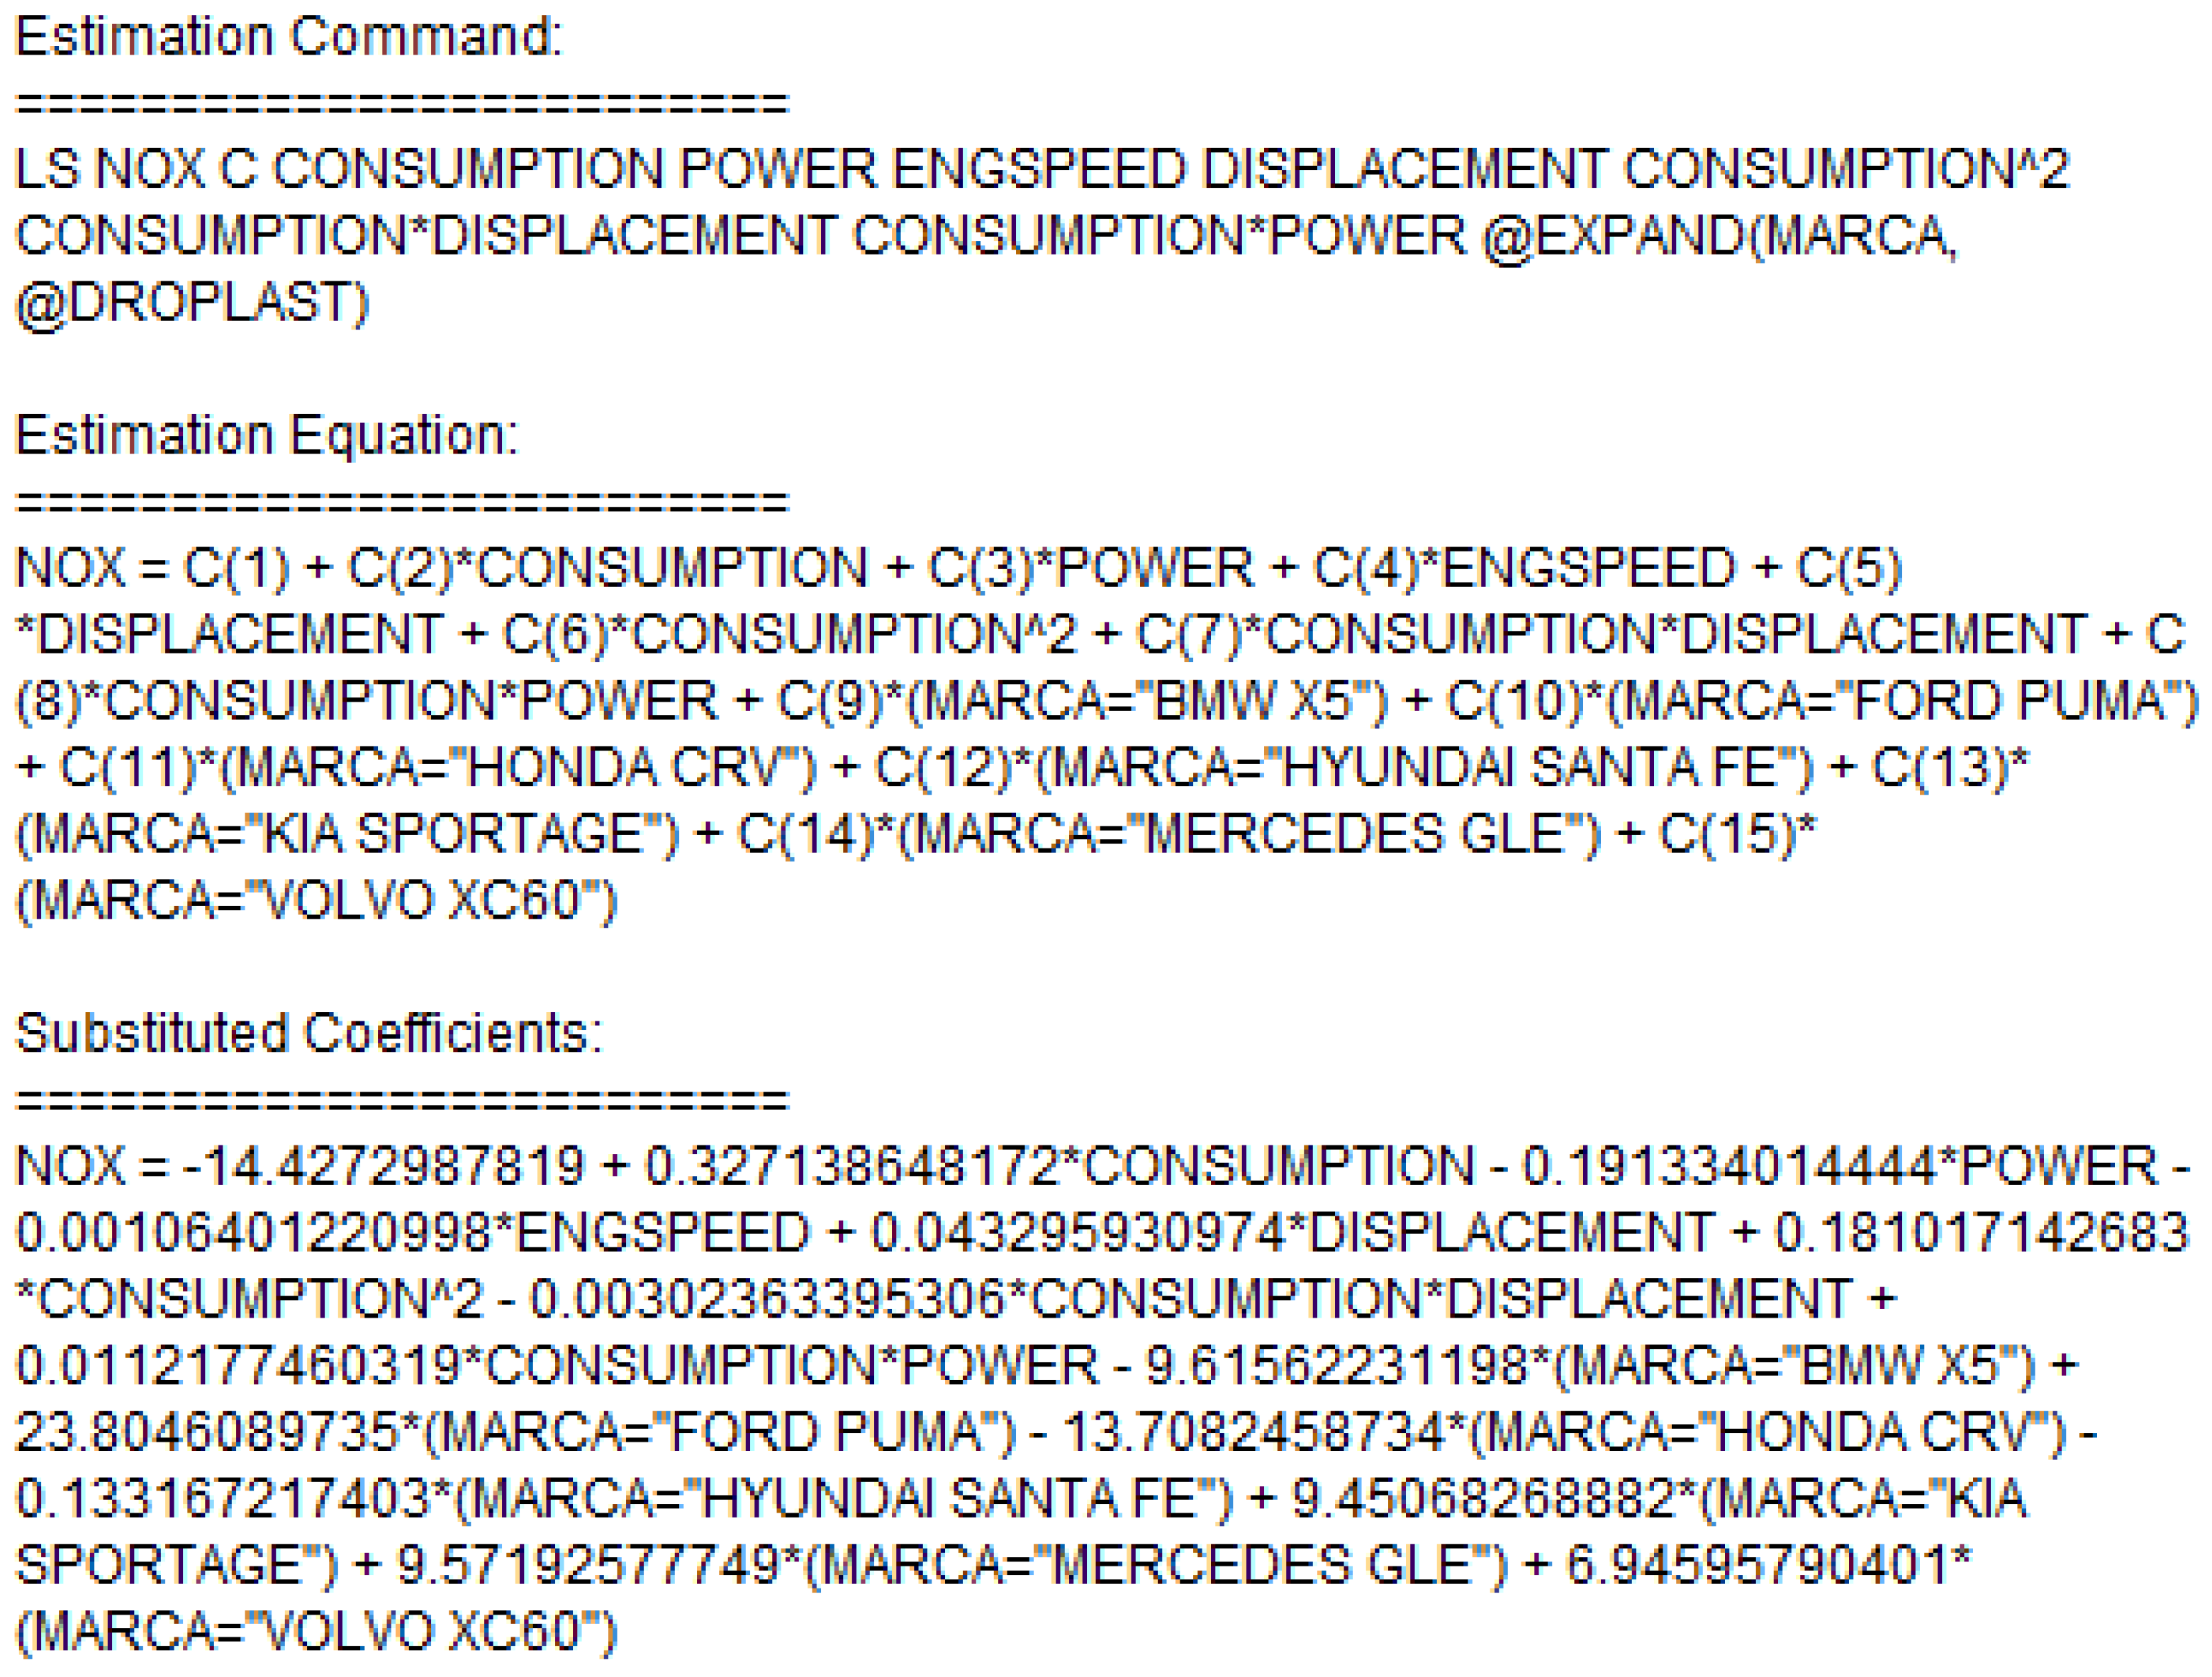
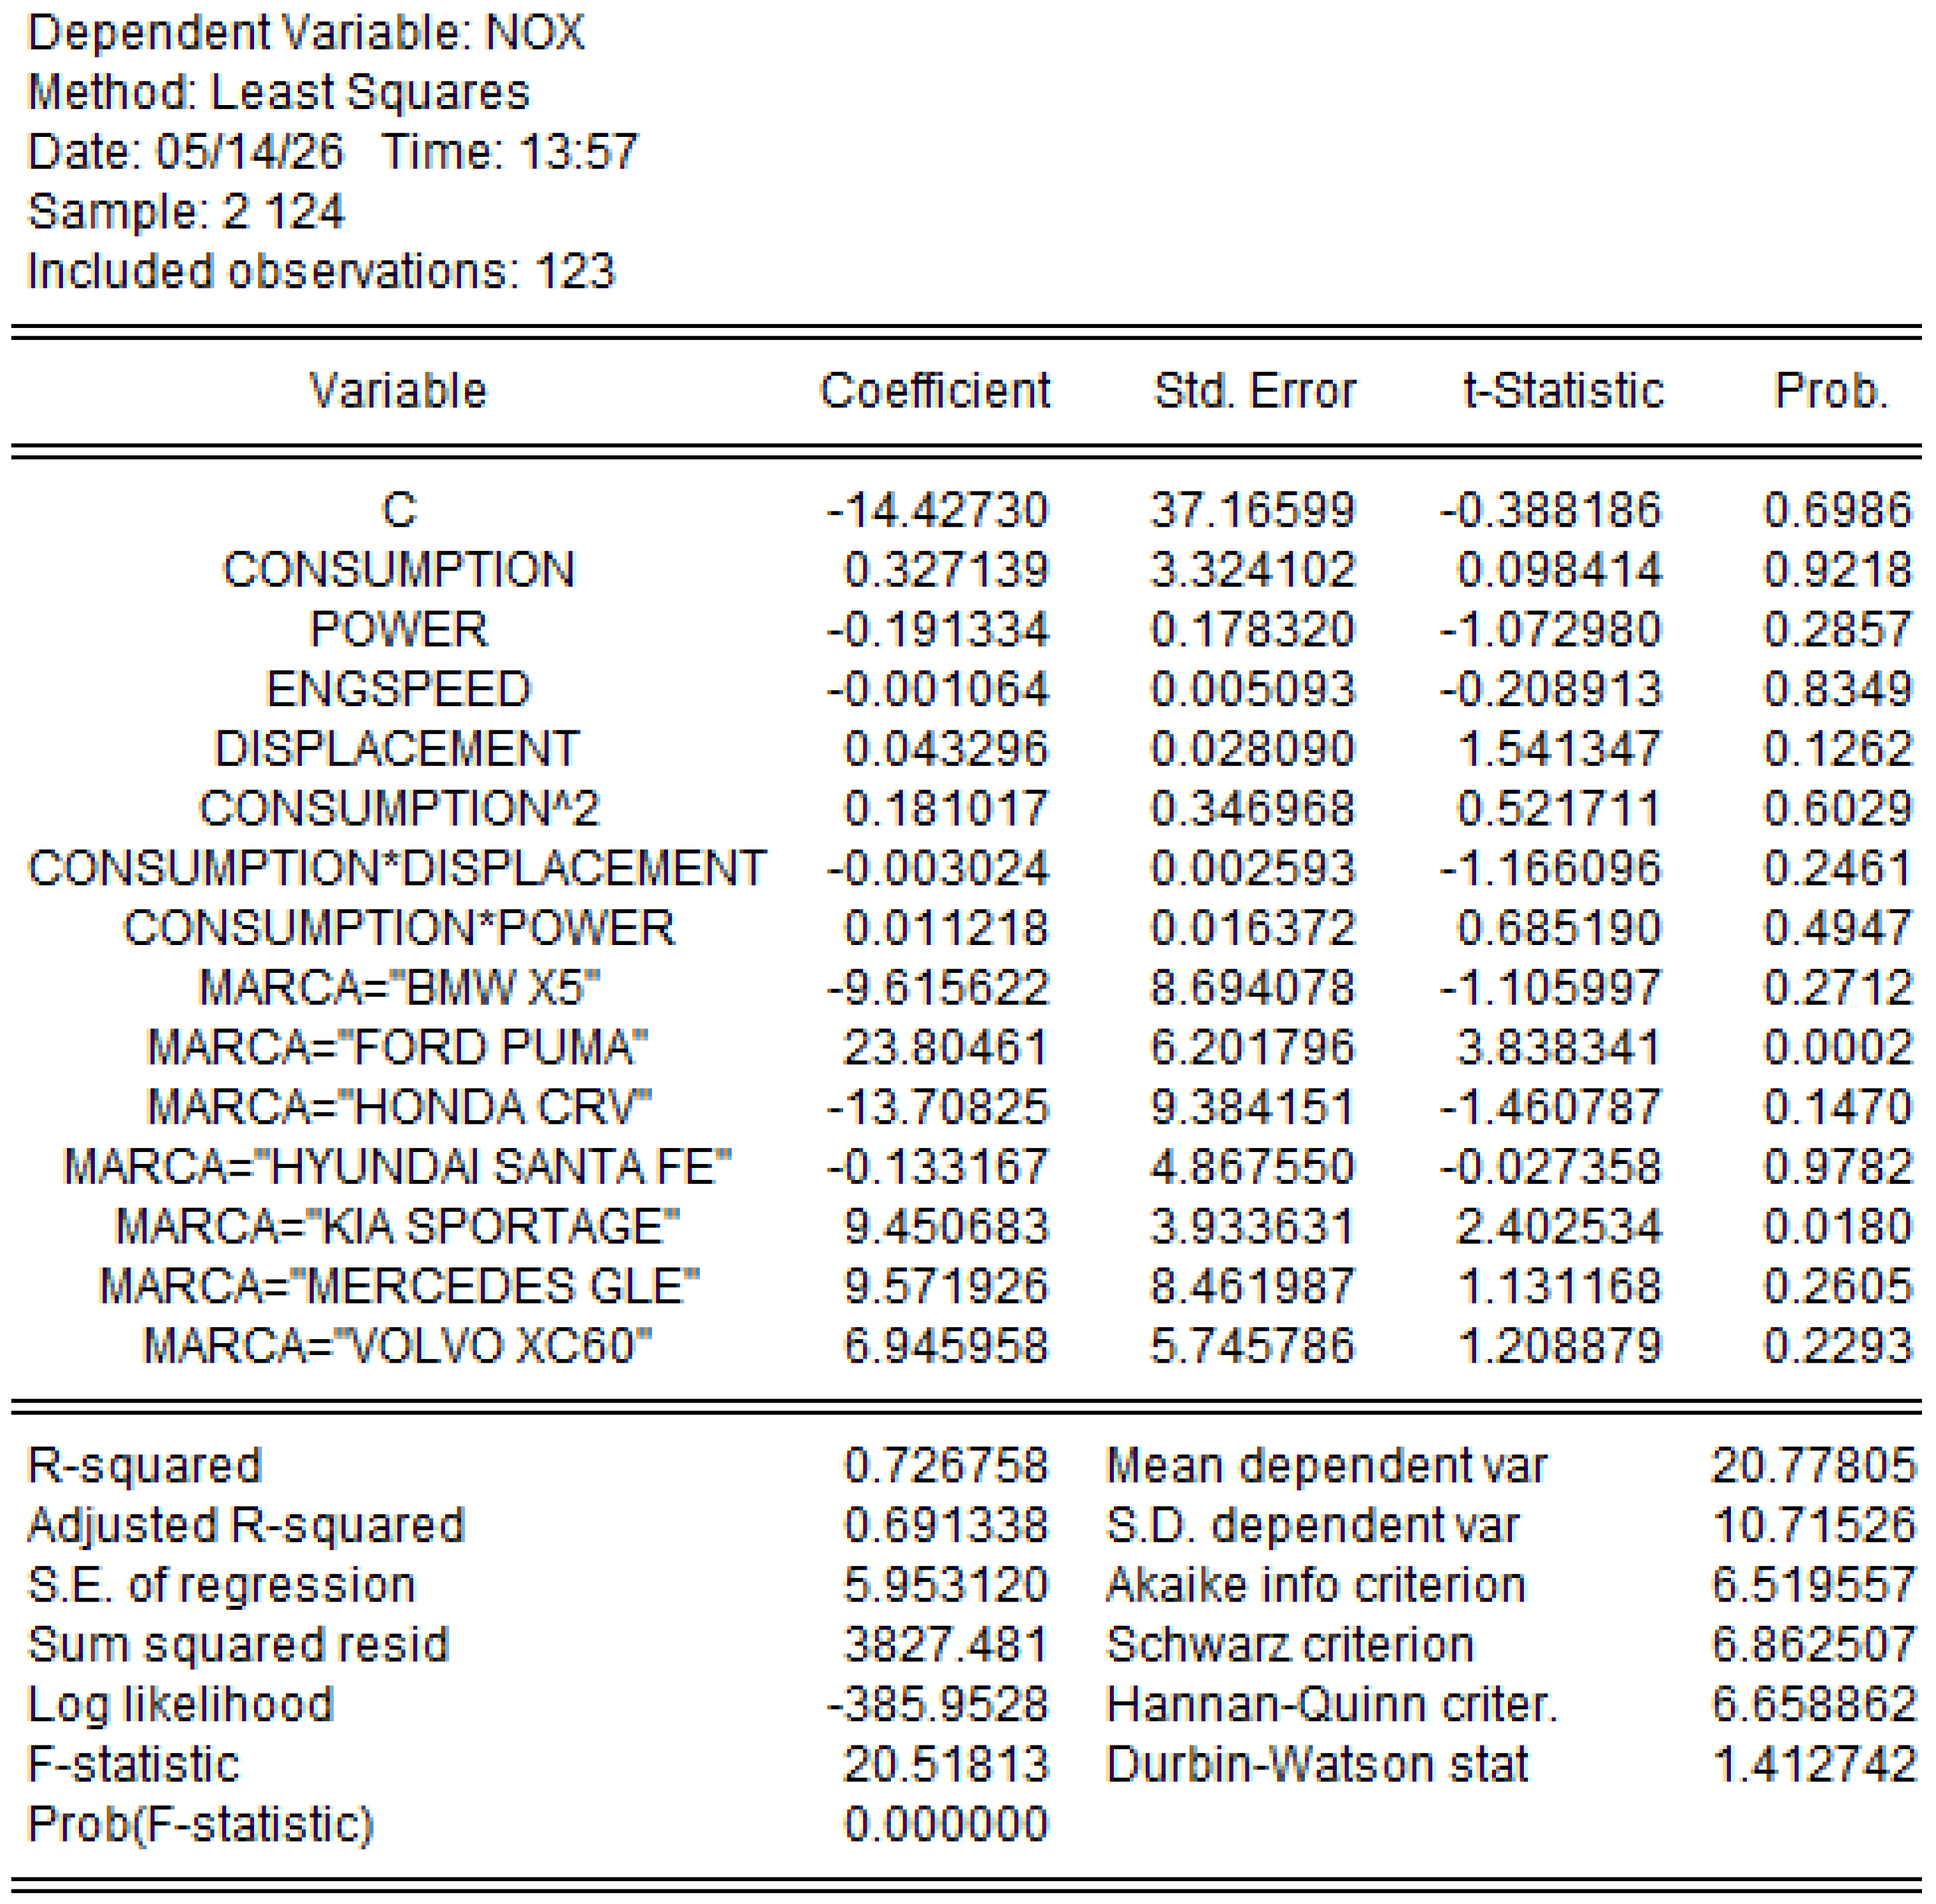
To evaluate the complex interactions between design parameters and the dynamic behaviour of emissions, a multiple non-linear regression model was estimated using the Ordinary Least Squares (OLSs) method. The statistical results indicate a robust performance of the proposed model, with a high coefficient of determination (R2 = 0.726), demonstrating that the mathematical approximation explains approximately 72.6% of the total variability in NOx emissions across the sample of 123 multi-brand observations. The overall superior significance of the equation is validated by the F-statistic value (20.51, with p < 0.0000). Based on the descriptive analysis of the coefficients, the impact of technological after-treatment differences among manufacturers dominates the overall emissions behaviour. Consequently, sub-samples associated with compact vehicles or specific architecture display critical variations, with highly statistically significant correlations observed for the Ford Puma (β = 23.80, p = 0.0002) and Kia Sportage (β = 9.45, p = 0.0180) models relative to the reference category. Although the cumulatively introduced non-linear terms (consumption2, consumption x displacement, and consumption x power) exhibit a degree of structural collinearity with p-values > 0.05, their simultaneous integration successfully isolated scale effects and stabilised the model’s residuals, yielding a Durbin–Watson statistic of 1.41, which is considered optimal for the transient modelling of pollutant emissions in hybrid electric vehicles, as shown in Figure 28.
The final econometric model, determined via the Ordinary Least Squares (OLS) method, quantifies the cumulative impact of technical specifications and operating regimes on nitrogen oxide emissions. The structural equation highlights a highly non-linear dynamic, where the quadratic fuel consumption parameter (β = 0.181) confirms the acceleration of emissions under high thermal loads. Geometric adjustment of the model is achieved through interaction coefficients, where the consumption x displacement term exerts a negative corrective influence (β = −0.003), tempering the specific emissions of large-displacement vehicles during cruising conditions, whereas the consumption x power interaction indicates a positive compounding effect (β = 0.011). Technology segmentation by brand reveals major gaps relative to the reference category (VW Golf); the Ford Puma (β = 23.80), Mercedes-Benz GLE (β = 9.57), and Kia Sportage (β = 9.45) models record higher emissions under identical driving conditions, whereas Honda CRV (β = −13.70) and BMW X5 (β = −9.61) exhibit a decreasing pollutant trend, reflecting the differentiated efficiency of energy management algorithms across the analysed hybrid architectures, as shown in Figure 29.
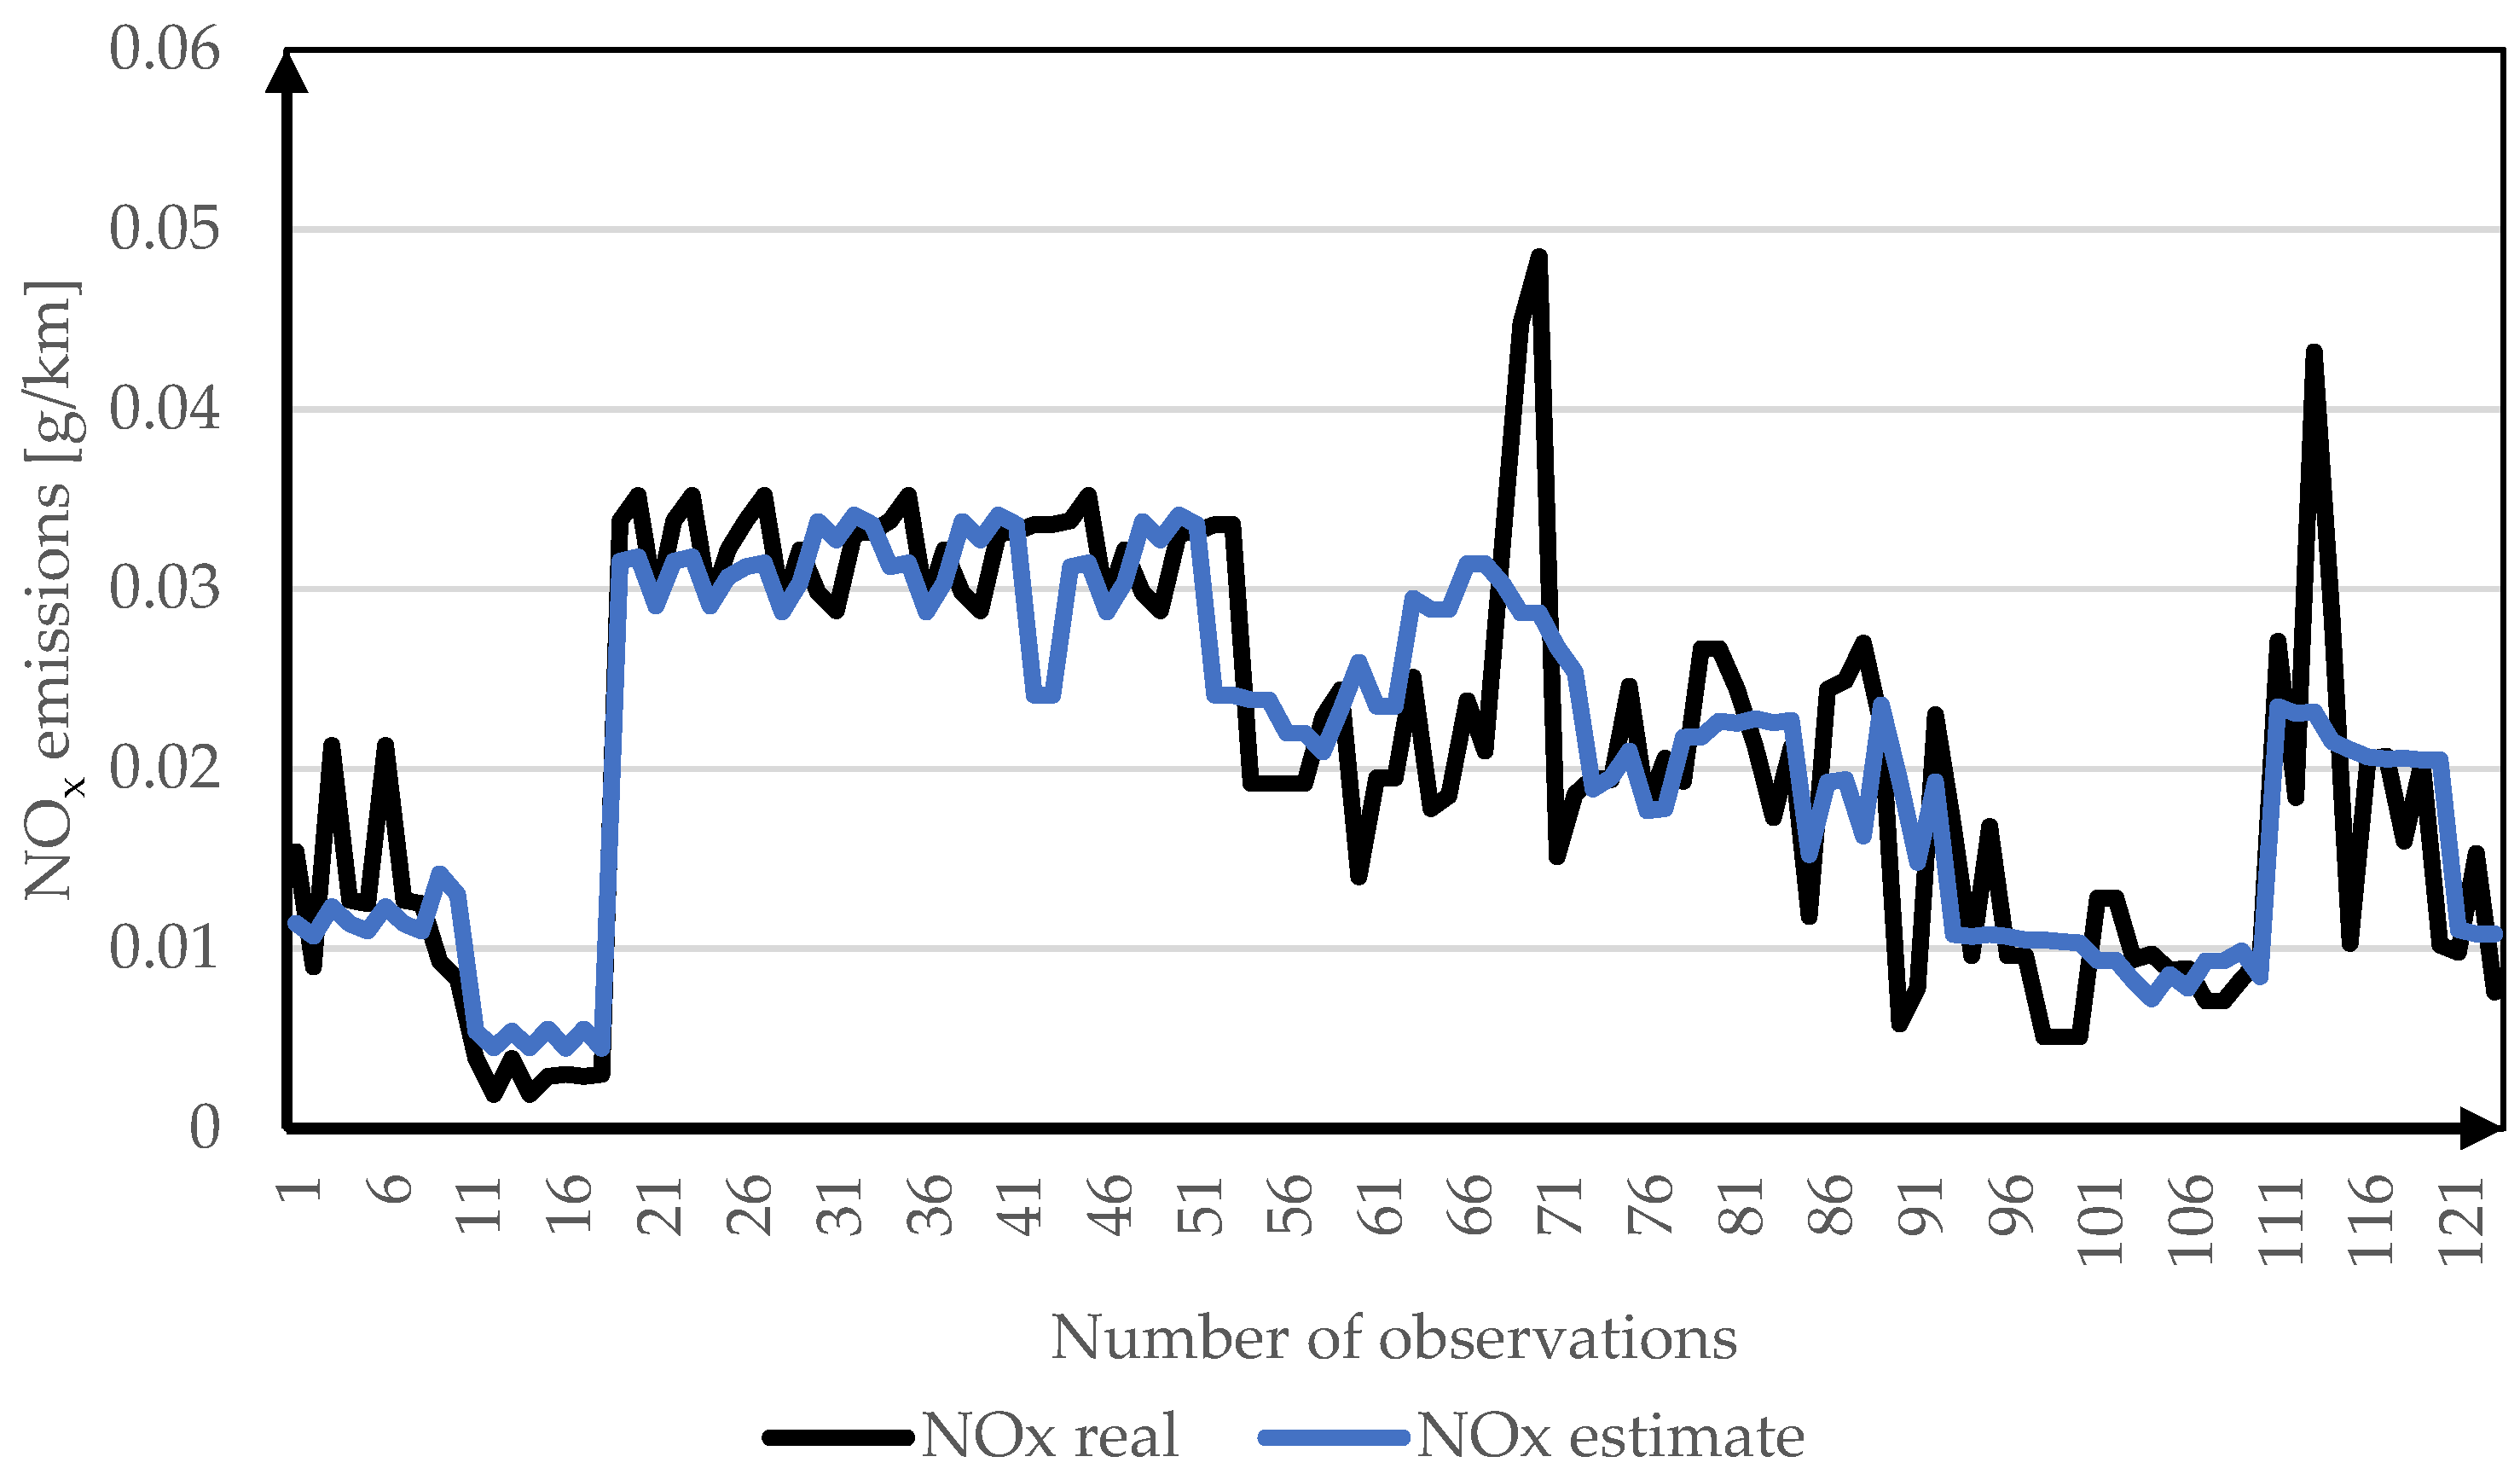
The comparative chart demonstrates a high fidelity of the developed non-linear model, as the estimated curve closely tracks the trends and fluctuations of the actual NOx values across the 123 observations, visually validating the equation’s capacity to capture the transient pollutant emission behaviour of the analysed hybrid vehicle, as shown in Figure 30.

Limitations and Future Research

This study has several limitations that suggest avenues for future research. First, the analysis focuses on hybrid vehicles in the EU, potentially limiting generalizability to other regions. Second, while the sample size is robust for econometric modelling, it may not capture all model-specific variations or emerging technologies. Third, the study examines operational emissions only, excluding lifecycle impacts. Additionally, the econometric models could be enhanced by incorporating vehicle mass as a key predictor for both CO2 and NOx emissions. For NOx modelling specifically, factors like oxygen concentration in the combustion zone, reaction time for Zeldovich mechanism, and temperature in the engine combustion chamber could improve accuracy. The limited NOx data availability also restricted the scope of analysis. Future research could expand the geographical scope, incorporate lifecycle assessments, include additional predictors, and explore newer vehicle technologies.

4. Conclusions

VOSviewer analysis shows that research on NOx emissions from hybrid vehicles between 2015 and 2024 is interdisciplinary, integrating technical measurements and solutions, environmental and health impact assessments, regulations, and advanced testing methods, all interconnected to support emission reduction and the transition to sustainable mobility.
Between 2015 and 2024, research on NOx emissions in hybrid vehicles evolved from optimising combustion processes and energy efficiency to an integrated approach combining advanced propulsion technologies, energy management, and environmental impact assessment, reflecting the increased interest in sustainable solutions and adaptation to strict regulations.
Research from 2015 to 2024 on NOx emissions from hybrid vehicles, reflected by the co-occurrence of keywords in Scopus, highlights a strong thematic core focused on the link between the combustion process, hybrid vehicle performance and impact on air quality, complemented by emerging directions such as optimisation of energy management, use of alternative fuels, and integration of smart technologies, all oriented towards reducing emissions and increasing sustainability.
In conclusion, the data show that agriculture is the main source of NOx emissions, with over 80% of the total, making it the absolute priority for reduction measures, by optimising fertilizer application and efficient manure management. Secondary sectors, such as waste management, manufacturing, energy production, and transport, have smaller contributions but remain relevant due to the combustion processes involved. Service sectors—such as trade, health, or construction—contribute very little to the total level of emissions, which indicates that public policies should be mainly oriented towards the agricultural sector. In the second place, investments in increasing efficiency and improving technologies used in industry and energy would be useful, as these interventions can generate significant and cost-effective emission reductions.
In the case of the hybrid vehicles analysed, experimental measurements show a visible increase in fuel consumption in demanding situations (“Vehicle high”) compared to favourable conditions (“Vehicle low”). This result highlights the major influence that driving style has on the energy efficiency of the hybrid system. In optimal scenarios, these vehicles can achieve low consumption values, specific to economical driving, but the differences between models are significant: some maintain their performance relatively constant, while others register steep increases in difficult conditions. In extreme situations, the consumption of certain hybrids can approach that of conventional cars, which confirms that their advantages are best exploited in gentle driving regimes, such as urban ones.
The results show that 1 t of N2O emitted in road or pipeline transport has a climate effect comparable to around 265 t of CO2. This equivalence highlights the extremely high global warming potential of nitrous oxide and underlines how important it is to reduce even small amounts of emissions.
Considering the direct link between CO2 emissions and fuel consumption, if one wants to reduce CO2 emissions, fuel consumption must automatically be reduced.
The formation of NOx depends on three main factors: the oxygen concentration in the combustion zone, the reaction time required for the formation of the Zeldovich mechanism of chemical reactions, and the temperature in the engine combustion chamber.
The analysis reveals an increasing polarisation of emissions between the Member States of the European Union, especially after 2018. The dispersion indicators (standard deviation, variance, range of values) and the shape of the distribution (kurtosis, skewness) show the increasing differences between the low- and very high-emitting countries. While the minimum values have remained almost constant, the maximum values and the total average have increased considerably, suggesting that current policies have not been sufficient.
By bridging macro-level emission trends with micro-level econometric analysis, this study significantly advances the scientific understanding of hybrid vehicles’ environmental performance in the EU, providing novel empirical evidence on the complex interplay between CO2 and NOx emissions and offering actionable insights that extend current knowledge on sustainable transport solutions, thereby informing both theoretical frameworks and practical strategies for achieving EU climate neutrality objectives.

Author Contributions

Conceptualisation, A.D. and E.P.; methodology, A.D. and E.P.; software, A.D. and E.P.; validation, A.D. and E.P.; formal analysis, A.D. and E.P.; investigation, A.D.; resources, A.D. and E.P.; data curation, A.D.; writing—original draft preparation, A.D.; writing—review and editing, A.D. and E.P.; visualisation, A.D. and E.P.; supervision, E.P.; project administration, A.D. and E.P.; funding acquisition, A.D. and E.P. All authors have read and agreed to the published version of the manuscript.

Funding

This paper was co-financed by The Bucharest University of Economic Studies during the PhD program.

Institutional Review Board Statement

Not applicable.

Informed Consent Statement

Not applicable.

Data Availability Statement

The data presented in this study are available upon request from the corresponding author.

Conflicts of Interest

The authors declare no conflicts of interest.

References

  1. Anenberg, S.C.; Miller, J.; Minjares, R.; Du, L.; Henze, D.K.; Lacey, F.; Malley, C.S.; Emberson, L.; Franco, V.; Klimont, Z.; et al. Impacts and mitigation of excess diesel-related NOx emissions in 11 major vehicle markets. Nature 2017, 545, 467–471. [Google Scholar] [CrossRef] [PubMed]
  2. Haugen, M.J.; Bishop, G.A. Long-term fuel-specific NOx and particle emission trends for in-use heavy-duty vehicles in California. Environ. Sci. Technol. 2018, 52, 6070–6076. [Google Scholar] [CrossRef] [PubMed]
  3. McCaffery, C.; Zhu, H.; Tang, T.; Li, C.; Karavalakis, G.; Cao, S.; Oshinuga, A.; Burnette, A.; Johnson, K.C.; Durbin, T.D. Real-world NOx emissions from heavy-duty diesel, natural gas, and diesel-hybrid electric vehicles. Sci. Total Environ. 2021, 784, 147224. [Google Scholar] [CrossRef]
  4. Stohl, A.; Aamaas, B.; Amann, M.; Baker, L.H.; Bellouin, N.; Berntsen, T.K.; Boucher, O.; Cherian, R.; Collins, W.; Daskalakis, N.; et al. Evaluating the climate and air quality impacts of short-lived pollutants. Atmos. Chem. Phys. 2015, 15, 10529–10556. [Google Scholar] [CrossRef]
  5. Monks, P.S.; Archibald, A.T.; Colette, A.; Cooper, O.; Coyle, M.; Derwent, R.; Fowler, D.; Granier, C.; Law, K.S.; Mills, G.E.; et al. Tropospheric ozone and its precursors from the urban to the global scale from air quality to short-lived climate forcer. Atmos. Chem. Phys. 2015, 15, 8889–8973. [Google Scholar] [CrossRef]
  6. Simon, H.; Reff, A.; Wells, B.; Xing, J.; Frank, N. Ozone Trends Across the United States over a Period of Decreasing NOx and VOC Emissions. Environ. Sci. Technol. 2015, 49, 186–195. [Google Scholar] [CrossRef]
  7. Bishop, G.A.; Stedman, D.H. Reactive Nitrogen Species Emission Trends in Three Light-/Medium-Duty United States Fleets. Environ. Sci. Technol. 2015, 49, 5270–5277. [Google Scholar] [CrossRef]
  8. Stewart, G.B.; Dajnak, D.; Davison, J.; Carslaw, D.C.; Beddows, A.V.; Phantawesak, N.; Stettler, M.E.; Hollaway, M.J.; Beevers, S.D. New NOx and NO2 vehicle emission curves, and their implications for emissions inventories and air pollution modelling. Urban Clim. 2024, 57, 102103. [Google Scholar] [CrossRef]
  9. Perdikopoulos, P.; Varella, A.; Katsaounou, P.; Ntziachristos, L.; Samaras, Z. Developing emission factors from real-world emissions of Euro VI urban Diesel, Diesel-hybrid, and compressed natural gas buses. Atmosphere 2025, 16, 293. [Google Scholar] [CrossRef]
  10. Feinauer, M.; Ehrenberger, S.; Epple, F.; Schripp, T.; Grein, T. Investigating particulate and nitrogen oxides emissions of a plug-in hybrid electric vehicle for a real-world driving scenario. Appl. Sci. 2022, 12, 1404. [Google Scholar] [CrossRef]
  11. Zhao, H.; Shi, L.; Xu, X.; Qiu, J.; Li, L.; Wang, J.; Yu, W.; Ge, Y. Impact of Shortening Real Driving Emission (RDE) Test Trips on CO, NOX, and PN10 Emissions from Different Vehicles. Sustainability 2024, 16, 9453. [Google Scholar] [CrossRef]
  12. Clairotte, M.; Valverde, V.; Giechaskiel, B. Real Driving Emissions (RDE): 2020 Assessment of Portable Emissions Measurement Systems (PEMS) Measurement Uncertainty; JRC Technical Report; European Commission: Luxembourg, 2021; Available online: https://publications.jrc.ec.europa.eu/repository/bitstream/JRC124017/pems_uncertainty_2020_v10.pdf (accessed on 2 October 2025).
  13. García, A.; Monsalve-Serrano, J.; Villalta, D.; Guzmán-Mendoza, M. Impact of low carbon fuels (LCF) on the fuel efficiency and NOx emissions of a light-duty series hybrid commercial delivery vehicle. Fuel 2022, 321, 124035. [Google Scholar] [CrossRef]
  14. IEA—International Energy Agency. Global EV Outlook 2022. 2022. Available online: https://www.iea.org/reports/global-ev-outlook-2022 (accessed on 2 October 2025).
  15. Cai, H.; Xie, S. Estimation of vehicular emission inventories in China from 1980 to 2005. Atmos. Environ. 2007, 41, 8735–8747. [Google Scholar] [CrossRef]
  16. Luján, J.M.; Garcia, A.; Monsalve-Serrano, J.; Martínez-Boggio, S. Effectiveness of hybrid powertrains to reduce fuel consumption and NOx emissions of a Euro 6d-temp diesel engine under real-life driving conditions. Energy Convers. Manag. 2019, 199, 111987. [Google Scholar] [CrossRef]
  17. Kumar, A.; Singh, R.; Sharma, A. Performance evaluation of hybrid electric vehicles for sustainable transport system. Int. J. Innov. Technol. Explor. Eng. 2019, 8, 195–201. [Google Scholar] [CrossRef]
  18. Sher, F.; Chen, S.; Raza, A.; Rasheed, T.; Razmkhah, O.; Rashid, T.; Rafi-Ul-Shan, P.M.; Erten, B. Novel strategies to reduce engine emissions and improve energy efficiency in hybrid vehicles. Clean. Eng. Technol. 2021, 2, 100074. [Google Scholar] [CrossRef]
  19. Nüesch, T.; Cerofolini, A.; Mancini, G.; Cavina, N.; Onder, C.; Guzzella, L. Equivalent consumption minimization strategy for the control of real-driving NOx emissions of a diesel hybrid electric vehicle. Energies 2014, 7, 3148–3178. [Google Scholar] [CrossRef]
  20. Weiss, M.; Bonnel, P.; Hummel, R.; Provenza, A.; Manfredi, U. On-road emissions of light-duty vehicles in Europe. Environ. Sci. Technol. 2011, 45, 8575–8581. [Google Scholar] [CrossRef] [PubMed]
  21. Holmer, O.; Eriksson, L. Simultaneous reduction of fuel consumption and NOx emissions through hybridization of a long haulage truck. IFAC-PapersOnLine 2017, 50, 8927–8932. [Google Scholar] [CrossRef]
  22. Li, C.; Swanson, J.; Pham, L.; Hu, S.; Hu, S.; Mikailian, G.; Jung, H.S. Real-world particle and NOx emissions from hybrid electric vehicles under cold weather conditions. Environ. Pollut. 2021, 286, 117320. [Google Scholar] [CrossRef]
  23. Borken-Kleefeld, J.; Chen, Y. New emission deterioration rates for gasoline cars—Results from long-term measurements. Atmos. Environ. 2015, 101, 58–64. [Google Scholar] [CrossRef]
  24. Carslaw, D.C.; Beevers, S.D.; Tate, J.E.; Westmoreland, E.J.; Williams, M.L. Recent evidence concerning higher NOx emissions from passenger cars and light-duty vehicles. Atmos. Environ. 2011, 45, 7053–7063. [Google Scholar] [CrossRef]
  25. Wu, Y.; Zhang, S.; Li, M. The challenge to NOx emission control for heavy-duty diesel vehicles in China. Atmos. Chem. Phys. 2012, 12, 9365–9379. [Google Scholar] [CrossRef]
  26. Yang, L.; Franco, V.; Mock, P.; Kolke, R.; Zhang, S.; Wu, Y.; German, J. Experimental assessment of NOx emissions from 73 Euro 6 diesel passenger cars. Environ. Sci. Technol. 2015, 49, 14409–14415. [Google Scholar] [CrossRef] [PubMed]
  27. Yang, L.; Zhang, S.; Wu, Y.; Chen, Q.; Niu, T.; Huang, X.; Zhang, S.; Zhang, L.; Zhou, Y.; Hao, J. Evaluating real-world CO2 and NOx emissions for public transit buses using a remote wireless OBD approach. Environ. Pollut. 2016, 218, 453–462. [Google Scholar] [CrossRef] [PubMed]
  28. Kossioris, T.; Maurer, R.; Sterlepper, S.; Günther, M.; Pischinger, S. Challenges and Solutions to Meet the Euro 7 NOx Emission Requirements for Diesel Light-Duty Commercial Vehicles. Emiss. Control Sci. Technol. 2024, 10, 123–139. [Google Scholar] [CrossRef]
  29. Peng, F.; Zhang, Y.; Song, G.; Huang, J.; Zhai, Z.; Yu, L. Evaluation of Real-World Fuel Consumption of Hybrid-Electric Passenger Car Based on Speed-Specific Vehicle Power Distributions. Adv. Mech. Eng. 2023, 15, 9016510. [Google Scholar] [CrossRef]
  30. Brinklow, G.; Herreros, J.M.; Zeraati Rezaei, S.; Doustdar, O.; Tsolakis, A.; Kolpin, A.; Millington, P. Non-carbon greenhouse gas emissions for hybrid electric vehicles: Three-way catalyst nitrous oxide and ammonia trade-off. Int. J. Environ. Sci. Technol. 2023, 20, 12521–12532. [Google Scholar] [CrossRef]
  31. Farren, N.J.; Davison, J.; Rose, R.A.; Wagner, R.L.; Carslaw, D.C. Underestimated ammonia emissions from road vehicles. Environ. Sci. Technol. 2020, 54, 15689–15697. [Google Scholar] [CrossRef] [PubMed]
  32. Borsari, V.; de Assunção, J.V. Ammonia emissions from a light-duty vehicle. Transp. Res. Part D Transp. Environ. 2017, 51, 53–61. [Google Scholar] [CrossRef]
  33. Heeb, N.V.; Forss, A.-M.; Brühlmann, S.; Lüscher, R.; Saxer, C.J.; Hug, P. Three-way catalyst-induced formation of ammonia—Velocity- and acceleration-dependent emission factors. Atmos. Environ. 2006, 40, 5986–5997. [Google Scholar] [CrossRef]
  34. EEA—European Environment Agency. Greenhouse Gas Emissions from Transport in Europe. 2023. Available online: https://www.eea.europa.eu (accessed on 2 October 2025).
  35. Hassouna, F.M.A.; Al-Sahili, K. Environmental impact assessment of the transportation sector and hybrid vehicle implications in Palestine. Sustainability 2020, 12, 7878. [Google Scholar] [CrossRef]
  36. Kapustin, A.; Rakov, V. Methodology to evaluate the impact of hybrid cars engine type on their economic efficiency and environmental safety. Transp. Res. Procedia 2017, 20, 247–253. [Google Scholar] [CrossRef]
  37. Gao, L.; Winfield, Z.C. Life Cycle Assessment of Environmental and Economic Impacts of Advanced Vehicles. Energies 2012, 5, 605–620. [Google Scholar] [CrossRef]
  38. Squalli, J. Greening the roads: Assessing the role of electric and hybrid vehicles in curbing CO2 emissions. J. Clean. Prod. 2024, 434, 139908. [Google Scholar] [CrossRef]
  39. Lang, J.; Cheng, S.; Zhou, Y.; Zhao, B.; Wang, H.; Zhang, S. Energy and environmental implications of hybrid and electric vehicles in China. Energies 2013, 6, 2663–2685. [Google Scholar] [CrossRef]
  40. Rivera-González, L.; Bolonio, D.; Mazadiego, L.F.; Naranjo-Silva, S.; Escobar-Segovia, K. Long-term forecast of energy and fuels demand towards a sustainable road transport sector in Ecuador (2016–2035). Sustainability 2020, 12, 472. [Google Scholar] [CrossRef]
  41. Tran, V.; Zhao, S.; Diop, E.B.; Song, W. Travelers’ Acceptance of Electric Carsharing Systems in Developing Countries: The Case of China. Sustainability 2019, 11, 5348. [Google Scholar] [CrossRef]
  42. Bozzi, A.D.; Aguilera, A. Shared E-Scooters: A Review of Uses, Health and Environmental Impacts, and Policy Implications of a New Micro-Mobility Service. Sustainability 2021, 13, 8676. [Google Scholar] [CrossRef]
  43. Moreau, H.; de Jamblinne de Meux, L.; Zeller, V.; D’Ans, P.; Ruwet, C.; Achten, W.M.J. Dockless e-scooter: A green solution for mobility? Comparative case study between dockless e-scooters, displaced transport, and personal e-scooters. Sustainability 2020, 12, 1803. [Google Scholar] [CrossRef]
  44. Felipe-Falgas, P.; Madrid-Lopez, C.; Marquet, O. Assessing environmental performance of micromobility using LCA and self-reported modal change: The case of shared e-bikes, e-scooters, and e-mopeds in Barcelona. Sustainability 2022, 14, 4139. [Google Scholar] [CrossRef]
  45. Badyelgajy, Y.; Doszhanov, Y.; Kapsalyamov, B.; Onerkhan, G.; Sabitov, A.; Zhumazhanov, A.; Doszhanov, O. Calculation of Greenhouse Gas Emissions from Tourist Vehicles Using Mathematical Methods: A Case Study in Altai Tavan Bogd National Park. Sustainability 2025, 17, 6702. [Google Scholar] [CrossRef]
  46. Pielecha, J.; Gis, W. Testing Exhaust Emissions of Plug-In Hybrid Vehicles in Poland. Energies 2024, 17, 6288. [Google Scholar] [CrossRef]
  47. Castillo, J.C.; Uribe, A.F.; Tibaquirá, J.E.; Giraldo, M.; Idárraga, M. Hybrid Electric Vehicles as a Strategy for Reducing Fuel Consumption and Emissions in Latin America. World Electr. Veh. J. 2025, 16, 101. [Google Scholar] [CrossRef]
  48. Rojas-Reinoso, E.V.; Anacleto-Fernández, M.; Utreras-Alomoto, J.; Carranco-Quiñonez, C.; Mata, C. Comparative Study of Fuel and Greenhouse Gas Consumption of a Hybrid Vehicle Compared to Spark Ignition Vehicles. World Electr. Veh. J. 2025, 16, 4. [Google Scholar] [CrossRef]
  49. Konečný, V.; Zuzaniak, M.; Jonasíková, D. Greenhouse Gas Emissions from Road Transport and Their Economic Value in the Assessment of Transport Projects Using a Cost–Benefit Analysis: Approaches Implemented in the Slovak Republic and Selected Central European Countries. Appl. Sci. 2025, 15, 1283. [Google Scholar] [CrossRef]
  50. Solaymani, S.; Botero, J. Reducing Carbon Emissions from Transport Sector: Experience and Policy Design Considerations. Sustainability 2025, 17, 3762. [Google Scholar] [CrossRef]
  51. Kwilinski, A.; Lyulyov, O.; Pimonenko, T. Reducing transport sector CO2 emissions patterns: Environmental technologies and renewable energy. Open Innov. Technol. Mark. Complex. 2024, 10, 100217. [Google Scholar] [CrossRef]
  52. Ebrahim, E.E.M.; Abonazel, M.R.; Shalaby, O.A.; Albeltagy, W.A.A. Studying the impact of socioeconomic and environmental factors on nitrogen oxide emissions: Spatial econometric modeling. Int. J. Energy Econ. Policy 2025, 15, 248–259. [Google Scholar] [CrossRef]
  53. Qin, X.; Xie, P.; Liao, C. Study on the synergistic effect of NOx and CO2 emission reduction in the industrial sector of Guangzhou. Front. Environ. Sci. 2025, 13, 1497121. [Google Scholar] [CrossRef]
  54. Song, Y.; Yue, Z.; Wang, X.; Sun, L.; Zang, M.; Guo, C. Effects of green total factor energy efficiency on industrial NOx emission abatement: Based on SBM-ML and spatial Durbin model for 257 prefecture-level cities in China. Environ. Dev. Sustain. 2026, 15, 1–31. [Google Scholar] [CrossRef]
  55. Zhu, G.; Shi, H.; Zhong, L.; He, G.; Wang, B.; Shan, J.; Han, P.; Liu, T.; Wang, S.; Liu, C.; et al. Nitrous oxide sources, mechanisms and mitigation. Nat. Rev. Earth Environ. 2025, 6, 574–592. [Google Scholar] [CrossRef]
  56. Deng, J.; Gong, C.; Engel, J.; Nabel, J.; Slominska-Durdasiak, K.; Nerobelov, G.; Ninomiya, H.; Zhang, L.; Zaehle, S. Impact of Past and Future Nitrogen Deposition Pathways on the Terrestrial Carbon Sink and N2O Emissions; No. EGU26-18329; Copernicus Publications: Göttingen, Germany, 2026. [Google Scholar] [CrossRef]
  57. Zhu, H.; Li, C.; McCaffery, C.; Cao, S.; Johnson, K.C.; Karavalakis, G.; Durbin, T. Emissions from heavy-duty diesel, natural gas, and diesel-hybrid electric vehicles—Part 1. NOx, N2O and NH3 emissions. Fuel 2024, 371, 132175. [Google Scholar] [CrossRef]
  58. Kanberger, E.D.; Ziegler, A. On the relevance of life-cycle CO2 emissions for vehicle purchase decisions. Transp. Res. Part D Transp. Environ. 2024, 126, 104031. [Google Scholar] [CrossRef]
  59. Catenazzo, A. Competition and the Green Deal: A study of consumers’ WTP for CO2 emissions reduction in the Italian car market. J. Eur. Compet. Law Pract. 2024, 15, 209–220. [Google Scholar] [CrossRef]
  60. Eurostat Database. Eurostat Online Database. 2025. Available online: https://ec.europa.eu/eurostat/web/main/data/database (accessed on 2 October 2025).
Figure 1. Chemiluminescence NOx analyser. 1—high voltage pulse source (minimum 7.5 kV), 2—spark gap enclosure, 3—reaction enclosure, 4—optical filter, 5—self-amplifying photosensitive element, 6—measuring device, 7—vacuum pump, 8—thermal reactor, 9—tap. Source: Own conception.
Sustainability 18 05341 g001
Figure 2. Caption co-occurrence network visualisation of keywords from Scopus articles (2015–2024) on “NOx emissions” and “hybrid vehicles”. Source: generated with VOSviewer.
Sustainability 18 05341 g002
Figure 3. Co-occurrence overlay visualisation network of keywords from Scopus articles (2015–2024) on “NOx emissions” and “hybrid vehicles”. Source: generated with VOSviewer.
Sustainability 18 05341 g003
Figure 4. Co-occurrence density visualisation network of keywords from Scopus articles (2015–2024) on “NOx emissions” and “hybrid vehicles”. Source: generated with VOSviewer.
Sustainability 18 05341 g004
Figure 5. Evolution of N2O emissions in the European Union Member States and other countries, in the case of land transport and transport via pipelines, expressed in [t]. Source: Eurostat database [60], own data processing, generated with Tableau.
Sustainability 18 05341 g005
Figure 6. Evolution of the quantity of N2O emissions in CO2 equivalent in the EU Member States, in the case of land transport and transport via pipelines, expressed in [103 t]. (a) illustrates the spatial distribution and volume of N2O emissions (expressed in CO2 equivalent) across the EU Member States in 2014. The proportional symbol map highlights that Western and South-Western European countries (such as Italy with (161,834 × 103 t and Spain with 150,179 × 103 t) were among the largest contributors to emissions originating from land transport and pipeline transport during this baseline year. (b) presents the updated emission values for the year 2023. A comparative analysis with (a) reveals a significant growth trend in specific regions; notably, Spain’s emissions increased drastically to 285,195 × 103 t, and Italy’s scaled up to 188,913 × 103 t. Conversely, certain states like Germany registered a noticeable decline (from 59,968·103 t down to 51,925 × 103 t), demonstrating uneven progress in emission dynamics over the 9-year period. Source: Eurostat database, own data processing, generated with Tableau.
Sustainability 18 05341 g006
Figure 7. Pareto analysis of new hybrid vehicle registrations in the European Union, 2024. Source: Eurostat, own data processing, generated with Excel.
Sustainability 18 05341 g007
Figure 8. Percentage of hybrid cars in the total car fleet of EU member countries. Source: Eurostat, own data processing.
Sustainability 18 05341 g008
Figure 9. Percentage of nitrogen oxides emissions by economic sectors, in 2023. Source: Eurostat, own data processing.
Sustainability 18 05341 g009
Figure 10. Structure of the number of hybrid passenger cars, depending on the amount of NOx emissions. Source: Eurostat, own data processing.
Sustainability 18 05341 g010
Figure 11. NOx emissions for different types of hybrid passenger cars brands. Source: Romanian Auto Registry, own data processing.
Sustainability 18 05341 g011
Figure 12. Fuel consumption per 100 km for different types of hybrid passenger car brands. Source: Romanian Auto Registry, own data processing.
Sustainability 18 05341 g012
Figure 13. Low fuel consumption per 100 km for different types of hybrid passenger car brands. Source: Romanian Auto Registry, own data processing.
Sustainability 18 05341 g013
Figure 14. CO2 emission, expressed in g/km. Source: generated with EViews 12.
Sustainability 18 05341 g014
Figure 15. Correlogram for low CO2 emission. Source: generated with EViews 12.
Sustainability 18 05341 g015
Figure 16. Correlogram for low fuel consumption. Source: generated with EViews 12.
Sustainability 18 05341 g016
Figure 17. The augmented Dickey–Fuller test for checking the stationarity of the low fuel consumption variable. Source: generated with EViews 12.
Sustainability 18 05341 g017
Figure 18. The augmented Dickey–Fuller test for checking the stationarity of the low CO2 emission variable. Source: generated with EViews 12.
Sustainability 18 05341 g018
Figure 19. Results of the linear multiple regression model, for vehicles with low CO2 emissions. Source: generated with EViews 12.
Sustainability 18 05341 g019
Figure 20. Results of the linear multiple regression model for vehicles with high CO2 emissions. Source: generated with EViews 12.
Sustainability 18 05341 g020
Figure 21. Mathematical representation of the model for vehicles with low CO2 emissions. Source: generated with EViews 12.
Sustainability 18 05341 g021
Figure 22. Mathematical representation of the model for vehicles with high CO2 emissions. Source: generated with EViews 12.
Sustainability 18 05341 g022
Figure 23. Correlogram for different types of data. Source: generated by Excel.
Sustainability 18 05341 g023
Figure 24. Granger causality test of the model for vehicles with low CO2 emissions. Source: generated with EViews 12.
Sustainability 18 05341 g024
Figure 25. Results regarding confidence interval limits of the model for vehicles with low CO2 emissions. Source: generated with EViews 12.
Sustainability 18 05341 g025
Figure 26. Results regarding residual analysis of the model for vehicles with low CO2 emissions. Source: generated with EViews 12.
Sustainability 18 05341 g026
Figure 27. Correlogram for NOx emission. Source: generated by Excel.
Sustainability 18 05341 g027
Figure 28. Results of the non-linear multiple regression model for NOx emissions. Source: generated with EViews 12.
Sustainability 18 05341 g028
Figure 29. Mathematical representation of the model for NOx emissions. Source: generated with EViews 12.
Sustainability 18 05341 g029
Figure 30. Comparison of actual and estimated NOx emissions for the hybrid vehicles studied. Source: generated by Excel.
Sustainability 18 05341 g030
Table 1. Descriptive statistics on the level of N2O emissions at EU-27 level. Source: Eurostat database, own data processing, generated with Data analysis Excel.
Descriptive Statistics2014201520162017201820192020202120222023
Mean175.78180.59195.82199.07203.13250.03242.37276.38285.34266.40
Standard Error31.1331.7536.0035.7036.3460.5561.4278.6681.9475.14
Median122.03125.30131.02145.04142.51137.08143.91136.47140.35143.09
Standard Deviation161.78164.97187.04185.48188.83314.63319.17408.74425.79390.46
Sample Variance26,172.127,214.034,985.434,404.435,658.198,993.6101,868.6167,071.5181,298.9152,460.9
Kurtosis1.811.821.383.333.738.749.1511.5111.879.86
Skewness1.491.471.451.731.792.762.823.183.242.99
Range609.74638.20699.15794.54820.701472.381496.151967.062055.441820.25
Minimum0.960.721.381.571.361.401.051.041.451.09
Maximum610.7638.92700.53796.11822.061473.781497.21968.12056.891821.34
Sum4746.124876.025287.235374.95484.596750.776543.867462.187704.257192.79
Count27272727272727272727
Disclaimer/Publisher’s Note: The statements, opinions and data contained in all publications are solely those of the individual author(s) and contributor(s) and not of MDPI and/or the editor(s). MDPI and/or the editor(s) disclaim responsibility for any injury to people or property resulting from any ideas, methods, instructions or products referred to in the content.