4.1. Analysis and Interpretation of Projection Results
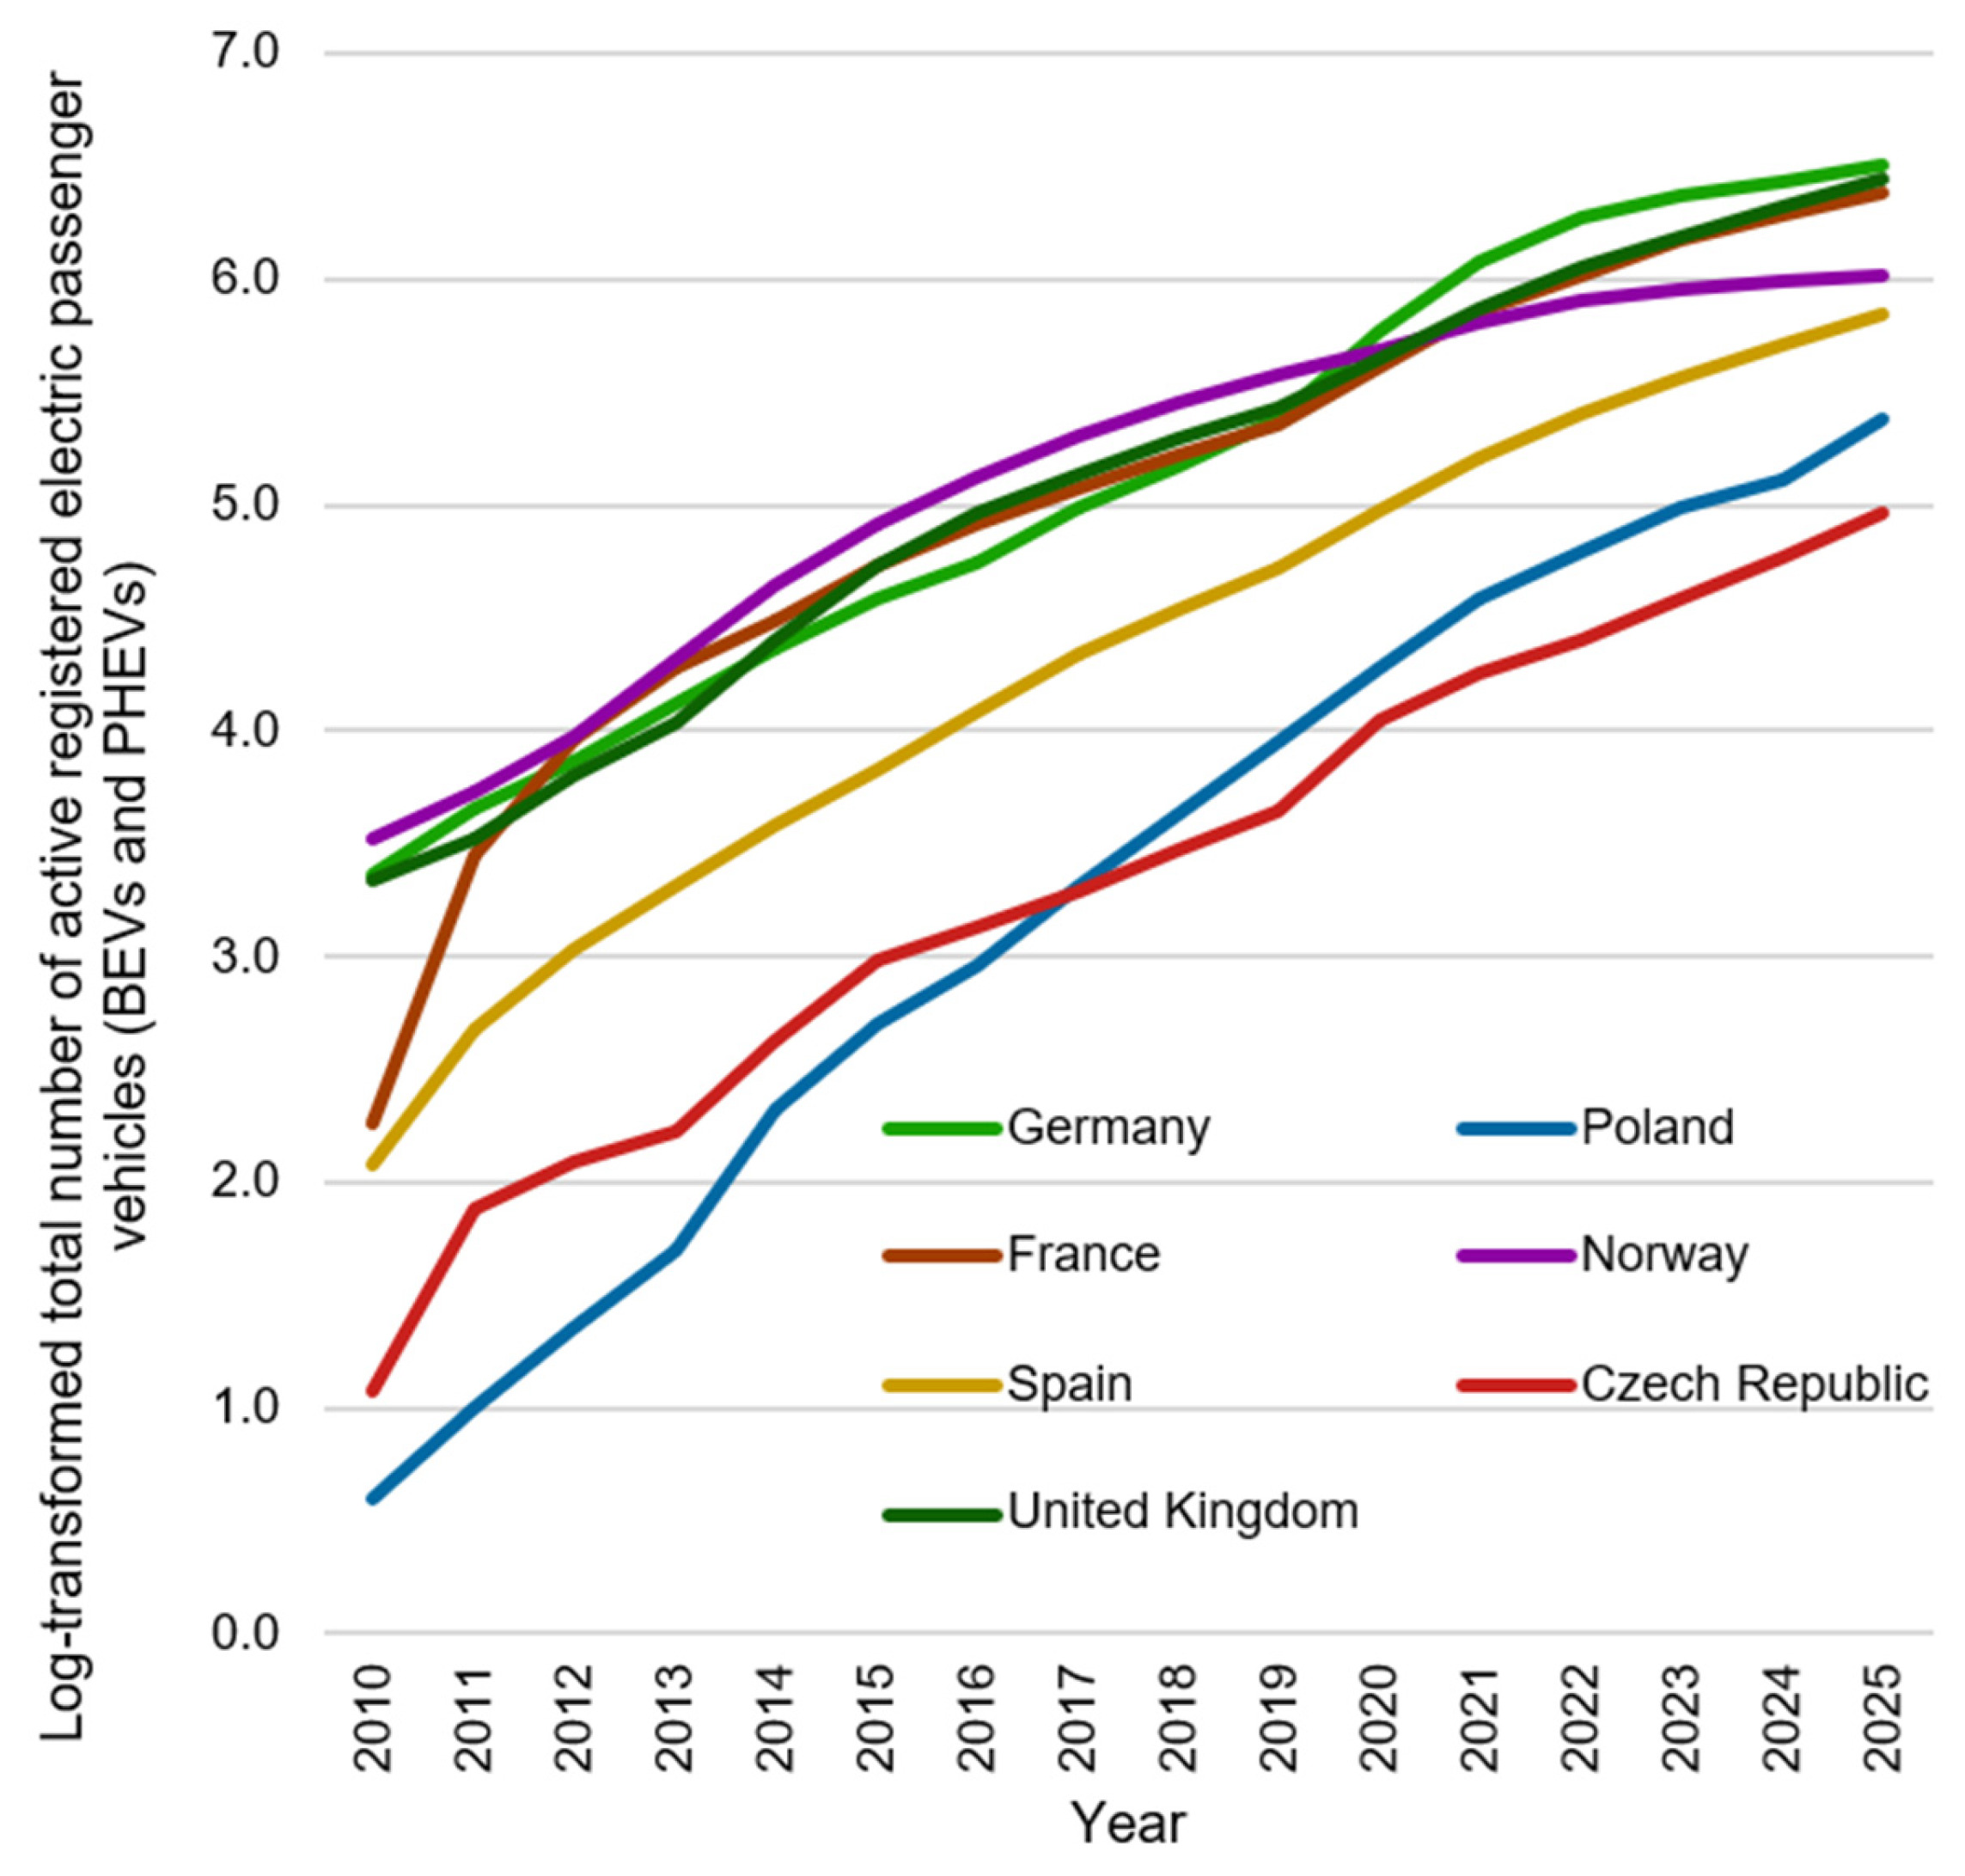
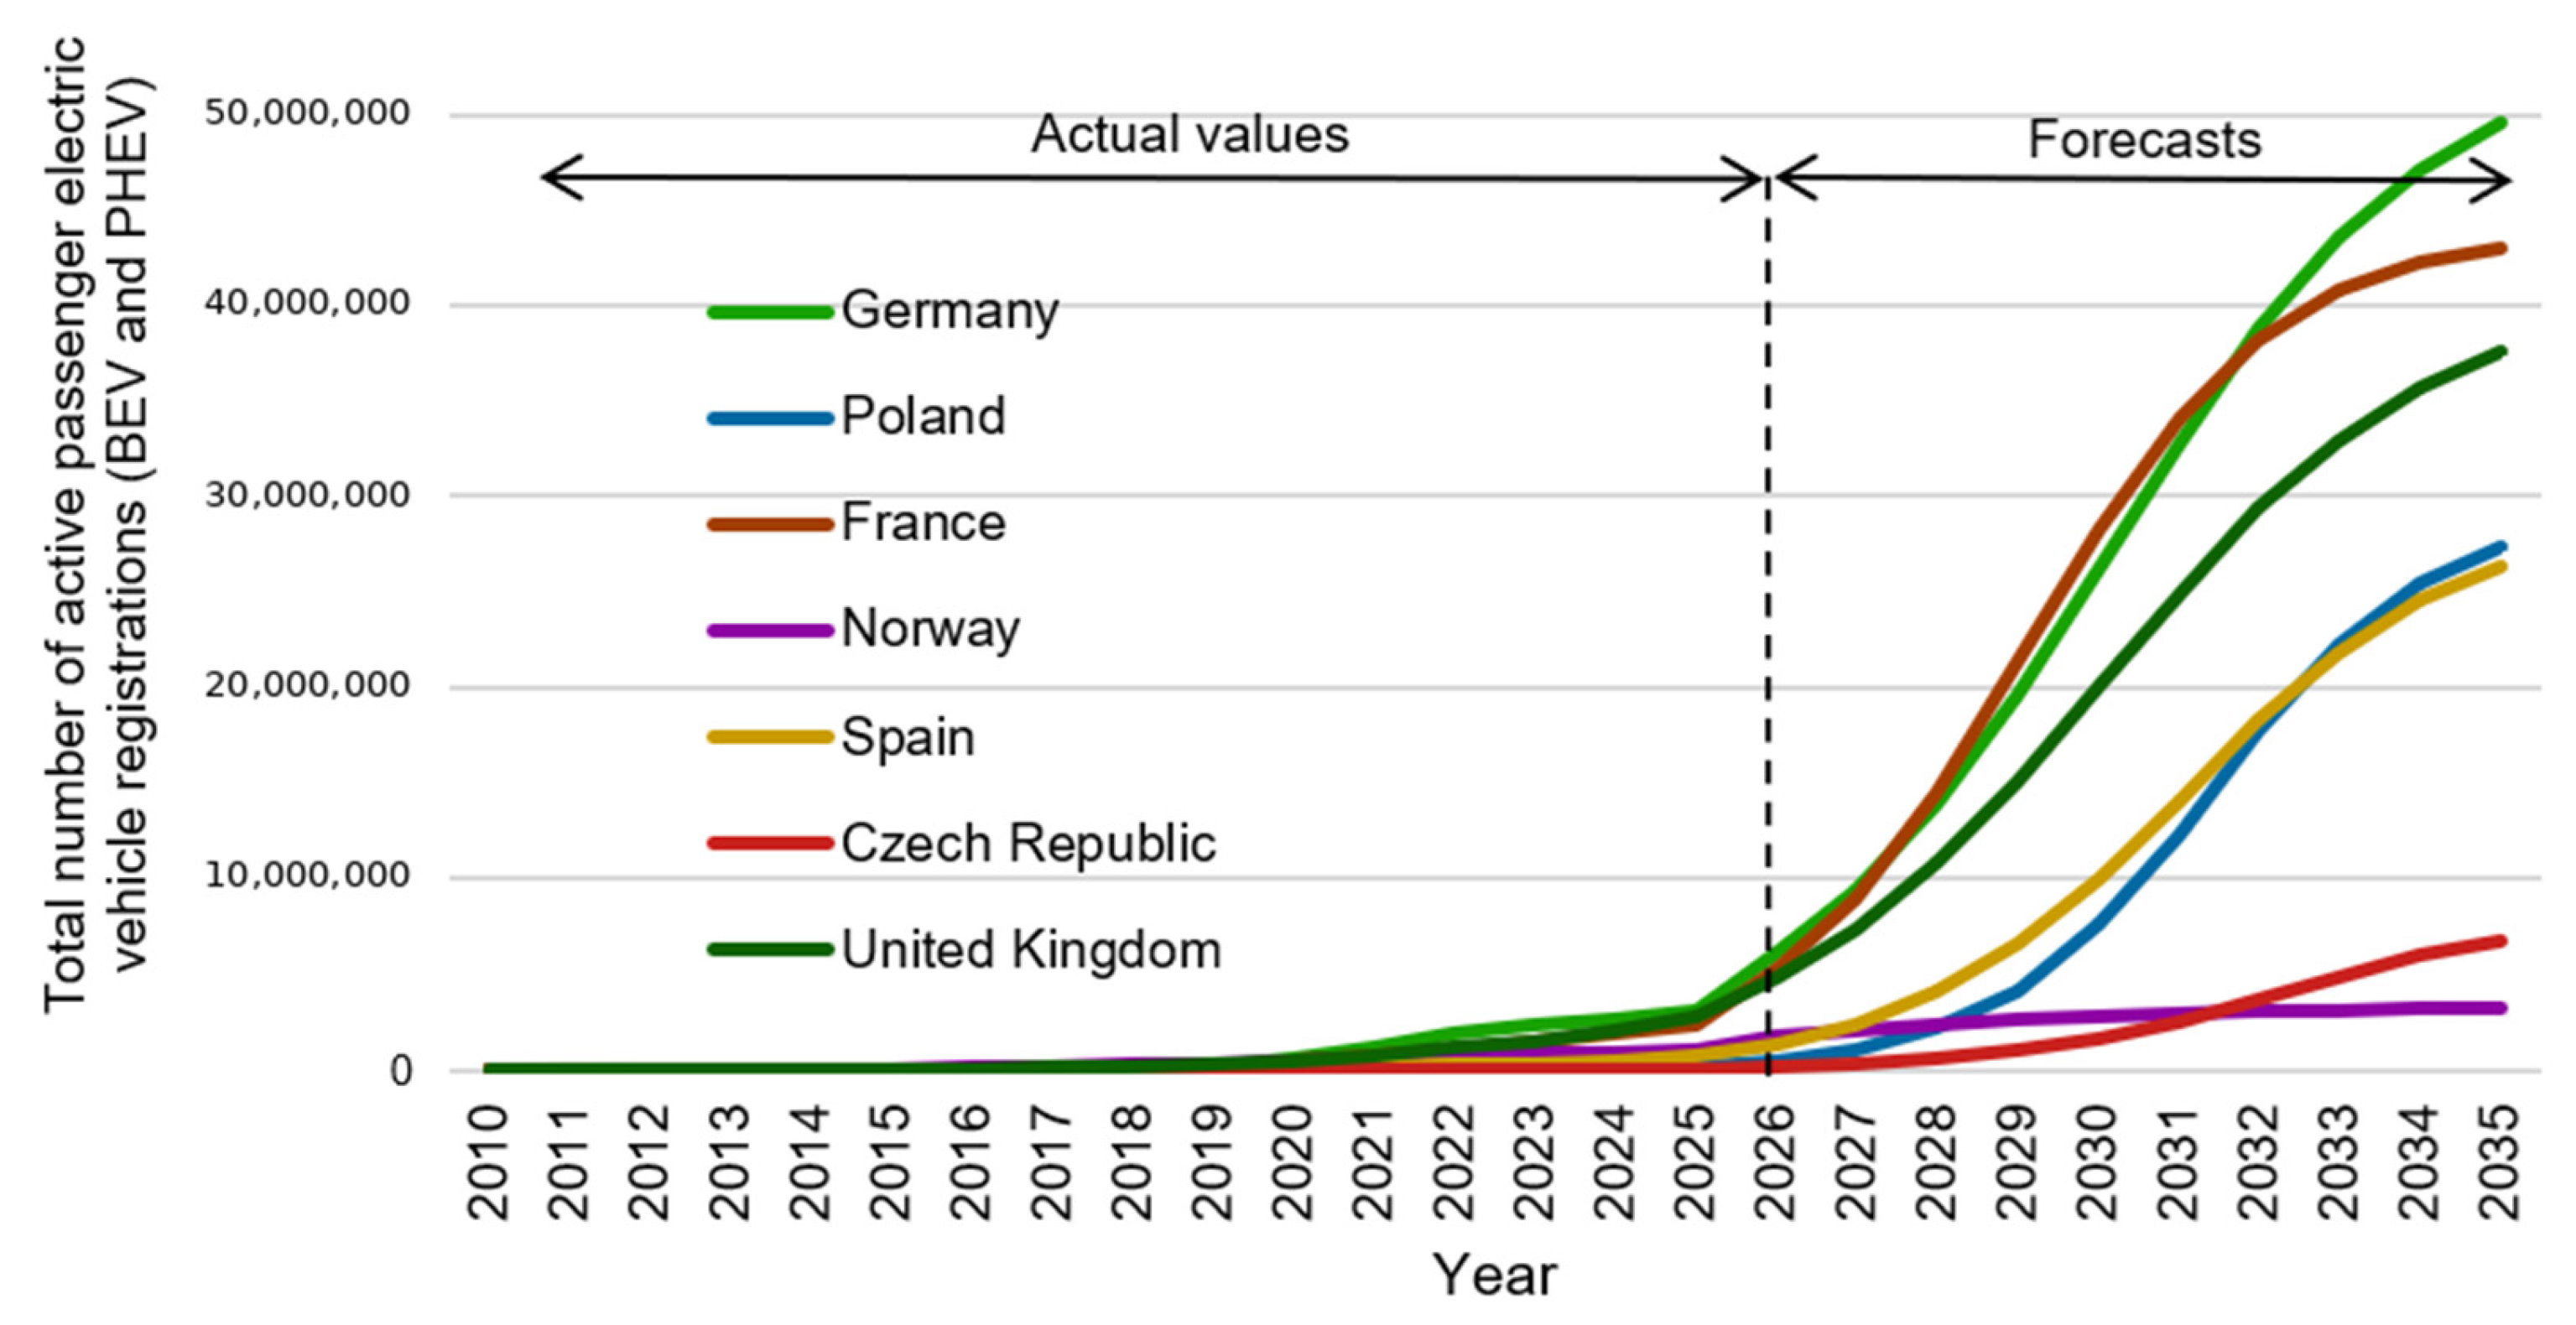
The statistical analysis conducted prior to the forecasting stage—based on three different normalization approaches—provided an alternative perspective on the development of electromobility across the seven analysed countries. Nevertheless, the most informative results were obtained from Min–Max normalization, which, for example, revealed a clear separation of the analysed countries into three groups according to the level of electromobility development. An analogous outcome was obtained by calculating the percentage share of active registered electric passenger vehicles (BEVs and PHEVs) within the total passenger-car fleet, irrespective of powertrain type.
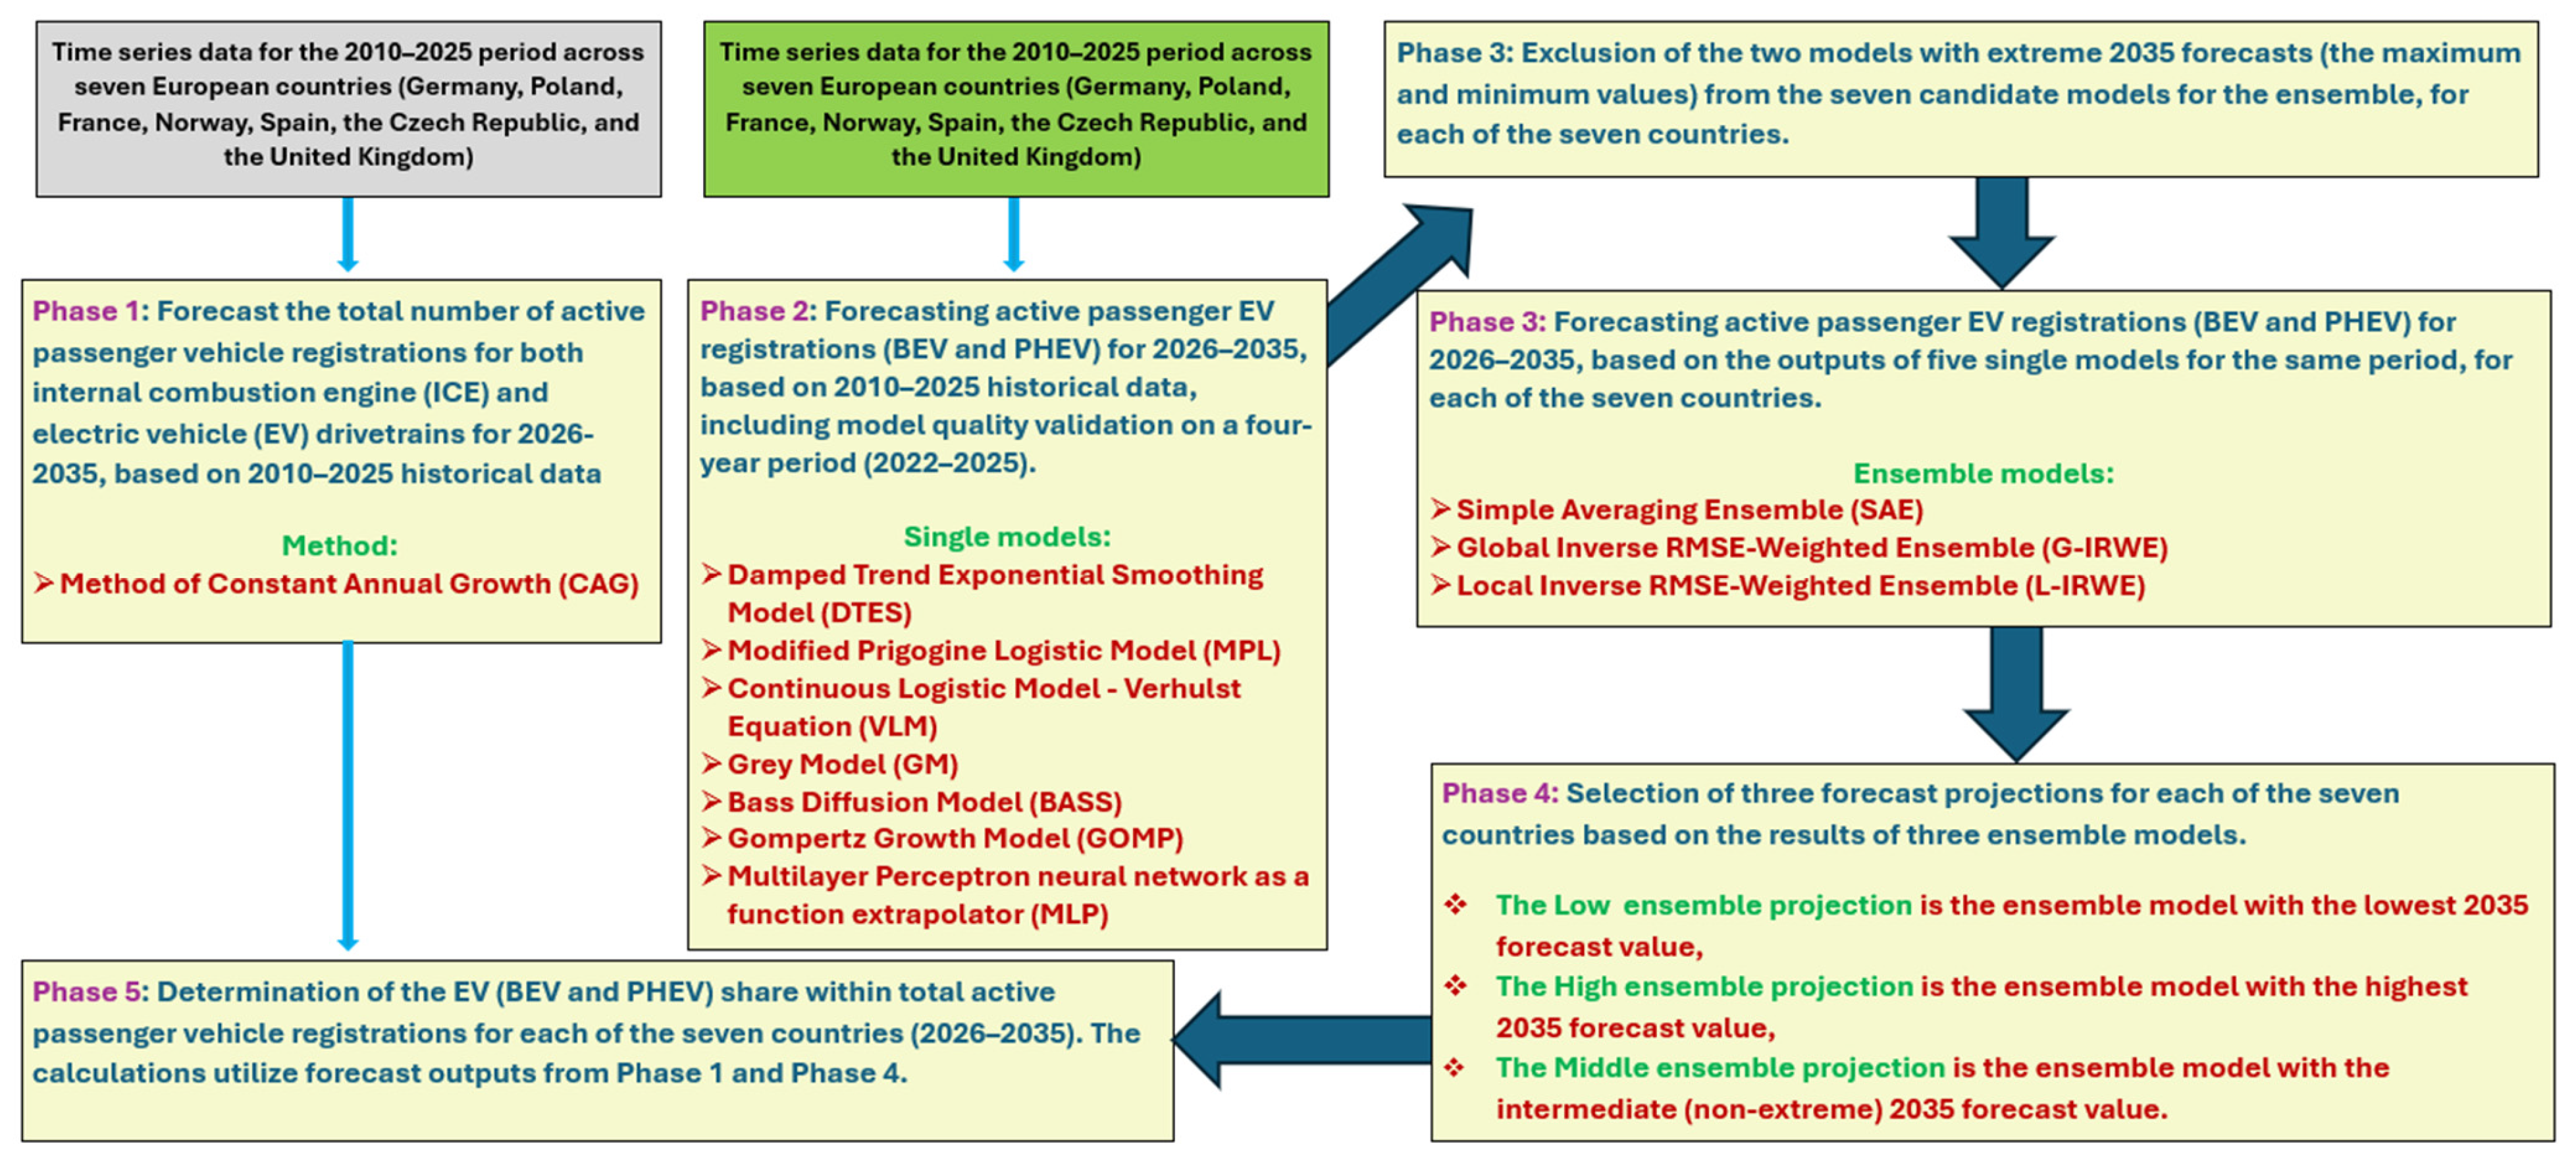
Single-model forecasts were produced using seven models, two of which incorporated a development ceiling (MPL and VLM). This provided a broader view of the prospective evolution of electromobility in the passenger-car segment. Among the analysed single forecasting models, DTES and MPL performed least favourably (i.e., they generated the largest number of outlying forecasts relative to the remaining models across the seven countries). In contrast, the VLM, BASS, and GOMP models merit particular attention: for none of the seven countries did forecasts produced by these models constitute extreme projections (i.e., candidates for exclusion in ensemble forecasting). It is worth noting that the GM model—recommended for the early phase of process development—was rejected in the case of Norway, which is logically consistent given Norway’s highest level of electromobility development. Another noteworthy observation is that the same two models (DTES and MLP) were rejected for the three countries characterised by a low level of electromobility development (Poland, Czech Republic, and Spain).
An analysis of preferred-model selection among the three ensemble models across three development ensemble projections showed that, under the low ensemble projection, no single ensemble model dominated across the seven analysed countries. A similar pattern was observed for the middle ensemble projection. By contrast, under the high ensemble projection, the SAE model was selected most frequently (five selections). Importantly, SAE was chosen almost exclusively for countries with a high level of electromobility development (Germany, France, Norway, and the United Kingdom). Spain constituted the exception, as SAE was also selected for this country. Overall (21 ensemble-model selections), no model dominated the others: each of the ensemble models—SAE, G-IRWE, and L-IRWE—was selected seven times.
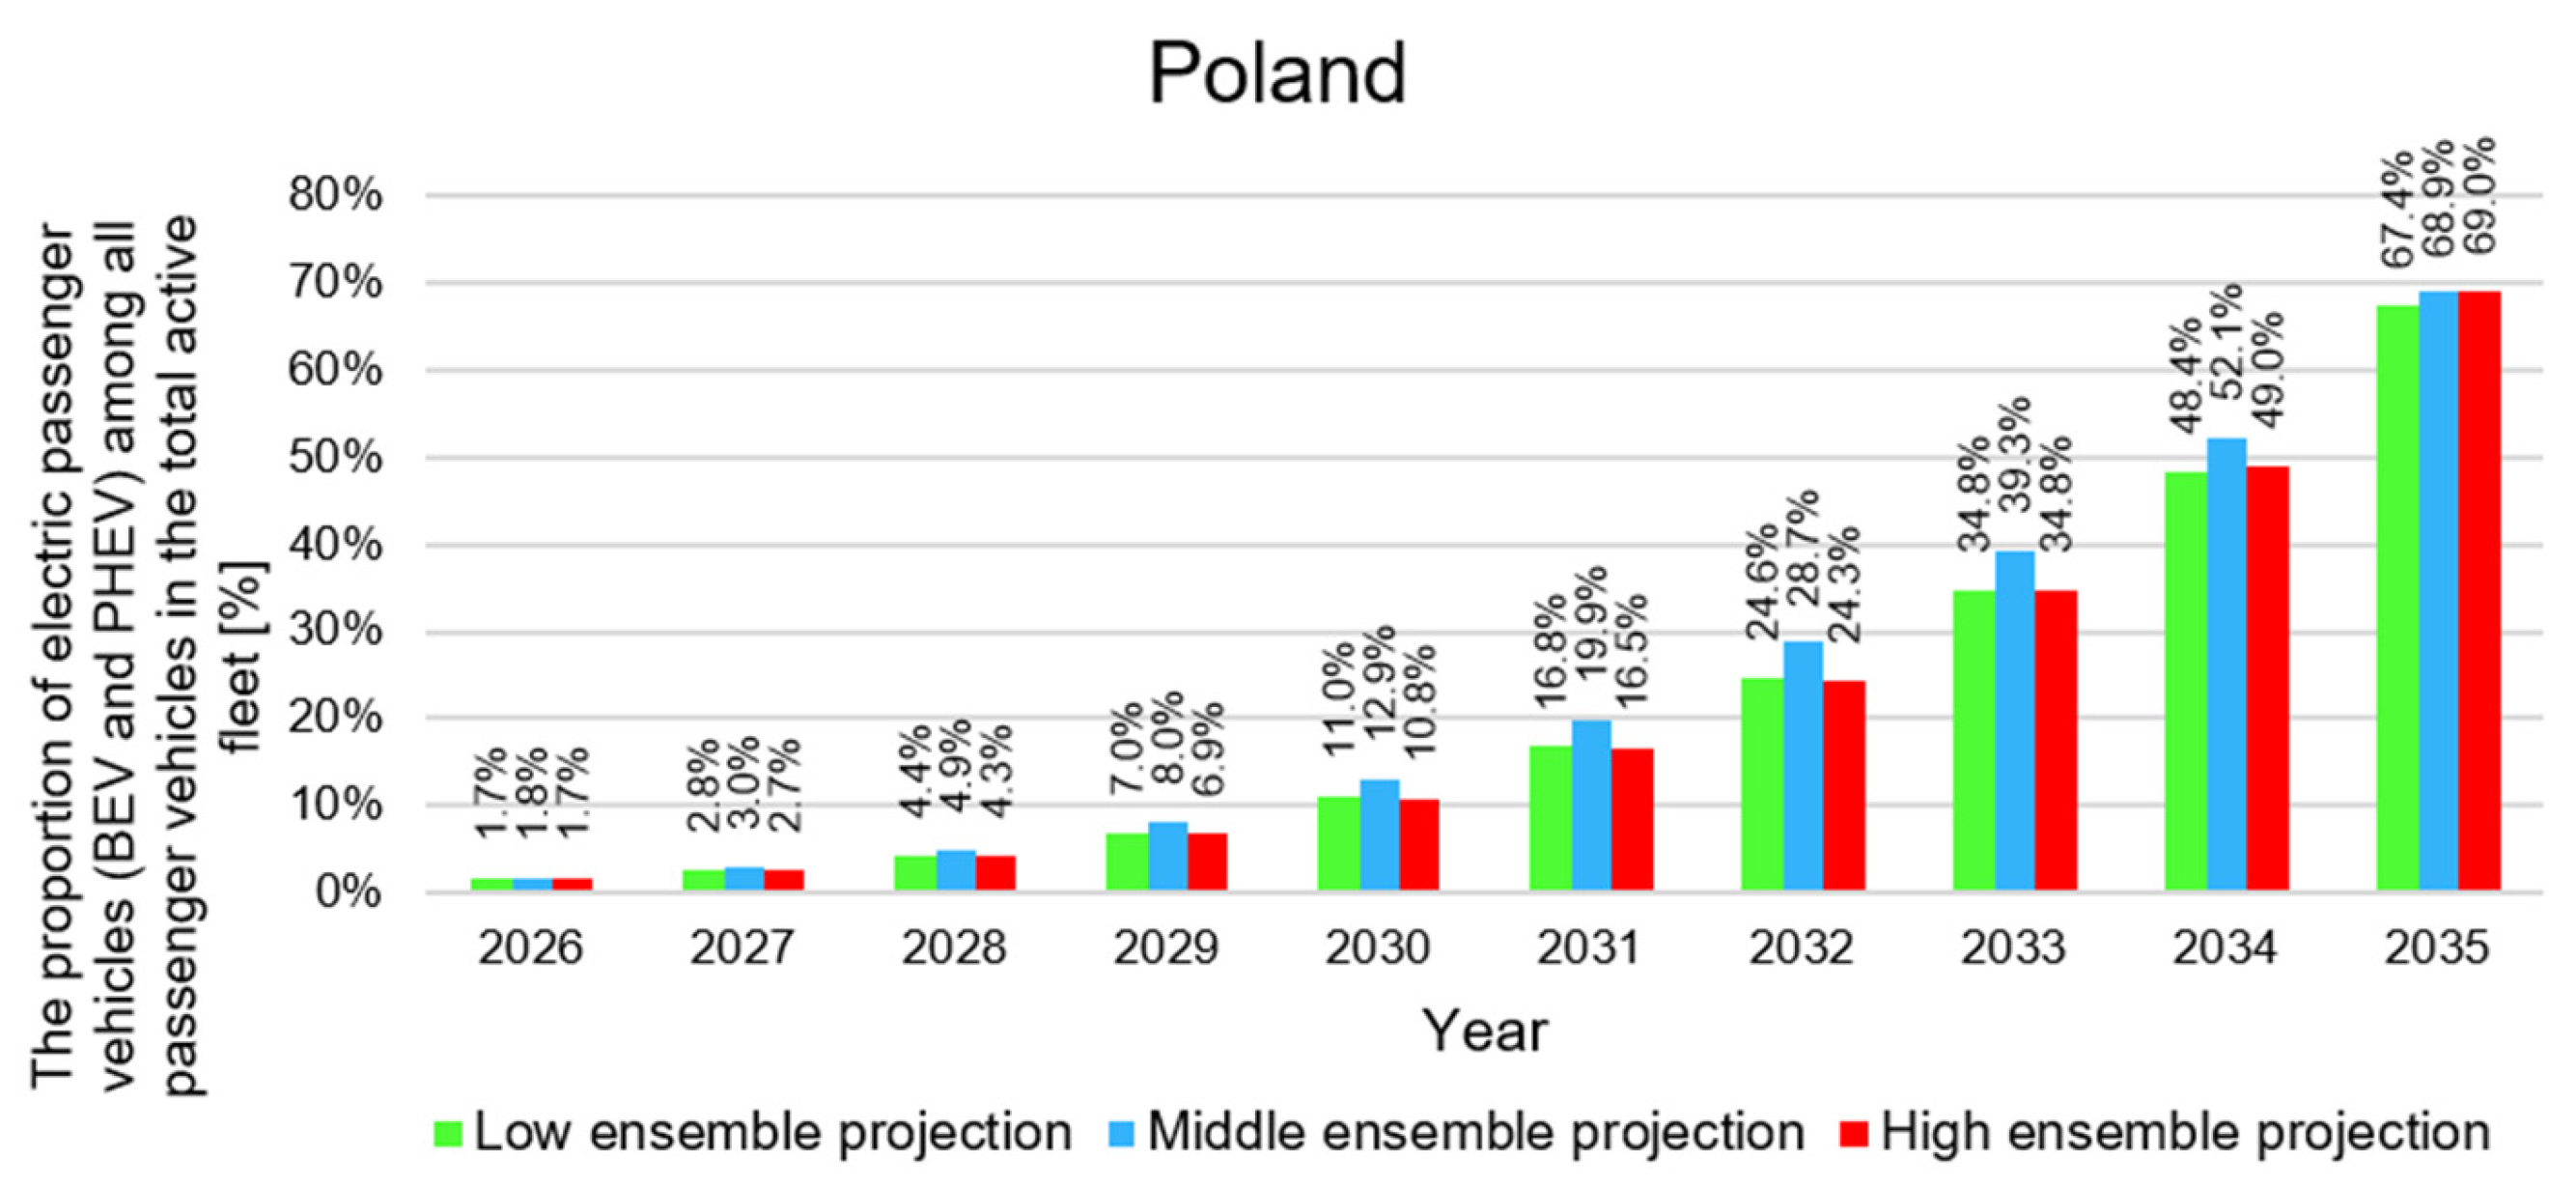
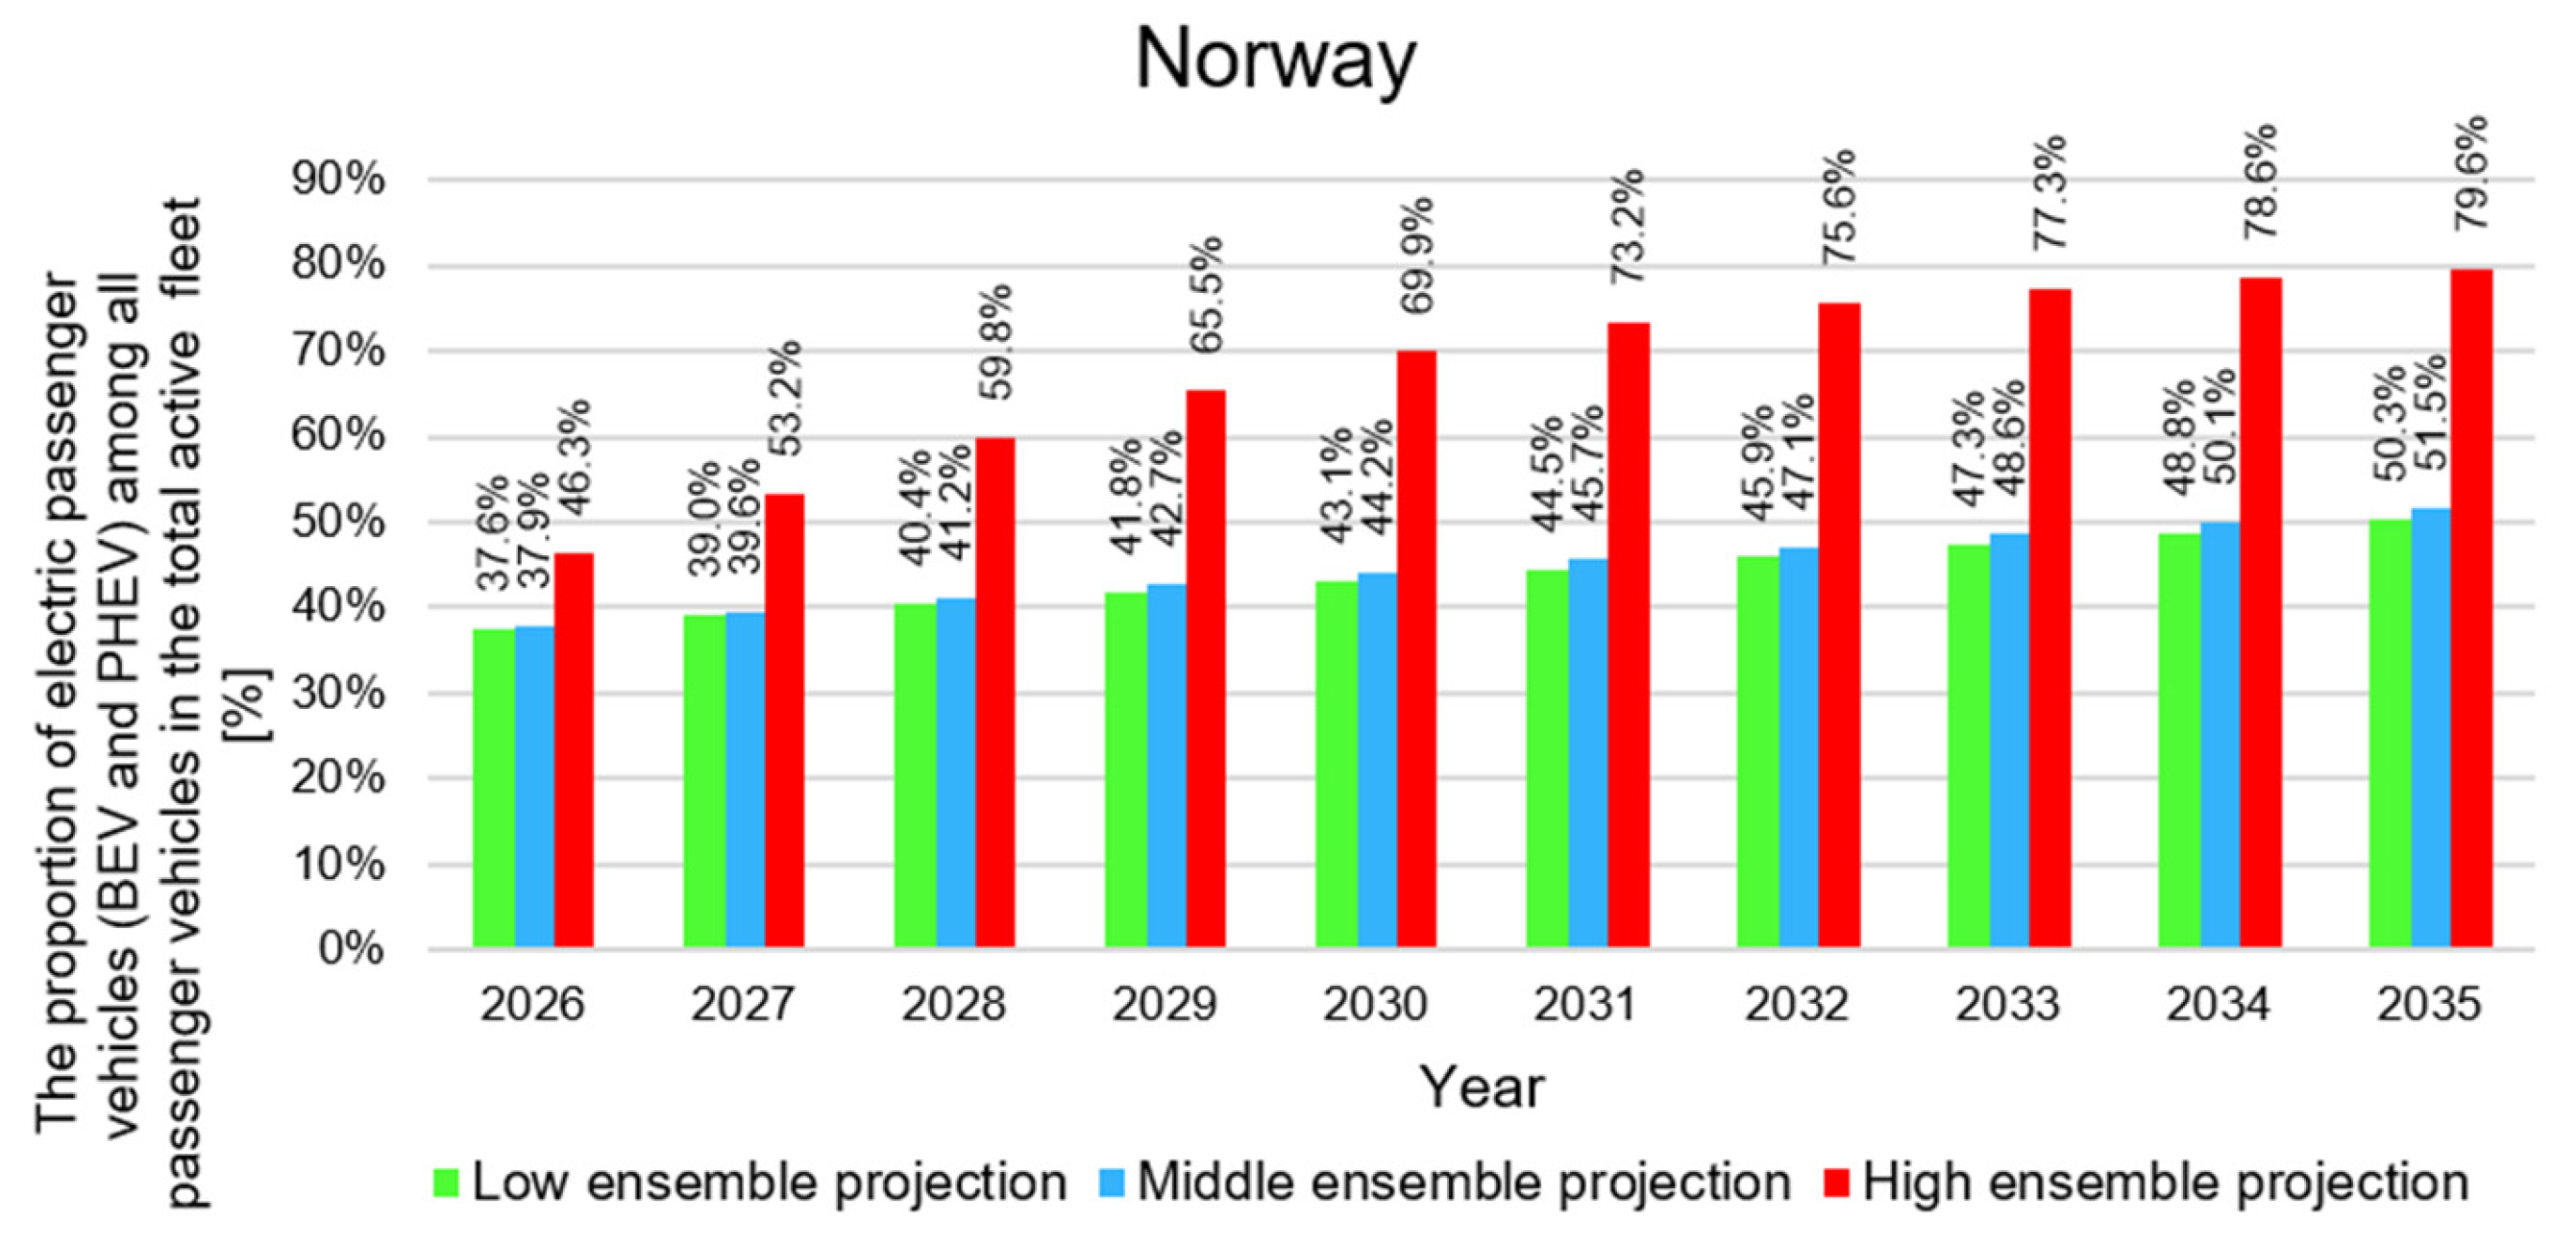
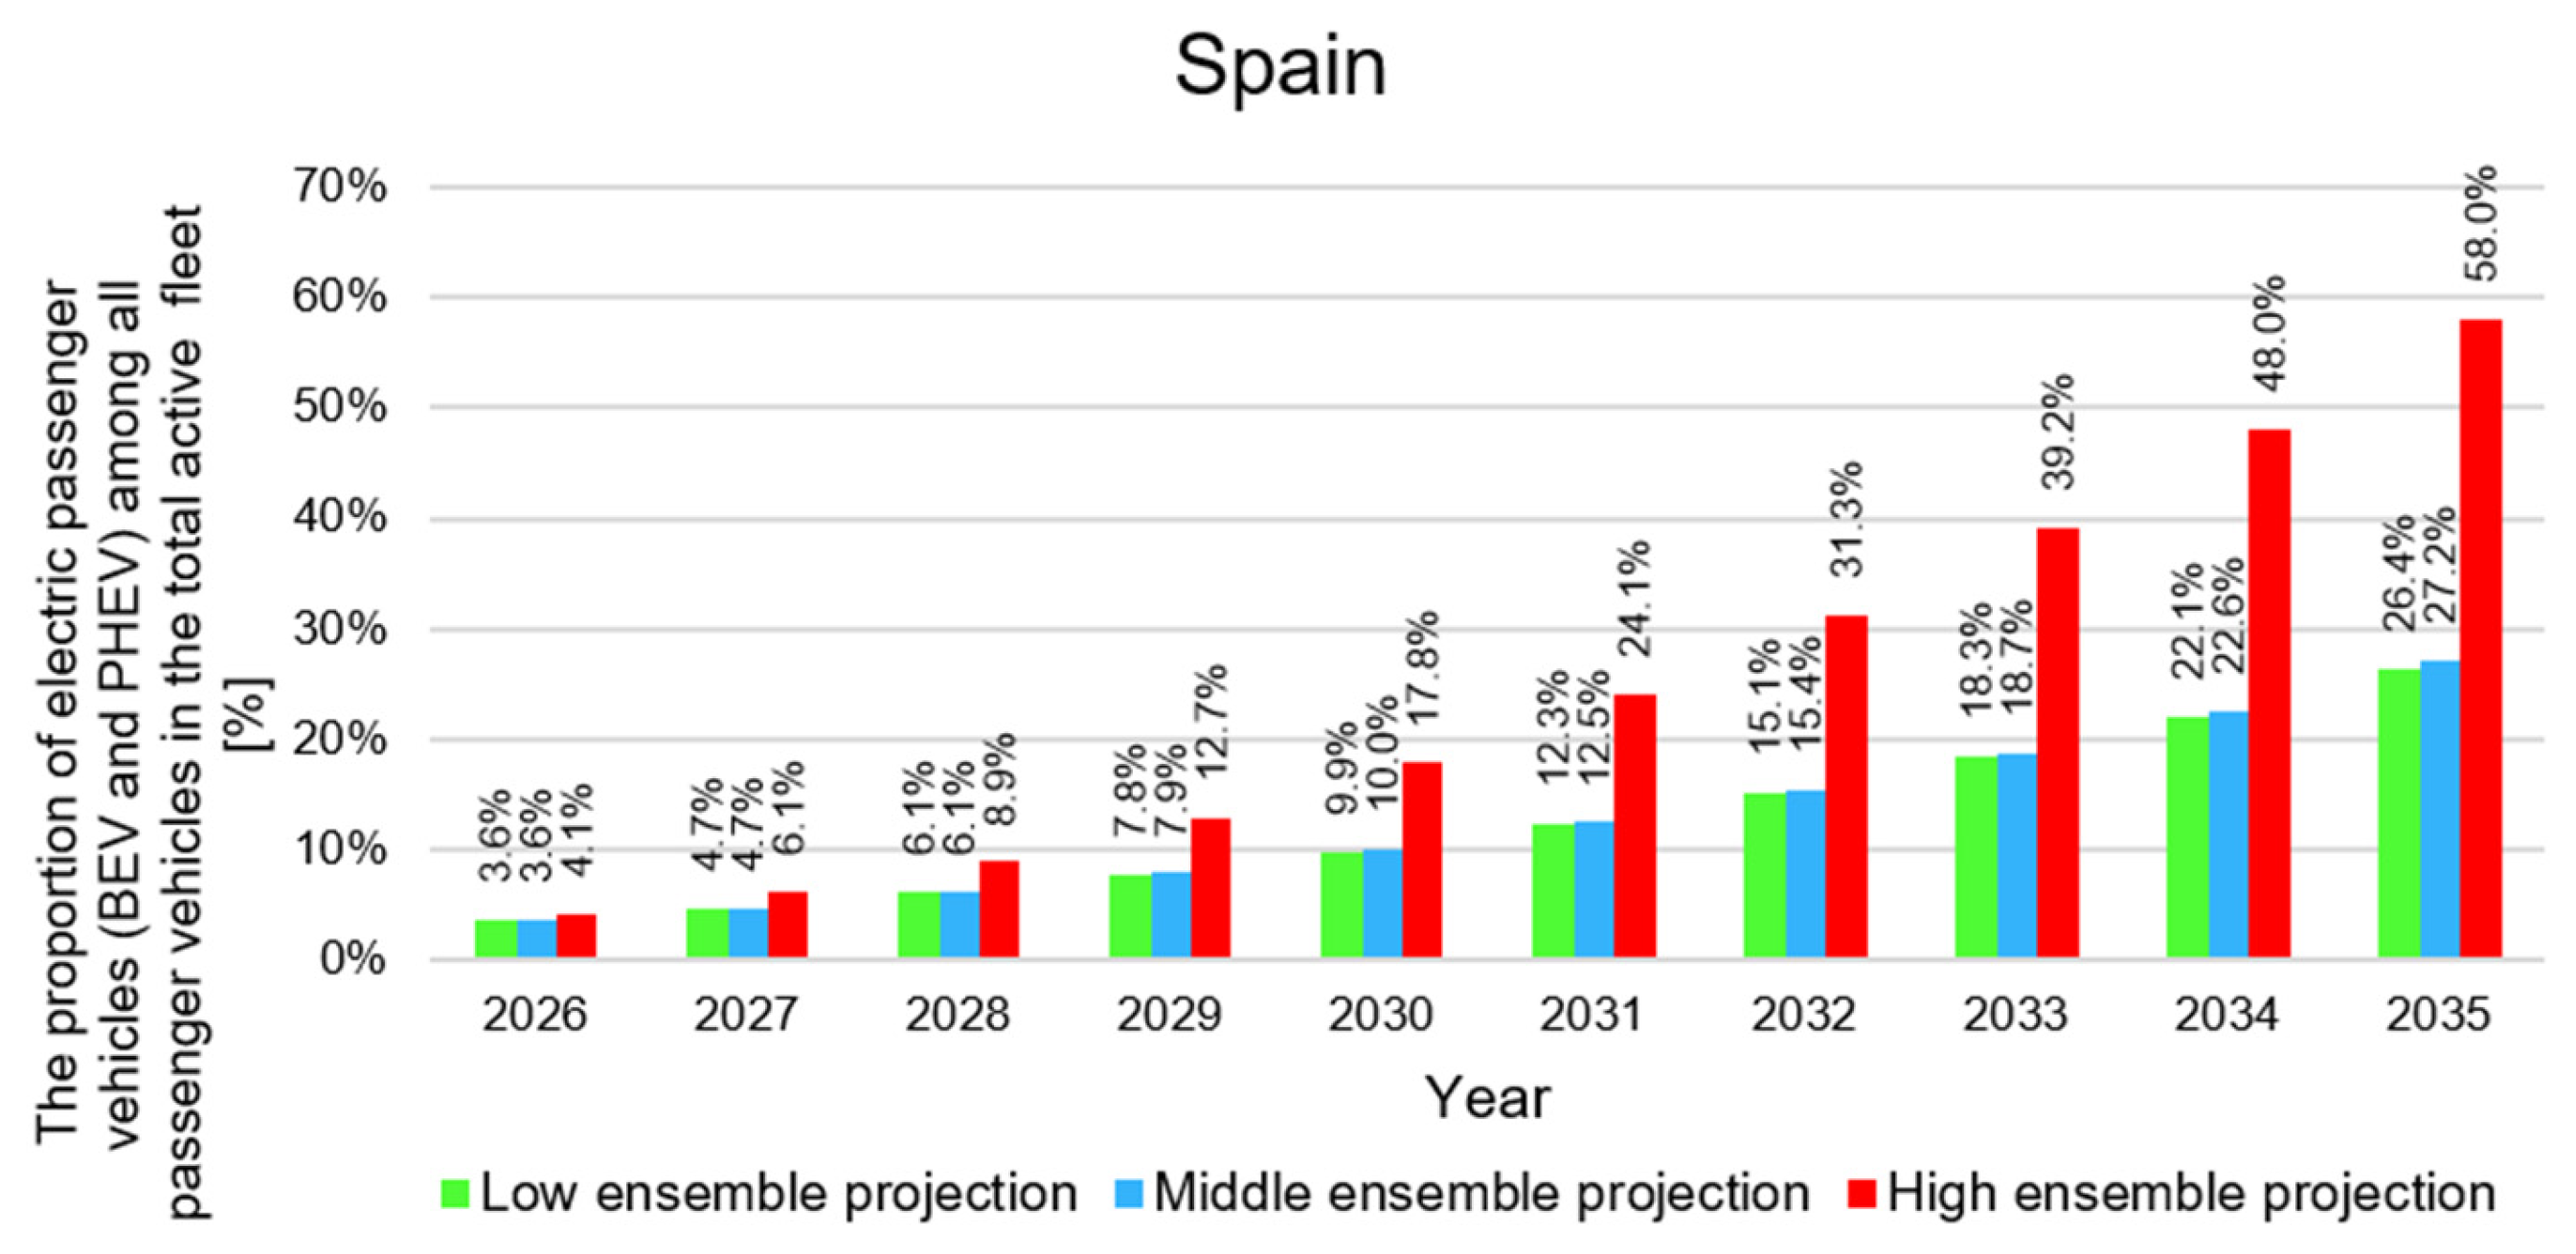
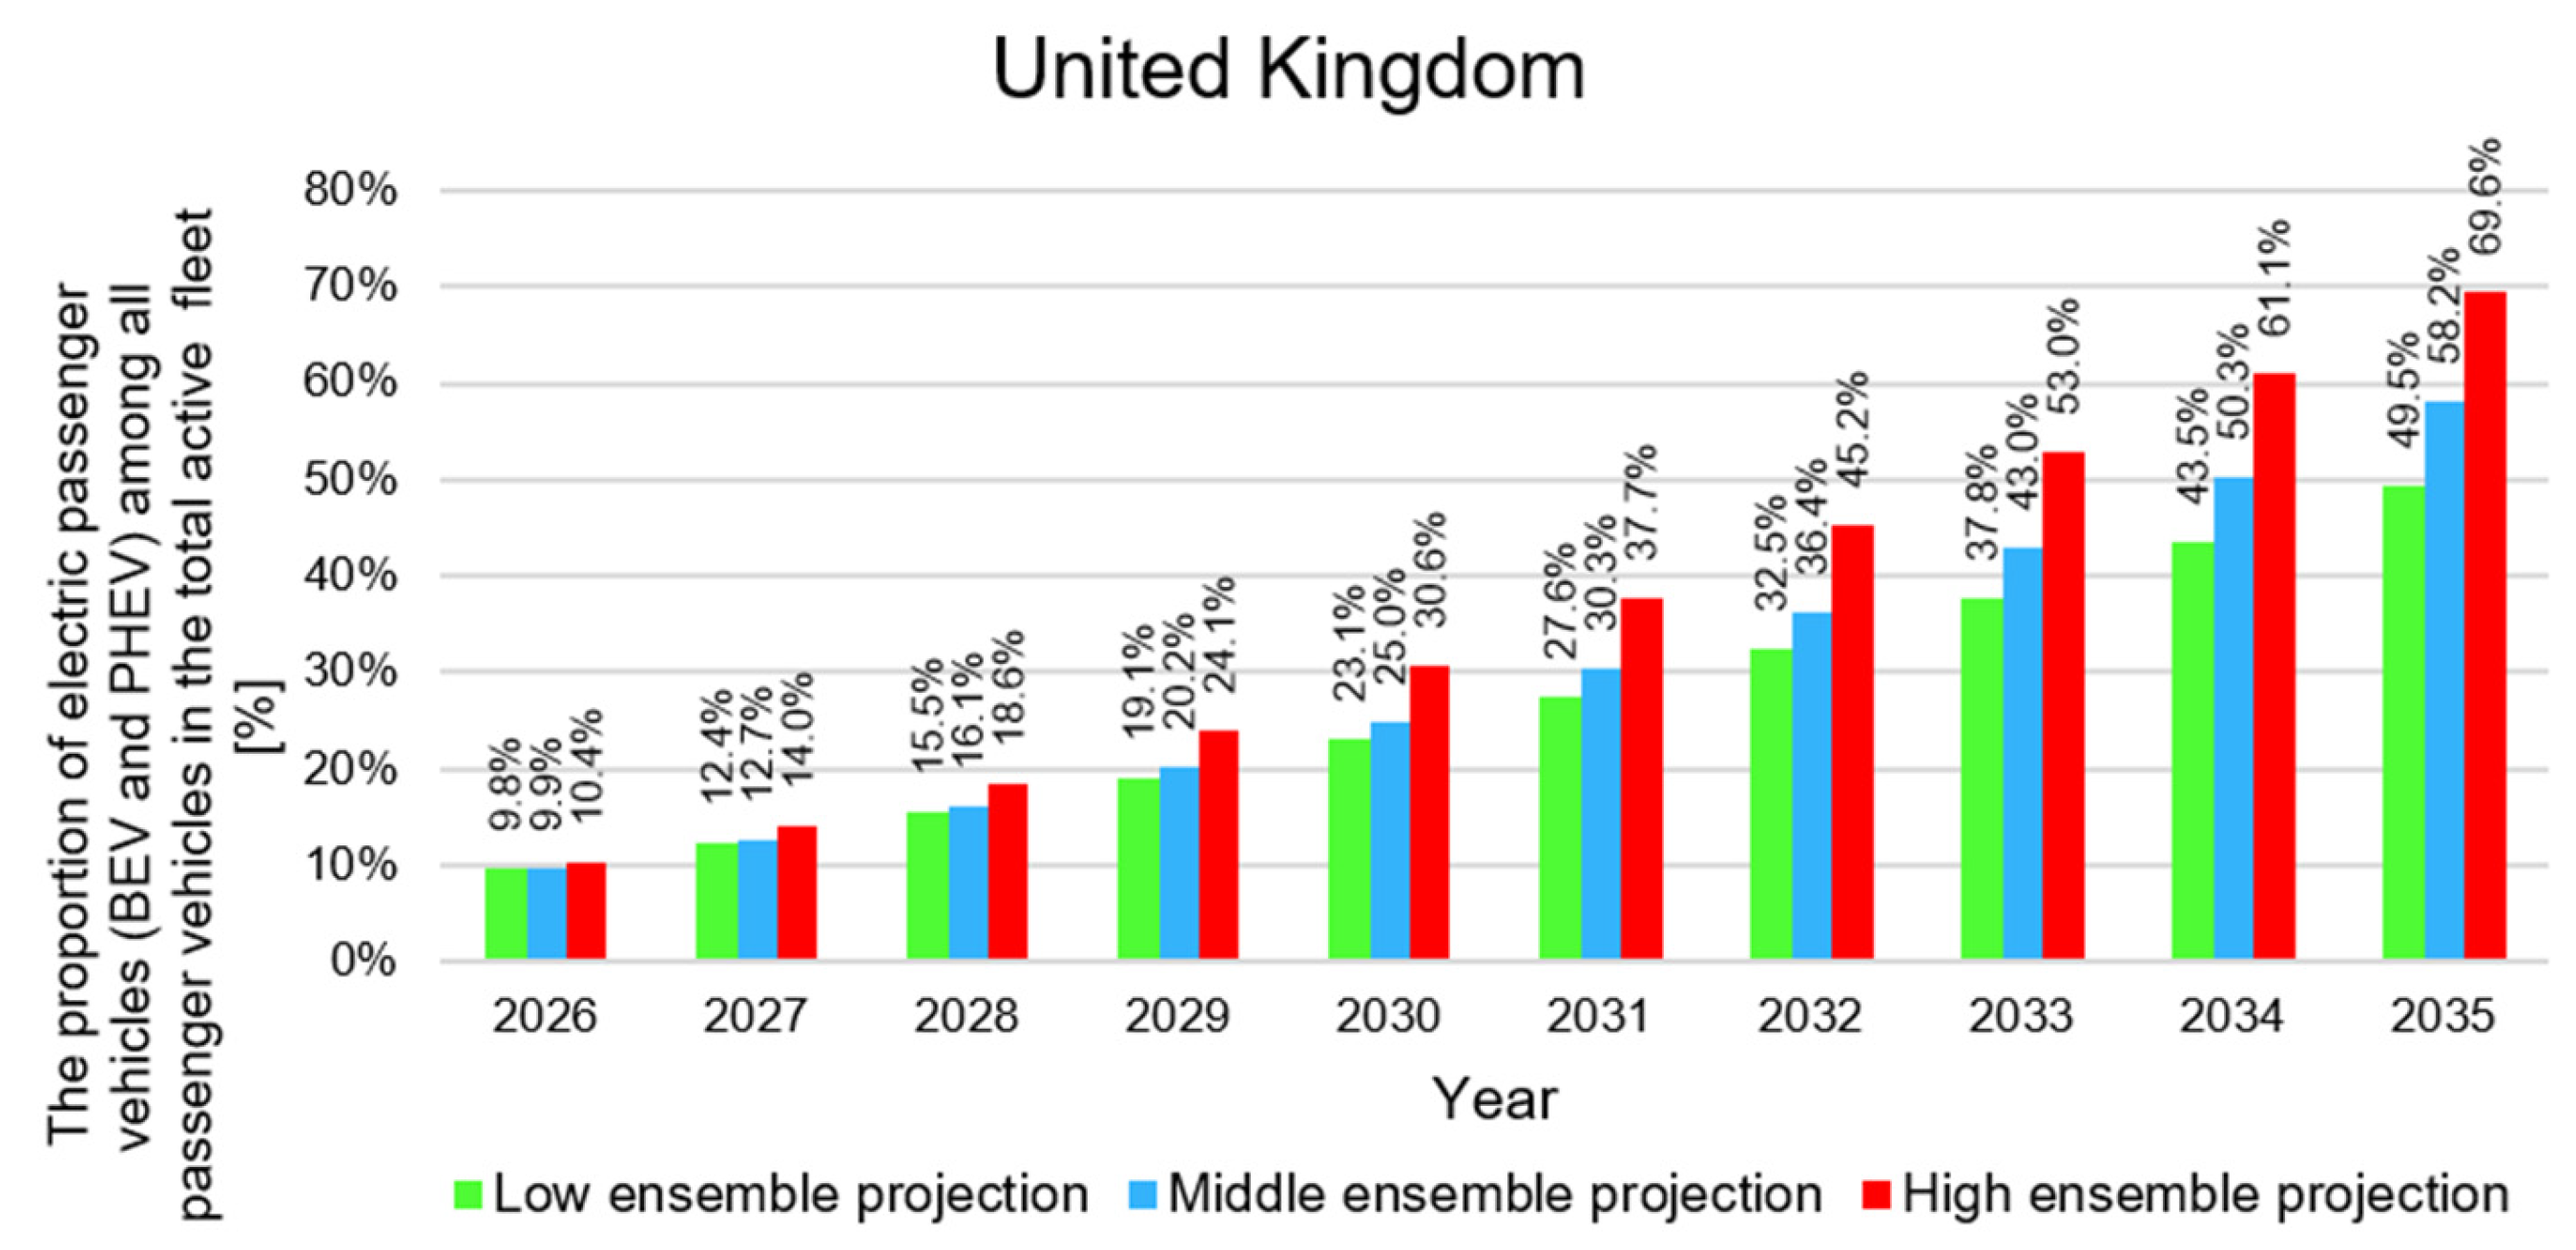
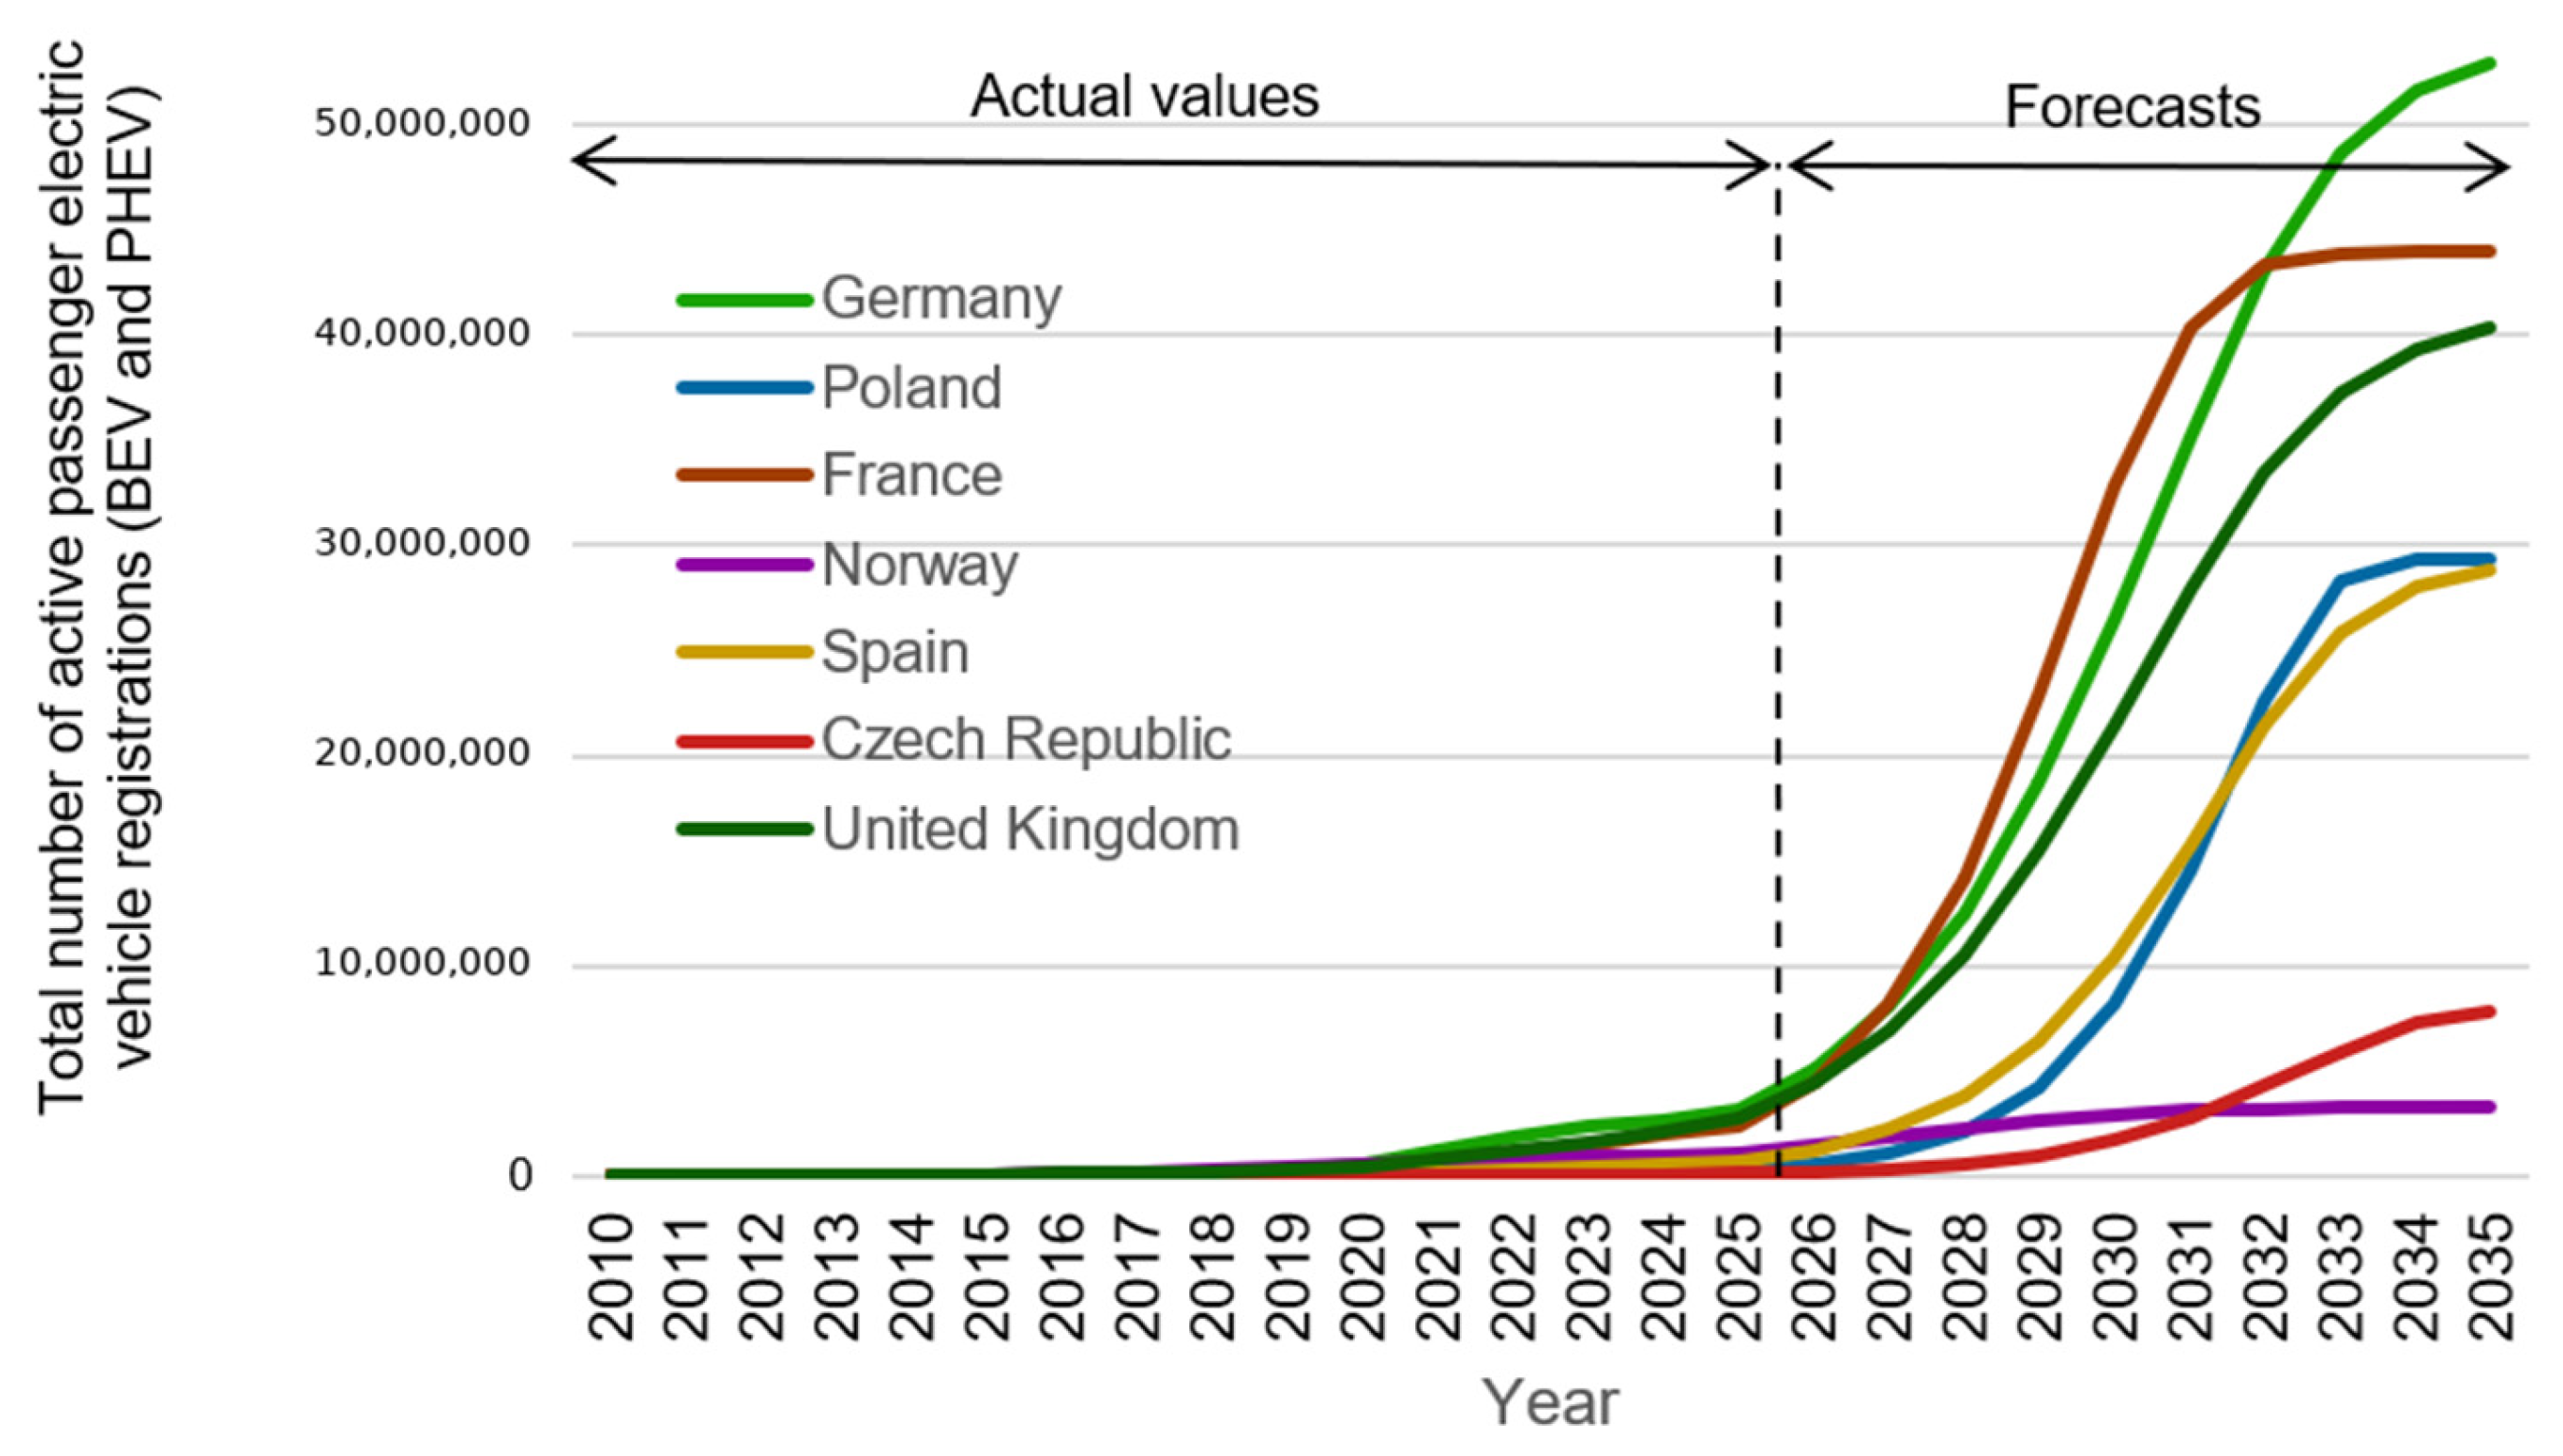
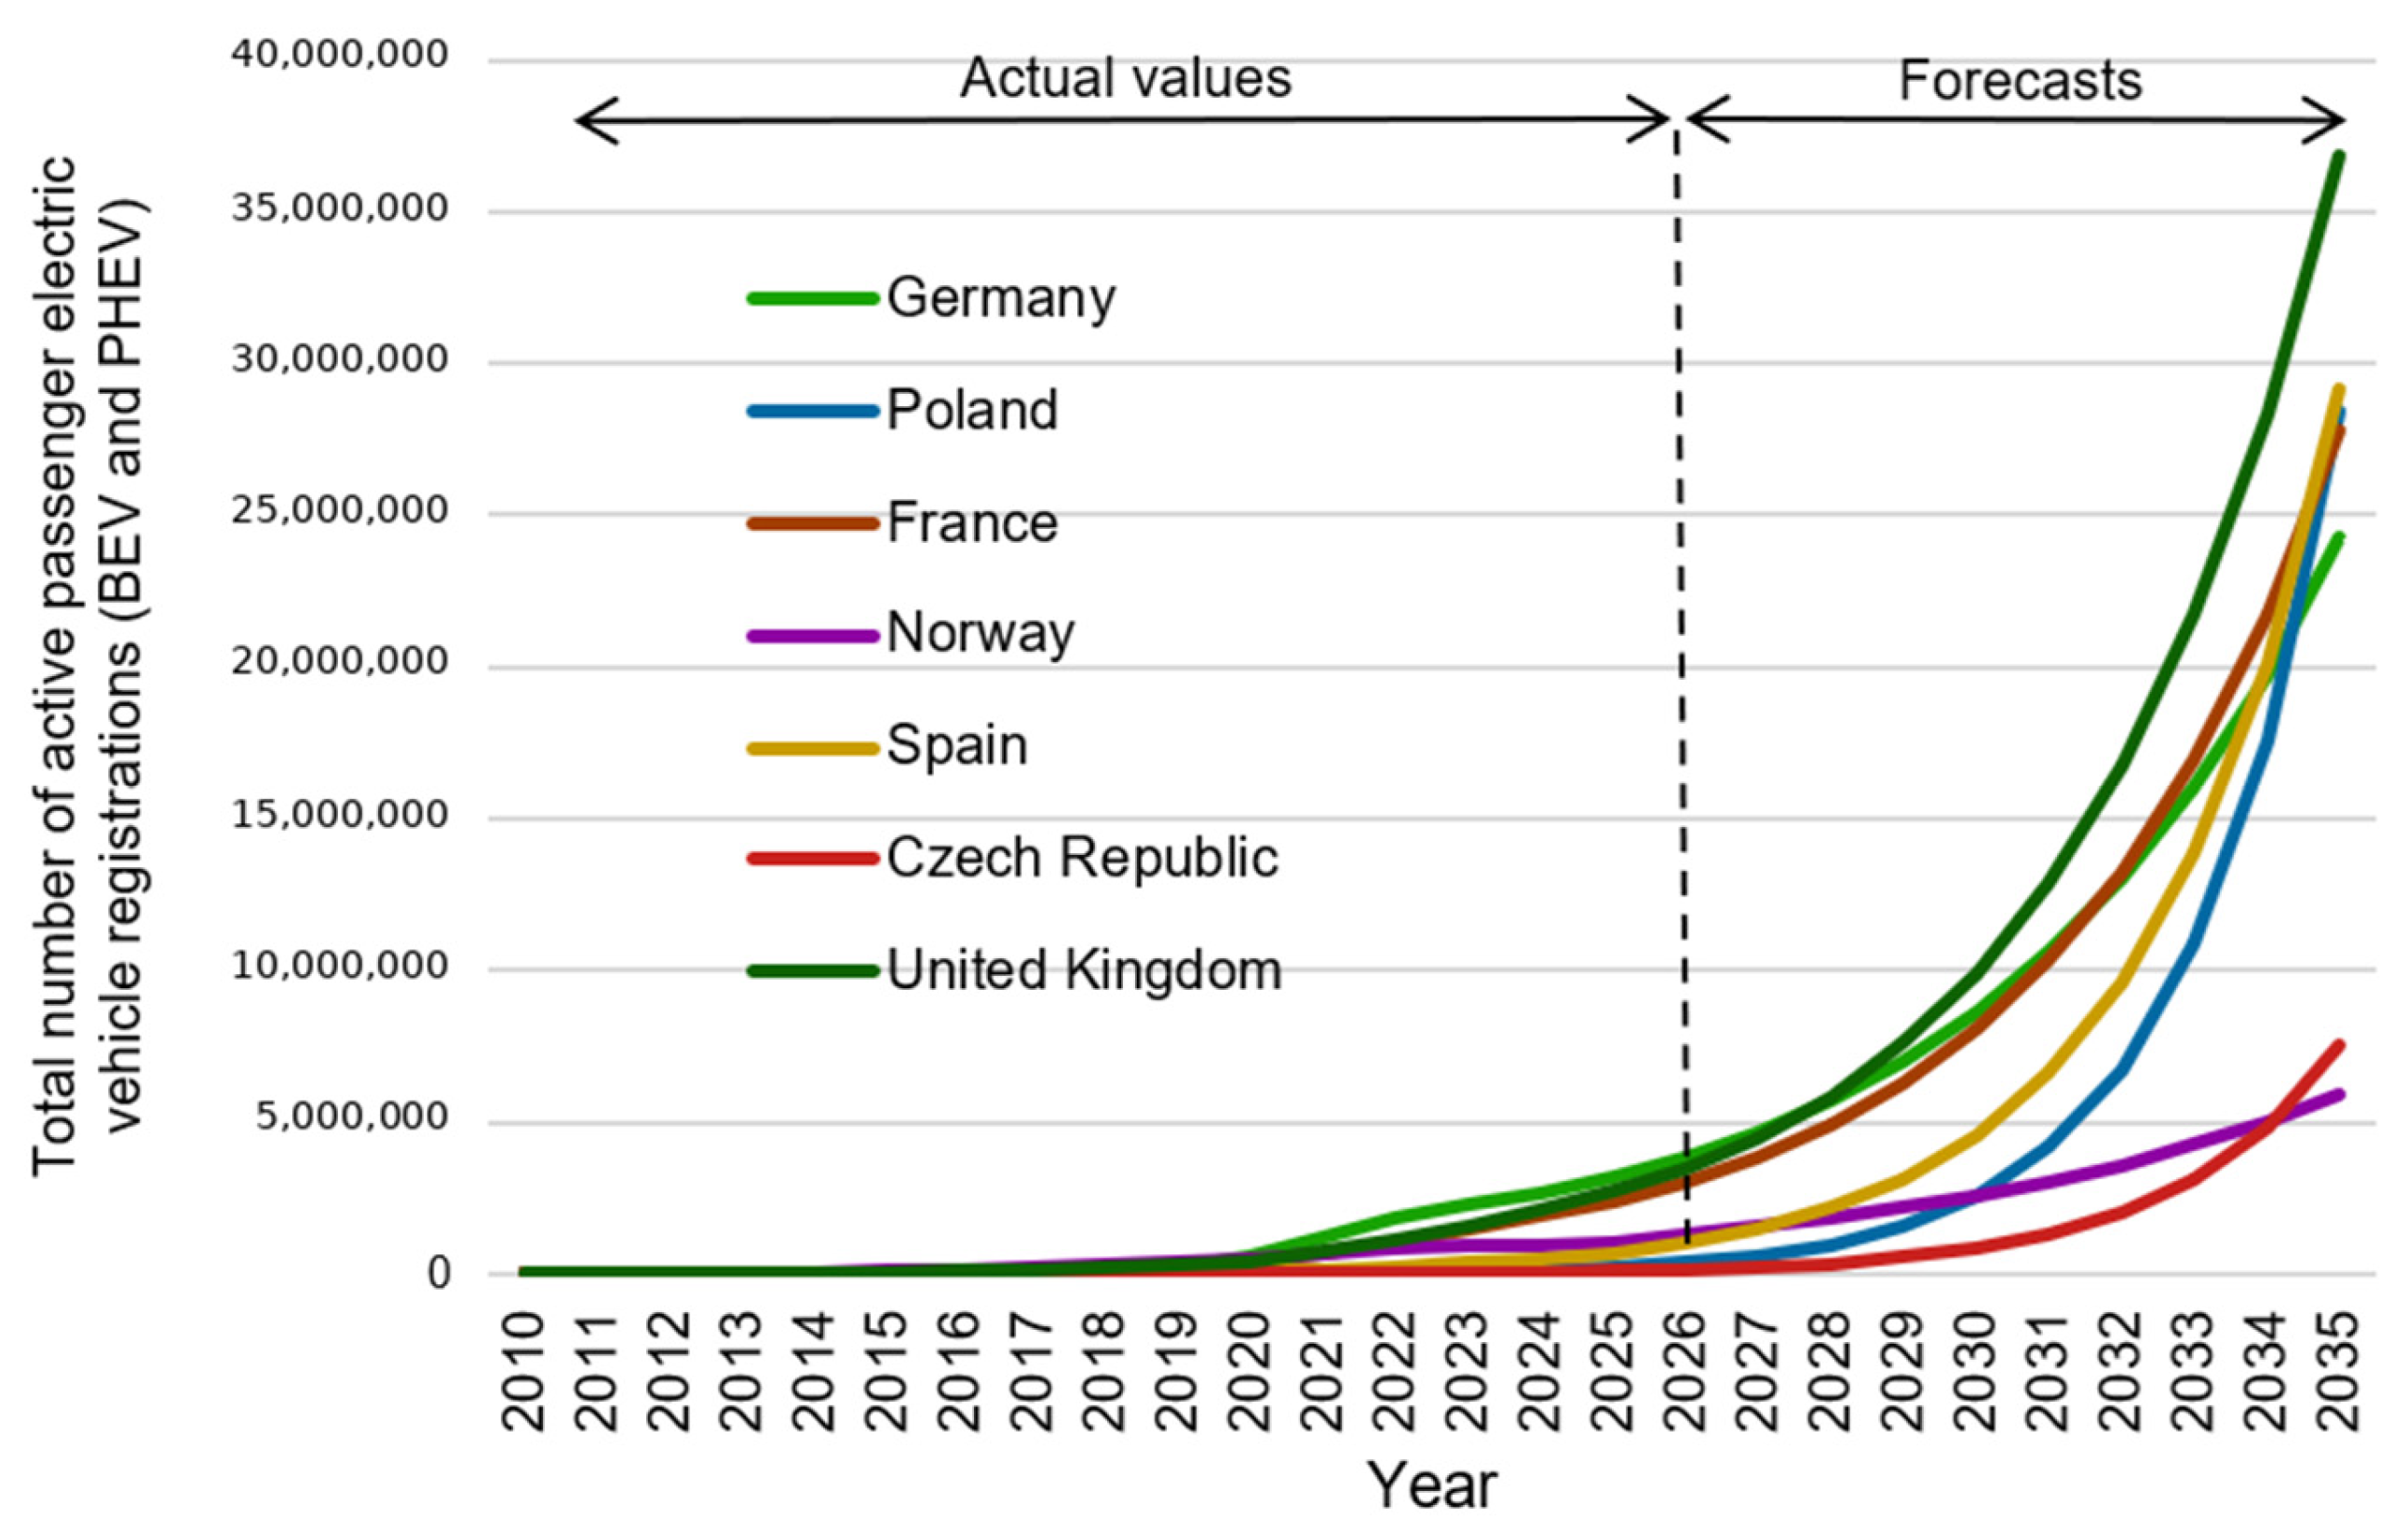
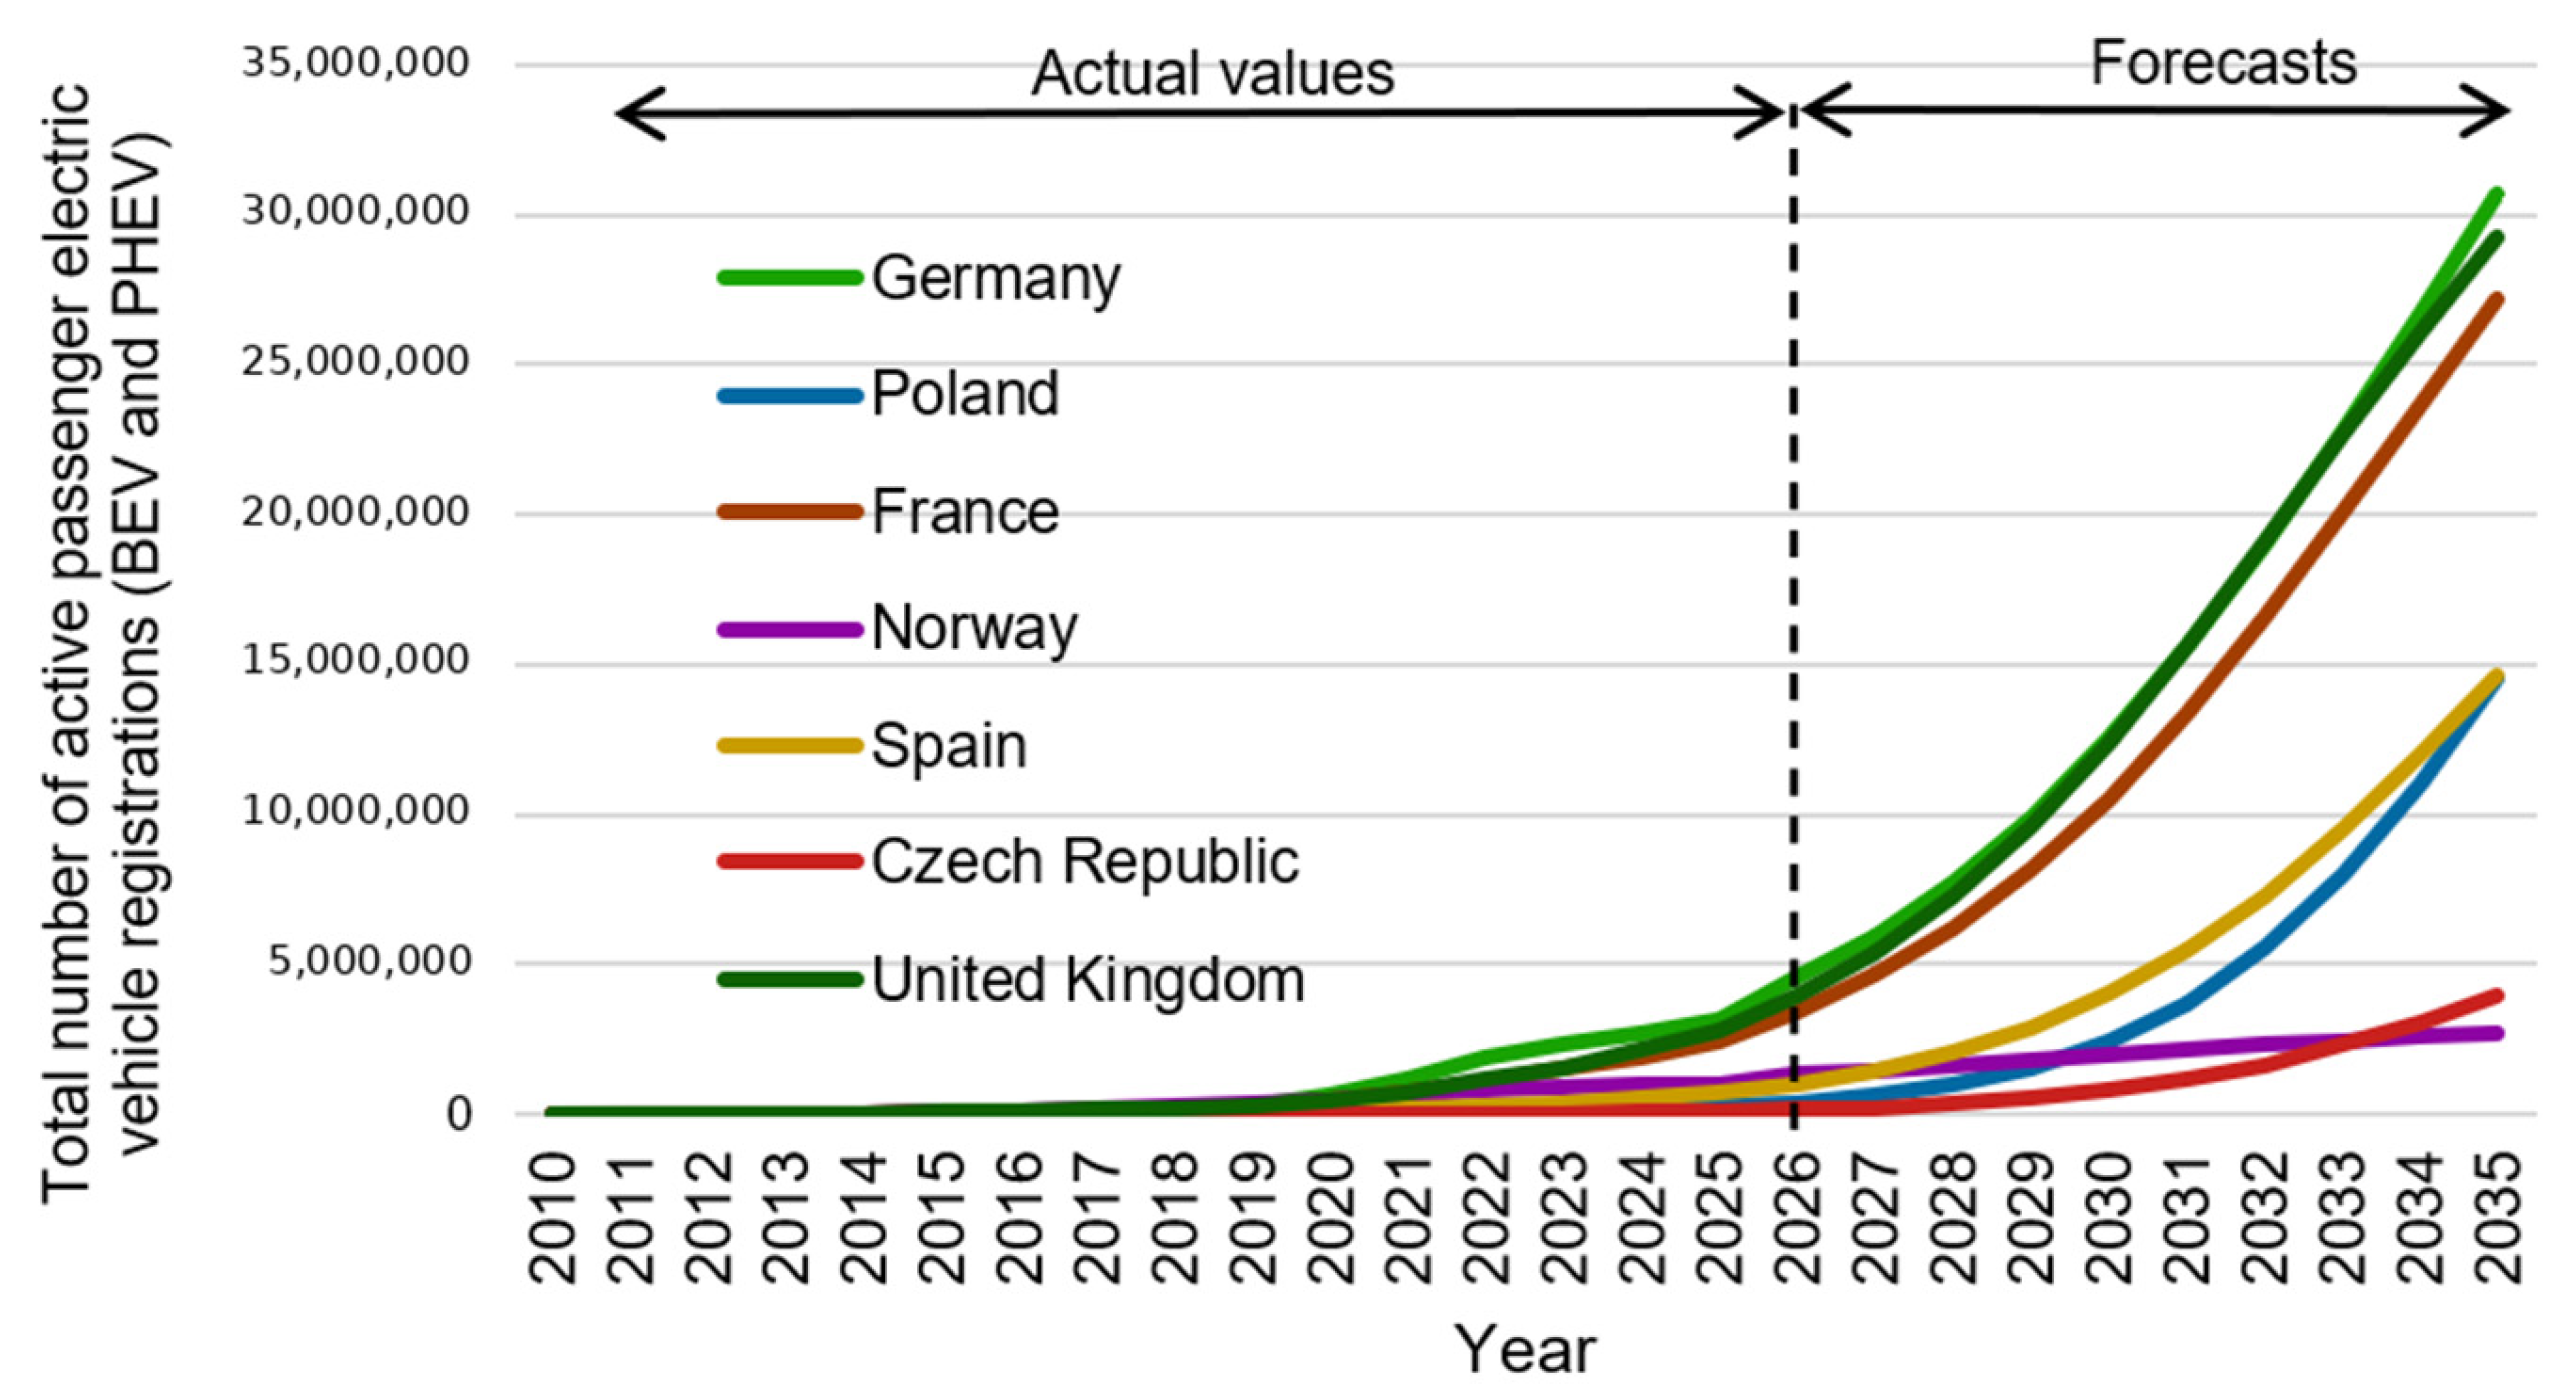
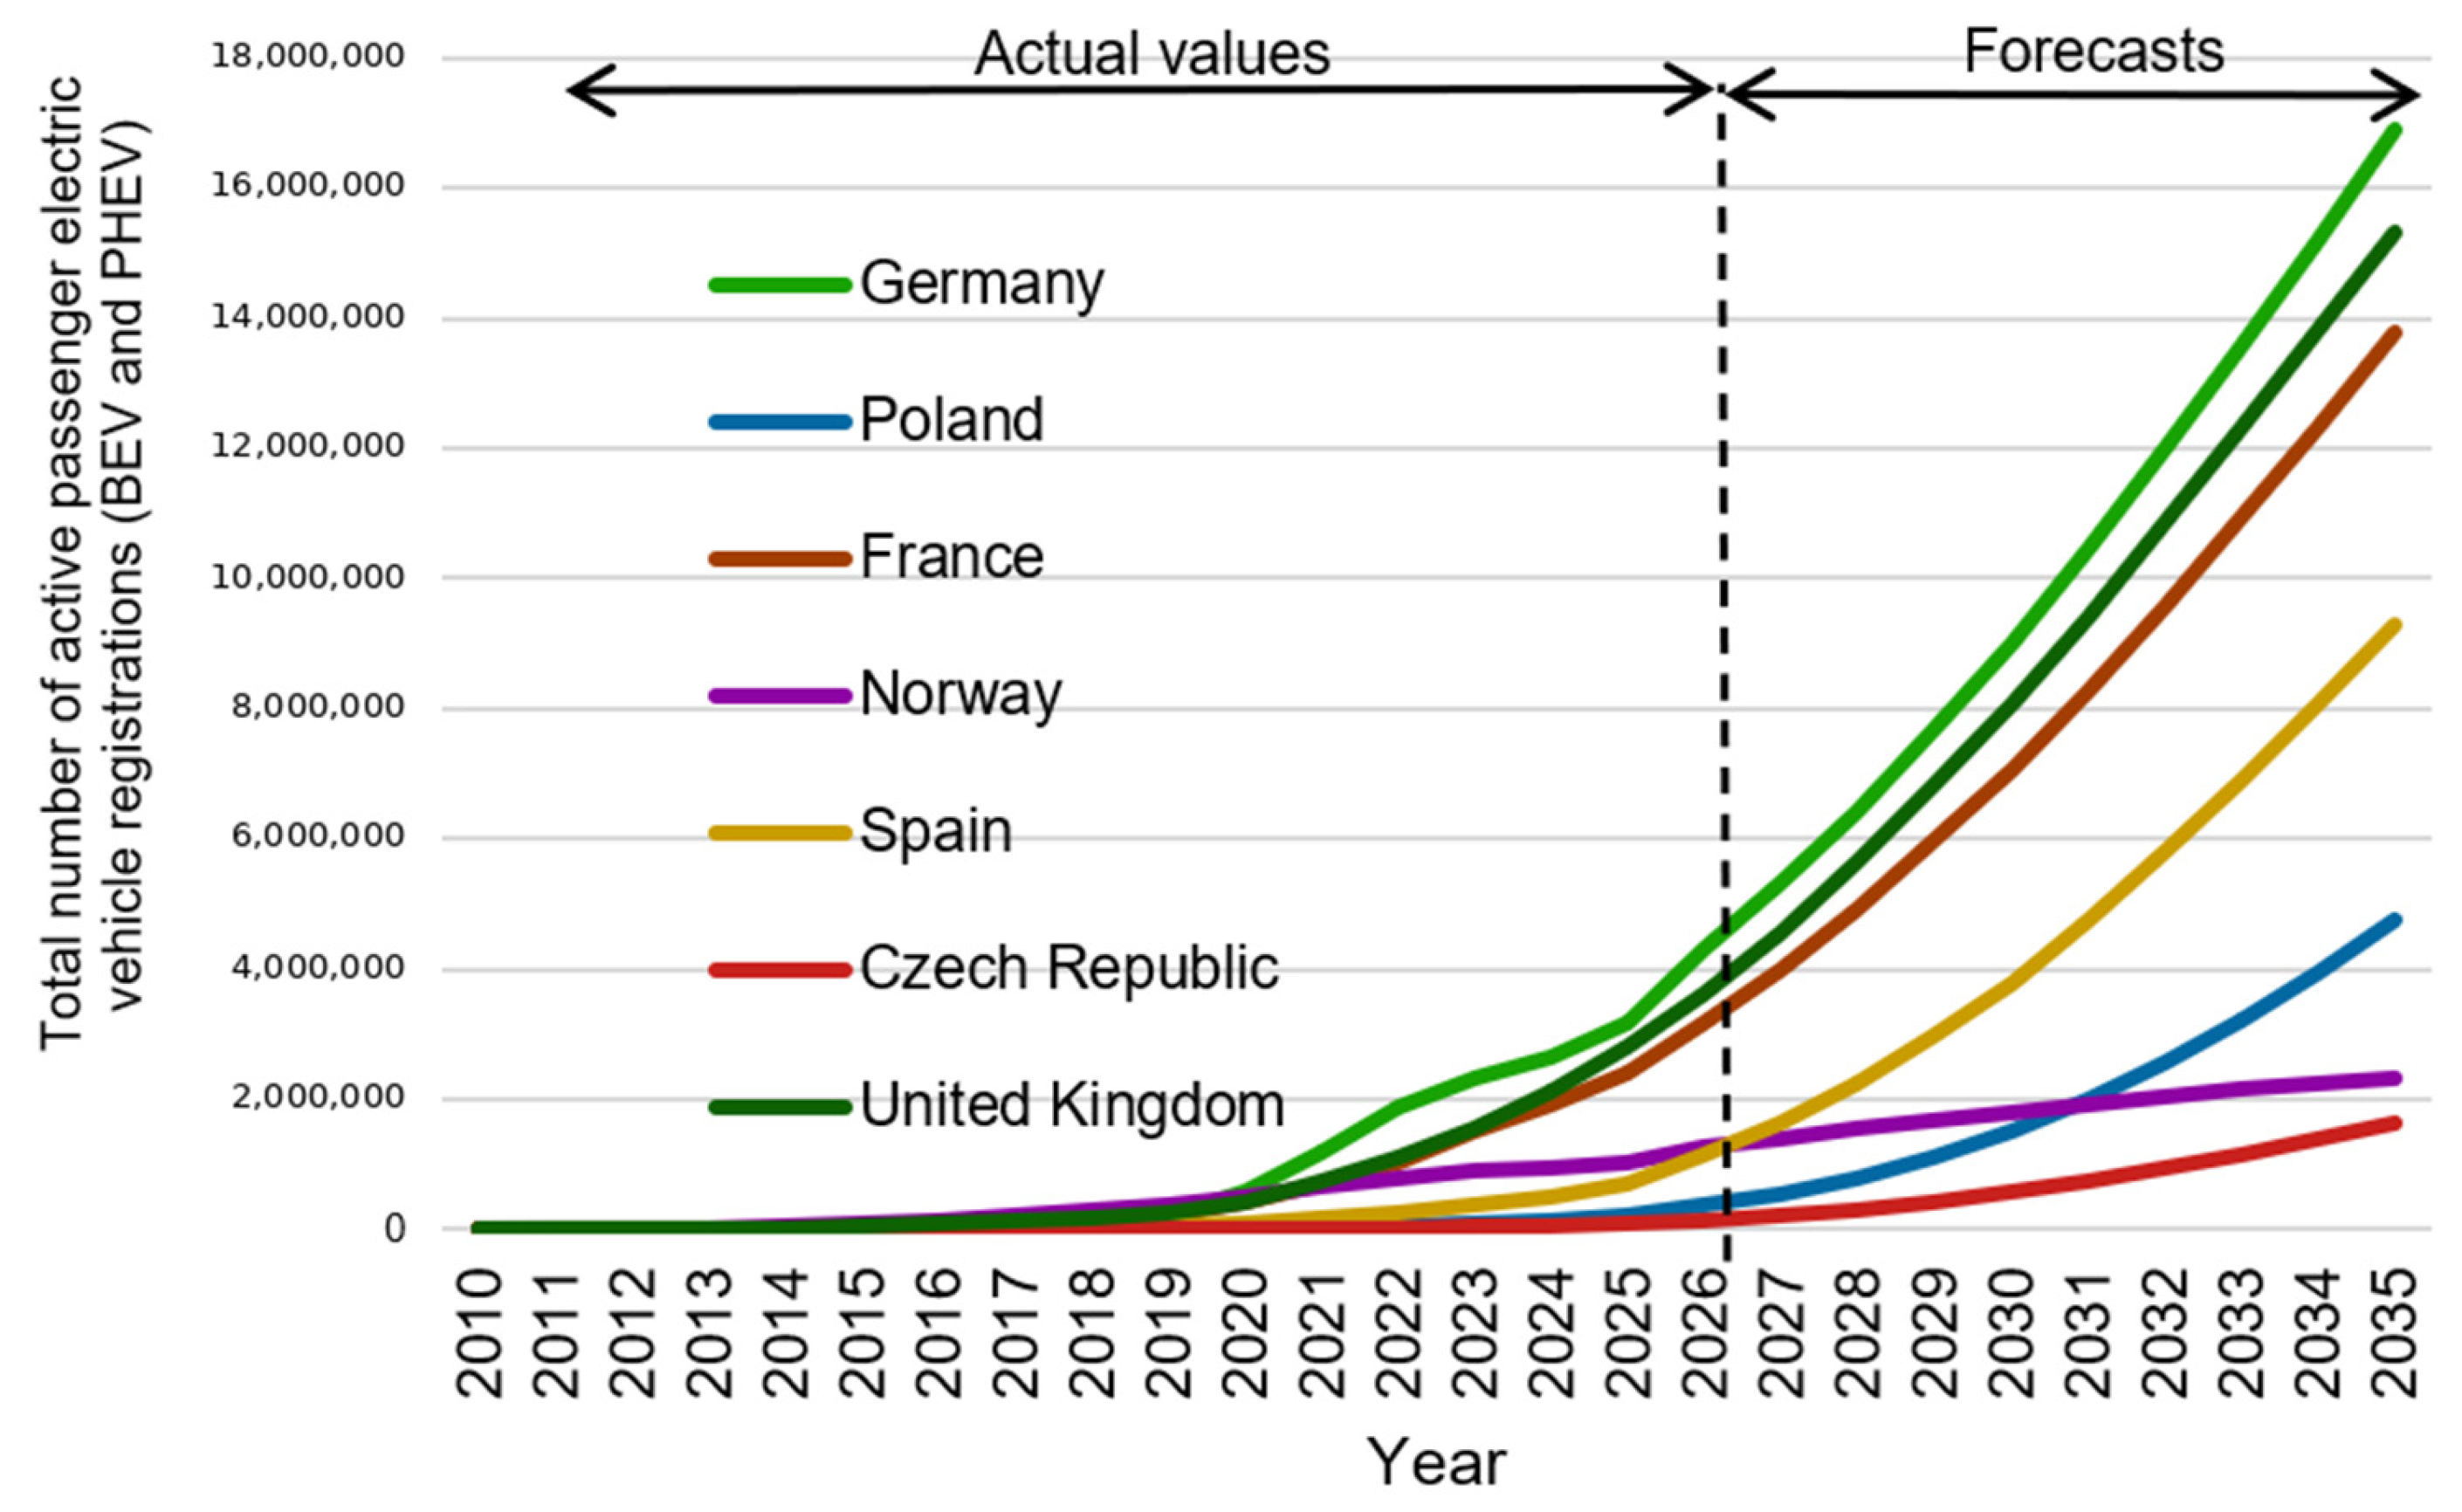
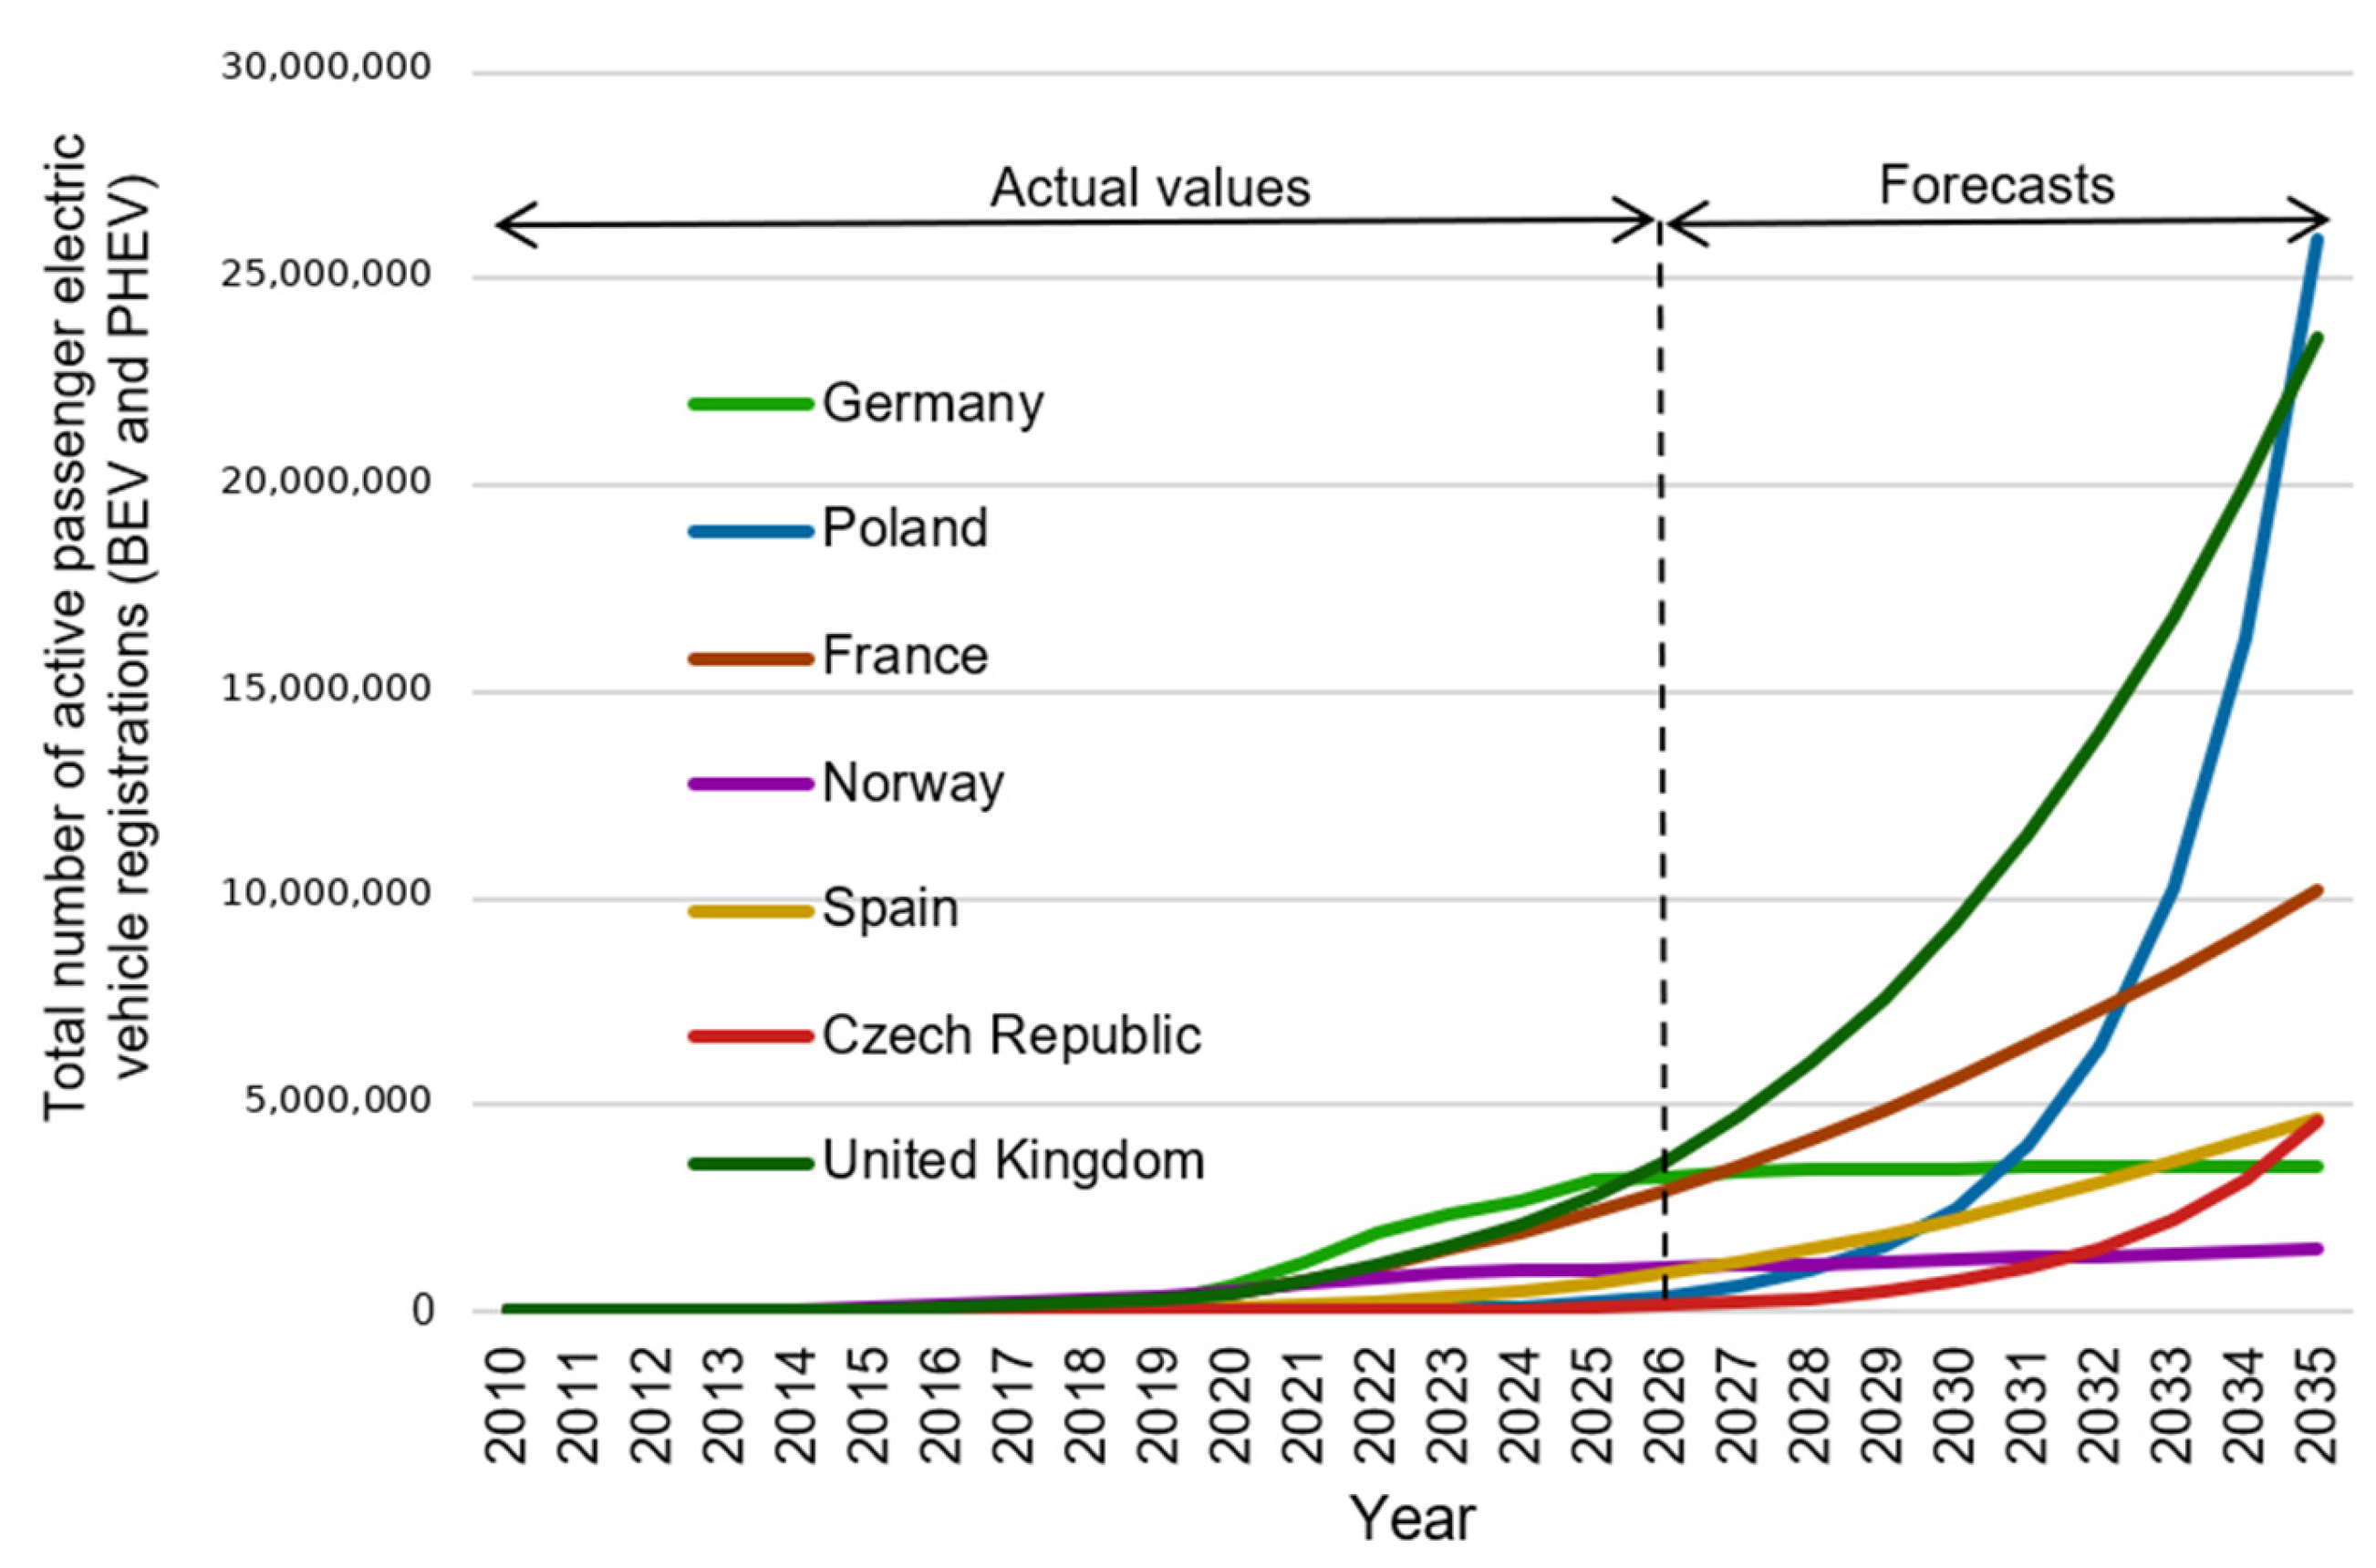
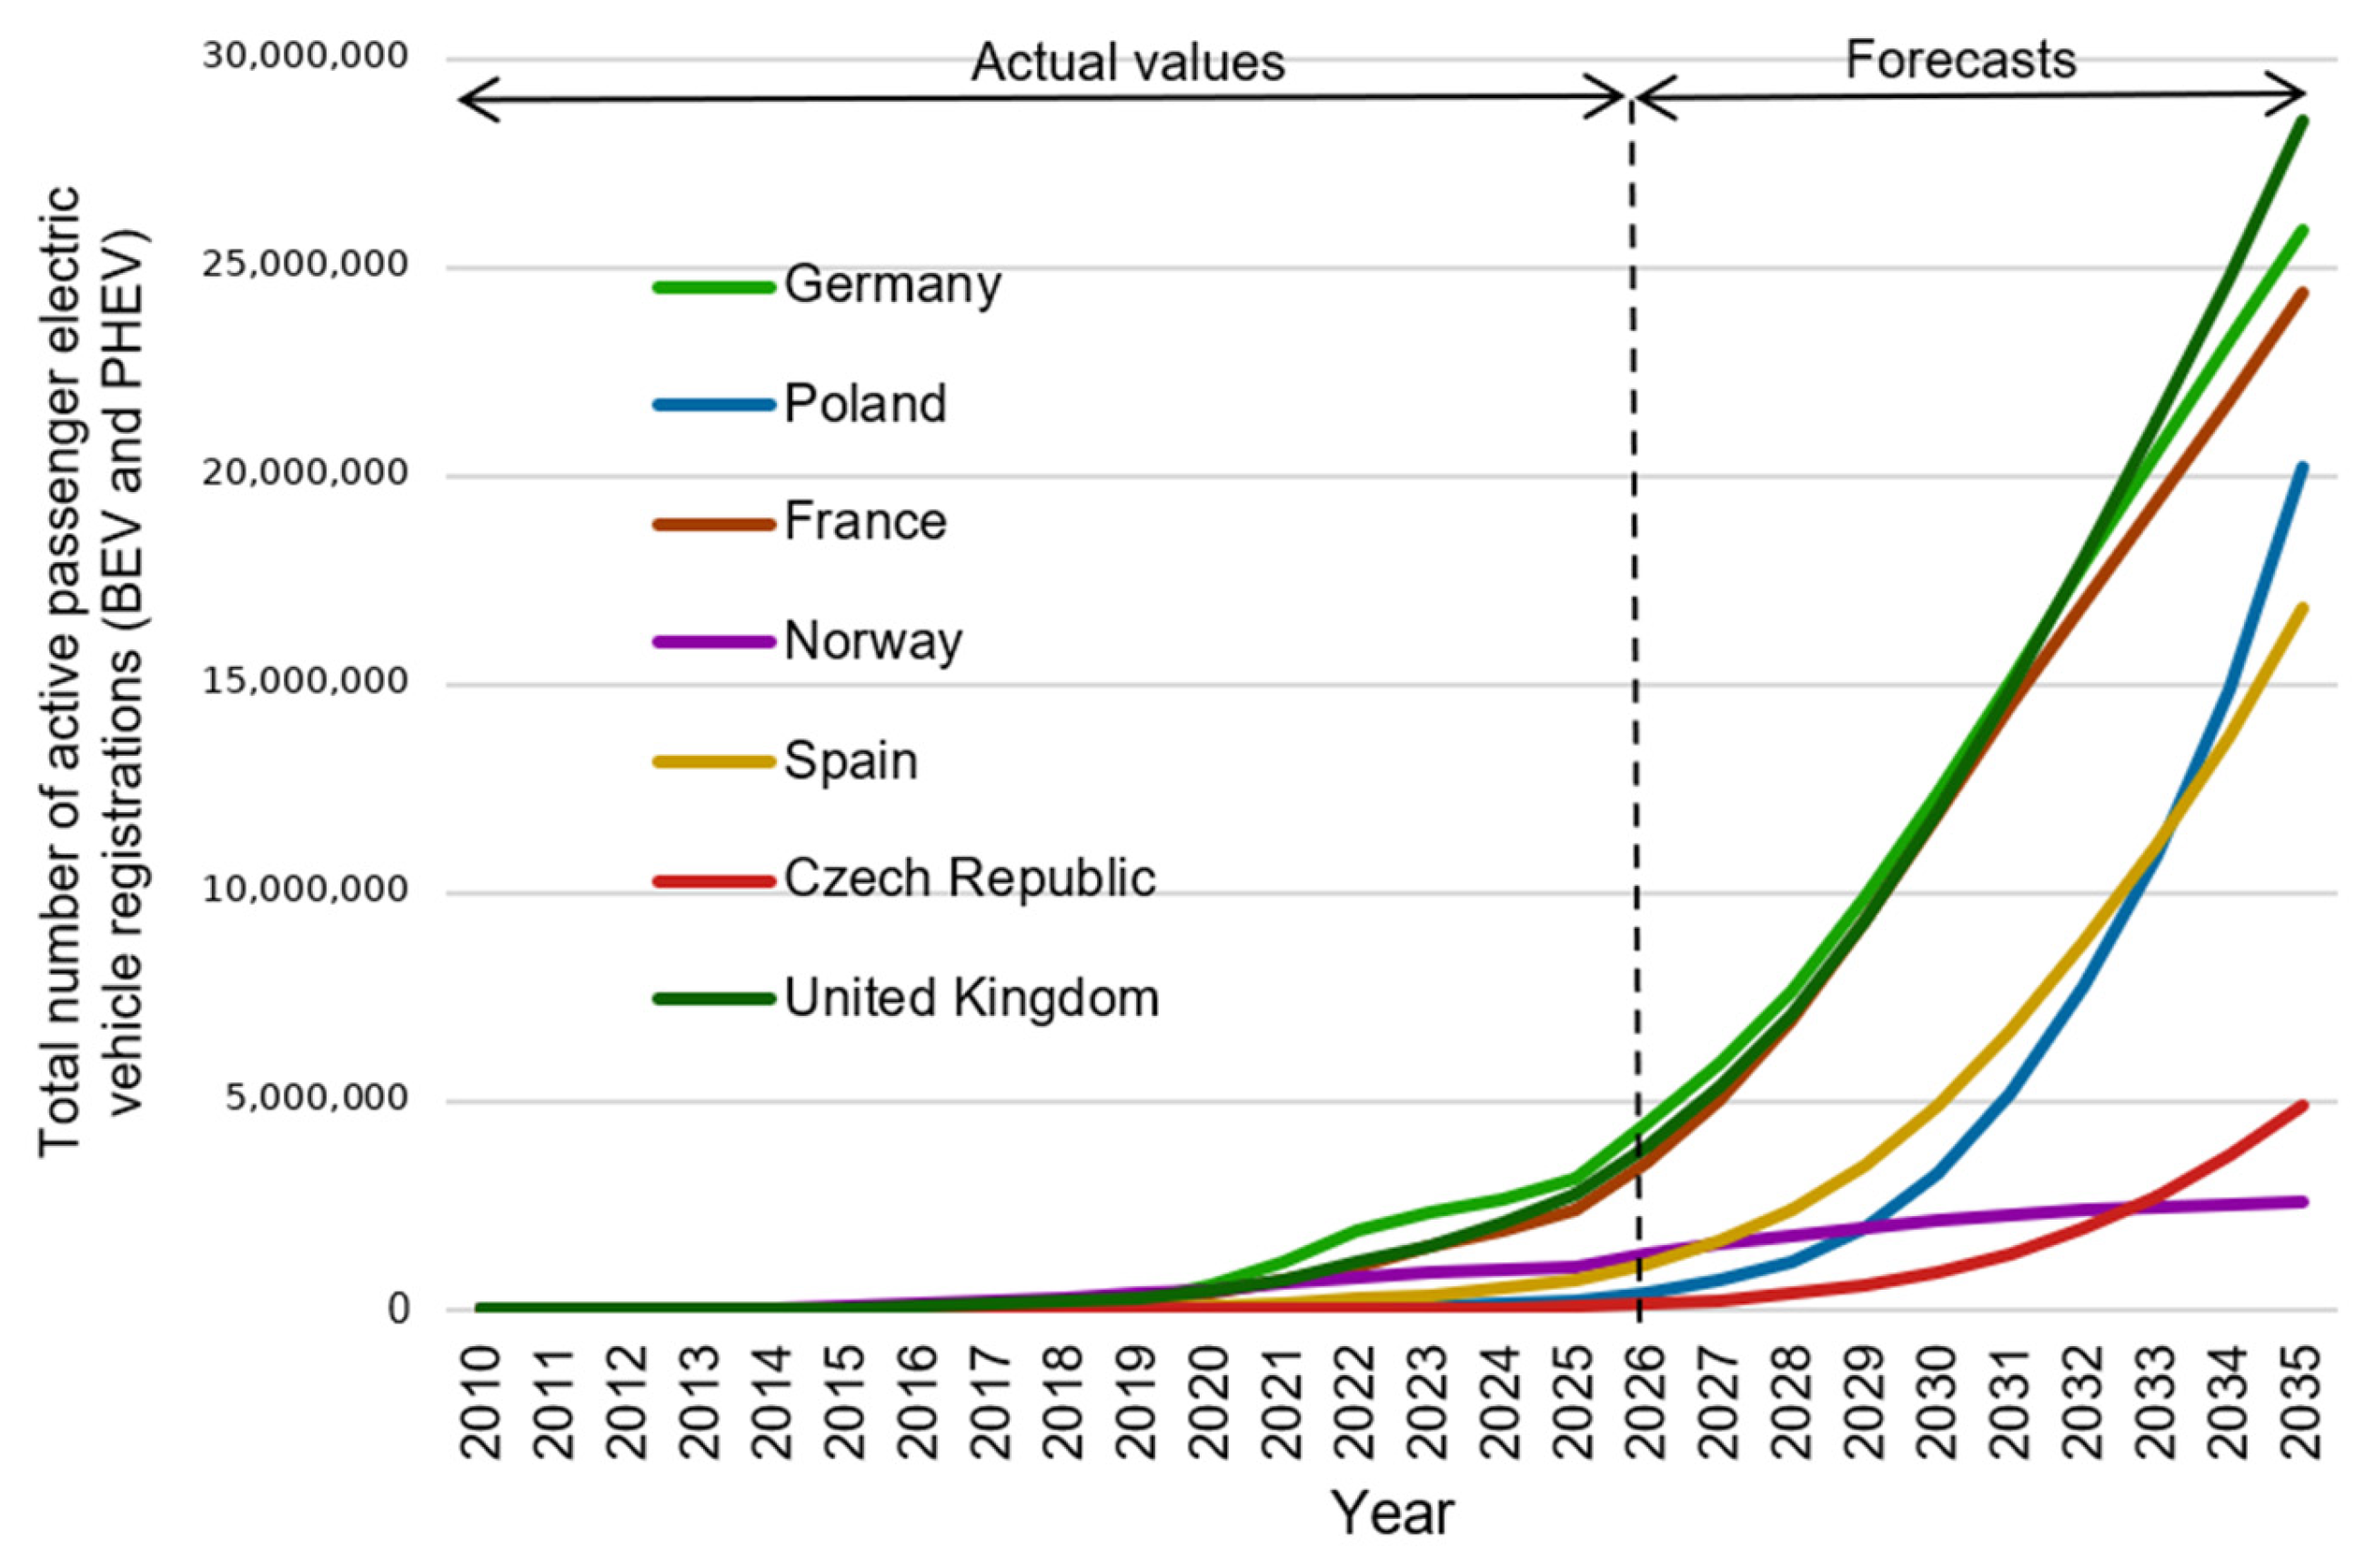
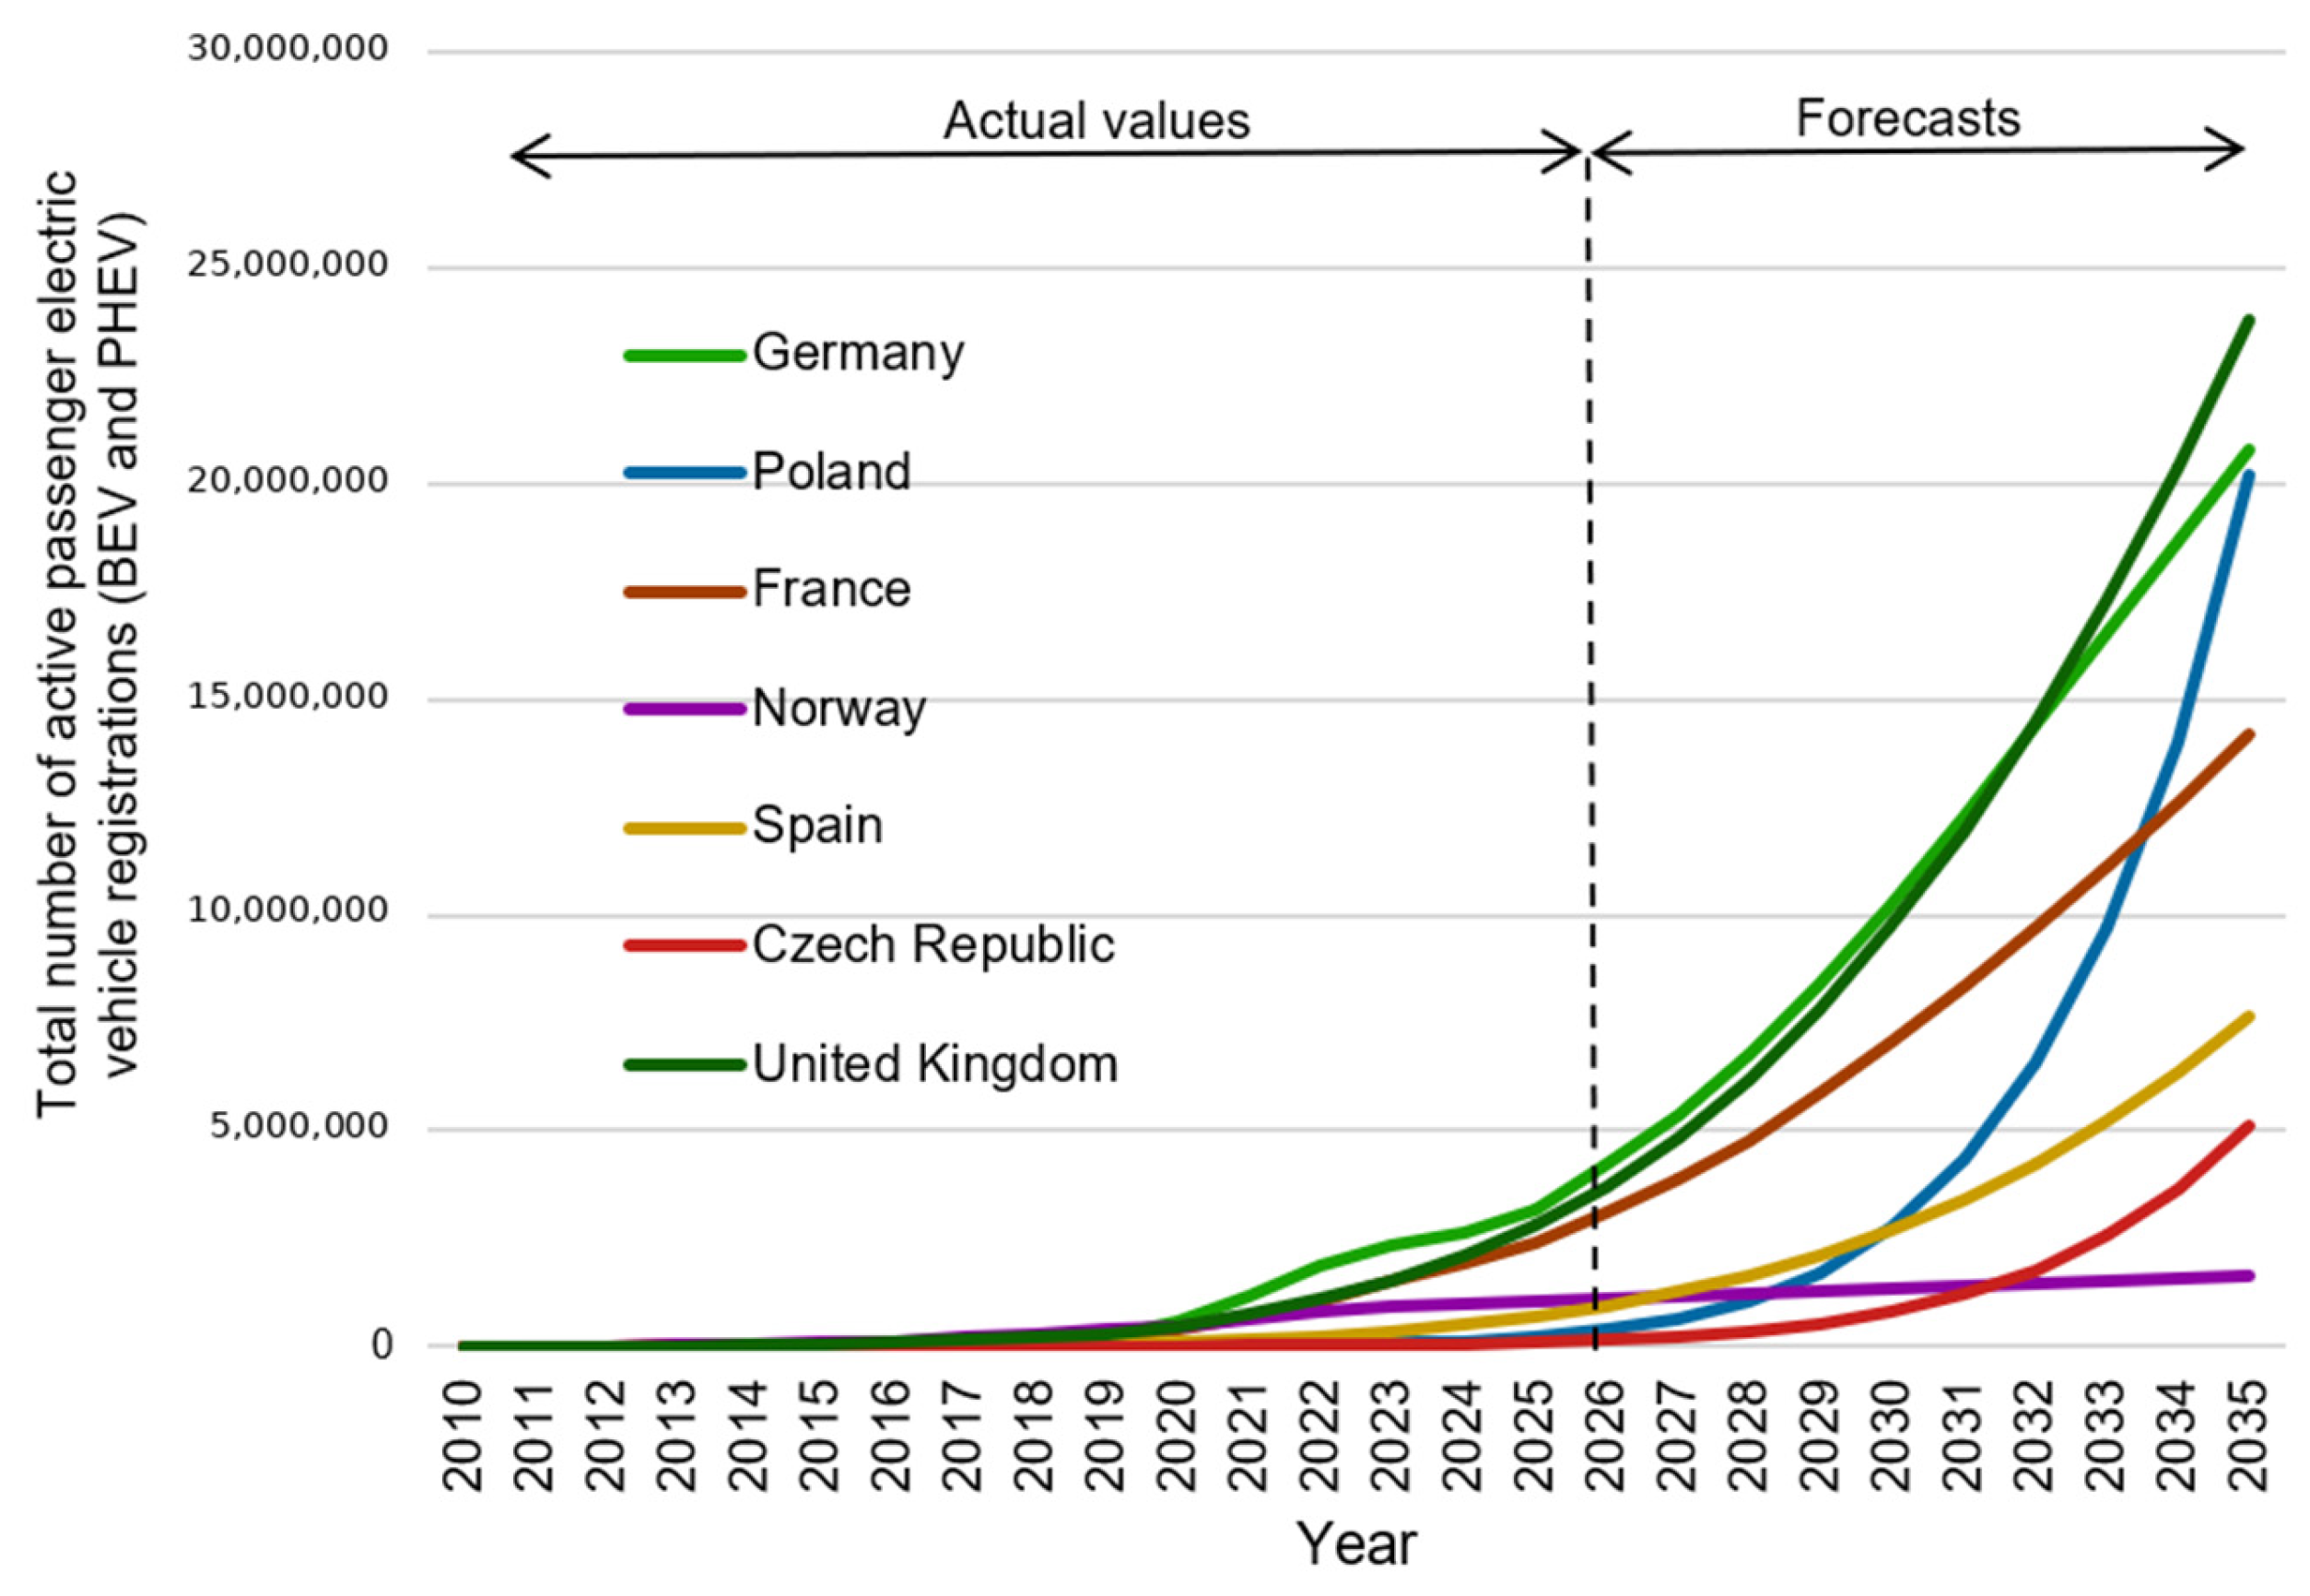
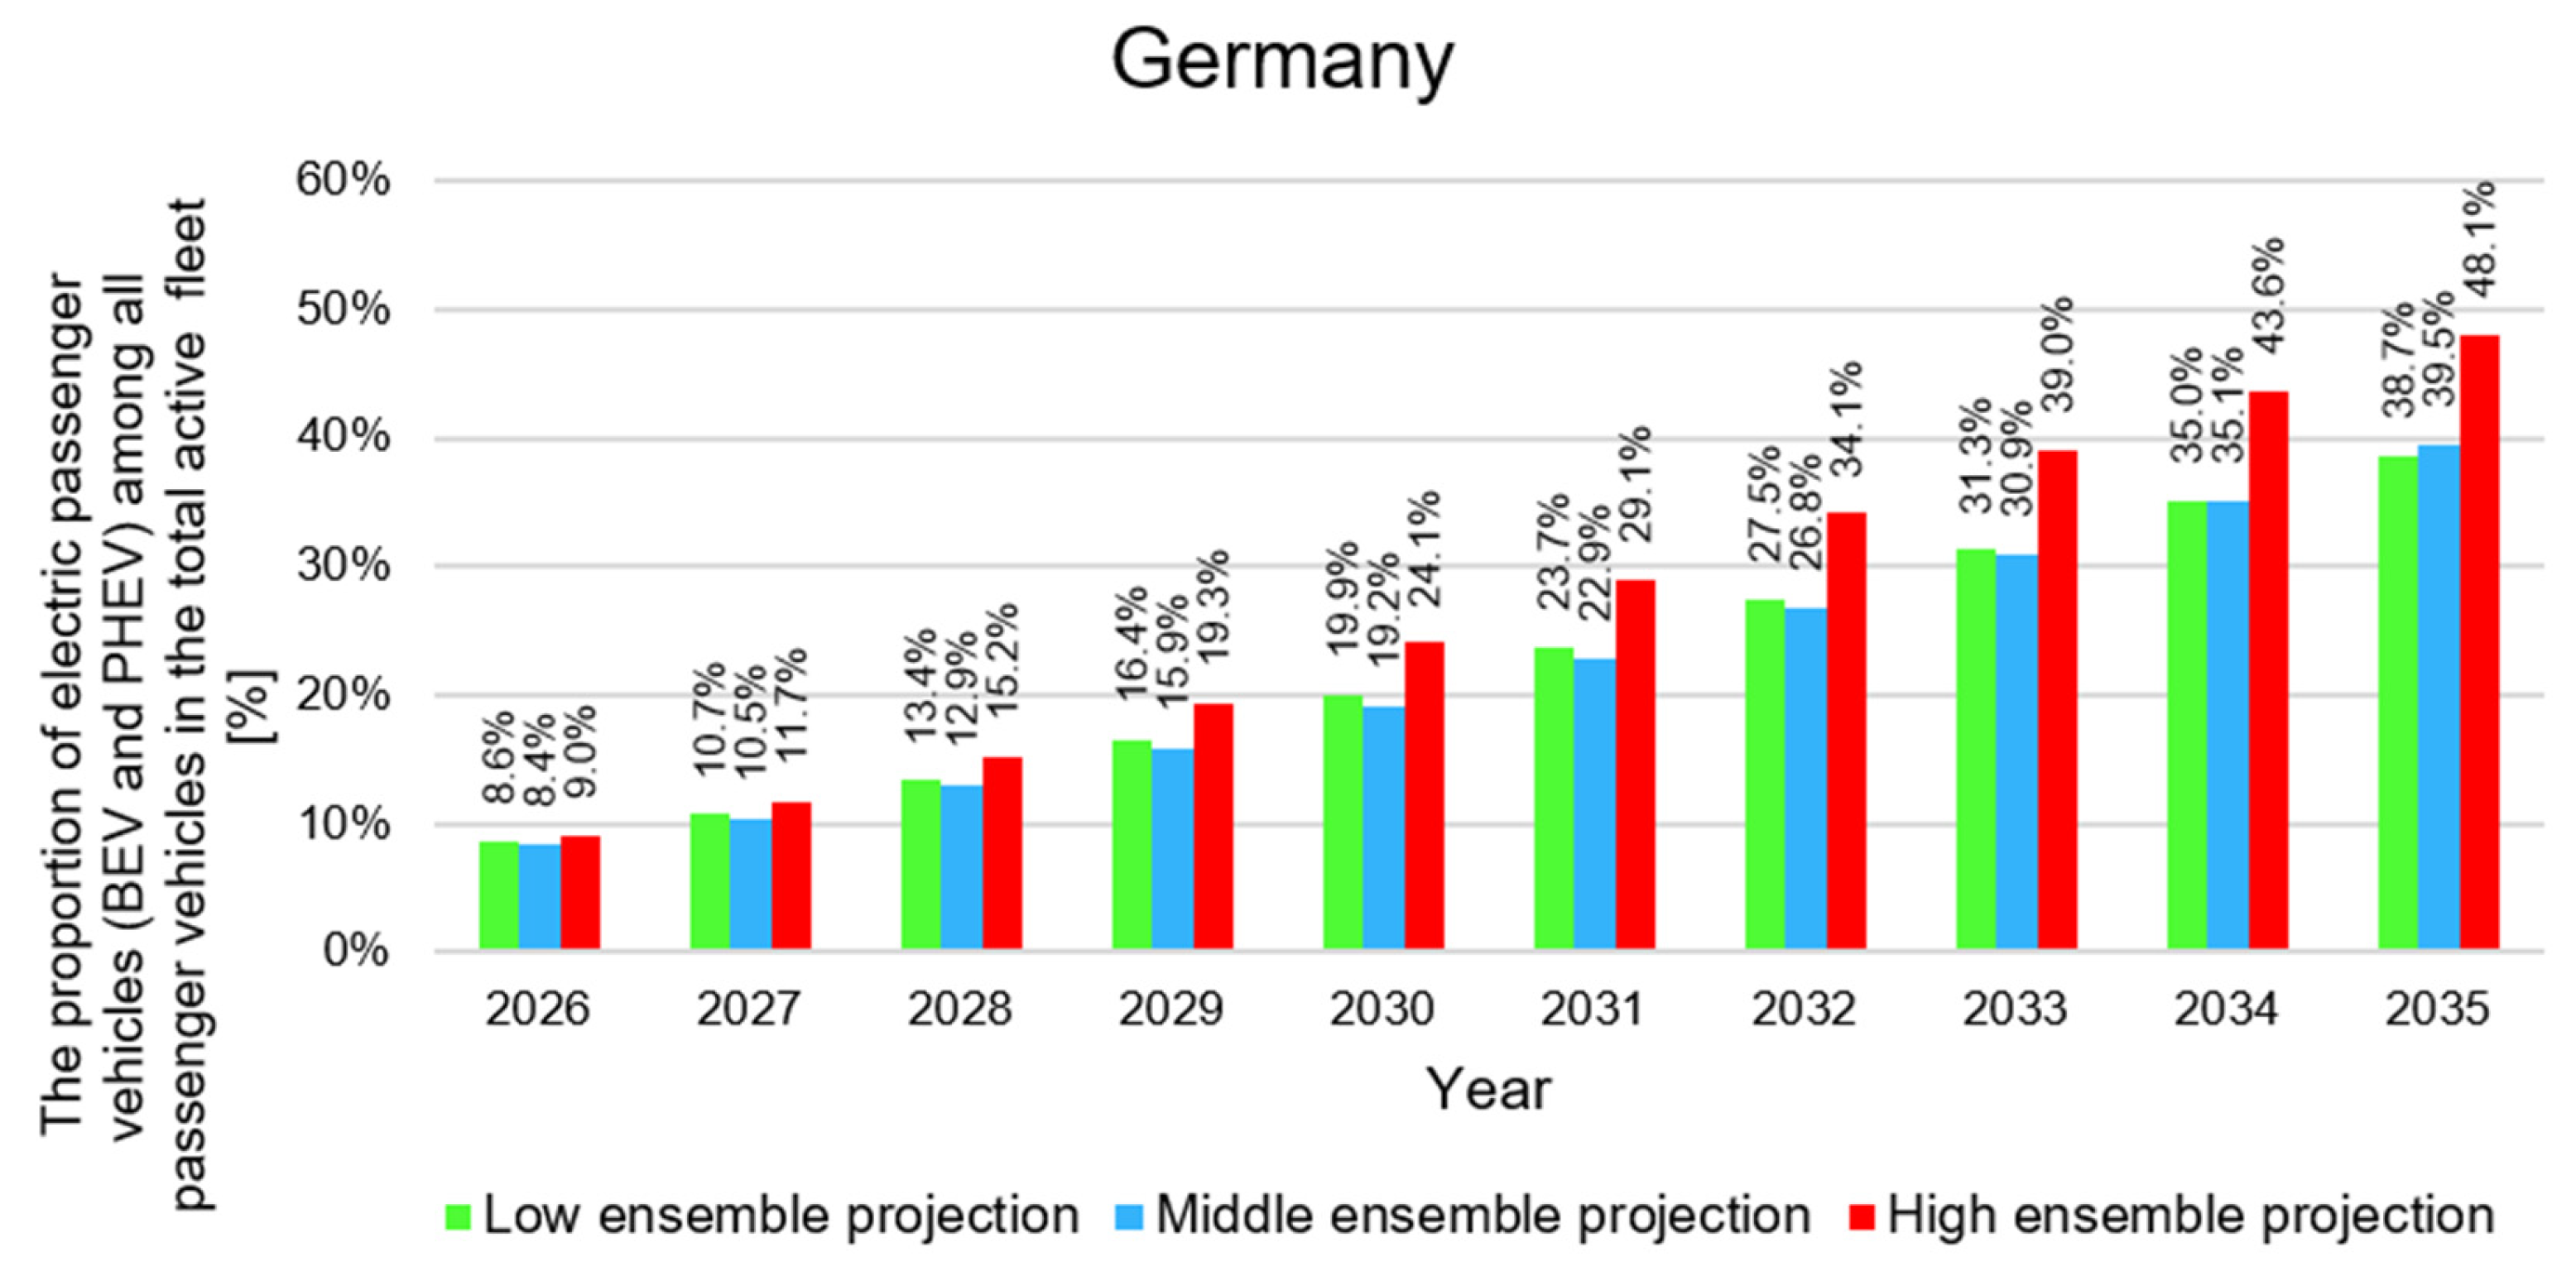
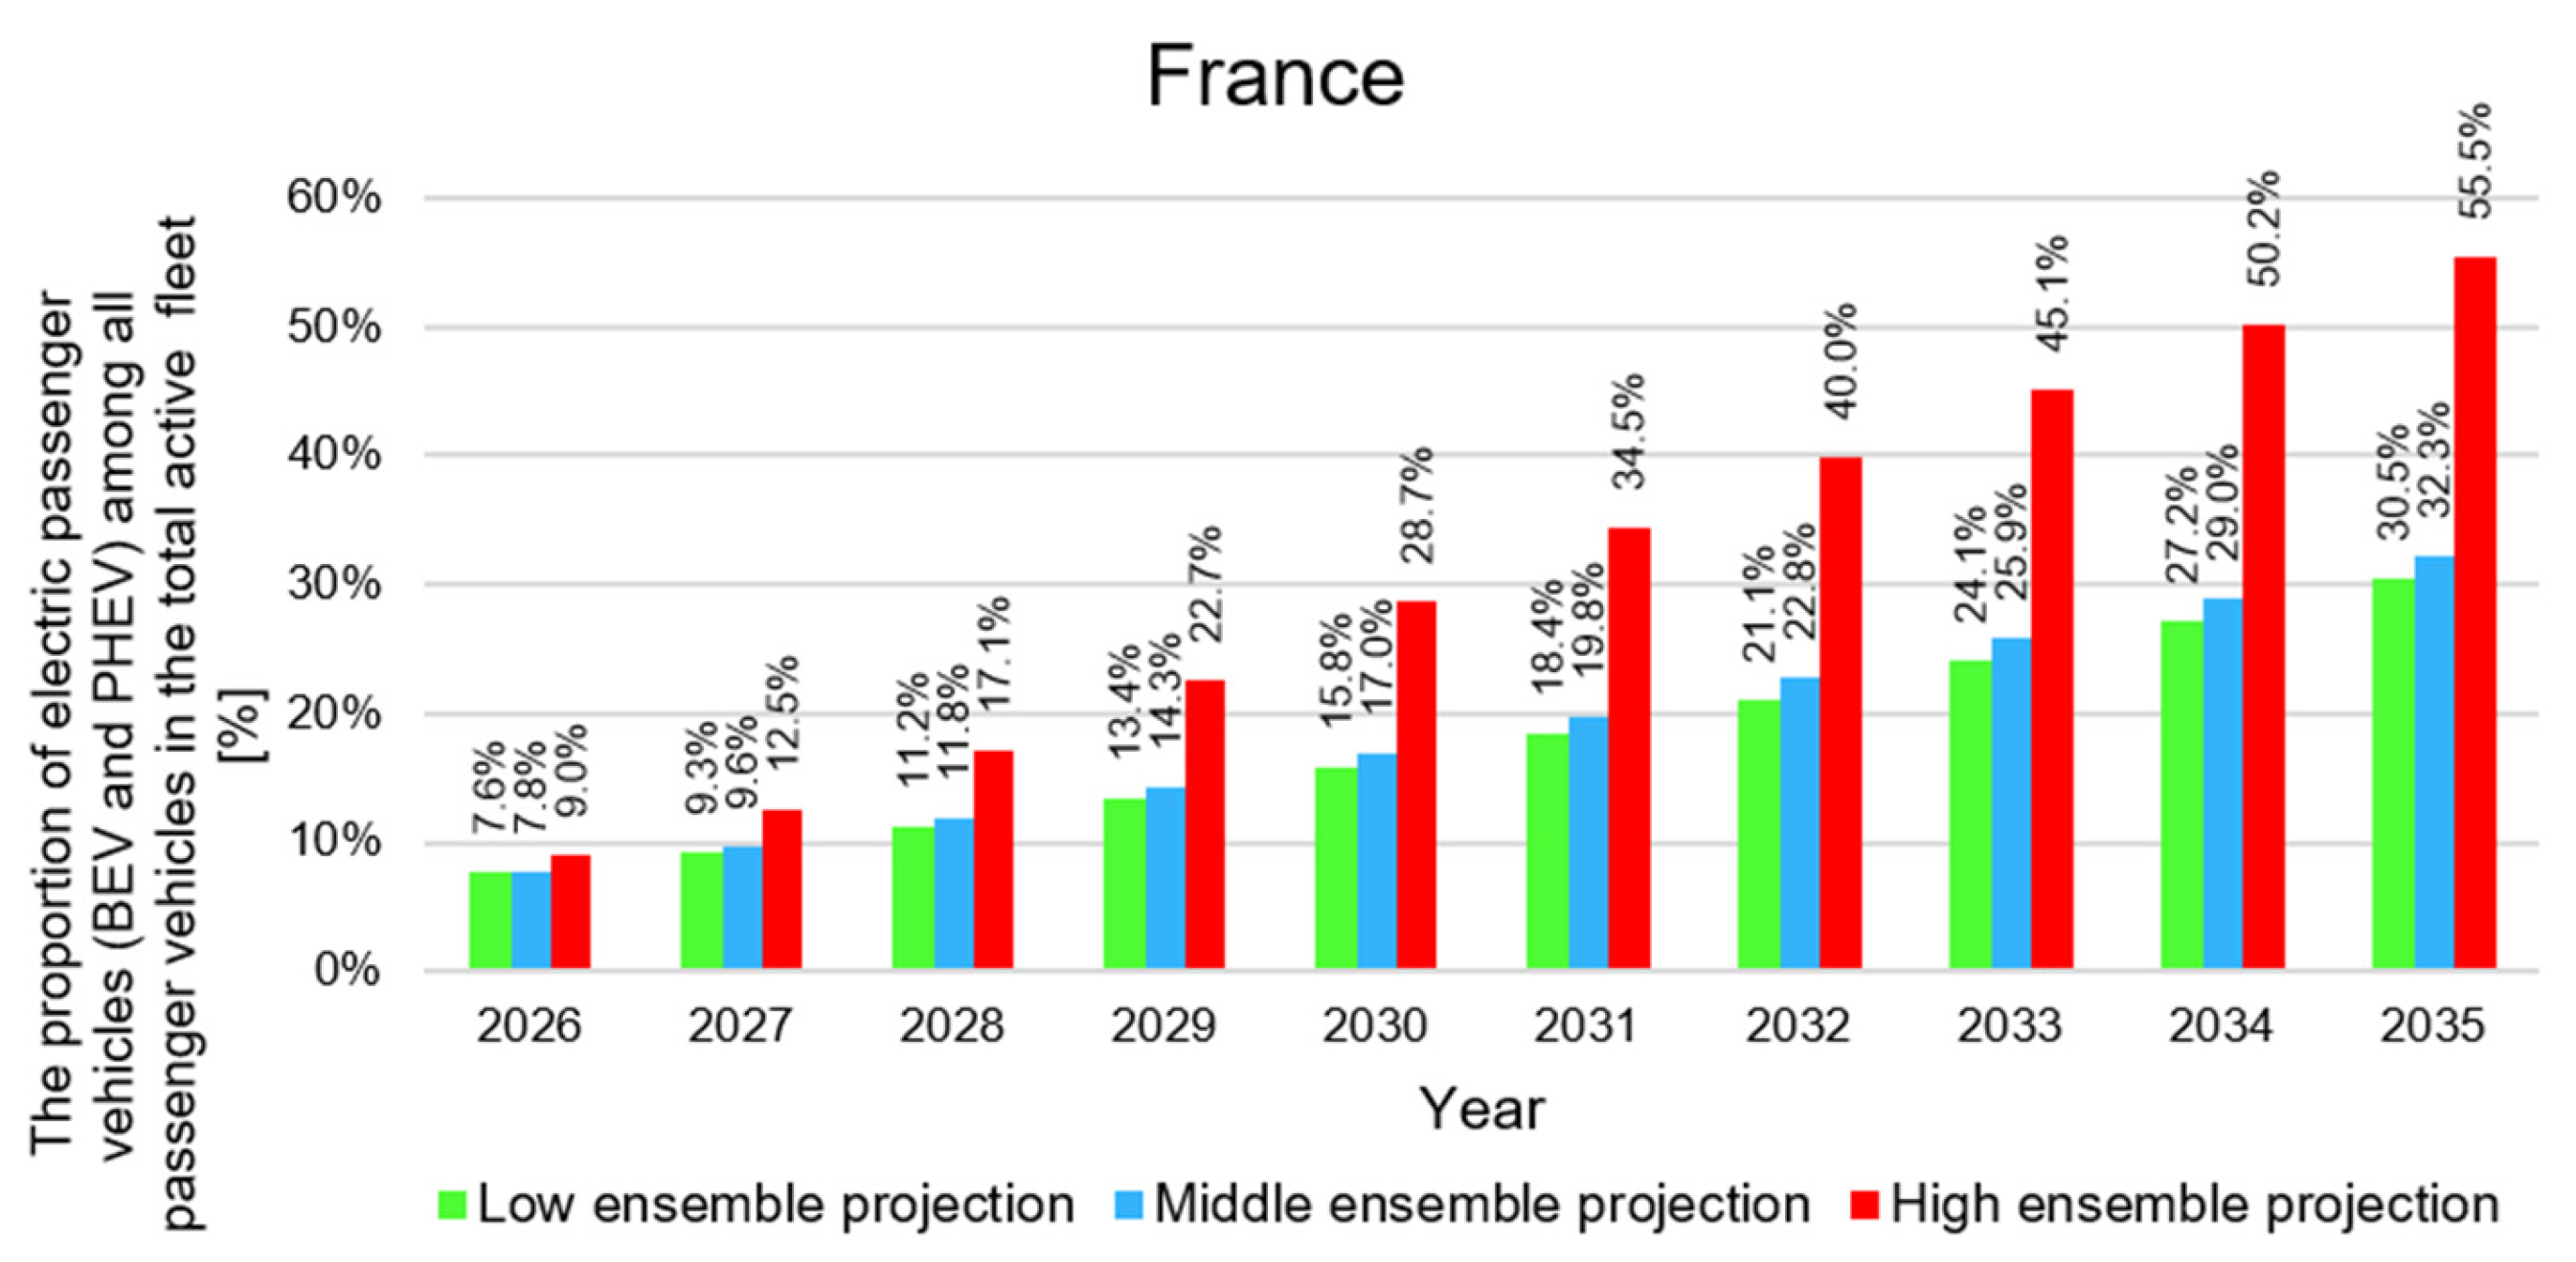
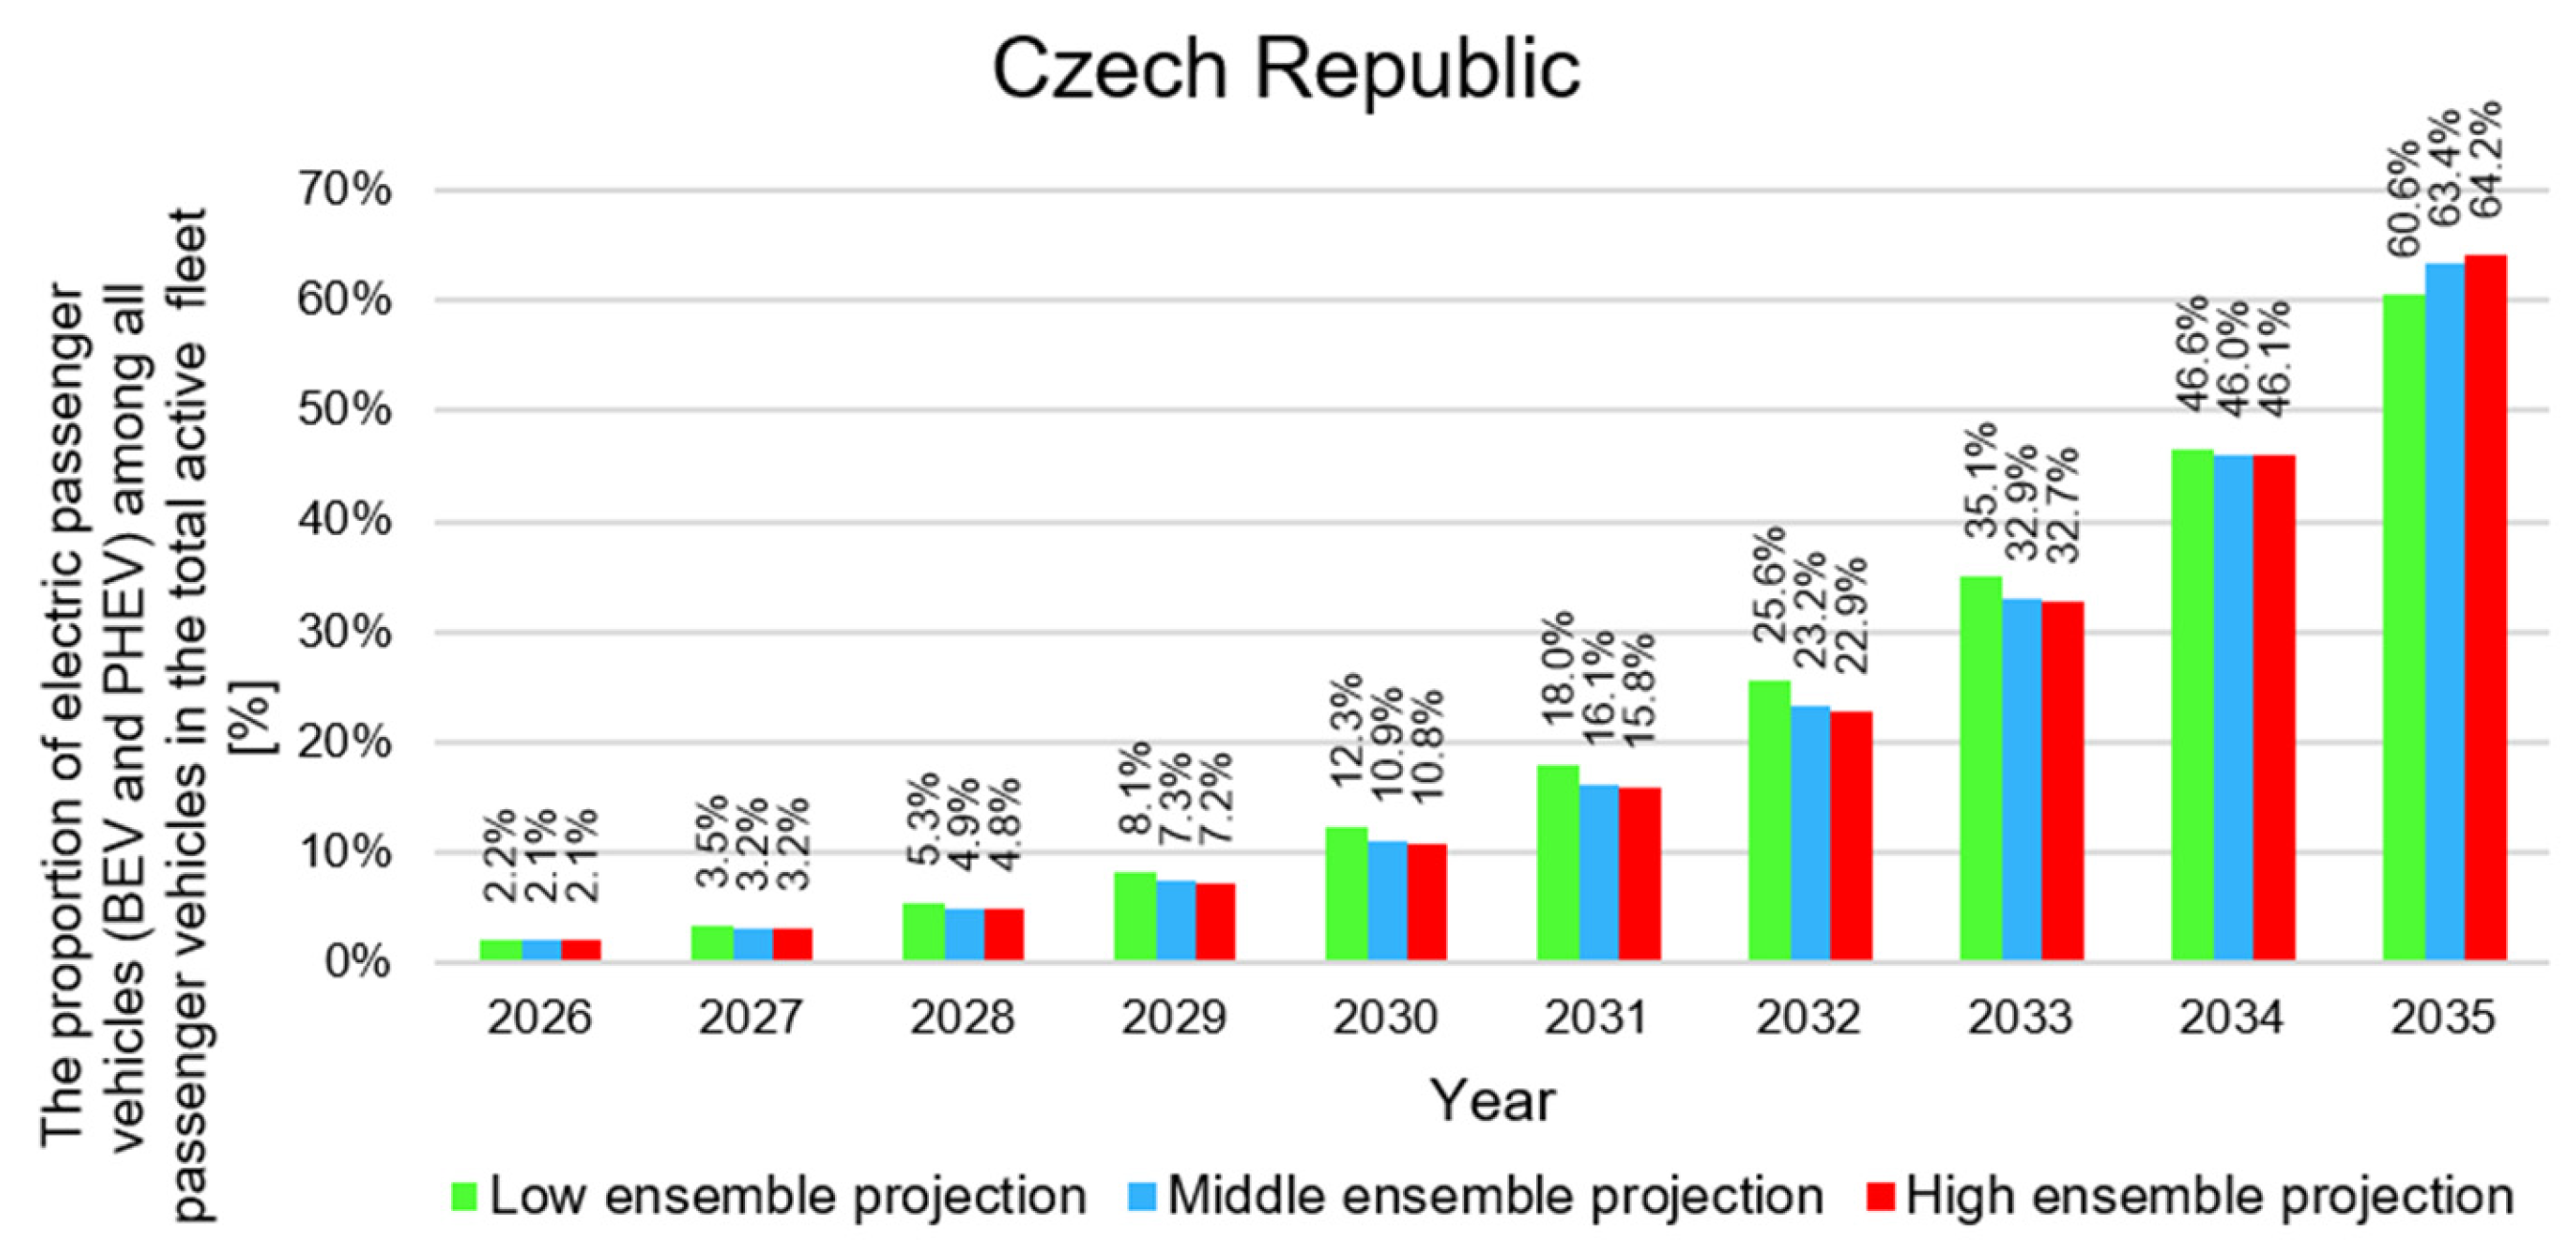
When analysing the final results for the share of total active passenger vehicle registrations in each of the seven countries (2026–2035), it can be observed that there are substantial cross-country differences, both in the achieved percentage levels and in the magnitude of ensemble projection-related variation within a given country. For Germany, the conservative and middle ensemble projections are nearly identical, whereas the high ensemble projection is more than 8 percentage points higher. A markedly different pattern is observed for Poland, where all three ensemble projections yield almost identical results in 2035, which may indicate increased forecast robustness for this country. A similar convergence of ensemble projection outcomes is also found for the Czech Republic; both countries share a relatively low level of electromobility development in 2025. In the case of the United Kingdom, the three ensemble projections diverge in 2035, but only to a limited extent—these results appear typical for an ensemble projection-based forecasting framework. By contrast, France, Norway, and Spain exhibit a comparable pattern of differentiation across ensemble projections, with conservative and balanced results being very close, and the high ensemble projection producing nearly double the values. Such strongly divergent outcomes may be regarded as outliers relative to the other two ensemble projections and, consequently, as the least credible.
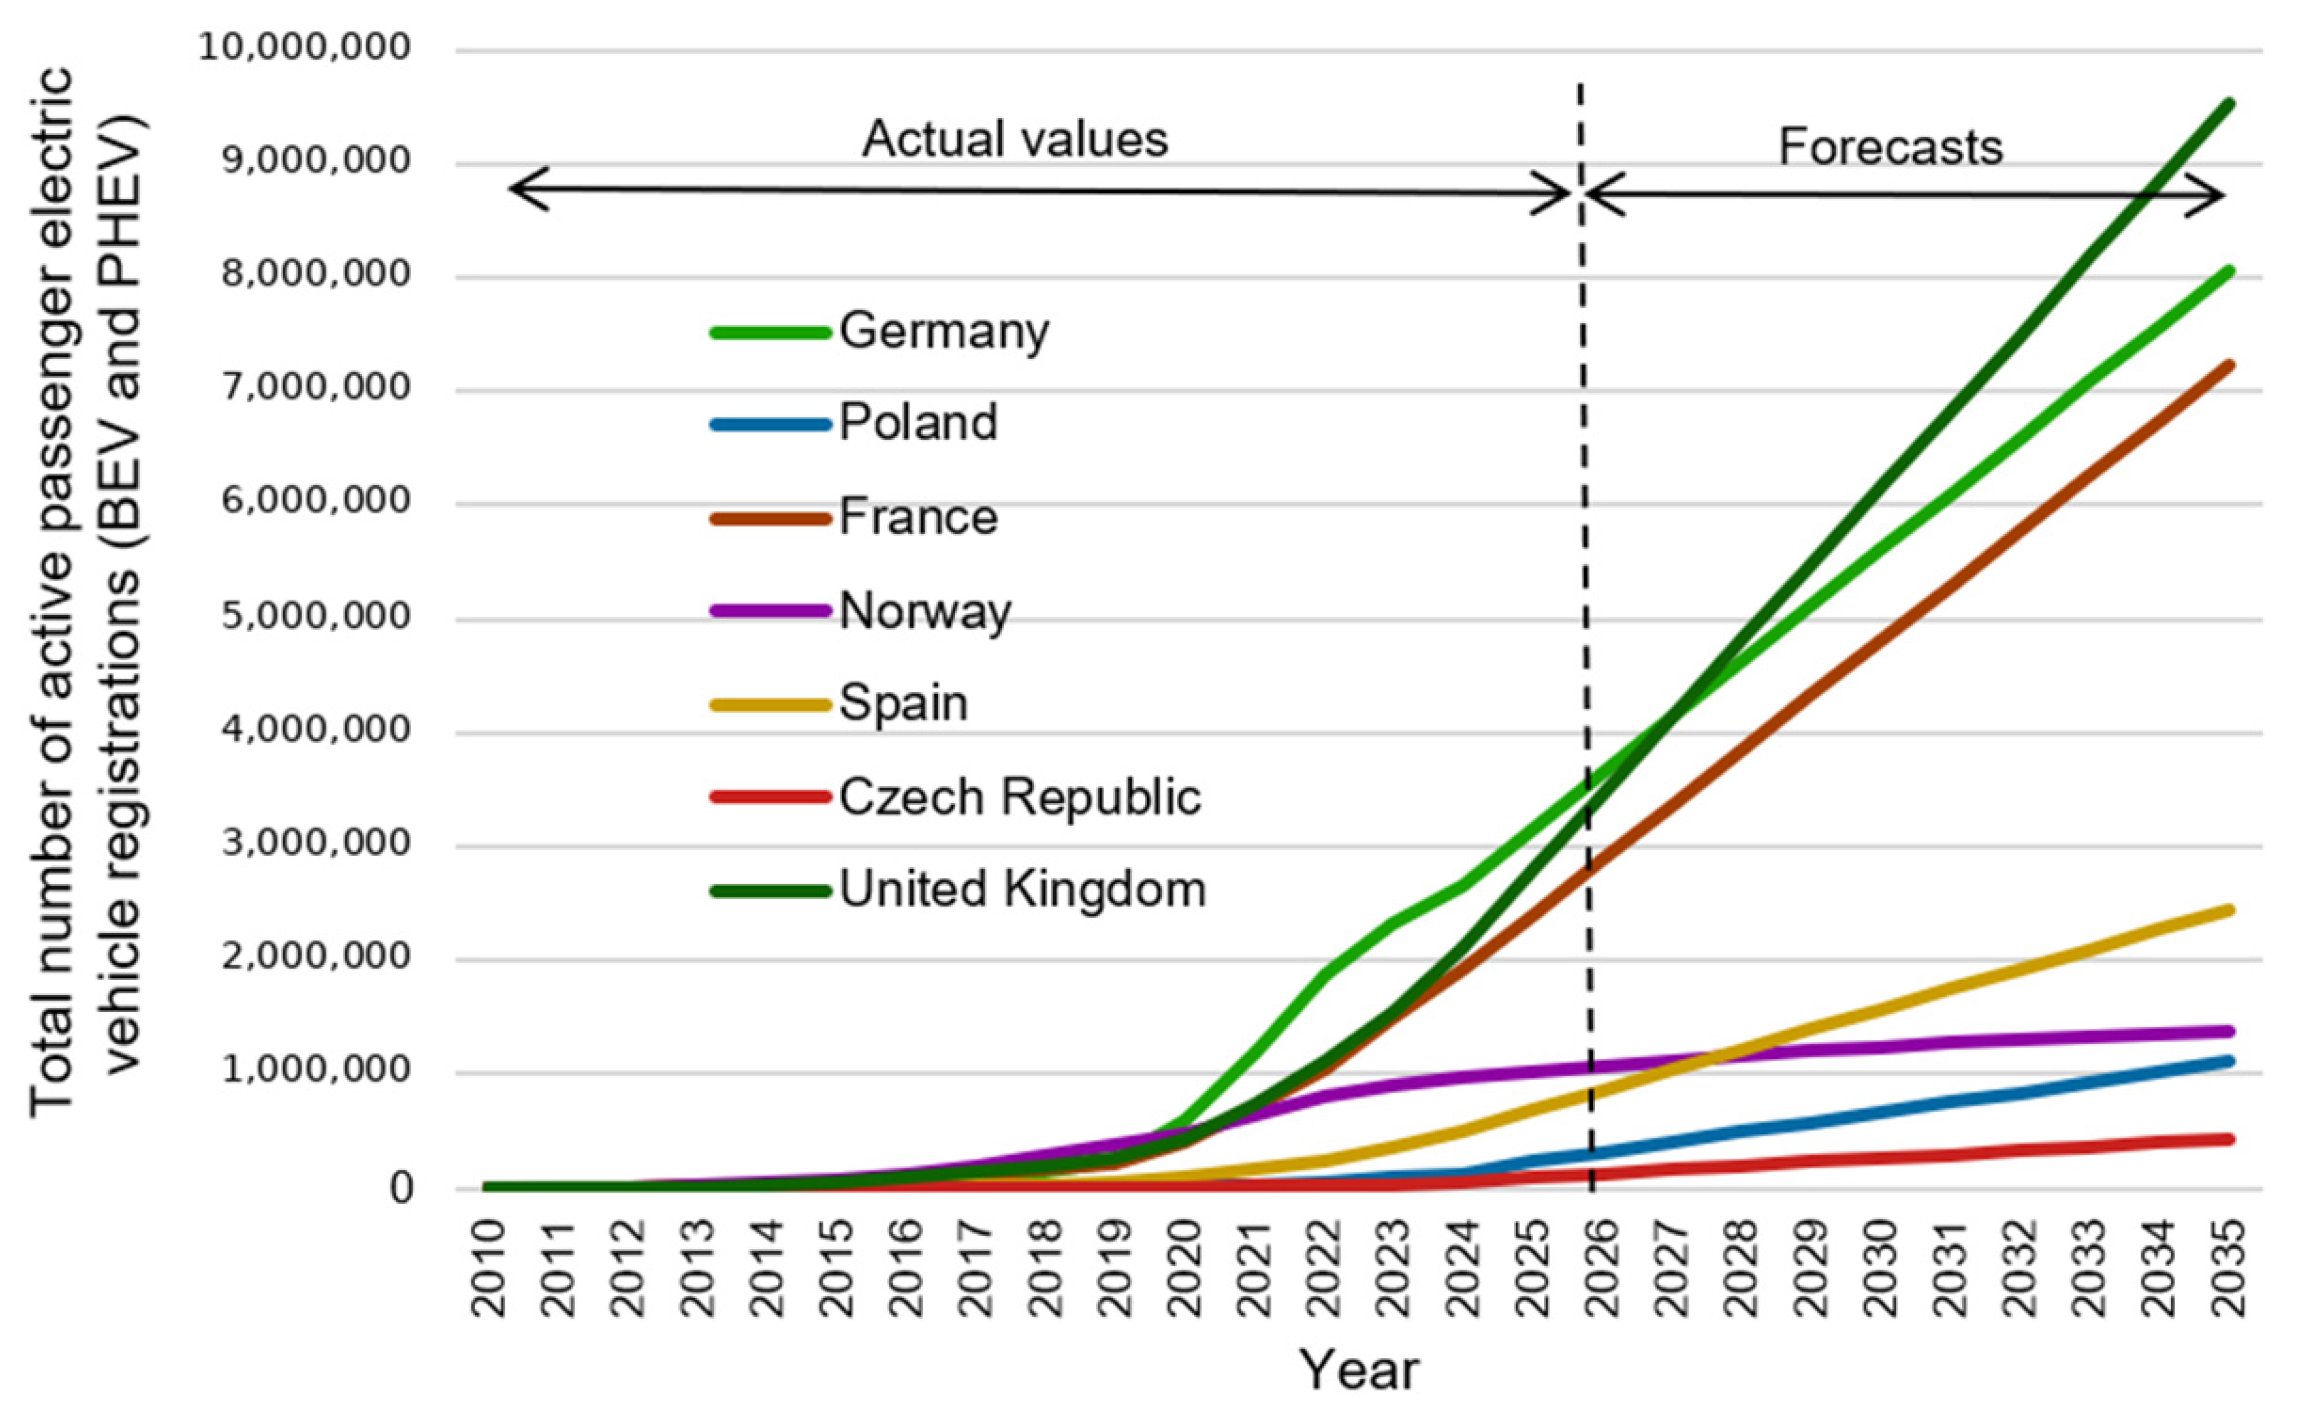
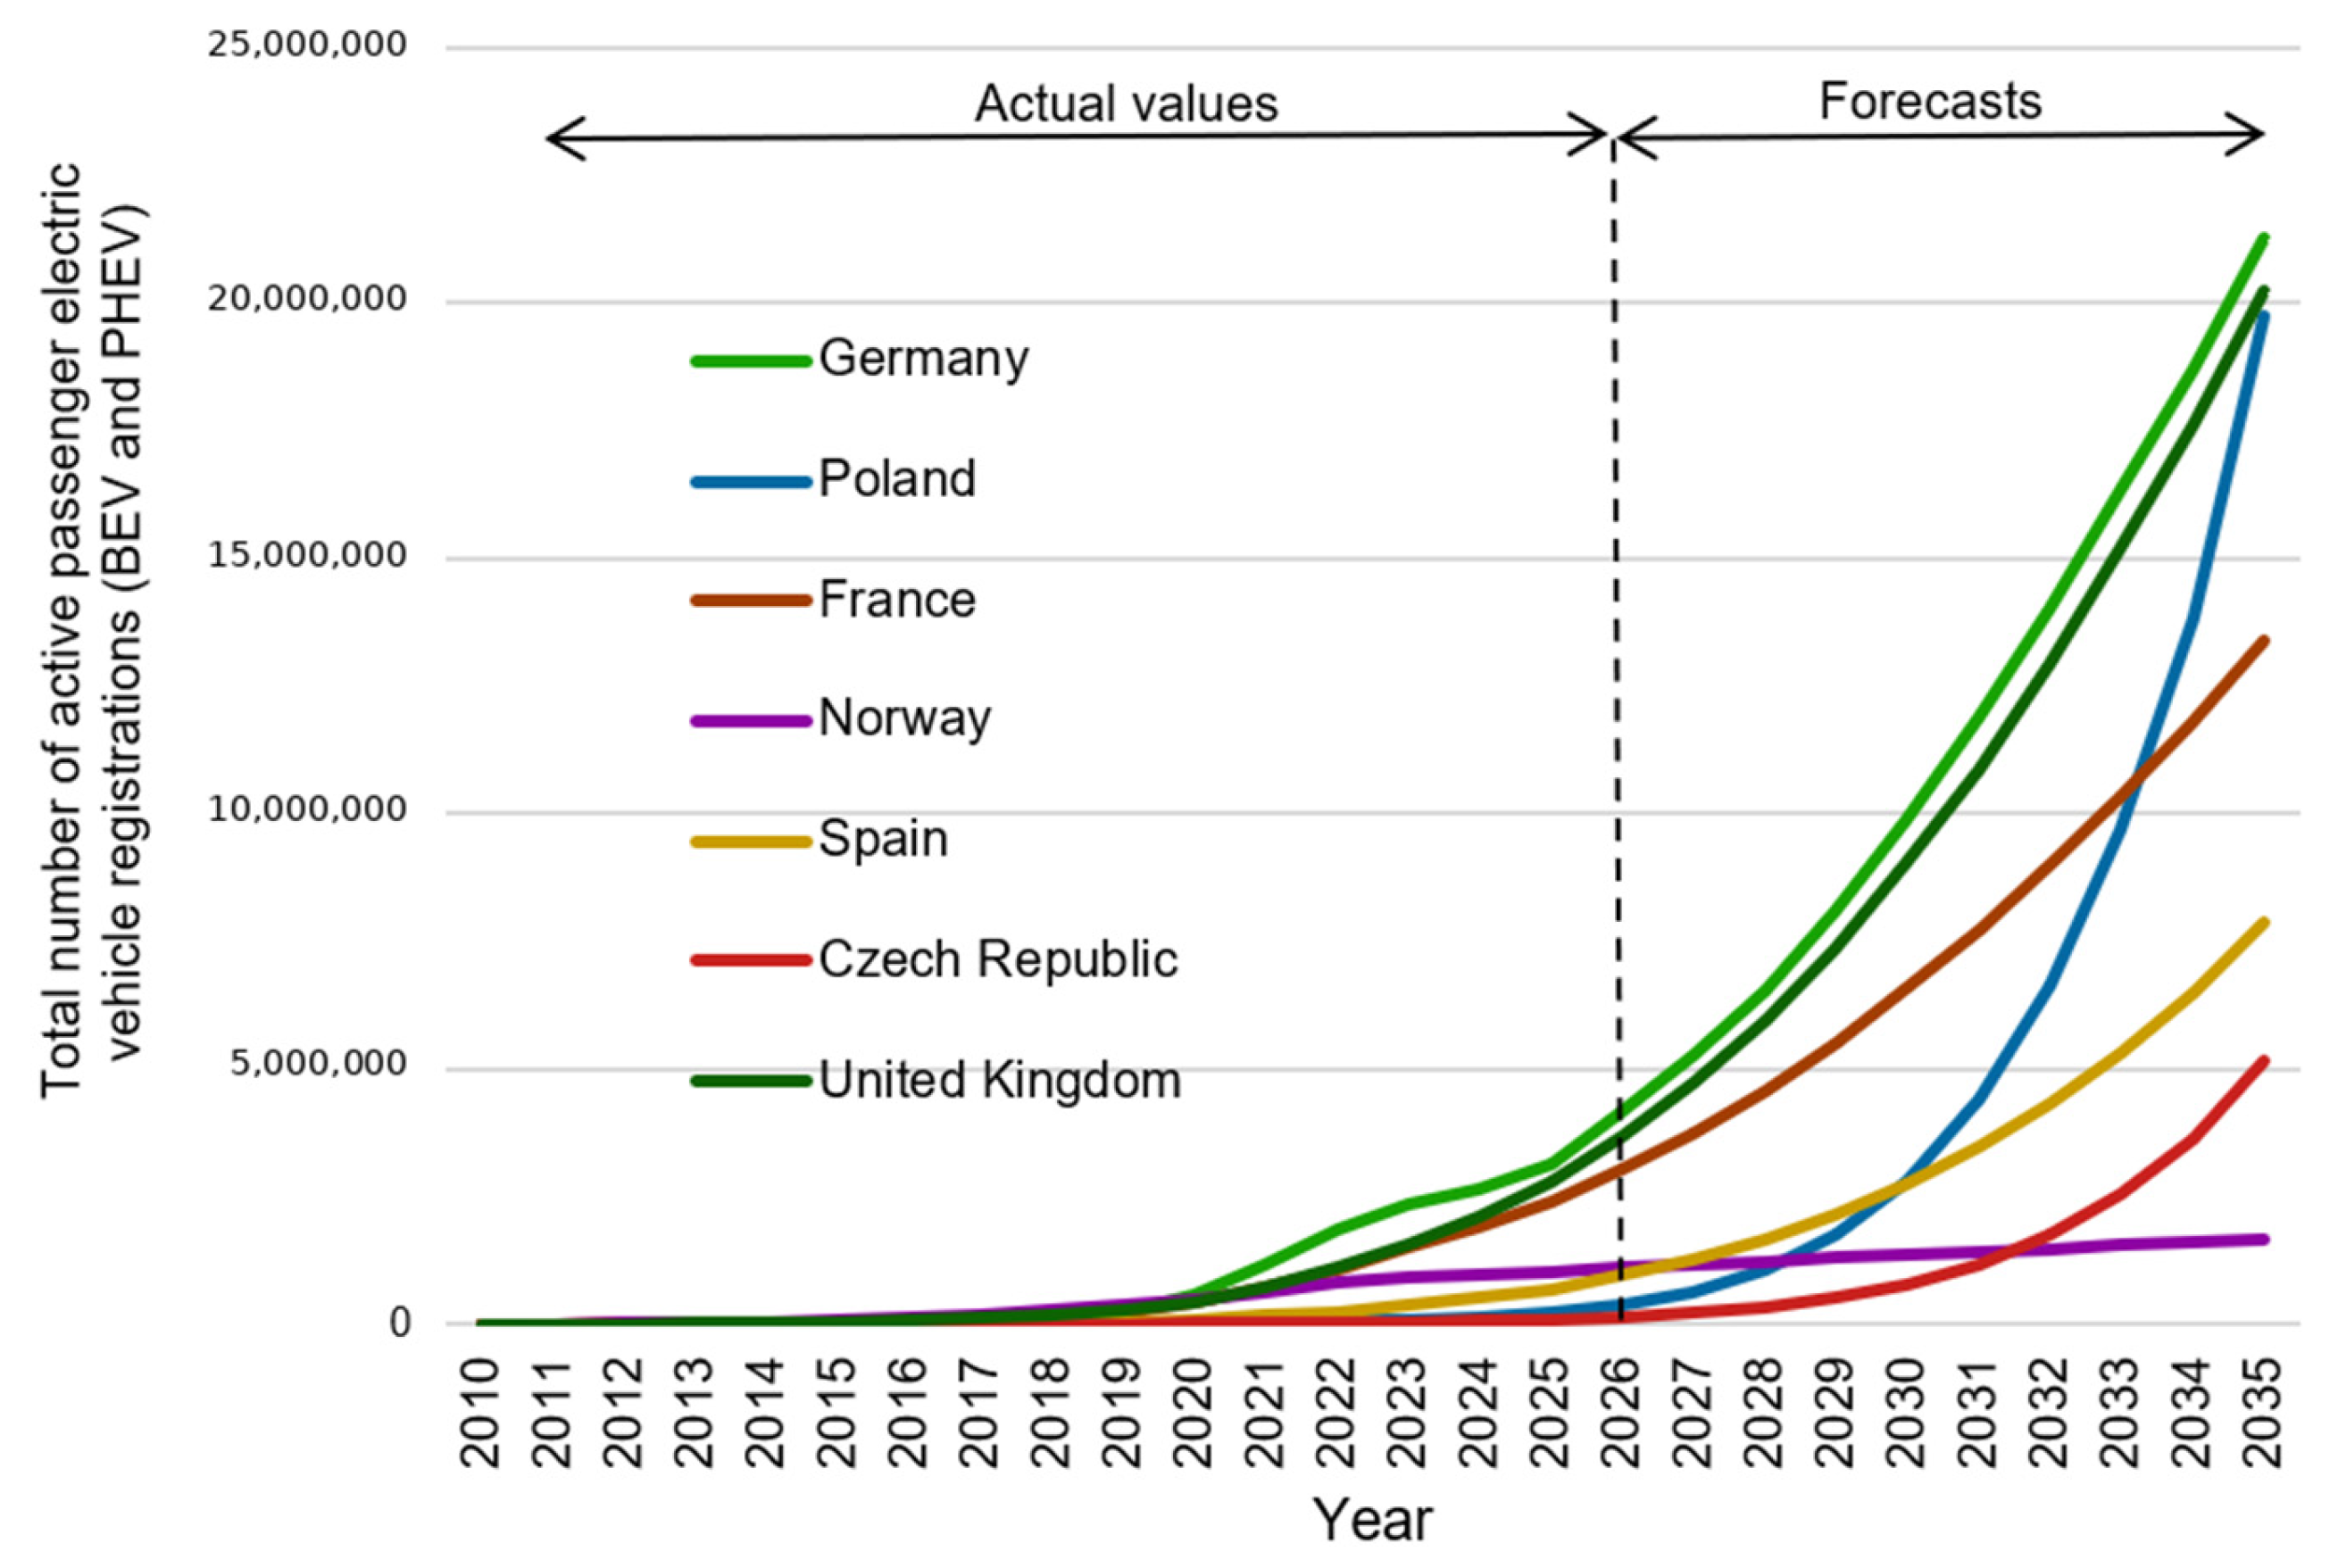
When, in turn, analysing the share of total active passenger vehicle registrations (2026–2035) in terms of electromobility growth dynamics between 2025 and 2035—focusing on the middle ensemble projection—the country-specific trajectories remain heterogeneous.
Table 7 summarizes the stages of electromobility development starting from the end of 2026 (a 1-year-ahead forecast), through the end of 2030 (a 5-year forecast horizon), and up to the end of 2035 (a 10-year forecast horizon).
The analysis of the forecast results presented in
Table 6 indicates that the largest percentage increase in electromobility is projected for Poland, Czech Republic, and the United Kingdom, whereas the smallest increase is projected for Germany and Spain. The result for Norway is notable, as it suggests a transition into the saturation phase of the process. In terms of development dynamics—comparing the forecasts for 2026 and 2035—the largest change is observed for Poland and Czech Republic. The smallest dynamics of change occur in Norway. For Germany and France, the growth dynamics are considerably lower than, for example, in the Czech Republic and Poland.
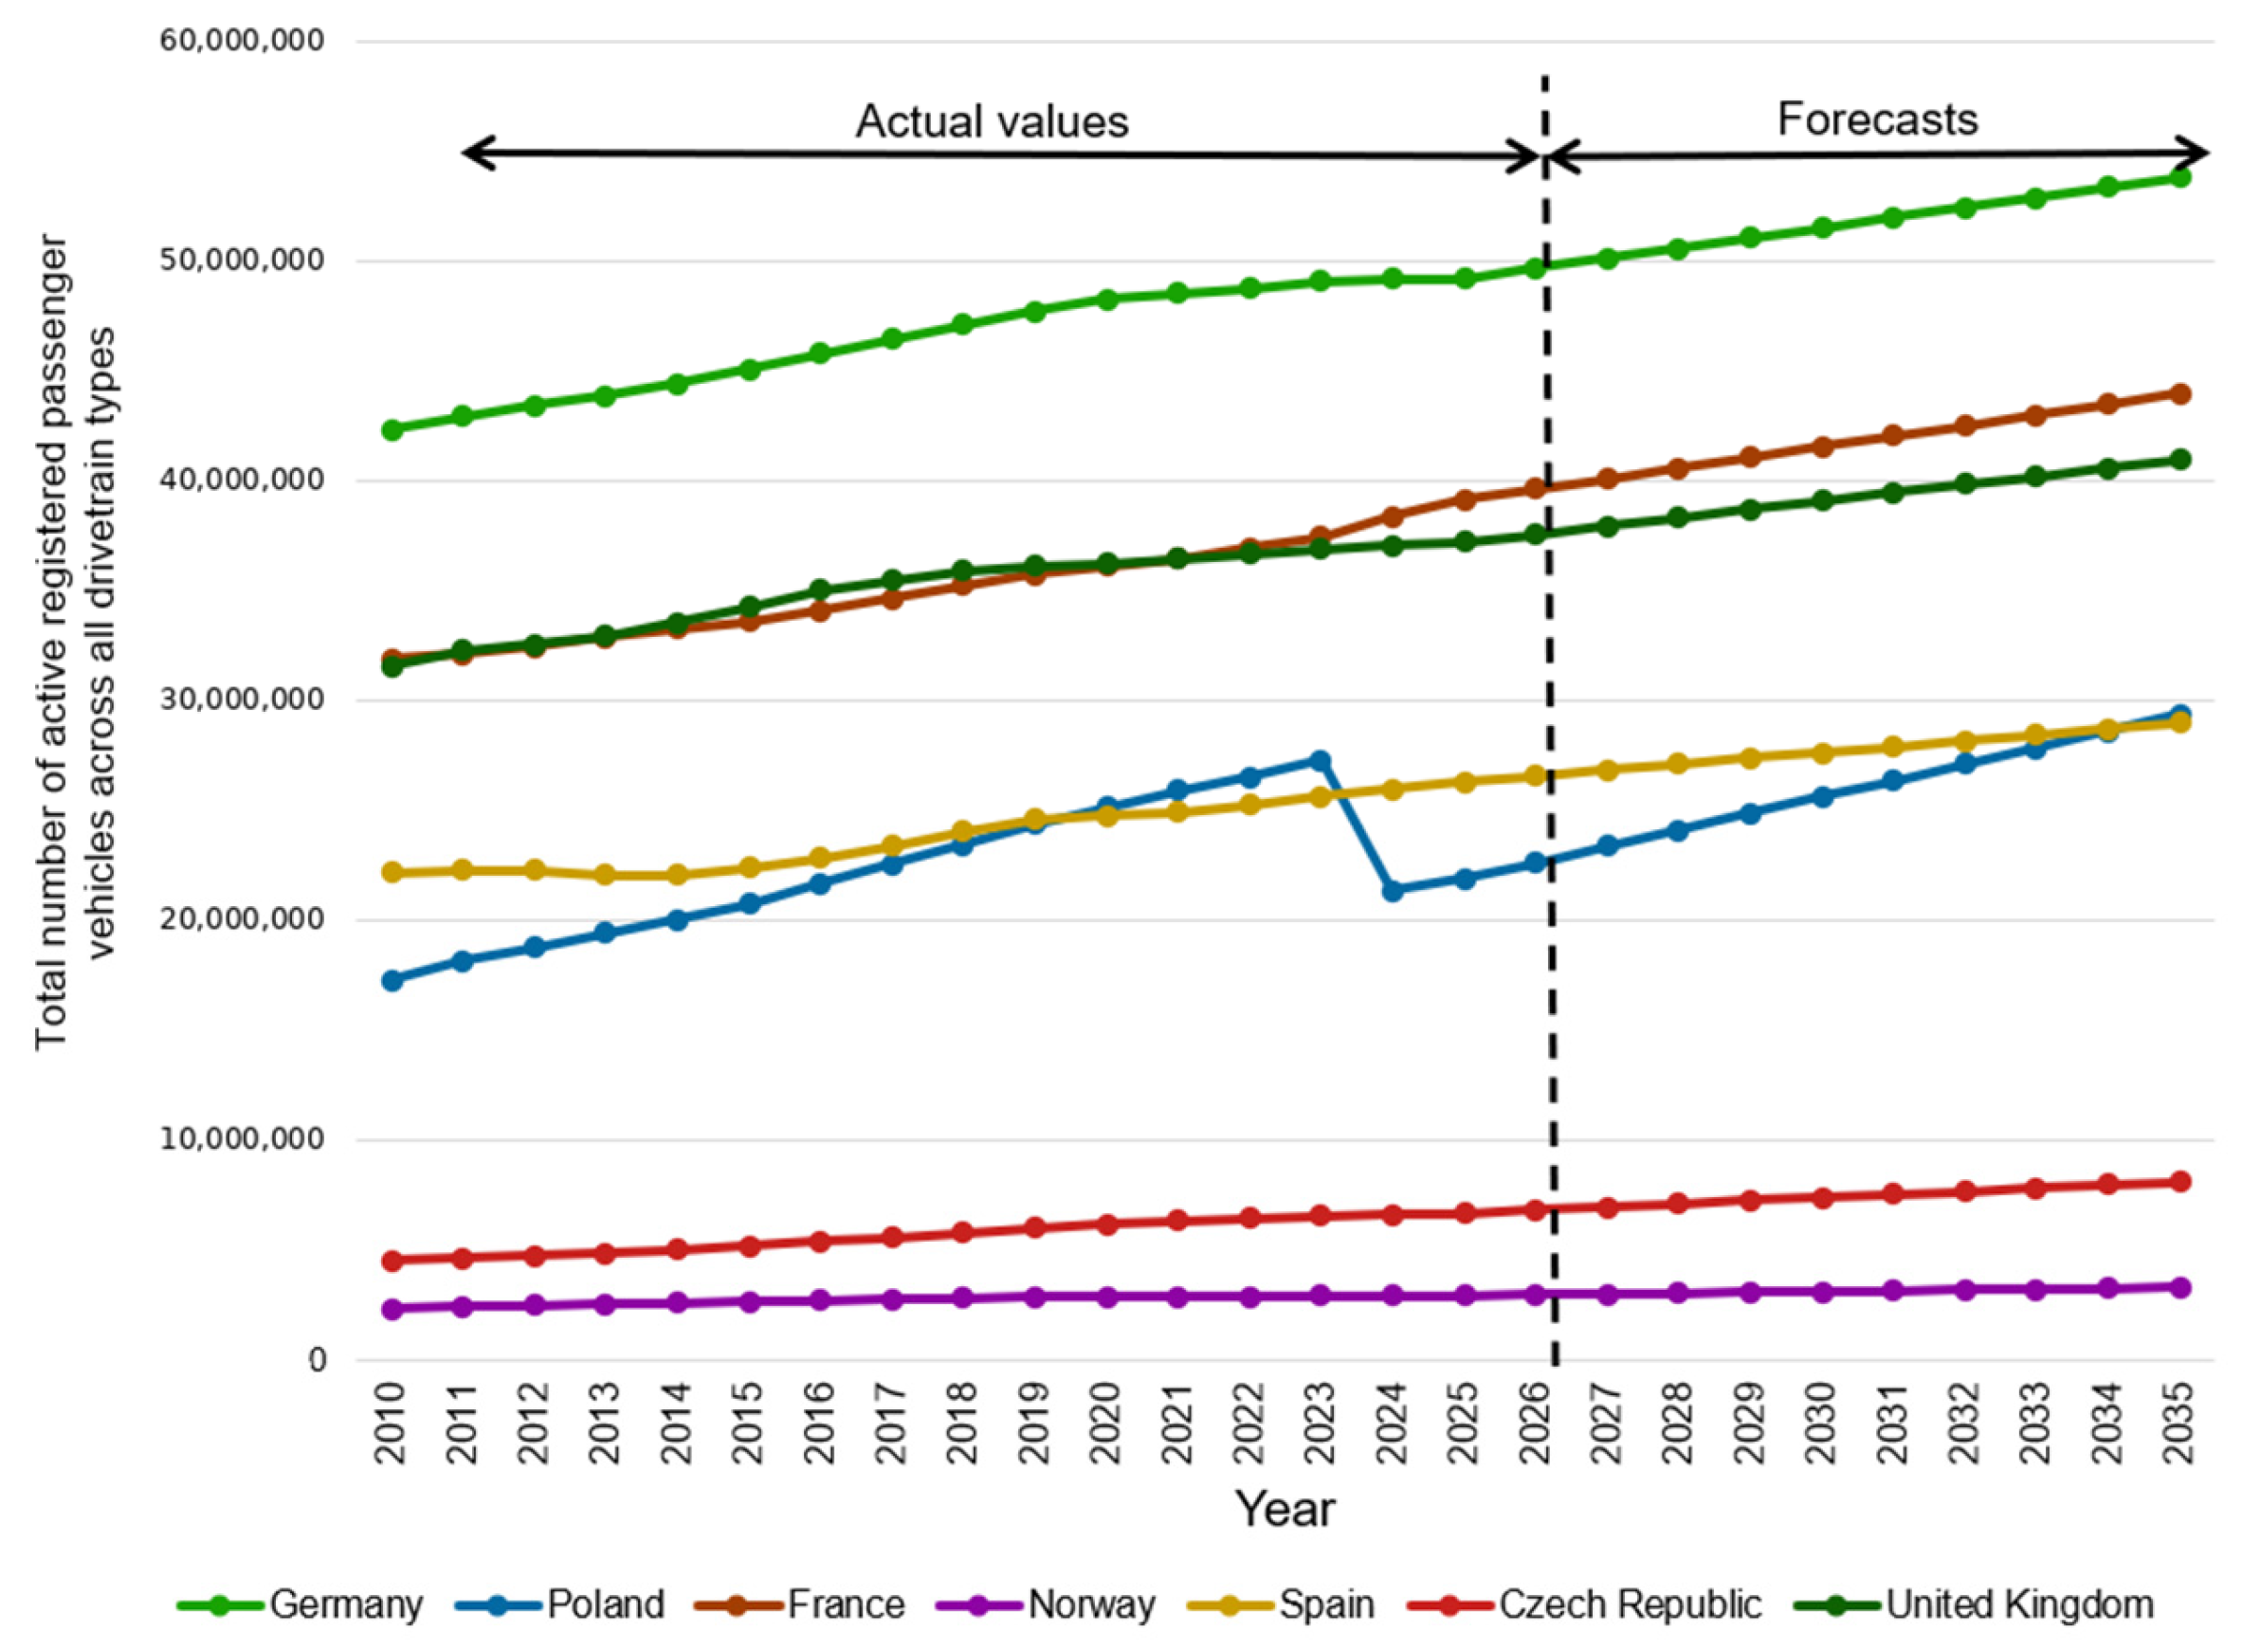
The interpretation of country-specific forecasts should also take into account jurisdiction-specific regulatory and policy contexts. Norway represents a mature EV market in which adoption has been strongly supported by long-standing fiscal incentives, taxation rules favouring zero-emission vehicles, and a national objective for new passenger cars to be zero-emission. The United Kingdom is influenced by the ZEV mandate, which sets binding annual targets for the share of new zero-emission cars and vans. The EU Member States analysed in this study are subject to common EU-level CO2 standards for new cars and vans and to the Alternative Fuels Infrastructure Regulation, but national implementation conditions, purchasing power, charging-infrastructure availability, electricity prices, and fiscal incentives differ substantially. These differences may explain why countries with similar historical EV-stock growth may diverge in future observations. The Polish case additionally requires caution because the 2024 statistical decline in the total passenger-vehicle fleet resulted from an administrative clean-up of inactive registrations rather than from an actual physical reduction in the active vehicle stock.
The proposed approach can be compared with several related forecasting strategies used in EV-market and technology-diffusion studies. Single-model approaches, such as logistic, Gompertz, Bass, grey, exponential-smoothing, and ARIMA/SARIMA, usually require the analyst to select one preferred specification. By contrast, the present method first generates forecasts from several structurally different models and then constructs trimmed ensembles after excluding the lowest and highest 2035 projections. This procedure reduces dependence on any single model and limits the impact of unstable extrapolations. Compared with standard equal-weight ensembles, the G-IRWE and L-IRWE variants additionally incorporate information on historical forecasting errors through inverse-RMSE weighting. Compared with more data-intensive machine-learning or multivariate econometric methods, the proposed framework is better suited to very short annual time series, but it does not explicitly model exogenous drivers. Therefore, its main contribution lies in providing a transparent and robust trend-based ensemble procedure for small-sample long-horizon EV-stock forecasting.
Table 8 shows a conceptual comparison of the proposed method with related forecasting approaches.
The proposed method has several advantages and limitations. Its main advantage is that it is transparent and applicable under severe data constraints, especially when only short annual EV-stock time series are available. By combining structurally different models and excluding the two most extreme 2035 projections before ensemble construction, the approach reduces dependence on a single model specification and limits the influence of unstable long-term extrapolations. The use of three ensemble variants also makes it possible to assess the sensitivity of results to alternative weighting assumptions. At the same time, the method remains trend-based and univariate. It does not explicitly incorporate explanatory variables such as energy prices, charging-infrastructure availability and costs, EV purchase prices, subsidy schemes, taxation, household income, or restrictions on new internal combustion engine vehicle sales. These factors may substantially affect future EV adoption, especially over a 10-year horizon. Consequently, the forecasts should be interpreted as conditional projections based on historical EV-stock dynamics rather than as full policy or market scenarios.
The method does not impose an explicit assumption that the number of BEVs and PHEVs must grow faster than the total passenger-vehicle fleet. The EV stock and the total passenger-vehicle stock are forecast separately, and the projected EV share is obtained only in the final step as their ratio. Nevertheless, because the historical EV-stock trajectories grow much faster than the total vehicle-stock trajectories, this difference is naturally reflected in the extrapolated results. The framework therefore captures the continuation of historical growth dynamics, but it does not explicitly simulate future restrictions on new ICE vehicle sales, EV purchase incentives, taxation changes, or other policy instruments.
A limitation of trimming is that it reduces the range of model-generated uncertainty. Therefore, the trimmed ensembles should be interpreted as robust central projection variants rather than as a full representation of all possible model outcomes. Future work could compare trimmed and untrimmed ensembles explicitly as an additional sensitivity test.
4.2. Policy Implications of the Projection Variants
The low, middle, and high projections are not probability-based scenarios, but they can still inform policy discussion. They indicate the range of EV-stock shares that may result if historical adoption dynamics continue under alternative ensemble assumptions. From a policy perspective, the low projection may be interpreted as a warning that current adoption dynamics may be insufficient to meet long-term decarbonisation expectations. The middle projection represents the most balanced trend-based outcome and may be the most useful for infrastructure planning. The high projection indicates the level of pressure that could arise on charging infrastructure, distribution grids, parking facilities, and public support schemes if EV adoption accelerates strongly.
For countries with currently low EV shares, such as Poland and the Czech Republic, even a moderate continuation of recent growth could imply a rapid increase in infrastructure needs. This would require accelerated deployment of public and residential charging, distribution-grid reinforcement, and stable regulatory incentives. For medium-development countries such as Germany, France, Spain, and the United Kingdom, the main policy challenge is to align EV uptake with charging-network expansion, electricity-system readiness, and affordability. In the United Kingdom, this is particularly relevant because the ZEV mandate creates a binding regulatory pathway for new zero-emission vehicle sales. For Norway, where EV adoption is already advanced, the policy challenge is less about initiating adoption and more about managing a mature EV system, including charging reliability, grid integration, incentive redesign, and the transition from purchase stimulation to efficient system operation.
These implications should be interpreted cautiously. The projections do not directly model future policy interventions, energy-price shocks, subsidy changes, or infrastructure bottlenecks. They therefore indicate potential planning pressures under trend continuation rather than providing a complete policy-scenario assessment.