Article

The Impact of Digital Trade Barriers on Digital Services Imports: An Inverted U-Shaped Relationship and Implications for Sustainable Digital Trade Governance

by
Zelin Zhang
1 and
Hong Zhang
2,*
1
School of Economics and Trade, Hunan University, Changsha 410082, China
2
School of Economics and Management, Changsha University of Science and Technology, Changsha 411076, China
*
Author to whom correspondence should be addressed.
Sustainability 2026, 18(11), 5338; https://doi.org/10.3390/su18115338
Submission received: 15 April 2026 / Revised: 18 May 2026 / Accepted: 21 May 2026 / Published: 26 May 2026
(This article belongs to the Section Economic and Business Aspects of Sustainability)

Abstract

Digital services imports have become a key driver of service trade and globalization. However, their rapid expansion has raised economic and security concerns, leading to increased digital trade barriers. This research investigates how these barriers affect digital services imports. Based on the panel data from 87 countries (2014–2022), the research shows: an inverted U-shaped relationship exists between digital trade barriers and digital services imports, characterized by an initial increase followed by a subsequent decrease. This finding remains robust after addressing endogeneity concerns and conducting a range of sensitivity tests. This relationship is most evident in developed economies with large imports, particularly in telecommunications, and is primarily driven by electronic transaction barriers and other barriers. Mechanism analysis indicates that digital trade barriers affect digital service imports through economic freedom, with the observed inverted U-shaped effect being primarily driven by the government size dimension. The institutional context reinforces the inverted U-shaped effect, with government efficiency and regulatory quality having the strongest moderating influence. By clarifying the inverted U-shaped relationship between digital trade barriers and digital services imports, this research provides a theoretical foundation and empirical evidence to support the sustainable development of digital trade.

1. Introduction

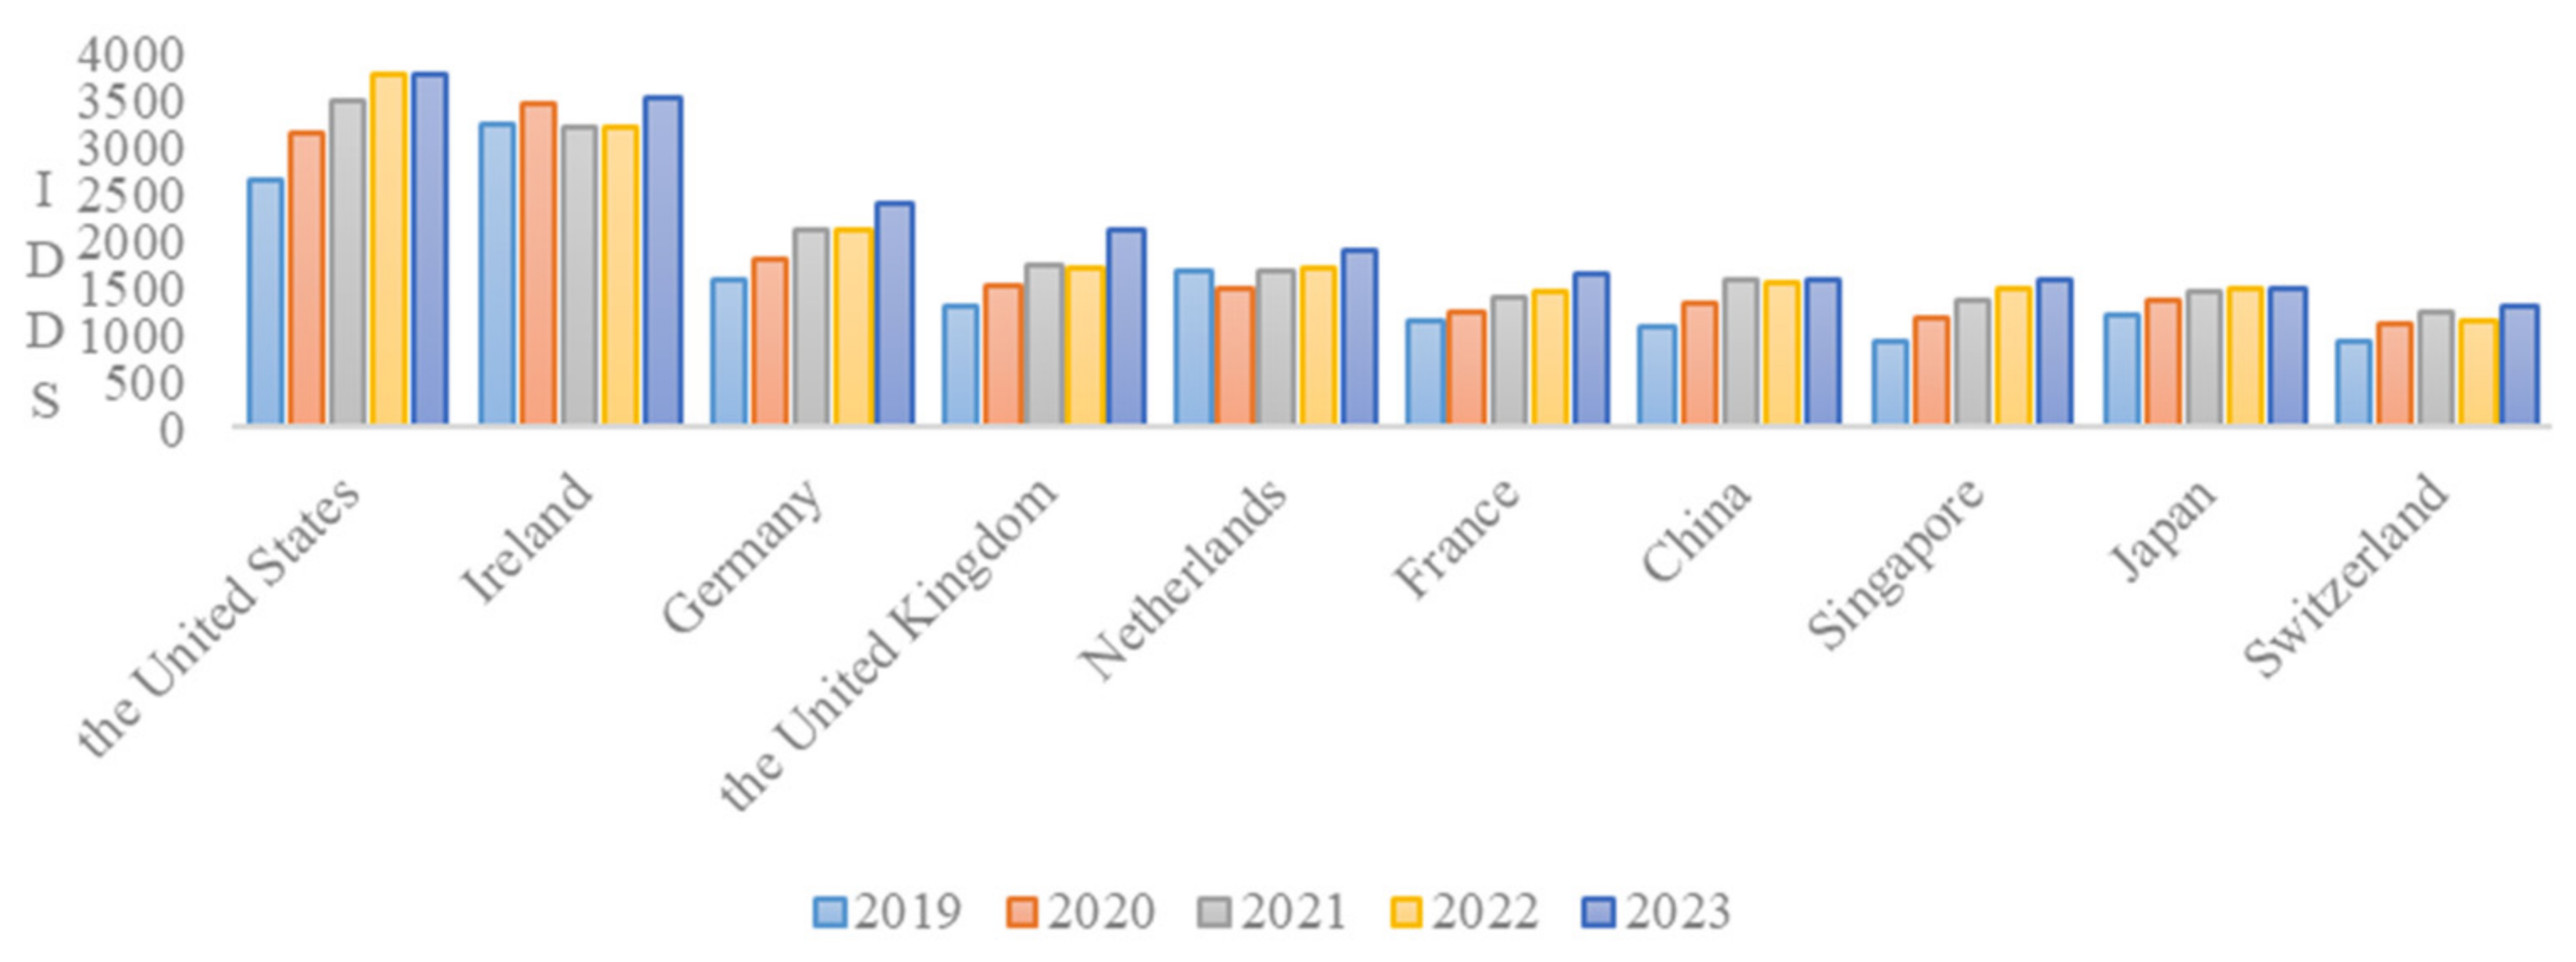
Currently, with the rapid expansion of digital trade, digital services imports served as an important pillar for countries to drive international trade growth [1,2,3]. Digital services imports are enabled by digital technologies such as information and communication technologies (ICT). Meanwhile, digital services imports are centered on digital services such as digital goods and services and information resources, and are characterized by digital delivery. Studies have shown that digital services imports reconstruct the global value chain through technological penetration, and thus promote economic growth [4], export upgrading [5], enterprise innovation quality [6], and host country green development [7]. According to the World Trade Organization, global imports of digitally delivered services increased from US$2.81928 trillion in 2019 to US$4.25041 trillion in 2023. Figure 1 shows that the top five economies in terms of digitally delivered service imports were, in order, the United States, Ireland, Germany, the United Kingdom, and the Netherlands. China was the only developing economy among the top 10, ranking seventh.
However, the rapid development of digital services imports has amplified the pressure on data privacy protection, posing threats to the social economy and national security [8,9]. To address these challenges, many countries have successively formulated targeted restrictive measures. A variety of digital trade barriers have emerged, including intellectual property protection rules, data localization requirements, and market access restrictions [10]. Trade barriers not only increase import costs but can also hinder the efficiency of digital service provision, thereby restricting the scale of digital service imports [11,12]. Therefore, examining how barriers to digital commerce affect the import of digital services enhances our understanding of the evolving nature and specific characteristics of trade protectionism in the digital era. This analysis offers valuable insights for developing sound regulatory frameworks and early-warning mechanisms pertaining to digital services imports.
Numerous studies have shown that digital trade barriers have an impact on digital services trade, digital services exports, economic growth, and value chain position. These studies generally point out that negative effects exist. The expansion of digital services trade is constrained by limitations in internet connectivity, which are often influenced by barriers within digital commerce [1,2], resulting in increasing trade costs [13] and suppressing technological innovation [14]. National regulations perceived as barriers to digital commerce tend to restrict the flow of such trade, with measures imposed by importing nations exhibiting a more pronounced adverse effect compared to those implemented by exporting countries [15]. Digital commerce restrictions may diminish the quality of exported goods by obstructing the flow of consumer demand insights and elevating transaction costs [16]. Export efficiency is adversely affected by digital trade restrictions in both exporting and importing nations [17]. Digital trade restrictions impede economic development, with particularly pronounced impacts evident in high-income and lower-middle-income nations [18]. Trade barriers on online platforms reduce the contribution of the ICT industry to overall economic productivity growth [19]. In highly digitized industrial regions, digital trade barriers can more significantly erode the market power of enterprises [20]. Digital trade barriers have suppressed the intensity of bilateral value-added trade, especially in the service industries [21]. Digital trade barriers hinder the upgrading of the national service industry’s position in the global value chain [22,23]. Research indicates that a nonlinear relationship exists between digital trade barriers and digital services trade, moderated by variables including trade volume, composition, innovation potential, and security assurance capabilities [24,25,26].
Existing literature directly examining how digital trade barriers affect digital services imports remains limited. A consensus exists regarding their detrimental consequences. Constraints on cross-border data transmission tend to reduce such imports and impede technological upgrading in digital services exports [27]. Strict data restriction policies can significantly reduce the import of digital financial services, while institutional quality can alleviate this negative impact [5]. Foreign digital trade barriers hinder domestic firms from importing digital intermediate goods and degrade the quality of these imports [28,29]. Restrictive data policies, particularly those limiting cross-border data flows, are significantly negatively correlated with data-intensive services imports [30,31]. Data restriction policies and institutions jointly shape digital financial service trade [32].
The following are the main contributions of this paper: (1) The existing literature mostly examines the negative effects of digital trade barriers on imports. In contrast, this article empirically analyzes the potential nonlinear correlation between digital trade barriers and digital services imports, which helps in understanding the complexity of the impact of these barriers. (2) Previous studies usually analyzed the impact of trade barriers through mechanisms such as “increased costs” or “increased uncertainty”, but this study confirms that economic freedom is a key mediating mechanism and further analyzed the role of its sub-dimensions. (3) Most existing studies treat the institutional environment as a single moderating variable. However, this paper defines the institutional environment as a multi-dimensional concept and studies how it systematically reshapes the influence curve of “trade barriers”, thereby deepening the understanding of the significance of the institutional environment as a fundamental soft power for the evolution of digital trade.

2. Theoretical Analysis and Research Hypotheses

2.1. Impact of Digital Trade Barriers on the Digital Services Imports

It is important to note that the DSTRI measures the stringency of restrictions, not the quality of digital regulation. Regulatory certainty and market standardization, however, arise from the host country’s broader institutional environment, not from the DSTRI measure itself. Therefore, the positive effect of moderate DSTRI values on digital services imports does not mean that restrictions are inherently beneficial. Rather, this effect arises from two sources. According to adaptive efficiency theory, when the host country implements digital trade barriers, foreign service providers may actively adjust their business models to adapt to regulatory requirements. Such adaptive investment helps to expand the scale of service supply under the compliance framework [25]. Meanwhile, signal transmission theory points out that moderate digital trade barriers, when embedded in a sound institutional environment, send a positive signal to the international market that the host country’s digital market is standardized, which can bring new production factors and new resource allocations to the host country, making up the gap in domestic effective demand [33]. As noted by [27,34], the relationship between digital technology and policy restrictions is complex and context-dependent.
The net benefit of compliance occurs only when marginal compliance costs are lower than the efficiency gains from market standardization—a condition that holds at low to moderate restrictiveness levels but reverses as barriers become excessive. At low restrictiveness levels, regulatory requirements are clear, compliance pathways are well-defined, and the institutional environment provides predictable enforcement, allowing foreign firms to absorb compliance costs while benefiting from market access. As restrictiveness increases beyond the optimal threshold, marginal compliance costs accelerate due to overlapping requirements, data localization mandates, and audit burdens, eventually dominating the efficiency gains.
However, escalating digital tariff barriers raise the financial burden on digital services trade, consequently impairing their global competitive position. Especially in price-sensitive markets, high digital tariffs can lead to an increase in service prices and suppress consumer demand in the host country [35]. In addition, the sustained escalation of non-tariff digital trade barriers concerning data flow, intellectual property rights, market access, and privacy protection raises the entry threshold for foreign services, increases the difficulty of foreign service supply, and hinders the growth of the host country’s digital service import scale.
Crucially, the positive initial slope does not imply that restrictions themselves are trade-promoting. Instead, at low to moderate restrictiveness levels, the marginal costs of compliance are relatively low, and foreign firms can absorb them while benefiting from the regulatory certainty that signals a standardized market. This regulatory certainty stems from the host country’s broader institutional quality, not from the DSTRI measure itself. As restrictiveness rises beyond the optimal threshold, marginal compliance costs accelerate and eventually dominate, reducing import volumes. The study advances the following propositions by building upon this analysis:
Hypothesis 1.
Digital trade barriers have an inverted U-shaped, nonlinear effect on digital services imports.

2.2. Analysis of the Mediating Role of Economic Freedom

Economic freedom acts as a key indicator for evaluating the degree of marketization in an international context. It refers to the extent to which the government does not interfere in economic activities, including free trade, market operation, private property rights, and the competitive process [36]. The theoretical link between economic freedom and digital services imports is fundamental: higher economic freedom reduces institutional transaction costs, enhances regulatory predictability, and fosters cross-border digital transactions by creating a low-barrier, high-predictability market environment. These features directly facilitate imports of digital services by lowering entry costs for foreign providers and stimulating domestic demand for global digital solutions.
At the early stage of digital trade barrier enforcement, well-designed restrictions are conducive to achieving critical policy goals, such as safeguarding national security and protecting the privacy of domestic sectors. Such measures can provide market participants with clear institutional boundaries and stable policy expectations, which consequently strengthens institutional security.
Conversely, once the intensity of such barriers exceeds a critical threshold, excessive regulation significantly increase institutional transaction costs. The compliance review and data governance processes can impose a particularly heavy additional burden [30,31]. Furthermore, rigorous constraints limit the global exchange of intellectual capital and technical expertise, thereby suppressing the circulation of innovation factors. These dynamics ultimately reduce the scale and quality of host countries’ digital services imports by driving up service prices, restricting consumer choices, and weakening technological spillover effects.
This nonlinear relationship reflects the operation of “regulatory balance” theory within the framework of economic freedom, where economic freedom acts as a mediating variable [37]. This relationship exhibits an inverted U-shaped pattern: moderate barriers may initially boost imports through institutional enhancements, but beyond an optimal level, stricter regulations lead to a decline in import volumes.
Importantly, we do not argue that digital trade barriers directly increase overall economic freedom. Rather, the mediation analysis examines whether digital trade barriers influence digital services imports through changes in specific dimensions of economic freedom—most notably government size—as an empirical channel. The theoretical logic is that barriers affect fiscal policy and government expenditure, which in turn shapes the economic freedom environment relevant to trade. We present this mediation analysis as an exploratory empirical channel, acknowledging that reverse causality (economic freedom shaping digital trade policy) is also possible. The causal chain we propose—digital trade barriers affecting government size (via fiscal policy and government expenditure), which in turn affects digital services imports—should be interpreted as an indicative pathway rather than a confirmed causal mechanism. Based on the above reasoning, we propose the following hypothesis:
Hypothesis 2.
Digital trade barriers can influence digital services imports through economic freedom.
We present this mediation analysis as an exploratory empirical channel, acknowledging that reverse causality (economic freedom shaping digital trade policy) is also possible. The causal chain we propose—digital trade barriers affecting government size (via fiscal policy and government expenditure), which in turn affects digital services imports—should be interpreted as an indicative pathway rather than a confirmed causal mechanism.

2.3. Analysis of the Moderating Role of Institutional Environment

In studies on digital services imports, a country’s institutional environment serves as a critical moderating variable. Specifically, the institutional quality of the host country not only determines how fully policy specifications translate into actual implementation, but also shapes the adaptability of the policy framework to evolving market conditions, thereby fundamentally moderating the ultimate effects of digital trade barriers on import activities.
Robust institutional frameworks in host nations can strengthen the beneficial influence of digital trade restrictions on digital services imports in the initial stages. This is because a well-established legal system and a transparent regulatory framework provide clear rule guidance for digital services imports, which can partially offset the additional costs brought about by digital trade barriers [38,39]. Additionally, institutional elements can help enhance the strategic flexibility of host country enterprises, thereby accelerating digital services imports.
However, when digital trade barriers exceed the optimal threshold, strict enforcement mechanisms make it difficult for host country firms to avoid high compliance costs. Requirements such as data residency rules and international data transfer audits have emerged as unavoidable fixed costs for businesses. The full internalization of these costs has greatly weakened the price competitiveness of imported digital services. As a result, substantial market access barriers have emerged. Furthermore, according to “path dependence theory”, high-quality institutional environments often involve complex legislative processes and stable legal frameworks. Although these measures can ensure policy continuity, they also generate considerable institutional inertia. This institutional rigidity makes it difficult to adjust barrier policies promptly in response to market changes. Consequently, the restrictive effect on digital service imports is extended [40]. Drawing on the above discussion, this paper advances the following hypotheses:
Hypothesis 3.
The institutional environment of the host country positively moderates the inverted U-shaped impact of digital trade barriers on digital services imports.
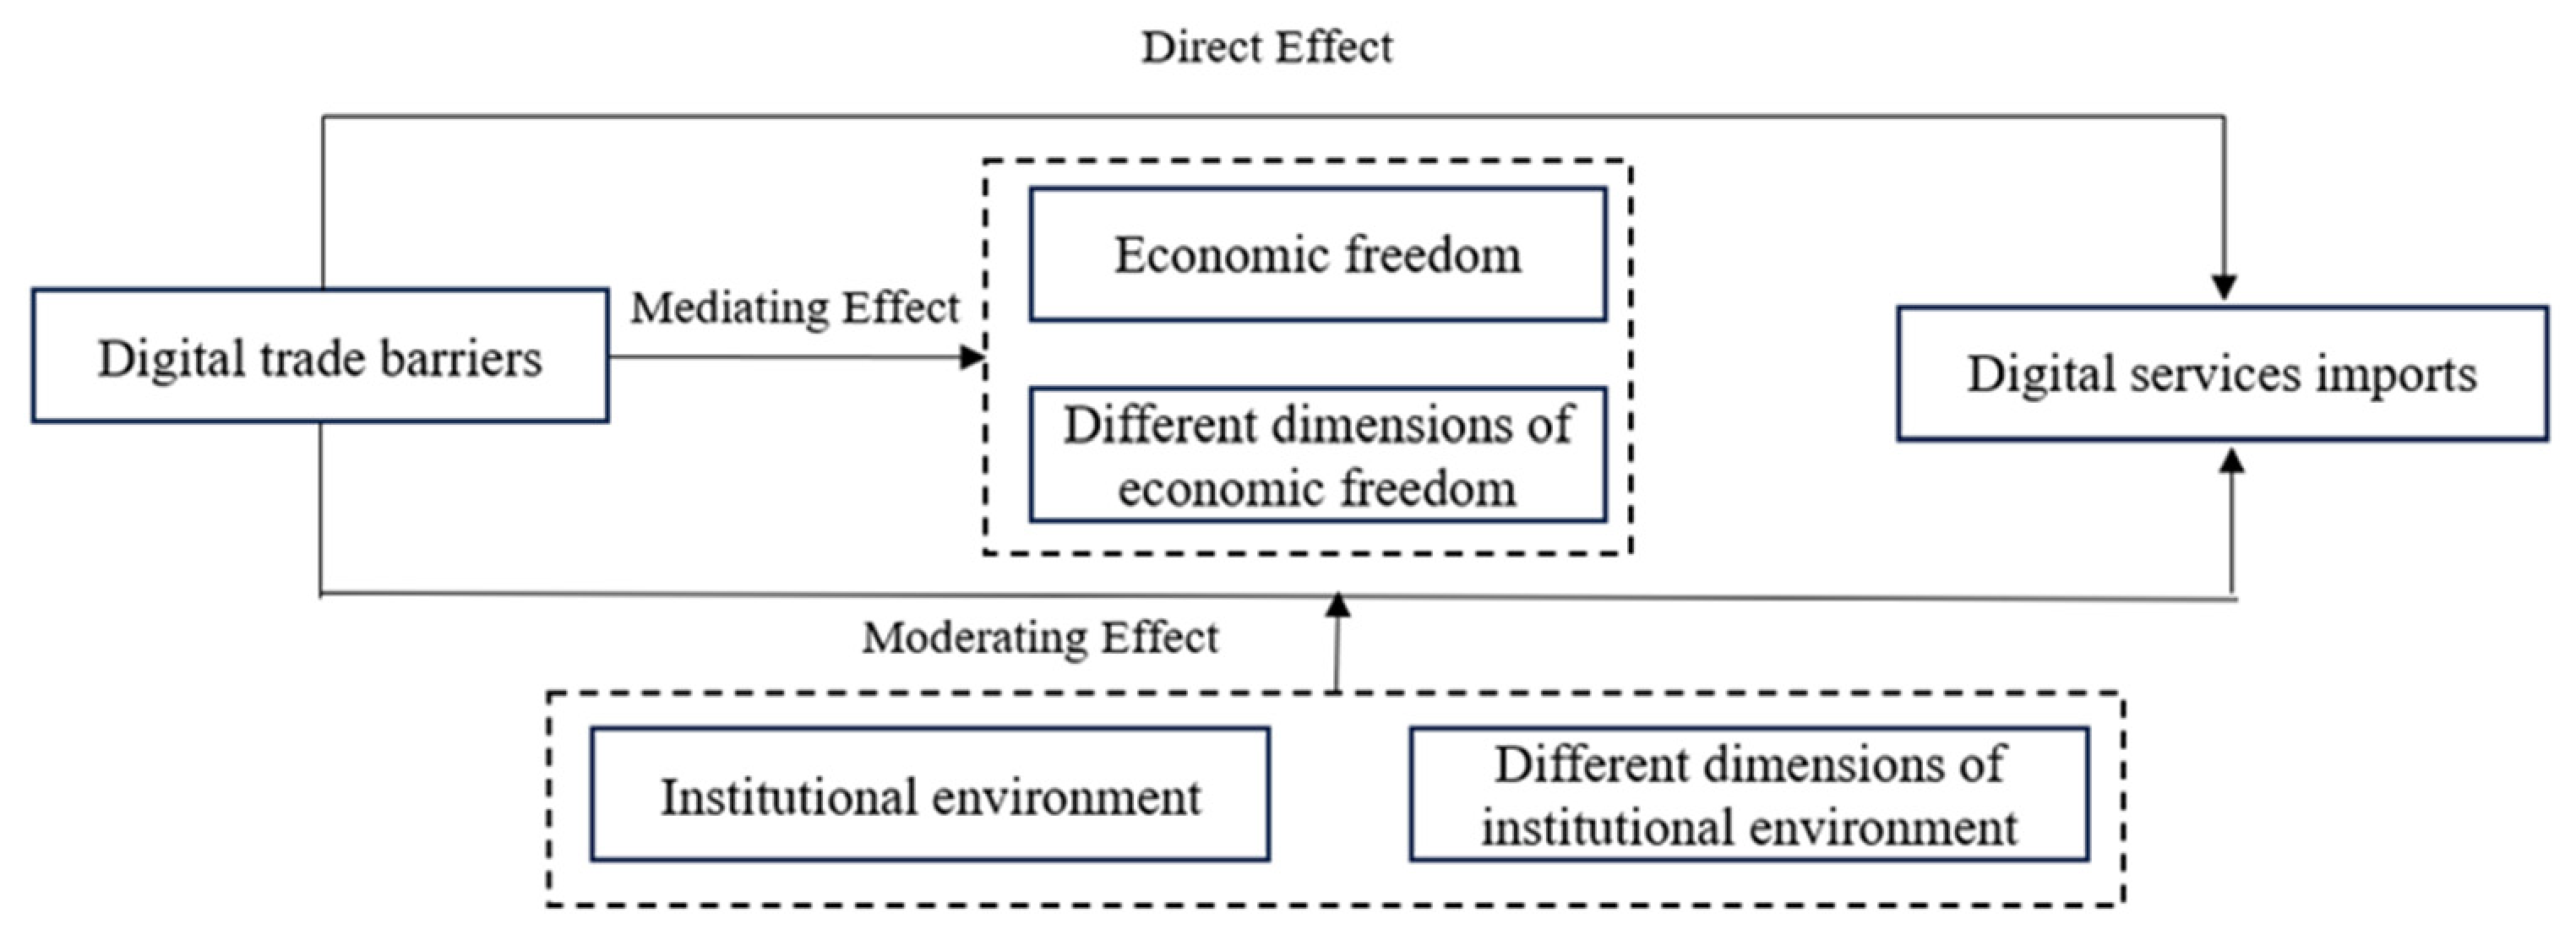
Building on the established assumptions, the theoretical framework for this study is developed and presented in Figure 2.

3. Methods and Data

3.1. The Empirical Model

To examine the nonlinear association between digital trade barriers and digital services imports, the squared term of digital trade barriers is incorporated into the regression model, which is established as follows:
D d s i i t = α 0 + α 1 D s t r i i t + α 2 D s t r i i t 2 + φ X i t + λ i + μ t + ε i t
Among them, i stands for the country, t stands for the time, D d s i i t represents digital services imports, D s t r i i t denotes digital trade barriers, X i t denotes the control variables in the model, including foreign direct investment (Fdi), outward foreign direct investment (Ofdi), carbon emissions (Ce), urbanization (Urb), and internet penetration level (Inf). λ i captures the country fixed effects, μ t represents the year fixed effects, and ε i t denotes the random error terms.
The theoretical framework mentioned earlier holds that economic freedom is the potential mechanism that connects digital trade barriers with digital services imports. To formally examine this mediating relationship, a systematic mediation analysis was conducted using the causal step procedure.
E f i t = β 0 + β 1 D s t r i i t + β 2 D s t r i i t 2 + φ X i t + λ i + μ t + ε i t
D d s i i t = γ 0 + γ 1 E f i t + φ X i t + λ i + μ t + ε i t
D d s i i t = η 0 + η 1 D s t r i i t + η 2 D s t r i i t 2 + η 3 E f i t + φ X i t + λ i + μ t + ε i t
Economic freedom (Ef) serves as the mediating variable.
To test the moderating role of the institutional environment on the relationship between digital trade barriers and digital services imports, we introduce an interaction term. The model is as follows:
D d s i i t = θ 0 + θ 1 D s t r i i t + θ 2 D s t r i i t 2 + θ 3 W g i i t + θ 4 W g i i t × D s t r i i t + θ 5 W g i i t × D s t r i i t 2 + φ X i t + λ i + μ t + ε i t
In the specified model, Wgi, which represents the institutional environment, is used as the moderating variable.

3.2. Variables

3.2.1. Explained Variable

Digital Services Imports (Ddsi): Most existing literature regards digitally deliverable services imports as a proxy variable for digital services imports, and takes the logarithm of them [41]. The digital service sector encompasses insurance, financial services, telecommunications, computing and information services, intellectual property royalties, and cultural and entertainment offerings, along with other commercial services.

3.2.2. Explanatory Variable

Digital Trade Barriers (Dstri): The digital services trade restriction index (DSTRI) is adopted in this paper to assess a nation’s digital trade barriers [42]. The metric is obtained from the DSTRI database. This dataset categorizes digital services trade barriers across five dimensions: infrastructure connectivity, electronic transactions, payment systems, intellectual property, and other related restrictions. For scoring, a value of 1 is assigned if a specific restrictive measure is present; otherwise, it is recorded as 0. Finally, the overall digital services trade restriction index is calculated through weighted processing.

3.2.3. Mediating Variable

Economic Freedom (Ef): The economic freedom index is a standard measure in academic research for evaluating market openness [43]. This composite indicator assesses policies that foster economic liberty, with scores ranging from 0 to 100, where higher scores reflect greater economic freedom. Fundamentally, the index measures the extent to which government intervention in markets is restrained.

3.2.4. Moderating Variable

Institutional environment (Wgi): This study employs the worldwide governance indicators (WGI), which provide governance scores for a country or region across six dimensions: control of corruption, government efficiency, political stability and absence of violence/terrorism, regulatory quality, rule of law, and voice and accountability. The average score of these six dimensions is used in this paper [44]. In essence, the WGI measures the effectiveness of government intervention when it occurs.

3.2.5. Control Variables

Foreign Direct Investment (Fdi): The advanced digital technologies, platforms, and services brought by foreign-funded enterprises directly increase import demands of the host country for digital products and digital intermediate goods [45]. Meanwhile, the integration of industrial chains led by foreign capital may also deepen the reliance on international digital supply chains, thereby increasing the overall scale of digital services imports. This study uses net FDI inflows as a percentage of GDP to assess the host country’s level of FDI [46].
Outward Foreign Direct Investment (Ofdi): The larger the scale of a country’s outward foreign direct investment is, the more its economic development tends to be export-oriented. Host country enterprises may increase their demands for services such as digital logistics, cross-border payments, and blockchain, to optimize global supply chain management. This study assesses the host nation’s outward FDI by employing the ratio of its net outward FDI flows to GDP [47].
Carbon Emissions (Ce): When a country imposes the carbon tax or strict emission reduction regulations, domestic enterprises tend to reduce their high-carbon production activities within the country [28,29]. The same effect can be achieved through digital services imports. This paper uses total carbon dioxide emissions and applies a logarithmic transformation to this variable.
Urbanization (Urb): The urban population ratio represents a nation’s residents’ consumption potential for digital services. Specifically, urbanization facilitates the agglomeration of population, industries, and capital, which in turn generates economies of scale, raises demand for digital services, and boosts digital services imports.
Internet Penetration Rate (Inf): Generally speaking, a high internet penetration rate indicates that the country’s digital infrastructure and user base are well-developed. Internet penetration enables more local enterprises to possess digital capabilities, allowing them to independently develop or use local digital programs, thereby reducing the demand for high-end digital services imports.

3.3. Data Sources

All data processing and econometric analyses were performed using Stata (version 17.0). Spatial data visualization and mapping were conducted using ArcGIS Pro (version 3.0). The data on digital services imports come from the WTO database; data on digital trade barriers are acquired from the OECD-DSTRI database; the data on economic freedom come from the Heritage Foundation; the data on the institutional environment come from the World Bank WGI database; and the data on control variables come from the World Bank WDI database. The OECD-DSTRI database encompasses 90 economies. Owing to missing data for Kosovo, Montenegro, and Serbia, after screening the relevant data, 87 countries were ultimately included in the empirical analysis. The study employs panel data spanning the period 2014–2022, covering these 87 countries. Summary statistics of the core variables are shown in Table 1.

4. Empirical Analysis

Following the nonlinear modeling approach of [32], we incorporate squared terms to capture potential nonlinearities in the relationship between digital trade barriers and digital services imports.

4.1. Benchmark Regression Analysis

To assess the effect of digital trade barriers on digital services imports, we carried out benchmark tests using a fixed effects model. Table 2 presents the regression results. Compared with columns (1), (2), and (3), column (4) indicates that after including country fixed effects, year fixed effects, and control variables, the R2 value rises notably, indicating improved explanatory power of the model. The results demonstrate that the coefficient on the linear term of digital trade barriers is notably positive, whereas the quadratic term coefficient is notably negative. This discovery supports the theoretical expectation outlined in Hypothesis 1, suggesting a nonlinear, inverted U-shaped relationship where digital trade barriers initially coincide with higher and then restrict digital services import. The estimated turning point of the inverted U relationship is 0.378 (95% CI [0.352, 0.422]). Thus, with the trade network of global digital services growing increasingly complex, this paper reveals that the effect of digital trade barriers on digital services imports presents different characteristics at different stages. In the initial stage, overseas digital service providers increase their technological investment and improve product quality to deal with host countries’ digital trade barriers. These efforts facilitate the introduction of advanced foreign digital technologies, products, and services [48]. However, the continuous increase in digital trade barriers curbs the host country’s openness, raise the entry threshold for foreign digital services, and leads to a reduction in the scale of digital services imports by the host country [49].
The estimated effects of the other variables on digital services imports are displayed in column (4) as follows. The coefficient for foreign direct investment inflow (Fdi) is significantly positive, which indicates that foreign enterprises stimulate the host country’s market demand for international digital services. The specific methods by which established multinational enterprises provide digital services in host countries, thereby participating in and stimulating local market demand, have been clarified [50]. The coefficient for foreign direct investment outflow (Ofdi) is significantly negative, suggesting that firms’ overseas expansions can directly utilize digital service resources within the host country, thereby reducing their reliance on international services [51]. The coefficient for internet penetration (Inf) shows a statistically negative relationship. One plausible interpretation is that higher internet accessibility enables local digital service providers to more effectively address domestic needs, creating an import substitution effect [14]. However, an alternative interpretation—that internet penetration increases demand for sophisticated foreign digital services—is also conceivable. In our sample, which includes a substantial share of developing economies where local digital capabilities are rapidly expanding, the import substitution effect appears to dominate. Digital transformation significantly affects export product cleanliness, supporting our import substitution interpretation [52]. The impacts of carbon emissions (Ce) and urbanization (Urb) on digital services imports are statistically insignificant. The coefficient of CO2 emissions is not significant, possibly because digital services imports rely more on ICT infrastructure and technological maturity, which are not directly related to the energy consumption of emissions. Meanwhile, although urbanization boosts the demand for digital services, its net effect has become insignificant. This may be because the effect of expanded local supply and the import substitution effect tend to offset each other.

4.2. Robustness Test and Endogeneity Test

4.2.1. Replacement of the Explanatory Variable

The OECD employs the Digital Services Trade Restrictiveness Index (DSTRI) to evaluate differences in digital trade restrictions across country pairs. Accordingly, the DSTRIH is adopted as an alternative indicator to the DSTRI for estimation. The bilateral heterogeneity index (DSTRIH) is constructed using two methods, namely “answer” (DSTRIHa) and “score” (DSTRIHc) [53]. Columns (1) and (2) of Table 3 show that the estimated coefficients on the linear and quadratic terms of DSTRIHa and DSTRIHc are significantly positive and negative respectively, confirming the robustness of the research conclusion.

4.2.2. Tail Reduction Treatment

To attenuate potential bias from extreme values, this study applies 1% and 99% quantile truncation to each variable in the sample. As reported in column (3) of Table 3, the corresponding estimates show that the linear term of digital trade barriers displays a statistically positive coefficient, while its quadratic term is significantly negative. These results affirm the robustness of the baseline regression estimates.

4.2.3. Replacement of Measurement and Estimation Methods

The random effects model presupposes that the influence of individual–specific characteristics follows a random pattern. This setting can effectively reflect the impact of potential unobserved heterogeneity among countries on digital services imports. Consequently, this study applies the random effects estimator, with the findings presented in Table 3. As shown in column (4), the effect of digital trade barriers on digital services imports is initially positive and then negative, aligning with the baseline regression outcome.

4.2.4. The Omitted Variables Problem

Given the numerous factors influencing the digital services imports, omitted variable bias could be a concern. Therefore, in addition to the original control variables, this paper further incorporates industrial structure (Str), government education expenditure (Gov), dependence on natural resources (Nat), and high-tech export (Ht). Specifically, Str is calculated as the ratio of service industry value added to GDP. Gov is quantified by the proportion of government education expenditure to GDP. The dependence on natural resources, denoted as Nat, is quantified as the share of mineral and metal exports in total merchandise exports. Meanwhile, high-tech exports (Ht) are represented by the proportion of high-tech exports in manufactured goods exports. And the estimates shown in column (5) of Table 3 are consistent with the baseline regression results.

4.3. Endogeneity Test

Two main aspects of endogeneity were considered. First, a country’s digital services imports are not only affected by existing barriers but may also, in turn, influence the government’s motivation and stringency in setting up such barriers [54]. Second, unobserved factors may simultaneously affect both digital trade barriers and imports, further complicating causal inference.
Given the persistent nature of digital trade barriers, we employ the one-period and two-period lags of the barrier variable as instruments. The exclusion restriction for the lagged instruments requires that past values of digital trade barriers affect current digital services imports only through their effect on current barriers, rather than through any other channel. This is plausible because past trade barriers are predetermined and therefore cannot be influenced by current import levels. Moreover, we include year fixed effects to absorb common time trends and country fixed effects to control for time-invariant heterogeneity, which further strengthens the exclusion restriction. As shown in columns (1) and (2) of Table 4, the Kleibergen–Paap rk LM test rejects the null hypothesis of underidentification. Furthermore, the Kleibergen–Paap rk Wald F statistic exceeds the applicable Stock–Yogo critical threshold, indicating that weak instrument concerns are alleviated. The IV estimates confirm an inverted U association between digital trade barriers and digital services imports, with the results remaining significant at the 1% level.
Additionally, we use the annual average of digital trade barriers across all other countries as an instrumental variable, which is theoretically justified because aggregate sample characteristics are unaffected by any single country’s behavior yet remain correlated with the explanatory variable [55]. We acknowledge that global policy trends could potentially violate the exclusion restriction; year fixed effects are included to absorb common shocks. The large IV coefficients suggest that measurement error may attenuate the baseline estimates, or that the instrument captures a local average treatment effect for policy-responsive countries. For this instrument, the exclusion restriction requires that other countries’ average barriers affect a given country’s digital services imports only through that country’s own barriers, rather than through any other pathway; this assumption is plausible as the aggregated measure is unlikely to be directly affected by any single country’s import behavior while remaining correlated with a country’s own barriers due to policy diffusion and global trends. The Kleibergen–Paap overidentification test does not reject instrument validity, and column (3) of Table 4 further confirms that digital trade barriers exert an inverted U-shaped influence on digital services imports, reinforcing the robustness of our main findings.

4.4. Heterogeneity Test

4.4.1. Heterogeneity in Countries

Countries vary in their ability to deal with digital trade barriers, mainly due to differences in economic freedom, import scale, and economic development level [56]. Among the 87 sample countries, significant disparities exist in the scale of digital services imports. Based on this, the average value of digital services imports of various countries from 2014 to 2022 was used as the classification criterion: countries below this threshold were grouped into the small-scale group, while those reaching or exceeding this level were classified into the large-scale group. Columns (1) and (2) of Table 5 report the corresponding results. The effect of digital trade barriers on digital services imports is concentrated in the large-scale group. This indicates that countries with a large scale of digital services imports usually have a considerable market size [57,58]. In the short term, moderate digital trade barriers can help regulate the trade market order and traders’ behaviors, further promoting import demand. However, in the long term, as major importing countries deeply integrate into the global digital supply chain, digital trade barriers directly add to the compliance costs of enterprises, thereby curbing import scale.
Countries with different levels of economic development exhibit significant differences in aspects such as trade environment and technological capabilities. According to the classification criteria of the World Economic Outlook 2025 released by the International Monetary Fund, the 87 sample countries are categorized into two types: developed economies and emerging market and developing economies. As shown in columns (3) and (4) of Table 5, the effect of digital trade barriers on digital services imports is concentrated in developed economies rather than emerging markets and developing economies. This is because developed economies have mature market structures, standardized regulatory environments and streamlined policy supervision, which make the influence of digital trade barriers on digital services imports significant [39]. In contrast, among emerging and developing economies, digital trade barriers exert an insignificant impact on digital services imports, due to market rigidity, underdeveloped institutional frameworks, and limited firm adaptability.

4.4.2. Heterogeneity in the Digital Services Industries

Digital services imports cover eight sub-sectors: insurance and pension services imports (SFI), financial services imports (SGI), intellectual property royalties imports (SHI), telecommunications services imports (SI1I), computer services imports (SI2I), information services imports (SI3I), other business services imports (SJI), and personal, cultural, and entertainment services imports (SKI). Different categories of digital services imports exhibit varying degrees of technological dependence, which in turn causes them to be affected by digital trade barriers to different degrees [59]. As digital services imports at different dimensions have their own characteristics, it is necessary to examine the relevant heterogeneity.
Columns (1) to (8) of Table 6 show that, among digital services imports at different dimensions, digital trade barriers mainly have an inverted U impact on telecommunications service imports (SI1I). This indicates that telecommunications services rely heavily on real-time connections and cross-border data flows. Moderate digital trade barriers can stimulate import demand by regulating the market and enhancing trust, and even attract high-quality services providers to enter [60]. However, as barriers strengthened, the core attributes of telecommunications services were directly suppressed, and thus the import scale of the host country shrinks sharply. This nonlinear relationship highlights the special sensitivity of telecommunications services, as their trade value is closely related to policy openness. There is a critical point between “moderate regulation” and “excessive closure” in policy effects, which eventually leads to an inverted U-shaped trajectory in digital services imports.

4.4.3. Heterogeneity in the Digital Trade Barriers

To study how digital trade barriers in different areas affect digital services imports, we conducted tests across five areas: infrastructure connectivity (Dstri1), electronic transactions (Dstri2), payment systems (Dstri3), intellectual property (Dstri4), and other barriers (Dstri5). As shown in Table 7, electronic transactions barriers and other barriers exert an inverted U-shaped influence on digital services imports. Barriers to electronic transactions mainly include regulatory restrictions in areas such as e-commerce activities and digital authentication [61,62]. Moderate regulatory measures promote an increase in digital services imports in the host country through mechanisms such as encouraging compliance-driven adjustments by foreign firms and curbing inefficient domestic supply [63]. However, when barriers exceed the critical threshold, restrictions on electronic transactions increase enterprise costs and transaction risks, weaken the convenience and cost-effectiveness of digital services trade, and lead to a decline in host country’s import demand [16,64]. Furthermore, other barriers stimulate digital services imports in the short term by substituting for traditional services trade. However, when the barriers exceed the affordability of enterprises in the host country, the positive impact of digital services imports in the host country will reverse.

5. Further Analysis: Tests of Mediation Effects and Moderation Effects

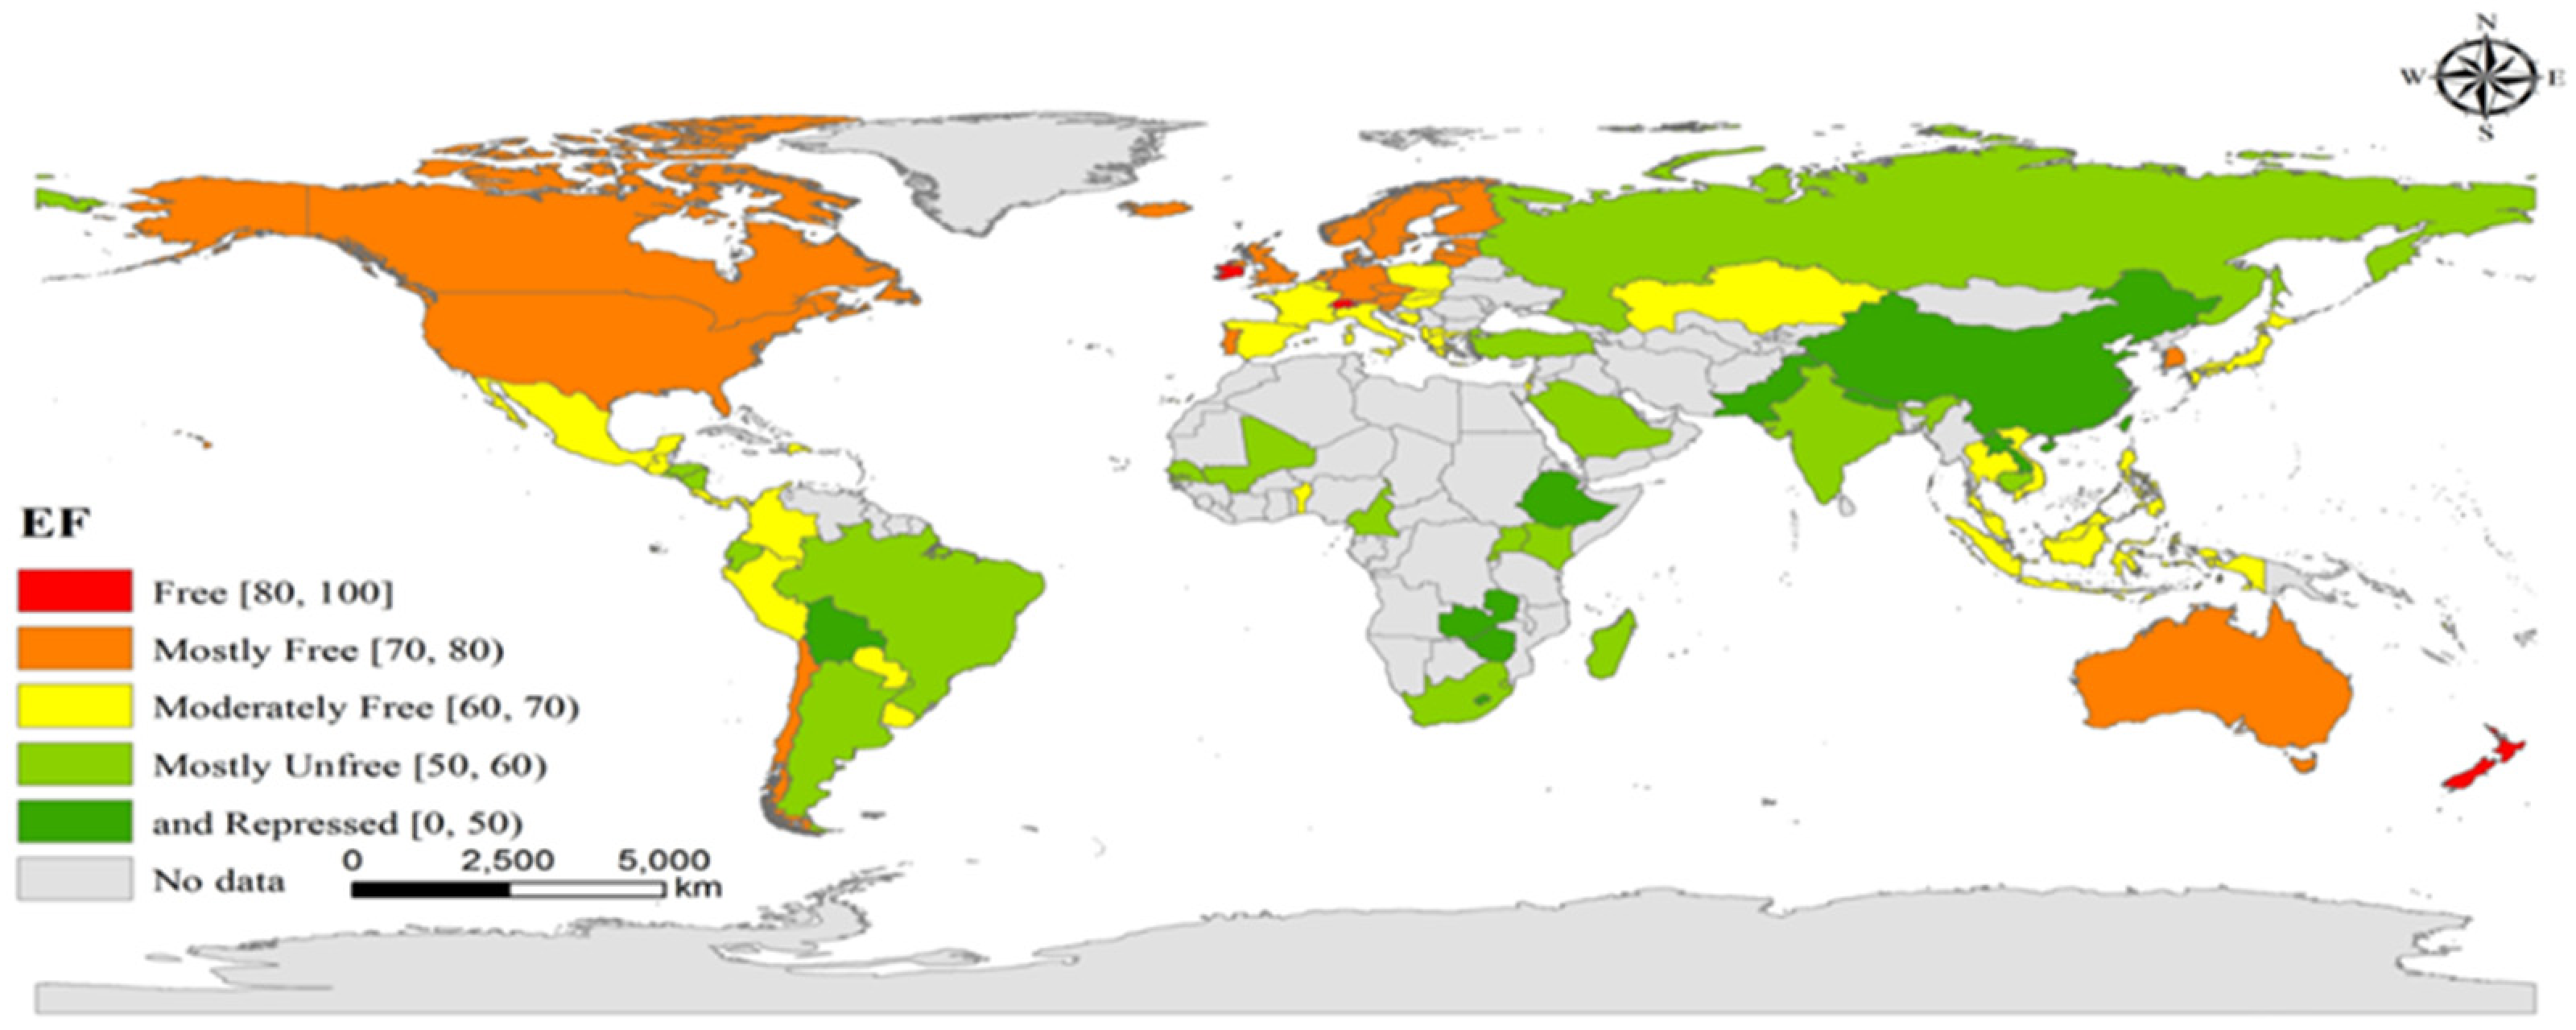
According to the Heritage Foundation’s classification, economic freedom can be divided into five levels: “Free” (80–100), “Mostly Free” (70–80), “Moderately Free” (60–70), “Mostly Unfree” (50–60), and “Repressed” (0–50). Figure 3 presents the spatial distribution of economic freedom across the 87 sampled economies in 2023. Economic freedom exhibits significant and systematic geographical heterogeneity globally. These differences are deeply rooted in structural factors, including the national institutional framework, policy orientation, market openness, and the degree of rule of law. Therefore, economic freedom serves as a mediating mechanism by which digital trade barriers impose a nonlinear influence on digital services imports.
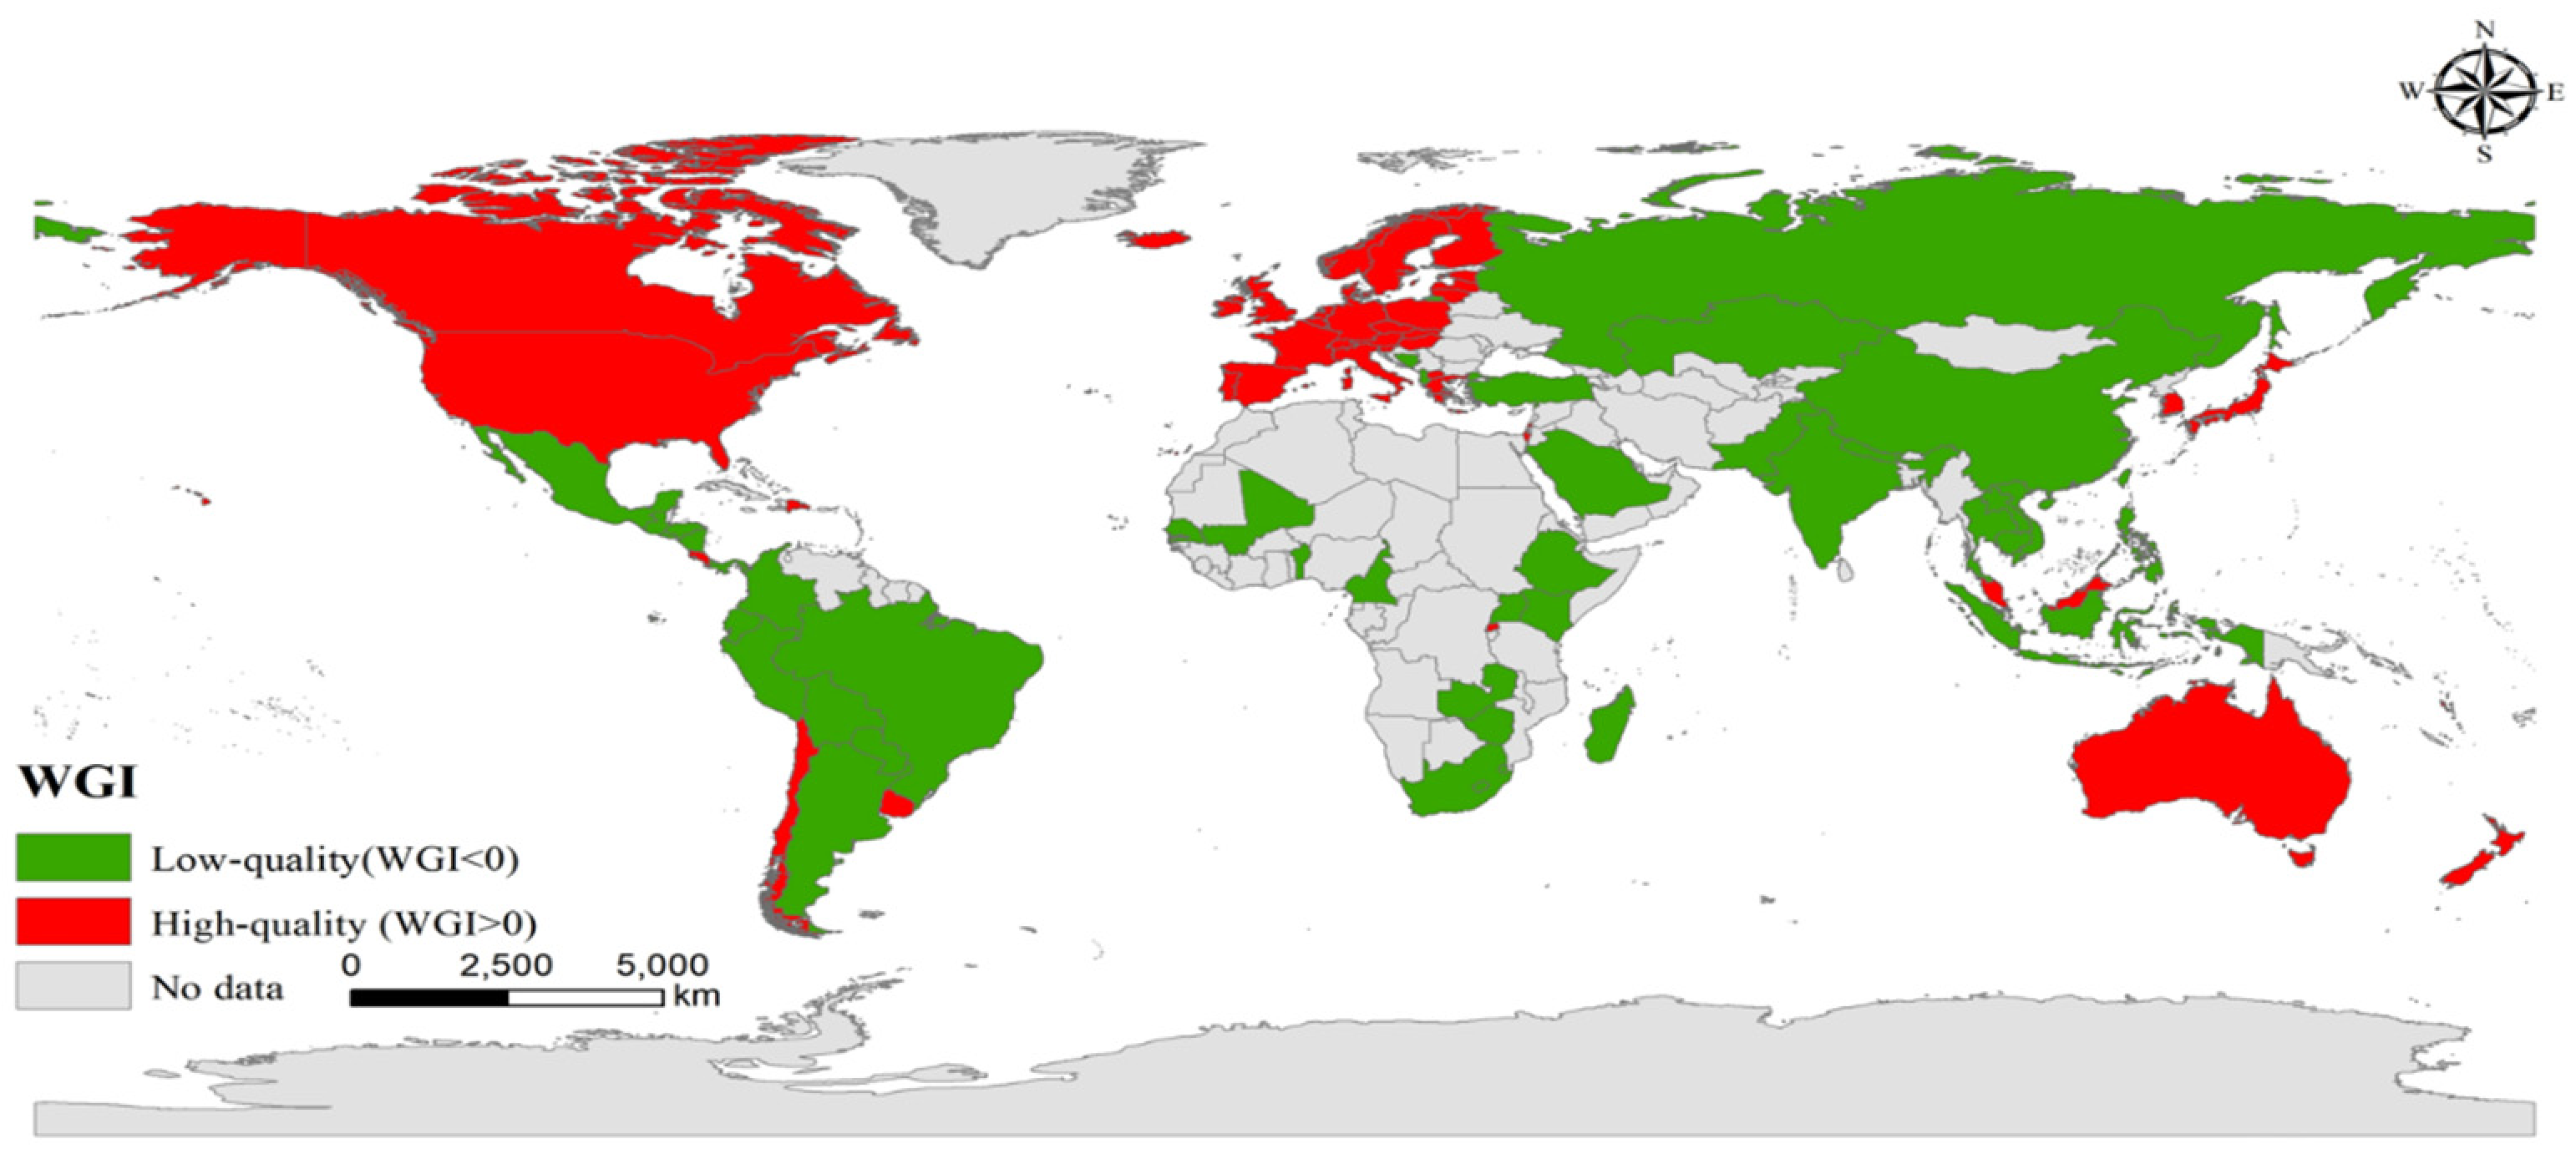
Based on the World Bank’s WGI classification criteria, countries can be categorized into two groups according to institutional quality: high-quality (WGI > 0) and low-quality (WGI < 0).
As shown in Figure 4, the global spatial distribution of WGI reveals significant and systematic heterogeneity in institutional quality worldwide. High-quality countries (WGI > 0) are primarily clustered in North America, Western Europe, Oceania, and parts of developed Asia, while low-quality countries (WGI < 0) are widely distributed in the Middle East, South Asia, Africa, and parts of Latin America, forming a distinct “institutional gap”. Therefore, institutional quality, as a key moderating variable, may systematically shape the nonlinear effect of digital trade barriers on digital services imports.

5.1. Test of the Mediating Effect of Economic Freedom

As hypothesized in the preceding theoretical analysis, digital trade barriers may influence digital services imports through the channel of economic freedom. We present this analysis as an exploratory test of the proposed mechanism, recognizing that alternative interpretations remain possible. Following established methods in the literature, this research employs a mediation effect model to empirically test this mechanism [52,65]. Table 8 presents the regression results.
Specifically, the linear term of digital trade barriers in column (1) is notably positive, while the quadratic term is significantly negative. The coefficient of economic freedom, as presented in column (2), is significantly positive at the 1% level. In column (3), the linear term of digital trade barriers turns significantly positive, the quadratic term becomes significantly negative, and economic freedom remains significantly positive.
The positive correlation between economic freedom and digital service imports is fundamentally derived from the ability of high-quality institutional arrangements to effectively reduce transaction costs, which provides support for Hypothesis 2. The inherent institutional features of economic freedom, including transparent regulation, financial openness, and investment liberalization, jointly create a market environment with low barriers and strong predictability. This environment not only directly reduces the institutional transaction costs associated with imported digital goods and services, but also is associated with increased the endogenous demand of domestic market entities for global cutting-edge digital technologies and solutions, thereby significantly expanding the scale of digital services imports.

5.2. Test of the Mediating Effect of Different Dimensions of Economic Freedom

According to the Index of Economic Freedom, economic freedom is measured across four key dimensions: rule of law, government size, regulatory efficiency, and open markets. This study further tests the mediating effects of diverse dimensions of economic freedom.
Columns (1)–(3) of Table 9 present the mediating effect of the rule of law. In column (1), neither the linear nor the quadratic term of digital trade barriers reaches statistical significance, which suggests that the mediating influence of the rule of law on the nexus between digital trade barriers and digital services imports is not statistically significant.
Columns (4)–(6) report the findings for the mediating function of government size. In column (4), the linear term of digital trade barriers displays a significantly positive coefficient, while the quadratic term is significantly negative. Column (5) shows a significantly positive coefficient for government size, and column (6) indicates significantly positive linear and negative quadratic terms of digital trade barriers, along with a markedly positive coefficient for government size at the 1% level. This confirms the mediating effect of digital trade barriers on digital services imports through government size, which follows a decreasing-then-increasing pattern.
Columns (7)–(9) report the mediating effect of regulatory efficiency. In column (7), the linear term of digital trade barriers is not significant, which shows the mediating role of regulatory efficiency is not supported. Column (10)–(12) examine the mediating effect of open markets. None of the key coefficients in columns (10) to (12) are statistically significant, indicating no significant mediating effect through open markets.
In summary, among the four dimensions of economic freedom, the decreasing-then-increasing mediating effect of digital trade barriers on digital services imports is unique to the government size dimension. This is because, it represents the most sensitive macroeconomic channel that links digital trade barriers to micro-level import decisions [66]. Specifically, digital trade barriers mainly function through their influence on a country’s fiscal policy and government expenditure. When government size is excessively large (reflected in high tax burdens and spending), it may exacerbate the negative effects of barriers [3]; however, as barriers reach a certain threshold and force a reduction in inefficient government intervention, the improvement of fiscal health becomes the key channel that ultimately promotes import growth [67].

5.3. Test of the Moderating Effect Based on Institutional Environment

To examine whether the institutional context of the host country functions as a moderating variable between digital trade barriers and digital services imports, this study carries out an empirical analysis, with the findings presented in Table 10. Columns (1) and (2) display the effect of digital trade barriers on digital services imports.
Columns (3) and (4) report the effect of the institutional environment on digital services imports. Columns (5) and (6) present the combined impacts of digital trade barriers, institutional environment, and their interaction terms on digital service imports. After accounting for the moderating effects of the control variables and the institutional environment, the results in column (6) indicates that the institutional environment enhances the inverted U-shaped impact of digital trade barriers on digital services imports, which confirms Hypothesis 3. The research shows that in the early stage of implementing digital trade barriers, the sound legal regulatory framework of the host country establishes predictable institutional conditions, which effectively offsets some additional costs brought about by these barriers. This result is consistent with the findings in [68,69,70]. Once barriers exceed the optimal level, the institutional environment will instead accelerate the inhibitory effect of digital trade barriers, leading to a steeper downward slope of the inverted U curve. The studies by [23,71] have successively confirmed that strict regulatory enforcement forces enterprises to bear the compliance costs of data localization and cross-border transfer audits, thereby weakening the market competitiveness of imported digital products.
In summary, institutional quality significantly moderates the inverted U relationship. In countries with strong institutional environments, the curve is steeper and the turning point occurs at lower restrictiveness levels, amplifying both the positive and negative slopes. In weak institutional settings, the curve is flatter and the turning point shifts to higher restrictiveness levels, dampening the responsiveness of imports to barrier changes. For high-quality institutional environments (WGI > 0), the turning point is 0.312 (95% CI [0.289, 0.335]); for low-quality environments (WGI < 0), it is 0.451 (95% CI [0.418, 0.484]).

5.4. Test of the Moderating Effect Based on Different Dimensions of Institutional Environment

Due to the varying characteristics of institutional environments across different dimensions, their moderating effects differ. This paper conducts an empirical analysis of this issue, and columns (1) to (6) of Table 11 display the corresponding regression results. In columns (2) and (4), the coefficient for Dstri × Wgi is significantly positive and the coefficient for Dstri2× Wgi is significantly negative. The results demonstrate that the moderating effects of government efficiency and regulatory quality are considerably stronger than those of other institutional factors. More specifically, effective regulation can accelerate the certification of compliant companies and clearly convey rules, thereby boosting digital service imports in the short term [64,72]. However, when digital trade barriers exceed the optimal level, efficient regulation leads to stricter barrier enforcement [14]. This further causes a sharp increase in compliance costs for enterprises in the host country, and amplifies the negative impacts of such barriers.

6. Discussion

In this section, we compare our findings with previous literature and highlight the utility of using institutional factors as explanations.
Our finding of an inverted U-shaped relationship between digital trade barriers and digital services imports is similar to those in [73,74]. The “V-shaped” reversal pattern in China’s photovoltaic exports following the implementation of trade barriers has been documented, and a “nonlinear convex relationship” exists between digital infrastructure and trade performance in African landlocked developing countries [73].
The utility of using institutional factors as explanations is threefold. First, economic freedom serves not merely as a control variable but as a fundamental mediating mechanism. It captures how barriers reshape the transaction cost environment and regulatory predictability, thereby affecting import decisions at the micro-level. Second, the institutional environment functions as a key moderating variable that systematically amplifies or dampens the barrier–import relationship. Third, by disaggregating these institutional concepts into sub-dimensions, we advance beyond monolithic treatments of institutions in prior work.
The distinct roles of economic freedom and the institutional environment deserve emphasis. Economic freedom mediates by adjusting the degree of market openness and transaction costs. The institutional environment moderates by shaping how barriers are enforced and adapted to market conditions. This conceptual distinction, often blurred in previous research, provides a more nuanced understanding of how different institutional configurations jointly determine digital trade outcomes.

7. Conclusions and Policy Recommendations

7.1. Conclusions

This study employs data from 87 sample nations covering the period 2014–2022 to assess the influence of digital trade barriers on digital services imports, with a particular focus on implications for sustainable digital trade governance. The conclusions are as follows: (1) An inverted U-shaped curve characterizes the relationship between digital trade barriers and digital services imports. This finding remains consistent across multiple examinations for endogeneity and robustness, suggesting that a balanced level of digital regulation is critical for sustaining long-term growth in digital services trade. (2) The effect of digital trade barriers on digital services imports varies notably across different economies, with stronger effects observed in economies with larger import volumes and in developed nations. Regarding different sectors, telecommunications services imports exhibit a distinct inverted U-shaped response to such barriers. Regarding barrier types, restrictions related to electronic transactions have a significant inverted U-shaped impact on digital services imports. These heterogeneous findings highlight the need for context-specific sustainability strategies tailored to national and sectoral conditions. (3) Economic freedom is an important channel through which digital trade barriers affect digital services imports. This finding should be interpreted as an indicative mechanism rather than a confirmed causal pathway. Among the four dimensions of economic freedom, the U-shaped mediating effect of digital trade barriers on digital services imports is primarily concentrated on government size. This result underscores the sustainability challenge of optimizing state–market relations to avoid both under-regulation and excessive intervention. (4) The institutional environment amplifies the inverted U-shaped effect of digital trade barriers on digital services imports. Specifically, government efficiency and regulatory quality play a particularly significant moderating role in this relationship. Strengthening these institutional dimensions is essential for achieving sustainable governance outcomes aligned with the SDGs.

7.2. Policy Recommendations

First, given the inverted U-shaped relationship between digital trade barriers and digital services imports, an adaptive management framework is essential. For telecommunications services—which are particularly sensitive to such barriers—policymakers should calibrate barrier levels near the optimal threshold. For electronic transaction barriers, countries below the optimal threshold may benefit from moderate increases to enhance market standardization and trust, while those above should pursue liberalization. However, this should be interpreted with caution, as the net effect depends on the specific institutional context and the adaptability of local firms. While ensuring data security, governments should gradually open up market access for digital services in phases, align with international digital trade rules, and implement complementary domestic policies to support the digital industry. This transformation will promote a qualitative shift in digital service imports from “protective growth” to “enhanced competitiveness,” thereby driving high-quality development of digital trade. Furthermore, given the heterogeneous effects of digital trade barriers across different countries, industries, and sectors, policymakers should implement categorized management strategies to maintain barrier levels within their respective optimal ranges, achieving a dynamic equilibrium between protection and development.
Second, economic freedom can serve as a critical mechanism for supporting digital services imports by reinforcing the market’s primary role in resource allocation. Governments should prioritize enhancing economic freedom as a key policy objective and sustain momentum for digital service imports by advancing institutional openness, ensuring the free flow of production factors, and deepening global regulatory coordination. Moreover, since digital trade barriers affect digital services imports through economic freedom, with their U-shaped effect primarily driven by the government size dimension, policymakers should implement governance strategies centered on precisely regulating government size. In this way, governments can maintain an optimal scale, ensuring that markets are neither disordered due to regulatory gaps nor stifled by excessive intervention. This balance is indispensable for fully realizing the potential of digital service imports while safeguarding security, and it represents a practical application of sustainability principles to policy design.
Finally, the institutional environment serves as a powerful moderating variable that enhances the relationship between digital trade barriers and digital services imports. Governments should integrate the institutional environment into the policy assessment framework for digital trade barriers. Such integration will boost the effectiveness of digital trade policies and ensure that regulatory measures align with local governance capabilities, legal standards, and administrative efficiency. Among all dimensions of the institutional environment, government efficiency and regulatory quality exhibit the most significant moderating effects. Therefore, policymakers should prioritize improving government efficiency as a key strategic objective. This transition requires moving beyond conventional regulatory frameworks toward an enabling governance structure—a shift designed to increase both flexibility and responsiveness in policy implementation. Such a change is vital for fostering the sustainable expansion of digital services imports while also supporting the SDGs by strengthening institutional quality and regulatory effectiveness.

7.3. Limitations and Future Research Directions

This study has two main limitations. First, the mediation analysis focuses on short-to-medium-run dynamics; long-run causality between economic freedom and digital trade barriers could operate in the opposite direction and should be examined in future research. The mediation analysis cannot definitively establish causal direction, as economic freedom may also shape digital trade policy. Future research could help address this issue. Second, while this study examines the economic and institutional determinants of digital services imports, it does not directly address sustainability implications. Future research should explore the environmental and social dimensions of digital services trade.

Author Contributions

Conceptualization, Z.Z.; methodology, Z.Z. and H.Z.; software, H.Z.; validation, Z.Z.; investigation, Z.Z.; data curation, H.Z.; writing—original draft preparation, Z.Z. and H.Z.; writing—review and editing, Z.Z. and H.Z.; project administration, Z.Z. All authors have read and agreed to the published version of the manuscript.

Funding

This study was supported by the Young Backbone Teachers Overseas Study Program of the China Scholarship Council (Student ID: 202500800019).

Institutional Review Board Statement

Not applicable.

Informed Consent Statement

Not applicable.

Data Availability Statement

The data presented in this study are available on request from the corresponding author.

Acknowledgments

We would like to acknowledge the China Scholarship Council that financially supported the authors in preparing the work. We would like to thank the reviewers for their attention and expertise, which contributed to improving the quality of this study.

Conflicts of Interest

The authors declare no conflict of interest.

Abbreviations

The following abbreviations are used in this manuscript:
SDGsSustainable Development Goals
Ddsidigital services imports
Dstridigital trade barriers
ICTinformation and communication technologies
Fdiforeign direct investment
Ofdioutward foreign direct investment
Cecarbon emissions
Urburbanization
Infinternet penetration level
Efeconomic freedom
DSTRIdigital services trade restriction index
DSTRIHBilateral Heterogeneity Index of DSTRI
Wgiinstitutional environment
Strindustrial structure
Govgovernment education expenditure
Natdependence on natural resources
Hthigh-tech export

References

  1. Li, J.; Wu, Z.; Feng, L. How does environmental regulation affect corporate tax burdens? Evidence from China’s environmental courts. Econ. Model. 2024, 130, 106566. [Google Scholar] [CrossRef]
  2. Ou, Z.; Jiang, N.; Ma, Y. Research on the impact mechanism of intellectual property protection on digital service trade from the perspective of country differences. Sci. Res. Manag. 2024, 45, 161–170. [Google Scholar]
  3. Zhang, Q.; Duan, Y. Digital empowerment and export quality: The moderate effect of market segmentation. Financ. Res. Lett. 2024, 63, 105334. [Google Scholar] [CrossRef]
  4. Otuya, W. Kenny and Baron 4 step analysis (1986): A case of employee job satisfaction as a mediator between ethical climate and performance among sugarcane transport SME’s in western Kenya. J. Econ. Sustain. Dev. 2019, 10, 108–118. [Google Scholar]
  5. Wu, F.; Xue, J.; Liu, Q.; Wu, H. How do digital trade barriers affect corporate digital innovation: Based on the perspective of blocking digital element allocation. J. Int. Trade 2025, 51, 39–54. [Google Scholar]
  6. Zhi, C.; Shuang, H. Import Trade in Digital Services and Economic Growth of Host Countries: Based on the Perspective of Cross-Border Data Inflow. Stat. Res. 2025, 42, 103–116. [Google Scholar]
  7. Li, Y.; Zhu, S. Impact of digital services trade restrictiveness on manufacturing export efficiency. Appl. Econ. 2024, 56, 8447–8461. [Google Scholar] [CrossRef]
  8. Wang, M.; Xie, Z. International trade barriers, export and industrial resilience: An empirical study based on the EU and USA antidumping and countervailing policies on photovoltaic products. Energy Policy 2025, 201, 114556. [Google Scholar] [CrossRef]
  9. Li, Y.; Vertinsky, I.B.; Li, J. National distances, international experience, and venture capital investment performance. J. Bus. Ventur. 2014, 29, 471–489. [Google Scholar] [CrossRef]
  10. Meltzer, J.P. Governing digital trade. World Trade Rev. 2019, 18, S23–S48. [Google Scholar] [CrossRef]
  11. Potluri, S.R.; Sridhar, V.; Rao, S. Effects of data localization on digital trade: An agent-based modeling approach. Telecommun. Policy 2020, 44, 102022. [Google Scholar] [CrossRef]
  12. Mohaddes, K.; Williams, R.J. The adaptive investment effect: Evidence from Chinese provinces. Econ. Lett. 2020, 193, 109332. [Google Scholar] [CrossRef]
  13. Vangipuram, B.; Gonzalez, J.Z.; Erfani, T. Making waves: Is water quality trading a false promise for balancing ecology and economy? Water Res. 2025, 284, 123959. [Google Scholar] [CrossRef]
  14. Guo, X.; Dong, X. Impact assessment and predictive analysis of digital trade barriers under the “Dual Circulation”. Economist 2025, 37, 58–67. [Google Scholar]
  15. Li, Y.; Shang, H. How does e-government use affect citizens’ trust in government? Empirical evidence from China. Inf. Manag. 2023, 60, 103844. [Google Scholar] [CrossRef]
  16. Tridgell, J. Open or closing doors? The influence of ‘digital sovereignty’ in the EU’s Cybersecurity Strategy on cybersecurity of open-source software. Comput. Law Secur. Rev. 2025, 56, 106078. [Google Scholar] [CrossRef]
  17. Tian, L.; Xiang, Y. Does the digital economy promote or inhibit income inequality? Heliyon 2024, 10, e33533. [Google Scholar] [CrossRef]
  18. Martina, F.F. Data flows and national security: A conceptual framework to assess restrictions on data flows under GATS security exception. Digit. Policy Regul. Gov. 2019, 21, 44–70. [Google Scholar]
  19. Correa, E.; Esquivias, M.A. The impact of digitalization, education, and institutional quality on economic growth: A comparative analysis between Sub-Saharan Africa and Middle East Countries. Soc. Sci. Humanit. Open 2025, 11, 101423. [Google Scholar] [CrossRef]
  20. Cao, T.L.; Hsu, J. Digitalization and country distance in international trade: An empirical analysis of European countries. Telecommun. Policy 2025, 49, 102877. [Google Scholar] [CrossRef]
  21. Lai, X.; Yue, S.; Guo, C.; Gao, P. Unleashing global potential: The impact of digital technology innovation on corporate international diversification. Technol. Forecast. Soc. Change 2024, 208, 123727. [Google Scholar] [CrossRef]
  22. Suh, J.; Roh, J. The effects of digital trade policies on digital trade. World Econ. 2023, 46, 2383–2407. [Google Scholar] [CrossRef]
  23. Zhan, Y.; Wang, T.; Bi, X. Creative production in the digital age: A network analysis of the digital game industry in China. Geoforum 2024, 157, 104158. [Google Scholar] [CrossRef]
  24. Donnelly, M. Payments in the digital market: Evaluating the contribution of Payment Services Directive II. Comput. Law Secur. Rev. 2016, 32, 827–839. [Google Scholar] [CrossRef]
  25. Wen, H.; Chen, W.; Zhou, F. Does digital service trade boost technological innovation?: International evidence. Socio-Econ. Plan. Sci. 2023, 88, 101647. [Google Scholar] [CrossRef]
  26. van der Marel, E.; Ferracane, M.F. Do data policy restrictions inhibit trade in services? Rev. World Econ. 2021, 157, 727–776. [Google Scholar] [CrossRef]
  27. Ma, S.; Shen, Y.; Fang, C. The digital world that trade created: Evidence from the information technology agreement. Econ. Anal. Policy 2025, 87, 746–763. [Google Scholar] [CrossRef]
  28. Graafland, J. Economic freedom and life satisfaction: A moderated mediation model with individual autonomy and national culture. Eur. J. Political Econ. 2023, 79, 102448. [Google Scholar] [CrossRef]
  29. Zhang, H.; Liu, Q.; Wei, Y. Digital product imports and export product quality: Firm-level evidence from China. China Econ. Rev. 2023, 79, 101981. [Google Scholar] [CrossRef]
  30. Dosmaganbetov, A.; Nanovsky, S. Unveiling the nexus: Impact of the extractive industries transparency initiative (EITI) on foreign direct investment (FDI). Resour. Policy 2025, 103, 105521. [Google Scholar] [CrossRef]
  31. Abbas, F.; Ali, S.; Woo, K.Y.; Wong, W.-K. Capital and profitability: The moderating role of economic freedom. Heliyon 2024, 10, e35253. [Google Scholar] [CrossRef] [PubMed]
  32. Ameer, W.; Xu, H. The long-run effect of inward and outward foreign direct investment on economic growth: Evidence from developing economies. Rev. Innov. Compet. J. Econ. Soc. Res. 2017, 3, 5–24. [Google Scholar] [CrossRef]
  33. Afolabi, J.A.; Fatai, B.O. Unlocking trade locks in landlocked developing countries (LLDCs) in Africa: The role of digital infrastructure. Telecommun. Policy 2025, 50, 103101. [Google Scholar] [CrossRef]
  34. Gupta, S.; Ghosh, P.; Sridhar, V. Impact of data trade restrictions on IT services export: A cross-country analysis. Telecommun. Policy 2022, 46, 102403. [Google Scholar] [CrossRef]
  35. Mithani, M.A. Scaling digital and non-digital business models in foreign markets: The case of financial advice industry in the United States. J. World Bus. 2023, 58, 101457. [Google Scholar] [CrossRef]
  36. Feng, D.; Lu, X.; Wang, H. Anti-corruption, digital economy development and carbon emissions—An empirical study based on 121 countries worldwide. Glob. NEST J. 2025, 27, 07669. [Google Scholar]
  37. Zhang, X.; Wang, Y. Research on the influence of digital technology and policy restrictions on the development of digital service trade. Sustainability 2022, 14, 10420. [Google Scholar] [CrossRef]
  38. Wu, Y.; Wang, X.; Xie, H.; Ma, S. How digital trade can reshape the trajectory of green and low-carbon development under the leadership of “dual-control” objectives. Glob. NEST J. 2025, 27, 07580. [Google Scholar]
  39. Bai, H.; Wang, G.; Hu, Y. The effect of major identity on depression among Chinese university students: A moderated mediation model. Acta Psychol. 2025, 255, 104985. [Google Scholar] [CrossRef]
  40. Cao, M. A Review of the OECD Digital Tax Reform Plan: Theoretical Interpretation, Interests Equalization and Rule Construction. Tax Res. 2021, 6, 77–84. [Google Scholar]
  41. Hu, Z.; Qin, Y.; Li, X. How do restrictions on cross-border data flows affect the cost of international services trade: An analysis based on cross-industry data of cross-border service industries. J. Int. Trade 2024, 50, 87–105. [Google Scholar]
  42. Herman, P.R.; Oliver, S. Trade, policy, and economic development in the digital economy. J. Dev. Econ. 2023, 164, 103135. [Google Scholar] [CrossRef]
  43. Jiang, G.; Cao, Z. How do digital service trade barriers affect value added trade intensity: An empirical test based on cross-border panel data. Nankai Econ. Stud. 2024, 40, 77–98. [Google Scholar]
  44. Tambini, D. The “Netflix effect” revisited: OTT video, media globalization and digital sovereignty in 4 countries. Telecommun. Policy 2025, 49, 102935. [Google Scholar] [CrossRef]
  45. Fisman, R.; Svensson, J. Are corruption and taxation really harmful to growth firm level evidence. J. Dev. Econ. 2007, 83, 63–75. [Google Scholar] [CrossRef]
  46. Vo, D.H.; Warkentin, M.; Tran, N.P. Examining the effects of national intellectual capital on economic growth: Does digital services trade restrictiveness matter? J. Knowl. Manag. 2025, 29, 281–300. [Google Scholar] [CrossRef]
  47. Ma, S.; Wang, Y.; Liu, K. The impact of digital trade barriers on the quality of China’s Cross-border e-commerce export products: A new interpretation from long-tail market demand. J. Macro-Qual. Res. 2025, 13, 1–15. [Google Scholar]
  48. Xu, X.; Sun, M. The impact of firm internationalisation on innovation persistence: The moderating effect of executives’ overseas background. Eur. J. Innov. Manag. 2025, 28, 5128–5150. [Google Scholar] [CrossRef]
  49. Ma, H.; Kang, C. The impact of U.S.-style digital trade rules on digital services trade between China and CPTPP member countries. Technol. Soc. 2025, 83, 103040. [Google Scholar] [CrossRef]
  50. Gong, Y.; Li, X. Designing boundary resources in digital government platforms for collaborative service innovation. Gov. Inf. Q. 2023, 40, 101777. [Google Scholar] [CrossRef]
  51. Guo, L.; Tang, M.; Wu, Y.; Bao, S.; Wu, Q. Government-led regional integration and economic growth: Evidence from a quasi-natural experiment of urban agglomeration development planning policies in China. Cities 2025, 156, 105482. [Google Scholar] [CrossRef]
  52. Zhang, B.; Wang, Y.; Chen, Y.; Zhou, J. Digital transformation by firms and the cleanliness of China’s export products. Energy Econ. 2024, 134, 1075. [Google Scholar] [CrossRef]
  53. Qiang, H.; Qi, J.; Liu, J. Digital trade barriers, integration of RTA regulations, and upgrading of the service industry value chain. Word Econ. Stud. 2024, 43, 34–48+135–136. [Google Scholar]
  54. Falavigna, G.; Ippoliti, R.; Ramello, G.B. Financial constraints, institutional quality and import trade flows: An empirical investigation on Italian manufacturing SMEs. Int. Bus. Rev. 2025, 34, 102453. [Google Scholar] [CrossRef]
  55. Nguyen, T.; Song, G.; Zhao, S.; Zuo, C. Market competition and digital transformation in firms. Financ. Res. Lett. 2025, 73, 106684. [Google Scholar] [CrossRef]
  56. Yu, H.; Yao, L. The impact of digital trade regulation on the manufacturing position in the GVC. Econ. Model. 2024, 135, 106712. [Google Scholar] [CrossRef]
  57. Zhang, H.; Kim, H.; Moon, S. The effects of data restriction policies and institutions on digital financial service and trade. Emerg. Mark. Financ. Trade 2025, 61, 2745–2762. [Google Scholar] [CrossRef]
  58. Ferronato, N.; Rada, E.C.; Portillo, M.A.G.; Cioca, L.I.; Ragazzi, M.; Torretta, V. Introduction of the circular economy within developing regions: A comparative analysis of advantages and opportunities for waste valorization. J. Environ. Manag. 2019, 230, 366–378. [Google Scholar] [CrossRef]
  59. Kong, N.; Wang, B.; Zhang, Y.; Zhou, N. How does digital technology affect export in services? J. Asian Econ. 2024, 95, 101814. [Google Scholar] [CrossRef]
  60. Li, H.; Lin, X.; Zhang, Z. How does digital finance affect imports, exports and trade balance: Evidence from China. Int. Rev. Econ. Financ. 2025, 99, 104054. [Google Scholar] [CrossRef]
  61. Zhou, N.; Yao, T. The Impact and heterogeneity of cross-border data flow restrictions on digital service imports. Int. Bus. 2021, 35, 1–15. [Google Scholar]
  62. Aligishiev, Z.; Blotevogel, R. No quick fix: The recovery and resilience plan and external position in Greece. Econ. Model. 2025, 115, 107186. [Google Scholar] [CrossRef]
  63. Jiang, M.; Jia, P. Does the level of digitalized service drive the global export of digital service trade? Evidence from global perspective. Telemat. Inform. 2022, 72, 101853. [Google Scholar] [CrossRef]
  64. Jon, W.; Yang, W. Mapping South Korea’s digital asset regulatory landscape: From criminal code to the recently implemented virtual asset user protection act. Comput. Law Secur. Rev. 2025, 57, 106140. [Google Scholar] [CrossRef]
  65. Ren, Q.; Du, J. Harmonizing innovation and regulation: The EU Artificial Intelligence Act in the international trade context. Comput. Law Secur. Rev. 2024, 54, 106028. [Google Scholar] [CrossRef]
  66. Ringvold, K.; Foss, N.J.; Elter, F. How do established multinational enterprises replicate digital business models across borders? The case of Telenor. J. Int. Manag. 2025, 31, 101294. [Google Scholar] [CrossRef]
  67. Ali, Z.A.; Hasan, R.; Alsanad, A.; Alhogail, A.; Gumaei, A.H. Multiple knowledge depiction of digital twin-driven circular economy: Concepts, integrated advanced technologies, triple bottom line of smart construction, and exploratory case studies. J. Eng. Res. 2025, 14, 836–857. [Google Scholar] [CrossRef]
  68. Arakpogun, E.O.; Whalley, J.; Wanjiru, R.; Elsahn, Z.; Kummitha, R.K.R. Bridging the digital divide in Africa via universal service funds: An institutional theory perspective. Inf. Technol. People 2023, 36, 126–154. [Google Scholar] [CrossRef]
  69. Liang, H.; Qin, Q. Manufacturing digitalization, digital trade barriers and the influence of export enterprises. Econ. Dyn. 2023, 7, 47–68. [Google Scholar]
  70. Bhattacharyya, J.; Subrahmanya, M.H.B. Determinants of a digital start-up’s access to VC financing in India: A signaling theory perspective. Technol. Forecast. Soc. Change 2024, 207, 123631. [Google Scholar] [CrossRef]
  71. Jin, H.J.; Kim, J.-C.; Su, Q. Economic freedom and market resilience: Safeguarding liquidity in times of crisis. J. Multinatl. Financ. Manag. 2025, 79, 100918. [Google Scholar] [CrossRef]
  72. Li, Z.; Wang, Y.; Bai, T. International digital trade and synergetic control of pollution and carbon emissions: Theory and evidence based on a nonlinear framework. J. Environ. Manag. 2025, 376, 124450. [Google Scholar] [CrossRef] [PubMed]
  73. van den Broek, T.; van Veenstra, A.F. Governance of big data collaborations: How to balance regulatory compliance and disruptive innovation. Technol. Forecast. Soc. Change 2018, 129, 330–338. [Google Scholar] [CrossRef]
  74. Ferracane, M.F.; van der Marel, E. Patterns of trade restrictiveness in online platforms: A first look. World Econ. 2020, 43, 2932–2959. [Google Scholar] [CrossRef]
Figure 1. Top 10 economies in imports of digitally delivered services globally, 2019–2023 (in US$ billions). Data source: World Trade Organization.
Sustainability 18 05338 g001
Figure 2. Theoretical framework.
Sustainability 18 05338 g002
Figure 3. Spatial distribution of economic freedom in 2023 based on a sample size of 87. Data source: The Heritage Foundation.
Sustainability 18 05338 g003
Figure 4. Spatial distribution of worldwide governance indicators in 2023 based on a sample size of 87. Data source: World Bank WGI.
Sustainability 18 05338 g004
Table 1. Descriptive statistics of variables.
Type of VariableVariableObsMeanSdMinMax
Explained variableDdsi7838.1752.3922.16712.840
Explanatory variableDstri7830.1720.1350.0000.632
Mediating variableFf78364.6869.69233.10089.700
Moderating variableWgi7830.2780.869−1.3321.852
Control variablesFdi7833.93719.293−360.35252.92
Ofdi7832.10919.166−360.35252.92
Ce7833.7512.114−1.8119.451
Urb78364.30721.49216.967100.00
Inf78364.58127.0183.700100.00
Table 2. Baseline regression result.
Ddsi
(1)(2)(3)(4)
Dstri3.189 ***
(0.587)
0.939 ***
(0.420)
2.399 ***
(0.474)
0.845 **
(0.422)
Dstri2−4.896 ***
(0.952)
−1.716 ***
(0.676)
−3.889 ***
(0.769)
−1.487 **
(0.682)
Fdi 0.005 **
(0.003)
0.006 ***
(0.002)
Ofdi −0.005 **
(0.003)
−0.006 ***
(0.002)
Ce −0.314 ***
(0.067)
−0.061
(0.062)
Urb 0.084 ***
(0.012)
0.015
(0.011)
Inf 0.008 ***
(0.001)
−0.004 ***
(0.001)
Cons7.861 ***
(0.061)
7.932 ***
(0.046)
3.247 ***
(0.704)
7.399 ***
(0.675)
Control variablesNoNoYesYes
Country fixedNoYesNoYes
Year fixedNoYesNoYes
Observations783783783783
R20.04080.53820.38580.5498
Note: ** and *** indicate statistical significance at the 5%, and 1% levels, respectively; the standard errors of the estimated coefficients are presented in parentheses.
Table 3. Robustness test.
Variable(1)
Explanatory Variable Replacement
DSTRIHa
(2)
Explanatory Variable Replacement
DSTRIHc
(3)
Data Undertail by 1%
(4)
Random Effect
(5)
Omitted Variables
Dstri1.548 **
(0.706)
1.003 **
(0.440)
0.844 **
(0.405)
2.181 ***
(0.525)
1.079 **
(0.425)
Dstri2−3.015 **
(1.253)
−1.908 ***
(0.727)
−1.444 **
(0.651)
−3.412 ***
(0.854)
−2.011 ***
(0.702)
Cons7.388 ***
(0.691)
7.573 ***
(0.700)
7.472 ***
(0.675)
2.772 ***
(0.334)
7.553 ***
(0.767)
Control variablesYesYesYesYesYes
Country fixedYesYesYesNoYes
Year fixedYesYesYesNoYes
Observations765765783783739
R20.54600.54690.53830.68710.5861
Note: ** and *** indicate statistical significance at the 5% and 1% levels, respectively. Standard errors are reported in parentheses.
Table 4. Endogeneity test.
Variable(1)
The First Lag of Digital Trade Barriers
(2)
The Second Lag of Digital Trade Barriers
(3)
The Mean Value of Digital Trade Barriers of All Other Countries
Dstri1.909 ***
(3.120)
4.306 ***
(1.328)
34.990 ***
(12.605)
Dstri2−3.098 ***
(0.915)
−6.602 ***
(1.957)
−38.289 **
(14.936)
Cons9.156 ***
(0.971)
9.541 ***
(1.343)
−6.635
(8.850)
Kleibergen–Paap rk Wald F33.3669.8097.736
Kleibergen–Paap rk LM52.035
[0.0000]
18.700
[0.0000]
3.845
[0.0499]
Control variableYesYesYes
Country fixedYesYesYes
Year fixedYesYesYes
N696609783
Note: ** and *** indicate statistical significance at the 5% and 1% levels, respectively. Standard errors are reported in parentheses.
Table 5. Country heterogeneity test.
VariableThe Scale of Digital Services ImportsLevels of Economic Development
(1)
Small-Scale Group
(2)
Large-Scale Group
(3)
Emerging Markets and Developing Economies
(4)
Developed Economies
Dstri0.579
(0.726)
2.033 ***
(0.433)
0.733
(0.587)
1.914 *
(0.998)
Dstri2−0.464
(1.172)
−4.069 ***
(0.707)
−1.250
(0.903)
−7.010 *
(4.222)
Cons4.502 ***
(1.013)
9.357 ***
(0.898)
3.963 ***
(0.732)
17.924 ***
(1.889)
Control variablesYesYesYesYes
Country fixedYesYesYesYes
Year fixedYesYesYesYes
Observations369414495288
R20.45690.76430.43860.8177
Note: * and *** indicate statistical significance at the 10% and 1% levels, respectively. Standard errors are reported in parentheses.
Table 6. Heterogeneity test of digital services industries.
Variable(1)
SFI
(2)
SGI
(3)
SHI
(4)
SI1I
(5)
SI2I
(6)
SI3I
(7)
SJI
(8)
SKI
Dstri0.812
(2.095)
2.220
(2.161)
5.732 **
(2.235)
4.729 ***
(0.936)
−6.377 *
(3.406)
0.198
(2.837)
−0.509
(1.985)
4.516
(3.285)
Dstri2−4.417
(3.383)
−9.008 **
(3.491)
−0.511
(3.610)
−6.482 ***
(1.511)
5.809
(5.500)
−2.719
(4.583)
1.065
(3.206)
−12.966 **
(5.306)
Cons16.640 ***
(3.347)
12.710 ***
(3.454)
12.048 ***
(3.572)
1.300
(1.495)
23.732 ***
(5.442)
3.466
(4.534)
3.355
(3.173)
27.668 ***
(5.250)
Control variablesYesYesYesYesYesYesYesYes
Country fixedYesYesYesYesYesYesYesYes
Year fixed YesYesYesYesYesYesYesYes
Observations783783783783783783783783
R20.07440.08390.09770.06110.16430.12440.10520.0989
Note: *, **, and *** indicate statistical significance at the 10%, 5%, and 1% levels, respectively. Standard errors are reported in parentheses.
Table 7. Heterogeneity test in the digital trade barriers.
VariableDdsi
(1)(2)(3)(4)(5)
Dstrin0.381
(0.500)
4.889 ***
(1.851)
−3.689
(2.339)
1.284
(3.604)
7.069 ***
(1.273)
Dstrin2−1.358
(1.278)
−41. 100 **
(18.321)
36.946
(56.726)
−14.554
(38.883)
−57.337 ***
(11. 188)
Cons7.601 ***
(0.673)
7.176 ***
(0.667)
7.467 ***
(0.659)
7.456 ***
(0.663)
6.695 ***
(0.656)
Control variablesYesYesYesYesYes
Country fixed effectsYesYesYesYesYes
Year fixed
effects
YesYesYesYesYes
Observations783783783783783
R20.54770.55120.54890.54670.5668
Note: ** and *** indicate statistical significance at the 5% and 1% levels, respectively. Standard errors are reported in parentheses. The explanatory variables Dstri for columns (1) to (5) are respectively infrastructure connectivity (Dstri1), electronic transactions (Dstri2), payment systems (Dstri3), intellectual property rights (Dstri4), and other barriers (Dstri5).
Table 8. Mediating effect test.
Variable(1)
Ef
(2)
Ddsi
(3)
Ddsi
Dstri17.993 ***
(5.489)
0.710 *
(0.424)
Dstri2−18.218 **
(8.865)
−1.351 **
(0.681)
Ef 0.008 ***
(0.003)
0.007 **
(0.003)
Cons77.004 ***
(8.772)
6.822 ***
(0.698)
6.824 ***
(0.709)
Control variablesYesYesYes
Country fixed YesYesYes
Year fixed YesYesYes
Observations783783783
R20.14350.55130.5540
Note: *, **, and *** indicate statistical significance at the 10%, 5%, and 1% levels, respectively. Standard errors are reported in parentheses.
Table 9. Mediation effect test of different dimensions of economic freedom.
Variable(1)
Ef1
(2)
Ddsi
(3)
Ddsi
(4)
Ef2
(5)
Ddsi
(6)
Ddsi
(7)
Ef3
(8)
Ddsi
(9)
Ddsi
(10)
Ef4
(11)
Ddsi
(12)
Ddsi
Dstri8.170
(11.370)
0.794 *
(0.417)
53.339 ***
(14.555)
0.728 *
(0.426)
−7.200
(6.410)
0.847 **
(0.423)
9.410
(5.954)
0.876 **
(0.423)
Dstri220.610
(18.364)
−1.615 **
(0.674)
−87.816 ***
(23.507)
−1.295 *
(0.688)
20.448 **
(10.352)
−1.494 **
(0.685)
−6.883
(9.616)
−1.510 **
(0.682)
Ef 0.006 ***
(0.001)
0.006 ***
(0.001)
0.002 **
(0.001)
0.002 **
(0.001)
−0.001
(0.003)
0.001
0.003)
−0.003
(0.003)
−0.003
(0.003)
Cons82.789 ***
(18.170)
6.890 ***
(0.662)
6.886 ***
(0.676)
84.008 ***
(23.259)
7.258 ***
(0.661)
7.216 ***
(0.680)
32.718 ***
(10.243)
7.493 ***
(0.662)
7.389 ***
(0.680)
76.658 ***
(9.515)
7.754 ***
(0.692)
7.656 ***
(0.706)
Control variablesYesYesYesYesYesYesYesYesYesYesYesYes
Country fixed YesYesYesYesYesYesYesYesYesYesYesYes
Year fixed YesYesYesYesYesYesYesYesYesYesYesYes
Observations783783783783783783783783783783783783
R20.86190.55800.56230.81740.55000.55230.10910.54660.54980.14560.54750.5508
Note: *, **, and *** indicate statistical significance at the 10%, 5%, and 1% levels, respectively. Standard errors are reported in parentheses. Columns (1)–(3) employ rule of law as the mediating variable; columns (4)–(6) employ government size; columns (7)–(9) employ regulatory efficiency; and columns (10)–(12) employ open markets.
Table 10. Moderating effect based on institutional environment.
VariableDdsi
(1)(2)(3)(4)(5)(6)
Dstri0.939 ***
(0.420)
0.845 **
(0.422)
0.910 *
(0.492)
0.865 *
(0.490)
Dstri2−1.716 ***
(0.676)
−1.487 **
(0.682)
−2.043 **
(1.032)
−1.898 *
(1.026)
Wgi 0.299 ***
(0.083)
0.308 ***
(0.083)
0.208 **
(0.103)
0.239 **
(0.103)
Dstri × Wgi 1.146 **
(0.471)
0.908 *
(0.473)
Dstri2 × Wgi −2.048 *
(1.046)
−1.741 *
(1.043)
Cons7.932 ***
(0.046)
7.399 ***
(0.675)
7.916 ***
(0.032)
7.515 ***
(0.649)
7.873 ***
(0.064)
7.493 ***
(0.668)
Control variablesNoYesNoYesNoYes
Country fixed effectsYesYesYesYesYesYes
Year fixed effectsYesYesYesYesYesYes
Observations783783783783783783
R20.53820.54980.54230.55560.55130.5615
Note: *, **, and *** indicate statistical significance at the 10%, 5%, and 1% levels, respectively. Standard errors are reported in parentheses. Control variables include FDI, OFDI, CE, URB, and INF as specified in Section 3.2.5.
Table 11. Moderating effect based on different dimensions of institutional environment.
VariableDdsi
(1)(2)(3)(4)(5)(6)
Dstri0.875 **
(0.424)
0.869 *
(0.449)
0.762 *
(0.435)
0.566
(0.495)
0.661
(0.488)
0.193
(0.570)
Dstri2−1.936 **
(0.755)
−1.982 ***
(0.760)
−1.057
(0.801)
−1.349
(0.865)
−1.333
(0.929)
0.367
(1.351)
Wgin0.056
(0.072)
0.189 **
(0.073)
0.041
(0.059)
−0.049
(0.085)
0.034
(0.083)
0.017
(0.072)
Dstri × Wgin0.596
(0.463)
0.878 **
(0.446)
0.647
(0.400)
1.224 ***
(0.453)
0.753 *
(0.444)
0.556
(0.430)
Dstri2 × Wgin−1.460
(0.953)
−2.253 **
(0.883)
−0.354
(0.723)
−2.034 ***
(0.722)
−1.195
(0.962)
0.078
(0.922)
Cons7.522 ***
(0.676)
7.759 ***
(0.669)
7.368 ***
(0.671)
7.453 ***
(0.674)
7.568 ***
(0.677)
7.330 ***
(0.673)
Control variablesYesYesYesYesYesYes
Country fixedYesYesYesYesYesYes
Year fixed YesYesYesYesYesYes
Observations783783783783783783
R20.55300.56610.55970.55600.55390.5559
Note: *, **, and *** indicate statistical significance at the 10%, 5%, and 1% levels, respectively. Standard errors are reported in parentheses. The moderating variables Wgin in columns (1)–(6) are respectively corruption control (Wgi1), government efficiency (Wgi2), political stability and the elimination of violent terrorism (Wgi3), regulatory quality (Wgi4), the level of law rule (Wgi5), and discourse power and accountability (Wgi6).
Disclaimer/Publisher’s Note: The statements, opinions and data contained in all publications are solely those of the individual author(s) and contributor(s) and not of MDPI and/or the editor(s). MDPI and/or the editor(s) disclaim responsibility for any injury to people or property resulting from any ideas, methods, instructions or products referred to in the content.