Article

Municipal Irrigation Management for Urban Green Infrastructure: Integrating Operational Data, Evapotranspiration and Intervention Prioritisation

by
Nataliia Zonova
1,2,
Luis Miguel dos Santos Costa
1,2,
João Monteiro
3,4,* and
Eduardo Natividade-Jesus
2,3
1
Municipality of Coimbra, 3000-300 Coimbra, Portugal
2
Coimbra Institute of Engineering, Polytechnic University of Coimbra, 3045-093 Coimbra, Portugal
3
Institute for Systems Engineering and Computers of Coimbra (INESCC), 3030-290 Coimbra, Portugal
4
Polytechnic School of Technology and Management of Oliveira do Hospital, Polytechnic University of Coimbra, 3400-124 Oliveira do Hospital, Portugal
*
Author to whom correspondence should be addressed.
Sustainability 2026, 18(11), 5335; https://doi.org/10.3390/su18115335
Submission received: 28 April 2026 / Revised: 15 May 2026 / Accepted: 22 May 2026 / Published: 26 May 2026

Abstract

Urban drought pressure is increasing the operational risk and cost of maintaining municipal green infrastructure. Irrigation is still widely managed through fixed routines and fragmented information. To address this challenge, the study develops an integrated operational analysis by combining water consumption records, maintenance data and a GIS inventory for twenty municipal green spaces. System characterisation and performance screening were carried out using hourly meter readings to distinguish typical scheduled irrigation peaks from non-standard consumption patterns. To move from monitoring to control, irrigation needs were estimated using evapotranspiration (ET0) and a garden-coefficient logic adapted to urban planting conditions and compared with measured consumption. The comparison indicates a potential reduction of 29–61% through improved scheduling and system adjustment. Based on the diagnosis, technical intervention scenarios were defined and assessed using techno-economic metrics, including ground-cover redesign and Mediterranean-adapted planting strategies. To support implementation, options were organised into intervention priorities using a multicriteria tool that balances water savings, costs and feasibility under municipal operations. Coimbra, Portugal is used as a case study, and a pilot application in a city garden, supported by 797 user surveys, clarifies practical constraints for scaling beyond isolated pilots. Turf-free scenarios indicate a 53.4% reduction in water use and a 60.5% reduction in operational costs, with a payback period below three years. The results highlight the potential of data-driven irrigation management to support more resilient, cost-effective and water-efficient municipal green infrastructure across diverse urban contexts.

1. Introduction

Water constitutes one of the main limiting factors of urban sustainability. Although essential for life and development, the availability of accessible freshwater at the surface is very low; only a residual fraction of the planet’s total water is found in surface waters (rivers and lakes), on the order of 10−2% of the global volume [1]. This limitation is exacerbated by the unequal distribution of resources and by demographic and environmental pressures that intensify demand and degrade water quality [2,3,4,5].
In cities, pressure on water resources rarely acts in isolation. Climatic variability and the increased frequency of dry periods intensify scarcity and increase the sensitivity of urban systems [6]. In parallel, urban expansion and densification [2,3,4,5] contribute to greater hydrological risk and the exacerbation of phenomena such as the urban heat island, with recognised impacts on health and well-being [7,8,9,10]. Especially in the Mediterranean climate, this combination of water seasonality, prolonged summers, and high evapotranspiration [11,12] reinforces the dependence on irrigation in urban green spaces and increases the risk of a mismatch between observed consumption and actual water requirements.
Within this context, urban green spaces cannot be regarded merely as aesthetic elements. When well-conceived and well-managed [13], they contribute to thermal comfort, environmental quality, and the everyday use of public space, while also potentially supporting health and well-being goals [14,15]. From the perspective of the urban water cycle, vegetation and associated solutions can reduce peak runoff and support a more integrated management of urban precipitation through processes such as interception, infiltration, and evapotranspiration [16,17].
Despite this potential, the multifunctionality of green spaces (e.g., health, thermal comfort, air quality, and acoustic environment) [9,14,15,16,17,18,19,20,21,22,23] rarely translates into integrated management routines at the municipal level [24,25,26,27]. As a result, irrigation management frequently relies on fixed routines and disconnected information sources [28,29]. Metered water consumption data, maintenance records, and spatial inventory data may exist, but without operational integration that allows for: (i) distinguishing consumption compatible with scheduled irrigation from anomalous profiles; (ii) relating observed consumption to an estimate of water requirements; and (iii) comparing spaces and supporting intervention decisions in a consistent and transparent manner.
This operational limitation is reinforced, in many municipalities, by the dependence on the public potable water supply for irrigation [30,31]. Alternatives such as the reuse of treated water are technically viable but still have limited uptake in routine operations. In Portugal, only 0.9% of treated water was reused in 2023 and 14% of that volume reached external users, which suggests significant room for progress in non-potable uses [32].
In recent years, irrigation technology [33,34,35,36] has become increasingly prominent in urban management. In Portugal, 69% of local authorities use technologies associated with smart cities and 24.7% report smart irrigation [37]. Nevertheless, the presence of data does not, by itself, guarantee effective decisions, as the challenge of transforming fragmented information into comparable prioritization criteria within the municipal context remains.
A central step in this process is to establish a plausible technical reference for water requirements against which observed consumption can be evaluated. To this end, methods based on reference evapotranspiration (ET0) and crop coefficients, framed within the FAO-56 method of the Food and Agriculture Organization (FAO), constitute the most widely used technical basis for estimating vegetation water requirements [38]. However, the direct application of agricultural coefficients to urban green spaces is limited by structural heterogeneity, the coexistence of vegetation layers, and microclimatic variations. To respond to this complexity, landscape/garden coefficient approaches, such as the WUCOLS system, have been proposed, which adjust ET0 to specific urban conditions [39,40,41].
Sustainable urban water management cannot, however, remain confined to irrigation. The articulation between irrigation, soil, and stormwater—especially in impervious urban environments—influences local water availability and the performance of green spaces [7,42].
In this context, solutions such as Sustainable Drainage Systems (SuDS) reinforce a decentralised approach based on infiltration, retention, and evapotranspiration and can, when applicable, support non-potable uses, including irrigation [43,44,45].
Despite the availability of technology, estimation methods, and nature-based solutions, operational decision-making in urban irrigation frequently remains fragmented [28,29,31]. This disconnection becomes particularly critical in contexts of budgetary constraints and increasing water costs, where poorly calibrated decisions can translate into additional burdens for municipal management [31,32].
Recent literature has addressed this problem from different perspectives. Some studies focus on the technical performance of irrigation systems in urban parks or specific green spaces and the evaluation of their operational efficiency, analysing consumption patterns, equipment operation, and adjustment opportunities in contexts of water scarcity [28,29]. Other works explore the role of monitoring and smart irrigation technologies, as well as the technical and institutional constraints to their implementation in cities [31,33,34,35,36]. In parallel, a third line of research develops methods to estimate urban vegetation water requirements based on reference evapotranspiration (ET0) and adjusted landscape coefficients, seeking to adapt agronomic standards to the structural heterogeneity of urban green spaces [39,40,41,46].
Together, these studies demonstrate significant potential for improving urban irrigation efficiency but remain largely centred on individual components of the system [28,31,46]. Consequently, the diagnosis of measured consumption, the biophysical estimation of water requirements, and the selection of interventions generally continue to be treated separately. Even when using operational data or monitoring technologies, they rarely explicitly articulate consumption screening, comparison with ET0-estimated requirements, and municipal prioritisation of actions within a single analytical framework.
The sustainable management of green spaces presupposes ecological, economic, and functional integration; however, this articulation does not always translate into clear operational procedures at the municipal level [27]. Additionally, aspects such as user perception, space functions, and maintenance expectations condition the acceptability of these measures [47,48], but their incorporation into the decision-making process tends to be episodic or limited to consultative formats with little influence on the final decision [49,50]. The challenge, therefore, lies not only in the technical integration of data but in the institutional capacity to operationalise that integration into prioritised and sustainable decisions. It is precisely this transition—from fragmented monitoring to a structured and decision-oriented control—that the present work seeks to operationalise.
In this context, the objective of this work is to develop and test an operational workflow oriented toward municipal application, linking measured consumption, estimated requirements, and intervention decisions. In particular, the study seeks to: (i) identify consumption patterns compatible with scheduled irrigation and flag anomalous profiles; (ii) estimate water requirements based on ET0 and coefficients adjusted to urban conditions; (iii) compare estimated requirements with observed consumption to quantify plausible margins for improvement; and (iv) structure and prioritize intervention options based on operational and techno-economic criteria.
The study’s main contributions are: (1) the proposal and testing of a replicable operational workflow that integrates three municipal sources (consumption, maintenance, and GIS inventory) into a single operational framework; (2) screening of consumption profiles to identify anomalies; (3) estimation of requirements via ET0 with adaptation to urban conditions; (4) translation of vegetation cover scenarios into comparable metrics of annual cost and water consumption; and (5) a multi-criteria prioritization framework to support decision-making and intervention planning.

2. Materials and Methods

2.1. Study Area and Scope

The study was developed within the context of municipal management of urban green spaces in the city of Coimbra (Portugal), a municipality with a Mediterranean climate [51] characterised by marked water seasonality [52,53,54,55,56,57], where irrigation constitutes a relevant operational component during the dry period. The study area is located in the city centre, in a consolidated area with high population density, a strong presence of urban infrastructure, and fragmented green spaces, which imposes operational constraints typical of medium-sized Mediterranean cities.
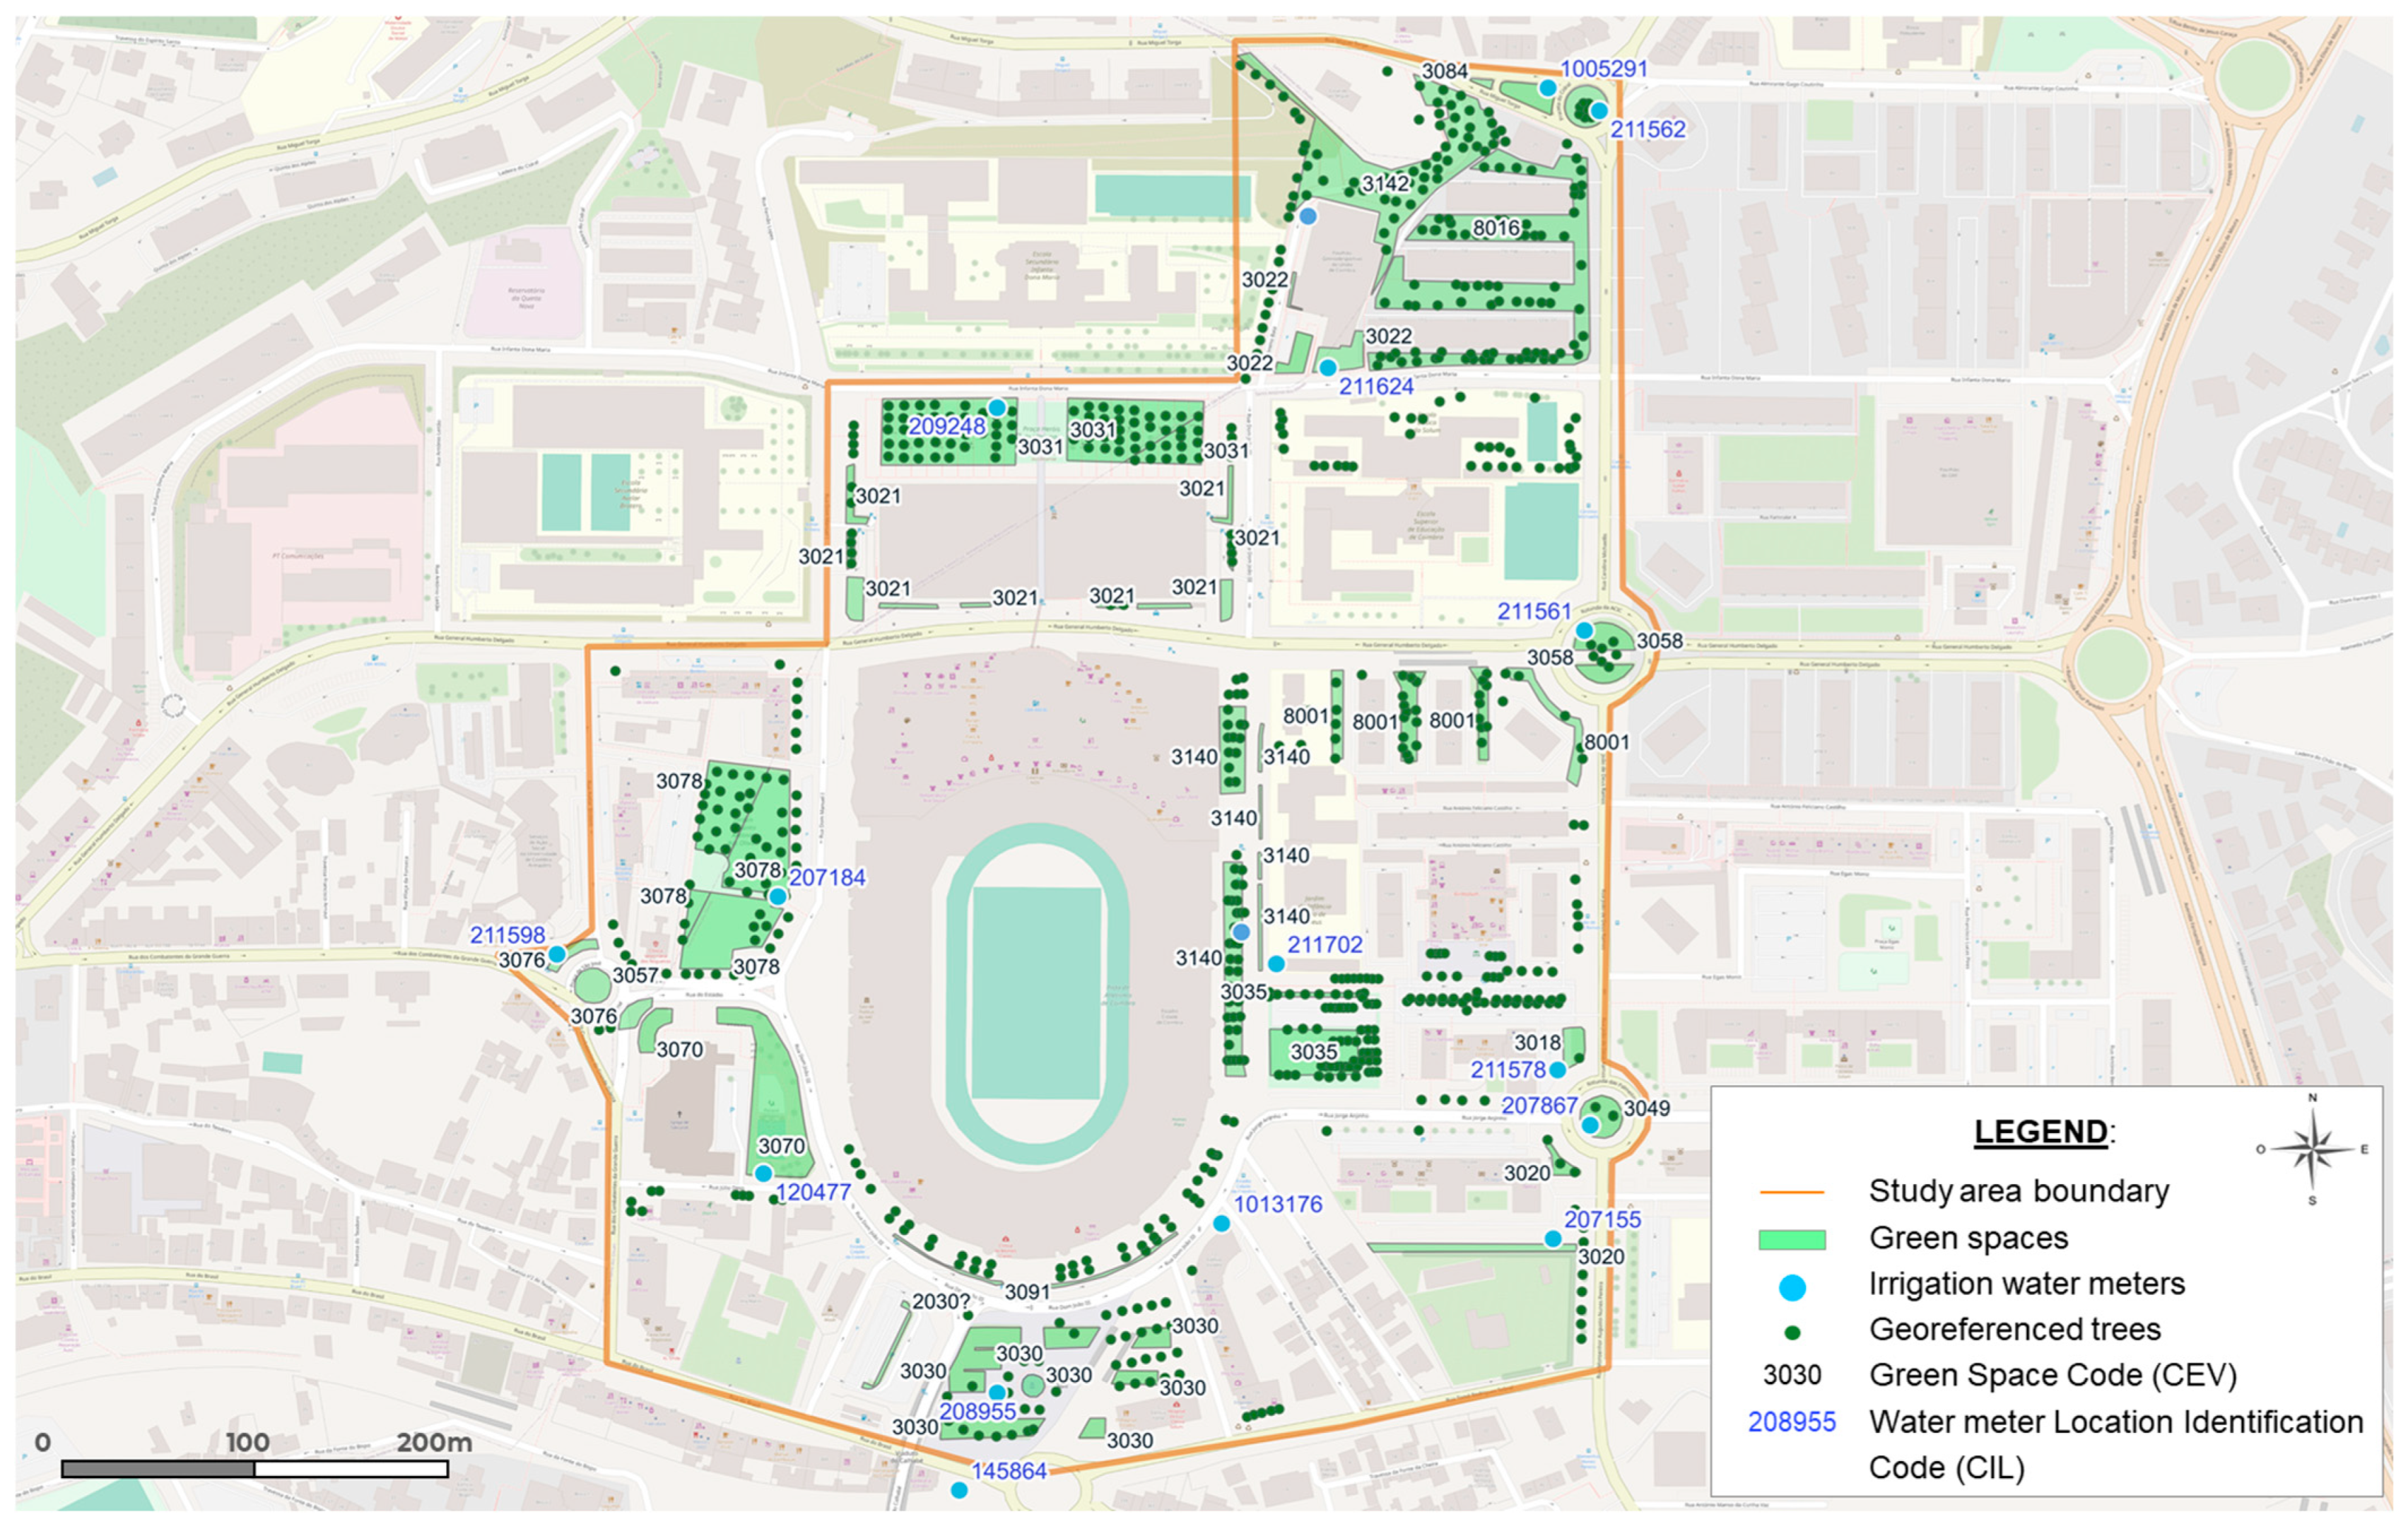
The analysis focused on 20 municipal green spaces of different use types, totalling 35,412 m2 of green areas with associated irrigation. These spaces are associated with 12 irrigation meters with telemetry, with 1:N relationships between meter and green space in some cases. A detailed list of the analysed green spaces, associated meters, irrigated areas, and irrigation-system typologies is provided in Table A1 (Appendix A.1). The spatial configuration of the analysed green spaces and their respective irrigation meters are presented in Figure 1.
The spaces were selected based on three cumulative criteria: (i) the existence of a dedicated meter or a clear association with an irrigation meter; (ii) the availability of a continuous hourly consumption series for 2019–2024; and (iii) spatial delimitation that could be consolidated in a GIS environment and was compatible with the observed hydraulic configuration.
For the purposes of analysis, the spaces were decomposed into approximately 60 hydrozones with relatively homogeneous coverage and irrigation conditions. The delimitation considered dominant typology, solar exposure, and emission system, being validated in situ and, when available, based on existing irrigation projects.
The Solum Garden, identified as green space CEV 3035 (Figure 1), was used as a detailed application case for the method. Social evidence collected through a user survey (n = 797) was used exclusively to contextualise the feasibility of implementing the proposed measures, without influencing the technical parameters of the model.

2.2. Data Sources and Integration

The methodology integrates three municipal data sources: water consumption, maintenance records, and GIS inventory. This integration was structured within a coherent analytical framework based on a unique identifier for each green space, aligned with municipal codes, ensuring consistent correspondence between tables, geometries, and time periods.
Consumption data originate from 12 m with hourly resolution for the period 2019–2024. The accumulated hourly readings were provided via telemetry and converted into incremental volumes (m3) by calculating the difference between consecutive records. Intervals with prolonged recording failures and readings inconsistent with cumulative series were excluded. When a meter served multiple green spaces, consumption was initially analysed at an aggregate level for screening, with spatial interpretation supported by field verification and by the functional configuration of the irrigation systems.
Maintenance records for 2021–2024 include interventions in irrigation systems, vegetation maintenance operations, plant replacements, refurbishments, and relevant changes in the functional configuration of green spaces. These records were used as an operational context for the interpretative validation of consumption profiles and the technical framing of scenarios, rather than being treated as a quantitative variable in the detection procedure.
The GIS inventory used in the analysis includes the delimitation of green spaces, the estimation of irrigated areas, the characterisation of land cover typologies relevant for parameterisation (including mixed classes where applicable), and operational attributes for linking to consumption and maintenance, including the location and identification of meters. Since the pre-existing inventory presented geometric inconsistencies and attribute gaps, a consolidation process was conducted involving an individual review per space, verification of the correspondence between spatial boundaries and associated meters, and normalisation of essential attributes (maintenance area, irrigated area, and dominant typology).
For the techno-economic assessment of the intervention scenarios, unit values for implementation and maintenance costs per cover typology were used, as well as the municipal water tariffs in effect during the analysis period, allowing for the estimation of annual costs and payback periods.

2.3. Operational Diagnosis of Irrigation Systems

The evaluation of irrigation system performance was based on the analysis of hourly water consumption series to identify operational patterns and operationally relevant deviations. The detailed analysis for anomaly detection and loss estimation focused primarily on the period 2023–2024, with previous years maintained for seasonal context.
The unit of analysis was the irrigation meter, interpreted according to its functional association with green spaces or hydrozones (Section 2.1). For profile framing, the typical nighttime window (00:00–05:00) was used as a reference, corresponding to the dominant practice of scheduled irrigation, without excluding occasional daytime activations associated with new plantings or seasonal adjustments.
Manual programming of controllers, with frequent intra-seasonal reconfigurations, precludes the use of global statistical thresholds (for example, μ ± kσ), since such an approach would generate a high rate of false positives in non-stationary operational patterns. Thus, a structured visual protocol was adopted, supported by periodic review of the time series and explicit temporal criteria. The classification followed a sequential logic: (i) identification of recurring peaks compatible with scheduled irrigation; (ii) detection of persistent flow outside the expected window; and (iii) distinction between short-duration events and persistent anomalous patterns based on their duration and inter-day recurrence.
The temporal thresholds adopted reflect the typical duration of irrigation cycles observed in the field and were defined conservatively, in order to reduce the risk of misclassifying legitimate activations associated with seasonal operational adjustments.
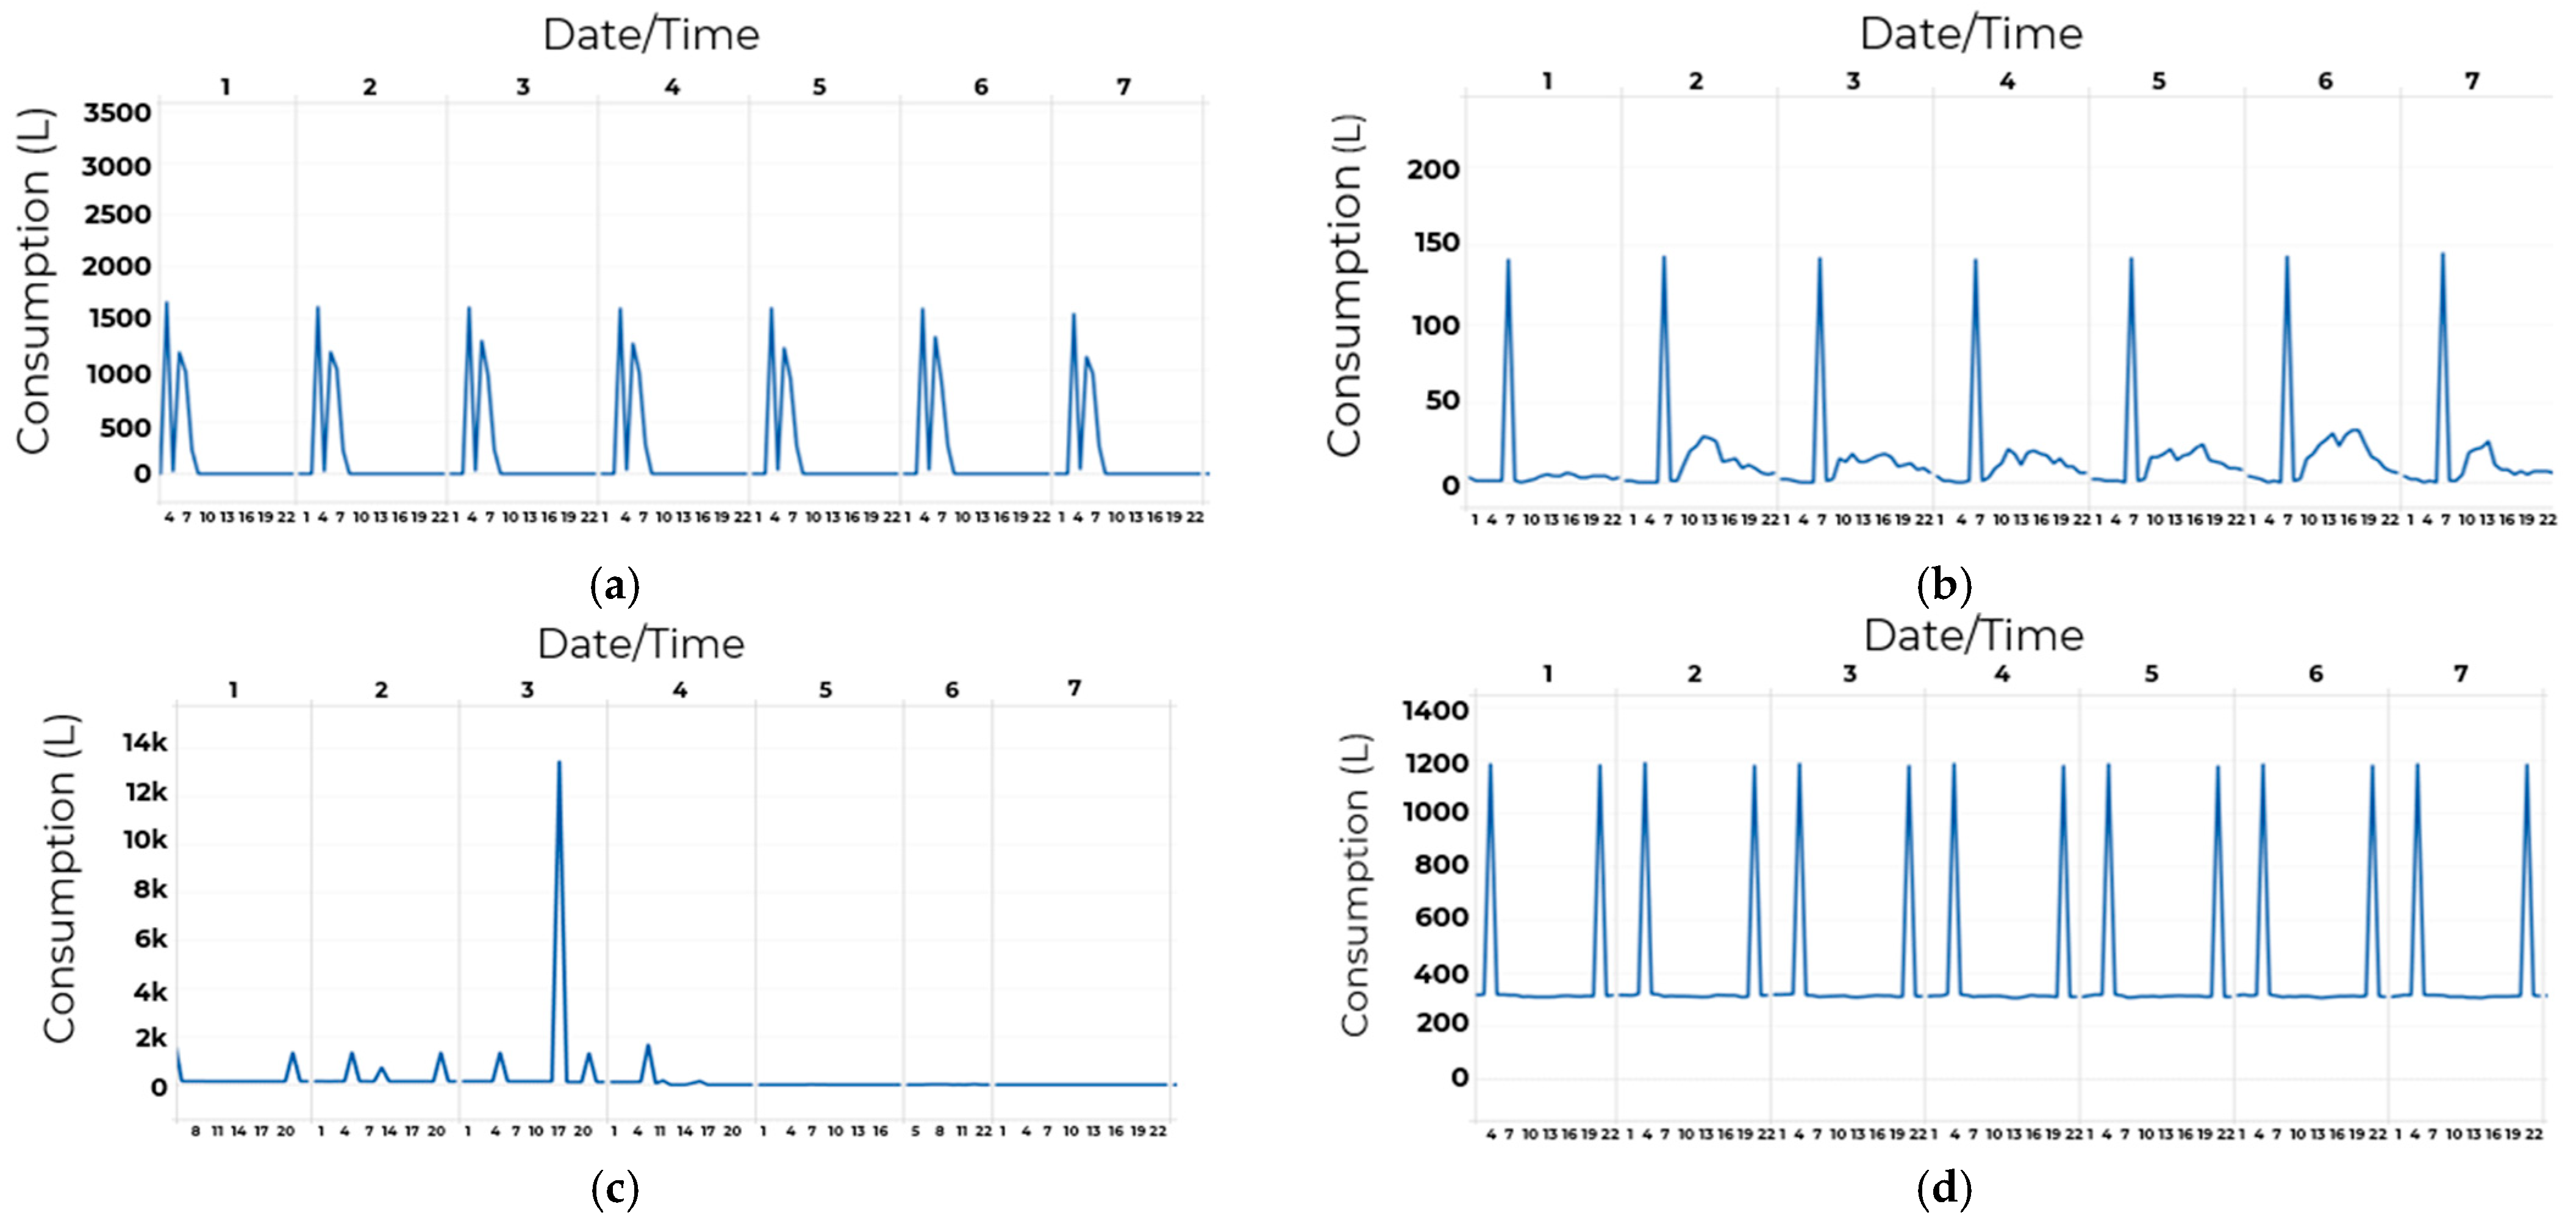
The profiles were analysed through sequential daily review and inter-monthly comparison, being classified into four typologies (Figure 2): scheduled irrigation, continuous off-schedule consumption, occasional bursts, and prolonged bursts, using graphical analysis in Tableau Desktop (Tableau Software LLC, Seattle, WA, USA).
The classification considered temporal position, duration, and inter-day persistence. Scheduled irrigation was identified by recurring and stable peaks within the defined window, with a consistent pattern on consecutive days. Continuous off-schedule consumption was considered when an hourly flow exceeding the effective meter measurement resolution (increment in litres) occurred outside the nighttime window for ≥6 consecutive hours—a threshold defined to exceed the typical cumulative duration of irrigation cycles observed in the field and to distinguish legitimate activations from persistent flow. Occasional bursts corresponded to events < 24 h, typically manifested as abnormally high peaks during scheduled irrigation cycles (e.g., a damaged sprinkler), with no recurrence the following day and a sudden increase compared to the previous 24 h profile. Prolonged bursts were identified when anomalous consumption persisted for ≥48 consecutive hours or repeated across multiple daily cycles without a pattern compatible with scheduled irrigation, requiring persistence over at least two consecutive cycles to avoid misclassification of one-off operational adjustments.
The protocol was applied consistently to the 12 m included in the study, with weekly iterative review of the profiles and specific reassessment of situations with high losses to confirm temporal consistency; maintenance information and field observations were used only for the interpretive validation of ambiguous cases.
For the estimation of losses, volumes associated with prolonged bursts were aggregated by period and compared with intervals of stable operation of the same meter, which were assumed to be a plausible operational reference for the observed hydraulic configuration. The accumulated difference was considered a potential loss associated with persistent anomalies, using periods of operationally stable functioning as a benchmark.

2.4. Estimation of Irrigation Water Requirements

The estimation of water requirements was adopted as a technical reference tool for the comparative analysis of deviations between observed consumption and plausible consumption in light of climatic and structural conditions. Given that the analysed systems lack design records or sectoral logs of applied volumes, it was not possible to calculate classical hydraulic indicators (e.g., uniformity coefficient or application efficiency). Therefore, the developed procedure aims to establish a coherent technical framework to contextualize the expected range of consumption.
Irrigation requirements were estimated based on reference evapotranspiration (ET0), calculated according to the Penman–Monteith equation (FAO-56) [38], using monthly averages for the period 2015–2024, derived from daily data from the Coimbra automatic weather station (IPMA) [57,58]. To ensure robustness in the monthly aggregation, only months with at least 25 days of valid daily observations were considered (a threshold consistent with climatological completeness control practices) [59]. Whenever there were at least five complete years for a given month, the corresponding observed mean was adopted; in the remaining cases, climatological reference values (CLIMWAT–FAO) were used, as implemented in CROPWAT 8.0 (FAO, Rome, Italy) [60], ensuring temporal continuity of the series.
Given the structural heterogeneity of urban green spaces, the conversion of ET0 into adjusted evapotranspiration was carried out according to the landscape coefficient method associated with WUCOLS (Water Use Classification of Landscape Species) [61], given by (1):
ETc = ET0 × Ke × Kd × Km × Ks,
in which Ke represents the species or dominant stratum coefficient (adopting the higher value in cases of coexistence) [41,61]; Kd adjusts for density or the degree of vegetation cover; Km incorporates the local microclimatic effect; and Ks corresponds to the factor associated with the irrigation strategy [29,38].
In the analysed spaces, Ks was set at a reference value of 0.9 (slight controlled deficit irrigation) and was adjusted only in justified situations. This assumption reflects current municipal practice, which aims for irrigation with a slight water deficit without visible stress. For deciduous species, an additional 20% reduction was applied outside the period of highest water demand, reflecting seasonal phenological variation. The adopted coefficients are systematized in Table A2a–e (Appendix A.2) [41,60,61,62].
The calculations were performed at the level of functional sections (hydrozones), considering dominant typology, irrigation method, and solar exposure, with validation through field observation and comparison with the existing hydraulic configuration. The results were subsequently aggregated at the green space level using a weighted average of the hydrozones for functional comparison with meter-measured consumption.
Effective precipitation (Pe) was incorporated into the estimation of the net irrigation requirement according to Expression (2):
NIR = ETc − Pe,
with Pe estimated by the USDA-SCS method, as implemented in CROPWAT 8.0 (FAO, Rome, Italy) [60]. When Pe ≥ ETc, it was assumed that NIR = 0, with no inter-monthly water storage considered. This option constitutes a simplification consistent with the adopted monthly scale.
The gross requirement was determined according to Expression (3):
NB = NIR/Ef,
where Ef corresponds to the average operational efficiency of the irrigation system, defined by typology (0.75 for sprinklers and sprayers; 0.9 for drip irrigation; 0.5 for manual irrigation), based on specialized technical literature [41,61,62]. These values do not incorporate extraordinary losses associated with bursts or anomalies, which were analysed separately in Section 2.3.
The methodology produces monthly and annual gross requirement estimates compatible with the municipal operational context. The procedure does not consider deep storage, capillary rise, or intra-monthly variations in Ks and Ef, constituting a simplified approximation oriented toward comparative analysis between spaces under real operational constraints.

2.5. Comparison Between Estimated Needs and Observed Consumption

The estimated water requirements were compared with meter-measured consumption, on a monthly and annual scale, with the aim of quantifying relative deviations and identifying operational margins for improvement.
The comparison was performed at the meter level, assuming functional correspondence with the associated green spaces or hydrozones. In cases where the operational diagnosis indicated relatively stable operation, the deviations between estimated gross requirement (NB) and observed consumption were interpreted as potential for programming and sectorization adjustments. In meters with persistent anomaly patterns, the comparison was used only as an indicative reference and was not interpreted as structural inefficiency.
The deviations were expressed in absolute terms (m3) and relative terms (%), subsequently being converted into financial impact based on the municipal water supply tariff in force in 2024 [63]. This step allowed for the technical framing of the consumption–requirement differential and the translation of the hydraulic diagnosis into an economic order of magnitude relevant to municipal management.

2.6. Vegetation Cover and Maintenance Cost Analysis

The analysis of vegetation cover was developed with the objective of explicitly integrating the biophysical and economic dimensions into the municipal decision-making process. The procedure was structured into three stages: (i) typological characterisation of existing vegetation covers, (ii) estimation of annual water requirements by typology, and (iii) quantification of unit costs for maintenance and implementation, allowing for the construction of comparable scenarios.
The characterisation of vegetation composition was based on a dedicated technical survey, analysis of implementation projects, and field verification, classifying the areas into four functional typologies: conventional lawn, biodiverse meadow, shrubs, and inert materials. In cases of mixed composition, water parameterisation was performed through proportional weighting of the area of each typology, avoiding excessive simplifications associated with dominant classification.
For each typology, the annual gross irrigation requirement (NB, m3/m2·year) was estimated based on the methodology described in Section 2.4, as well as the annual water cost per square meter, obtained by applying the municipal tariff in force. Average annual maintenance costs were derived from consolidated municipal operational records (2021–2024), aggregated by typology. Implementation costs (€/m2) were estimated based on market unit values using the CYPE Price Generator (Urban Spaces module, CYPE Ingenieros, S.A., Alicante, Spain) [64], ensuring technical-economic consistency between alternatives.
The results were expressed in €/m2·year and m3/m2·year, allowing for direct comparison between typologies and the construction of combinatorial scenarios for a standardised reference area. This procedure allowed landscape design decisions to be translated into quantifiable metrics of consumption and municipal burden, establishing an objective basis for evaluating structural alternatives under budgetary constraints.

2.7. Definition and Assessment of Intervention Scenarios

Based on the operational diagnosis, the estimation of water requirements, and the technical-economic analysis of the cover typologies, 14 intervention scenarios were defined (Appendix A.3), intended to support municipal decision-making in a structured and comparable manner.
The construction followed a parametric logic, based on four previously characterised typologies: conventional lawn, biodiverse meadow, shrubs, and inert materials, for which the annual gross irrigation requirement, annual water cost, average annual maintenance cost, and unit implementation cost were estimated.
The scenarios were modelled for a reference area of 1000 m2, allowing the effect of the percentage composition of the typologies on annual water consumption, operational costs, and initial investment to be isolated. The values were obtained through proportional weighting of the areas, assuming linear behaviour of the hydraulic and economic parameters.
For each alternative, the simple payback period of the investment was also estimated, calculated as the ratio between the difference in initial investment compared to the reference scenario (100% lawn) and the estimated annual operational savings, without financial discounting.
The scenarios do not constitute specific spatial proposals, but rather analytical instruments designed to test the system’s sensitivity to different vegetation compositions and to quantify, in a transparent manner, the cumulative effects of design choices on water consumption and municipal costs.

2.8. Multicriteria Prioritisation of Interventions

To compare the intervention scenarios under different decision priorities, a multicriteria analysis was conducted. When comparing scenarios against multiple, and often conflicting criteria, a multicriteria method is the appropriate assessment tool [65]. Multicriteria analysis is a decision-support tool that highlights the compromises required for each scenario, rather than providing one objectively superior answer. TOPSIS (Technique for Order of Preference by Similarity to Ideal Solution) was the chosen method. TOPSIS is based on the principle that the best scenario should have the shortest geometric distance from the Positive Ideal Solution and the longest geometric distance from the Negative Ideal Solution. In simpler terms, it ranks the scenarios by measuring how close they are to the ideal solution and how far they are from the worst-case solution across all criteria simultaneously. The result is a rank for each scenario, in a [0, 1] interval scale, with 0 (worst) to 1 (best). Details on the method, including formulas and the calculation procedure, can be found in Triantaphyllou [66].
Within multicriteria methods, TOPSIS was selected due to its transparency and ease of interpretation, which makes it suitable for spatial planning in a municipal context, where decision-making often requires clear and operationally applicable results. Both multicriteria analysis and TOPSIS are widely used in spatial and municipal planning [67,68,69,70,71,72].
From the initial set of 14 scenarios, 8 representative scenarios were selected for multicriteria analysis in order to avoid redundancy and ensure comparability across distinct landscape strategies. These scenarios were evaluated considering different landscaping options with a standardised reference area of 100 m2. Mixed scenarios were evaluated through a weighted interpretation of their components to ensure internal consistency across alternatives.
Eight criteria were considered, covering economic (implementation and water-related costs), operational (maintenance), environmental (biodiversity and infiltration), and functional–perceptual aspects (aesthetic value and functionality). Quantitative values were derived directly from the scenario modelling, while qualitative criteria (aesthetic value, functionality, biodiversity and infiltration potential) were assessed using a 5-point Likert scale (1 = very low; 5 = very high). Scores were assigned through a structured expert-based comparative assessment, based on the composition of each scenario and the expected performance of the different land cover types. The evaluation was conducted consistently across scenarios to ensure internal coherence, in line with visual evaluation approaches used in urban landscape studies [73,74].
The inclusion of both annual and long-term water costs allows distinguishing between short-term operational burden and cumulative economic impact over time, which is particularly relevant in municipal decision-making contexts with both annual budget constraints and long-term planning horizons.
All criteria were normalised via the Linear Different Ratio normalisation and classified as benefit or cost. The TOPSIS method was then applied to obtain a ranking for each weighting set, providing a structured basis for comparing alternatives and identifying solutions that can be consistently evaluated under varying conditions.

2.9. Pilot Application and User-Perception Assessment

The Jardim da Solum was selected as a pilot case because it combines the main conditions addressed by the proposed workflow: recent spatial reconfiguration, fragmented green areas, anomalous irrigation consumption, and documented public concern regarding the future use of the space. This made it a suitable case for testing how operational diagnosis, vegetation-cover scenarios, and spatial planning constraints could be interpreted within a municipal decision-support context. The pilot integrated field observation, spatial interpretation, and available operational data, aiming to assess the consistency between the technical diagnosis and observed patterns of space use.
To complement the technical analysis, surveys were conducted with garden users, as the suitability of public-space interventions also depends on patterns of use and user perception [47,48,49,50]. To this end, surveys were applied to different groups associated with the study area: children, the school community, users approached in person at the site, and the general public. These groups reflect the main user profiles directly associated with the park and its surrounding area, ranging from daily school-related use to occasional use by residents and other visitors.
A total of 797 responses were collected through four types of questionnaires. The questionnaires included questions about the frequency and manner of garden use, perception of environmental quality and usage conditions, evaluation of existing infrastructure, and priorities for future improvement. Some questions included open-ended responses, which were analysed through thematic coding and organised into analytical categories, complementing the reading of closed-ended responses. Although adapted to different target groups, the questionnaires maintained a common analytical structure regarding space use, functional constraints, and future expectations for the area. The surveys were administered in different formats (in-person, digital, and paper), according to the participants’ profiles.
Table 1 presents a summary of the questionnaire typologies, target audience, objective, application format, estimated duration, and number of responses obtained. The complete survey instruments are provided in Appendix A.4.
The survey results were analysed descriptively to support the interpretation of usage priorities, user perceptions, and potential functional limitations of the space, but were not incorporated as direct variables in the hydraulic or economic model.
The spatial application of the scenarios was operationalised by delimiting functional subzones and overlaying them with the proposed covers, allowing for the testing of compatibility between estimated water efficiency gains and operational requirements (sitting areas, circulation, children’s recreation, and transitions). The pilot thus functioned as a pre-implementation assessment stage, intended to evaluate the technical and functional coherence of the proposed scenarios before potential implementation.

3. Results

3.1. Operational Screening from Hourly Consumption

The hourly analysis of the 12 m revealed significant heterogeneity in operational performance throughout 2023–2024. In 2024, four meters showed persistent consumption patterns outside the typical irrigation window, compatible with prolonged hydraulic anomaly events, with estimated potential losses exceeding 90% of the annual volume recorded in each case. The detailed results by green space (CEV) and CIL code are summarised in Table 2.
At the scale of the analysed system, the estimated potential losses totalled 7206 m3 (€13,270) in 2024, with a strong concentration in a small subset of infrastructures: the four meters with persistent patterns accounted for 89.5% of the total volume of estimated potential losses. In contrast, the remaining eight meters showed profiles predominantly compatible with scheduled irrigation and/or limited deviations, without inter-day persistence of anomalous consumption.
The results indicate that the observed inefficiency is not distributed homogeneously but results from localised occurrences of long duration; therefore, targeted corrective interventions have the potential to disproportionately reduce the total volume of potential losses. It is important to note that the classification is based on the temporal signature of consumption (Section 2.3) and aims at operational screening; causal confirmation (e.g., burst, valve, programming) requires field verification and/or maintenance records.

3.2. Comparison Between Estimated Irrigation Needs and Observed Consumption

The comparison between the estimated gross requirement (NB) and the consumption observed in 2024 was conducted in four spaces with stable operational performance, excluding meters with persistent anomalies identified in Section 3.1, in order to reduce the influence of structural losses on the interpretation. In all cases, consumption exceeded the NB based on ET0 and coefficients adjusted to urban conditions. The relative deviation, defined as (Consumption − NB)/Consumption, varied between 29% and 61% (average ≈ 45%). The annual results per green space are presented in Table 3.
The accumulated surplus in the four spaces totalled 478.8 m3 in 2024, equivalent to approximately €839 at the municipal tariff considered. The monthly analysis confirmed a concentration of water requirements between June and August, with residual values during the winter period; therefore, consumption recorded outside the dry season is not explained by climatic demand, but by operational parameterisation and/or specific system conditions. Taken together, the results support a technically plausible margin for optimisation through seasonal adjustment of scheduling and calibration by cover typology, assuming the absence of relevant potential losses and adequate functional correspondence between the meter and the irrigated area.

3.3. Techno-Economic Scenarios (Landscape Cover Scenarios)

The modelling of the 14 parametric scenarios, applied to a reference area of 1000 m2, quantified the effect of cover composition on annual water consumption and operational costs, assuming proportional aggregation of unit parameters by typology (Section 2.6). The comparative summary of the representative scenarios is presented in Table 4, allowing the identification of the dominant role of conventional lawn in the consumption and cost structure.
The reference scenario (A1—100% Lawn) serves as the baseline for comparison with the remaining configurations. Full replacement with biodiverse meadow (A2) reduced consumption by 62.8% and annual cost by 58.3%. Among mixed combinations, a progressive reduction in consumption and costs was observed as the percentage of lawn decreased, with configurations such as C2 (60% Meadow + 40% Shrubs) exceeding a 50% reduction in both indicators. The scenario with the highest reduction (E1—60% Inert + 40% Shrubs) achieved reductions of 76.0% in consumption and 81.4% in annual cost, reflecting a significant structural change in the vegetation composition.
The scenarios constitute analytical instruments designed to quantify the magnitude of potential impacts and support a structured comparison between alternatives. They do not represent specific executive proposals but rather highlight the cumulative impact of vegetation composition choices on water consumption and municipal costs.

3.4. Pilot Application: Jardim da Solum

The Jardim da Solum (code 3035) was used as a pilot case to test the consistency between the operational diagnosis, parametric modeling, and real-world conditions of use. Between 2022 and 2024, the green area was reduced from 1956.20 m2 to 1075.85 m2 (−45%) as a result of infrastructural interventions, with a relative increase in impervious surfaces and fragmentation of the vegetation cover.
In 2024, the associated meter showed estimated losses of 1460 m3 (95.7% of the recorded volume), equivalent to €2712.8, with an hourly pattern compatible with prolonged bursts (Section 3.1).
The social analysis revealed a contrast between the value attributed to the space and its effective use. Although approximately 80% of respondents considered the garden important for local quality of life, about 64% reported using it primarily as a walkthrough corridor; the most frequently mentioned limitations were the lack of shade or vegetation (≈70%) and the scarcity of comfortable places to stay (≈55%). These results indicate that the space functions predominantly as a circulation area rather than a place for staying, a situation also associated with the limited perception of existing infrastructure (for example, concrete elements rarely interpreted as usable benches). At the same time, the predominance of circulation-related use and the recurrent demand for shade and vegetation suggest that the proposed low-water scenarios remain functionally compatible with the current patterns of use.
Applying the configuration derived from Section 3.3 (47% biodiverse meadow, 36% shrubs, and 17% inert permeable surfaces), the estimated annual NB was 239.07 m3 (−53.4% compared to the homogeneous lawn scenario). The estimated annual operational cost was €893.77 (−60.5%), corresponding to a projected annual saving of €1369.37 and a simple payback period of 2.7 years. These estimates reflect structural gains associated with the change in covers, assuming operation without relevant losses; the elimination of bursts/anomalous patterns identified in 2024 constitutes a prior and independent corrective measure, with additional potential impact.
The case demonstrates the applicability of the proposed workflow under real municipal conditions and highlights the coherence between estimated efficiency gains and the functional requirements of the space under real operational conditions.

3.5. Multicriteria Ranking Under Varying Decision Priorities

Table 5 below summarises the decision matrix for the multicriteria analysis. Before applying TOPSIS, the criteria were checked to avoid strong overlap and redundancy, as multicriteria analyses require criteria to be as independent as possible and non-redundant in order to avoid biased results [75,76]. A Pareto optimality analysis was also performed to verify that all scenarios were non-dominated and therefore relevant for comparison.
The TOPSIS method was applied using predefined weighting sets. These weights reflect the relative importance assigned by the decision maker to each criterion and allow the analysis of trade-offs between competing objectives. As mentioned, seven weighting sets were defined, as shown in Table 6.
TOPSIS scores for all scenarios and weighting schemes are reported in Appendix A.5 (Table A4), while the resulting rankings are presented in Table 7.
The multicriteria evaluation shows that scenario rankings shift with the weighting scheme, confirming that the selection of solutions depends on the adopted priorities, but follows a consistent pattern.
Scenarios based on meadow vegetation—either as a single cover (A2) or combined with shrubs (C2)—consistently appear among the best-performing options. Their performance reflects a balanced combination of lower irrigation demand, reduced maintenance requirements and stronger ecological contribution, making them relatively robust under different decision priorities.
When cost-related criteria are prioritised, simpler solutions gain relevance, particularly conventional grass and inert-based configurations. However, even in these cases, they do not systematically outperform meadow-based scenarios. This suggests that lower irrigation demand and maintenance intensity do not necessarily translate into a cost disadvantage within the analysed timeframe.
As greater weight is given to environmental and qualitative criteria, the differences between scenarios become more pronounced. Mixed vegetation systems, especially meadow–shrub combinations, move to the top of the ranking, reflecting their ability to combine ecological performance with functional and perceptual qualities. In contrast, simplified configurations become less competitive once the evaluation extends beyond purely economic considerations.
A similar pattern is observed when water efficiency is prioritised. Scenarios with lower irrigation demand remain among the top-ranked options, reinforcing the results of the previous analyses on water consumption and scenario modelling. At the same time, their performance is not determined by water alone, showing that water efficiency aligns with broader operational and urban objectives.
Overall, the analysis does not identify a single best scenario but clearly highlights a group of consistently high-performing configurations. These correspond primarily to meadow-based solutions (A2) and mixed vegetation systems combining meadow and shrubs (C2), which remain among the top-ranked options under all weighting schemes, with mixed configurations tending to perform better when qualitative and environmental criteria are prioritised. In contrast, simplified configurations—particularly inert surfaces and conventional grass—perform well primarily under cost-driven criteria and lose relevance when broader environmental and functional aspects are considered.

4. Discussion

The study analysed the linkage between hourly consumption screening, requirement estimation based on adjusted ET0, and parametric modelling of landscape covers within the context of municipal urban irrigation management. The results indicate that irrigation inefficiency in urban systems cannot be interpreted as a uniform process, but rather as the coexistence of distinct operational regimes with different management implications: persistent losses concentrated in a small subset of infrastructures and over-application in operationally stable systems when compared to a coherent climatic baseline.
The hourly analysis revealed a strong concentration of estimated potential losses in four meters, responsible for approximately 90% of the estimated volume of water loss in 2024. This pattern indicates that, in urban systems equipped with telemetry, inefficiency tends to result from persistent long-duration anomalies rather than uniformly distributed deviations. Comparable results have been reported in operational monitoring studies of large-scale urban parks, where sub-daily resolution allowed for the distinction between scheduled cycles and flows incompatible with regular operation. In the present case, the intra-seasonal variability associated with manual scheduling precluded the application of global statistical thresholds, requiring conservative temporal criteria and interpretive validation. This finding reinforces previous evidence that the presence of telemetry does not eliminate the need for an analytical framework adapted to the operational context [33,34,35,36].
In systems classified as stable, the comparison between observed consumption and the estimated gross requirement based on adjusted ET0 revealed deviations between 29% and 61%. These values fall within the over-application margins reported in Mediterranean urban contexts when scheduling is not seasonally recalibrated. It is important to clarify that the estimate based on landscape coefficients constitutes a technical comparative baseline, rather than an absolute definition of optimal requirement. The identified deviations do not automatically imply technical failure; they may reflect deliberate vegetation management decisions. However, they provide an objective basis for evidence-based technical discussion. In the absence of design records and sector-specific hydraulic indicators, this approach allows for the estimation of orders of magnitude and the reduction of decision-making arbitrariness, without replacing a detailed hydraulic audit.
Parametric cover modelling introduced a structural dimension to the analysis, demonstrating that vegetation composition simultaneously influences water consumption and operational costs. The progressive reduction in lawn percentage produced cumulative effects on the aggregated annual cost, showing that landscaping decisions have measurable budgetary implications. This finding is consistent with approaches that conceptualise green infrastructure as a multifunctional system whose performance depends on the coherence between design, maintenance, and ecological framework [27]. In the analysed case, scenarios with greater structural diversification showed reductions exceeding 50% in both consumption and annual cost, indicating significant potential for progressive reconfiguration in contexts of water scarcity.
The integration of the three analytical levels—operational screening, climatic baseline, and structural modelling—allowed for the establishment of an analytical decision sequence: (i) priority correction of persistent anomalies identified by temporal signature; (ii) seasonal recalibration of scheduling in stable systems; (iii) eventual structural reconfiguration of covers when technically and socially viable. This hierarchy reduces the risk of premature structural interventions in systems whose operational deviation results primarily from point anomalies. In this sense, the proposed framework differs from approaches centred primarily on isolated monitoring technologies or infrastructure replacement strategies, by prioritising operational diagnosis and calibration before structural redesign.
The multicriteria analysis using TOPSIS further extends this framework by explicitly incorporating decision priorities into the evaluation of intervention scenarios and revealed that no single scenario dominates across all weighting schemes, confirming that the selection of interventions depends inherently on the priorities adopted by the decision maker. This finding is not merely technical: it reflects a structural characteristic of municipal management, where decisions must simultaneously balance cost efficiency, ecological performance, user functionality, and institutional feasibility [65,66,67,68,69,70,71,72].
While the ranking varies across weighting schemes, the results show a consistent pattern: meadow-based and mixed vegetation solutions (particularly A2 and C2) remain among the best-performing options across all configurations. This indicates that certain landscape strategies provide robust performance under varying planning objectives, reinforcing the practical relevance of the approach for municipal decision-making, where trade-offs between cost, environmental performance, and functionality are inherent.
Beyond the empirical results, the study reveals a structural limitation in the management of urban green infrastructures: the coexistence of multiple information sources without formal integration into decision-making. Consumption data, spatial inventory data, and maintenance records tend to operate in parallel circuits, with limited correspondence between measurement and technical intervention. The applied approach organises these dimensions into a coherent sequence of operational interpretation by introducing explicit prioritisation criteria under real-world institutional constraints. The contribution of the study thus lies in demonstrating that water efficiency depends not only on technical modeling but on the coherence between data sources and decision levels.
The Jardim da Solum pilot case demonstrated the spatial applicability of the proposed framework and confirmed that estimated structural gains are compatible with the functional requirements of the public space. The incorporation of user perception defined implementation constraints without altering the technical parameters of the model, reinforcing the importance of incorporating functional-use constraints into pre-implementation municipal planning.
Perhaps the most substantive finding of this study is not any single technical result but the demonstration that the three analytical dimensions—operational screening, climatic baseline, and structural cover modelling—are mutually reinforcing and cannot be effectively pursued in isolation. Existing literature has addressed each component separately: studies on smart irrigation and telemetry [33,34,35,36] focus on detection technology; ET0 adaptation studies [39,40,41,46] focus on requirement estimation; and green infrastructure design studies [27,47,48] focus on landscape and ecological performance. What is largely absent from the literature is an operational framework that explicitly sequences these dimensions into a decision hierarchy under real municipal constraints. The present study proposes and tests such a sequence: (i) priority correction of persistent anomalies identified by temporal consumption signature; (ii) seasonal recalibration of scheduling in operationally stable systems; and (iii) structural reconfiguration of vegetation covers when technically and socially viable. This hierarchy is consequential: it reduces the risk of premature structural investments in systems whose inefficiency is primarily operational in origin, a mistake that is costly and difficult to reverse in municipal contexts. The study thus contributes to operationalising the transition from fragmented monitoring—in which consumption data, spatial inventories, and maintenance records coexist without formal articulation—to a structured, decision-oriented management framework. To the authors’ knowledge, no prior study has explicitly integrated these three dimensions into a replicable municipal-scale workflow validated against real operational data.
It should be noted that the results reflect the operational conditions captured during the study period. Following the diagnostic phase, some of the identified situations have been subject to technical follow-up, including anomaly verification, corrective interventions in irrigation operation, and ongoing refinement of monitoring and supporting data. The results presented therefore represent a consistent snapshot of system performance under the observed conditions and should be interpreted within this temporal scope rather than as a fixed representation of the current operational context.

5. Conclusions

Irrigation management in urban green spaces currently plays a growing role in the adaptation of cities to contexts of increased pressure on water resources. These spaces fulfill a role that goes beyond the aesthetic dimension, contributing to urban thermal regulation, environmental quality, and population well-being, as well as to stormwater management through infiltration and retention processes that help mitigate runoff episodes and urban flooding [14,15,16,17,54,55,56].
Despite this growing importance, the information required for irrigation management often remains scattered across different systems: consumption data, spatial inventories, and maintenance records, which hinders its use as a consistent basis for analysis and decision-making.
The study demonstrates that an operational decision-making framework can be structured for municipal irrigation by integrating three dimensions: hourly consumption, climatic requirement estimation, and parametric modelling of covers.
The analysis confirms that irrigation inefficiency follows two distinct operational patterns rather than a uniform distribution. In some cases, inefficiency is concentrated in a small number of meters associated with persistent anomalous consumption patterns. In others, systems with apparently stable operation show consumption levels higher than the estimated requirements derived from ET0-based methods as a comparative baseline, indicating a margin for optimisation through seasonal adjustments of the irrigation scheduling.
This supports a structured decision sequence: priority correction of persistent anomalies, followed by optimisation of stable systems, and, where justified, structural redesign of vegetation covers. The multicriteria evaluation strengthens this framework by demonstrating that intervention priorities depend on the chosen decision criteria, while still identifying robust solutions across scenarios. Meadow-based and mixed vegetation configurations consistently perform well under different weighting schemes, highlighting their suitability for municipal-scale implementation where multiple objectives must be balanced.
The results further demonstrate that the composition of vegetation covers directly influences water consumption and maintenance costs. Landscaping design choices, therefore, have direct implications across the management cycle of green spaces.
The main contribution of the study lies in the proposal of an analytical framework that links dimensions usually treated separately—namely, operational consumption data, climatic baseline, and vegetation structure—demonstrating the operational value of an interdisciplinary integration of hydrological, landscape, and management perspectives.
The results suggest that improving water efficiency in urban green spaces requires structured operational workflows and prioritisation mechanisms based on integrated data interpretation, rather than the mere introduction of additional technologies.

5.1. Limitations

The limitations of the study stem from the monthly scale adopted for requirement estimation, the transfer of generalised coefficients to a specific urban context, and the partial correspondence between meters and irrigated areas in 1:N configurations. The loss estimation is based on temporal consumption signatures and requires physical confirmation for precise causal determination. The values presented should, therefore, be interpreted as comparative estimates rather than as a definitive hydraulic quantification of application efficiency.

5.2. Future Research

Future research should include sector-specific validation with direct flow measurement, longitudinal assessment following anomaly correction, and the development of semi-automatic methods compatible with non-stationary scheduling. The pilot implementation of the proposed solutions, accompanied by systematic monitoring of operational indicators (water consumption, phytosanitary status of vegetation, space utilisation, and maintenance costs) over at least one full seasonal cycle, will allow for the evaluation of the measures’ actual effectiveness and the identification of implementation constraints in an urban context. The integration of remote sensing could contribute to the independent spatial assessment of evapotranspiration patterns in heterogeneous urban contexts [46]. Additionally, it will be relevant to evaluate the applicability of the methodology across different urban green-space typologies and in cities with similar climatic conditions, exploring the model’s potential for replication as a tool to support municipal water management.

Author Contributions

Conceptualisation, N.Z. and L.M.d.S.C.; methodology, N.Z.; software, N.Z.; formal analysis, N.Z.; investigation, N.Z.; data curation, N.Z.; visualisation, N.Z.; writing—original draft preparation, N.Z.; validation, E.N.-J.; multicriteria analysis, E.N.-J. and J.M.; writing—review and editing, E.N.-J., L.M.d.S.C. and J.M.; supervision, E.N.-J.; project administration, N.Z.; resources, L.M.d.S.C.; funding acquisition, not applicable. All authors have read and agreed to the published version of the manuscript.

Funding

This research was funded by UID/00308/2025, FCT Pluriannual Funding UID/308: Instituto de Engenharia de Sistemas e Computadores de Coimbra—INESC Coimbra; DOI https://doi.org/10.54499/UID/00308/2025.

Institutional Review Board Statement

Ethical review and approval were waived for this study due to the anonymous, voluntary, minimal-risk nature of the survey and the absence of personal identifying data.

Informed Consent Statement

Informed consent was obtained from all subjects involved in the survey; participation was voluntary and anonymous.

Data Availability Statement

The data used in this study originate from municipal operational systems (water consumption records, maintenance logs, and GIS inventory) and are not publicly available due to administrative and operational restrictions. Aggregated results and methodological details are presented in the manuscript. Access to the underlying data may be granted upon reasonable request to the corresponding author and subject to authorization by the Municipality of Coimbra.

Acknowledgments

The authors thank the Municipality of Coimbra (Department of Public Spaces) and Águas de Coimbra for institutional support and access to telemetric consumption records.

Conflicts of Interest

The authors declare no conflicts of interest.

Abbreviations

The following abbreviations are used in this manuscript:
CEVGreen space code (Código de Espaço Verde)
CILMeter location code (Código de Identificação de Local)
ET0Reference evapotranspiration
ETcCrop/landscape evapotranspiration
NIRNet irrigation requirement
NBGross irrigation requirement
EfIrrigation efficiency
SuDSSustainable Urban Drainage Systems
GISGeographic Information System (SIG—Sistema de Informação Geográfica)
WUCOLSWater Use Classification of Landscape Species

Appendix A

Appendix A.1. List and Characteristics of Analysed Green Spaces

Table A1. Analysed green spaces and associated water meters.
CILAssociated CEV(s)Irrigated Area (m2)Irrigation SystemRelationTypology
2115783018176.20Sprinkler1:1Roundabout
2071553020684.26Spray1:1Garden
2116243022656.96Sprinkler + Spray1:1Courtyard
1458643030 + 30912179.53Drip + Spray1:NSquare
20924830312996.87Spray1:1Square
2117023035 + 3140186.25Sprinkler + Spray1:NGarden
2078673049373.06Sprinkler1:1Roundabout
2115983057 + 3076617.39Spray1:NRoundabout
2115613058551.79Drip1:1Roundabout
12047730701288.69Sprinkler + Spray1:1Slope
20718430784262.25Sprinkler1:1Courtyard
10052913084307.05Sprinkler + Spray1:1Roundabout
Note: “Relation” indicates whether one meter supplies one green space (1:1) or multiple green spaces (1:N).

Appendix A.2. Landscape Coefficients and Irrigation Parameters (Ke, Kd, Km, Ks, Ef) Used in the ET0-Based Irrigation Demand Estimation

Table A2. a. Species coefficient (Ke), b. Density coefficient (Kd), c. Microclimate coefficient (Km), d. Water stress coefficient (Ks), e. Irrigation efficiency (Ef).
a. Species Coefficient (Ke)
Vegetation TypeKe
Trees0.90
Shrubs0.60
Groundcovers/creeping vines0.70
Mixed plantings0.90
Ornamental turf (well maintained)0.85
Rustic or invaded turf0.75
Turfgrass—Poa spp.0.60
b. Density Coefficient (Kd)
Vegetation TypeHighMediumLow
Trees1.31.00.5
Shrubs1.11.00.5
Groundcovers/creeping vines1.11.00.5
Mixed plantings1.31.10.6
Turf1.01.00.6
c. Microclimate Coefficient (Km)
Vegetation TypeExposedPartially ShadedShaded
Trees1.41.00.5
Shrubs1.31.00.5
Groundcovers/creeping vines1.21.00.5
Mixed plantings1.41.00.5
Turf1.21.00.8
d. Water stress Coefficient (Ks)
Irrigation RegimeKs
Full irrigation (no stress)1.0
Moderate deficit irrigation0.8–0.9
Severe water restriction0.6–0.7
e. Irrigation Efficiency (Ef)
Irrigation MethodEf
Sprinkler irrigation0.75
Spray irrigation0.75
Drip irrigation0.90
Micro-sprinkler0.85
Mist/nebulization0.80
Manual irrigation0.50
Note: a. Vegetation categories are applied at the hydrozone level. For mixed plantings (two or more vegetation types), the higher Ke value is adopted to avoid underestimation of irrigation demand. For species-specific coefficients, see the Garden Irrigation Manual [41]. b. High = dense canopy/planting structure; Medium = moderate occupation; Low = sparse planting or wide spacing. In multi-layer vegetation (e.g., trees + shrubs), the dominant stratum within the hydrozone is considered. c. Exposed = high solar radiation and/or wind exposure; Partially shaded = partial protection (walls, trees), limited direct sun; Shaded = minimal direct sun, higher soil moisture retention. d. Ks = 1.0 corresponds to full irrigation supply (ETc fully satisfied). Moderate deficit irrigation allows partial water savings with limited impact on visual quality. Severe restrictions reduce water demand significantly but may affect plant vitality during dry periods. For newly planted vegetation, Ks = 1.0 is assumed until establishment. For deciduous species, Ks may be reduced by ~20% outside peak demand periods (April–May; October–November) [29]. e. Pressurized systems (e.g., drip and micro-sprinkler) assume adequate filtration and periodic maintenance. Ef is applied in the calculation of gross irrigation requirements. Additional (applied calculation): The landscape coefficient was computed as Kj = Ke × Kd × Km, and the crop evapotranspiration was estimated as ETc = ET0 × Kj × Ks. Gross irrigation requirement was computed by accounting for effective precipitation (Pe) and efficiency (Ef).

Appendix A.3. Full Techno-Economic Scenario Matrix (1000 m2 Reference Area)

Table A3. Full techno-economic scenario matrix (1000 m2 reference area).
ScenarioLawn (%)Meadow (%)Shrubs (%)Inert (%)Annual Water Use (m3)Annual Water Cost (€)Annual Maintenance (€)Total Annual Cost (€)Annual Saving vs. A1 (€)Cost
Reduction (%)
Water
Reduction (%)
A1100%0%0%0%512.97953.1313102263.130.000.0%0.0%
A20%100%0%0%190.57354.10590944.101319.0358.3%62.8%
A30%0%100%0%308.07572.414801052.411210.7253.5%39.9%
B180%0%20%0%471.99876.9911442020.99242.1410.7%8.0%
B260%0%40%0%431.01800.859781778.85484.2921.4%16.0%
B340%60%0%0%319.53593.718781471.71791.4235.0%37.7%
C10%30%50%20%211.21392.44417809.441453.7064.2%58.8%
C20%60%40%0%237.57441.43546987.431275.7156.4%53.7%
C30%40%30%30%168.65313.37380693.371569.7769.4%67.1%
D130%30%30%10%303.48563.907141277.90985.2443.5%40.8%
D220%40%30%10%271.24503.996421145.991117.1449.4%47.1%
D310%30%40%20%231.70430.51500930.511332.6258.9%54.8%
E10%0%40%60%123.23228.97192420.971842.1781.4%76.0%
E20%80%20%0%214.07397.76568965.761297.3757.3%58.3%
Notes: (i) Percentages refer to cover composition over a 1000 m2 reference area. (ii) Annual savings and reductions were computed relative to A1. (iii) Water costs were estimated using a unit price of 1.858074 €/m3 based on the 2024 tariff of Águas de Coimbra [63]. (iv) “Annual maintenance” refers to routine maintenance costs consistent with the unit assumptions used in the scenario analysis.

Appendix A.4. Survey Instruments Used in the Jardim da Solum Pilot

The surveys were originally administered in Portuguese. The English versions presented below are translated versions provided for methodological transparency.

Appendix A.4.1. Rapid Survey

Q1. How often do you pass through or visit Jardim da Solum?
  • Daily
  • Several times per week
  • Several times per month
  • Rarely
  • Never
Q2. What is the main reason for passing through or staying in this space? (Select up to two options)
  • I only use it as a passage route
  • I wait for or accompany my child to school or kindergarten
  • I rest or wait for someone
  • Social meeting
  • Walking my dog
  • Other: _______
Q3. Has the reduction of green areas affected the way you use this space?
  • I use the space less frequently
  • I continue to use it, but the space has lost quality
  • It has not affected my use
  • I had never used this space before
Q4. What are the main limitations of this space? (Select up to two options)
  • Lack of shade and vegetation
  • Lack of benches or resting areas
  • Insufficient lighting at night
  • Lack of drinking fountains
  • Lack of maintenance
  • Other: _______
Q5. Which improvements do you consider most important? (Select up to two options)
  • Increase vegetation and create shaded areas
  • Install appropriate urban furniture (benches, tables)
  • Improve lighting and safety
  • Install drinking fountains
  • The space should remain as it is
  • Other: _______
Q6. Which aspects of the garden should be improved?
  • Create more direct and accessible pedestrian paths
  • Improve pavement conditions
  • Add benches and comfortable urban furniture
  • Only repair what was damaged during construction works
  • No changes are necessary

Appendix A.4.2. School Survey

Q1. What is your relationship with the school?
  • Teacher
  • Non-teaching staff member
  • Parent or guardian
Q2. How often do you pass through or visit Jardim da Solum?
  • Daily
  • Several times per week
  • Several times per month
  • Rarely
  • Never
Q3. At what time do you usually use this space?
  • Morning
  • Lunch time
  • End of the day
  • Weekends
  • I do not use this space
Q4. What do you mainly use this space for? (Select up to two options)
  • I only use it as a passage route
  • I wait for or accompany my child to school or kindergarten
  • I rest or wait for someone
  • Social interaction or meeting
  • Other: ____________
Q5. How do you evaluate the accessibility of Jardim da Solum?
  • Easy and convenient for pedestrians
  • It could have more direct and safer connections
  • Difficult for children, older adults, or people with reduced mobility
  • I have never tried to access the garden
Q6. Has the reduction of green area and the construction of the new parking area affected your use of this green space?
  • Yes, it has made the space less pleasant and usable
  • Yes, it has reduced environmental quality
  • It has not affected my use
  • I had never used this space before
Q7. How do you evaluate the new passenger drop-off and pick-up area (“Kiss and Ride”) created in the former green area?
  • Positive—it improved traffic circulation during school drop-off and pick-up times
  • Neutral—I do not see a major impact
  • Negative—it reduced the green area
  • Negative—it is underused outside peak hours
  • Other: ____________
Q8. What do you consider the best solution to balance the Kiss-and-Ride area and the green space?
  • Create more drop-off spaces and improve its surroundings
  • Reduce the parking area and expand vegetation
  • Create a leisure area with benches and shade
  • Keep the space as it is
Q9. What do you consider the most problematic aspects of the current Jardim da Solum? (Select up to two options)
  • Lack of shade and vegetation
  • Lack of benches or resting areas
  • Insufficient lighting at night
  • Lack of drinking fountains or water points
  • Lack of maintenance
  • Other: ____________
Q10. What do you consider most important for improving Jardim da Solum? (Select up to two options)
  • More vegetation and shaded areas
  • Creation of leisure and rest areas for the school community
  • Better integration between the parking area and the green space
  • Installation of drinking fountains or water points
  • Nothing needs to be changed
  • Other: ____________
Q11. Do you think Jardim da Solum should include outdoor educational spaces for school use?
  • Yes, it would be an excellent option for educational activities
  • Perhaps, if adequate infrastructure were provided
  • Perhaps, but only if the area were fenced
  • No, the space is not suitable for that purpose
Q12. If the space were redesigned, would you be interested in participating in school initiatives related to its maintenance or improvement?
  • Yes
  • Maybe
  • No
Q13. Do you have any additional comments or suggestions about Jardim da Solum?

Appendix A.4.3. Children’s Survey

Q1. How do you usually go to school? (Choose one option)
  • On foot
  • By bicycle
  • By car
  • By bus
Q2. If you could choose, how would you like to go to school?
  • On foot
  • By bicycle
  • By car
  • By bus
  • By MetroBus (when available)
Q3. After leaving school, do you usually play in the street?
  • Yes, always
  • Sometimes
  • No
About the Garden
Q4. Do you spend time playing in the garden near the school?
  • Yes, I love it
  • Sometimes
  • No
Q5. How do you feel about the condition of the garden today? (The garden may sometimes be dirty or under construction—tell us what you think.)
  • I like it, but it could be better
  • I do not like it very much
  • I do not know
Activities and Planting
Q6. Would you like the school to organise activities in the garden? (For example: games, outdoor classes, picnics, storytelling.)
  • Yes
  • No
  • Maybe
Q7. Have you ever planted something to eat (such as vegetables or fruits)?
  • Yes
  • No
Q8. Would you like to plant something in the garden?
  • Yes
  • No
  • Maybe
The Garden and Its Appearance
Q9. Do you think the garden is beautiful?
  • Very beautiful
  • More or less
  • Not beautiful
Q10. Is the garden well maintained?
  • Yes, it is well maintained
  • Sometimes I think it could be better
  • I do not know
  • Your Ideas to Improve the Garden
Q11. What idea do you have to improve the garden? (Write or draw a short idea. For example: “I want a clean place to play” or “I want more flowers”.)

Appendix A.4.4. General Survey

Participant Profile
Q1. In which area/parish of Coimbra do you live?
  • Santo António dos Olivais
  • Sé Nova, Santa Cruz, Almedina e São Bartolomeu
  • Other parishes of Coimbra
  • I do not live in Coimbra but visit the city
Q2. How often do you pass through or visit Jardim da Solum?
  • Daily
  • Several times per week
  • Several times per month
  • Rarely
  • Never
Q3. What is your age group?
  • Under 18
  • 18–29
  • 30–49
  • 50–64
  • 65 or more
Use and Perception of the Garden
Q4. What is the main reason for passing through or staying in this space? (Select up to two options)
  • I only use it as a passage route
  • I wait for or accompany my child to school/kindergarten
  • I rest or wait for someone
  • Social meeting
  • Walking my dog
  • Other: ______
Q5. Has the reduction of the green area, including the creation of the Kiss-and-Ride drop-off zone, affected how you use Jardim da Solum?
  • I stopped using the space as frequently
  • I continue to use it, but its quality has decreased
  • It did not affect my use
  • I never used this space before
Q6. How important do you consider Jardim da Solum for the quality of life in Coimbra?
  • Very important
  • Important
  • Slightly important
  • Not important
  • No opinion
Q7. How important do you consider Jardim da Solum for the quality of life in the Solum neighbourhood?
  • Very important
  • Important
  • Slightly important
  • Not important
  • No opinion
Limitations and Problems
Q8. In your opinion, what are the main limitations of Jardim da Solum? (Select up to three options)
  • Lack of shade and vegetation
  • Lack of benches and resting areas
  • Insufficient lighting at night
  • Lack of drinking fountains or water points
  • Lack of safety
  • Inadequate accessibility or pavement
  • The space is often empty or unattractive
  • Other: ______
Q9. How do you evaluate accessibility and pedestrian circulation in the garden?
  • Easy and convenient for pedestrians
  • Routes could be clearer and more direct
  • Difficult for people with reduced mobility
  • I have never tried to walk through the garden
Q10. Do you usually use this space with children?
  • Yes, regularly
  • Yes, occasionally
  • No, because I do not have children in my care
  • No, the garden is not suitable for children
  • Other: ______
Improvements and Solutions
Q11. What do you consider most important to improve Jardim da Solum? (Select up to three options)
  • More vegetation and shaded areas
  • Benches and comfortable urban furniture
  • Better lighting and safety
  • Drinking fountains and water points
  • Leisure spaces for children
  • Exercise paths (walking, running)
  • Other: ______
  • Nothing needs to be changed
Q12. In your opinion, how should the Kiss-and-Ride area be balanced with the green space?
  • Create more green areas around the Kiss-and-Ride zone
  • Reduce parking space and expand vegetation
  • Maintain the parking area as it is
  • Other: ______
Q13. How would you like Jardim da Solum to evolve in the future?
  • Maintained mainly as a passage corridor but better organised
  • Become an urban park with leisure and social areas
  • Become a more naturalised green space
  • Become a small educational garden with information panels
  • Other: ______
Q14. Additional comments or suggestions about Jardim da Solum (Open response)

Appendix A.5. Multicriteria Analysis (Additional Results)

Table A4. TOPSIS scores for all scenarios across weighting schemes.
ScenarioSet/01Set/02Set/03Set/04Set/05Set/06Set/07
A1—Grass0.40660.31810.29170.52670.43880.55810.2388
A2—Meadow0.72590.68340.70680.64260.77520.70030.7303
A3—Shrubs0.44070.59790.46150.61510.61240.67820.6032
A4—Inert0.59800.60910.78920.37970.37970.19490.7041
B2—Grass + Shrubs0.36890.36260.29890.49990.43900.52230.3220
C2—Meadow + Shrubs0.64760.68370.62370.69670.77910.77300.6965
D2—Mixed0.59450.60630.56750.65790.66000.68960.6140
E1—Shrubs + Inert0.53840.60550.68780.37660.42000.27770.6803
Note: Higher values indicate closer proximity to the ideal solution.

References

  1. Shiklomanov, I.A. World fresh water resources. In Water in Crisis: A Guide to the World’s Fresh Water Resources; Gleick, P.H., Ed.; Oxford University Press: New York, NY, USA, 1993; pp. 13–24. [Google Scholar]
  2. United Nations, Department of Economic and Social Affairs, Population Division. World Population Prospects 2024: Probabilistic Projections; United Nations: New York, NY, USA, 2024; Available online: https://population.un.org/wpp/ (accessed on 11 January 2026).
  3. United Nations Human Settlements Programme (UN-Habitat). World Cities Report 2024: Cities and Climate Action; UN-Habitat: Nairobi, Kenya, 2024; Available online: https://unhabitat.org/wcr/ (accessed on 11 January 2026).
  4. United Nations, Department of Economic and Social Affairs, Population Division. World Urbanization Prospects 2024 Revision: Country Profiles; United Nations: New York, NY, USA, 2024; Available online: https://population.un.org/wup/ (accessed on 11 January 2026).
  5. Our World in Data. Water Use & Stress. Available online: https://ourworldindata.org/water-use-stress (accessed on 11 January 2026).
  6. Intergovernmental Panel on Climate Change (IPCC). Climate Change 2023: Synthesis Report; IPCC: Geneva, Switzerland, 2023; Available online: https://www.ipcc.ch/report/ar6/syr/ (accessed on 11 January 2026).
  7. Feng, B.; Zhang, Y.; Bourke, R. Urbanization impacts on flood risks based on urban growth data and coupled flood models. Nat. Hazards 2021, 106, 613–627. [Google Scholar] [CrossRef]
  8. Stewart, I.D.; Voogt, J.A. Urban heat islands. In Encyclopedia of Atmospheric Sciences, 3rd ed.; Robinson, W.A., Ed.; Academic Press: London, UK, 2026; pp. 512–529. [Google Scholar] [CrossRef]
  9. Tong, S.; Prior, J.; McGregor, G.; Shi, X.; Kinney, P. Urban heat: An increasing threat to global health. BMJ 2021, 375, n2467. [Google Scholar] [CrossRef] [PubMed]
  10. Monteiro, J.; Sousa, N.; Coutinho-Rodrigues, J.; Natividade-Jesus, E. Challenges Ahead for Sustainable Cities: An Urban Form and Transport System Review. Energies 2024, 17, 409. [Google Scholar] [CrossRef]
  11. Agência Portuguesa do Ambiente (APA). Relatório do Estado do Ambiente 2024; APA: Lisboa, Portugal, 2024. Available online: https://rea.apambiente.pt/ (accessed on 11 January 2026).
  12. Santos, E. Are Climate Change Strategies Effective in Managing Urban Water Resources? The Case of Portugal. Sustainability 2024, 16, 9664. [Google Scholar] [CrossRef]
  13. Milvoy, A.; Roué Le Gall, A. Les questions à se poser pour aménager des espaces de jeux favorables à la santé. Santé Action 2015, 434, 38–39. Available online: https://www.santepubliquefrance.fr/content/download/141602/2118717?version=1 (accessed on 11 January 2026).
  14. Nguyen, P.-Y.; Astell-Burt, T.; Rahimi-Ardabili, H.; Feng, X. Green Space Quality and Health: A Systematic Review. Int. J. Environ. Res. Public Health 2021, 18, 11028. [Google Scholar] [CrossRef]
  15. Gascon, M.; Triguero-Mas, M.; Martínez, D.; Dadvand, P.; Forns, J.; Plasència, A.; Nieuwenhuijsen, M.J. Mental health benefits of long-term exposure to residential green and blue spaces: A systematic review. Int. J. Environ. Res. Public Health 2015, 12, 4354–4379. [Google Scholar] [CrossRef]
  16. Muerdter, C.P.; Wong, C.K.; LeFevre, G.H. The role of vegetation in bioretention for stormwater treatment in the built environment: Pollutant removal, hydrologic function, and ancillary benefits. Environ. Sci. Water Res. Technol. 2018, 4, 592–612. [Google Scholar] [CrossRef]
  17. Berland, A.; Shiflett, S.A.; Shuster, W.D.; Garmestani, A.S.; Goddard, H.C.; Herrmann, D.L.; Hopton, M.E. The role of trees in urban stormwater management. Landsc. Urban Plan. 2017, 162, 167–177. [Google Scholar] [CrossRef] [PubMed]
  18. Rey-Gozalo, G.; Barrigón Morillas, J.M.; Montes González, D.; Vílchez-Gómez, R. Influence of green areas on the urban sound environment. Curr. Pollut. Rep. 2023, 9, 746–759. [Google Scholar] [CrossRef]
  19. Hewitt, C.N.; Ashworth, K.; MacKenzie, A.R. Using green infrastructure to improve urban air quality (GI4AQ). Ambio 2020, 49, 62–73. [Google Scholar] [CrossRef] [PubMed]
  20. Barwise, Y.; Kumar, P. Designing vegetation barriers for urban air pollution abatement: A practical review for appropriate plant species selection. npj Clim. Atmos. Sci. 2020, 3, 12. [Google Scholar] [CrossRef]
  21. Aronson, M.F.J.; Lepczyk, C.A.; Evans, K.L.; Goddard, M.A.; Lerman, S.B.; MacIvor, J.S.; Nilon, C.H.; Vargo, T. Biodiversity in the city: Key challenges for urban green space management. Front. Ecol. Environ. 2017, 15, 501–509. [Google Scholar] [CrossRef]
  22. Gill, S.; Handley, J.F.; Ennos, R.; Pauleit, S. Adapting cities for climate change: The role of the green infrastructure. Built Environ. 2007, 33, 115–133. [Google Scholar] [CrossRef]
  23. Monteiro, J.; Sousa, N.; Pais, F.; Coutinho-Rodrigues, J.; Natividade-Jesus, E. Planning Cities for Pandemics: Review of Urban and Transport Planning Lessons from COVID-19. Proc. Inst. Civ. Eng. Munic. Eng. 2023, 176, 125–138. [Google Scholar] [CrossRef]
  24. Dias, R.C.; Vidal, D.G.; Seixas, P.C.; Maia, R.L. Os espaços verdes e as preocupações com a sustentabilidade nos Planos Diretores Municipais de 3a geração. Cid. Comunidades Territ. 2020, 41, 44–70. [Google Scholar] [CrossRef]
  25. Feltynowski, M. Urban green spaces in land-use policy—Types of data, sources of data and staff: The case of Poland. Land Use Policy 2023, 127, 106570. [Google Scholar] [CrossRef]
  26. Terkenli, T.S.; Bell, S.; Tošković, O.; Dubljević-Tomićević, J.; Panagopoulos, T.; Straupe, I.; Kristianova, K.; Straigyte, L.; O’Brien, L.; Živojinović, I. Tourist perceptions and uses of urban green infrastructure: An exploratory cross-cultural investigation. Urban For. Urban Green. 2020, 49, 126624. [Google Scholar] [CrossRef]
  27. Hansen, R.; Pauleit, S. From multifunctionality to multiple ecosystem services? A conceptual framework for multifunctionality in green infrastructure planning. Ambio 2014, 43, 516–529. [Google Scholar] [CrossRef] [PubMed]
  28. Canales-Ide, F.; Zubelzu, S.; Segovia-Cardozo, D.; Rodríguez-Sinobas, L. Assessing the Performance of Irrigation Systems in Large Scale Urban Parks: Application to the Case of Valdebebas, Madrid (Spain). Remote Sens. 2022, 14, 1060. [Google Scholar] [CrossRef]
  29. Canales-Ide, F.; Zubelzu, S.; Rodríguez-Sinobas, L. Irrigation systems in smart cities coping with water scarcity: The case of Valdebebas, Madrid (Spain). J. Environ. Manag. 2019, 247, 187–195. [Google Scholar] [CrossRef]
  30. Monteiro, L.; Pissarra, P.; Mendes, M.P. Rega de espaços verdes urbanos com água para reutilização: O que esperar? Rev. Recur. Hídricos 2021, 42, 25–29. [Google Scholar] [CrossRef]
  31. Esperon-Rodriguez, M.; Gallagher, R.V.; Russo, A.; Power, S.A.; Calaza-Martínez, P.; Lourenço, T.C.; Cariñanos, P.; Eleuterio, A.A.; Guo, Z.; Lee, G.; et al. Global trends in urban forest irrigation: Environmental influences, challenges and opportunities for sustainable practices across 109 cities worldwide. Sustain. Cities Soc. 2025, 130, 106510. [Google Scholar] [CrossRef]
  32. ERSAR—Entidade Reguladora dos Serviços de Águas e Resíduos. Relatório Anual dos Serviços de Águas e Resíduos em Portugal (RASARP 2024); ERSAR: Lisboa, Portugal, 2024; Volume 1.
  33. Sánchez-Sutil, F.; Cano-Ortega, A. Smart control and energy efficiency in irrigation systems using LoRaWAN. Sensors 2021, 21, 7041. [Google Scholar] [CrossRef]
  34. Sousa, D.; Moutinho, R.; Resende, C.; Oliveira, J.; Soares, M.R.; Graça, R.; Oliveira, A.; Moreira, W.; Carvalho, L. IoT sensing for precision agriculture. In Proceedings of the 2023 IEEE International Conference on Pervasive Computing and Communications Workshops (PerCom Workshops), Atlanta, GA, USA, 13–17 March 2023; IEEE: New York, NY, USA, 2023; pp. 300–302. [Google Scholar] [CrossRef]
  35. Gloria, A.; Dionisio, C.; Simões, G.; Cardoso, J.; Sebastião, P. Water management for sustainable irrigation systems using Internet-of-Things. Sensors 2020, 20, 1402. [Google Scholar] [CrossRef]
  36. Aldegheishem, A.; Alrajeh, N.; García, L.; Lloret, J. SWAP: Smart water protocol for the irrigation of urban gardens in smart cities. IEEE Access 2022, 10, 43528–43541. [Google Scholar] [CrossRef]
  37. Direção-Geral de Estatísticas da Educação e Ciência (DGEEC). Cidades e Territórios Inteligentes 2023—Câmaras Municipais; DGEEC: Lisboa, Portugal, 2024; Available online: https://www.dgeec.medu.pt/api/ficheiros/66f12dcf081cd43c247ab71c (accessed on 11 January 2026).
  38. Allen, R.G.; Pereira, L.S.; Raes, D.; Smith, M. Crop Evapotranspiration: Guidelines for Computing Crop Water Requirements (FAO Irrigation and Drainage Paper 56); FAO: Rome, Italy, 1998; Available online: https://www.fao.org/4/x0490e/x0490e06.htm (accessed on 11 January 2026).
  39. California Center for Urban Horticulture (CCUH); California Department of Water Resources (DWR). Water Use Classification of Landscape Species (WUCOLS V); University of California: Davis, CA, USA, 2025; Available online: https://ccuh.ucdavis.edu/wucols (accessed on 11 January 2026).
  40. Hartin, J.S.; Fujino, D.W.; Oki, L.R.; Reid, S.K.; Ingels, C.A.; Haver, D.L. Water requirements of landscape plants: Studies conducted by the University of California researchers. HortTechnology 2018, 28, 422–428. [Google Scholar] [CrossRef]
  41. Ávila Alabarces, R. (coord.); Manual de Riego de Jardines: Guión Didáctico para el Profesorado, 1st ed.; Junta de Andalucía: Sevilla, Spain, 2004; ISBN 84-8474-106-0. [Google Scholar]
  42. Pereira, M.J.M.G.; Fernandes, L.F.S.; Macário, E.M.B.; Gaspar, S.M.; Pinto, J.G. Climate change impacts in the design of drainage systems: Case study of Portugal. J. Irrig. Drain. Eng. 2014, 141, 04014057. [Google Scholar] [CrossRef]
  43. Ramisio, P.J.; Brito, R.S.; Beceiro, P. Accessing synergies and opportunities between nature-based solutions and urban drainage systems. Sustainability 2022, 14, 16906. [Google Scholar] [CrossRef]
  44. Ballard, W.; Wilson, B.; Udale-Clarke, H.; Illman, H.; Scott, S.; Ashley, T.; Kellagher, R. The SuDS Manual (CIRIA C753); CIRIA: London, UK, 2015; ISBN 978-0-86017-760-9. [Google Scholar]
  45. Rodríguez-Rojas, M.I.; Garrido-Jiménez, F.J.; Abarca-Álvarez, F.J.; Vallecillos-Siles, M.R. Advances in the integration of sustainable drainage systems into urban planning: A case study. Sustainability 2024, 16, 2658. [Google Scholar] [CrossRef]
  46. Nouri, H.; Beecham, S.; Kazemi, F.; Hassanli, A. Comparing Three Approaches of Evapotranspiration Estimation in Mixed Urban Vegetation. Remote Sens. 2016, 8, 492. [Google Scholar] [CrossRef]
  47. Ugolini, F.; Massetti, L.; Calaza-Martínez, P.; Cariñanos, P.; Dobbs, C.; Ostoić, S.K.; Marin, A.M.; Pearlmutter, D.; Saaroni, H.; Šaulienė, I.; et al. Understanding the benefits of public urban green space: How do perceptions vary between professionals and users? Landsc. Urban Plan. 2022, 228, 104575. [Google Scholar] [CrossRef]
  48. Gearin, E.; Hurt, C.S. Making space: A new way for community engagement in the urban planning process. Sustainability 2024, 16, 2039. [Google Scholar] [CrossRef]
  49. NEF. Participation Works! 21 Techniques of Community Participation for the 21st Century, 1st ed.; New Economics Foundation: London, UK, 1998; ISBN 1-899407-17-0. [Google Scholar]
  50. Arnstein, S.R. A Ladder of Citizen Participation. J. Am. Inst. Plan. 1969, 35, 216–224. [Google Scholar] [CrossRef]
  51. Peel, M.C.; Finlayson, B.L.; McMahon, T.A. Updated world map of the Köppen–Geiger climate classification. Hydrol. Earth Syst. Sci. 2007, 11, 1633–1644. [Google Scholar] [CrossRef]
  52. Câmara Municipal de Coimbra. Plano Municipal de Defesa da Floresta Contra Incêndios (2018–2027), Caderno I; Câmara Municipal de Coimbra: Coimbra, Portugal, 2018. Available online: https://fogos.icnf.pt/pmdfci/06_Coimbra/0603/3G/Caderno_I/PMDFCI_0603_Coimbra_CADERNO_I.pdf (accessed on 11 January 2026).
  53. Câmara Municipal de Coimbra. Plano Municipal de Ação Climática de Coimbra (PMAC-C); Câmara Municipal de Coimbra: Coimbra, Portugal, 2024. [Google Scholar]
  54. Ornelas, A.; Cordeiro, A.; Lameiras, J.M. Thermal comfort assessment in urban green spaces: Contribution of thermography to the study of thermal variation between tree canopies and air temperature. Land 2023, 12, 1568. [Google Scholar] [CrossRef]
  55. Cordeiro, A.M.; Ornelas, A.; Silva, D.D. The importance of topography in the formation of cold-air pooling in urban spaces: The example of the city of Coimbra (Portugal). Theor. Appl. Climatol. 2023, 152, 227–239. [Google Scholar] [CrossRef]
  56. Cordeiro, A.; Ornelas, A.; Lameiras, J.M. The thermal regulator role of urban green spaces: The case of Coimbra (Portugal). Forests 2023, 14, 2351. [Google Scholar] [CrossRef]
  57. Instituto Português do Mar e da Atmosfera (IPMA). Monitorização do Clima; IPMA: Lisboa, Portugal, 2024; Available online: https://www.ipma.pt/pt/oclima/monitorizacao/ (accessed on 11 January 2026).
  58. Instituto Português do Mar e da Atmosfera (IPMA). Normais Climatológicas 1981–2010: Coimbra/Bencanta; IPMA: Lisboa, Portugal, 2010. Available online: https://www.ipma.pt/bin/file.data/climate-normal/cn_81-10_COIMBRA_BENCANTA.pdf (accessed on 11 January 2026).
  59. World Meteorological Organization (WMO). Guide to Climatological Practices; WMO-No. 100; 2023 Edition; World Meteorological Organization: Geneva, Switzerland, 2023; ISBN 978-92-63-10100-6. [Google Scholar]
  60. FAO—Food and Agriculture Organization of the United Nations. CROPWAT 8.0 for Windows (Software) and User Guide; FAO: Rome, Italy, 2009. [Google Scholar]
  61. University of California Cooperative Extension; California Department of Water Resources. A Guide to Estimating Irrigation Water Needs of Landscape Plantings in California: The Landscape Coefficient Method and WUCOLS III; California Department of Water Resources: Sacramento, CA, USA, 2000.
  62. Washington State Department of Ecology. Determining Irrigation Efficiency and Consumptive Use; Publication No. 20-11-076; Washington State Department of Ecology: Olympia, WA, USA, 2024. Available online: https://apps.ecology.wa.gov/publications/summarypages/2011076.html (accessed on 11 January 2026).
  63. Águas de Coimbra, E.M. Tarifário de Abastecimento de Água e de Saneamento de Águas Residuais Para 2024 (Edital n.º 199/2023). Available online: https://www.aguasdecoimbra.pt/wp-content/uploads/Edital-n.o-199_2023-1.pdf (accessed on 11 January 2026).
  64. CYPE Ingenieros, S.A. Gerador de Preços: Espaços Urbanos (Portugal). Available online: https://www.geradordeprecos.info/espacos_urbanos/ (accessed on 24 April 2025).
  65. Monteiro, J.; Sousa, N.; Coutinho-Rodrigues, J.; Natividade-Jesus, E. Benchmarking real and ideal cities—A multicriteria analysis of city performance based on urban form. Cities 2024, 150, 105040. [Google Scholar] [CrossRef]
  66. Triantaphyllou, E. Multi-Criteria Decision Making Methods: A Comparative Study; Springer: New York, NY, USA, 2000. [Google Scholar] [CrossRef]
  67. Kutty, A.A.; Kucukvar, M.; Onat, N.C.; Ayvaz, B.; Abdella, G.M. Measuring sustainability, resilience and livability performance of European smart cities: A novel fuzzy expert-based multi-criteria decision support model. Cities 2023, 137, 104293. [Google Scholar] [CrossRef]
  68. Marull, J.; Padró, R.; La Rota-Aguilera, M.J.; Pino, J.; Giocoli, A.; Cirera, J.; Ruiz-Forés, N.; Coll, F.; Serrano-Tovar, T.; Velasco-Fernández, R. Modelling land use planning: Socioecological integrated analysis of metropolitan green infrastructures. Land Use Policy 2023, 126, 106558. [Google Scholar] [CrossRef]
  69. Aragão, F.V.; Chiroli, D.M.G.; Zola, F.C.; Aragão, E.V.; Marinho, L.H.N.; Correa, A.L.C.; Colmenero, J.C. Smart cities maturity model—A multicriteria approach. Sustainability 2023, 15, 6695. [Google Scholar] [CrossRef]
  70. Stachura, P.; Kuligowska, K. Multi-criteria analysis of urban policy for sustainable development decision-making: A case study for Warsaw city, Poland. Procedia Comput. Sci. 2021, 192, 259–269. [Google Scholar] [CrossRef]
  71. Masoumi, Z.; Van Genderen, J.V. Investigation of sustainable urban development direction using geographic information systems (case study: Zanjan city). Int. Arch. Photogramm. Remote Sens. Spatial Inf. Sci. 2019, XLII-2/W13, 1313–1320. [Google Scholar] [CrossRef]
  72. Pais, F.; Monteiro, J.; Sousa, N.; Coutinho-Rodrigues, J.; Natividade-Jesus, E. A multicriteria methodology for maintenance planning of cycling infrastructure. Proc. Inst. Civ. Eng. Eng. Sustain. 2022, 175, 248–264. [Google Scholar] [CrossRef]
  73. Aşur, F. Determination of User Preferences on Visual Landscape at Urban Context: Van/Edremit (Turkey) Example. Sustainability 2022, 14, 1596. [Google Scholar] [CrossRef]
  74. Zhang, N.; Zheng, X.; Wang, X. Assessment of Aesthetic Quality of Urban Landscapes by Integrating Objective and Subjective Factors: A Case Study for Riparian Landscapes. Front. Ecol. Evol. 2022, 9, 735905. [Google Scholar] [CrossRef]
  75. Keeney, R.L.; Raiffa, H. Decisions with Multiple Objectives: Preferences and Value Trade-Offs; Cambridge University Press: Cambridge, UK, 2014. [Google Scholar] [CrossRef]
  76. Zeleny, M. Multiple criteria decision making (MCDM). In Wiley StatsRef: Statistics Reference Online; Wiley: Hoboken, NJ, USA, 2014. [Google Scholar] [CrossRef]
Figure 1. Study area and spatial linkage between municipal green spaces (CEV codes) and irrigation water meters (CIL location codes) used for consumption screening and subsequent analyses in Coimbra, Portugal.
Sustainability 18 05335 g001
Figure 2. Typological classification of irrigation consumption profiles based on hourly meter data: (a) Scheduled irrigation, characterised by recurrent and temporally stable peaks; (b) continuous off-schedule consumption, indicating persistent flow outside expected irrigation windows; (c) short-duration leakage events, reflected by abrupt and isolated consumption spikes; (d) persistent leakage patterns, characterised by sustained anomalous flow across multiple daily cycles.
Sustainability 18 05335 g002
Table 1. Overview of survey types, target groups, objectives, format, duration and number of responses.
Survey TypeTarget GroupObjectiveFormatDurationResponses
RapidPark usersImmediate perceptions of use and current conditionsOn-site (QR code and tablets)2–3 min148
SchoolTeachers, staff and parentsAccessibility, safety and school-related useDigital (QR code and email via school)5–7 min126
ChildrenPrimary school pupilsChildren’s use, perception and desired improvementsPaper-based activity during school hours10–15 min280
GeneralResidents and park usersPerceived quality, use patterns and improvement prioritiesOnline (QR code, social media and local networks)8–10 min243
Table 2. Comparative analysis of screening-based estimated water losses and associated costs (2023–2024).
CEVCIL CodeLosses 2023 (m3)Loss Cost 2023 (€)Estimated Loss Share 2023 (%)Losses 2024 (m3)Loss Cost 2024 (€)Estimated Loss Share 2024 (%)
3018211578814.9 €6.0%1222.3 €8.3%
3020207155208386.5 €94.5%7381371.3 €99.2%
3022211624134249.0 €100%387719.1 €37.1%
3030 + 3091145864---39527343.1 €92.3%
3031209248210390.2 €46.6%---
3035 + 31402117021120.4 €100%14602712.8 €95.7%
304920786747.0 €2.4%23.0 €0.8%
3057 + 3076211598386717.2 €31.1%11.2 €0.1%
30582115614176.2 €13.0%300557.4 €100%
30701204771324.9 €12.8%1731.6 €13.9%
3078207184187347.5 €10.2%305566.7 €14.2%
308410052911426.0 €8.9%3259.5 €11.9%
Table 3. Annual comparison between estimated irrigation requirement and observed consumption (2024).
CEVArea (m2)Estimated NB (m3)Observed
Consumption (m3)
Potential Reduction (%)Potential Saving (€)
3018176.26813248%118.4 €
3049373.06147206.429%109.6 €
3057 + 3076617.39270484.444%399.1 €
30843078923061%261.4 €
Table 4. Comparative techno-economic performance of selected cover scenarios (1000 m2 reference area).
ScenarioCover CompositionAnnual Cost (€)Cost Reduction (%)Water Reduction (%)
A1Lawn 100%22630.00%0.00%
A2Meadow 100%94458.30%62.80%
B2Lawn 60% + Shrubs 40%177921.40%16.00%
C2Meadow 60% + Shrubs 40%98756.40%53.70%
D2Lawn 20% + Meadow 40% + Shrubs 30% + Inert Materials 10%114649.40%47.10%
E1Inert Materials 60% + Shrubs 40%42181.40%76.00%
Table 5. Decision matrix for intervention scenarios (per 100 m2).
Scenarios
(Per 100 m2)/
Criteria
Landscaping Cost (€)Full Irrigation Water Cost (€/Year)Water Cost 10 Years (€)Maintenance (€/Year)Aesthetic ValueFunctionalityBiodiversityInfiltration
A1—Grass2134959501314523
A2—Meadow144335220595254
A3—Shrubs344657290484344
A4—Inert17090002112
B2—Grass (60%) + Shrubs (40%)26598068697.84423
C2—Meadow (60%) + Shrubs (40%)22454424854.65354
D2—Grass (20%) + Meadow (40%) + Shrubs (30%) + Inert (10%)22095034464.24344
E1—Shrubs (40%) + Inert (60%)24042311619.23222
Table 6. Weighting schemes used in the multicriteria analysis (%).
Weight Sets/
Criteria
Landscaping Cost (€)Annual Water Cost (€)Water Cost 10 Years (€)Maintenance (€/year)Aesthetic ValueFunctionalityBiodiversityInfiltration
Set 1—Initial cost2020101010101010
Set 2—Maintenance cost1010202010101010
Set 3—Cost202020205555
Set 4—Urban quality1010101010201020
Set 5—Bio-aesthetic1010101020102010
Set 6—Eco-social555520202020
Set 7—Water Efficiency10153015105510
Table 7. Ranking of scenarios across weighting schemes and final aggregated ranking.
ScenarioSet 1Set 2Set 3Set 4Set 5Set 6Set 7Average RankFinal Rank
A1—Grass78856586.718
A2—Meadow12232211.861
A3—Shrubs66644465.145
A4—Inert33178824.574
B2—Grass + Shrubs87765676.577
C2—Meadow + Shrubs21411131.861
D2—Mixed44523353.713
E1—Shrubs + Inert55387745.576
Note: Bold values indicate the best-performing scenarios in the final ranking.
Disclaimer/Publisher’s Note: The statements, opinions and data contained in all publications are solely those of the individual author(s) and contributor(s) and not of MDPI and/or the editor(s). MDPI and/or the editor(s) disclaim responsibility for any injury to people or property resulting from any ideas, methods, instructions or products referred to in the content.