Article

Research on the Development and Application of New Eco-Friendly Noise Barrier Materials Based on Recycled Waste


1
Beijing Highway Traffic Engineering Co., Ltd., Beijing 101118, China
2
Architecture Acoustics Laboratory, School of Architecture, Tsinghua University, Beijing 100084, China
*
Author to whom correspondence should be addressed.
Sustainability 2026, 18(11), 5332; https://doi.org/10.3390/su18115332
Submission received: 19 April 2026 / Revised: 10 May 2026 / Accepted: 14 May 2026 / Published: 26 May 2026
(This article belongs to the Special Issue Advances in Research on Sustainable Waste Treatment and Technology)

Abstract

Traffic noise adversely affects residents near expressways, calling for sustainable noise mitigation solutions. This study developed three eco-friendly sound-absorbing panels from sand, industrial slag, and microporous ceramics. By optimizing aggregate gradation, the influence of porosity and flow resistivity on absorption coefficients was analyzed to determine optimal mix ratios. The panels were integrated into perforated metal noise barriers and evaluated through reverberation room and sound insulation tests. Field simulations using SoundPLAN for a residential project in Taizhou validated real-world performance. Results showed that slag panels achieved a Noise Reduction Coefficient (NRC) of 0.70, while sand and ceramic panels both reached 0.55. All configurations maintained a weighted sound reduction index (Rw) of 25–26 dB. Empirical simulations confirmed that a 2.5 m high barrier keeps noise levels within the 60 dB limit. Compared with traditional glass wool, these inorganic panels offer comparable noise reduction, superior non-combustibility, and better weather resistance, making them effective for frequency-specific noise control in urban engineering applications.

1. Introduction

Urban transportation networks are increasingly dense, making rapid transit essential. However, noise from engines, aerodynamics, and tire-pavement interaction poses significant health threats to residents [1], particularly near congested intersections with higher noise levels [2,3]. Long-term exposure increases risks of cardiovascular disease, sleep disorders, and depression [4,5,6]. The Report on the Prevention and Control of Noise Pollution in China (2025) noted 228,000 traffic noise complaints in 2024, highlighting an urgent need for mitigation [7].
Installing barriers along propagation paths is the most effective engineering method for residential noise control. Common approaches include ecological buffers [8,9] or metal barriers at site boundaries [10]. Noise barriers optimize the acoustic environment through the combined effects of sound absorption, sound insulation, and the reflection of sound energy. Beyond geometric shape [11], barrier performance depends heavily on internal materials and construction [12]. Effective designs must balance acoustics, aesthetics, durability, and cost [13].
Composite structures of porous and standard concrete are prevalent for noise barriers [14]. Sound waves entering the porous matrix generate friction as air molecules move against the walls of micro-voids. This process, governed by air viscosity and thermal conductivity, converts acoustic energy into heat [15]. To support the circular economy, researchers have explored recycled waste aggregates like bottom ash [16], recycled waste concrete [17], fly ash and waste rubber [18], polystyrene granules, polyethylene terephthalate granules, corn cob granules, shredded sunflower stalk and balls made of sheep wool [19] etc. While these achieve Noise Reduction Coefficients (NRC) values of 0.20–0.60, traditional concrete faces challenges from aggregate depletion and high environmental footprints [20]. Furthermore, current research lacks validation in complex, real-world urban environments. Thus, developing eco-friendly components and evaluating them in “Quiet Housing” projects holds substantial academic and practical significance.

2. Materials and Experimental Techniques

2.1. Materials

Guided by principles of resource recycling and environmental friendliness, this study utilizes natural resources or waste products as aggregates for porous sound-absorbing panels. These include sand particles, industrial slag, and microporous ceramsite.

2.1.1. Sand Particles

To mitigate the ecological pressure caused by the over-extraction of river sand [19], dune sand was selected as the primary aggregate, a choice validated in previous sustainable concrete research [21]. Sand panels are fabricated by bonding natural sand grains with inorganic silicon-based solvents. Preliminary study indicate that these materials can achieve a broadband average sound absorption coefficient ( α ¯ ) of 0.66, calculated as the arithmetic mean of absorption coefficients across the primary frequency range (typically 100–5000 Hz for traffic noise) to evaluate the broadband performance of components [22], offering superior durability, environmental performance, and cost-effectiveness compared to glass wool and micro-perforated metal plates.

2.1.2. Industrial Slag

Slag aggregates are produced from high-temperature combustion (1500–1700 °C) in industrial boilers and collected via a wet ash removal process, which leverages the water-cooling quenching effect to promote the formation of a rich and stable porous microstructure within the slag, while effectively suppressing secondary pollution from fine dust particles [23]. The resulting material exhibits stable physical properties and a broad particle size distribution ranging from 0.1 mm to several millimeters. Optimizing the particle size gradation increases the open void ratio, thereby enhancing acoustic absorption. Research indicates that novel acoustic materials [24] or sound barriers [25] fabricated by mixing this type of slag with cement can achieve the NRC of approximately 0.30. Furthermore, wet-processed boiler slag is chemically inert and exhibits an extremely low heavy metal leaching rate tested under the EN 12457-4 standard falling well below environmental safety limits [23,26]. In coal-intensive developing countries like China, the wide availability of raw materials for slag panels offers a promising solution to mitigate the pressure of industrial solid waste disposal.

2.1.3. Microporous Ceramsite

The raw materials for microporous ceramic panels are derived from river silt or municipal sewage sludge, which are calcined at 1100 °C to form lightweight aggregates with a minimum particle size of less than 1 mm. Previous studies have demonstrated that adjusting the aggregate size, panel thickness [27], and internal pore structure [28] can significantly enhance the sound absorption performance of ceramsite products. To address structural load-bearing limitations, CEM I 42.5N Portland cement is utilized as the binding agent.

2.2. Sample Preparation Process

All specimens were manufactured using low-cost molding processes. The raw materials were ground and sieve-screened to obtain three particle size fractions, as detailed in Table 1:
To accommodate the distinct physical properties of the aggregates, differentiated binder systems were implemented. For sand and slag aggregates, the two-component polysiloxane (Elkem Silicones, Lyon, France) was employed as the binder at a dosage of 6–8 wt% relative to the aggregate mass. Polysiloxane was selected over epoxy resin due to its superior fire resistance, lower volatile organic compound (VOC) emissions, and reduced brittleness, ensuring better structural integrity after curing. Methodologically, for small-sized particles such as sand and slag, the polysiloxane system forms a uniform thin-film coating, thereby avoiding the excessive airflow resistivity commonly caused by pore clogging from cementitious hydration products. In contrast, microporous ceramic panel utilized CEM I 42.5N Portland cement as the binder at a dosage of 70–80 wt%. The cementitious matrix establishes a supportive skeleton and constructs interconnected pores among the larger aggregates, achieving an optimal balance between mechanical density and acoustic absorption.
The mixtures were stirred to a homogeneous consistency and cast into molds using a cold-pressing technique. To ensure the stability and reproducibility of the pore structure, compaction pressures were tailored to the aggregate characteristics: 3.0 MPa for sand panel, 2.7 MPa for slag panel, and 4.0 MPa for microporous ceramic panel—the latter being higher due to the rheology of the cement paste and the relative hardness of the particles.
The specimens were cured naturally at ambient temperature (20–25 °C) for 16–24 h. While elevated temperatures (e.g., 150 °C) can accelerate the curing process to 1–2 h, ambient curing was strictly adopted to mitigate micro-cracks induced by thermal stress, thereby ensuring the consistency of subsequent acoustic measurements. Following demolding, the specimens underwent precision cutting and edge-grinding to reach the final standardized dimensions for inorganic sound-absorbing panels.
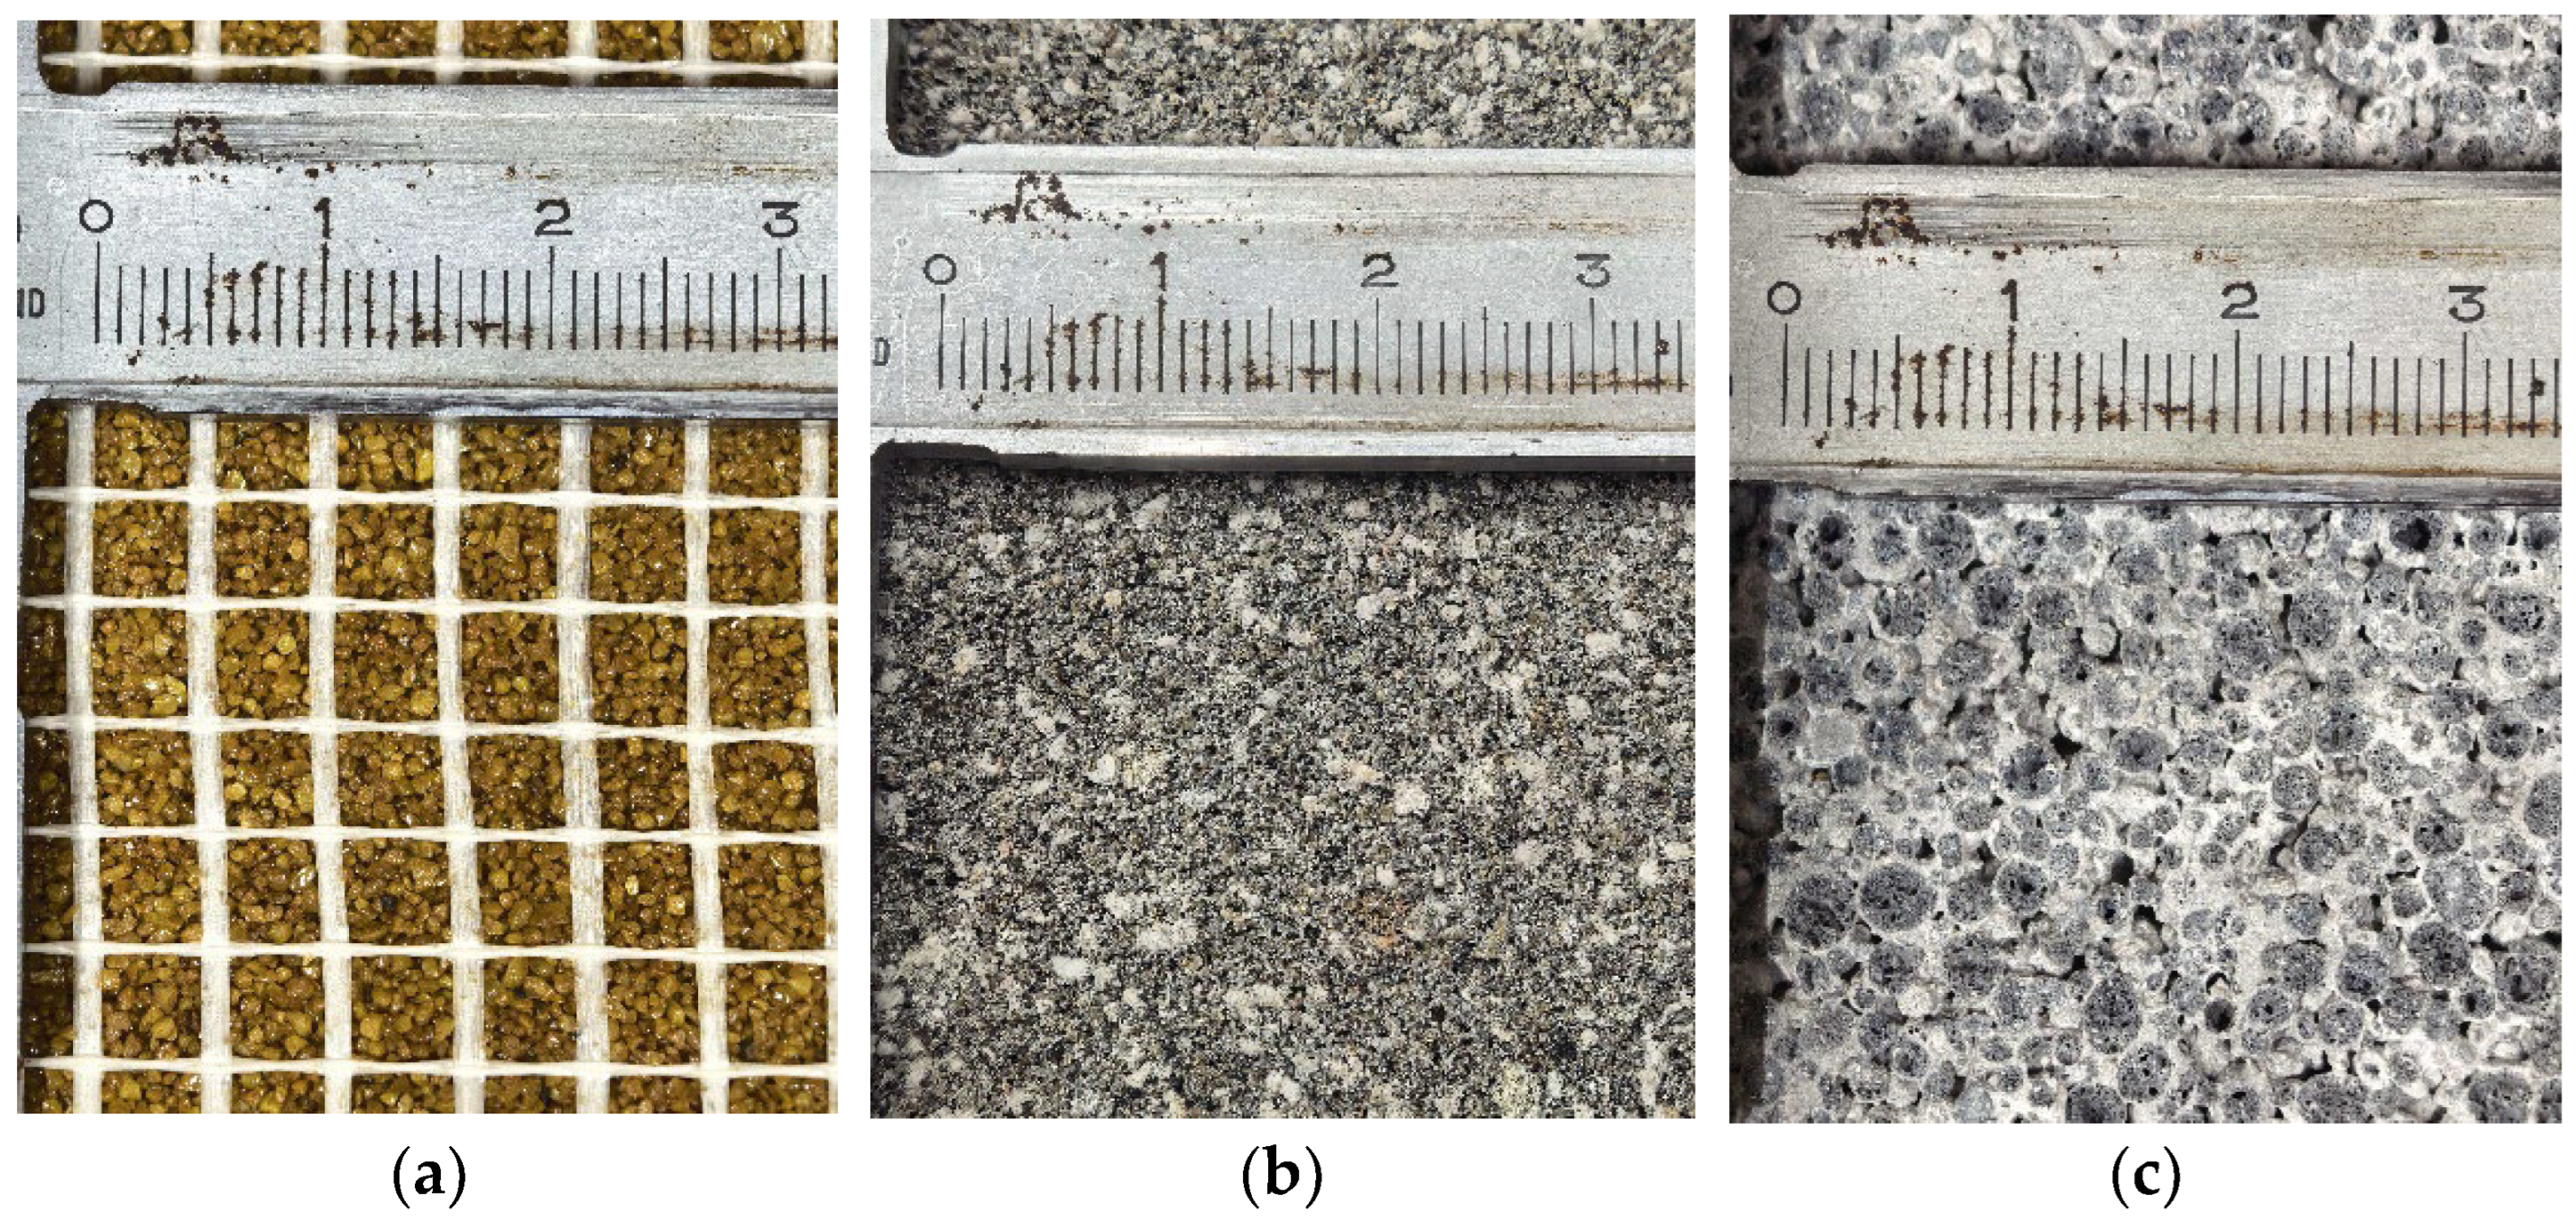
A schematic representation of the three panel products is provided in Figure 1.
The classic Johnson-Champoux-Allard-Lafarge (JCAL) model describes the attenuation of sound waves within pores through viscous and thermal loss mechanisms. Description of its acoustic characteristics depends on the following six key physical parameters: porosity (ϕ), flow resistivity (σ), tortuosity (α), viscous characteristic length (Λ), thermal characteristic length (Λ′), and static thermal permeability (k0) [29]. Among these, flow resistivity (σ) is the core parameter determining the low-frequency acoustic performance of a material, reflecting the viscous resistance loss generated as sound waves pass through the porous skeleton. Within the JCAL framework, flow resistivity and static viscous permeability (k0) satisfy the relationship: σ = η/k0 (where η is the dynamic viscosity of air), which serves as the foundation for constructing the dynamic density function. Existing research on the sensitivity of JCAL parameters suggests that flow resistivity, porosity, and tortuosity are the most influential factors determining the absorption coefficient for granular materials [14,30]. Consequently, during the initial material development phase, this study prioritizes these three dominant parameters over the characteristic lengths, which require more complex microscopic scanning.
To optimize low-frequency performance, this study introduced varied aggregate size ratios to enhance parameters like tortuosity, thereby increasing sound energy dissipation efficiency. For 20 mm thick specimens of the three materials, open porosity (the ratio of interconnected pore volume to total volume) was measured using the gas expansion method for panels with different particle size combinations [31]. Static airflow resistivity was then measured using the Direct Airflow Method in accordance with ISO 9053-1:2018 [32], and the normal-incidence sound absorption coefficient was measured using the Impedance Tube Method.
Multiple mix ratios were initially examined for each raw material category, and physical parameters were measured on five parallel specimens per ratio to ensure data repeatability and reliability. Acoustic performance (NRC ≥ 0.40) was set as the primary selection criterion, supplemented by practical engineering considerations including compressive strength, screw-holding capacity, and molding process stability. For example, certain slag panel configurations achieving an NRC of 0.50 were excluded due to insufficient screw-holding capacity (<300 N) resulting from a high proportion of large-sized aggregates, which would compromise installation integrity. Based on these criteria, representative mix ratios were selected for in-depth analysis, with their physical parameter statistics (mean ± standard deviation) summarized in Table 2. The NRC, a key indicator of acoustic performance, is calculated as the arithmetic mean of absorption coefficients at 250 Hz, 500 Hz, 1000 Hz, and 2000 Hz, rounded to the nearest 0.05. Ranging from 0.00 (total reflection) to 1.00 (total absorption), the NRC directly reflects the barrier’s capacity to mitigate broadband traffic noise.
Experimental measurements demonstrate a strong correlation between specific flow resistivity and the NRC for each sample group. This relationship generally aligns with the viscous loss laws governing porous sound-absorbing materials, where acoustic performance is co-determined by particle size ratio and porosity. For instance, in the Sand Panel 02 group, optimizing the proportion of micro and medium sized particles resulted in a specific flow resistivity of 1849 ± 30 Pa·s/m2 and a peak NRC of 0.60. These findings indicate that an appropriate particle size gradation increases pore channel tortuosity, thereby enhancing viscous friction and thermal loss of sound waves against pore walls while maintaining overall porosity at approximately 43.0%.
However, the increase in sound absorption performance relative to specific flow resistivity is non-linear, exhibiting a distinct critical threshold. Analysis of the Sand Panel 03 and Slag Panel 05 groups reveals that when specific flow resistivity rises to 3490 ± 37 and 2165 ± 52 Pa·s/m2, respectively—due to excessively fine particles or over-compaction—their NRC values drop to 0.40 and 0.45. Excessive flow resistivity indicates a severe mismatch between the material’s characteristic acoustic impedance and that of air, causing a significant portion of mid-to-low frequency sound waves to reflect off the surface rather than penetrating the structure for dissipation. This observation aligns with previous research concluding that while increasing flow resistivity offers limited improvement for low-frequency absorption in sand panels, it leads to a decline in high-frequency performance, ultimately detrimental to overall noise reduction. In contrast, the Slag Panel series, characterized by a lower bulk density (average between 553–788 kg/m3) and a higher average porosity (approximately 48%), achieves superior acoustic matching within a lower flow resistivity range. This underscores the structural advantages of lightweight porous aggregates for broadband sound absorption applications.
Compared to the lightweight slag panels, the introduction of a cementitious matrix (70–80%) in the microporous ceramic panel group significantly increased its bulk density (average between 1146–1778 kg/m3), resulting in NRC values generally stabilizing between 0.40 and 0.55. Analysis of the microporous ceramic panel 03 group reveals that when the gradation span increases (using a three-tier gradation of 1.0–3.0 mm), the filling effect of fine particles within the voids of larger aggregates causes the porosity to drop to the group’s lowest value of 32.7%. Furthermore, the specific flow resistivity rises to 2952 ± 39 Pa·s/m2, leading to a degradation in acoustic performance. This demonstrates that for cement-based porous materials, it is essential to strictly control the uniformity of particle size gradation or optimize the aggregate-to-matrix ratio. Such measures are necessary to prevent excessive compaction, thereby maintaining the required interconnected pore structure and acoustic impedance matching.
According to the acoustic impedance matching theory [30], the sound absorption performance is primarily governed by the degree of matching between their characteristic impedance and the characteristic impedance of air (approximately 415 Pa·s/m). Under the constraint of 20 mm sample thickness, the distinct physical properties of the three aggregate types lead to significantly different optimal flow resistivity (σ) thresholds for achieving impedance matching. Experimental data fitting indicates that for sand panels—which utilize fine grains (0.2–0.7 mm) resulting in a highly dense pore structure and elevated tortuosity—a higher flow resistivity is required to compensate for the limited propagation path, with an estimated optimal threshold of 1000–1900 Pa·s/m2. In contrast, slag panels, benefiting from a high porosity and a loose skeleton, achieve ideal impedance matching at a lower flow resistivity level (500–1000 Pa·s/m2). The microporous ceramic panels, however, are restricted by the cementitious matrix (70–80%), leading to inferior pore connectivity and high sensitivity to compaction; thus, they exhibit a narrow adaptation range with an optimal threshold concentrated between 600–900 Pa·s/m2.
For subsequent studies, the optimal mixing ratios for three materials—Sand Panel 02, Slag Panels 02 and 03, and Microporous Ceramic Panel 01—were selected for further testing. Considering the application requirements of noise barriers in complex engineering environments, the non-acoustic indicators of the candidate materials were evaluated by a testing agency accredited with China Metrology Accreditation (CMA) qualifications. All materials demonstrated excellent engineering compatibility. Specifically, the combustion performance of all materials met the Class A non-combustible standard, and total volatile organic compound (TVOC) emission rates were below 0.065 mg/(m2·h), ensuring environmental friendliness and safety within semi-enclosed noise barrier structures. Regarding construction feasibility, the screw-holding capacity of the sand panels, slag panels, and microporous ceramic panels exceeded 650 N, 400 N, and 400 N, respectively, all meeting the mechanical requirements for secure installation within metal casings.
Further analysis of the core advantages reveals that the sand panel exhibits outstanding mechanical properties, with a maximum compressive strength of 29.1 MPa and a flexural strength of 24.7 MPa. These characteristics provide sufficient support for high-load scenarios and demonstrate its potential to serve as a self-supporting component. The slag panel, while possessing a lower compressive strength of 12.4 MPa, demonstrates exceptional weather resistance, with a strength retention rate exceeding 99% after 25 freeze–thaw cycles, making it ideal for high-latitude cold regions. Meanwhile, the microporous ceramic panel offers high stability for road sections subjected to complex dry-wet cycles, characterized by an extremely low moisture expansion rate of 0.03% and a stable flexural strength of 4.0 MPa.
From a life cycle assessment (LCA) perspective, the novel sound-absorbing panels were compared with conventional materials, such as glass wool. Studies indicate that the environmental burden of glass wool is primarily concentrated in the raw material extraction and the high-temperature melting and fiberization stages [33]. According to the Inventory of Carbon and Energy (ICE) V4.1 database, the embodied carbon of glass wool is approximately 1.53 kg CO2-eq/kg. In contrast, the natural sand, industrial slag, and microporous ceramsite used herein are natural materials or industrial by-products with extremely low initial embodied carbon coefficients (0.005, 0.07, and 0.7 kg CO2-eq/kg, respectively). After accounting for the binder ratios (two-component polysiloxane or CEM I cement), the total embodied carbon of the newly developed panels is approximately 0.32, 0.38, and 0.48 kg CO2-eq/kg, representing only 20–31% of that of glass wool. Furthermore, unlike glass wool, which requires energy-intensive melting at 1300–1500 °C (with production energy consumption typically ≥25 MJ/kg), the proposed cold-pressing process (3–4 MPa) consumes only 0.5 MJ/kg, leading to pressing-stage emissions of approximately 0.08 kg CO2-eq/kg (based on the average emission factor of the Chinese power grid). Moreover, these inorganic panels offer superior structural stability and non-combustibility, avoiding moisture-induced collapse or fiber shedding risks. Their longer service life and potential for secondary recycling as road base or aggregates further reduce the overall life cycle burden.

3. Specimen Testing for Noise Barriers

3.1. Experimental Overview

To evaluate the practical application effects of these novel eco-friendly materials in noise barrier, this study utilized standardized perforated metal noise barriers as the structural shells. The unit barrier dimensions were set at 1950 mm × 520 mm × 90 mm. The selected material was 1.5 mm thick galvanized steel plate, featuring groove structures on both sides to enable seamless modular splicing. The sound-facing surface was precision-perforated with a hole diameter of 2.5 mm and a center-to-center spacing of 4 mm. The total perforation rate was calculated as 30.92%, ensuring that sound waves can efficiently enter the interior of the barrier.
Test panels were filled inside the barrier shell, secured to the inner side of the perforated faceplate using bolts and washers, creating an air cavity between the panels and the metal backplate. This “perforated plate–absorbent material–air layer” composite structure was designed to optimize frequency response characteristics. The experimental groups included sand panels, microporous ceramic panels, and two densities (high and low) of slag panels. All filling materials were prepared according to the optimal mixing ratios determined in the previous material tests.
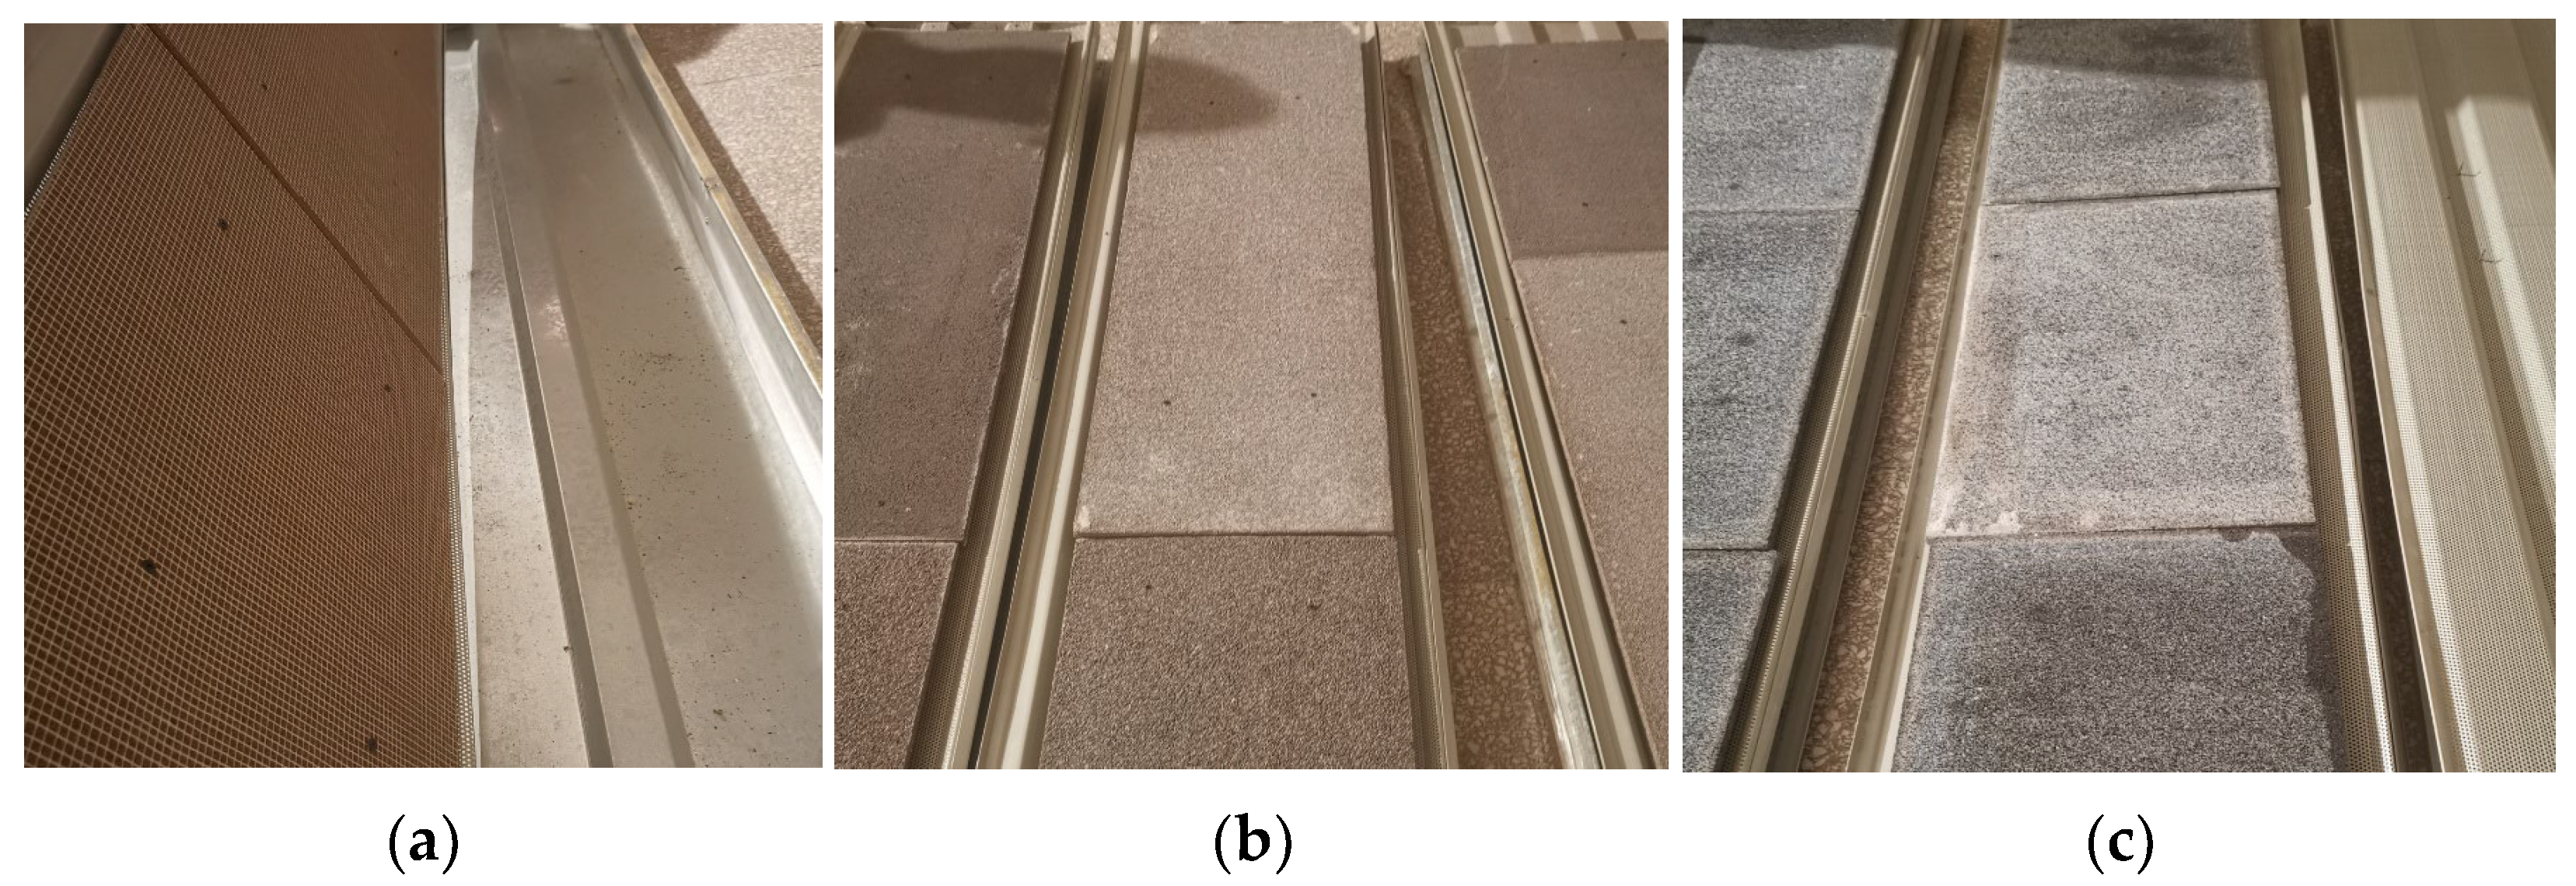
Based on prior laboratory research, increasing panel thickness from 20 mm to 30 mm or 50 mm enhances sound absorption performance at mid-to-low frequencies below 800 Hz but leads to a decline in performance within the 1000–2000 Hz range [22]. Furthermore, the addition of a rear cavity significantly improves low-frequency absorption as the air layer thickness increases, raising the average sound absorption coefficient by approximately 0.10–0.20 [22]. However, the increased panel weight associated with greater thickness negatively impacts transportation and installation costs, as well as structural stability, hindering its application in practical engineering. Consequently, the physical specifications of the panels were standardized to a thickness of 20 mm for comparative analysis, as illustrated in Figure 2.

3.2. Analysis of Sound Absorption Performance

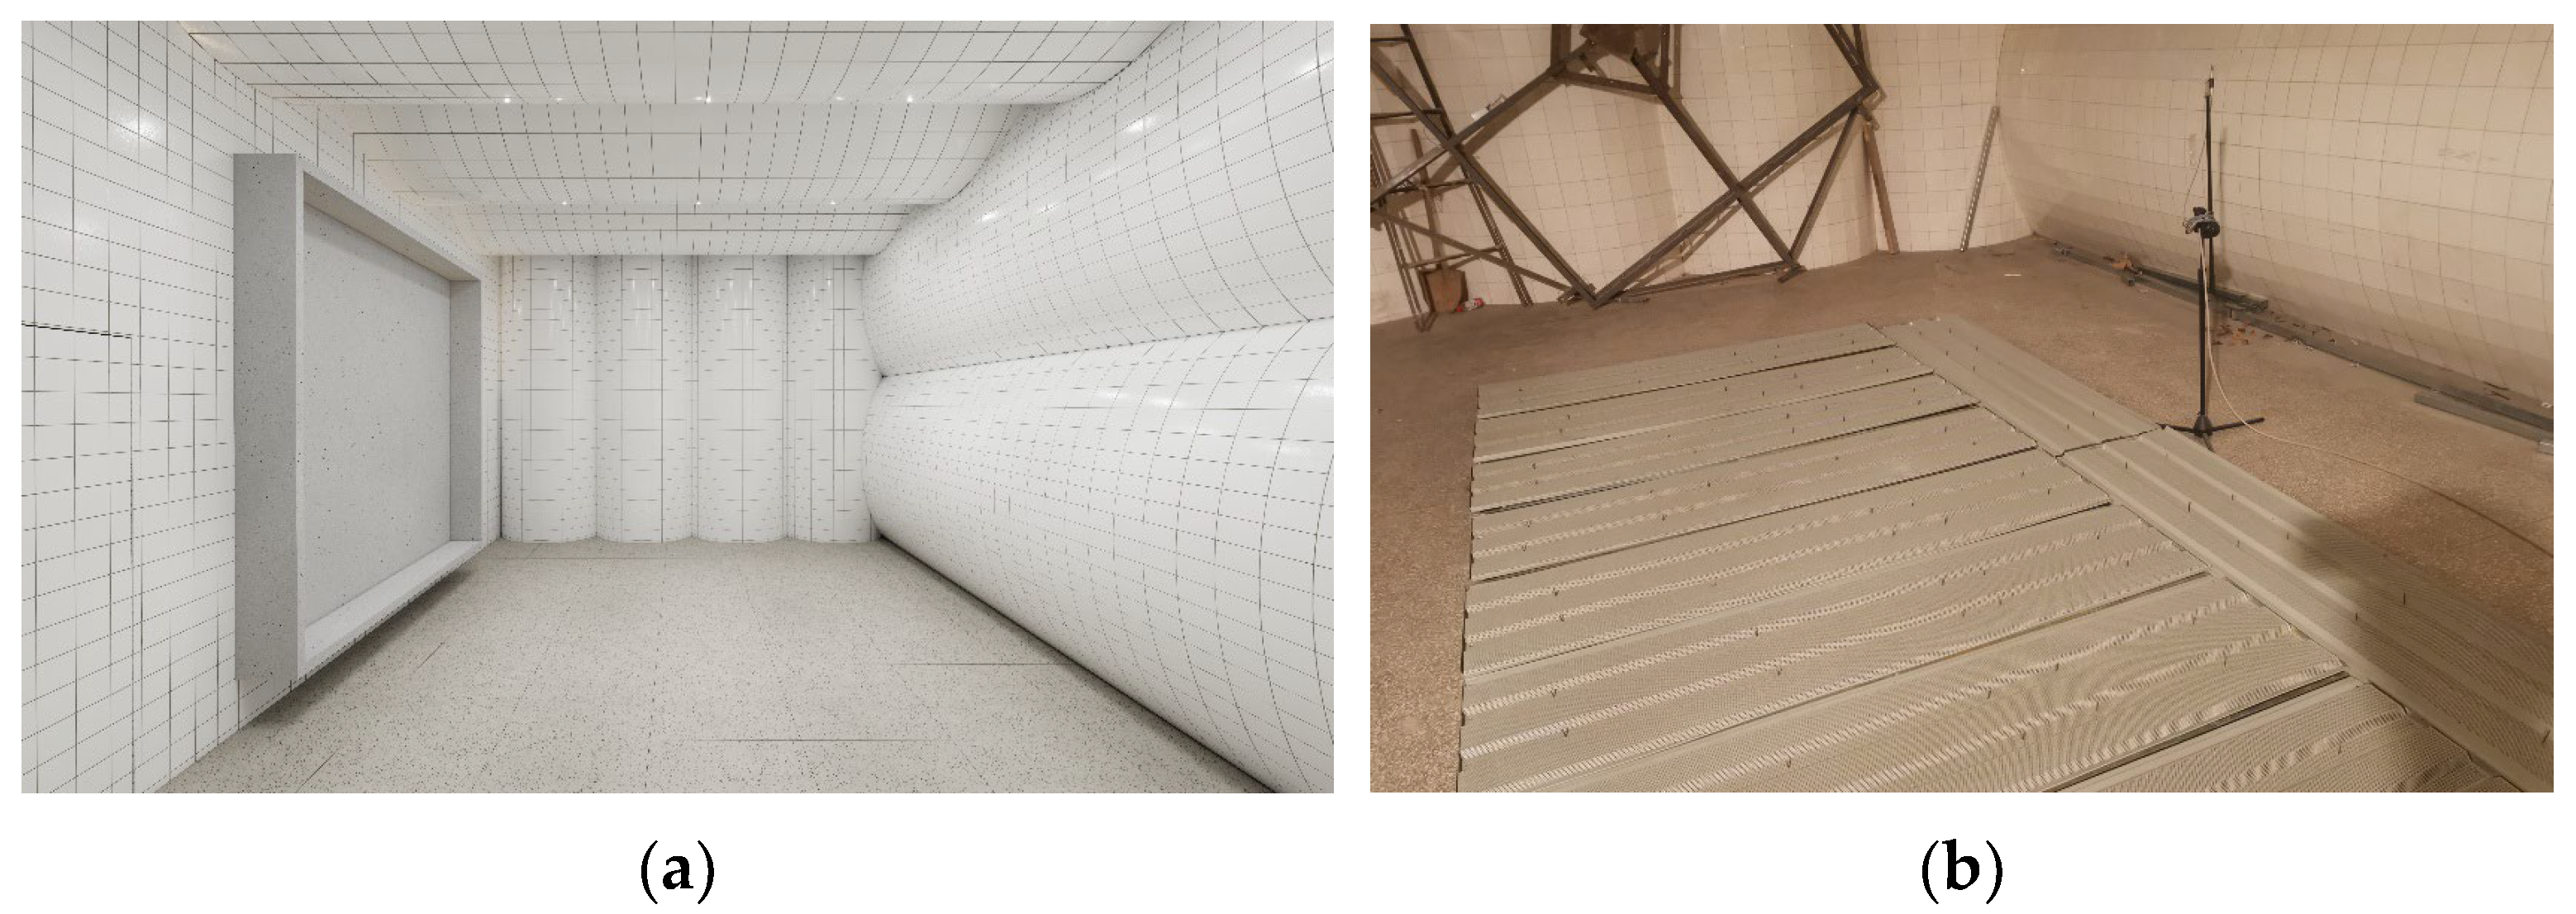
To investigate the acoustic effects in real environments, the Reverberation Room Method was employed to determine the diffuse-field absorption coefficient, rather than the normal-incidence absorption coefficient. The testing process strictly followed the ISO 354:2003 standard [34]. Measurements were conducted in standard reverberation laboratory with a volume of approximately 200 m3, where the samples consisted of 10 sets of metal noise barrier units laid flat, as shown in Figure 3. The experiment analyzed sound absorption data across the full frequency band 100–5000 Hz and calculated the NRC.
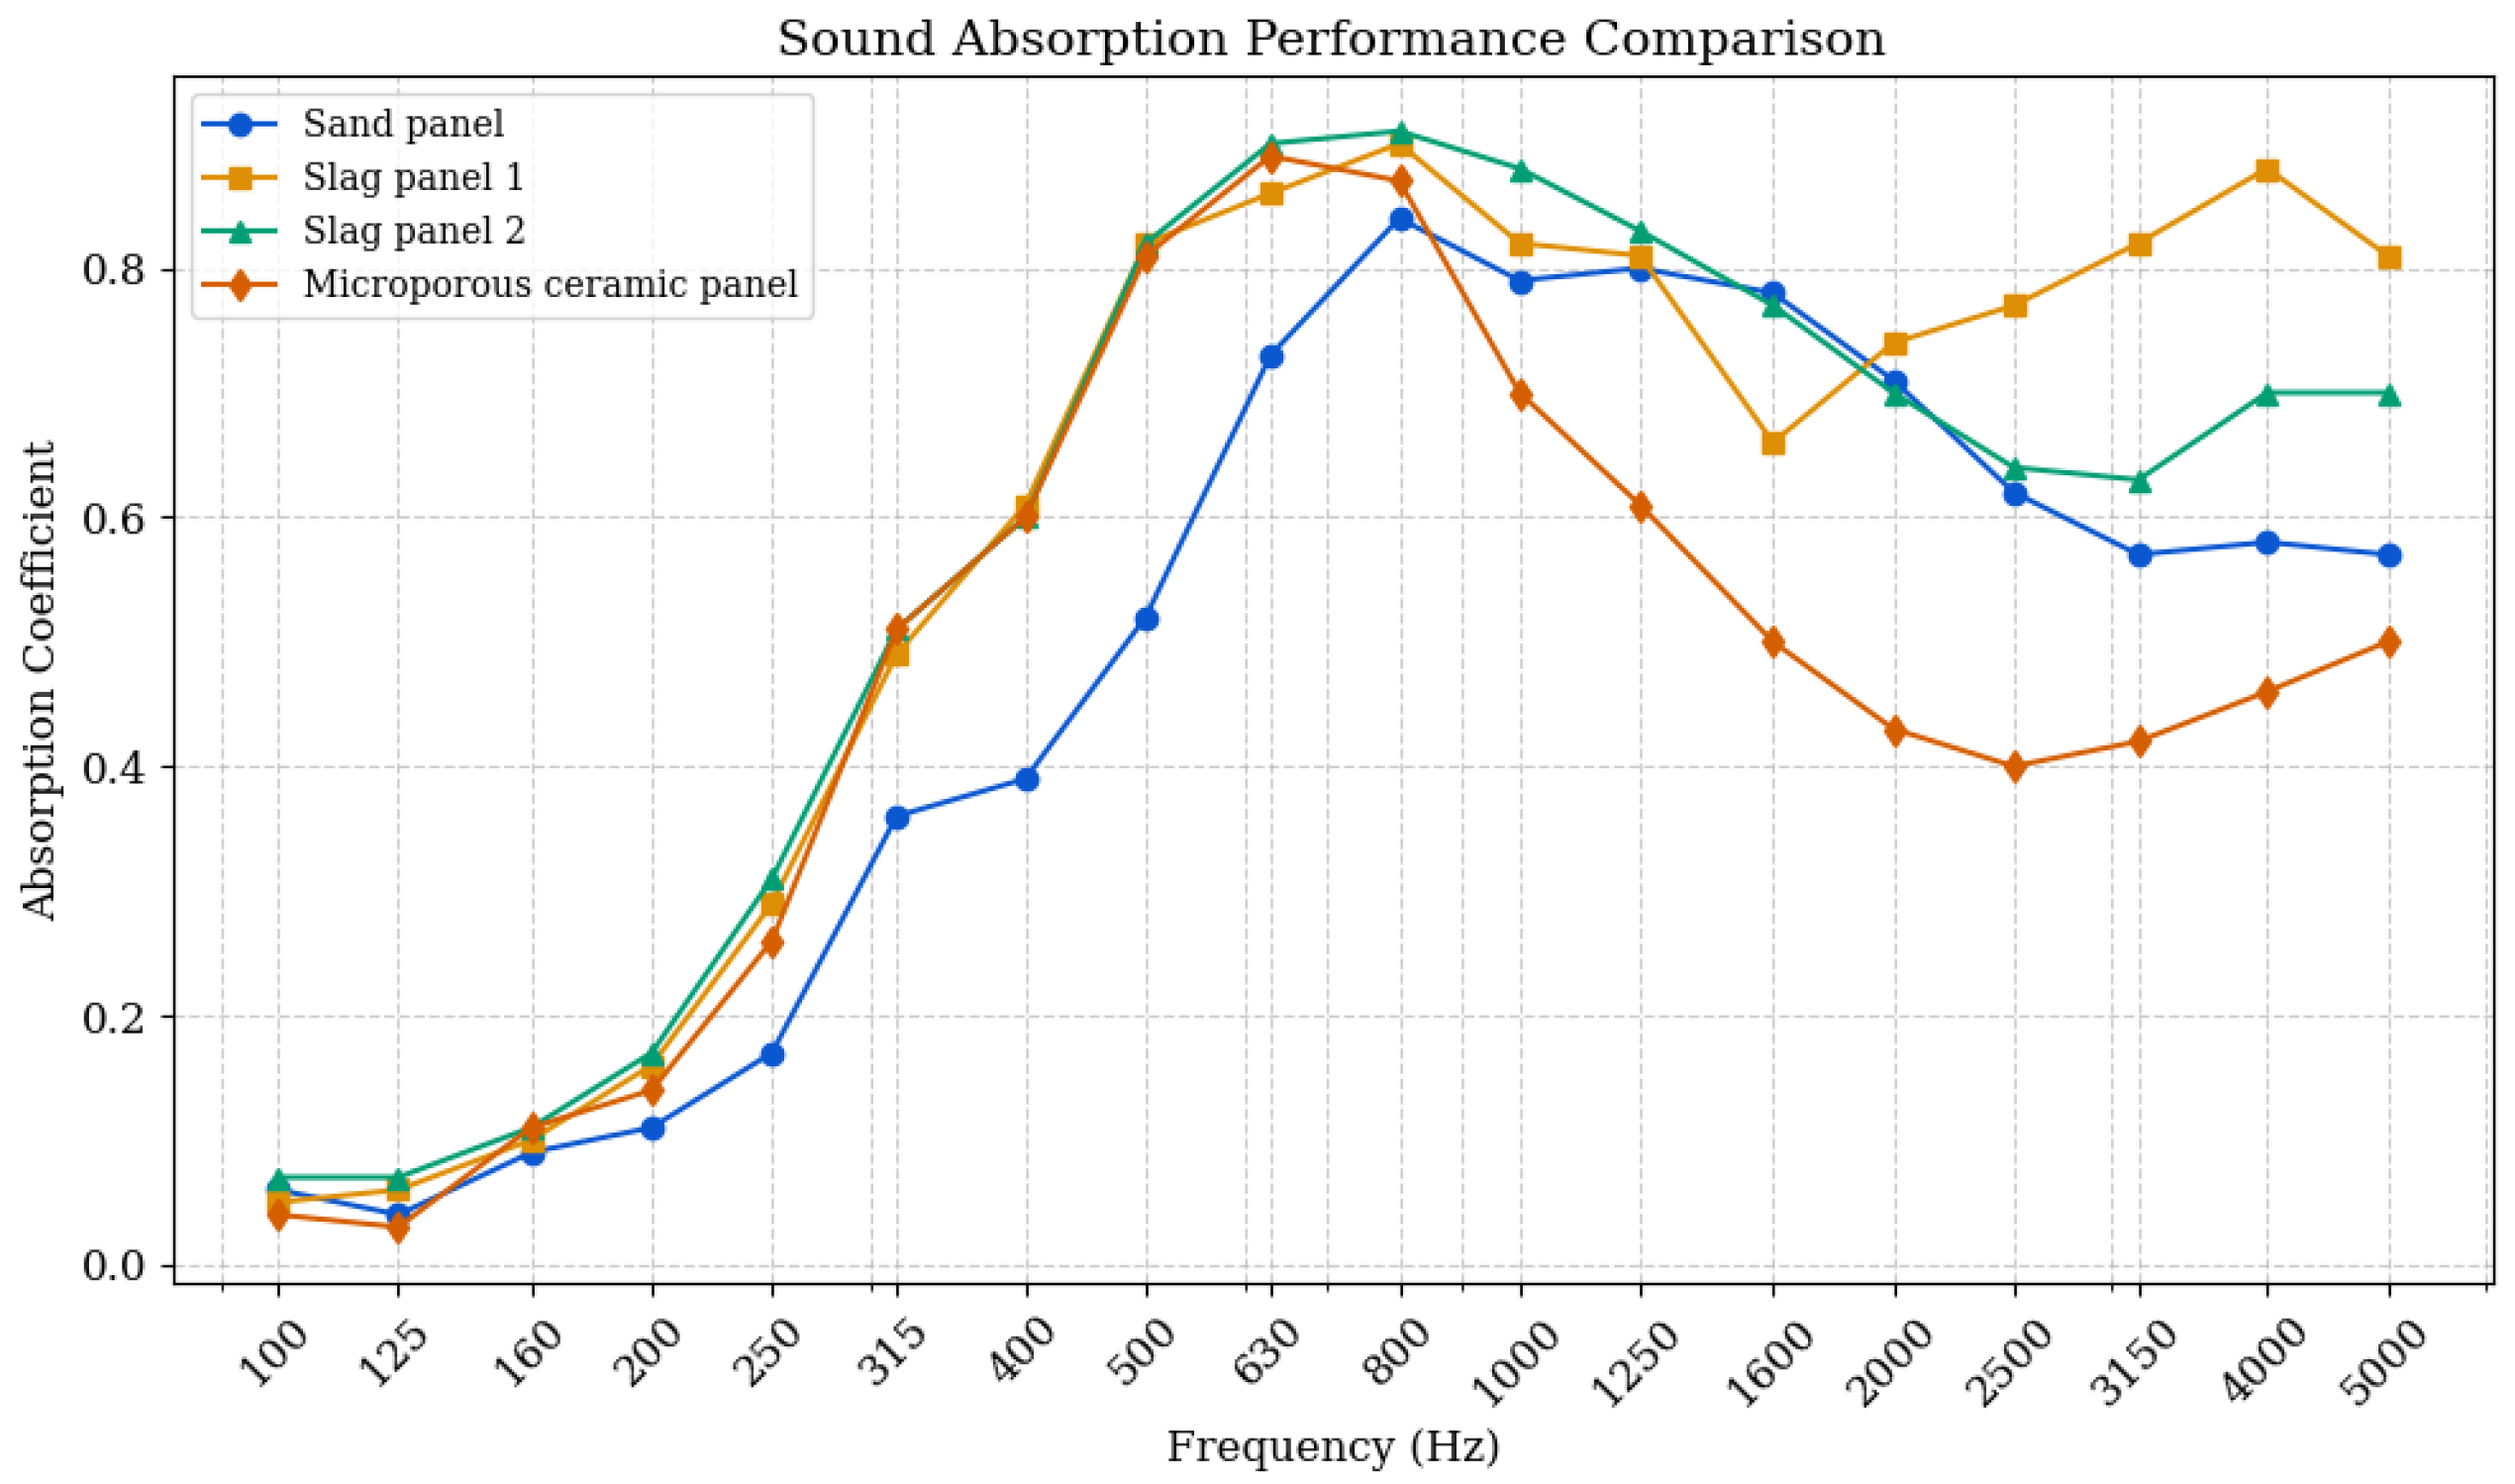
Experimental results indicate that four groups of composite structural barriers exhibit excellent broadband sound absorption characteristics. As shown in Table 3, the average sound absorption coefficient across the full frequency band for the slag panels exceeds 0.50, with NRC reaching 0.70. This performance is significantly superior to sand panels and microporous ceramic panels, both of which achieved an NRC of 0.55. This advantage is primarily attributed to the slag panels’ outstanding absorption ability at frequencies below 800 Hz and above 2000 Hz. The performance across various frequency bands is illustrated in Figure 4.
In the low-frequency range (below 500 Hz), the slag panels exhibit the most prominent performance in dissipating long-wavelength sound energy, attributed to their high porosity of approximately 48.0%. In 315–400 Hz, the microporous ceramic panels show performance similar to the slag panels, which may be attributed to their internal secondary microporous structure that likewise enhances low-frequency sound energy conversion. In contrast, the sand panels show slightly lower results within the 160–500 Hz range, reaching only 0.17 at 250 Hz, which due to the dense structure and highest density, creating significant resistance to the penetration of low-frequency sound waves, as reflected by the specific flow resistivity of 1849 Pa·s/m2.
The frequency range of 500–2000 Hz, which covers the primary energy interval of traffic noise, serves as the core index for measuring the effectiveness of noise barriers. Within this range, Slag Panel 2 reaches its peak with a maximum absorption coefficient of approximately 0.90 at 630–1000 Hz, while Slag Panel 1 maintains a level above 0.80 below 1250 Hz despite minor fluctuations. The sand panels demonstrate excellent stability in the mid-frequency band, with the absorption curve maintaining a plateau between 0.78 and 0.84 in the 800–1600 Hz range, indicating that their optimized mixing ratio achieves an ideal match between flow resistivity and air impedance. In contrast, the microporous ceramic panel experiences a significant decline after reaching a peak of 0.87 at 800 Hz, dropping to approximately 0.40 at 2000 Hz. This degradation is likely due to the high proportion of cementitious matrix (70–80%), which may lead to a reduction in the connectivity of the microporous structure, causing the flow resistivity to exceed the critical threshold. This results in a severe acoustic impedance mismatch for high-frequency sound waves at the material surface, making it difficult for sound energy to penetrate into the pores for dissipation.
In the high-frequency range (2000–5000 Hz), the sand panel exhibits a downward trend in sound absorption as frequency increases, yet its coefficient remains consistently above 0.50. In contrast, the microporous ceramic panel shows the lowest performance among the four configurations; although it recovers slightly after 2500 Hz, its high-frequency absorption coefficient plateaus between 0.40 and 0.50. Notably, Slag Panel 1 demonstrates unique high-frequency absorption characteristics, with a secondary surge after 2000 Hz reaching 0.88 at 4000 Hz. This broadband, high-absorption capability provides a significant advantage in mitigating high-frequency noise, such as tire-pavement noise generated at high speeds.

3.3. Analysis of Sound Insulation Performance

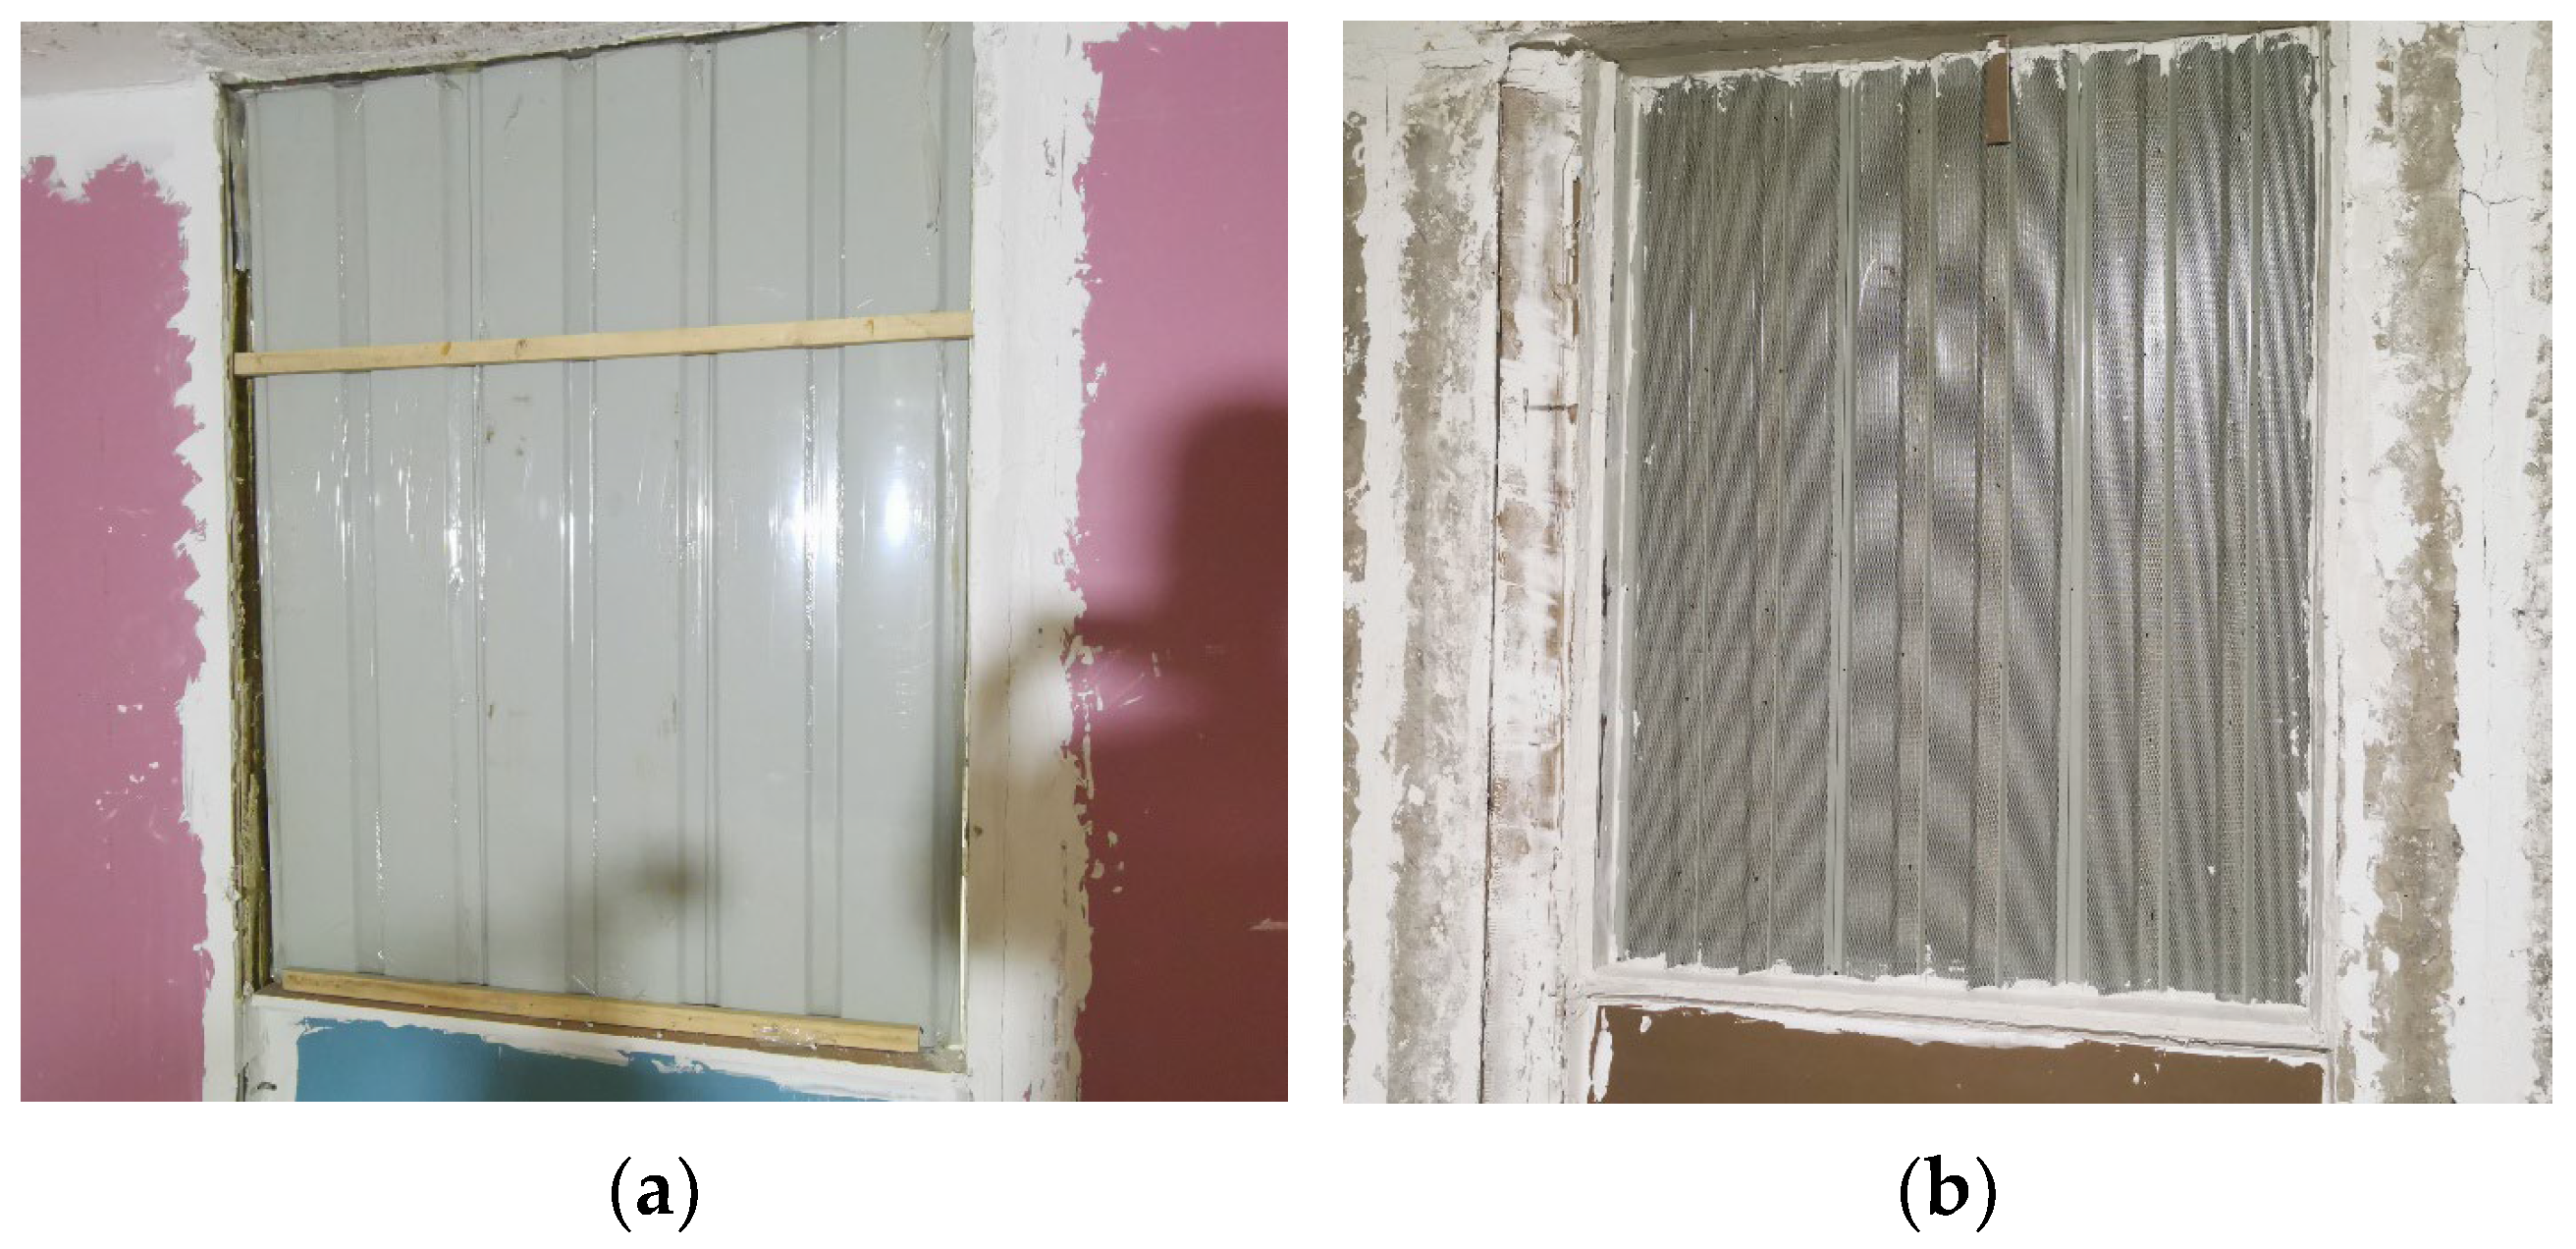
To evaluate the airborne sound insulation capacity of various composite noise barrier schemes, measurements were conducted in a sound insulation laboratory according to the GB/T 45305.2-2025 (ISO 10140-2:2021) standard [35,36]. The laboratory features a “room-in-room” vibration-isolated structure to effectively shield against external vibrations and flanking transmission. The test specimen, composed of three spliced sound barrier units, was installed in a 10 m2 aperture (4 m wide × 2.5 m high). The surrounding gap was filled with 60 mm thick cement panels combined with over six layers of 12 mm gypsum board (average density 910 kg/m3) on both sides, with the edges sealed using gypsum putty to ensure that sound transmission occurred primarily through the specimen itself. The experiment aimed to determine the weighted sound reduction index (Rw) and its spectrum adaptation terms (C and Ctr).
To quantitatively verify the suppression of flanking transmission (especially in the low-frequency range) by the sealed composite construction, a verification was conducted in accordance with GB/T 45305.2-2025 (ISO 10140-2:2021) [35,36]. The standard specifies that the sound energy transmitted through the filler wall should be at least 6 dB, preferably 15 dB, lower than that through the test specimen. Simulations using INSUL 9.0 software show that the composite filler structure achieves a weighted sound reduction index R w ( C ; C t r ) of 50(−1; −3) dB, while the noise barrier component is below 30 dB—a difference exceeding 15 dB. Additionally, the CMA-accredited laboratory adopts a “room-in-room” vibration-isolated configuration. Together, these measures ensure that the measured sound transmission originates primarily from the specimen itself.
The test setup is shown in Figure 5.
During the measurement process, Nor276 dodecahedral omnidirectional sound source was positioned in the source room (Norsonic AS, Tranby, Norway). Microphones were placed at symmetrical positions in both the source and receiving rooms at a height of 1.5 m. Steady-state average sound pressure levels were obtained through continuous scanning sampling, with a scanning radius of 1.0 m and a duration of at least 30 s. The sound reduction index R of the specimen is calculated according to Equation (1):
R = L 1 L 2 + 10 l g S A
where L1 and L2 are the average sound pressure levels in the source and receiving rooms, respectively (dB); S is the area of the test specimen (m2); and A is the equivalent sound absorption area in the receiving room (m2).
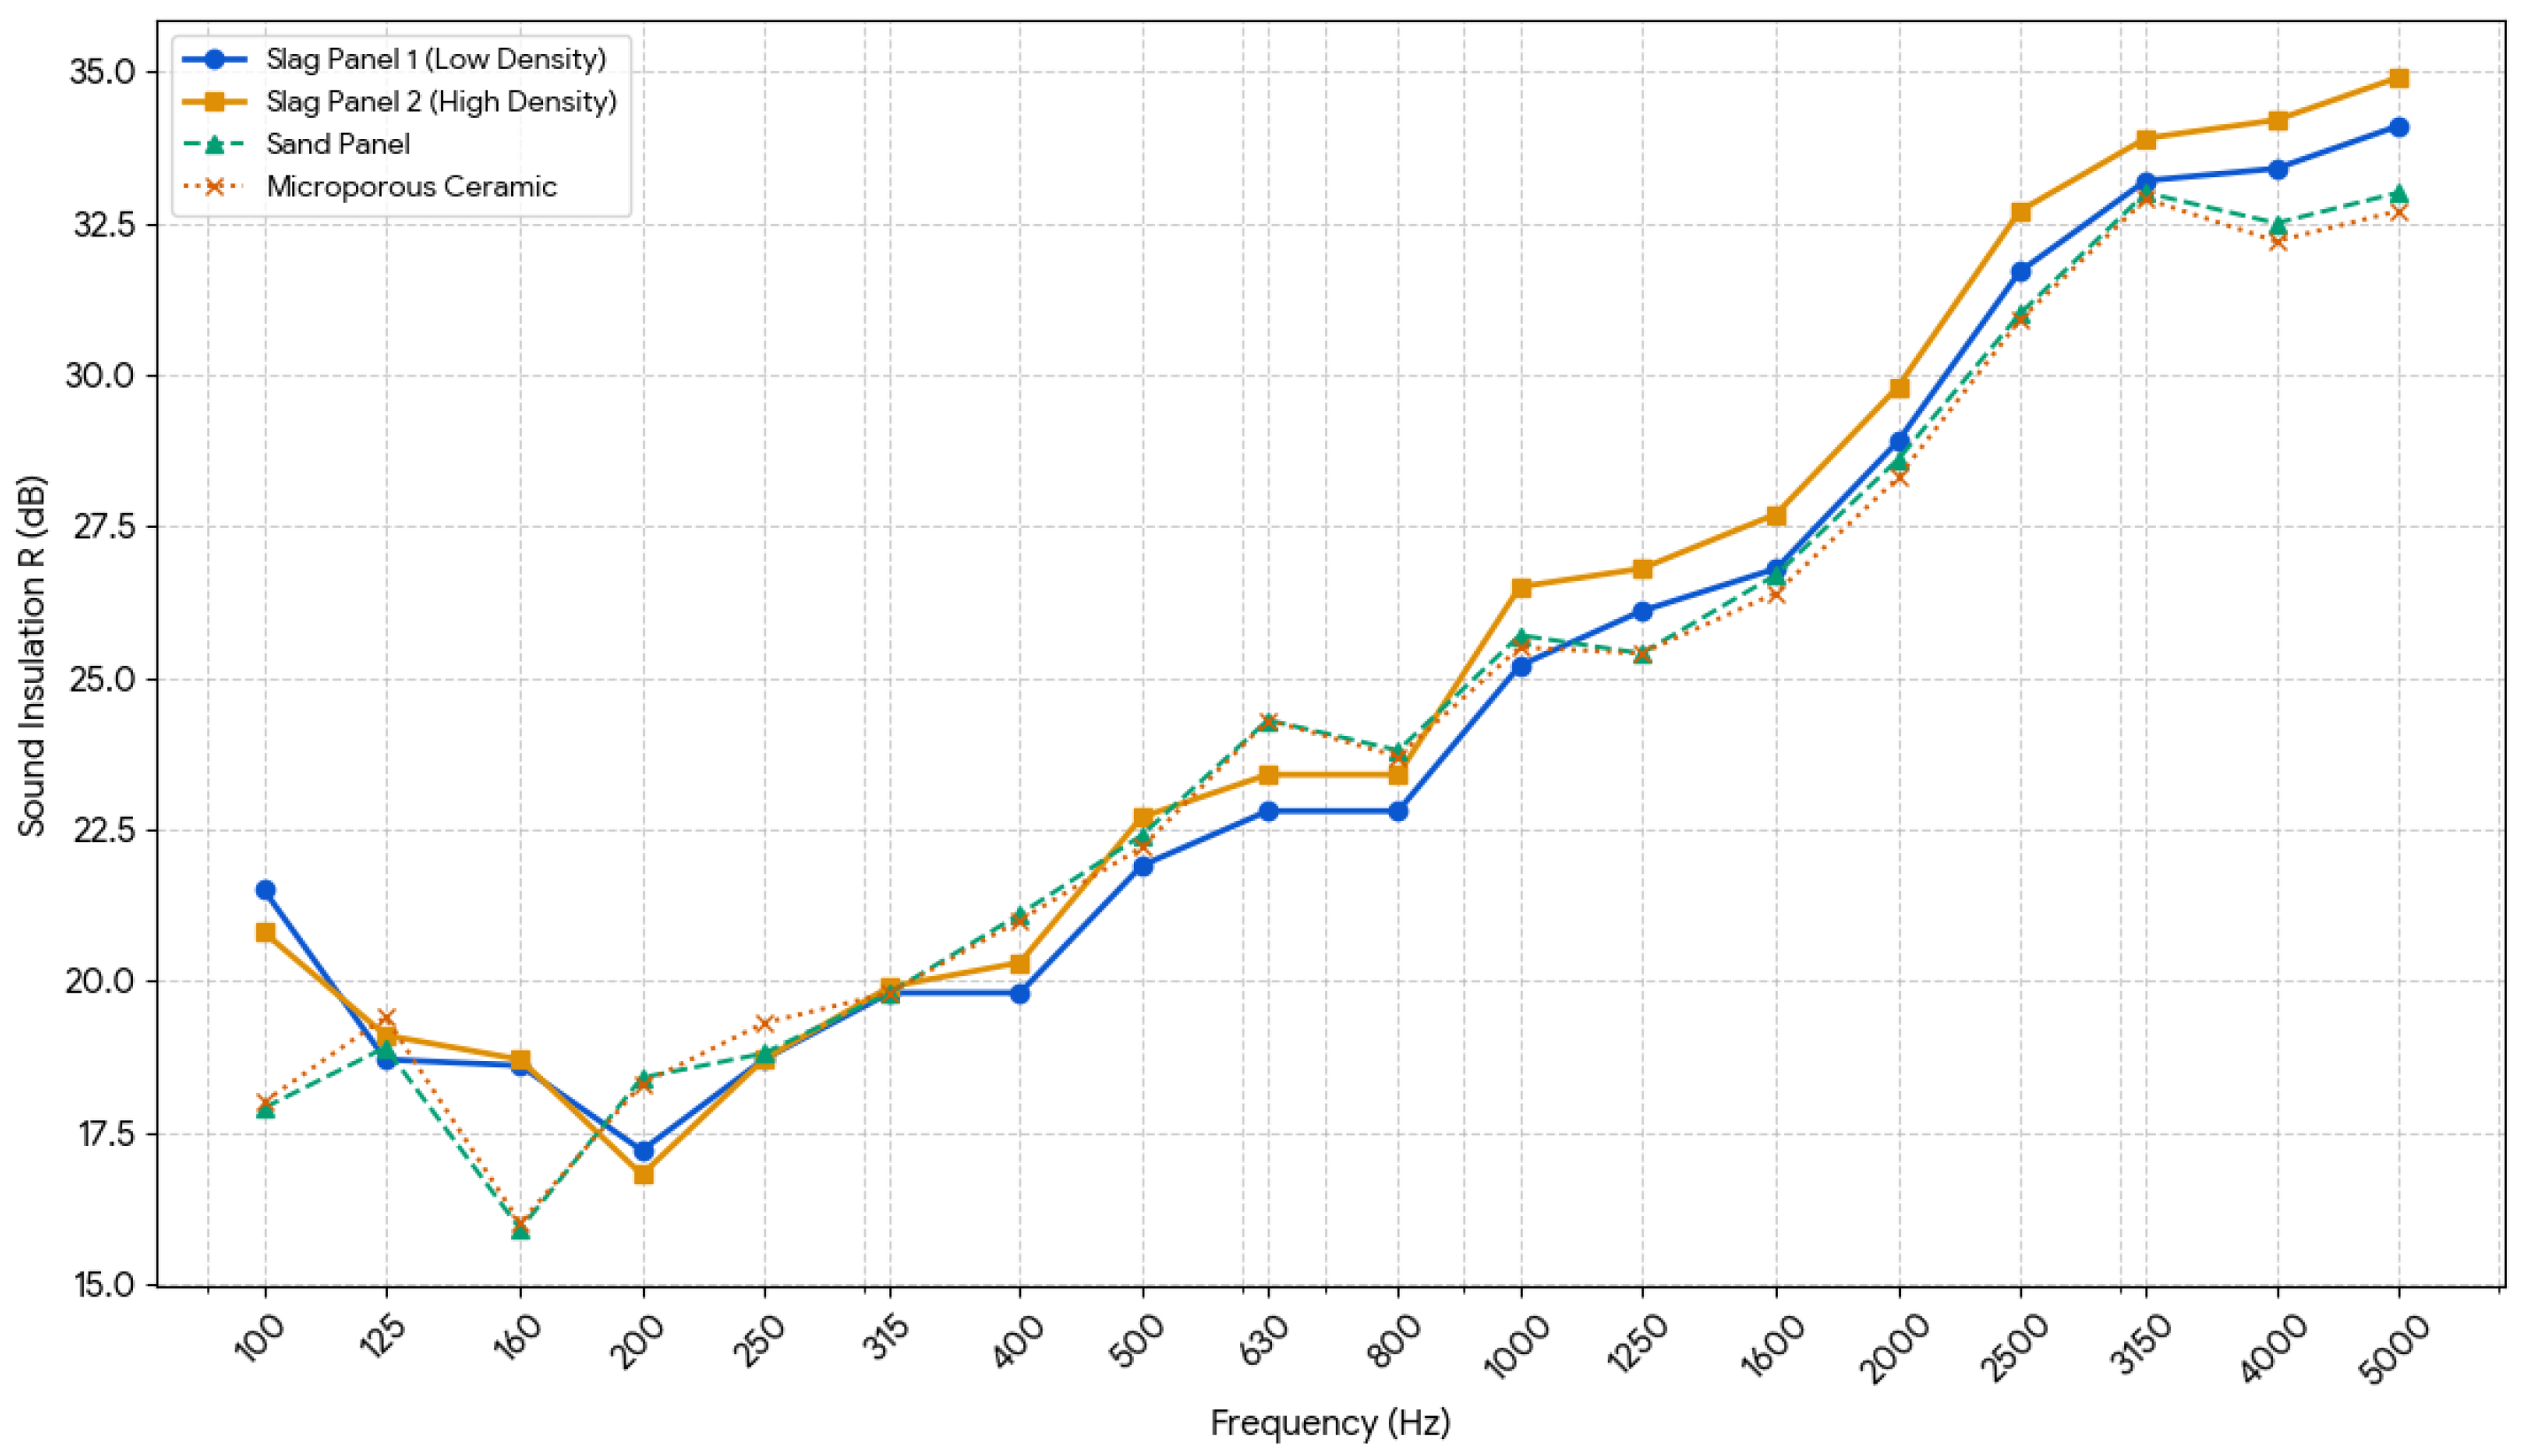
The experimental results are summarized in Table 4. Despite significant disparities in sound absorption coefficients across different frequency bands, Rw of the sound barrier components primarily follows the mass law. Except for Slag Panel 1, which yielded an Rw of 25 dB due to its lower density, the other three schemes all achieved 26 dB. Notably, both slag panels exhibited spectrum adaptation terms of (0, −2), whereas the sand panel and microporous ceramic panel recorded (−1, −3). This indicates that the slag panel configuration is more effective than the sand panel or microporous ceramic panel at mitigating low-frequency interference generated by vehicular traffic.
The frequency-dependent trends of sound insulation performance are illustrated in Figure 6, where all curves exhibit a consistent, steady increase with rising frequency. In the low-frequency range (100–315 Hz), the curves show minor fluctuations due to the combined influence of surface density and structural resonance. In the mid-to-high frequency range (500–2000 Hz)—the primary energy band for road traffic noise, particularly engine power noise—all four materials demonstrate stable acoustic growth. Specifically, Slag Panel 2 (high-density) outperforms the other materials by approximately 1.0–1.5 dB above 1000 Hz, reaching 27.7 dB at 1600 Hz, while the curves for the sand panel and microporous ceramic panel overlap significantly, indicating equivalent stability. In the high-frequency range (above 2500 Hz), sound insulation remains above 30 dB, effectively blocking high-frequency tire-pavement noise. Consequently, material selection can be tailored to the specific noise spectrum of urban expressways: high-density slag panel is recommended for road sections with a high proportion of trucks and significant mid-frequency energy, whereas sand panel and microporous ceramic panel are highly suitable for sections dominated by light passenger vehicles where tire noise is prominent.

4. Case Study: Application of the Quiet Housing Project

4.1. Project Overview

This study selects a “Quiet Housing” construction project in Jiaojiang District, Taizhou City, Zhejiang Province as an empirical case study. Field investigations reveal that the north side of the project is immediately adjacent to Kaifa Avenue, an east–west urban arterial road featuring a dual six-lane layout with a width of approximately 30–40 m. As a primary corridor for east–west freight and a critical node for cross-regional commuting in Taizhou, the road recorded an average daily traffic volume of 42,000 vehicles as of 2024, accounting for approximately 35% of the commuting pressure in the Taizhou Bay New Area. Particularly during peak hours, the proximity of the project’s northern boundary to a major intersection leads to frequent traffic congestion, causing environmental noise levels to significantly exceed regulatory standards and posing a severe challenge to the acoustic environment quality of the residential area.
According to Article 4.2.1 of the Assessment Standard for Quiet Housing (T/CSUS 61-2023) [37], the noise levels at the project site must outperform the limits for Class 2 sound environment functional zones specified in the current national standard, Environmental Quality Standard for Noise (GB 3096) [38], which requires Ld < 60 dB. Furthermore, the background noise level is directly linked to several core evaluation indicators, including the proportion of “quiet sides” of residential buildings and the indoor equivalent sound level (LAeq,T). Consequently, this simulation analysis adopts a limit of no more than 60 dB for the equivalent sound level outside the most exposed buildings on the north side of the project as the objective for optimization research.
To ensure the accuracy of the simulation, environmental noise was measured during the morning peak period (07:00–09:00) for a single duration of no less than 20 min using a Norsonic Nor150 sound level meter equipped with a Nor1290 sound intensity probe (Norsonic AS, Tranby, Norway). To avoid interference from the shielding effects of temporary site hoardings, the monitoring point was positioned 1 m outside a window at a height of 10 m on the north-side building. The measured noise levels, verified through calculations based on the monitoring data and the roadside traffic noise spectrum, are presented in Table 5.

4.2. Analysis of Simulation

Due to the suboptimal sound insulation of the low-density version (Slag Panel 1), only the high-density slag panel (Slag Panel 2) was used for this simulation. A conventional perforated barrier served as the control group to objectively evaluate the new materials. This control barrier was filled with 40 mm thick centrifugal glass wool (density: 48 kg/m3) and wrapped in 0.15 mm alkali-free hydrophobic glass cloth. Its measured average sound absorption coefficient was 0.88.
The simulation of site environmental noise distribution was conducted using acoustic software SoundPLAN 8.1. The prediction model employed the RLS-90 algorithm, which has been extensively validated in traffic noise research [39,40]. Model input parameters included sound pressure levels, topography, building geometric features, and road boundaries, while interference from temporary buildings and hoardings was excluded. Parameters were standardized based on field conditions: the road surface was defined as non-porous asphalt concrete; the average vehicle speed on Kaifa Avenue was set to 60 km/h with a heavy vehicle proportion of 20% based on the measured daily traffic volume of 42,000 vehicles. Meteorological parameters were maintained at standard conditions (temperature 20 °C, relative humidity 70%), which is consistent with typical traffic noise prediction standards for short-range propagation.
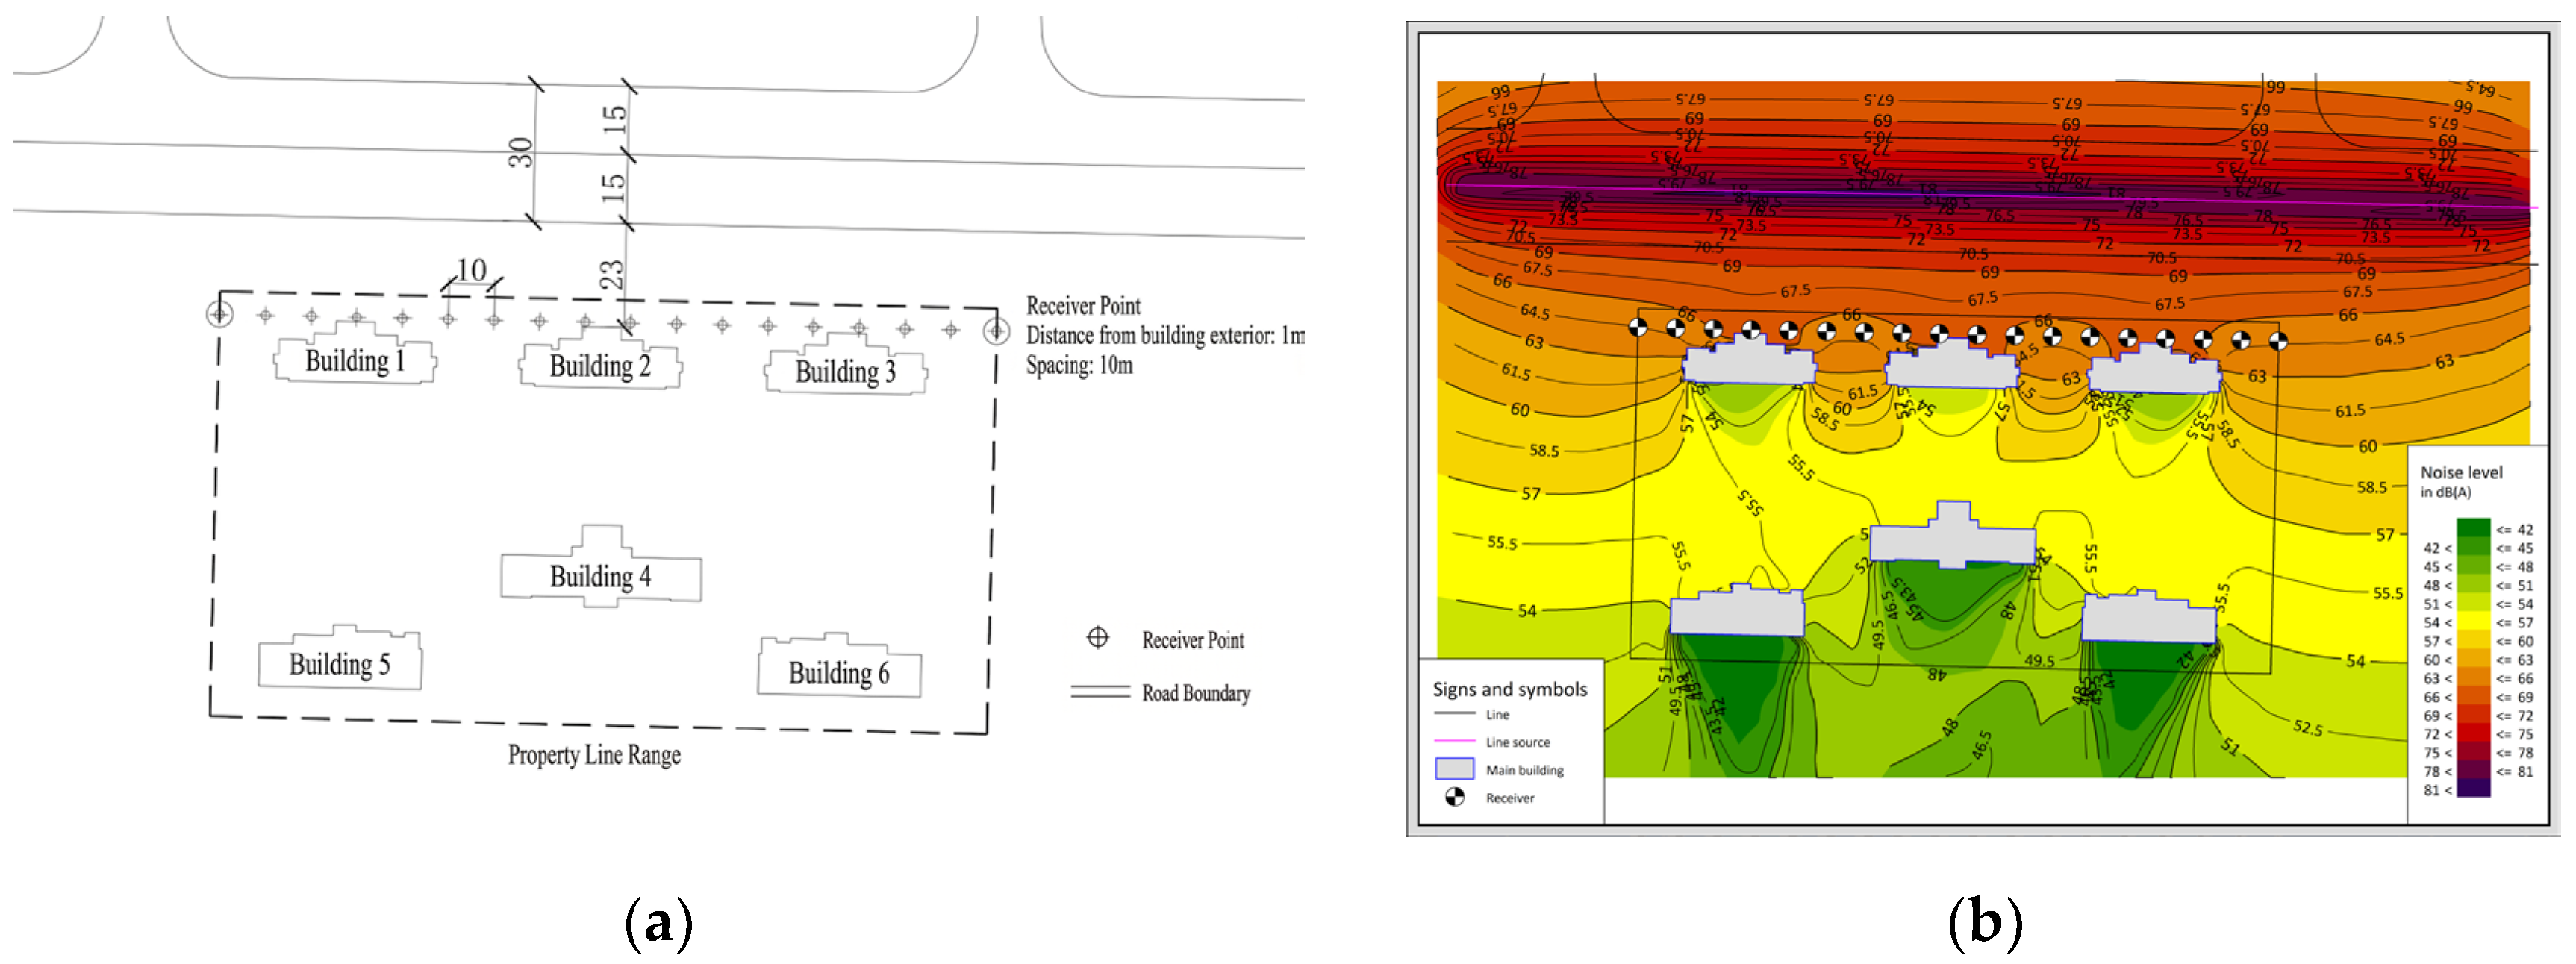
To accurately predict the acoustic environment quality of the building facades under various noise reduction schemes, 18 receiver points were established at a height of 1.2 m above ground and 1 m from the windows, spaced at 10 m intervals. Initial simulation results (Figure 7 and Table 6) indicated that without any acoustic protection measures, the noise levels at all receiver points failed to meet the 60 dB limit requirement.

4.2.1. Simulation 1: Assuming a Single-Sided Noise Barrier at the Project Boundary

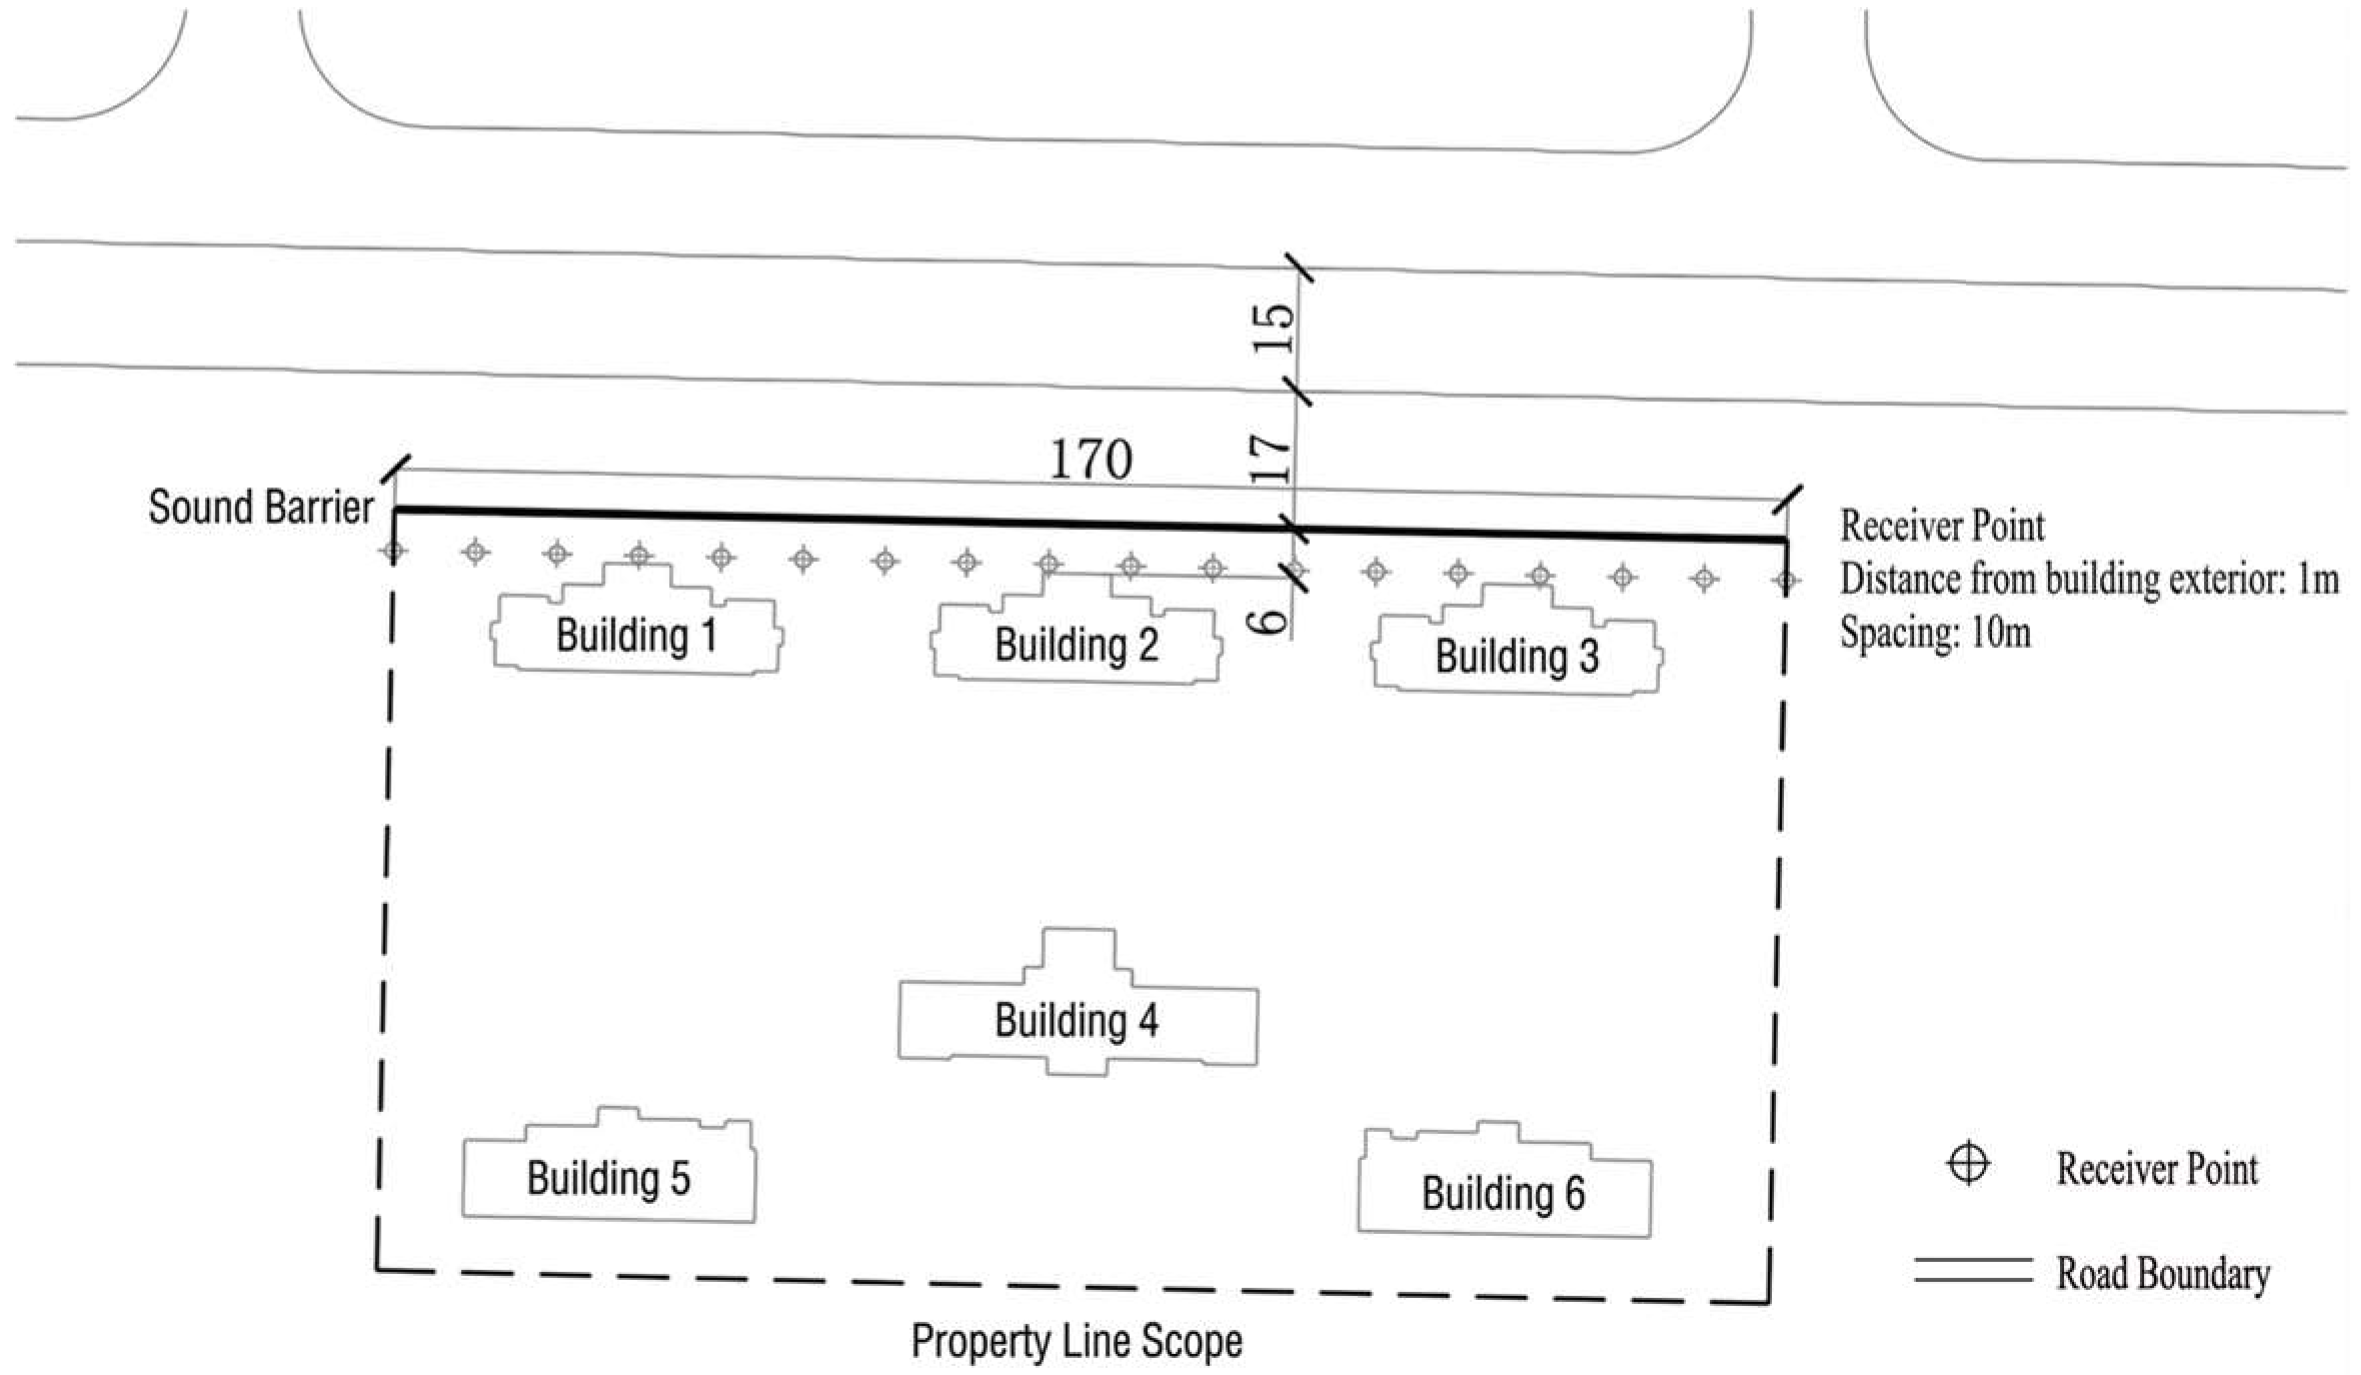
The study simulated a single-sided noise barrier installed along the northern boundary of the project site. The barrier’s perforated sound-absorbing surface was oriented toward Kaifa Avenue, with its centerline positioned 17 m from the roadside. Laboratory-measured acoustic parameters for the four filling schemes—Sand Panel, Slag Panel, Microporous Ceramic Panel, and Glass Wool—were integrated into the model for analysis (Figure 8).
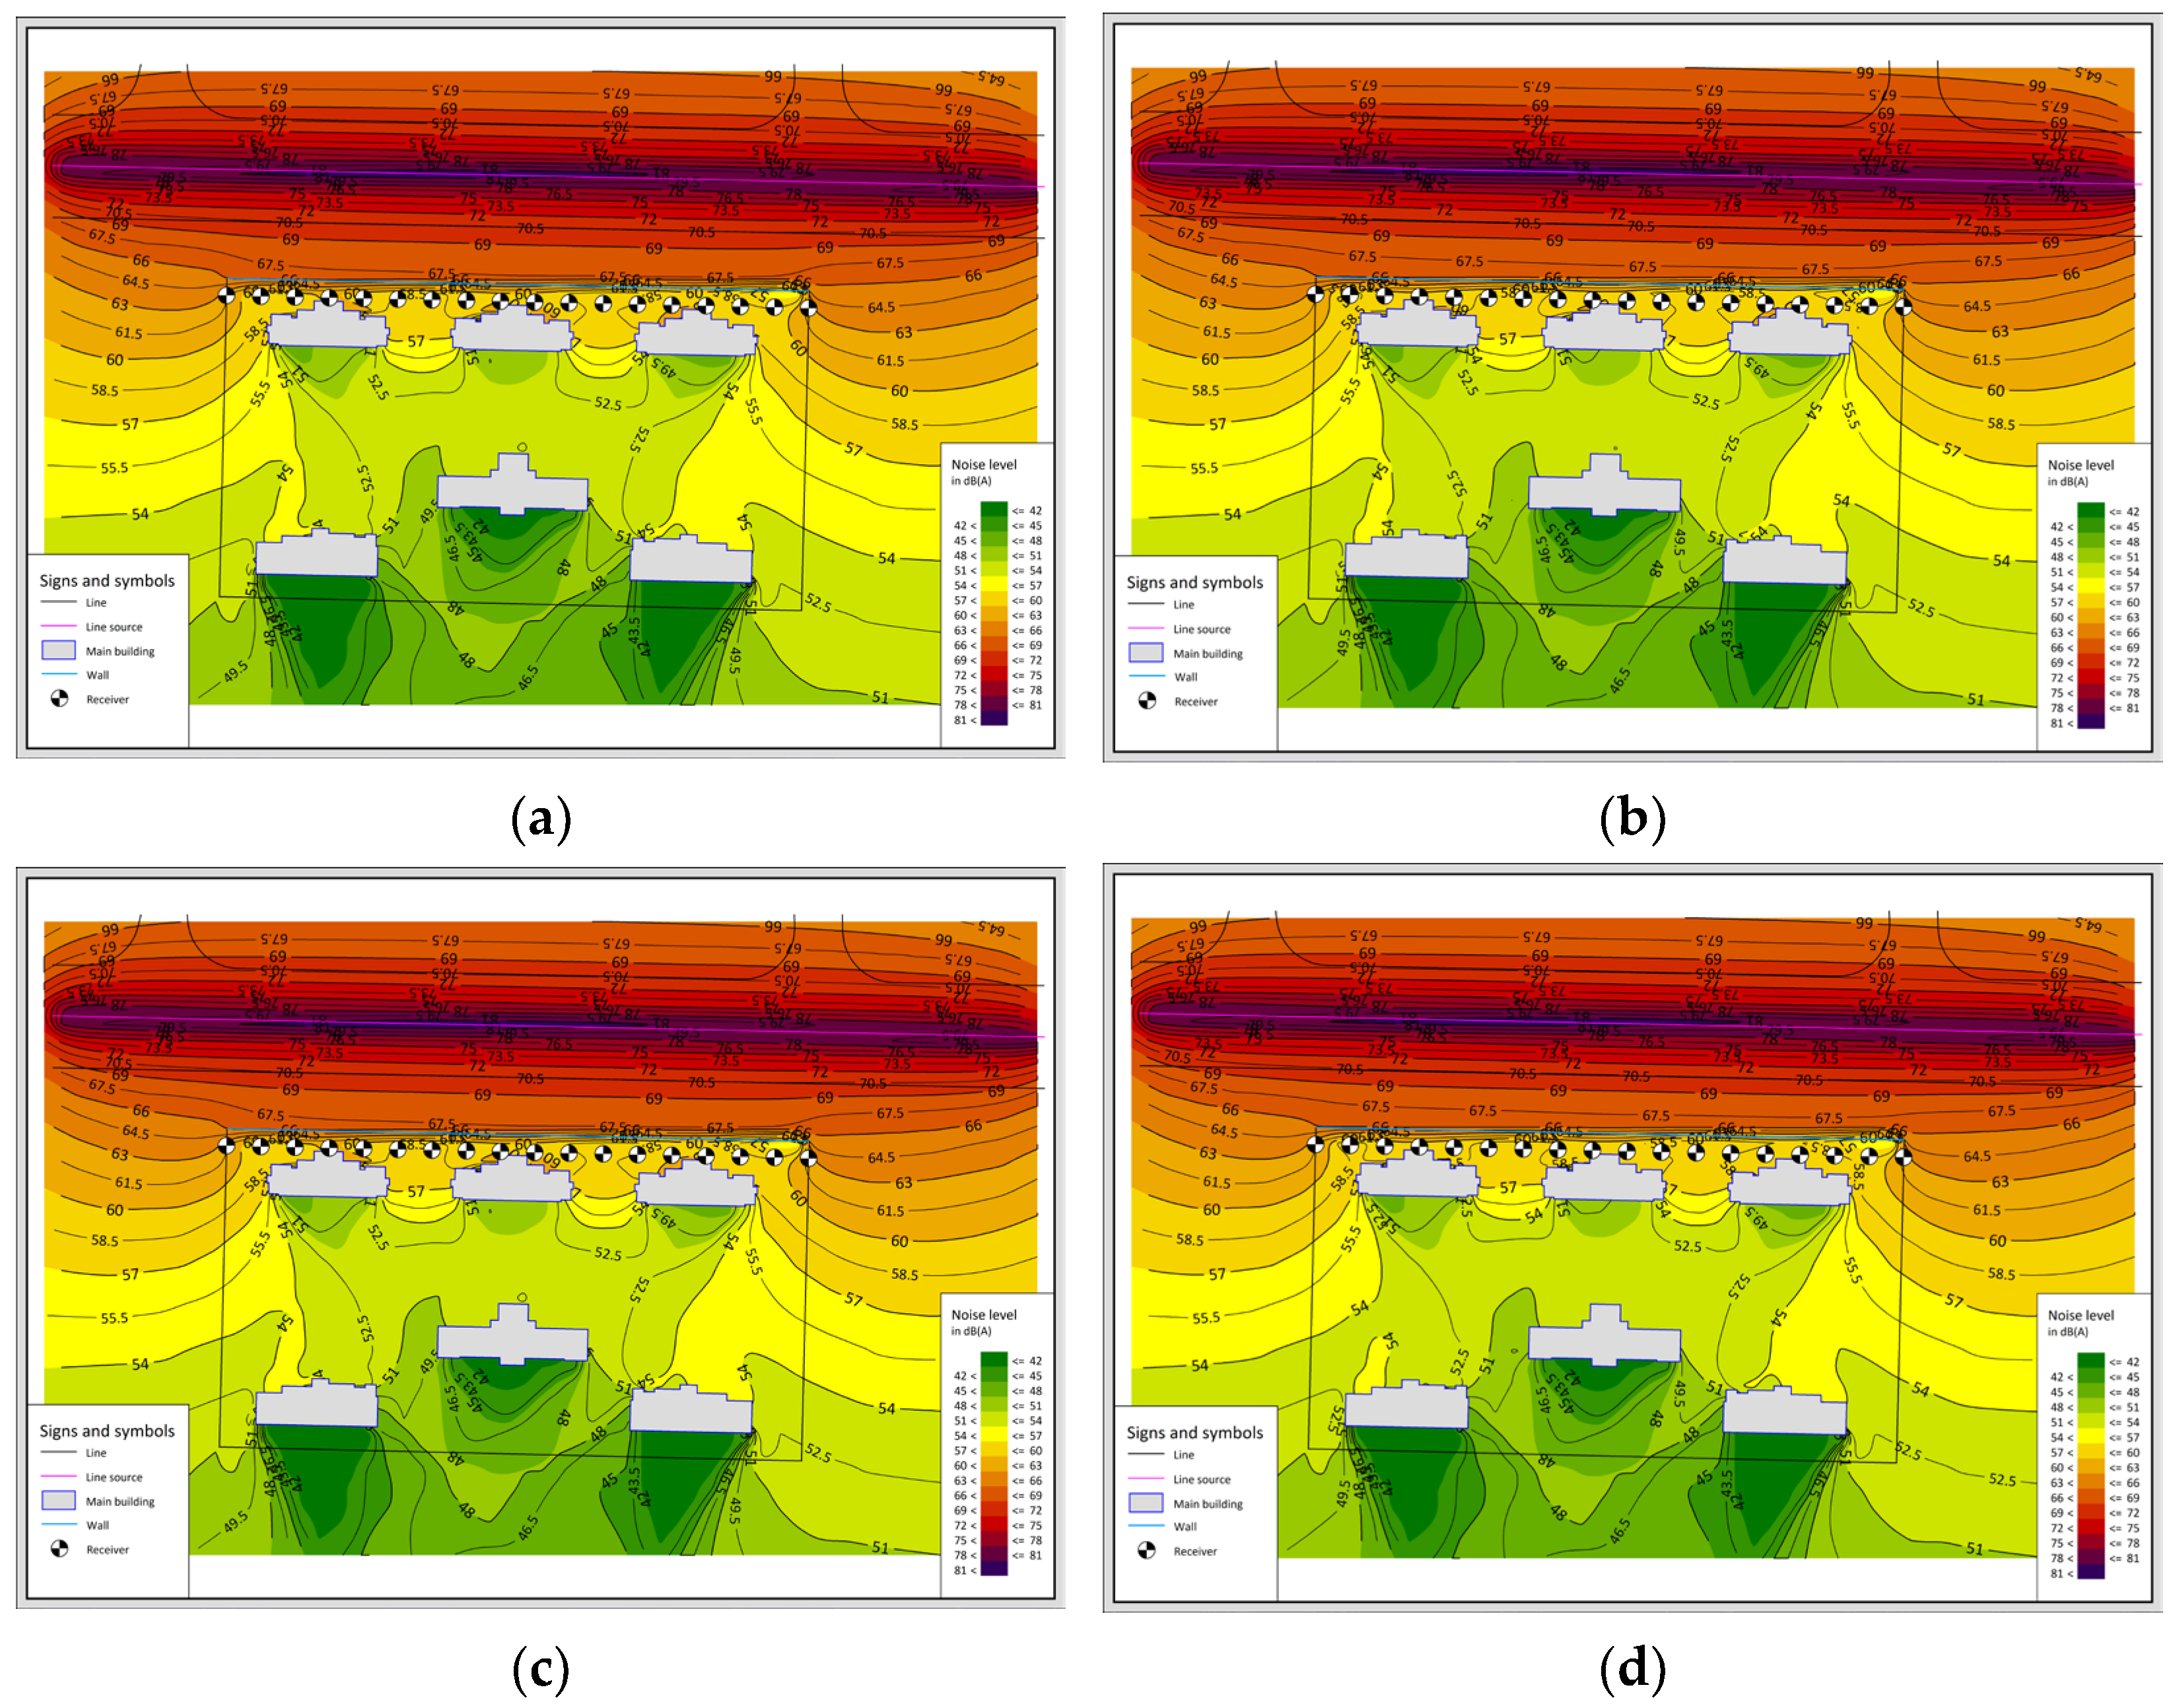
Based on established engineering practices for high-intensity traffic noise environments, the effective noise reduction height of the barrier was set at 2.5 m. The resulting noise distribution is illustrated in Figure 9, while the specific sound pressure level statistics for each receiver point are summarized in Table 7.
Analysis of the simulation data in Table 7 indicates that noise barriers with various filling materials provide significant noise reduction. Receiver points 1 and 18, located near the project boundaries and road intersections, remain exposed to high noise levels (62.0–62.5 dB) due to direct and diffracted sound. For practical engineering applications, these barrier ends would require heightening or wrap-around optimization to improve performance.
Most receiver points across the four schemes meet the requirements of the Assessment Standard for Quiet Housing. Traditional glass wool maintains a slight noise reduction advantage of about 0.4 dB. However, new eco-friendly materials like the slag panel successfully limit noise to around 60 dB at most points. While the sand and microporous ceramic panels perform nearly identically, the slag panel holds a marginal advantage of 0.1 dB due to its specific acoustic properties.
Compared to traditional glass wool, these new panels offer superior weather resistance and non-combustibility. By utilizing natural resources or industrial waste like slag, they significantly reduce environmental burden during production. Furthermore, their slim 20 mm design allows for a larger internal air cavity within the barrier unit, which maintains acoustic performance while improving transportation and installation convenience.

4.2.2. Simulation 2: Assuming a Double-Sided Noise Barrier at the Road Boundary

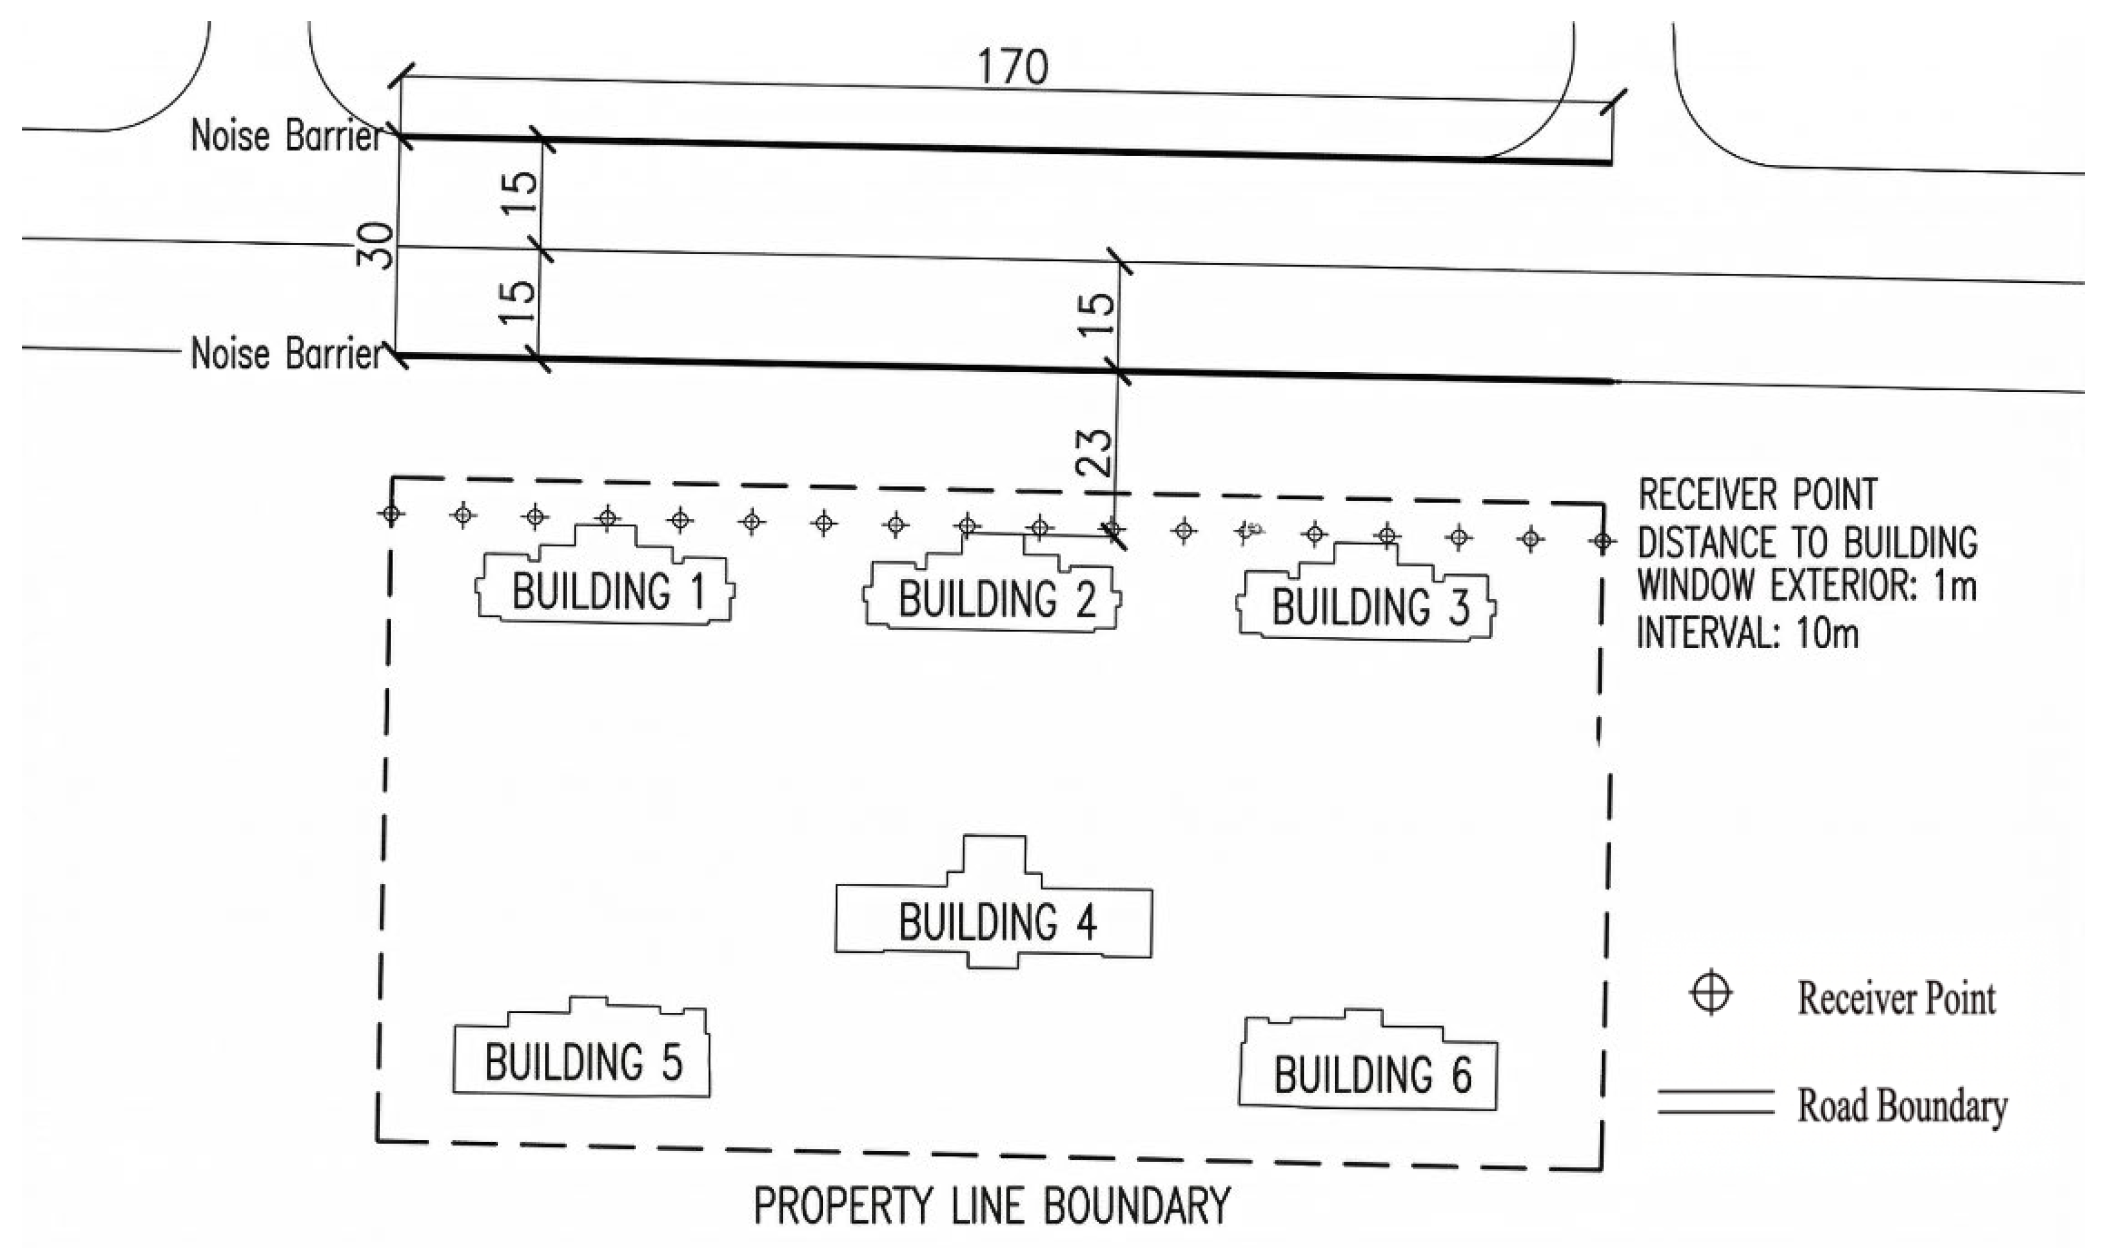
Considering that in practical engineering applications, noise barriers are typically installed symmetrically on both sides of a road to better protect sensitive areas. Therefore, this study simulated a dual-sided symmetrical layout along Kaifa Avenue. In this configuration, the distance between the northern barrier and the sensitive buildings was increased to 23 m. All other parameters, including the absorbent materials, structural forms, and the 2.5 m design height, remained consistent with the single-sided scheme. The layout is illustrated in Figure 10.
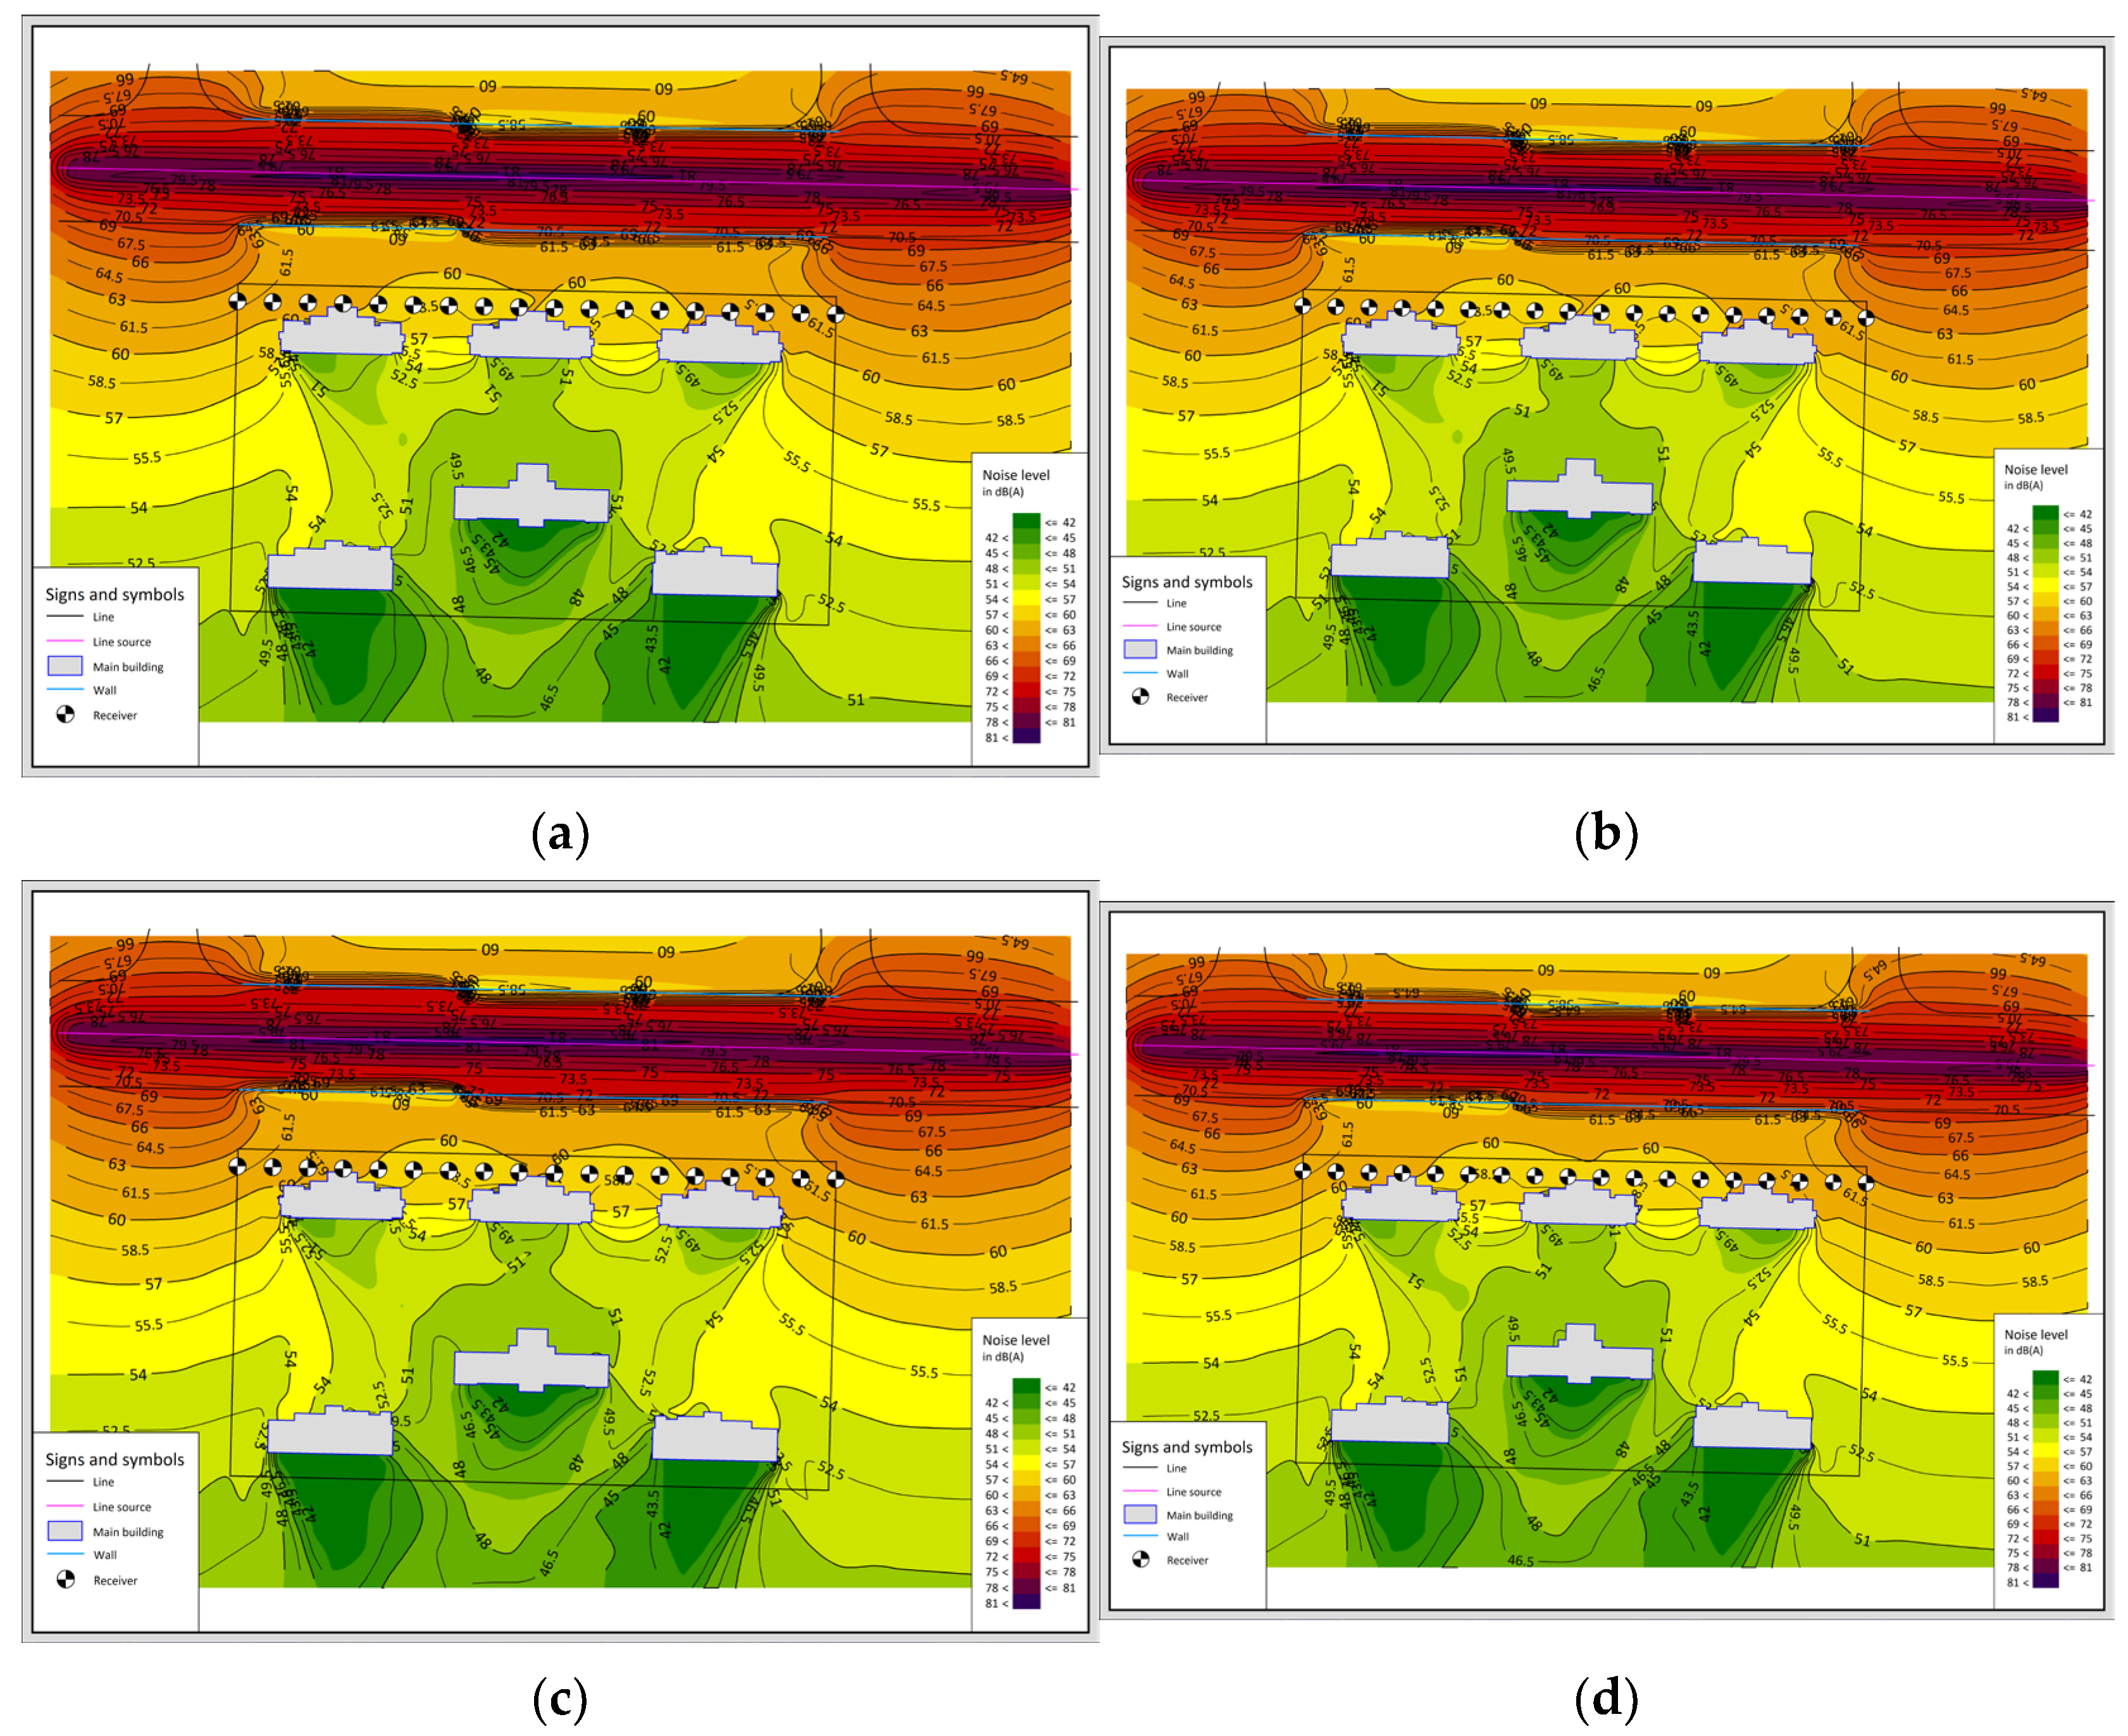
The simulation results are illustrated in Figure 11. All four material schemes demonstrate a degree of suppression of the site’s environmental noise. However, a comparison of the simulated data in Table 7 and Table 8 reveals a general slight increase in noise levels at each receiver point. This phenomenon is attributed to the parallel reflective noise buildup effect occurring between the two barriers. Despite the excellent sound absorption properties of the new panels, they cannot fully eliminate the energy from multiple reflections between the barrier walls.
At receiver points 1–4 and 15–18, noise levels typically range between 60.8 and 62.6 dB. This indicates that under conditions of high traffic volume and specific building clearances, sound energy still reaches these points through multiple reflections and diffractions. Merely increasing the sound absorption coefficient is insufficient to offset this noise gain and meet required limits. Therefore, further optimization of the sound insulation structure or an increase in barrier height should be considered.
In the double-sided configuration, the glass wool group maintains a noise reduction advantage of approximately 0.2 dB over eco-friendly schemes due to its high average sound absorption coefficient. Predicted results for the sand and slag panels are highly consistent. Analysis of Figure 4 and Table 5 shows both materials have nearly identical absorption properties in the 1000–2500 Hz band, which covers the primary traffic noise energy on Kaifa Avenue. Conversely, noise levels for the microporous ceramic panel were 0.1 dB higher than the sand panel. This reflects slightly weaker absorption under this specific noise spectrum and reflective environment.

4.3. Discussion

Based on the simulation results, the noise reduction performance gap between the three innovative inorganic eco-friendly materials and traditional centrifugal glass wool is remarkably narrow, demonstrating comparable engineering utility. Notably, in practical expressway noise barrier engineering, the benchmark glass wool is typically configured with a thickness of 40–80 mm. According to the theory of porous media acoustics [30] and existing studies [41,42,43], thickness is a decisive factor for the frequency of the first absorption peak: as the thickness of glass wool decreases, the insufficient propagation path within the material leads to a significant decline in low-frequency absorption. Although increasing the rear air cavity can partially compensate for the impedance matching, the overall NRC tends to decrease. In contrast, the eco-friendly panels developed in this study exhibit a superior performance-to-thickness advantage. Taking the sand panel as an example, increasing the thickness from 20 mm to 50 mm elevates the NRC from 0.45 to 0.55 [22]. Consequently, it can be inferred that at an equivalent thickness, the acoustic performance of the new eco-panel barriers would surpass that of traditional glass wool barriers. From an engineering perspective, the 20 mm eco-panels not only sufficiently meet most noise mitigation requirements under moderate traffic pressure but also offer significant advantages in reducing costs, minimizing transport loads, and simplifying installation, making them a more sustainable choice for urban environments.
In double-sided scenarios, multiple reflections between barriers cause energy buildup, making effective mitigation highly dependent on a material’s absorption within dominant frequency bands. Therefore, selecting noise barriers for “Quiet Housing” projects requires initial environmental monitoring and spectral analysis of surrounding traffic noise. This process ensures the selection of an eco-friendly material with acoustic properties tailored to the specific site for precise noise control.
It is important to note that the numerical simulations in this study strictly follow the RLS-90 standard, employing idealized and uniform meteorological conditions. This standardized configuration is designed to exclude complex environmental interferences—such as wind speed, directional gradients, and temperature inversions—thereby providing a consistent benchmark to objectively compare the acoustic contributions of traditional glass wool and the newly developed panels. Nevertheless, real-world traffic noise is influenced by various dynamic factors: experimental data suggests that for every 1 °C increase in pavement temperature, close-proximity tire noise decreases by approximately 0.06 dB(A) [44]. Under stable traffic flow conditions, ambient temperature variations can account for 20% to 42% of noise level fluctuations, with an average influence coefficient of approximately −0.09 dB/°C [45]. Furthermore, the total sound pressure level is significantly affected by the total volume of vehicles, traffic composition (e.g., the proportion of heavy vehicles), driving speeds, and operational conditions, such as frequent stop-and-go movements during congestion [46]. Future research should incorporate a broader range of meteorological conditions and complex traffic dynamics to achieve more comprehensive noise prediction and assessment.

5. Conclusions

This study presents the development and empirical application of three eco-friendly sound-absorbing materials: sand panel, slag panel, and microporous ceramic panel. The following conclusions are drawn:
  • Particle size gradation governs acoustic performance: Optimizing aggregate size ratios and increasing pore channel tortuosity enhance viscous friction and thermal losses without significantly reducing porosity, achieving an optimal NRC. Excessive flow resistivity, however, causes impedance mismatching and reduces absorption efficiency.
  • The three panels offer distinct broadband advantages: The slag panel excels below 500 Hz and above 2000 Hz, ideal for complex traffic noise. The sand panel maintains high stability (0.78–0.84) in the 800–1600 Hz mid-frequency band. The microporous ceramic panel performs well below 800 Hz, though its high cementitious matrix content increases high-frequency reflections.
  • Eco-friendly noise barriers effectively mitigate residential traffic noise: Their performance is comparable to traditional glass wool-filled structures. Furthermore, these materials offer excellent mechanical properties, non-combustibility, strong weather resistance, and ease of transportation and installation.
  • Targeted material selection is essential for practical applications: Selection should be based on road traffic volume and the specific spectral characteristics of the traffic noise to achieve optimal, precision noise reduction.

Author Contributions

Conceptualization, T.Y. and H.S. (Huanbin Song); Methodology, B.M. and H.S. (Haiyang Sun); Software, H.Q. and Y.T.; Validation, J.W. and X.Y.; Formal analysis, T.Y.; Investigation, B.M.; Resources, H.S. (Haiyang Sun); Data curation, H.Q.; Writing—original draft preparation, T.Y. and H.S. (Huanbin Song); writing—review and editing, T.Y. and H.S. (Huanbin Song); Visualization, H.S. (Huanbin Song); Supervision, J.W.; Project administration, X.Y.; Funding acquisition, Y.T. All authors have read and agreed to the published version of the manuscript.

Funding

This research received no external funding.

Institutional Review Board Statement

Not applicable.

Informed Consent Statement

Not applicable.

Data Availability Statement

The original contributions presented in this study are included in the article. Further inquiries can be directed to the corresponding author.

Conflicts of Interest

Tong Yu, Baolong Ma, Haiyang Sun and Yulu Teng were employed by Beijing Highway Traffic Engineering Co., Ltd. The remaining authors declare that the research was conducted in the absence of any commercial or financial relationships that could be construed as a potential conflict of interest.

Abbreviations

The following abbreviations are used in this manuscript:
NRCNoise Reduction Coefficient
RwWeighted Sound Reduction Index

References

  1. Vaitkus, A.; Andriejauskas, T.; Vorobjovas, V.; Jagniatinskis, A.; Fiks, B.; Zofka, E. Asphalt Wearing Course Optimization for Road Traffic Noise Reduction. Constr. Build. Mater. 2017, 152, 345–356. [Google Scholar] [CrossRef]
  2. Rendón, J.; Gómez, D.M.M.; Colorado, H.A. Useful Tools for Integrating Noise Maps about Noises Other than Those of Transport, Infrastructures, and Industrial Plants in Developing Countries: Casework of the Aburra Valley, Colombia. J. Environ. Manag. 2022, 313, 114953. [Google Scholar] [CrossRef] [PubMed]
  3. Yadav, A.; Parida, M.; Choudhary, P.; Kumar, B. Investigating Important and Necessary Conditions to Analyse Traffic Noise Levels at Intersections in Mid-Sized Cities. J. Environ. Manag. 2024, 355, 120515. [Google Scholar] [CrossRef]
  4. Basner, M.; McGuire, S. WHO Environmental Noise Guidelines for the European Region: A Systematic Review on Environmental Noise and Effects on Sleep. Int. J. Environ. Res. Public Health 2018, 15, 519. [Google Scholar] [CrossRef]
  5. Singh, N.K.; Markandeya; Manar, M.K.; Shukla, S.P.; Mohan, D. Statistical and Spatio-Temporal Analyses of Noise Pollution Level and Its Health Impact. Environ. Sci. Pollut. Res. 2023, 30, 82951–82963. [Google Scholar] [CrossRef]
  6. Orban, E.; McDonald, K.; Sutcliffe, R.; Hoffmann, B.; Fuks, K.B.; Dragano, N.; Viehmann, A.; Erbel, R.; Jöckel, K.-H.; Pundt, N. Residential Road Traffic Noise and High Depressive Symptoms after Five Years of Follow-up: Results from the Heinz Nixdorf Recall Study. Environ. Health Perspect. 2016, 124, 578. [Google Scholar] [CrossRef]
  7. Report on Prevention and Control of Noise Pollution in China (2025); Ministry of Ecology and Environment: Beijing, China, 2025.
  8. Lacasta, A.M.; Penaranda, A.; Cantalapiedra, I.R.; Auguet, C.; Bures, S.; Urrestarazu, M. Acoustic Evaluation of Modular Greenery Noise Barriers. Urban For. Urban Green. 2016, 20, 172–179. [Google Scholar] [CrossRef]
  9. Meng, Q.; Evgrafova, O.; Li, M. Effect of Coniferous Tree–Shrub Mixtures on Traffic Noise Reduction in Public Spaces. Buildings 2025, 15, 4266. [Google Scholar] [CrossRef]
  10. Morillas, J.M.B.; Gozalo, G.R.; González, D.M.; Moraga, P.A.; Vílchez-Gómez, R. Noise Pollution and Urban Planning. Curr. Pollut. Rep. 2018, 4, 208–219. [Google Scholar] [CrossRef]
  11. May, D.N.; Osman, M.M. The Performance of Sound Absorptive, Reflective, and T-Profile Noise Barriers in Toronto. J. Sound Vib. 1980, 71, 65–71. [Google Scholar] [CrossRef]
  12. Laxmi, V.; Thakre, C.; Vijay, R. Evaluation of Noise Barriers Based on Geometries and Materials: A Review. Environ. Sci. Pollut. Res. 2022, 29, 1729–1745. [Google Scholar] [CrossRef]
  13. Jiang, L.; Kang, J. Combined Acoustical and Visual Performance of Noise Barriers in Mitigating the Environmental Impact of Motorways. Sci. Total Environ. 2016, 543, 52–60. [Google Scholar] [CrossRef] [PubMed]
  14. Kim, H.-K.; Lee, H.-K. Acoustic Absorption Modeling of Porous Concrete Considering the Gradation and Shape of Aggregates and Void Ratio. J. Sound Vib. 2010, 329, 866–879. [Google Scholar] [CrossRef]
  15. Nelson, P.M. Designing Porous Road Surfaces to Reduce Traffic Noise; TRL Annual Review 1994; Transportation Research Laboratories: Berkshire, UK, 1995. [Google Scholar]
  16. Arenas, C.; Leiva, C.; Vilches, L.F.; Cifuentes, H. Use of Co-Combustion Bottom Ash to Design an Acoustic Absorbing Material for Highway Noise Barriers. Waste Manag. 2013, 33, 2316–2321. [Google Scholar] [CrossRef] [PubMed]
  17. Park, S.B.; Seo, D.S.; Lee, J. Studies on the Sound Absorption Characteristics of Porous Concrete Based on the Content of Recycled Aggregate and Target Void Ratio. Cem. Concr. Res. 2005, 35, 1846–1854. [Google Scholar] [CrossRef]
  18. Laxmi, V.; Thakre, C.; Bisarya, A.; Vijay, R. An Innovative Approach for the Development of Sound Absorbing Material Using Industrial Wastes. Constr. Build. Mater. 2023, 369, 130523. [Google Scholar] [CrossRef]
  19. Oancea, I.; Bujoreanu, C.; Budescu, M.; Benchea, M.; Grădinaru, C.M. Considerations on Sound Absorption Coefficient of Sustainable Concrete with Different Waste Replacements. J. Clean. Prod. 2018, 203, 301–312. [Google Scholar] [CrossRef]
  20. Salahuddin, H.; Nawaz, A.; Maqsoom, A.; Mehmood, T. Effects of Elevated Temperature on Performance of Recycled Coarse Aggregate Concrete. Constr. Build. Mater. 2019, 202, 415–425. [Google Scholar] [CrossRef]
  21. Park, S.; Lee, E.; Ko, J.; Yoo, J.; Kim, Y. Rheological Properties of Concrete Using Dune Sand. Constr. Build. Mater. 2018, 172, 685–695. [Google Scholar] [CrossRef]
  22. Lu, S.; Xu, W.; Chen, Y.; Yan, X. An Experimental Study on the Acoustic Absorption of Sand Panels. Appl. Acoust. 2017, 116, 238–248. [Google Scholar] [CrossRef]
  23. Cox, M.; Nugteren, H.; Janssen-Jurkovičová, M. Combustion Residues: Current, Novel and Renewable Applications; John Wiley & Sons: Hoboken, NJ, USA, 2008. [Google Scholar]
  24. Li, J.; Zhuang, X.; Leiva, C.; Arenas, C.; Cornejo, A.; Querol, X.; Moreno, N.; Font, O.; Fernández Pereira, C. Utilization of Boiler Slag from Pulverized-Coal-Combustion Power Plants in China for Manufacturing Acoustic Materials. Energies 2020, 13, 5705. [Google Scholar] [CrossRef]
  25. Li, J.; Zhuang, X.; Querol, X.; Font, O.; Moreno, N. A Review on the Applications of Coal Combustion Products in China. In Coal Geology of China; Routledge: London, UK, 2020; pp. 141–186. [Google Scholar]
  26. BS EN 12457-4:2002; Characterisation of Waste. Leaching. Compliance Test for Leaching of Granular Waste Materials and Sludges—Part 4: One Stage Batch Test at a Liquid to Solid Ratio of 10 l/kg for Materials with Particle Size Below 10 mm (Without or with Size Reduction). British Standards Institution (BSI): London, UK, 2002.
  27. Luo, X.Y.; Li, W.F.; Jin, X.L. Effect of Aggregate Size and Gradation on the Ceramsite Sound-Absorbing Materials. Adv. Mater. Res. 2011, 216, 450–457. [Google Scholar] [CrossRef]
  28. Wang, C.; Ren, X.; Diao, Q.; Pan, X.; Su, W.; Chang, L.; Lin, B.; Yan, S. Sound Absorption Performance of a Triple-Hole Structure in Green Ceramsite Concrete for High-Speed-Railway Sound Barriers: Experiments and Neural Network Modeling. Case Stud. Constr. Mater. 2023, 18, e01980. [Google Scholar] [CrossRef]
  29. Champoux, Y.; Allard, J.-F. Dynamic Tortuosity and Bulk Modulus in Air-saturated Porous Media. J. Appl. Phys. 1991, 70, 1975–1979. [Google Scholar] [CrossRef]
  30. Allard, J.; Atalla, N. Propagation of Sound in Porous Media: Modelling Sound Absorbing Materials; John Wiley & Sons: Hoboken, NJ, USA, 2009. [Google Scholar]
  31. Washburn, E.W.; Bunting, E.N. Porosity: VI. Determination of Porosity by the Method of Gas Expansion. J. Am. Ceram. Soc. 1922, 5, 112–130. [Google Scholar] [CrossRef]
  32. BS EN ISO 9053-1:2018; Acoustics—Determination of airflow resistance—Part 1: Static airflow method. British Standards Institution: London, UK, 2018.
  33. Füchsl, S.; Rheude, F.; Röder, H. Life Cycle Assessment (LCA) of Thermal Insulation Materials: A Critical Review. Clean. Mater. 2022, 5, 100119. [Google Scholar] [CrossRef]
  34. BS EN ISO 354:2003; Acoustics—Measurement of Sound Absorption in a Reverberation Room. British Standards Institution: London, UK, 2003.
  35. GB/T 45305.2-2025; Acoustics—Laboratory Measurement of Sound Insulation of Building Elements—Part 2: Measurement of Airborne Sound Insulation. State Administration for Market Regulation and Standardization Administration of China: Beijing, China, 2025.
  36. BS EN ISO 10140-2:2021; Acoustics—Laboratory Measurement of Sound Insulation of Building Elements—Part 2: Measurement of Airborne Sound Insulation. British Standards Institution: London, UK, 2021.
  37. T/CSUS 61-2023; Assessment Standard for Quiet Housing. Chinese Society for Urban Studies (CSUS): Beijing, China, 2023.
  38. GB 3096-2008; Environmental Quality Standard For Noise. China Environmental Science Press: Beijing, China, 2008.
  39. Bravo-Moncayo, L.; Chávez, M.; Puyana, V.; Lucio-Naranjo, J.; Garzón, C.; Pavón-García, I. A Cost-Effective Approach to the Evaluation of Traffic Noise Exposure in the City of Quito, Ecuador. Case Stud. Transp. Policy 2019, 7, 128–137. [Google Scholar] [CrossRef]
  40. de Medeiros, A.F.D.; Pimentel, R.L.; de Melo, R.A.; de Araújo, B.C.D.; da Costa Brasileiro, T. Investigation of Traffic Noise Attenuation Potential of an Urban Highway Underpass. Appl. Acoust. 2022, 192, 108682. [Google Scholar] [CrossRef]
  41. Du, Z.; Jin, Y.; Pang, F.; Li, S.; Huo, R. Study on Sound Absorption Characteristics of Multilayer Composite Structures. In Proceedings of the 2018 IEEE 8th International Conference on Underwater System Technology: Theory and Applications (USYS); IEEE: New York, NY, USA, 2018; pp. 1–5. [Google Scholar]
  42. Li, C.D.; Chen, Z.F.; Zhou, J.M.; Li, B.B.; Wu, W.P.; Chen, Z.; Xu, T.Z.; Qiu, J.L. Material Parameter Determination in Glass Wool Mat for Sound Absorption. Appl. Mech. Mater. 2012, 148, 1271–1275. [Google Scholar] [CrossRef]
  43. Davern, W. Perforated Facings Backed with Porous Materials as Sound Absorbers—An Experimental Study. Appl. Acoust. 1977, 10, 85–112. [Google Scholar] [CrossRef]
  44. Bueno, M.; Luong, J.; Viñuela, U.; Terán, F.; Paje, S.E. Pavement Temperature Influence on Close Proximity Tire/Road Noise. Appl. Acoust. 2011, 72, 829–835. [Google Scholar] [CrossRef]
  45. Morillas, J.M.B.; Gozalo, G.R.; Gonzalez, D.M.; Sanchez-Fernandez, M.; Leon, A.B. A Comprehensive Experimental Study of the Influence of Temperature on Urban Road Traffic Noise under Real-World Conditions. Environ. Pollut. 2022, 309, 119761. [Google Scholar] [CrossRef] [PubMed]
  46. Huang, K.; Dai, L.M.; Huang, W.W. Effects of Operation Time of Pavement and Traffic Flow on the Traffic Noise of the Highways in an Urban Area. J. Environ. Inform. 2014, 24, 121–130. [Google Scholar] [CrossRef]
Figure 1. Schematic representation of the panel specimens: (a) Sand Panel; (b) Slag Panel; (c) Microporous ceramic Panel.
Sustainability 18 05332 g001
Figure 2. Installation schematic of noise barriers with three types of test panels: (a) Sand Panel; (b) Slag Panel; (c) Microporous ceramic Panel.
Sustainability 18 05332 g002
Figure 3. Schematic of sound absorption testing for the test panels: (a) Reverberation room; (b) Test process.
Sustainability 18 05332 g003
Figure 4. Comparison of sound absorption performance of the test panels.
Sustainability 18 05332 g004
Figure 5. Schematic of sound insulation testing for the test panels: (a) Back; (b) Front.
Sustainability 18 05332 g005
Figure 6. Comparison of sound insulation performance of the test panels.
Sustainability 18 05332 g006
Figure 7. (a) Schematic of the current site layout (b) simulated noise levels.
Sustainability 18 05332 g007
Figure 8. Schematic of the single-sided noise barrier configuration along the project boundary.
Sustainability 18 05332 g008
Figure 9. Simulated noise distribution after installing a 2.5 m single-sided noise barrier at the project boundary: (a) Sand Panel; (b) Slag Panel; (c) Microporous ceramic panel; (d) Glass wool.
Sustainability 18 05332 g009
Figure 10. Schematic diagram of the double-sided noise barrier at the road boundary.
Sustainability 18 05332 g010
Figure 11. Simulated noise distribution after installing a 2.5 m double-sided noise barrier along the road boundary: (a) Sand Panel; (b) Slag Panel; (c) Microporous ceramic panel; (d) Glass wool.
Sustainability 18 05332 g011
Table 1. Particle Size Statistics for Different Ranges (mm).
Raw MaterialsMicro Particle SizeMedium Particle SizeMacro Particle Size
Sand Aggregates0.2–0.30.3–0.50.5–0.7
Industrial Slag0.5–1.01.0–1.51.5–2.0
Porous Ceramsite1.0–1.51.5–2.02.0–3.0
Table 2. Typical mixing ratios and physical parameter statistics for each material group.
GroupsParticle Size Distribution (mm)Bulk Density (kg/m3)Porosity (%)Specific Flow Resistance (Pa·s/m2)NRC
Sand Panel 010.5–0.7 (40%)
0.3–0.5 (60%)
1647 ± 5241.2 ± 1.2986 ± 210.50
Sand Panel 020.3–0.5 (55%)
0.2–0.3 (45%)
1481 ± 4543.5 ± 0.91849 ± 300.60
Sand Panel 030.5–0.7 (20%)
0.3–0.5 (40%)
0.2–0.3 (20%)
1523 ± 3743.4 ± 0.33490 ± 370.40
Sand Panel 040.5–0.7 (15%)
0.3–0.5 (35%)
0.2–0.3 (50%)
1489 ± 6443.9 ± 2.12710 ± 510.45
Slag Panel 011.5–2.0 (40%)
1.0–1.5 (60%)
647 ± 4343.2 ± 0.61287 ± 310.45
Slag Panel 021.5–2.0 (55%)
1.0–1.5 (45%)
553 ± 2348.3 ± 0.6498 ± 220.60
Slag Panel 031.5–2.0 (45%)
1.0–1.5 (35%)
0.5–1.0 (20%)
788 ± 3747.6 ± 1.0695 ± 300.60
Slag Panel 041.5–2.0 (35%)
1.0–1.5 (30%)
0.5–1.0 (35%)
832 ± 4644.1 ± 1.11427 ± 430.50
Slag Panel 051.5–2.0 (35%)
0.5–1.0 (65%)
845 ± 1943.6 ± 0.92165 ± 520.45
Microporous ceramic Panel 01
Concrete (70%)
2.0–3.0 (40%)
1.5–2.0 (60%)
1146 ± 6443.7 ± 0.7631 ± 190.55
Microporous ceramic Panel 02
Concrete (70%)
2.0–3.0 (50%)
1.5–2.0 (50%)
1416 ± 3740.9 ± 1.0892 ± 270.50
Microporous ceramic Panel 03
Concrete (80%)
2.0–3.0 (30%)
1.5–2.0 (25%)
1.0–1.5 (45%)
1753 ± 4932.7 ± 1.12952 ± 390.40
Microporous ceramic Panel 04
Concrete (80%)
1.5–2.0 (45%)
1.0–1.5 (55%)
1778 ± 4339.8 ± 1.41612 ± 420.45
Table 3. Statistics of sound absorption performance test results.
Test Panels α ¯ NRC
Sand Panel0.490.55
Slag Panel 1 (low density)0.550.70
Slag Panel 2 (high density)0.540.70
Microporous ceramic Panel0.470.55
Table 4. Statistical results of sound insulation performance testing.
Test PanelsRw (C, Ctr)
Sand Panel26 (−1, −3)
Slag Panel 1 (low density)25 (0, −2)
Slag Panel 2 (high density)26 (0, −2)
Microporous ceramic Panel26 (−1, −3)
Table 5. Statistical summary of field measurement data (at 10 m height).
Frequency (Hz)631252505001 K2 K4 K8 KA-weighted
Sound pressure level (dB)66.259.658.455.559.456.854.346.663.4
Table 6. Statistics of simulated results at each receiver point under the current condition.
Receiver Point123456789
LrD (dBA)64.465.066.067.166.165.265.066.067.1
Receiver Point101112131415161718
LrD (dBA)66.565.765.065.666.367.065.964.964.6
Table 7. Simulated results statistics at receiver points (2.5 m single-sided noise barrier at project boundary).
Sand PanelReceiver Point123456789
LrD (dBA)62.158.459.360.459.458.658.459.260.5
Receiver Point101112131415161718
LrD (dBA)60.059.158.358.959.760.559.258.562.4
Slag PanelReceiver Point123456789
LrD (dBA)62.058.359.260.359.358.558.359.160.3
Receiver Point101112131415161718
LrD (dBA)59.958.958.258.759.660.459.158.462.3
Microporous ceramic panelReceiver Point123456789
LrD (dBA)62.158.459.360.459.458.658.459.260.5
Receiver Point101112131415161718
LrD (dBA)60.059.158.358.959.760.559.358.562.4
Glass woolReceiver Point123456789
LrD (dBA)62.058.059.060.059.058.258.058.960.1
Receiver Point101112131415161718
LrD (dBA)59.658.758.058.559.360.158.858.262.3
Table 8. Statistics of simulated results at each receiver point with a 2.5 m double-sided noise barrier at the road boundary.
Sand PanelReceiver Point123456789
LrD (dBA)61.960.961.461.259.458.758.458.960.2
Receiver Point101112131415161718
LrD (dBA)59.658.958.659.060.061.461.361.562.6
Slag PanelReceiver Point123456789
LrD (dBA)61.960.961.461.259.458.758.458.960.2
Receiver Point101112131415161718
LrD (dBA)59.658.958.659.060.061.461.361.562.6
Microporous ceramic panelReceiver Point123456789
LrD (dBA)61.960.961.461.259.558.758.559.160.3
Receiver Point101112131415161718
LrD (dBA)59.759.058.759.160.161.561.361.562.6
Glass woolReceiver Point123456789
LrD (dBA)61.960.861.361.159.358.658.358.860.1
Receiver Point101112131415161718
LrD (dBA)59.558.858.558.959.861.461.261.462.6
Disclaimer/Publisher’s Note: The statements, opinions and data contained in all publications are solely those of the individual author(s) and contributor(s) and not of MDPI and/or the editor(s). MDPI and/or the editor(s) disclaim responsibility for any injury to people or property resulting from any ideas, methods, instructions or products referred to in the content.