Article

Spatial Mismatch and Synergy Between Structural Importance and Carbon Sequestration for Sustainable Management of Green Highway Networks: An Integrated Complex Network Analysis

1
Shandong High-Speed Infrastructure Construction Co., Ltd., Jinan 250014, China
2
Research Center for Environmental Protection and Soil & Water Conservation, China Academy of Transportation Sciences, Beijing 100010, China
3
College of Forestry, Beijing Forestry University, Beijing 100083, China
*
Author to whom correspondence should be addressed.
Sustainability 2026, 18(11), 5328; https://doi.org/10.3390/su18115328 (registering DOI)
Submission received: 18 March 2026 / Revised: 29 April 2026 / Accepted: 29 April 2026 / Published: 25 May 2026
(This article belongs to the Special Issue Sustainable Transportation Systems Design and Management)

Abstract

Green highway networks function as critical linear carbon sinks for sustainable transportation systems, yet the link between their network topological structure and sequestration efficiency remains poorly understood. This research establishes an integrated framework to explore the spatial synergy and mismatch between green highway network structure and carbon sequestration in Shandong Province. We constructed a spatially explicit “node-edge” network at a road corridor scale (250-m buffer) and quantified seasonal Net Primary Productivity (NPP) using the CASA model. Results demonstrate: (1) The green highway network exhibits a highly heterogeneous, heavy-tailed structure with low clustering coefficients (<0.01), characterized by high connectivity efficiency but limited structural redundancy; (2) The network’s NPP shows pronounced spatiotemporal dynamics, peaking in summer (mean: 364.7 gC · m 2 · season 1 ) and reaching its nadir in winter (mean: 52.2 gC · m 2 · season 1 ); (3) Statistically significant spatial synergies ( p < 0.01 , Z > 4.00 ) exist between green highway topology and NPP, with weighted closeness ( I = 0.29 ) and weighted degree ( I = 0.21 ) showing the highest effect sizes; (4) LISA analysis identified specific spatial mismatches, such as “High-Low” clusters (high structural importance but low carbon efficiency) in northern inland regions, which represent priority targets for ecological retrofitting. These outcomes quantify that network topology effectively reflects ecological performance, offering a “topology-guided” strategy to promote climate change mitigation and enhance the long-term sustainability of regional transportation infrastructure.

1. Introduction

1.1. Background and Context

Amidst the intensifying crisis of global climate change, limiting global temperature rise and achieving carbon neutrality have become critical objectives for the international community [1]. As the world’s largest carbon emitter, China has strategically committed to the “Dual Carbon” objectives—peaking carbon emissions before 2030 and achieving carbon neutrality by 2060—which necessitates profound systemic transformations across all economic sectors [2]. Within this framework, the transportation sector has emerged as a key sector for emission reduction, currently ranking as the third-largest source of carbon emissions in China and accounting for approximately 10% of the national total [3,4]. Among various transportation modalities, road transport constitutes the predominant share, exceeding any other single mode [5]. In particular, highways, serving as the high-speed arteries of regional development, face immense pressure to decarbonize due to their high traffic density and energy intensity [6]. However, beyond their role as emission sources, highways also form the spatial foundation of nature-based infrastructure. Within this Transport Ecology perspective, roadside green belts, median vegetation, and interchange landscapes collectively constitute a large-scale linear ecosystem. This green highway network exhibits substantial carbon sequestration potential, thereby providing a critical nature-based solution for partially offsetting transportation-related carbon emissions.

1.2. Literature Review and Research Gap

To exploit this ecological potential, extensive research has focused on quantifying and enhancing the carbon sequestration capacity of highway vegetation. Studies by Fu et al. and Li et al. have demonstrated that through protective forest belts, highways such as the G42 and the Tarim Desert Highway can achieve significant annual carbon sinks, partially offsetting traffic emissions [7,8]. To further elevate this function, current improvement strategies predominantly concentrate on micro-scale interventions, including vegetation configuration optimization, soil structure amelioration, and reinforced maintenance management [9,10,11]. However, these site-specific measures typically entail substantial implementation costs [9], and more critically, they tend to treat roadside green spaces as isolated patches, neglecting the systemic benefits of ecological connectivity. The transition from general landscape ecology to highway-specific research requires a clearer justification: highway green spaces are not merely fragmented patches but constitute integrated “Linear Ecological Networks”. Leveraging Infrastructure Ecology, we can re-evaluate these infrastructures as continuous ecological corridors. Parallel to these micro-scale efforts, the construction of ecological security patterns based on complex network theory has emerged as a prevalent approach in broader landscape ecology [12]. Recent investigations in the Yellow River Basin have revealed that topological metrics—such as betweenness centrality and PageRank—are strongly correlated with ecosystem services like carbon sequestration and water retention [13,14]. Yet, this “network perspective” has been largely confined to natural watersheds or urban agglomerations; its application to linear transportation infrastructure remains scarce, leaving the interactive mechanisms between the topological structure of highway network and their carbon sequestration function largely unexplored.
The protective green spaces along highways effectively constitute a distinctive “Patch-Corridor” ecological network [15,16]. Theoretically grounding this concept requires distinguishing between natural and artificial ecological networks: while natural networks evolve through biological succession and environmental selection, artificial green highway networks are engineering-driven systems characterized by high topological regularity and planned linear connectivity. Unlike natural ecosystems where structural connectivity aligns with spontaneous biological flows, these artificial systems are constrained by transportation standards [17,18]. Consequently, it is unclear whether the “structure-function” synergy observed in natural ecological systems applies to these transportation infrastructures. Specifically, current research has not yet clarified the interactive mechanisms between topological indicators (e.g., centrality, connectivity) and carbon sequestration function. It remains to be determined whether structurally critical nodes (such as major interchanges) effectively function as “carbon sinks,” or if there exists a spatial mismatch where high-priority nodes are ecologically underutilized. This knowledge gap hinders the advancement of highway route planning and vegetation management from simple “quantity expansion” to “structural optimization,” limiting the ability to identify and reinforce the network’s ecological bottlenecks.
While recent studies have significantly advanced our understanding of carbon dynamics, they primarily focus on the regional spatial mismatch between carbon supply and demand [4] or the impact of integrated green-grey infrastructure patterns on carbon emissions at the village-town scale [19]. However, transportation infrastructure in these studies is often simplified as static land-use patches or socioeconomic drivers. A critical knowledge gap remains regarding how the intrinsic topological characteristics of linear highway networks—such as centrality and connectivity—interact with their localized ecological functions (e.g., carbon sequestration) at a refined corridor scale. Unlike broad-scale land-use assessments, the synergy between network “structure” and “function” provides a more mechanistic perspective for sustainable infrastructure planning.

1.3. Research Hypotheses and Objectives

Based on these theoretical considerations, we explicitly hypothesize that: (1) highway nodes with higher topological centrality (e.g., closeness and degree) exhibit significantly higher carbon sequestration potential due to their strategic positioning within the linear network; and (2) specific spatial mismatches exist between topological importance and functional output, identifying critical bottlenecks where structural advantages have not been translated into ecological benefits.
Consequently, this study focuses on Shandong Province—China’s inaugural “Ministry-Province Collaborative Demonstration Zone” for transportation, comprising a highway network exceeding 8600 km and pioneering “zero-carbon” highway initiatives—as the empirical case to systematically decode the relationship between network structure and carbon sequestration function. Specifically, the objectives of this research are threefold: (1) to construct a spatially explicit “node-edge” ecological network by abstracting extensive green spaces at interchanges and toll stations as ecological nodes, and defining network edges at a “road corridor scale” (with a bilateral 250 m buffer) to resolve the spatial resolution mismatch between narrow roadside vegetation and regional remote sensing data; (2) to quantify the seasonal Net Primary Productivity (NPP) using the Carnegie-Ames-Stanford Approach (CASA) model driven by multi-source remote sensing data; and (3) to apply Bivariate Global Moran’s I and Local Indicators of Spatial Association (LISA) to quantitatively evaluate the coupling relationships between topological importance (measured by metrics such as weighted degree and betweenness centrality) and carbon sequestration function. By identifying specific regions of spatial “synergy” and “mismatch,” this research aims to reveal the pivotal role of network structure in regional carbon dynamics, thereby offering theoretical support and quantitative references for implementing “topology-guided” green transportation planning and achieving carbon neutrality in Shandong Province and analogous regions.

2. Materials and Methods

2.1. Study Area

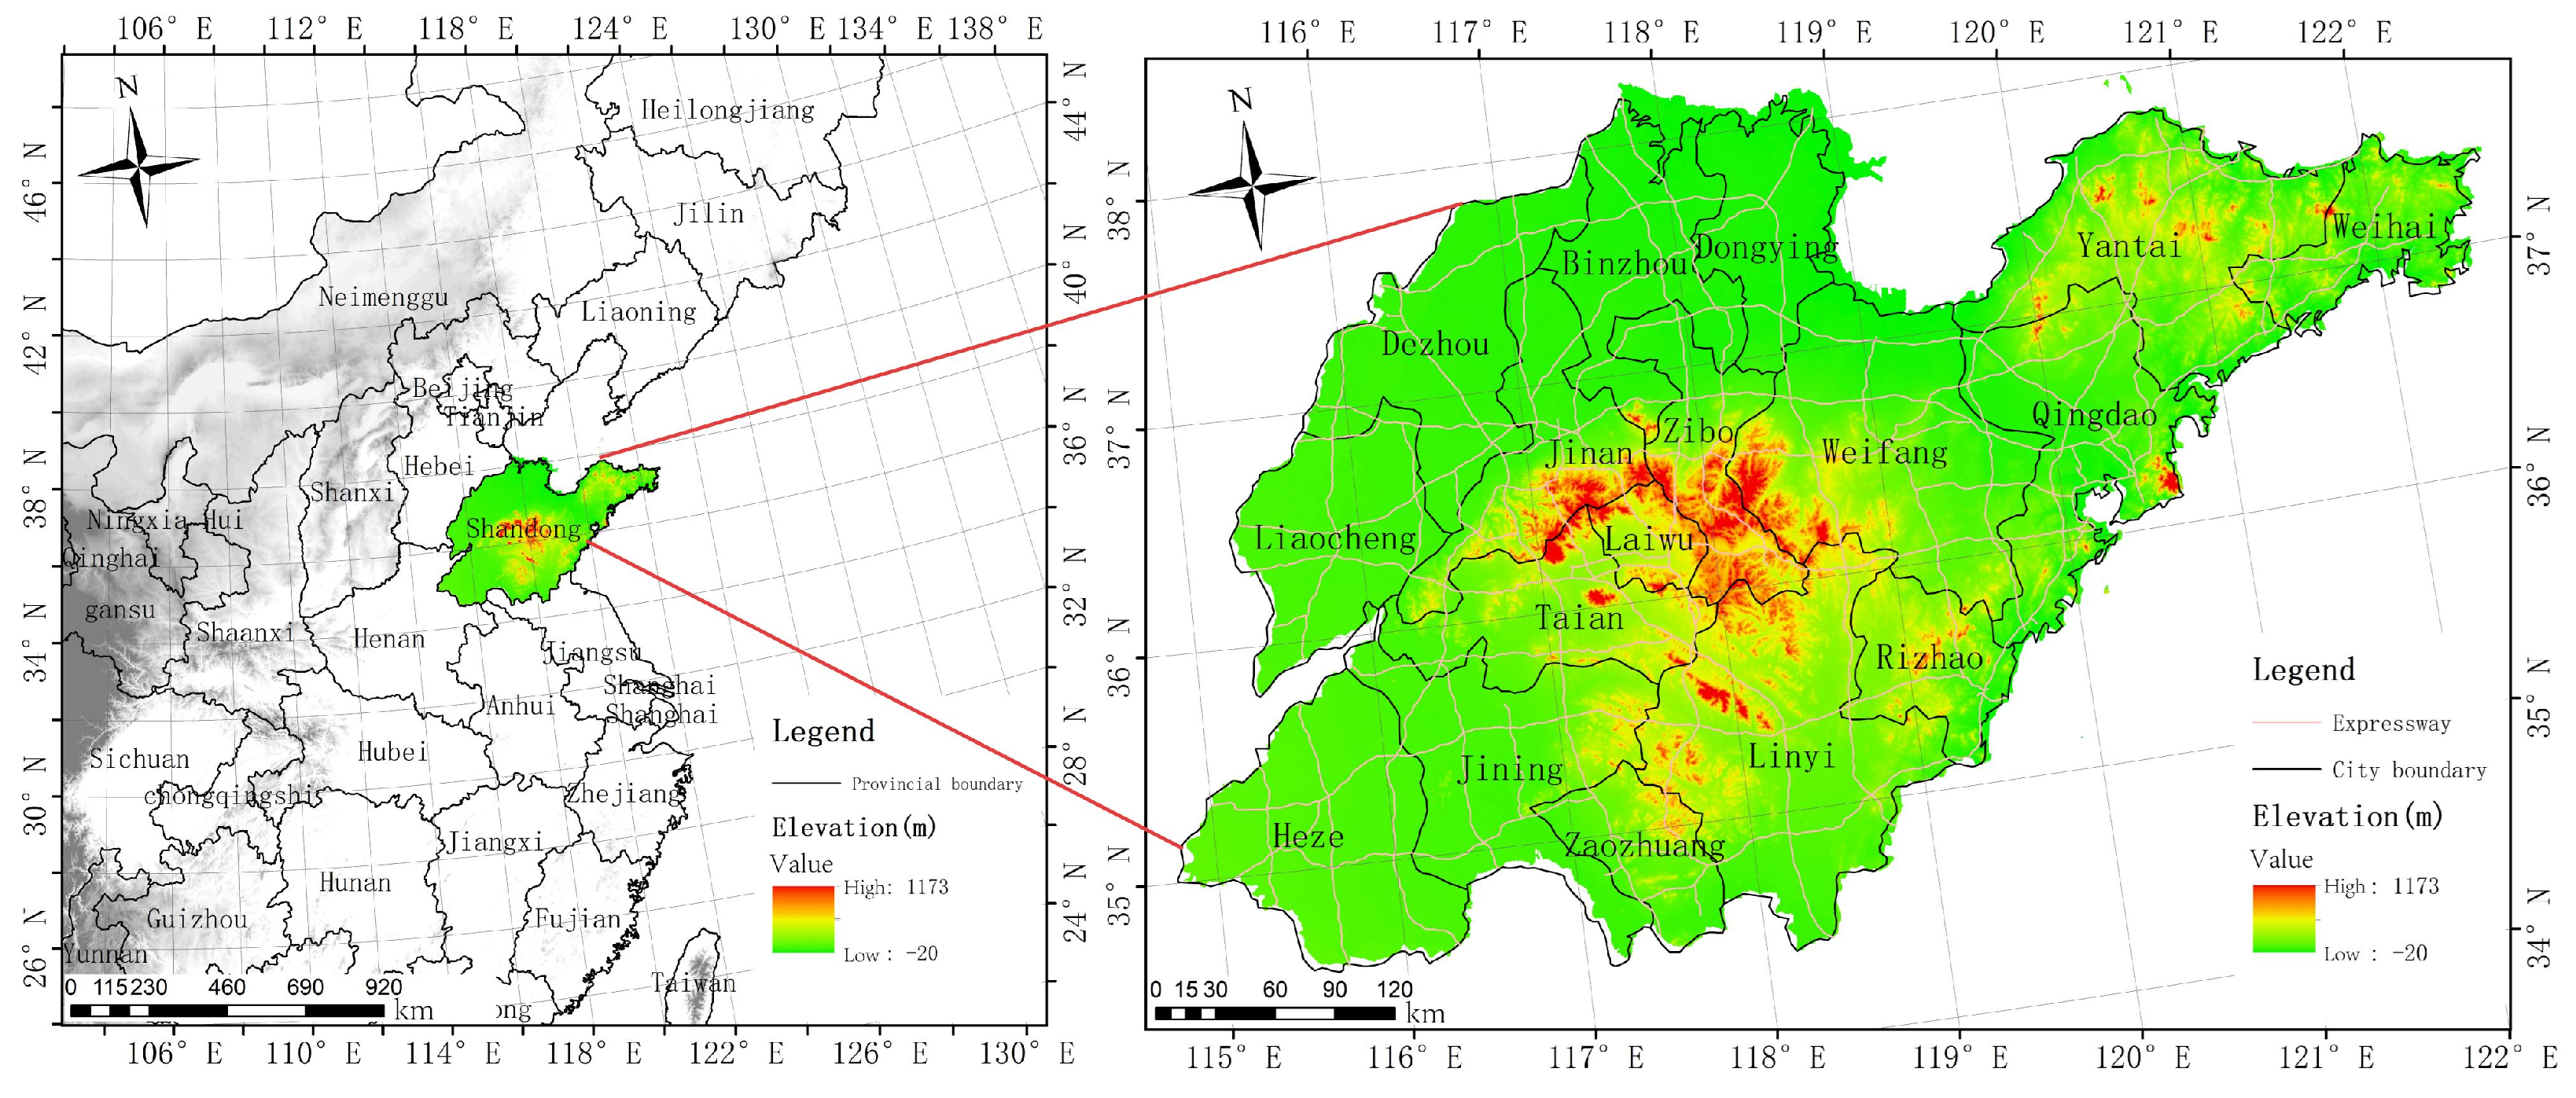
Shandong Province is situated along China’s eastern coastline in the lower Yellow River region, spanning 34 ° 22.9 38 ° 24.01 N latitude, encompassing an area of 15.58 × 10 4 km 2 (Figure 1). The topography exhibits complex diversity, characterized by central mountainous, southwestern and northwestern low-lying plains, and eastern undulating gentle hills, thereby forming a comprehensive topographic framework structured around mountainous-hilly backbones with interspersed plains and basins. The climate is predominantly characterized by warm temperate monsoon conditions, featuring distinct seasonal variations and concentrated precipitation patterns [20], with annual mean temperatures ranging from 11 to 14   ° C and annual precipitation typically varying between 550 and 950 mm [21]. Shandong Province represents China’s inaugural ministry–province collaborative demonstration zone for transportation infrastructure development, experiencing rapid highway expansion, with total highway mileage reaching more than 8600 km in recent years, establishing a comprehensive network configuration characterized by “nine vertical corridors, five horizontal arteries, one ring road, seven radial connections, and multiple interconnecting routes” [22,23]. As a region characterized by a high-density transportation network and diverse topographical transitions (from plains to hills), Shandong serves as an ideal representative case for evaluating the ecological-structural coupling of highway networks in rapidly developing coastal provinces globally. In recent years, Shandong Province’s highway system has proactively pursued “zero-carbon” highway implementation pathways, executing extensive green space ecological restoration and construction initiatives along highway corridors, deploying intelligent transportation systems and innovative eco-friendly construction materials, thereby minimizing energy consumption while enhancing the comprehensive carbon sequestration capacity of the highway network [24,25,26].

2.2. Data Sources

The datasets employed in this study comprise Shandong Province highway data, precipitation data, temperature data, Normalized Difference Vegetation Index (NDVI) data, solar radiation raster data, land cover data, Night Time Light (NTL) data and Digital Elevation Model (DEM) data.
The year 2023 was selected as the representative year for this study, as its meteorological conditions (e.g., annual precipitation and mean temperature) were closely aligned with the 30-year climatological mean of Shandong Province, minimizing the bias introduced by extreme climate anomalies.
All datasets correspond to the year 2023, wherein Shandong Province highway data were provided by Shandong Highway Construction Management Group Co., Ltd. in vector line format; precipitation and mean temperature data were sourced from China’s National Tibetan Plateau Scientific Data Center, shared by researcher Peng Shouzhang [27,28], in raster format with 1 km spatial resolution, comprising monthly precipitation data and monthly mean temperature data for Shandong Province; NDVI data was similarly obtained from China’s National Tibetan Plateau Scientific Data Center, shared by researcher Gao Jixi, featuring 250 m spatial resolution and derived through synthesis and mosaicking of Aqua/Terra-MODIS satellite sensor MOD13Q1 products integrated with land use data [29]. Solar radiation data were acquired from the Climatology Lab (https://www.climatologylab.org/terraclimate.html, accessed on 4 December 2025), comprising Terra Climate monthly downward shortwave solar radiation datasets with 4 km spatial resolution [30]. Land cover data were derived from the China Land Cover Dataset published by Professor Huang Xin of Wuhan University [31], presented in raster format with 30 m spatial resolution, accessible for download at (https://zenodo.org/records/12779975, accessed on 4 December 2025). NTL data representing human disturbance intensity were derived from the NPP-VIIRS (Visible Infrared Imaging Radiometer Suite) Annual VIIRS Nighttime Lights V2.1 dataset, produced by the Earth Observation Group at the Colorado School of Mines [32]; this dataset, with a spatial resolution of approximately 500 m, has undergone strict geometric correction and outlier removal to eliminate stray light and background noise. DEM data was derived from the Shuttle Radar Topography Mission Digital Elevation Model (DEM) with a spatial resolution of 90 m [33]; this data was obtained from the NASA Earth data portal, the slope layer was calculated from the original DEM using the Surface Analysis toolset within the ArcGIS Pro 3.2 software.
To ensure the reliability of the estimation, we utilized the standard Quality Control layers of the MODIS products to filter out low-quality pixels affected by cloud cover or atmospheric aerosols. The CASA model parameters, particularly the maximum light use efficiency, were calibrated based on established literature [34]. Furthermore, the meteorological datasets were sourced from the 1 km monthly temperature and precipitation dataset for China provided by the National Tibetan Plateau Data Center, which has been extensively validated in previous regional studies across China and is widely recognized for its high spatial accuracy [27,28,35], thereby ensuring the robustness of the water and temperature stress scalars in our NPP modeling. All raster datasets were mosaicked and masked to the study area. Subsequently, they were resampled to a uniform 250 m spatial resolution and reprojected into the WGS 1984 Albers Equal Area Conic projection system.

2.3. Methodological Framework

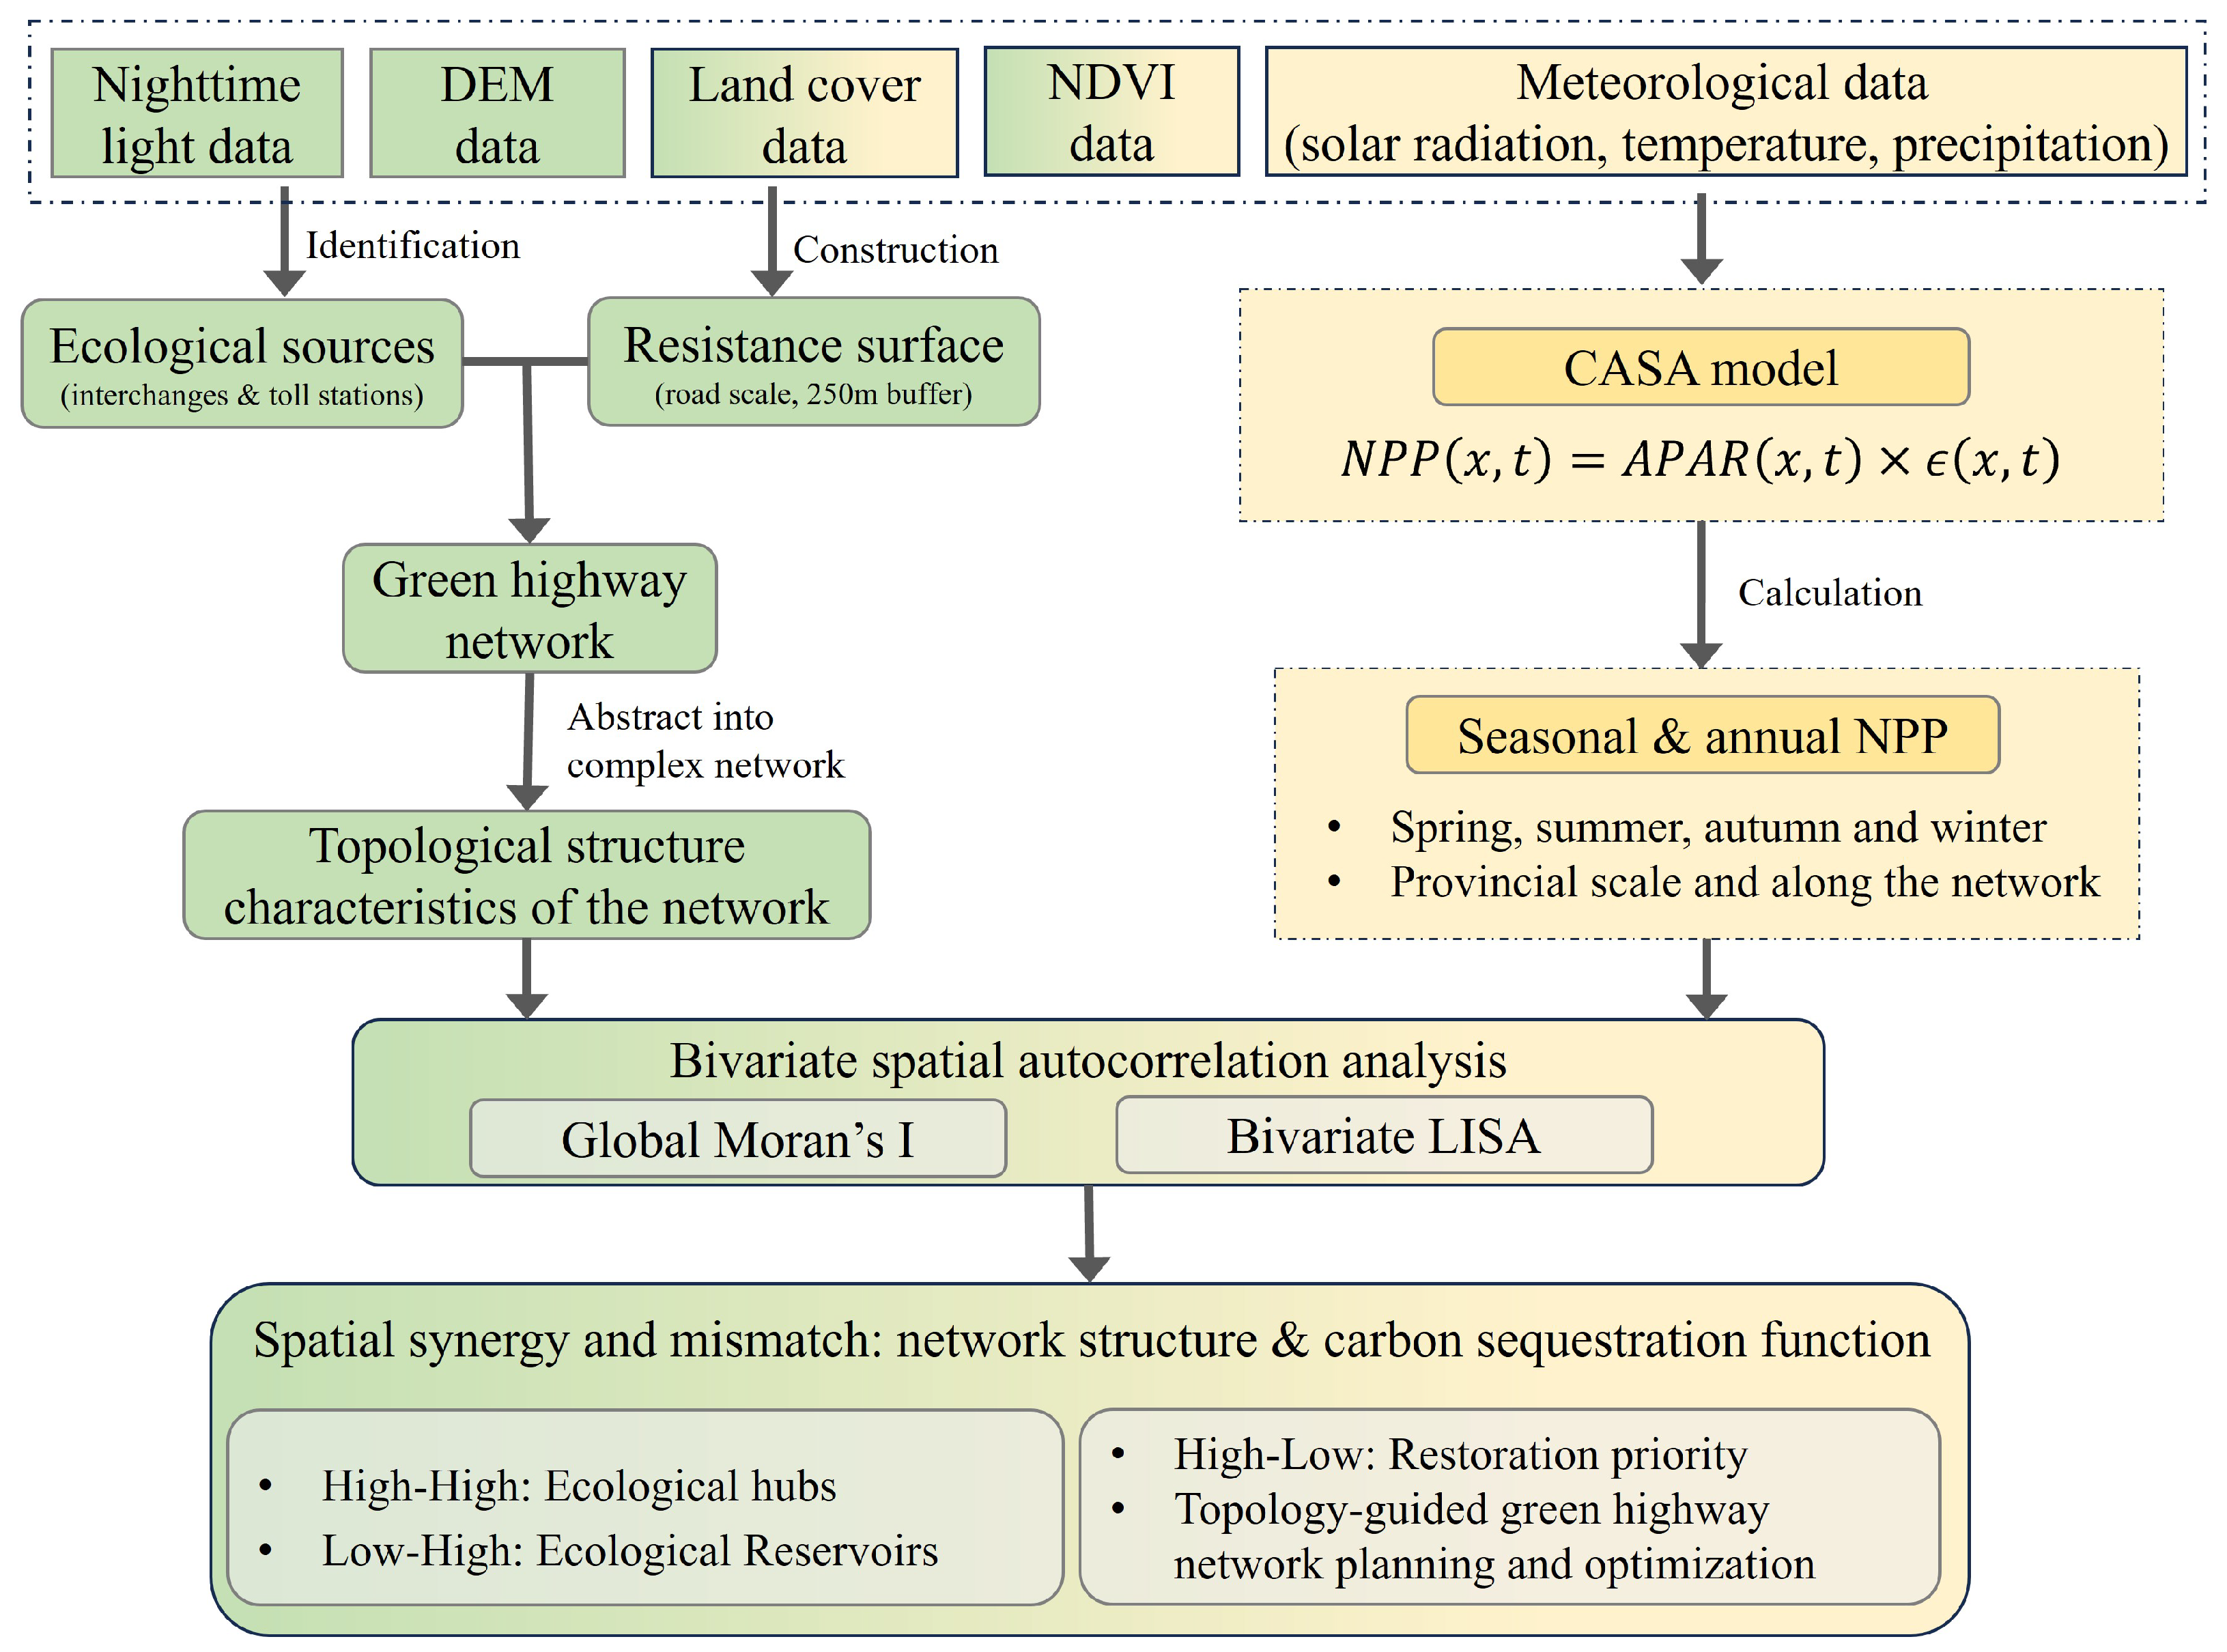
As illustrated in Figure 2, this study adopts an integrated analytical framework to investigate the spatial relationship between green highway network structure and carbon sequestration function. The framework is organized as a sequential workflow comprising three interconnected components.
First, a spatially explicit green highway ecological network is constructed to characterize the structural configuration of roadside green infrastructure at the road corridor scale. Second, the carbon sequestration function of network nodes is quantified to represent the ecological function of the network. Finally, spatial statistical analyses are conducted to examine the coupling patterns between network structural importance and carbon sequestration, thereby identifying areas of spatial synergy and mismatch.
This integrated framework enables a systematic linkage between network topology and ecological function, providing a basis for topology-guided optimization of green highway systems.

2.4. Green Highway Network Construction Methodology

This study employs a complex network approach to model the green highway infrastructure in Shandong Province. By abstracting the roadside ecosystems into a weighted network of nodes and edges, we establish a structural framework to further analyze the spatial synergy between network centrality and carbon sequestration function.

2.4.1. Definition of Nodes and Edges

This study abstracts the green highway network into a “Patch-Corridor” topological model, where interchanges and toll stations are abstracted as ecological nodes because they represent the primary spatial concentration of green infrastructure within the regional highway network. It is important to note that Shandong Province, as a pioneer in ’Green Highway’ development, has implemented standardized landscape designs for its highway hubs. These designs typically incorporate extensive vegetation within the interior loops of interchanges and surrounding areas of toll stations. Consequently, these sites function as ‘ecological stepping stones’ with significantly higher biomass density than standard linear road segments. Our node definition thus captures these concentrated ‘carbon-sequestering hubs,’ which are the structural foundations of the artificial-ecological network.
For each ecological node, NPP was extracted as the mean value within a buffer zone of 250 m surrounding the interchange or toll station, thereby linking raster-based productivity information to node-level attributes. The selection of a 250 m buffer represents a deliberate trade-off between ecological realism and methodological constraints. It should be explicitly noted that this buffer width was established based on conceptual reasoning and data resolution alignment, rather than being derived from an empirical optimization process (e.g., multi-scale sensitivity testing). From an ecological perspective, this width encompasses the primary ’Road Effect Zone’, where highway-induced microclimate changes and nitrogen deposition significantly influence vegetation productivity. Methodologically, this scale is intrinsically linked to the 250 m spatial resolution of the MODIS NDVI product. Using a narrower buffer (e.g., 50 m or 100 m) would introduce significant mixed-pixel errors, where the spectral signature of road surfaces would dominate and distort the NPP estimation of the surrounding vegetation. Conversely, a wider buffer would incorporate excessive non-highway land uses, diluting the specific ecological characteristics of the highway corridor.
Correspondingly, the highway segments function as linear green corridors (edges) that facilitate ecological connectivity and material exchange between nodes. This abstraction aligns with the spatial resolution constraints of the multisource remote sensing data while capturing the functional essence of the roadside ecosystem.

2.4.2. Ecological Resistance Assessment at Road Corridor Scale

Due to the inherent narrowness of highway green belts (typically <50 m) and the spatial resolution constraints of available regional datasets (e.g., 250 m MODIS NDVI), individual landscaping strips cannot be effectively resolved. Consequently, this study adopts the road corridor scale as the primary spatial unit for analysis. This scale encompasses the highway infrastructure and its immediate ecological influence zone (a bilateral 250 m buffer matching the 250 m data resolution). Analyzing at the corridor scale not only aligns with the sensor’s physical constraints but also accounts for the integrated ecological functions provided by the highway and its surrounding environment as a coherent landscape element.
The resistance assessment framework integrates five thematic factors commonly adopted in resistance surface construction: elevation, slope, land cover, NDVI, and Night Time Light (NTL). To ensure methodological objectivity and cross-study comparability, resistance values were assigned based on standardized ecological security pattern protocols that have been widely validated across diverse geographical regions in China—ranging from the arid Northwest to the humid Southeast [13,36,37]. Following the principle of parsimony and to avoid over-parameterization in the absence of specific species-tracking data, an equal-weighting scheme (0.2 per factor) was adopted. The specific classification and resistance assignments are detailed in Table 1. To ensure the robustness of this construction, a weight-based sensitivity analysis was performed by perturbing the assigned weights by ± 10 % to ± 20 % . The high consistency of the resulting spatial gradients ( r > 0.92 ) confirms that the model realistically captures landscape constraints and remains stable despite minor fluctuations in factor weighting.
To transform the highway map into a functional ecological network, the cumulative ecological resistance ( R u v ) along each corridor was calculated. Utilizing Python 3.9-based spatial scripts within the ArcPy environment of ArcGIS Pro 3.2, we performed line-integral analysis across the comprehensive resistance surface to derive the total resistance for each segment between nodes. This cumulative value represents the physical and structural difficulty for ecological flux and matter exchange to occur along a specific highway corridor.
To facilitate topological analysis, the R u v values were normalized and transformed into Ecological Continuity Coefficients ( W u v ) using a reciprocal transformation shown in Equation (1):
W u v = 1 R u v
This coefficient serves as the edge weight for the green highway network. By integrating these weights into the computation of metrics such as weighted betweenness, the network model can effectively distinguish between transport junctions and critical “ecological stepping stones” that maintain regional carbon sequestration stability.

2.5. Complex Network Metrics

To systematically assess the structural importance and synergistic potential of the green highway network, this study employs six classical topological metrics adapted for weighted network analysis. To ensure transparency regarding the statistical collinearity among these topological features, a comprehensive Pearson correlation matrix is presented in Section 3.2.7.
While certain topological metrics may exhibit statistical correlation due to the inherent constraints of the linear highway network, they are retained here because they represent fundamentally distinct structural dimensions of network architecture. Specifically, weighted degree quantifies the local connectivity and cumulative strength of direct interactions of a node; weighted closeness centrality reflects the relative central positioning and global accessibility of a node within the overall system; weighted clustering coefficient assesses local redundancy and the prevalence of closed triangular formations, reflecting the structural robustness of a node’s immediate neighborhood; weighted betweenness centrality identifies pivotal ‘bridges’ that control structural flow and path efficiency between sub-networks; weighted eigenvector centrality highlights ‘ecological engines’ that gain importance from their proximity to other influential neighbors; and weighted PageRank identifies ‘stable hubs’ by evaluating sustained global influence through iterative probability distribution. Relying on statistical pruning (e.g., PCA) would risk obscuring these specific topological nuances and physical interpretability, which are essential for ‘topology-guided’ infrastructure planning. Consequently, these six metrics are treated as complementary structural descriptors, providing a multi-dimensional framework to characterize the intrinsic properties of highway nodes prior to investigating their potential coupling with ecological functions.
Unlike binary networks, the weighted metrics used here incorporate the Ecological Continuity Coefficient ( W u v ) as the edge weight, ensuring that the identification of network hubs reflects both geometric connectivity and corridor quality.

2.5.1. Weighted Degree

Weighted degree is the most fundamental local metric, representing the summation of weights for all edges directly connected to a given node [38]. It reflects the total ecological flux potential and the immediate resource aggregation capability of a junction. The computational equation is shown in Equation (2):
W D ( v ) = u N ( v ) w u v
where W D ( v ) represents the weighted degree of node v; u and v are nodes; N ( v ) is the neighborhood of node v; and w u v denotes the Ecological Continuity Coefficient (reciprocal of cumulative resistance) between nodes u and v.

2.5.2. Weighted Closeness Centrality

Weighted closeness centrality quantifies the efficiency of a node in reaching all other nodes through high-quality (low-resistance) corridors [39,40]. It is calculated as the reciprocal of the sum of resistance-weighted network distances between the focal node and all other nodes (Equation (3)):
C c w ( v ) = n 1 u v R u v
where C c w ( v ) is the weighted closeness centrality of node v.

2.5.3. Weighted Clustering Coefficient

This metric measures the local cohesiveness of a node’s neighborhood by considering the intensity of connections among its neighbors. It helps identify whether a node resides within a locally robust and highly clustered structural configuration. Its low values signify linear connectivity with an absence of redundant ecological pathways [40,41]. The weighted version is formulated to account for edge weights w as shown in Equation (4):
C w ( v ) = 1 W D ( v ) ( k v 1 ) u , h w v u + w v h 2 a v u a v h a u h
where C w ( v ) is the weighted clustering coefficient of node v, k v is the binary degree and a is the adjacency matrix element.

2.5.4. Weighted Betweenness Centrality

Weighted betweenness centrality identifies critical “ecological bottlenecks” or hubs that control the flow across the network. It measures the ratio of shortest weighted paths (defined as paths with the lowest cumulative resistance along highway corridors) traversing a node [39,40,42] as shown in Equation (5):
C B w ( v ) = s v t V σ s t w ( v ) σ s t w
where C B w ( v ) represents the weighted betweenness centrality of node v; V is the set of all nodes in the network; s and t denote any two nodes in the network; σ s t w is the total number of shortest weighted paths between s and t; and σ s t w ( v ) is the number of such paths passing through v.

2.5.5. Weighted Eigenvector Centrality

This metric accounts for both the quantity of connections and the ecological significance of the connected counterparts. It characterizes the hierarchical prominence of a node within the network. It is solved using the principal eigenvector of the weighted adjacency matrix [39,40,43] as shown in Equation (6):
x v = 1 λ u N ( v ) w u v x u
where x v represents the weighted eigenvector centrality of node v, and λ represents the eigenvalue. High values signify “multi-tiered cores” with robust connection capabilities to other influential nodes.

2.5.6. Weighted PageRank

Weighted PageRank evaluates node importance based on the link structure and the quality of incoming ecological corridors. It is computed through a Markov stochastic process [44,45] as shown in Equation (7):
P R w ( v ) = 1 d n + d u N ( v ) w u v P R w ( u ) W D ( u )
where P R w ( v ) represents the weighted PageRank of node v, d is the damping factor (typically 0.85). It facilitates the identification of nodes critical for maintaining ecological flow stability across the network.

2.6. CASA Model

This study employs the Carnegie-Ames-Stanford Approach (CASA), a satellite-based light use efficiency model, to estimate the Net Primary Productivity (NPP) of highway green spaces. The CASA model integrates multi-source datasets—including remotely sensed NDVI, solar radiation, air temperature, and precipitation—to simulate the biophysical processes of light energy absorption and conversion [46]. This model is widely recognized for its robust performance in quantifying vegetation carbon sequestration across diverse spatial scales [47,48].
The core computational procedure of the CASA model is presented in Equation (8):
N P P ( x , t ) = A P A R ( x , t ) × ε ( x , t )
where N P P ( x , t ) denotes the NPP at pixel x during time t, A P A R ( x , t ) represents the absorbed photosynthetically active radiation by vegetation, and ε ( x , t ) corresponds to the actual light use efficiency.
The A P A R ( x , t ) is determined through Equation (9):
A P A R ( x , t ) = S O L ( x , t ) × F P A R ( x , t ) × 0.5
where S O L ( x , t ) represents the total solar radiation, 0.5 represents the proportion of P A R available for photosynthesis in total radiation, F P A R ( x , t ) signifies the fraction of photosynthetically active radiation intercepted by the vegetation canopy, typically derived through NDVI inversion, with calculations employing linear transformation methodology as detailed in Equation (10):
F P A R = N D V I N D V I min N D V I max N D V I min
where N D V I min and N D V I max are the minimum and maximum N D V I values for a given vegetation type. Following the methodology of existing literature, these values are obtained by identifying the 5% and 95% thresholds of the N D V I distribution for each land cover category in Shandong Province, thereby ensuring the model’s sensitivity to regional environmental conditions.
The actual light use efficiency ε ( x , t ) is collectively modulated by temperature stress factors T ε 1 ( x , t ) , T ε 2 ( x , t ) and water stress factor W ε , as presented in Equation (11):
ε ( x , t ) = ε max × T ε 1 ( x , t ) × T ε 2 ( x , t ) × W ε ( x , t )
where ε max is the maximum potential light use efficiency for specific vegetation types, due to the dominance of deciduous species in the study area, the ε max for forests was set to 0.692 gC · MJ 1 , representing the characteristic deciduous broadleaf communities of Shandong, for croplands and grasslands, a uniform value of 0.542 gC · MJ 1 was applied, following the calibrated benchmarks for Chinese terrestrial ecosystems [34]. The temperature stress factors, T ε 1 ( x , t ) and T ε 2 ( x , t ) , account for the limitations imposed by ambient temperature on photosynthesis, as expressed in Equations (12) and (13):
T ε 1 ( x , t ) = 0.8 + 0.02 T o p t ( x ) 0.0005 T o p t ( x ) 2
T ε 2 ( x , t ) = 1.185 1 + exp 0.2 T o p t ( x ) 10 T ( x , t ) × 1 1 + exp 0.3 T o p t ( x ) 10 + T ( x , t )
where T o p t ( x ) is the optimal growth temperature, defined as the mean temperature of the month when N D V I reaches its annual peak, and T ( x , t ) is the actual mean temperature of the current month.
The water stress factor W ε ( x , t ) represents the effect of available moisture on vegetation productivity, which is calculated as follows in Equation (14):
W ε ( x , t ) = 0.5 + 0.5 × E E T ( x , t ) P E T ( x , t )
where E E T ( x , t ) and P E T ( x , t ) represent the actual evapotranspiration and potential evapotranspiration, respectively. In this study, P E T ( x , t ) is estimated using the Thornthwaite method based on monthly mean temperature and latitude, while E E T ( x , t ) is derived from the regional moisture balance model integrating monthly precipitation data.
To ensure the reliability of the NPP estimation, the CASA-derived results were validated through a spatial correlation analysis against the MODIS NPP product (MOD17A3HGF v061). This cross-product validation allows for an objective assessment of the model’s performance in capturing the regional productivity gradients of Shandong Province.

2.7. Bivariate Spatial Autocorrelation Analysis

To quantitatively evaluate the spatial synergy and coupling relationship between the topological characteristics of the green highway network and nodal carbon sequestration function (NPP), this study employs Bivariate Global Moran’s I and Bivariate Local Moran’s I (LISA). All spatial autocorrelation calculations and cluster mapping were conducted using GeoDa 1.20.

2.7.1. Bivariate Global Moran’s I

The Bivariate Global Moran’s I is used to characterize the overall spatial correlation and dependence between two variables (x and y) across the entire study area [49,50]. It is calculated as shown in Equation (15):
I X Y = i = 1 n j = 1 , j i n W i j X i X ¯ Y j Y ¯ S 2 i = 1 n j = 1 , j i n W i j
where I X Y is the bivariate global Moran’s I; n is the total number of network nodes; X i and Y j represent the values of the topological indicator and NPP at nodes i and j, respectively; X ¯ and Y ¯ are the mean values; S 2 is the sample variance; and W i j is the spatial weight matrix. I X Y > 0 indicates a positive spatial correlation, while I X Y < 0 signifies a spatial mismatch or negative correlation.
Since the nodes in the green highway network (interchanges and toll stations) are discretely and unevenly distributed, this study employs a K-Nearest Neighbors Spatial Weight Matrix to define the spatial relationships [51]. The weight matrix was constructed by identifying the k = 4 nearest neighbors for each node based on the shortest Euclidean distance [52]. This value was chosen to represent the immediate cardinal adjacency (Rook’s contiguity), which is optimal for capturing localized spatial dependencies in 250 m grid data while preventing excessive spatial smoothing. Sensitivity tests (with k ranging from 4 to 10) confirmed that the spatial patterns and significance levels remained robust.
Prior to the spatial analysis, the statistical distribution of all variables was examined. While the NPP data exhibited a near-normal distribution, the network topological metrics showed significant right-skewness. To ensure methodological consistency and to meet the assumptions of spatial statistical inference, a log-transformation was applied to both the NPP and network indicators [49,53]. This procedure balances the skewed distributions and mitigates the impact of extreme values, thereby enhancing the stability and comparability of the spatial autocorrelation and subsequent coupling analysis. The transformation formula are shown in Equations (16) and (17):
X = ln ( X + 1 )
Y = ln ( Y + 1 )
where X and Y represent the raw observations of topological indicators and NPP, respectively, while X and Y are the transformed values used for subsequent spatial autocorrelation analysis.

2.7.2. Bivariate Local Moran’s I (LISA)

Local Indicators of Spatial Association (LISA) are utilized to identify the spatial clustering patterns of the two variables at specific locations. This analysis categorizes the spatial relationship into four types of clusters: High-High (H-H), Low-Low (L-L), High-Low (H-L), and Low-High (L-H) [49,50].
H-H cluster represents nodes where both structural importance and NPP are significantly high, serving as synergy hubs for regional ecological stability. L-L cluster indicates nodes where both variables are significantly low, typically representing ecological “cold spots” with limited connectivity and productivity. H-L cluster highlights a spatial mismatch where nodes possess high structural importance but exhibit low carbon sequestration function, potentially due to internal resource competition or intense human disturbance. L-H cluster identifies nodes with low structural importance that are surrounded by or possess high ecological output, signifying regions where carbon sink potential has not been fully integrated into the network’s structural framework [54].
The local index is calculated according to Equation (18):
I i = Z X i j = 1 , j i n W i j Z Y j
where I i represents the local bivariate Moran’s I for node i; and Z X i and Z Y j are the standardized values of observations X and Y at nodes i and j, respectively.
During the calculation of the bivariate local Moran’s I, the same variable preprocessing ( ln ( X + 1 ) and ln ( Y + 1 ) transformations) and spatial weight configuration as the global analysis were utilized to ensure the consistency and comparability of the spatial autocorrelation results.

3. Results

3.1. Green Highway Network Construction

3.1.1. Ecological Resistance Assessment

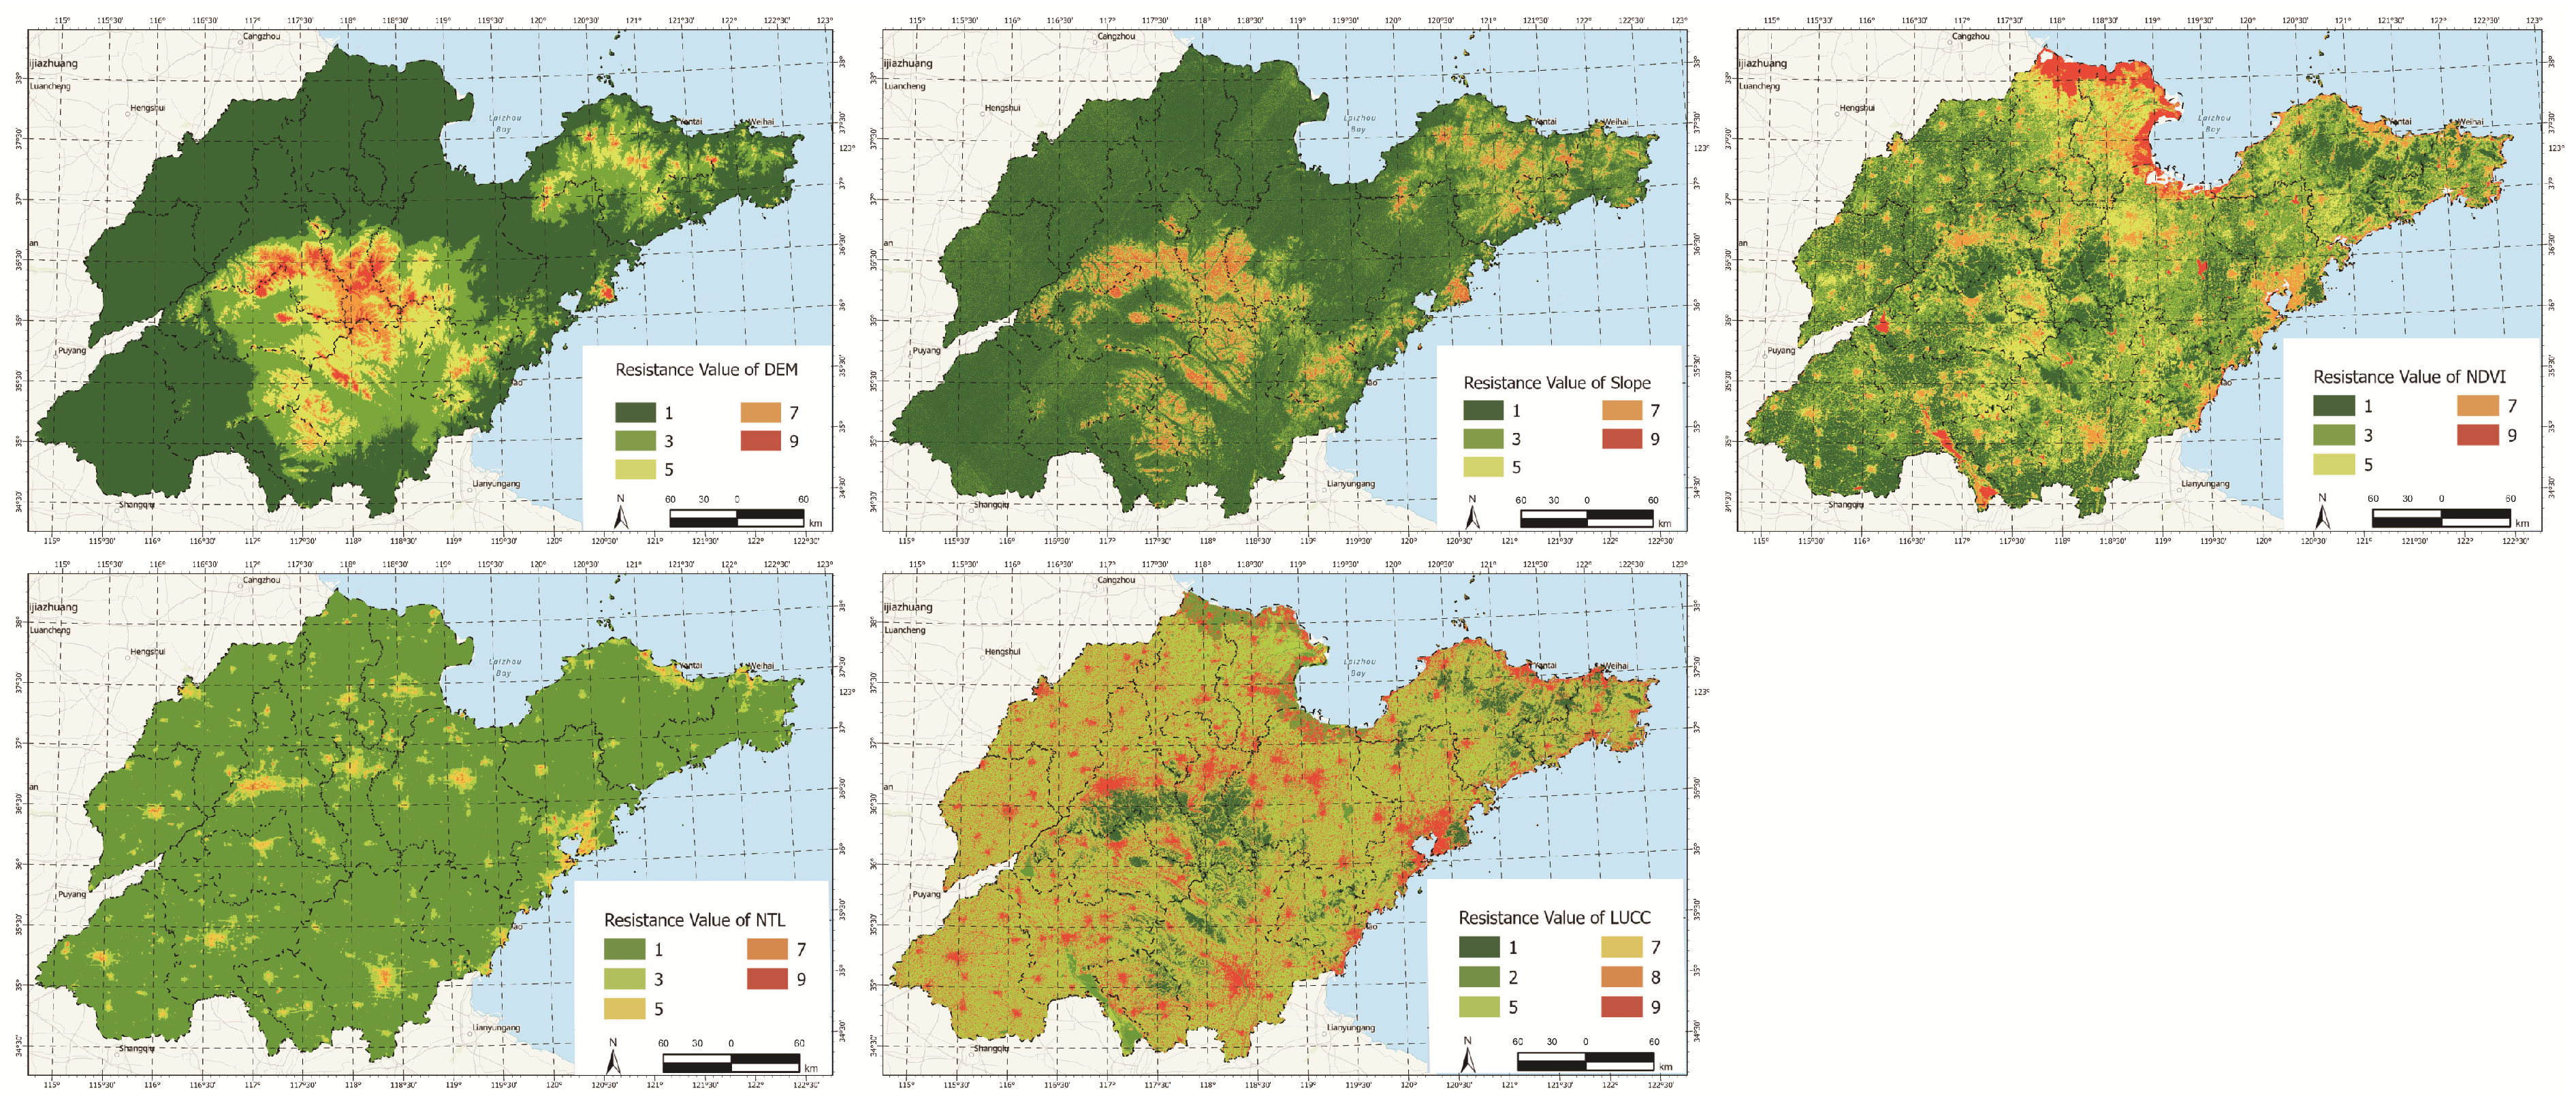
Following the resistance assessment framework presented in Table 1, ecological resistance within the study area for 2023 was evaluated, with results illustrated in Figure 3.
To verify the robustness of the resistance surface construction, a weight-based sensitivity analysis was conducted. We perturbed the assigned weights of the five resistance factors by ± 10 % to ± 20 % and re-simulated the spatial gradients. The results indicated that the spatial distribution of high- and low-resistance zones remained highly consistent, with a Pearson correlation coefficient (r) exceeding 0.92 between different weighting scenarios. This demonstrates the algorithmic robustness of the model, showing that the spatial gradients are not sensitive to minor fluctuations in thematic factor weighting. However, it is important to explicitly acknowledge that this mathematical stability does not fully validate the underlying ecological reality. Without empirical observation data (e.g., specific species dispersal tracking), the actual ecological resistance encountered by biological fluxes within these corridors remains a theoretical approximation rather than a validated physical reality.
As demonstrated in the figure, the central-western region, encompasses Shandong Province’s Taiyi Mountain area, characterized by elevated terrain and substantial topographic variations, yielding considerable resistance from DEM and slope factors, whereas other plain regions exhibit minimal topography-induced resistance. Regarding NDVI, low-resistance areas are concentrated in the Yellow River Delta and southwestern Shandong, whereas urbanized coastal zones around Qingdao and northern municipal areas show elevated resistance due to reduced vegetation coverage. The NTL factor reveals high-resistance “hotspots” in metropolitan clusters like Jinan and Qingdao, while rural and mountainous areas maintain minimal resistance. Finally, the land cover analysis identifies built-up areas as high-resistance patches, while forest-concentrated regions in the central and eastern hilly territories function as low-resistance ecological matrices.
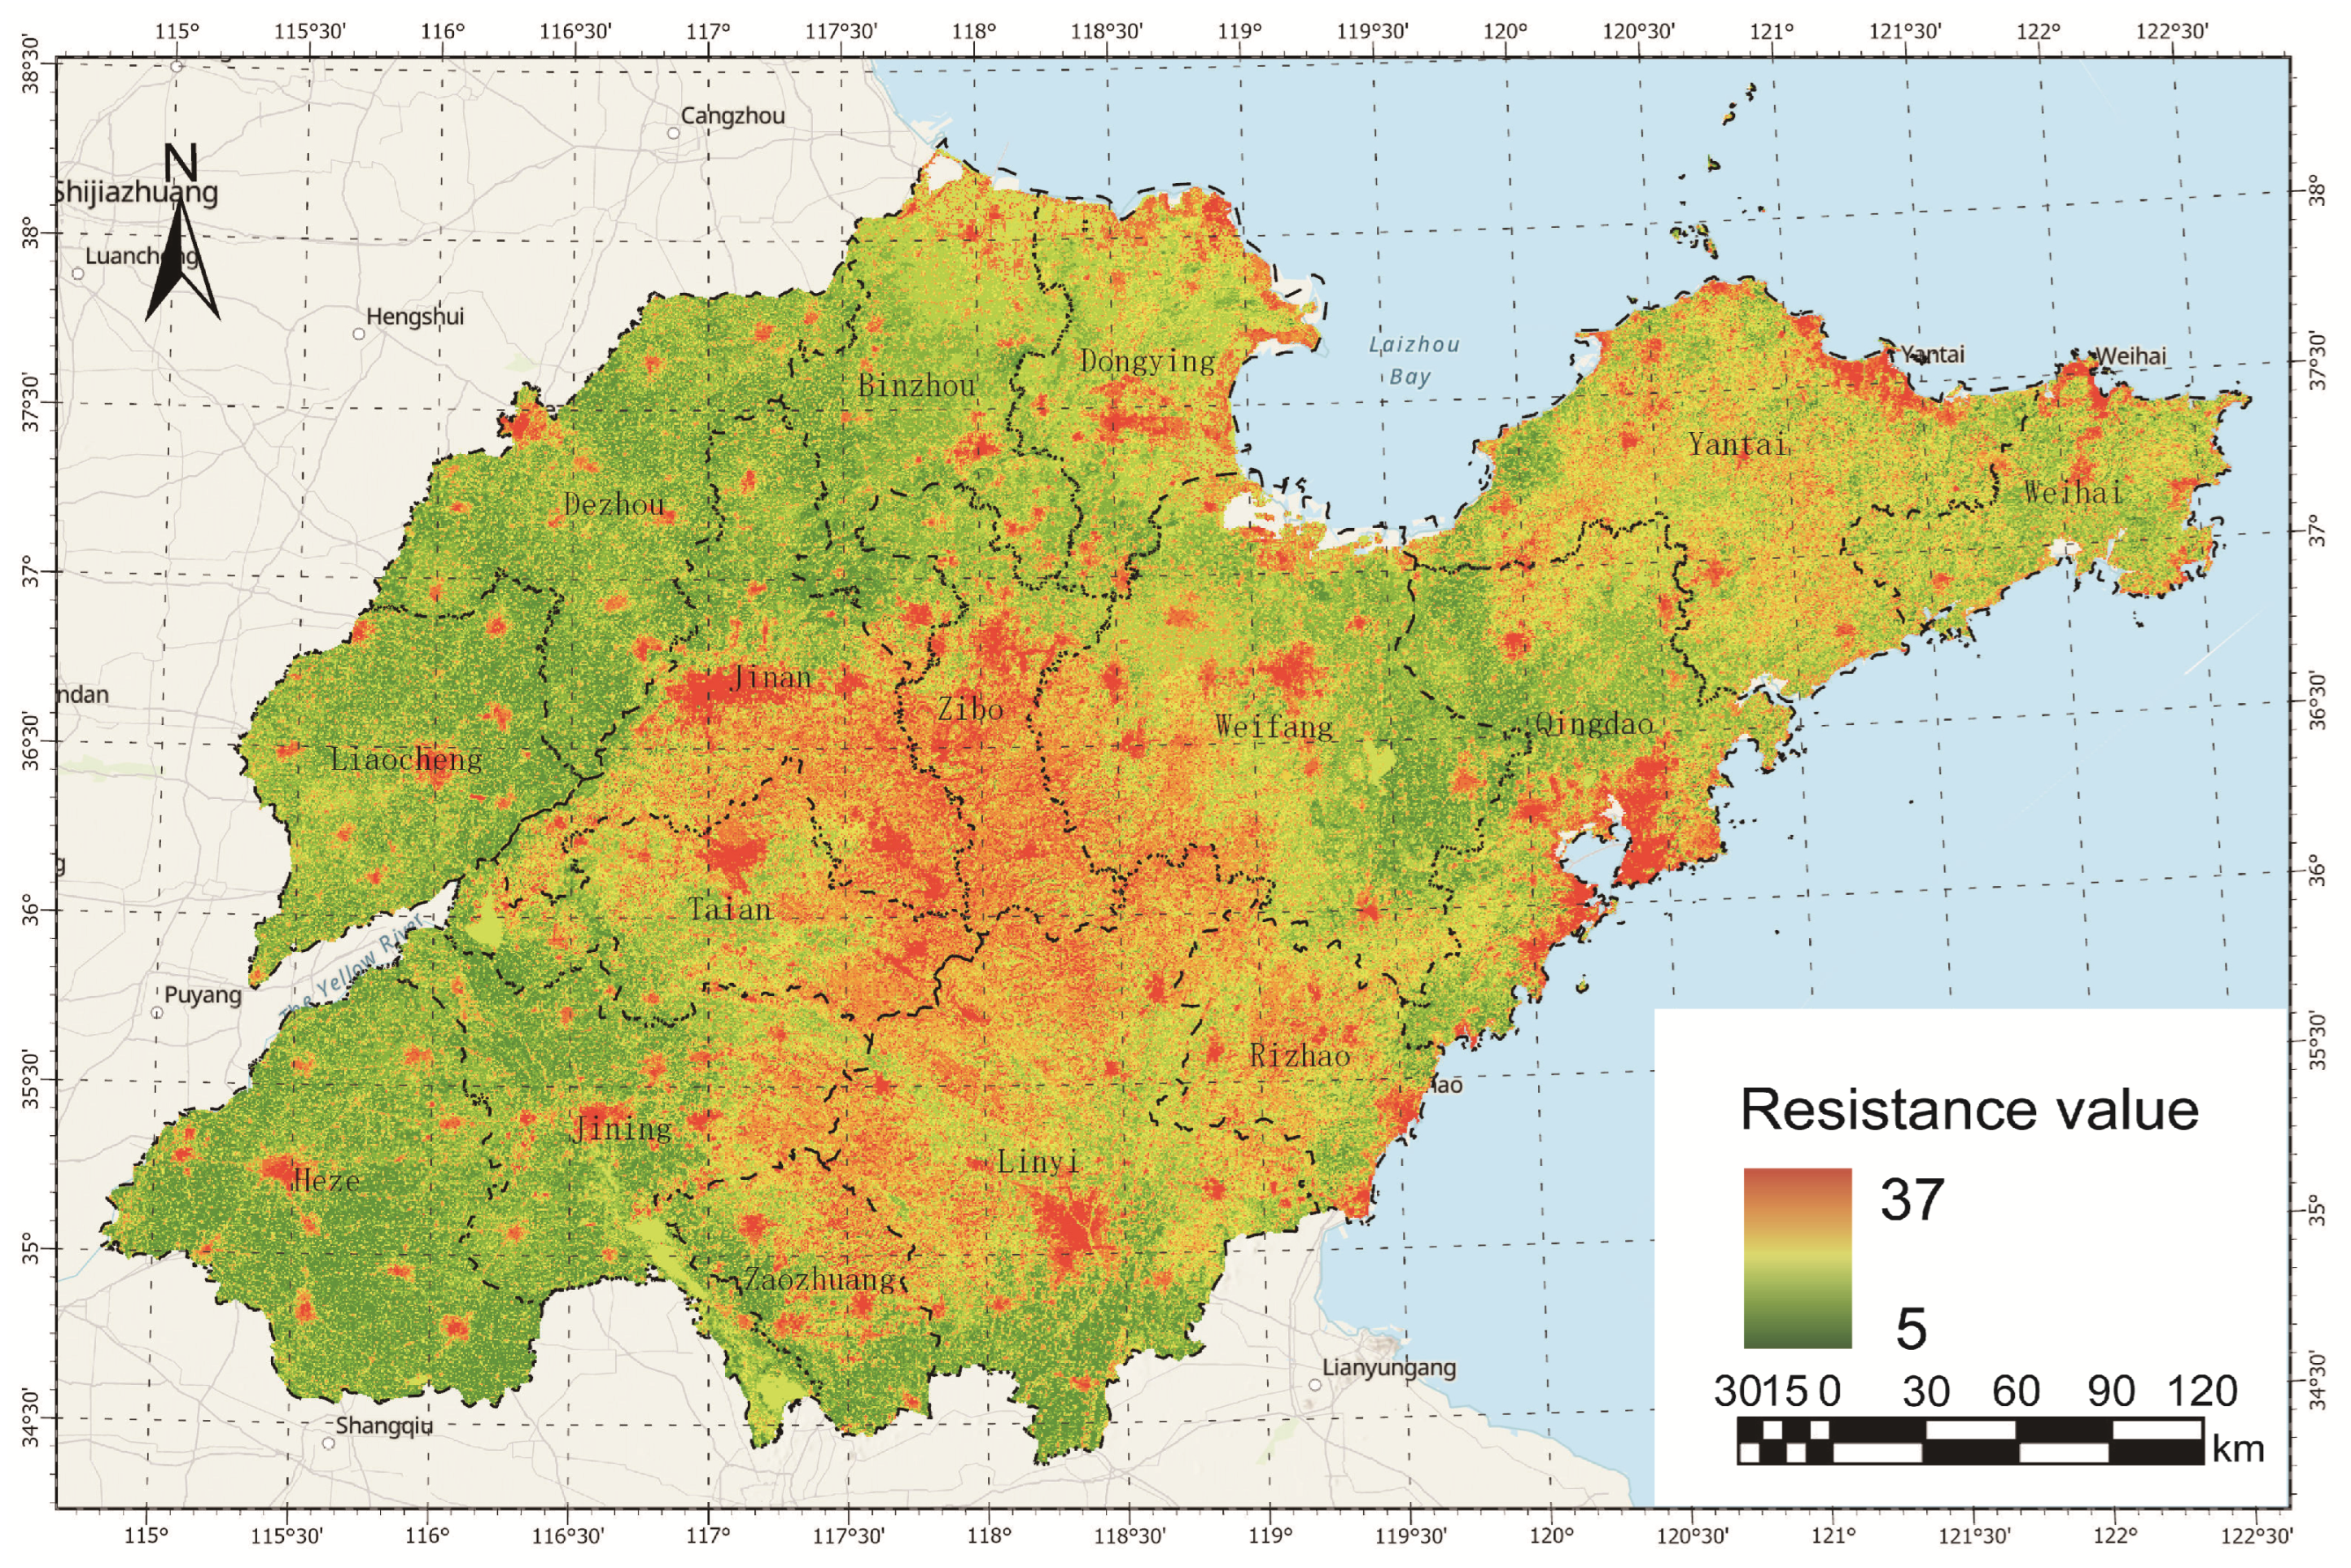
Through spatial superposition of individual resistance factors, the spatial distribution of comprehensive resistance values within the study area was derived, as illustrated in Figure 4. As demonstrated in the figure, comprehensive resistance values display considerable spatial heterogeneity, wherein high-resistance zones exhibit point-like distribution patterns, primarily concentrated within metropolitan areas including Jinan, Qingdao, Yantai, and central regions, predominantly coinciding with urban built-up areas and zones of intensive human disturbance. Low-resistance areas demonstrate areal distribution characteristics, chiefly concentrated within southwestern Shandong plains, northern coastal regions, and localized hilly forested territories, where vegetation coverage remains favorable, topography is relatively flat, human interference is limited, and comprehensive resistance values are correspondingly reduced.

3.1.2. Green Highway Network Extraction

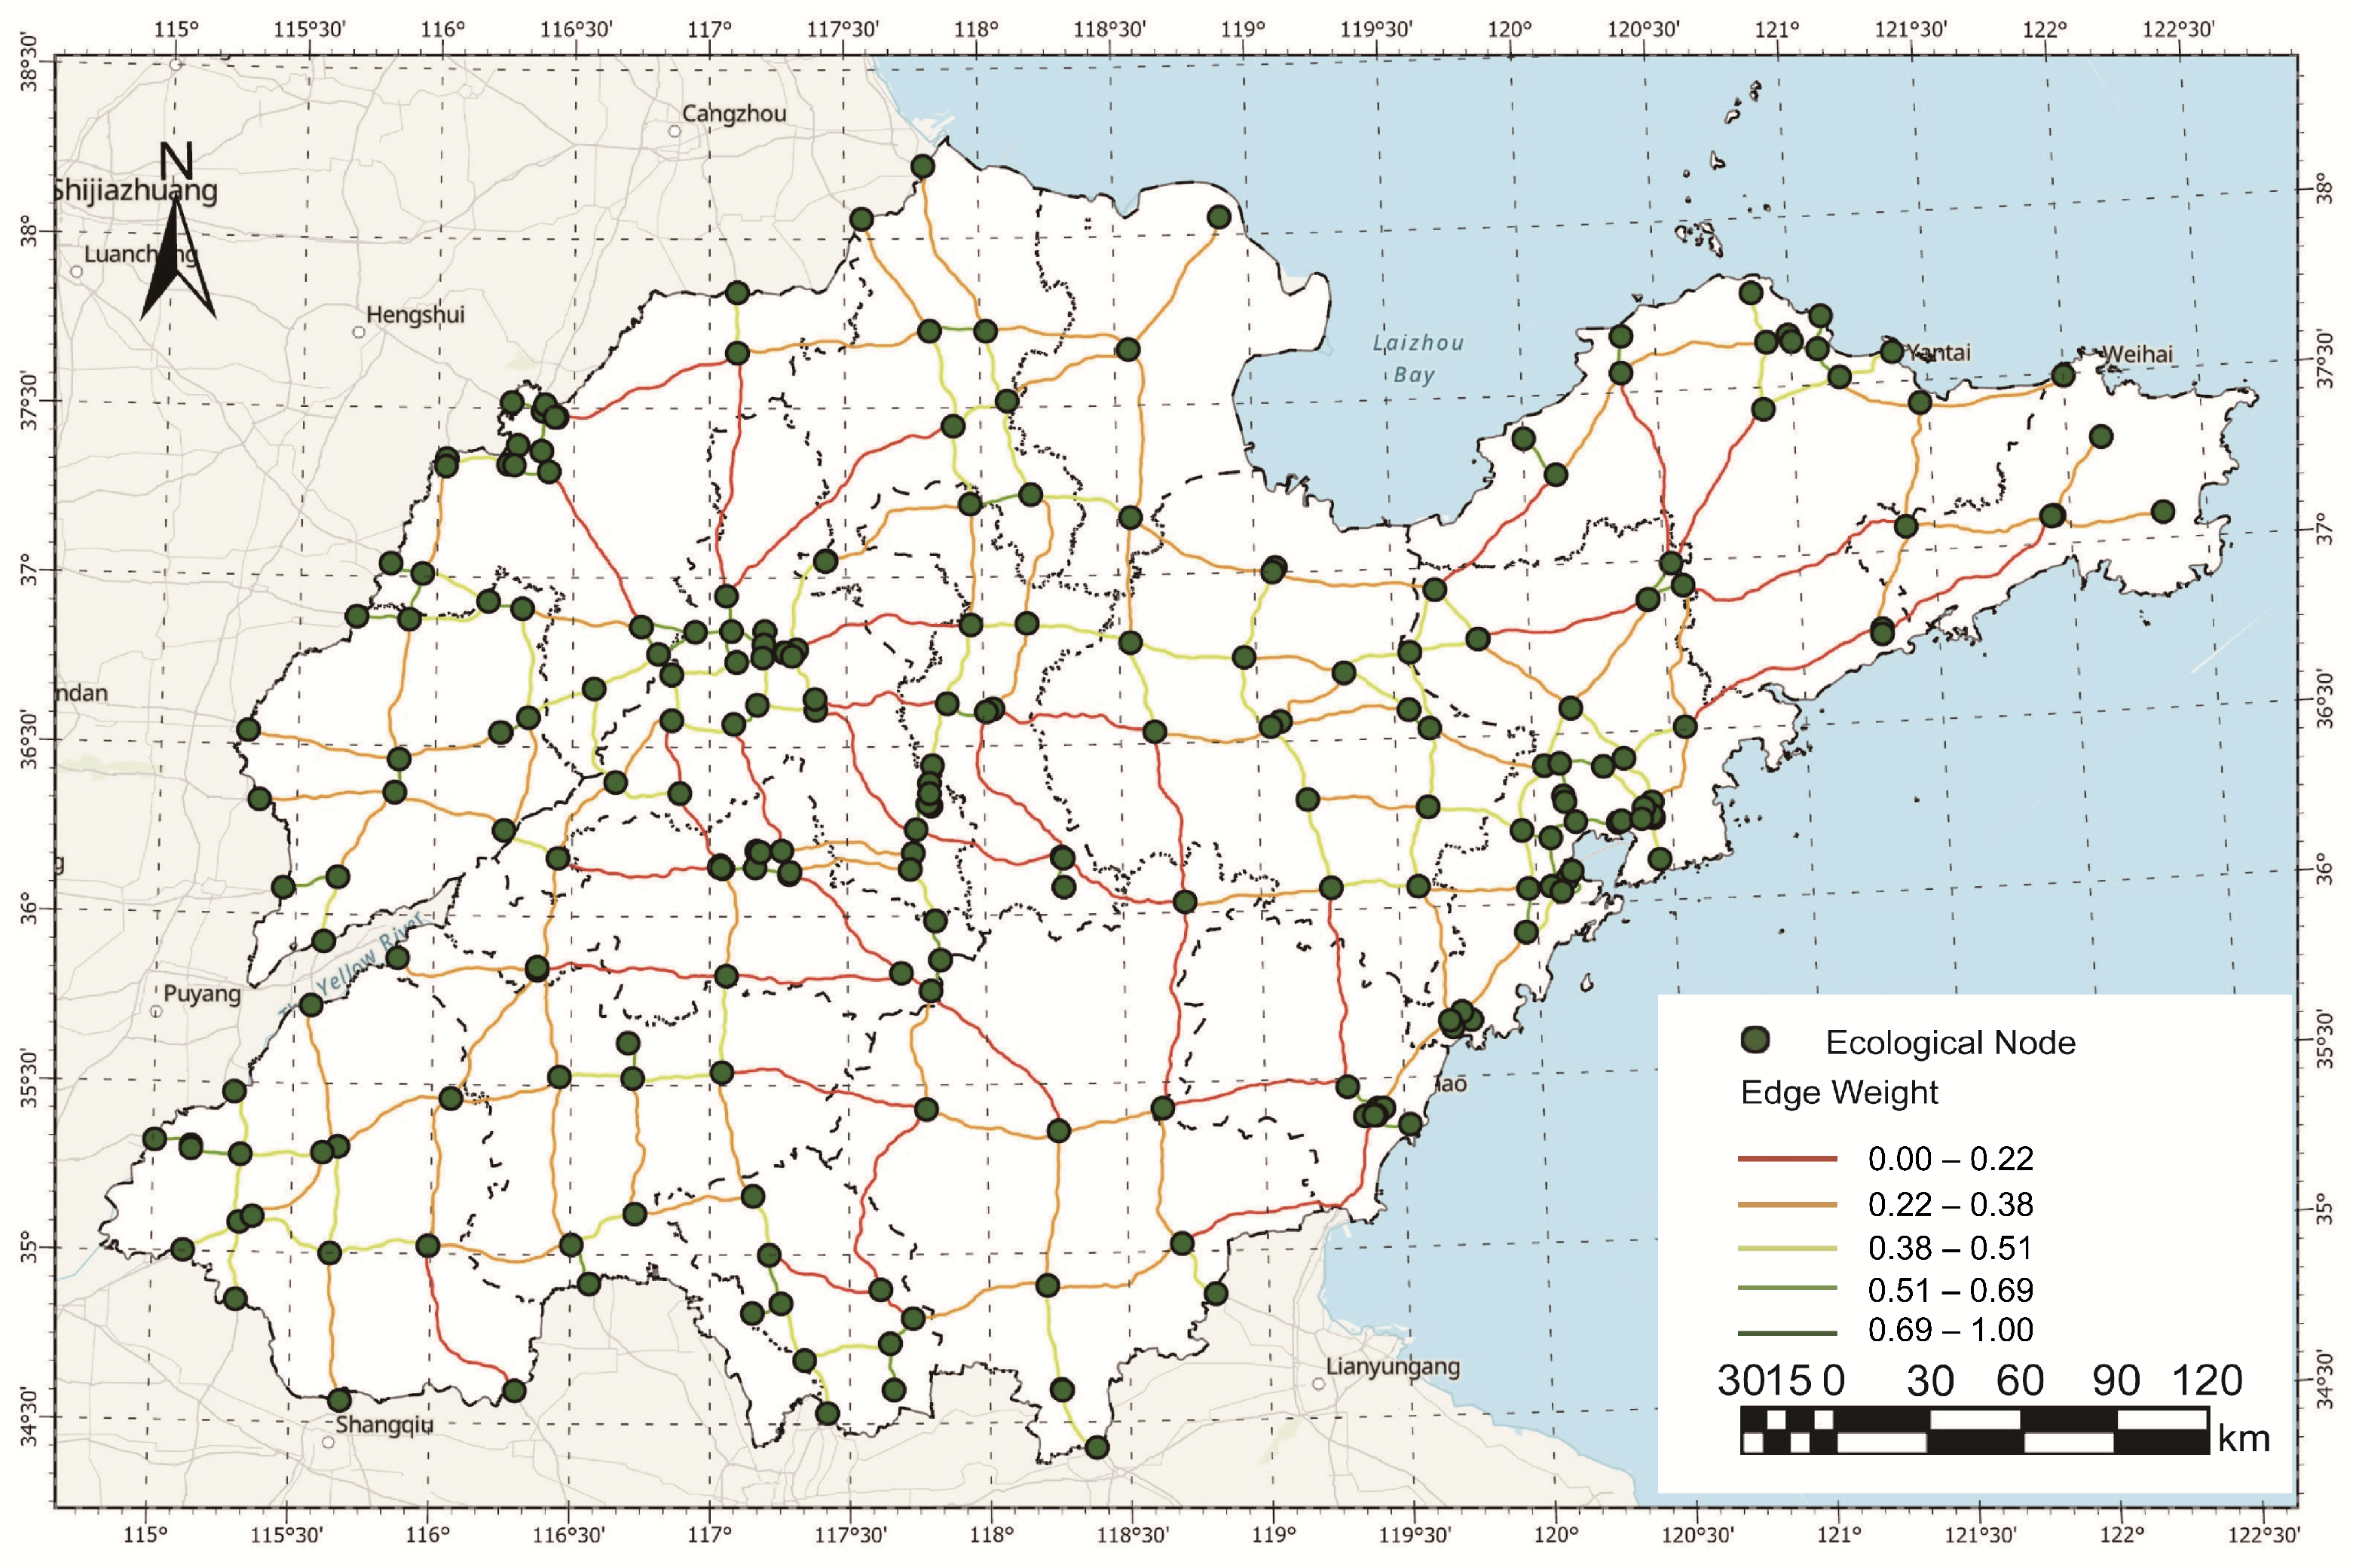
This study designates interchanges and toll stations with sufficient vegetation as ecological nodes, while road corridor units connecting these nodes are abstracted as network edges. Each edge represents a green corridor defined by a bilateral 250 m buffer, a scale selected to balance ecological realism with methodological constraints. As detailed in the methodology, this width encompasses the primary ‘Road Effect Zone’—where highway-induced microclimate changes and nitrogen deposition significantly influence vegetation productivity—while simultaneously aligning with the 250 m spatial resolution of the MODIS NDVI dataset. By analyzing at this original resolution, we avoid spatial artifacts from over-sampling and mitigate mixed-pixel errors, where road surface signatures might otherwise distort the NPP estimations of narrow green belts. This ensures the physical integrity of the remote sensing signals and provides a stable basis for provincial-scale topological modeling. The edge weights are defined as the Ecological Continuity Coefficient ( W u v ), derived from the reciprocal of the cumulative resistance values. The resulting green highway network is presented in Figure 5.
The construction results of the green highway network are illustrated in Figure 5. The network exhibits significant spatial heterogeneity in terms of edge weights. Specifically, higher-weighted edges ( W u v > 0.69 ) are predominantly distributed across southwestern Shandong, the northern coastal regions, and the south-central hilly forested areas. These regions are characterized by lower comprehensive resistance and higher ecological connectivity, forming ‘low-resistance corridors’ that facilitate ecological mobility. Conversely, lower-weighted edges ( W u v < 0.22 ) are primarily concentrated in metropolitan clusters such as Jinan and Qingdao, as well as adjacent highway intersection zones with higher human disturbance. Overall, the network reflects the spatial differentiation of ecological suitability within the highway corridors, where the south-central and southwestern regions provide a more continuous framework for ecological connectivity compared to the more fragmented coastal and central metropolitan regions.

3.2. Topological Structural Characteristics of Green Highway Network

Employing the methodology outlined in Section 2.5, topological structural indicators of Shandong Province’s green highway network were computed and the corresponding topological structural characteristics were analyzed.

3.2.1. Weighted Degree

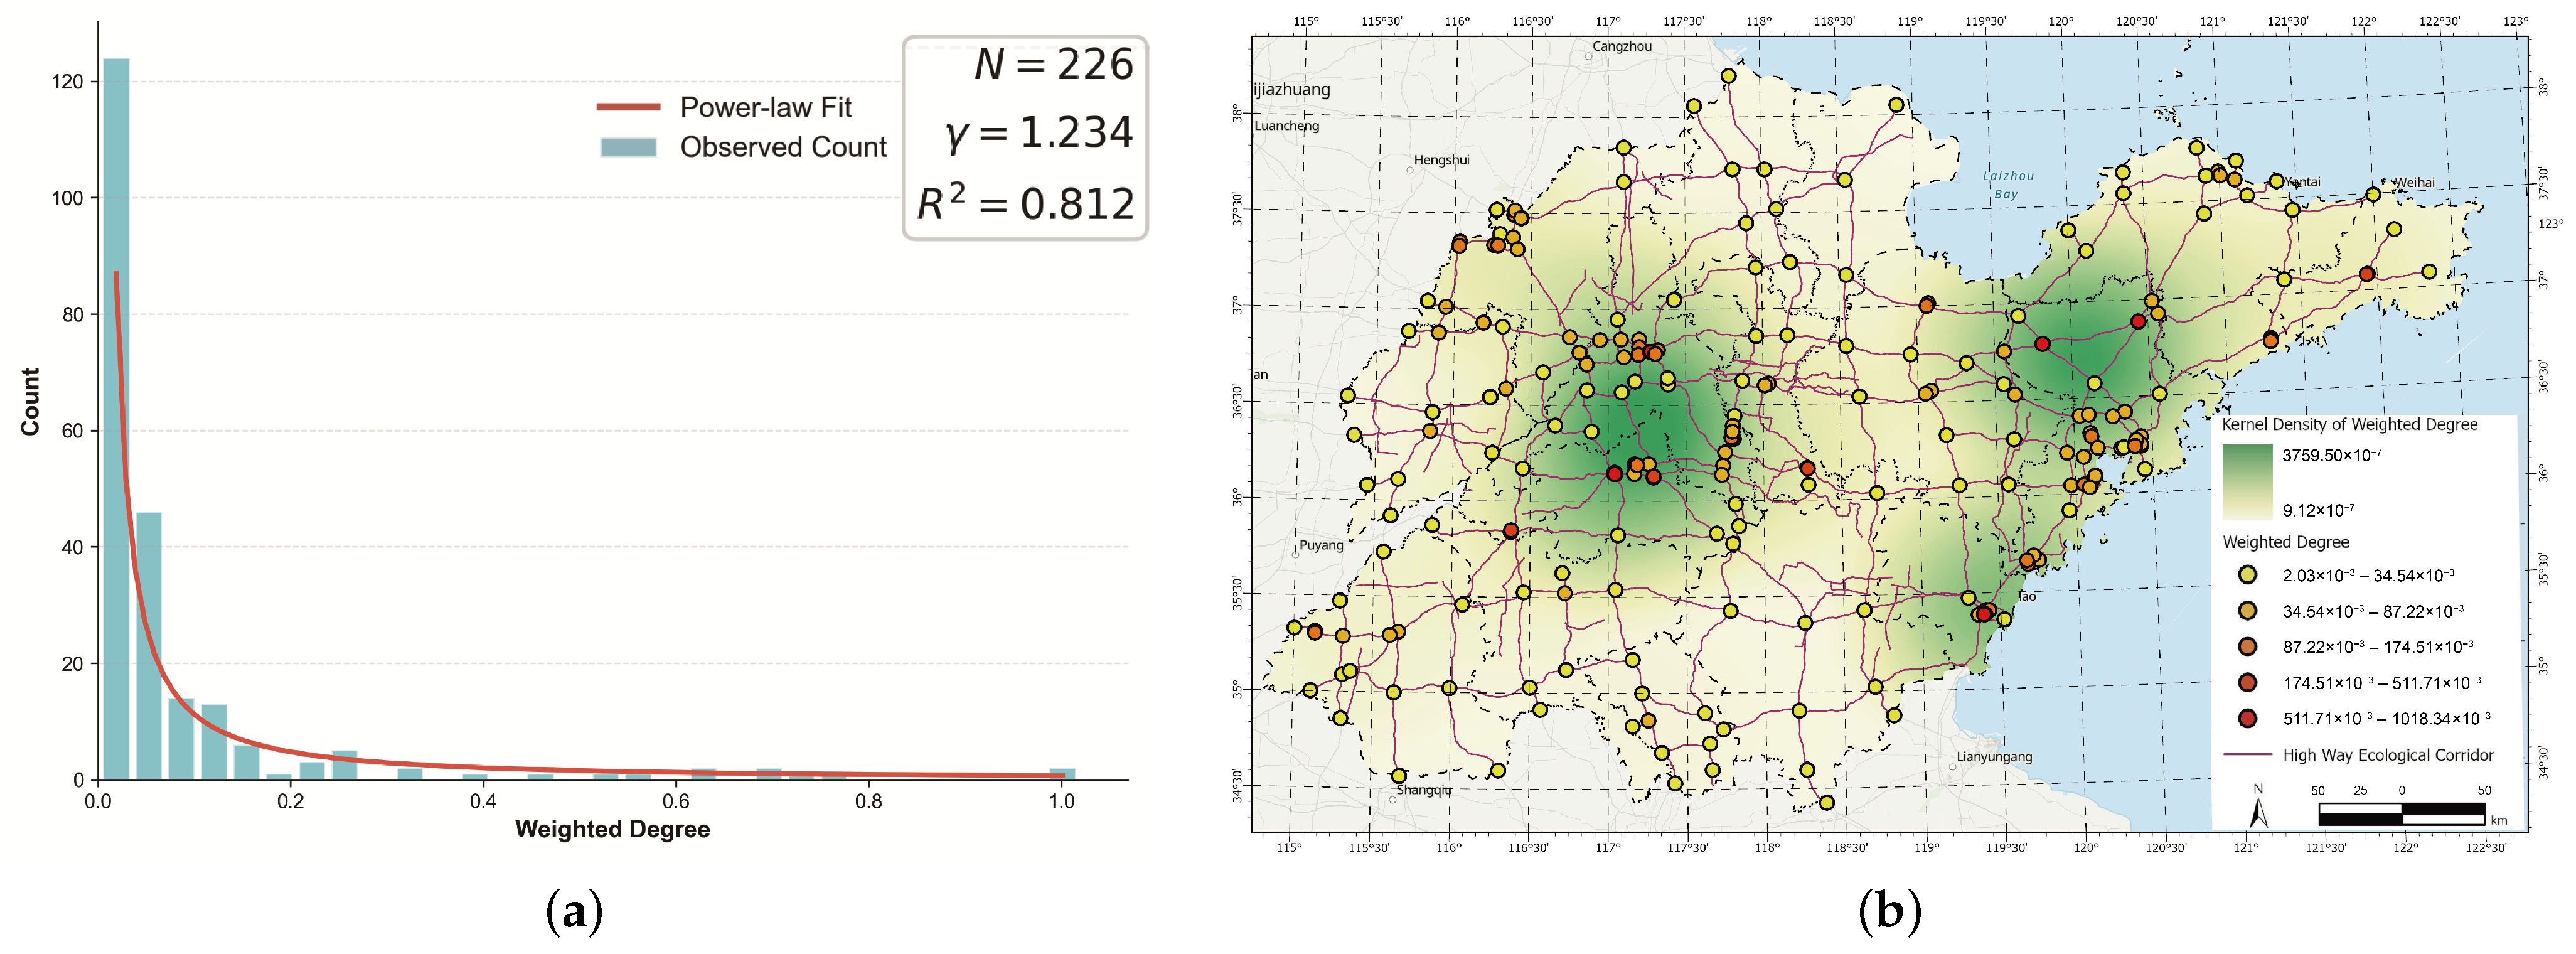
The statistical distribution of node-weighted degree in the green highway network exhibits a pronounced heavy-tailed pattern, significantly diverging from a normal distribution. As illustrated by the empirical power-law trend (Figure 6a), the majority of nodes possess relatively low weighted degrees, while only a small number of “hub” nodes exhibit extraordinarily high values. Although an initial power-law fit yields an exponent of γ = 1.234 ( R 2 = 0.812 ), this metric is primarily employed as an exploratory tool to intuitively demonstrate the network’s high heterogeneity, rather than strictly claiming a mathematical scale-free topology. This heavy-tailed property accurately reflects the “hub-and-spoke” characteristic of the highway nodes, indicating that the ecological flux potential is highly concentrated in a limited number of core junctions.
The spatial distribution of weighted degrees reveals significant regional heterogeneity across Shandong Province (Figure 6b). High-weighted degree nodes and high-density clusters are primarily concentrated in the central hilly regions and the southeastern ecological corridors. These areas function as the “ecological engines” of the network, providing robust support for regional ecological energy flow. Low-weighted degree nodes are predominantly distributed in the western plains and northern coastal terminals. Due to higher ecological resistance or linear isolation, these nodes exhibit diminished connectivity, representing potential bottlenecks for province-wide ecological integration.

3.2.2. Weighted Closeness Centrality

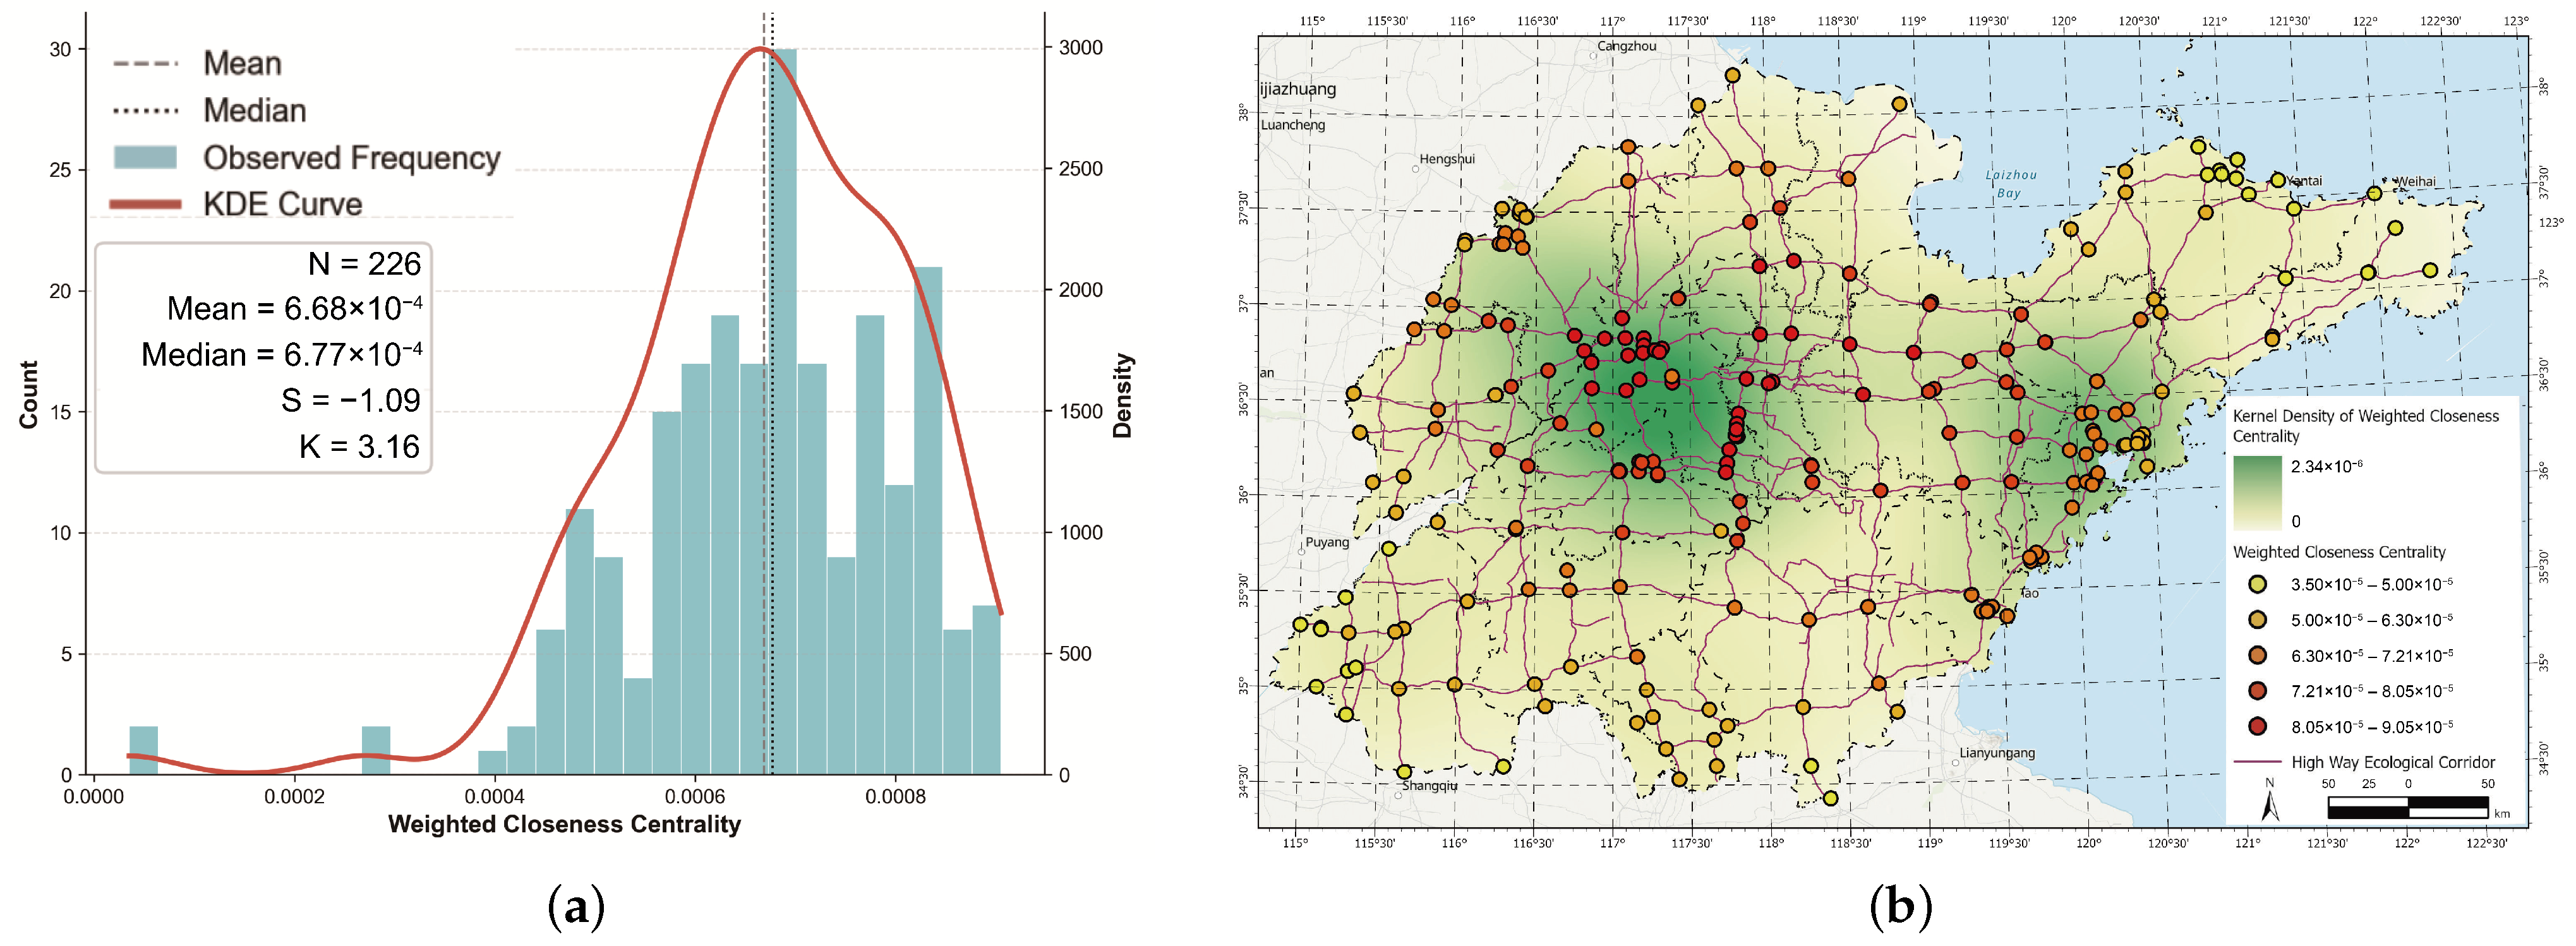
The statistical analysis of weighted closeness centrality (Figure 7a) characterizes the structural integration and relative accessibility of the green highway network. The values exhibit a moderate normal distribution with a slight left-skewed characteristic ( S = 1.09 , K = 3.16 ). The mean value ( 6.68 × 10 4 ) is closely aligned with the median ( 6.77 × 10 4 ), indicating that the accessibility of the majority of ecological nodes is maintained at a balanced and high level. The concentration of nodes in the high-value range (>0.0006) suggests a homogeneous structural efficiency across the majority of the network, meaning that most junctions are positioned at similar topological distances from the rest of the system.
While the absolute values appear small due to the reciprocal of cumulative geographic and ecological resistance, the internal baseline analysis reveals a distinct spatial differentiation. The spatial mapping (Figure 7b) further elucidates the geographical manifestation of this accessibility, highlighting a clear “center-periphery” structure. Nodes with higher weighted closeness centrality are predominantly clustered in the central hilly regions and the southeastern arterial corridors. These areas serve as the structural backbone of the network, enabling rapid ecological flux across the province. Lower values are observed at the network terminals, particularly in the northern coastal municipal areas and the western provincial borders. These nodes exhibit relative “ecological isolation,” as their longer weighted distances to other network hubs limit their participation in large-scale ecological processes.

3.2.3. Weighted Clustering Coefficient

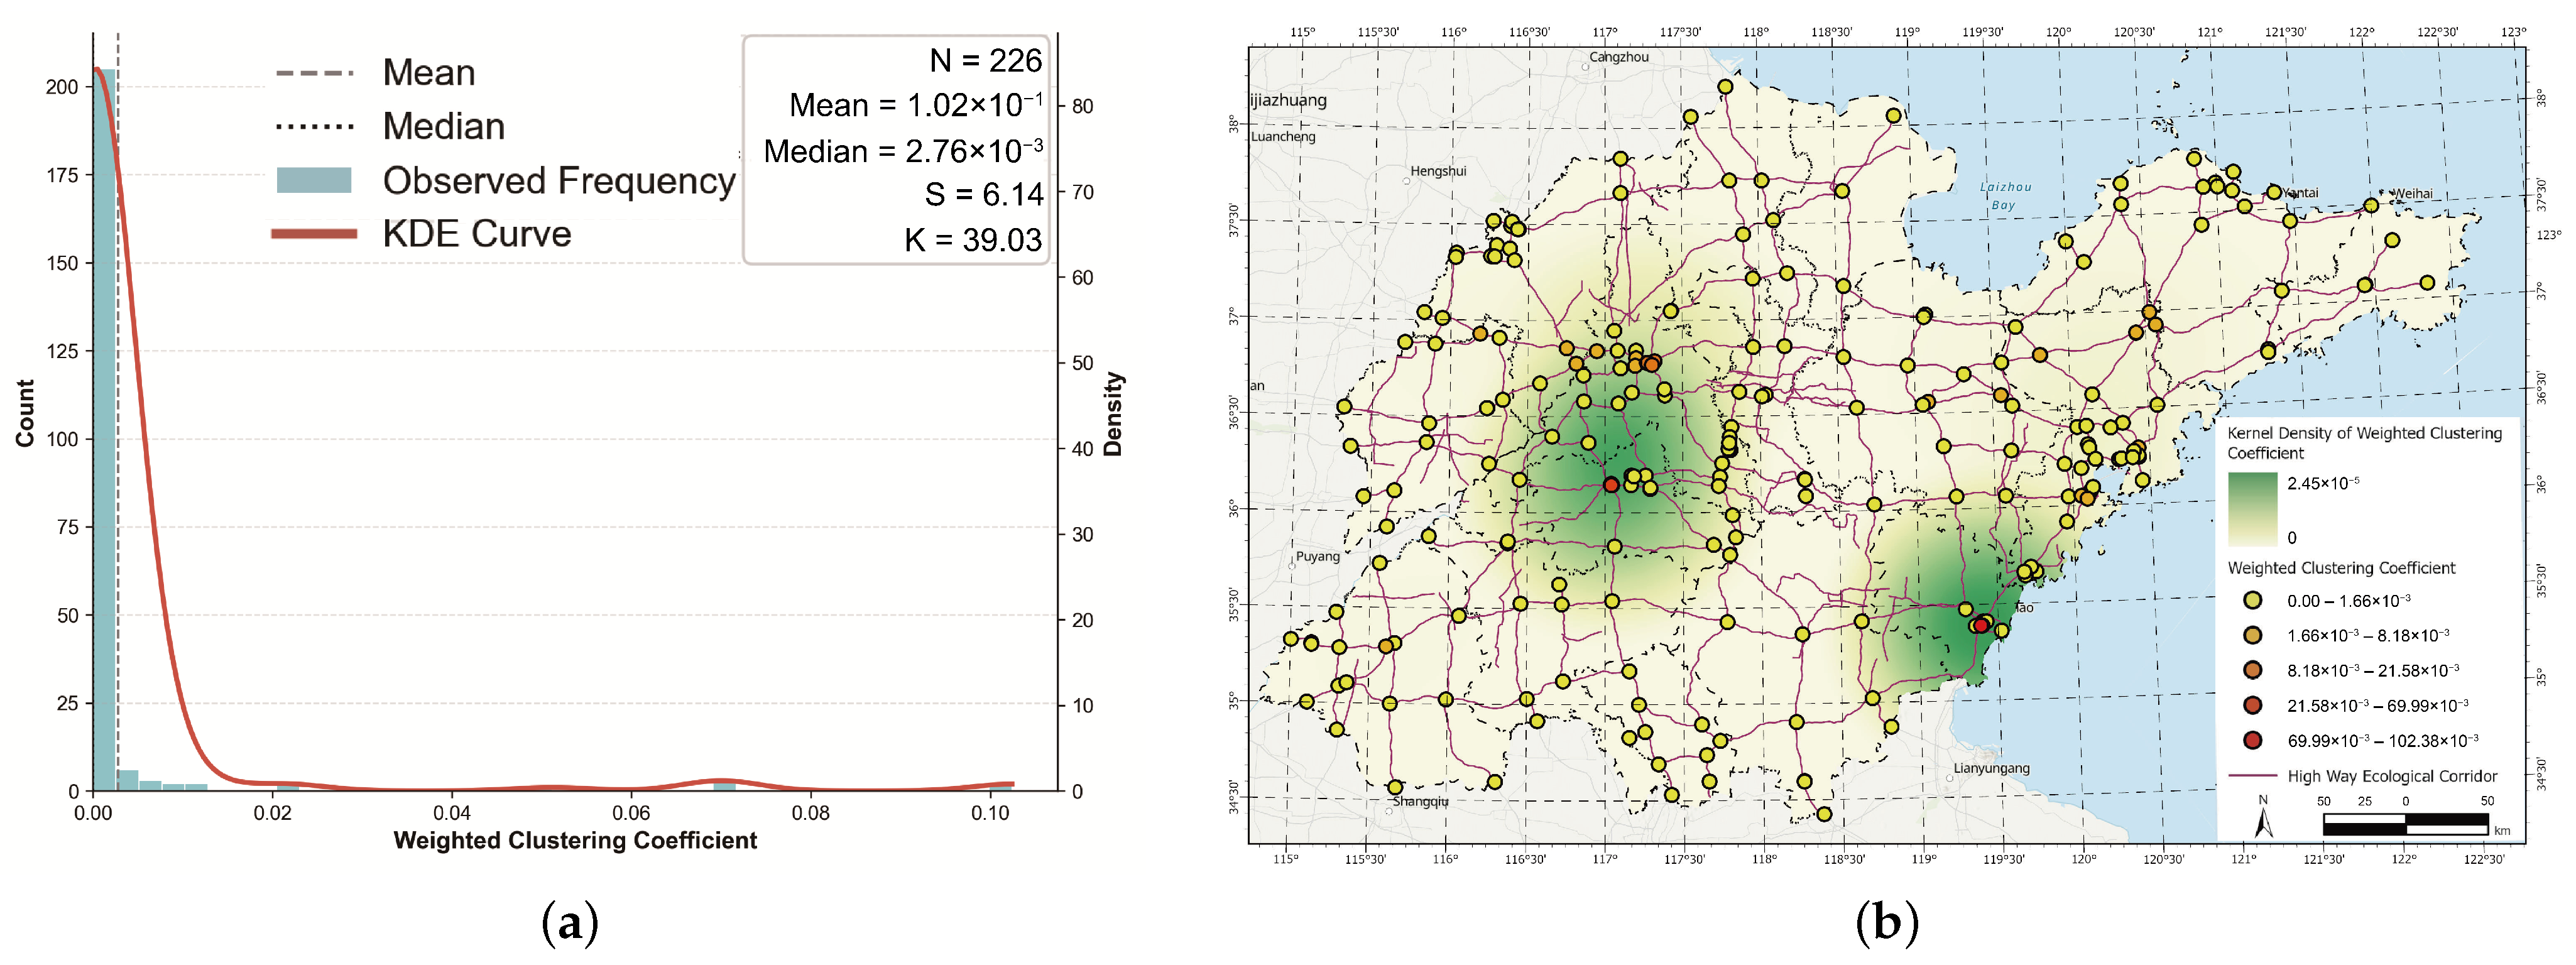
The statistical analysis (Figure 8a) reveals that the node clustering coefficients within the green highway network are generally diminished. The distribution exhibits a pronounced right-skewed pattern ( S = 6.14 , k = 39.03 ), with the vast majority of nodes concentrated in the extremely low-value range (<0.01). The mean value is 2.76 × 10 3 , which is significantly lower than that of typical biological ecological networks. This statistical trend indicates an absence of closed triangular structures and redundant ecological pathways within the network. The connectivity is predominantly characterized by shortest linear paths, reflecting a ‘high-efficiency but low-redundancy’ topological configuration.
The spatial distribution map (Figure 8b) illustrates the localized nature of high-clustering configurations within the province. Nodes with relatively higher clustering coefficients are predominantly concentrated within central Shandong regions and certain urban convergence zones, such as the peripheral areas of Jinan, Linyi, and Weifang. These clusters often coincide with complex highway interweaving areas where multiple corridors intersect. In contrast, low-clustering nodes are extensively distributed across the network peripheries. This layout facilitates rapid ecological flux through the main framework but suggests a potential structural vulnerability. Due to the lack of alternative triangular loops, the network’s local resilience might be limited in the event of connectivity failure. While the current study focuses on the static topological evaluation, future research incorporating dynamic failure simulations (e.g., random or targeted attacks) would further quantify the robustness of this ecological network.

3.2.4. Weighted Betweenness Centrality

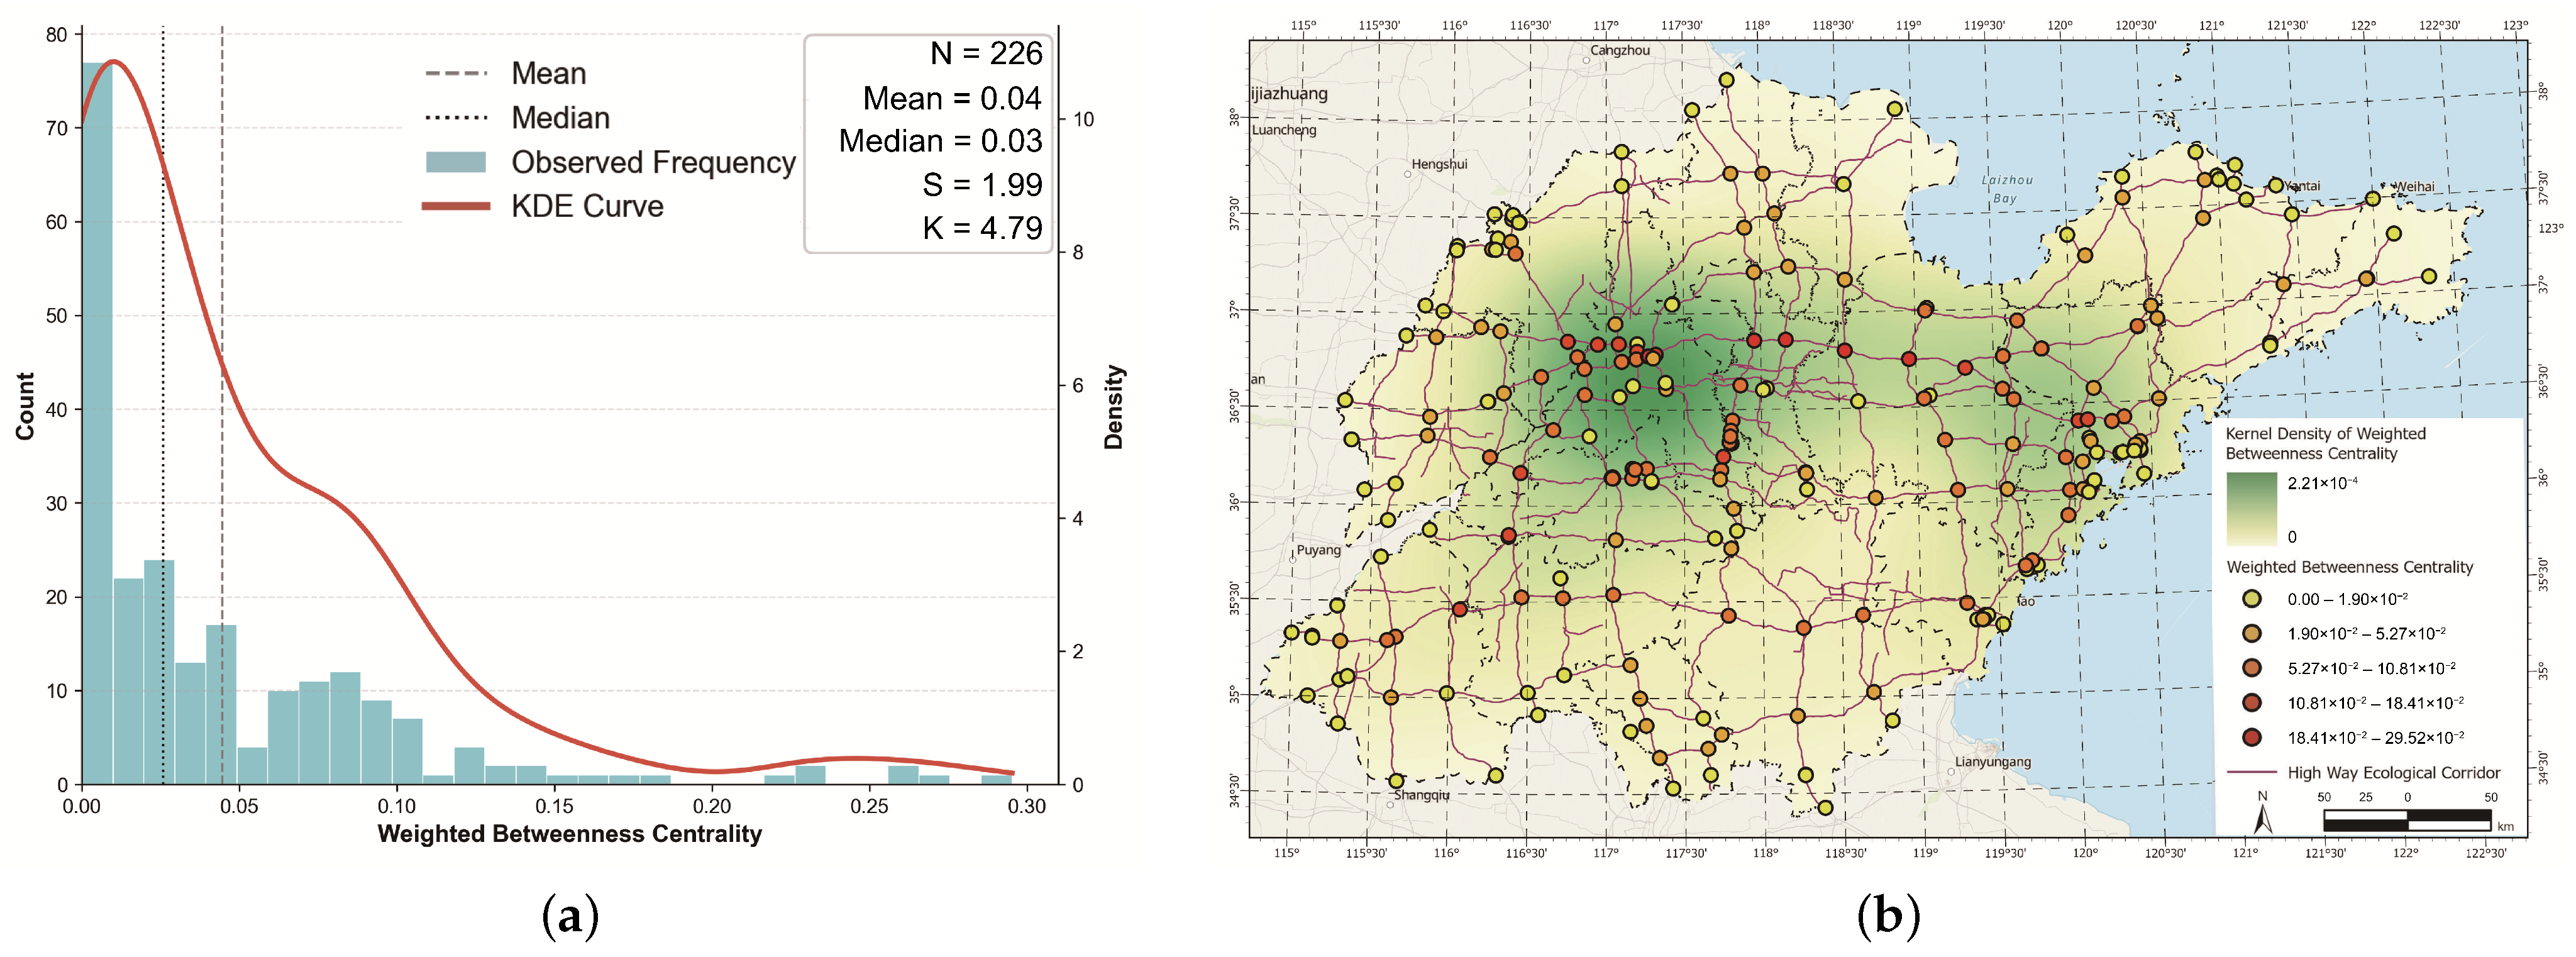
The statistical distribution of weighted betweenness centrality (Figure 9a) reveals a significant structural imbalance within the green highway network. The results demonstrate a strong right-skewed pattern with a skewness (S) of 1.99 and a kurtosis (K) of 4.79. Over 80% of the nodes exhibit extremely low values (below 0.02), indicating that the “gatekeeping” role is concentrated in a very limited number of junctions. The mean value (0.04) is considerably higher than the median (0.03), confirming that a small group of high-value nodes dominates the control over ecological energy exchange and shortest-path connectivity across the province.
The spatial mapping (Figure 9b) identifies these critical nodes as “ecological bottlenecks” that bridge distinct regions. High-centrality nodes are primarily clustered at the intersection of the central hilly areas and the southeastern ecological regions, particularly surrounding the cities of Rizhao, Linyi, and southern Weifang. These junctions act as essential “stepping stones” that facilitate ecological flux between the western plains and eastern coastal areas. The kernel density analysis highlights that these core hubs are concentrated in the south-central territory. Any degradation of roadside vegetation or loss of connectivity at these high-betweenness nodes could significantly impair the overall efficiency of the provincial green highway network and lead to the fragmentation of sub-networks.

3.2.5. Weighted Eigenvector Centrality

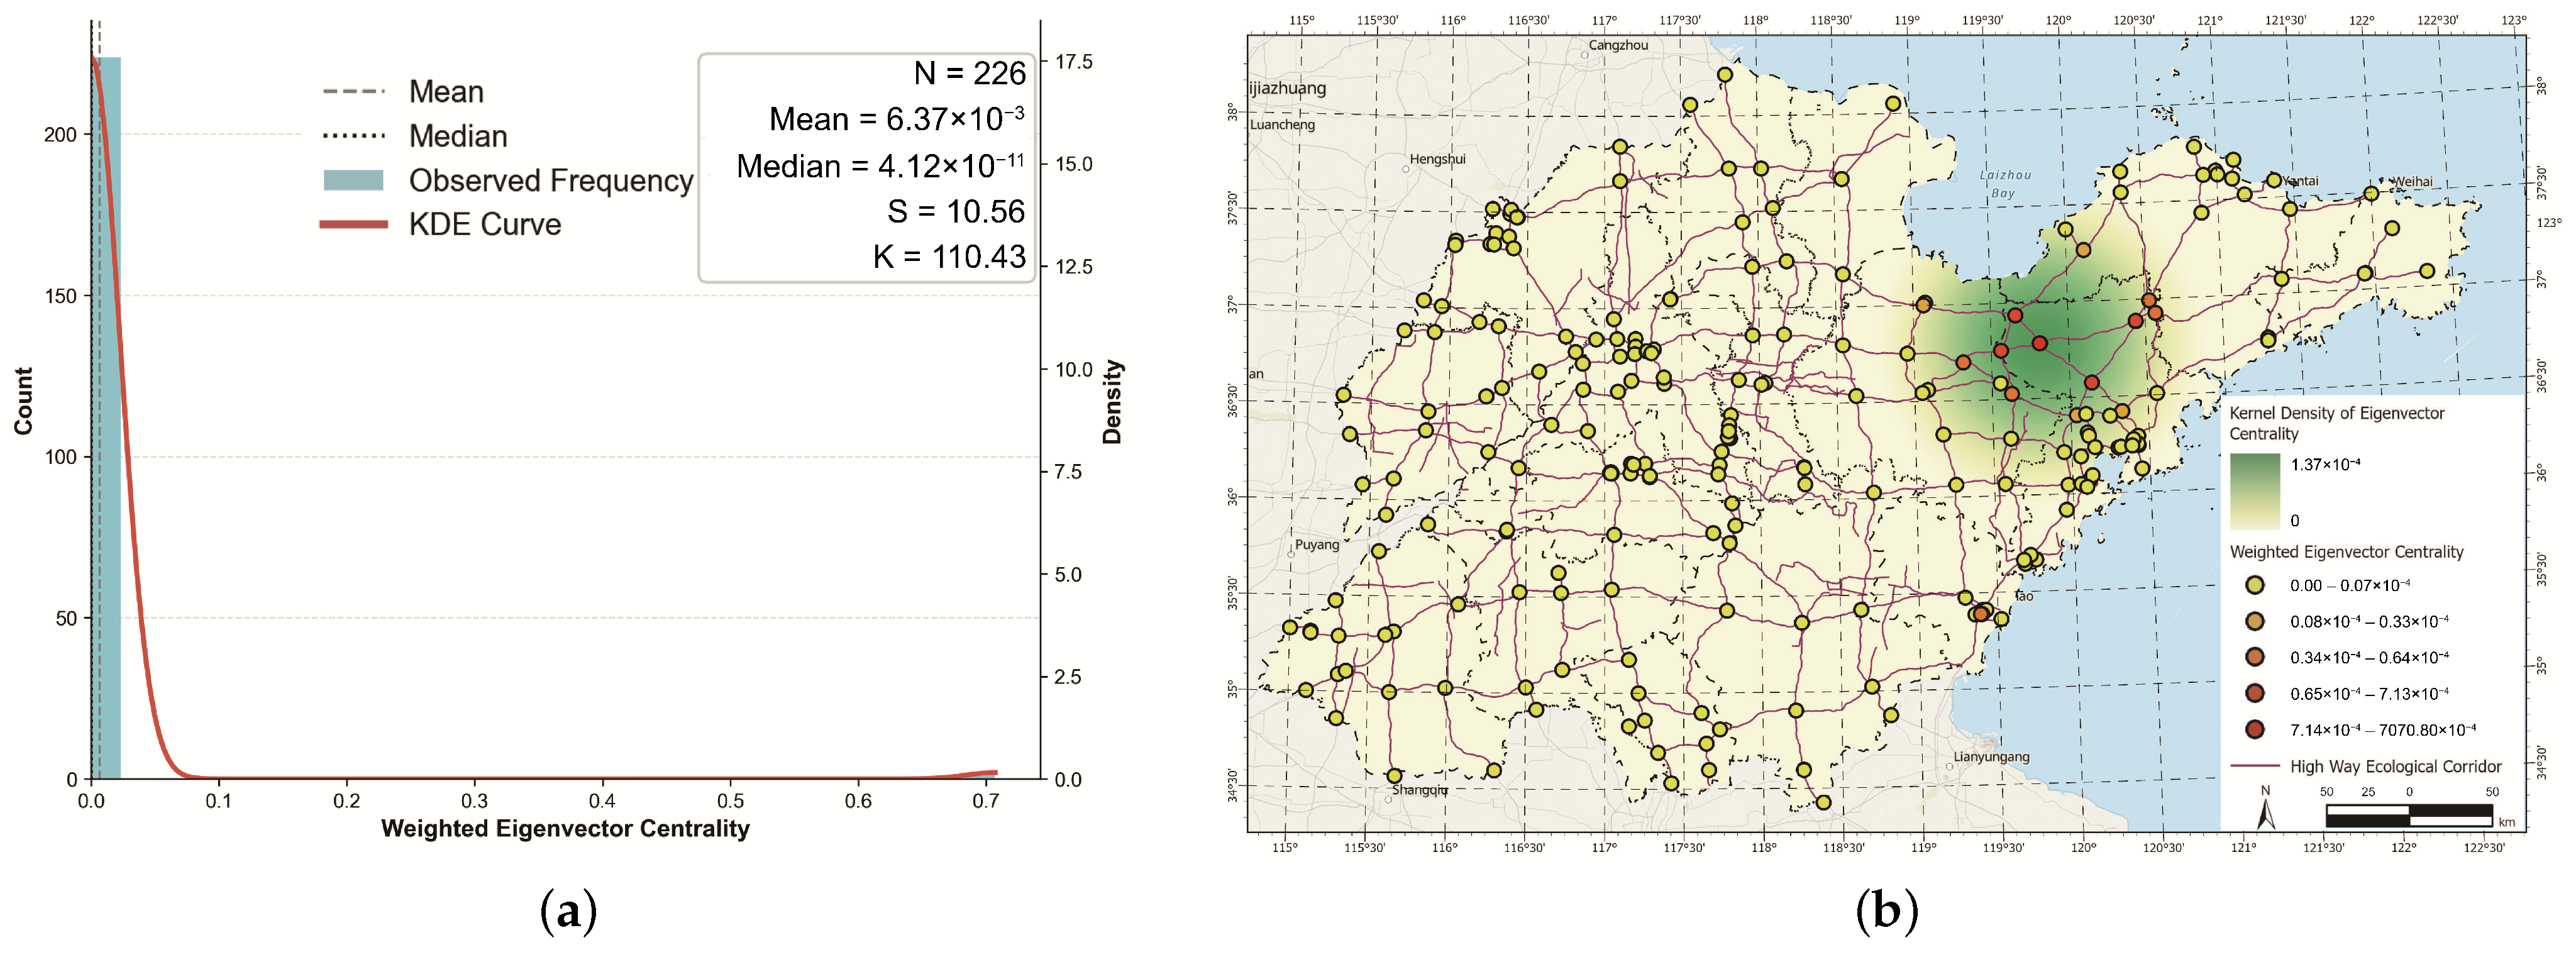
The statistical analysis of weighted eigenvector centrality (Figure 10a) reveals an extreme level of concentration regarding node influence within the network. The distribution exhibits an extraordinarily strong right-skewed pattern, with a skewness (S) of 10.56 and a kurtosis (K) of 110.43. The vast majority of nodes possess centrality values near zero (median = 4.12 × 10 11 ), indicating that they have minimal influence on the overall network prestige. The substantial disparity between the mean ( 6.37 × 10 3 ) and the median reflects a highly concentrated distribution pattern in the ecological network, where only a tiny fraction of nodes are connected to other highly influential hubs, thereby dominating the structural influence of the system.
The spatial mapping (Figure 10b) clarifies that this structural influence is geographically localized in the eastern part of the province. High-centrality nodes (red dots) and the primary kernel density “cloud” are exclusively concentrated in the eastern coastal region, particularly surrounding the Qingdao–Weifang–Yantai urban–ecological belt. This suggests that nodes in this region are not only well-connected but are also connected to other high-quality ecological hubs, forming a prestigious “core” of the provincial green highway network. In contrast, nodes in the western plains and northern border areas exhibit negligible eigenvector centrality. Despite being part of the highway network, their lack of proximity to influential ecological “leaders” results in their peripheral status regarding large-scale ecological information and energy exchange.

3.2.6. Weighted PageRank

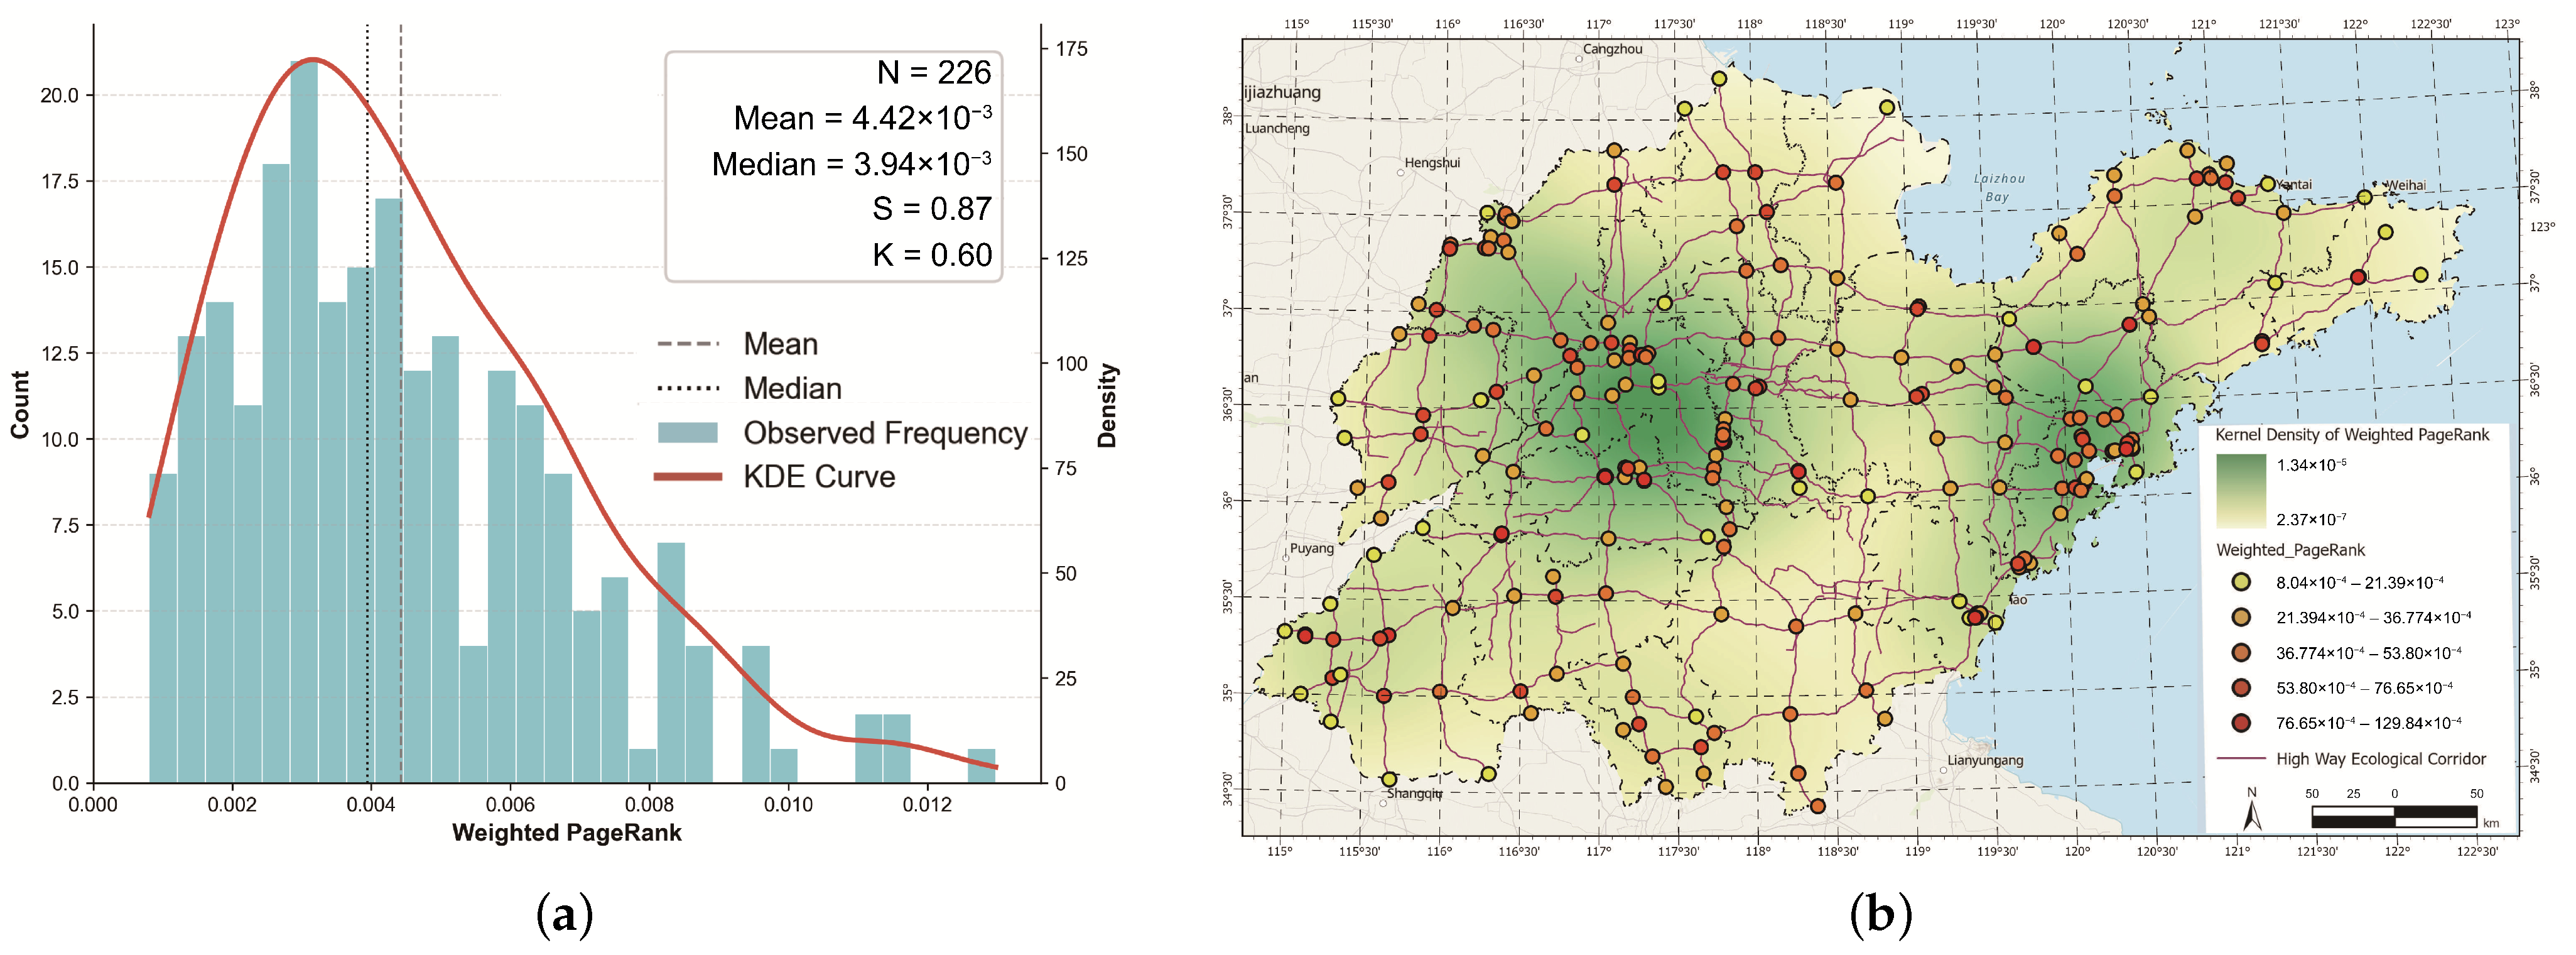
The statistical analysis of weighted PageRank (Figure 11a) reveals a more balanced distribution of node importance compared to other centrality metrics, such as eigenvector centrality. The distribution exhibits a moderate right-skewed pattern with a skewness (S) of 0.87 and a kurtosis (K) of 0.60. Unlike the extreme concentration seen in eigenvector centrality, most nodes fall within the range of 2.0 × 10 3 to 6.0 × 10 3 , suggesting that PageRank provides a more robust and balanced evaluation of ecological prestige across the network. The close alignment between the mean ( 4.42 × 10 3 ) and median ( 3.94 × 10 3 ) indicates that the network’s overall importance is supported by a broad base of relatively influential nodes rather than being dependent on a single outlier cluster.
The spatial mapping (Figure 11b) highlights a “multi-core” geographic pattern of high-prestige nodes. High-value nodes and dense kernel density “clouds” are primarily located in the central hilly regions (surrounding Jinan and Tai’an) and the eastern coastal–industrial belt (Qingdao and Weifang). These nodes are strategically important as they are not only well-connected but are also connected to other highly significant ecological junctions, forming a stable provincial ecological backbone. Compared to eigenvector centrality, PageRank identifies more influential nodes in the southwestern and inland northern areas. This implies that nodes in these secondary regions still play a vital role in maintaining the flow of ecological information and energy by linking local clusters to the global network core.

3.2.7. Correlation Analysis of Topological Metrics

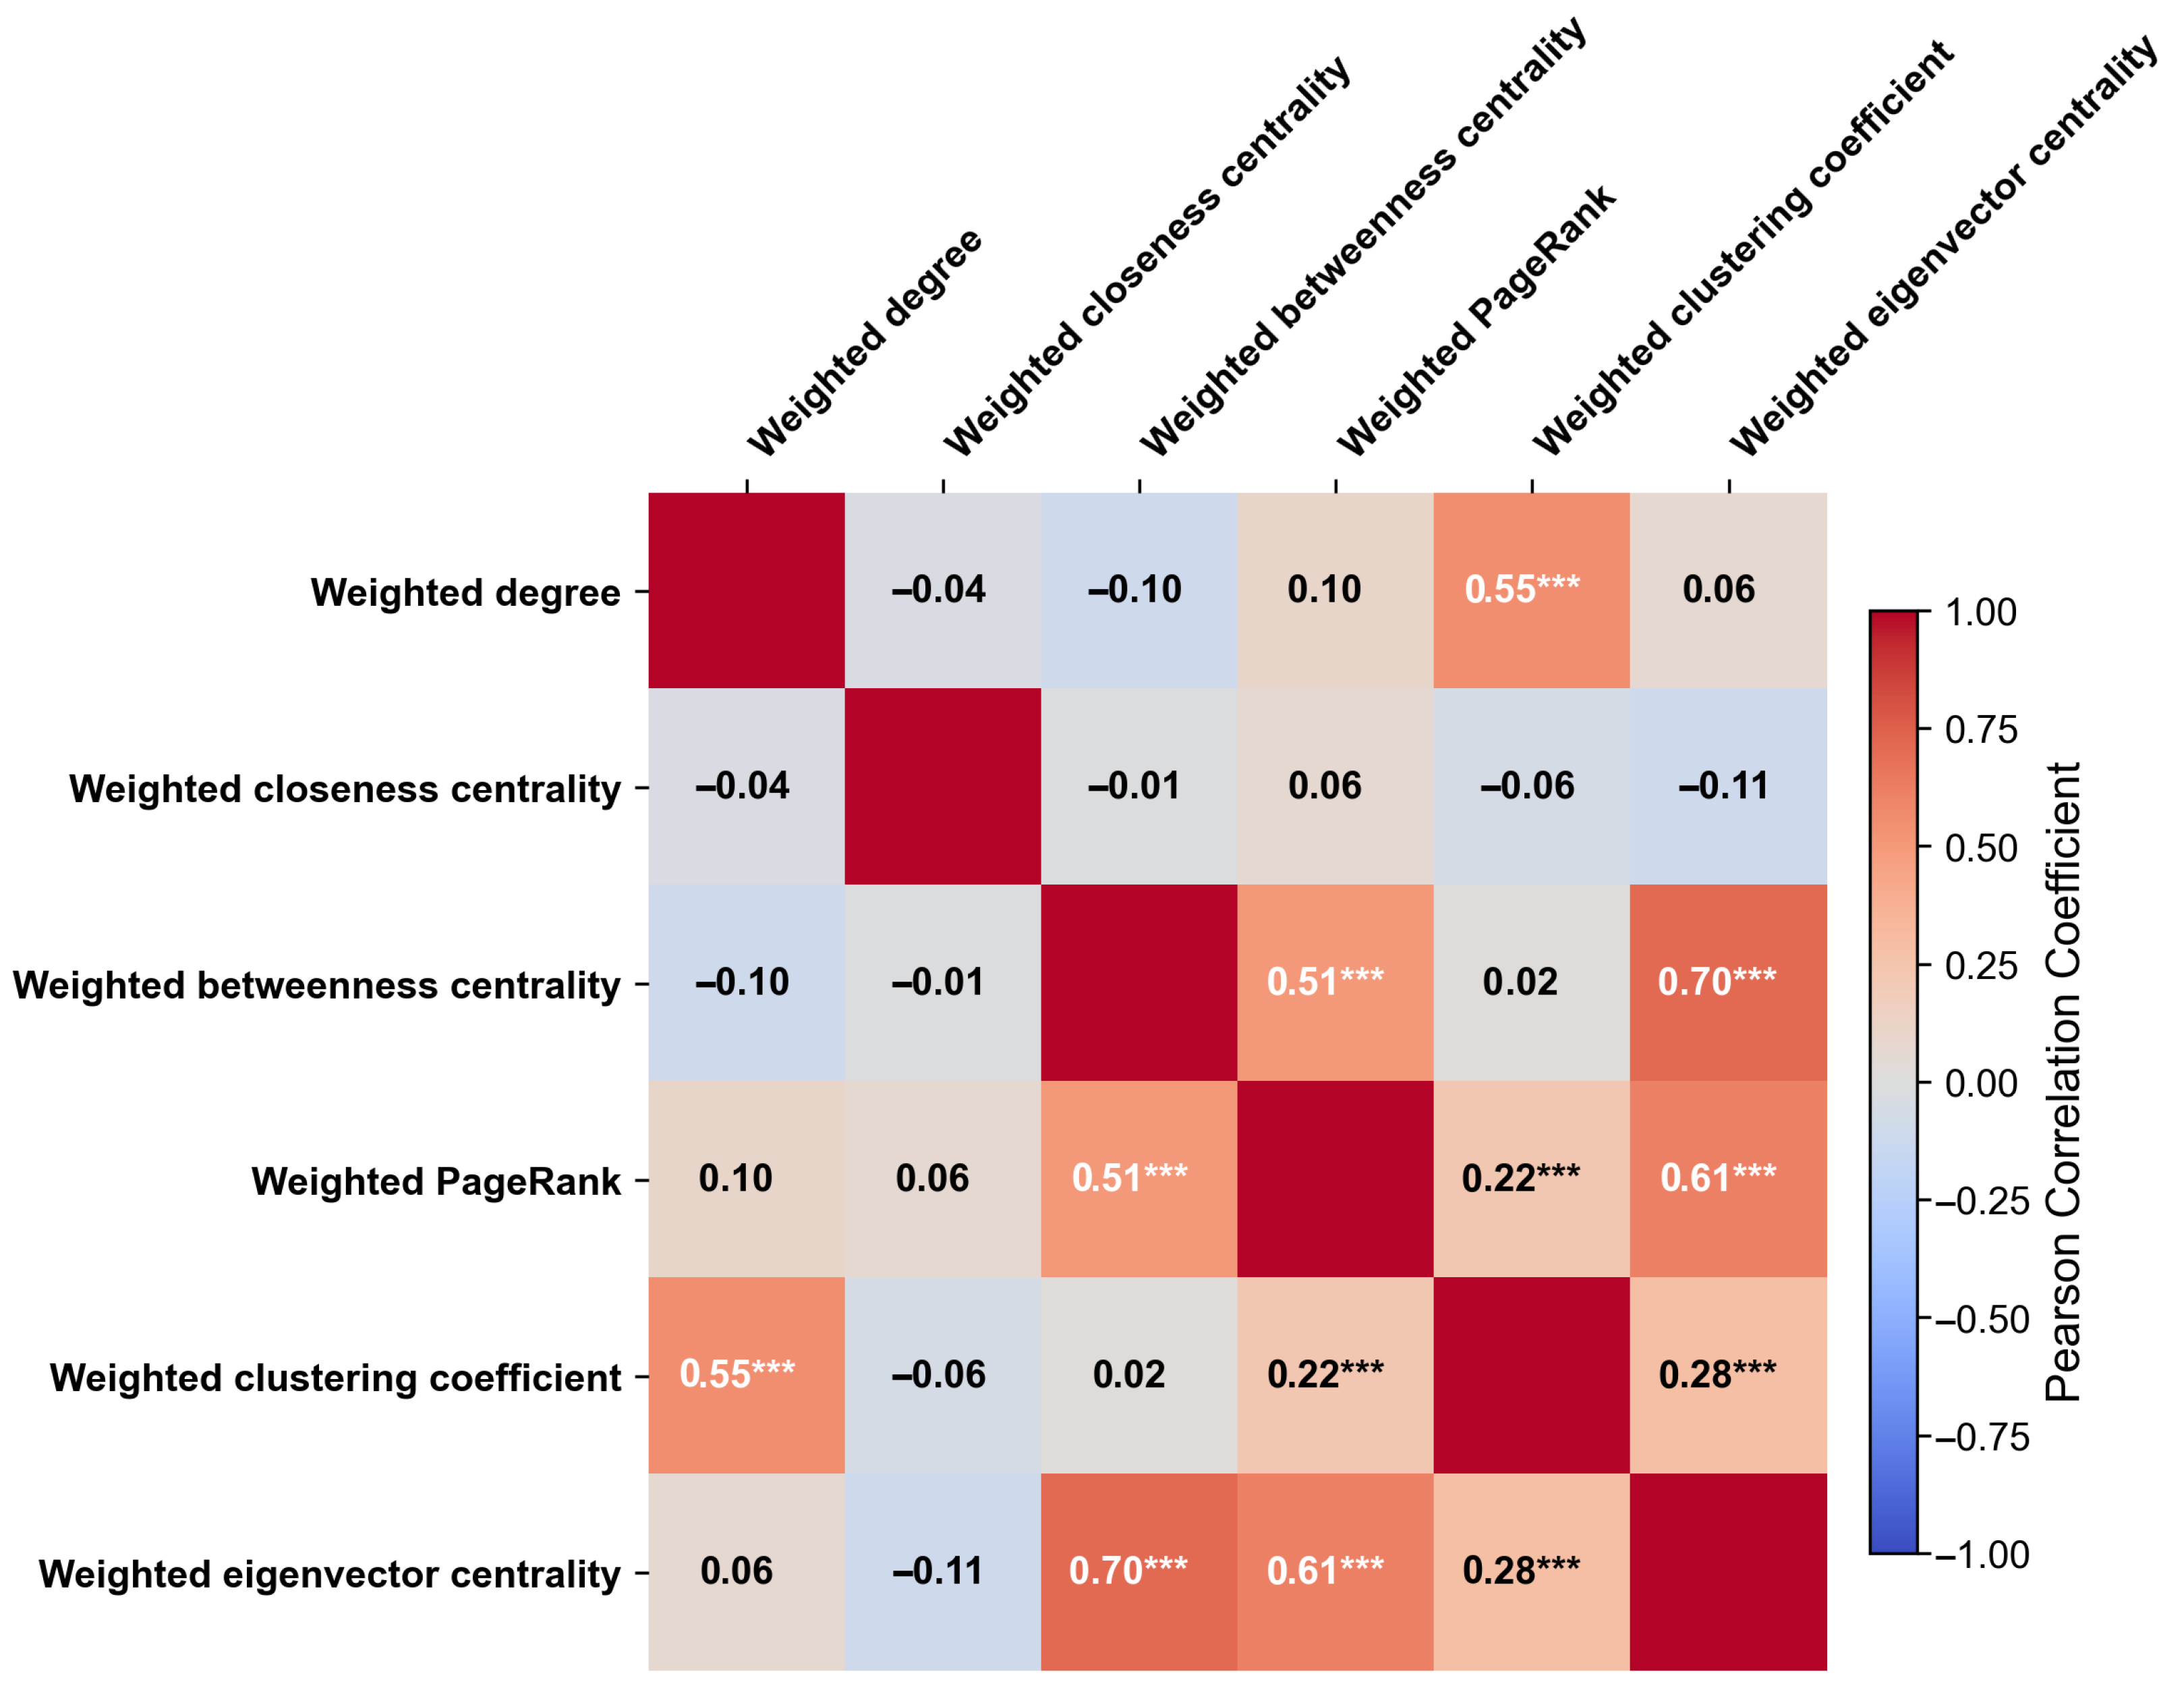
Prior to examining the spatial coupling between the network structure and carbon sequestration, a Pearson correlation analysis was conducted to assess the statistical relationships among the six topological metrics (Figure 12). The correlation matrix reveals distinct functional dimensions within the green highway network. Specifically, metrics associated with global influence and path control demonstrate significant positive collinearity, notably between weighted betweenness and eigenvector centrality ( r = 0.70 , p < 0.001 ), as well as between weighted PageRank and eigenvector centrality ( r = 0.61 , p < 0.001 ). Similarly, local connectivity metrics, such as weighted degree and clustering coefficient, exhibit a moderate positive correlation ( r = 0.55 , p < 0.001 ).
In contrast, weighted closeness centrality shows no significant correlation with any other metric (all | r | 0.11 ). This structural independence highlights that closeness centrality captures a unique dimension of global reachability that is not subsumed by local density or hierarchical bridging roles. The inherent statistical variance among these metrics theoretically justifies the inclusion of multiple topological dimensions to comprehensively evaluate the complex architecture of the green highway network.

3.2.8. Provincial-Scale Spatiotemporal Patterns of NPP

The NPP for Shandong Province in 2023 was calculated using the CASA model. To ensure the reliability of the estimation, the CASA-derived yearly NPP was validated through a spatial correlation analysis against the MODIS NPP product (MOD17A3HGF v061). The results demonstrated a high degree of spatial consistency and a significant positive correlation ( R 2 = 0.83 , p < 0.001 ). To further quantify the model’s accuracy, we calculated the Root Mean Square Error (RMSE) and the Mean Bias. The RMSE was found to be 72.48 gC · m 2 · a 1 with a Mean Bias of 34.15 gC · m 2 · a 1 , confirming that the CASA-derived NPP provides a high-precision estimation compared to the MODIS benchmark.
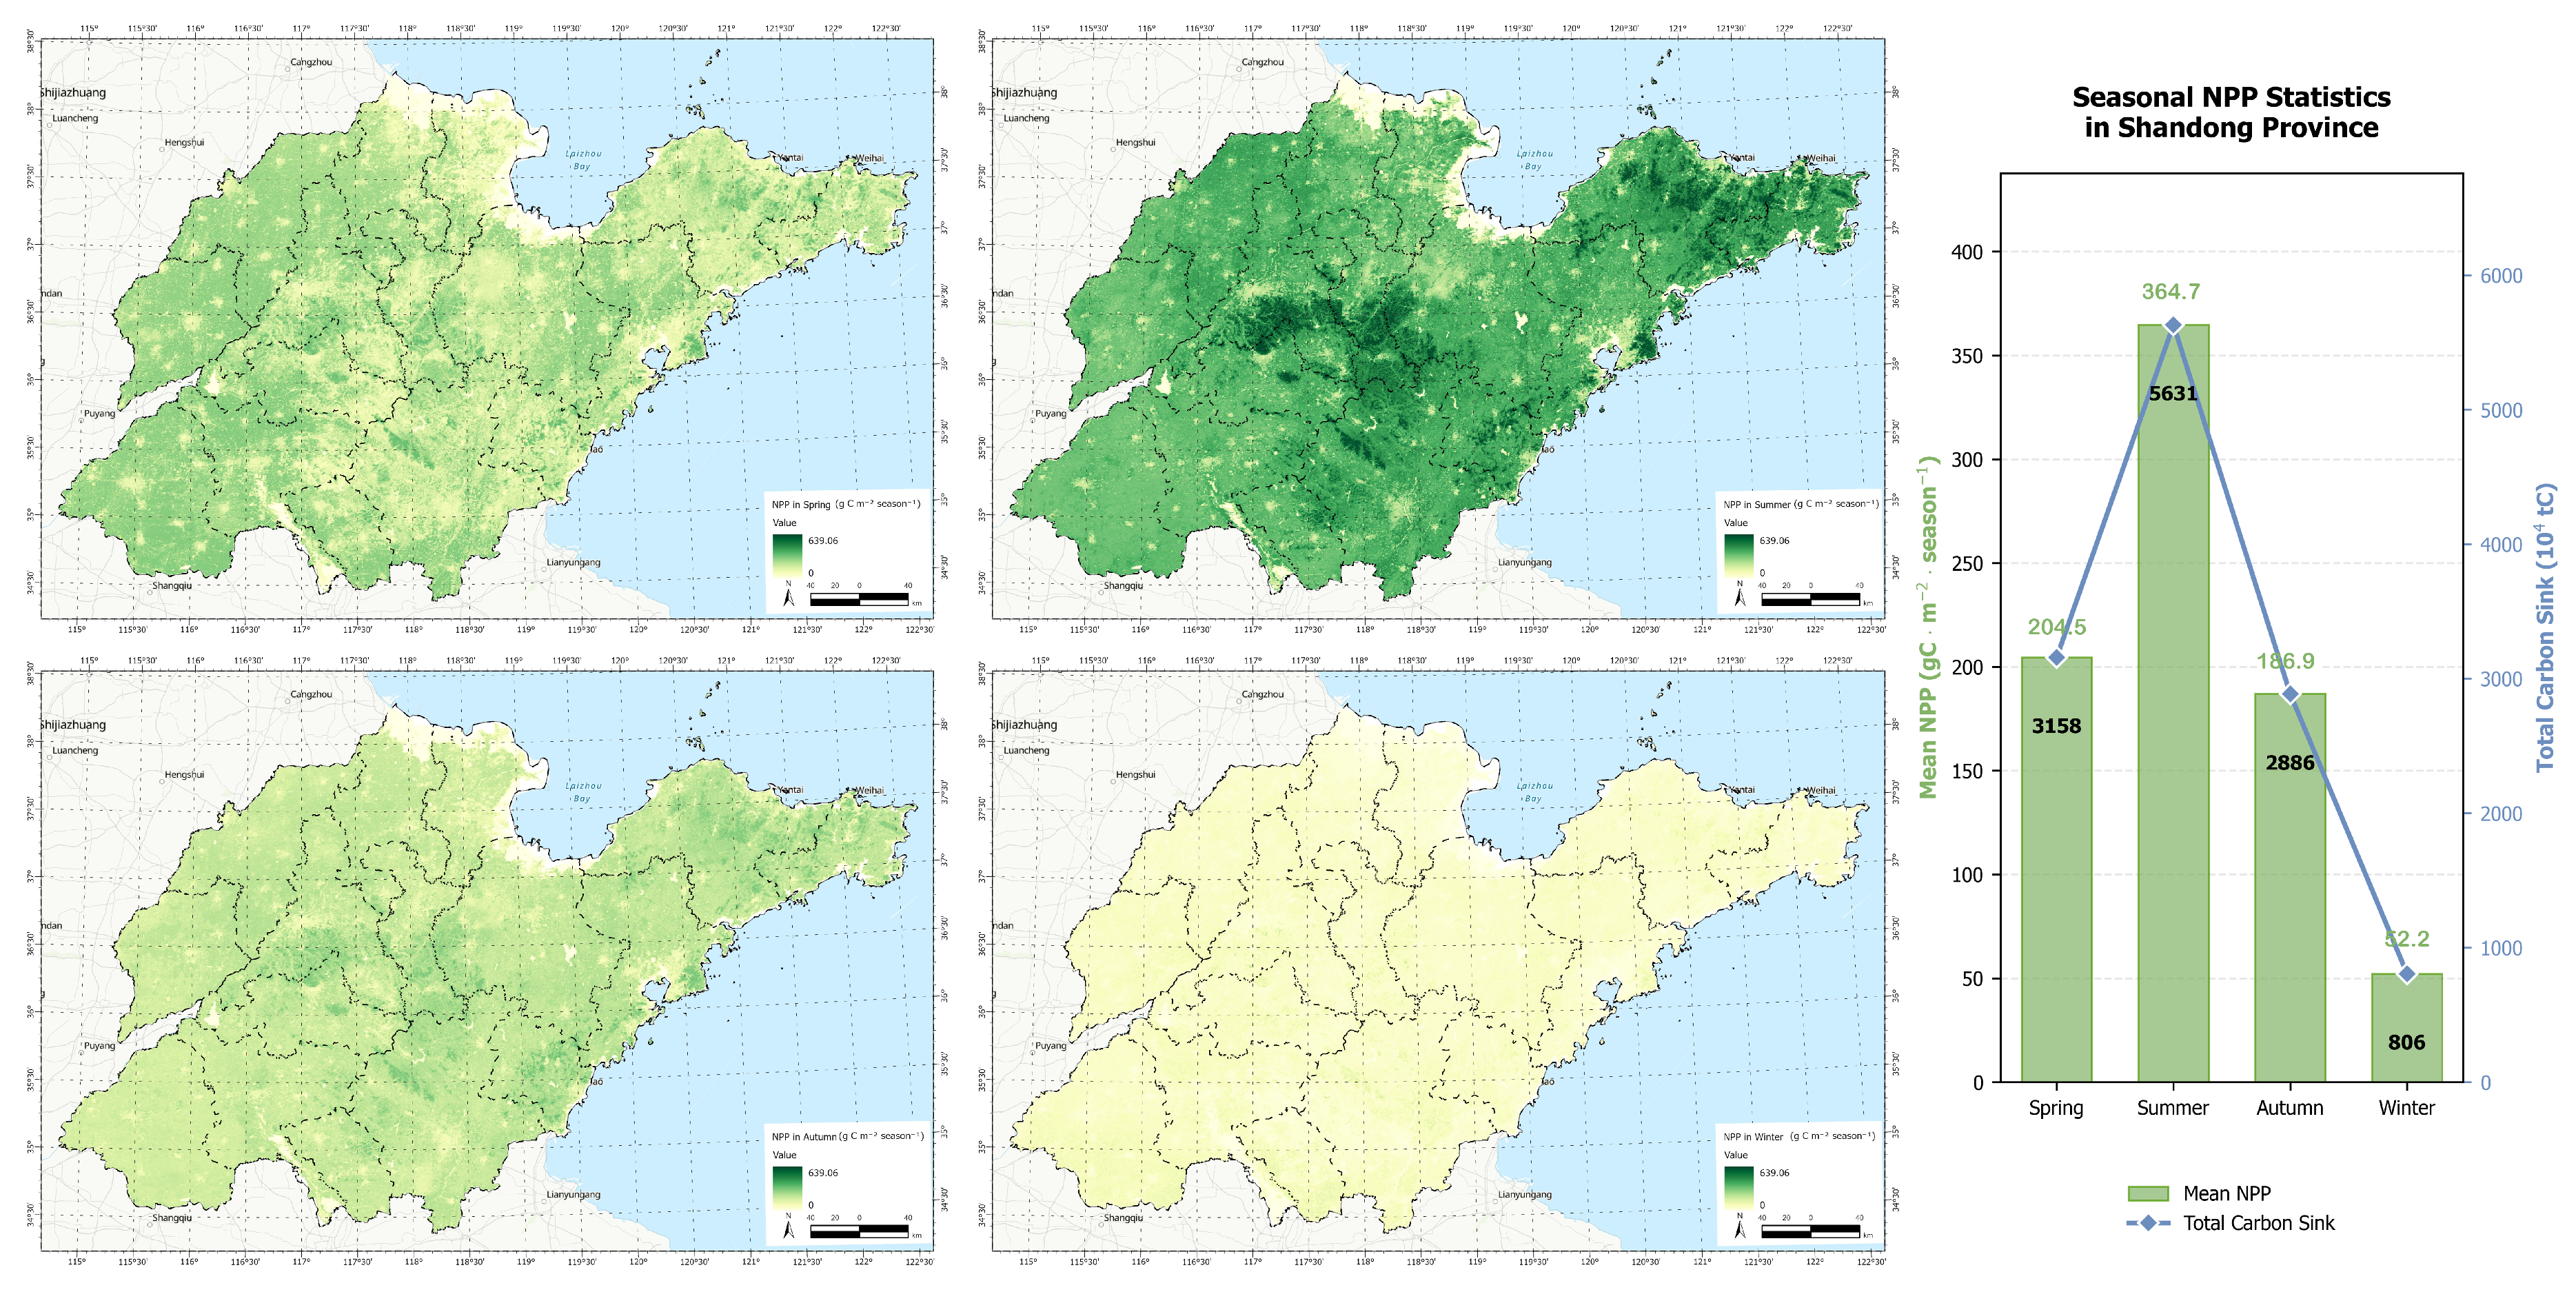
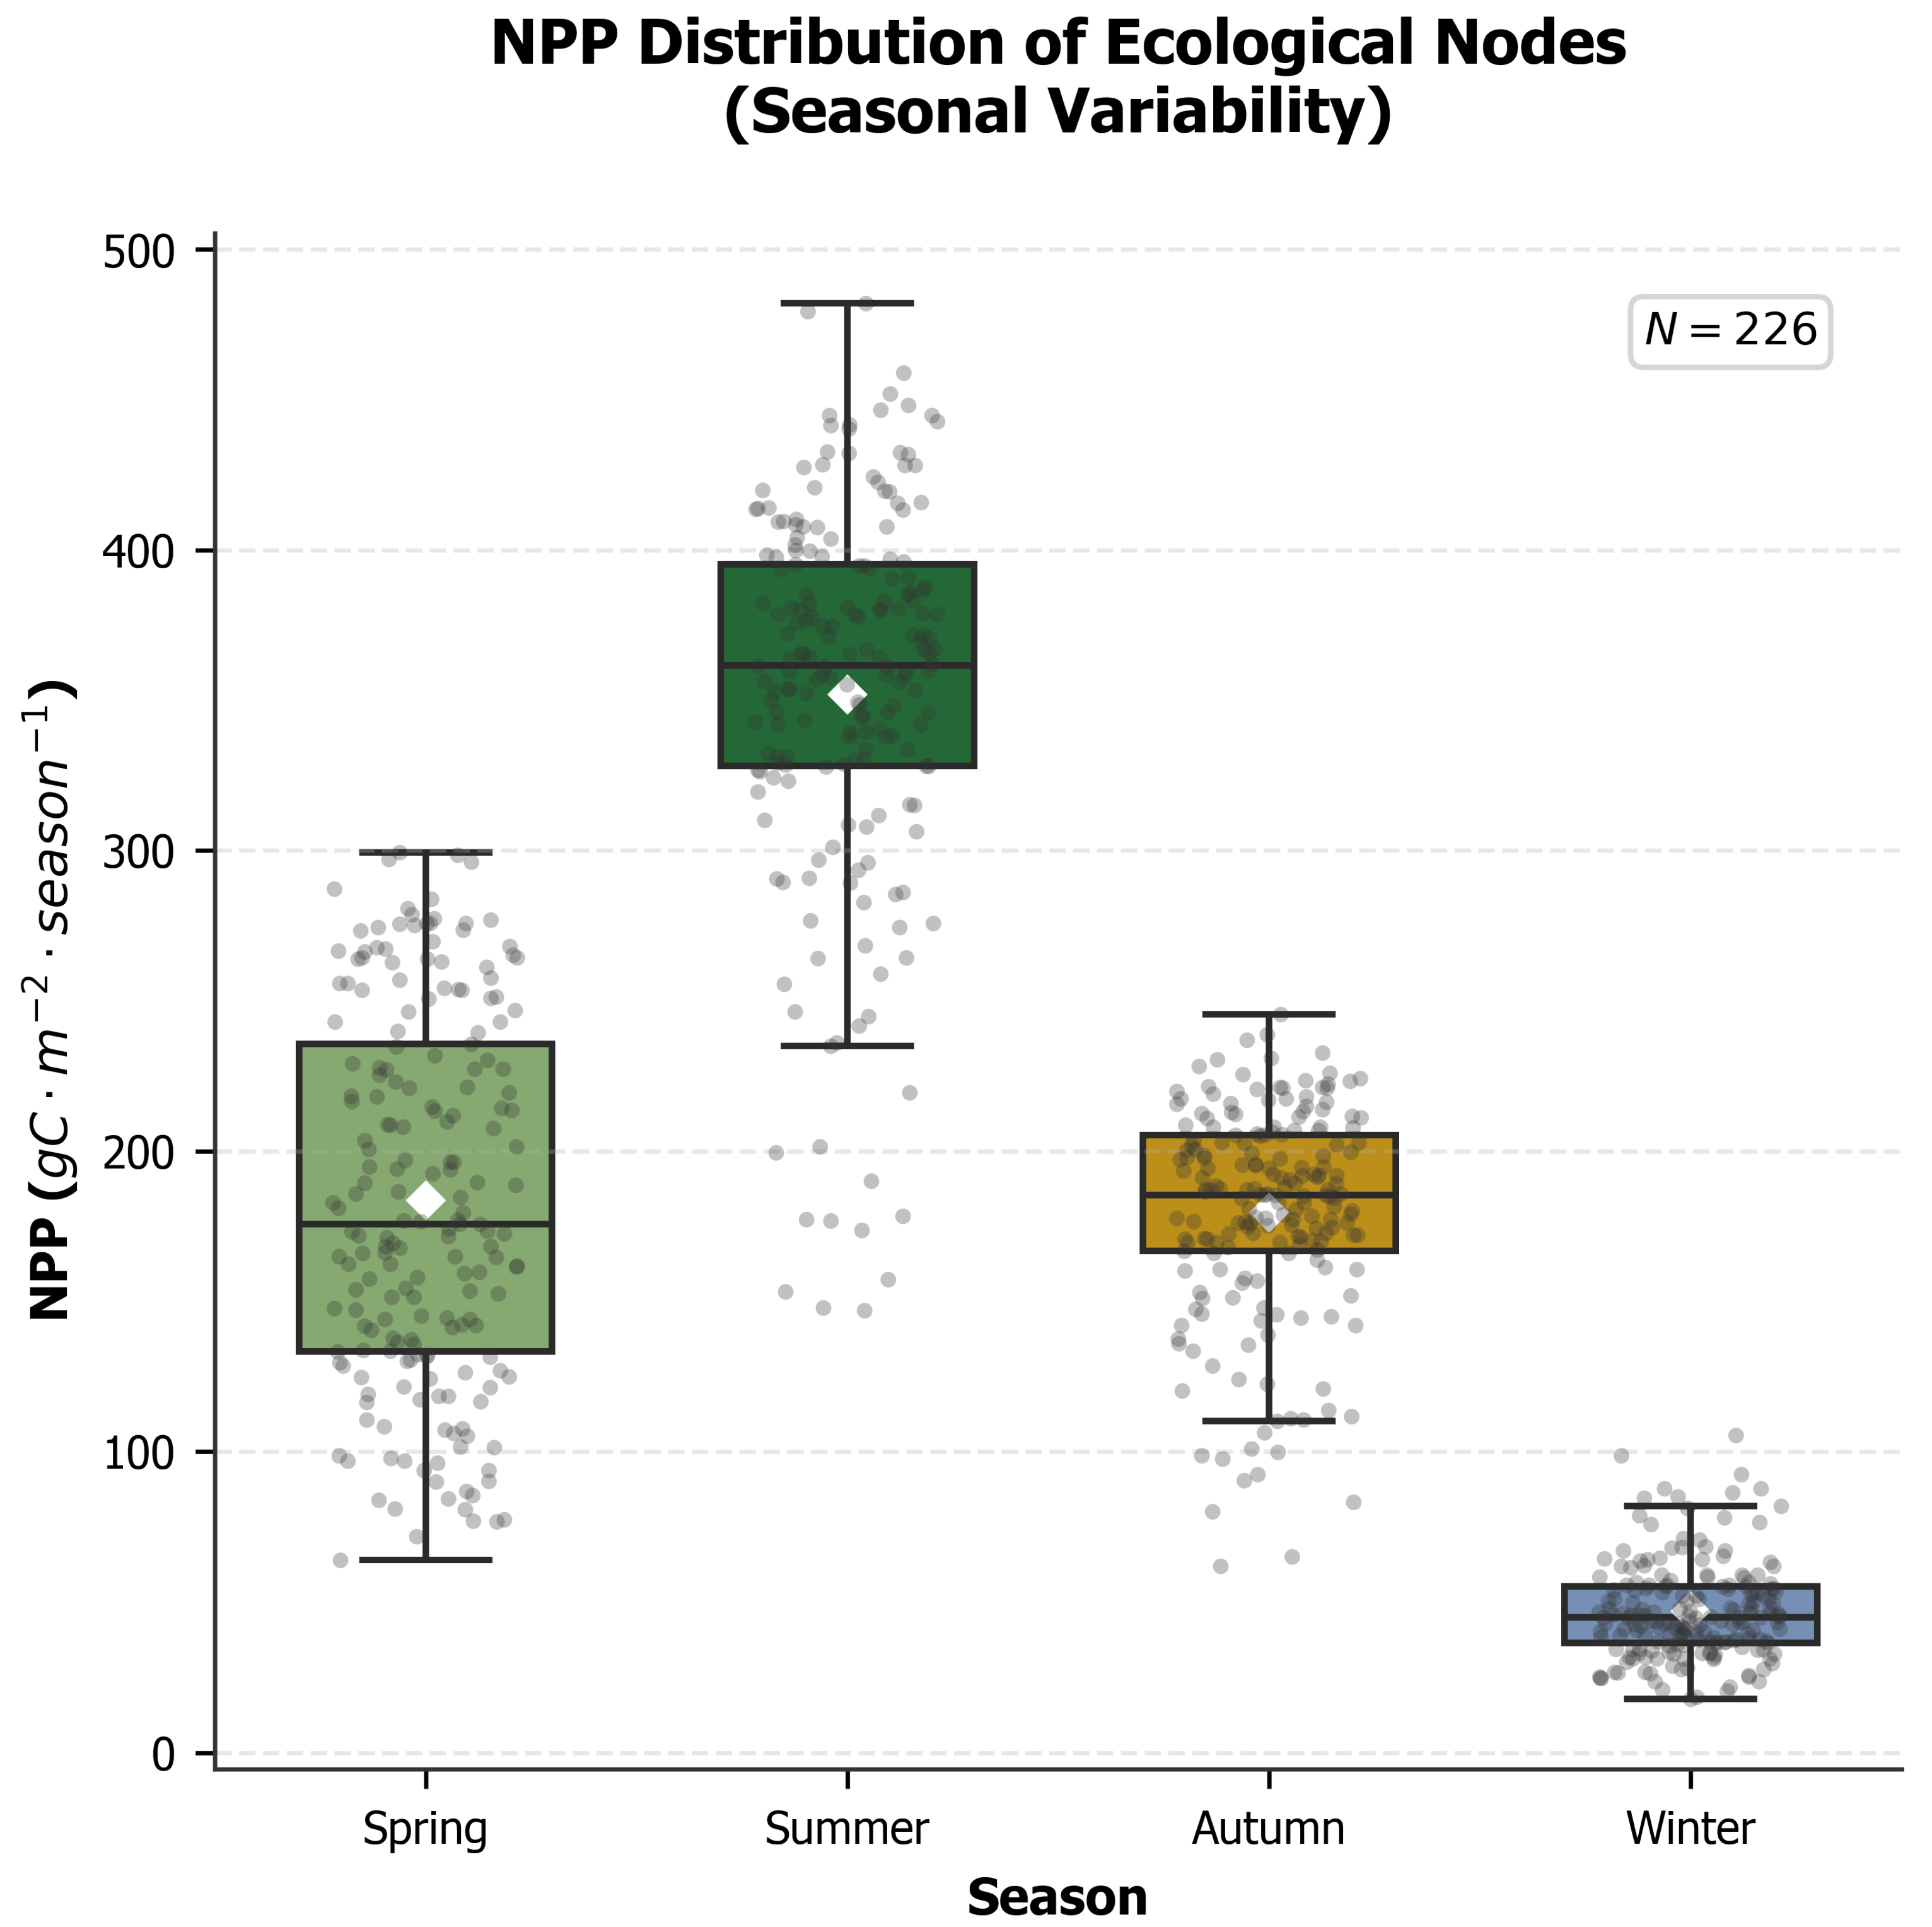
As illustrated in the seasonal statistics (Figure 13), the NPP within the Shandong green highway network exhibits pronounced unimodal seasonal fluctuations, driven by the region’s temperate monsoon climate. The highest carbon sequestration occurs in Summer, characterized by optimal hydrothermal synchronicity. The mean NPP reaches 364.7 gC · m 2 · season 1 , contributing to a total carbon sink of 5631 × 10 4 tC. Spring and Autumn serve as intermediate phases with moderate productivity. Spring NPP is slightly higher than that of Autumn, indicating rapid biomass accumulation during the vernal green-up period. Winter marks the ecological nadir but maintains a baseline activity level, with a mean NPP of 52.2 gC · m 2 · season 1 and a total sink of 806 × 10 4 tC.
The spatial maps reveal a stable geographical gradient of “high in the central-south and east, low in the northwest and coastal fringes” across all seasons, despite temporal variations in intensity. A first-order trend surface analysis was performed to statistically verify the observed spatial gradient. The results indicated a significant positive correlation between NPP and longitude ( β = 3.52 , p < 0.01 ) and a significant negative correlation with latitude ( β = 4.28 , p < 0.01 ). This regression model statistically substantiates the ‘high southeast–low northwest’ ecological pattern, which is primarily dictated by the increasing hydrothermal gradient from the inland plains to the coastal hilly regions. High NPP values are consistently anchored in the Taiyi Mountain Range (central-south) and the Jiaodong Peninsula (east). These regions possess higher topographic relief and extensive forest coverage, serving as the primary carbon reservoirs for the provincial ecological network. Conversely, the Northwestern Plain and the Yellow River Delta consistently exhibit lower NPP. The combination of intensive agricultural land use in the plains and soil salinity constraints in the coastal delta limits the potential for high-intensity carbon sequestration along highways in these areas.

3.2.9. Seasonal Variability of NPP at Ecological Nodes

To quantify the carbon sequestration function of the 226 ecological nodes, a seasonal distribution analysis was performed (Figure 14). The data exhibits a quasi-normal distribution across all seasons, with several noteworthy asymmetrical outlier patterns.
The close alignment between the median (black horizontal line) and the mean (white diamond) in all four seasons suggests a relatively symmetrical distribution of NPP values among the highway nodes. This stability indicates that the ecological nodes respond somewhat uniformly to macro-climatic drivers at the provincial scale. The NPP pulses follow a clear hierarchy: Summer > Spring ≈ Autumn > Winter. Summer nodes exhibit the highest median, while Winter maintains a vital baseline.
During the high-productivity seasons, several nodes fall significantly below the lower whisker. These “low-productivity outliers” represent nodes with high proportions of impervious surfaces or those situated in degraded landscapes (e.g., the Yellow River Delta’s saline soils), where carbon sequestration potential is structurally constrained. In contrast, winter displays a distinct pattern of upward outliers. These nodes act as “Ecological Refugia,” maintaining higher carbon sequestration rates during the dormant period. This is due to the presence of evergreen coniferous forests or favorable microclimates in the central hilly regions, which sustain the network’s ecological baseline during extreme cold.

3.3. Spatial Coupling Analysis of Network Topological Metrics and Carbon Sequestration Function

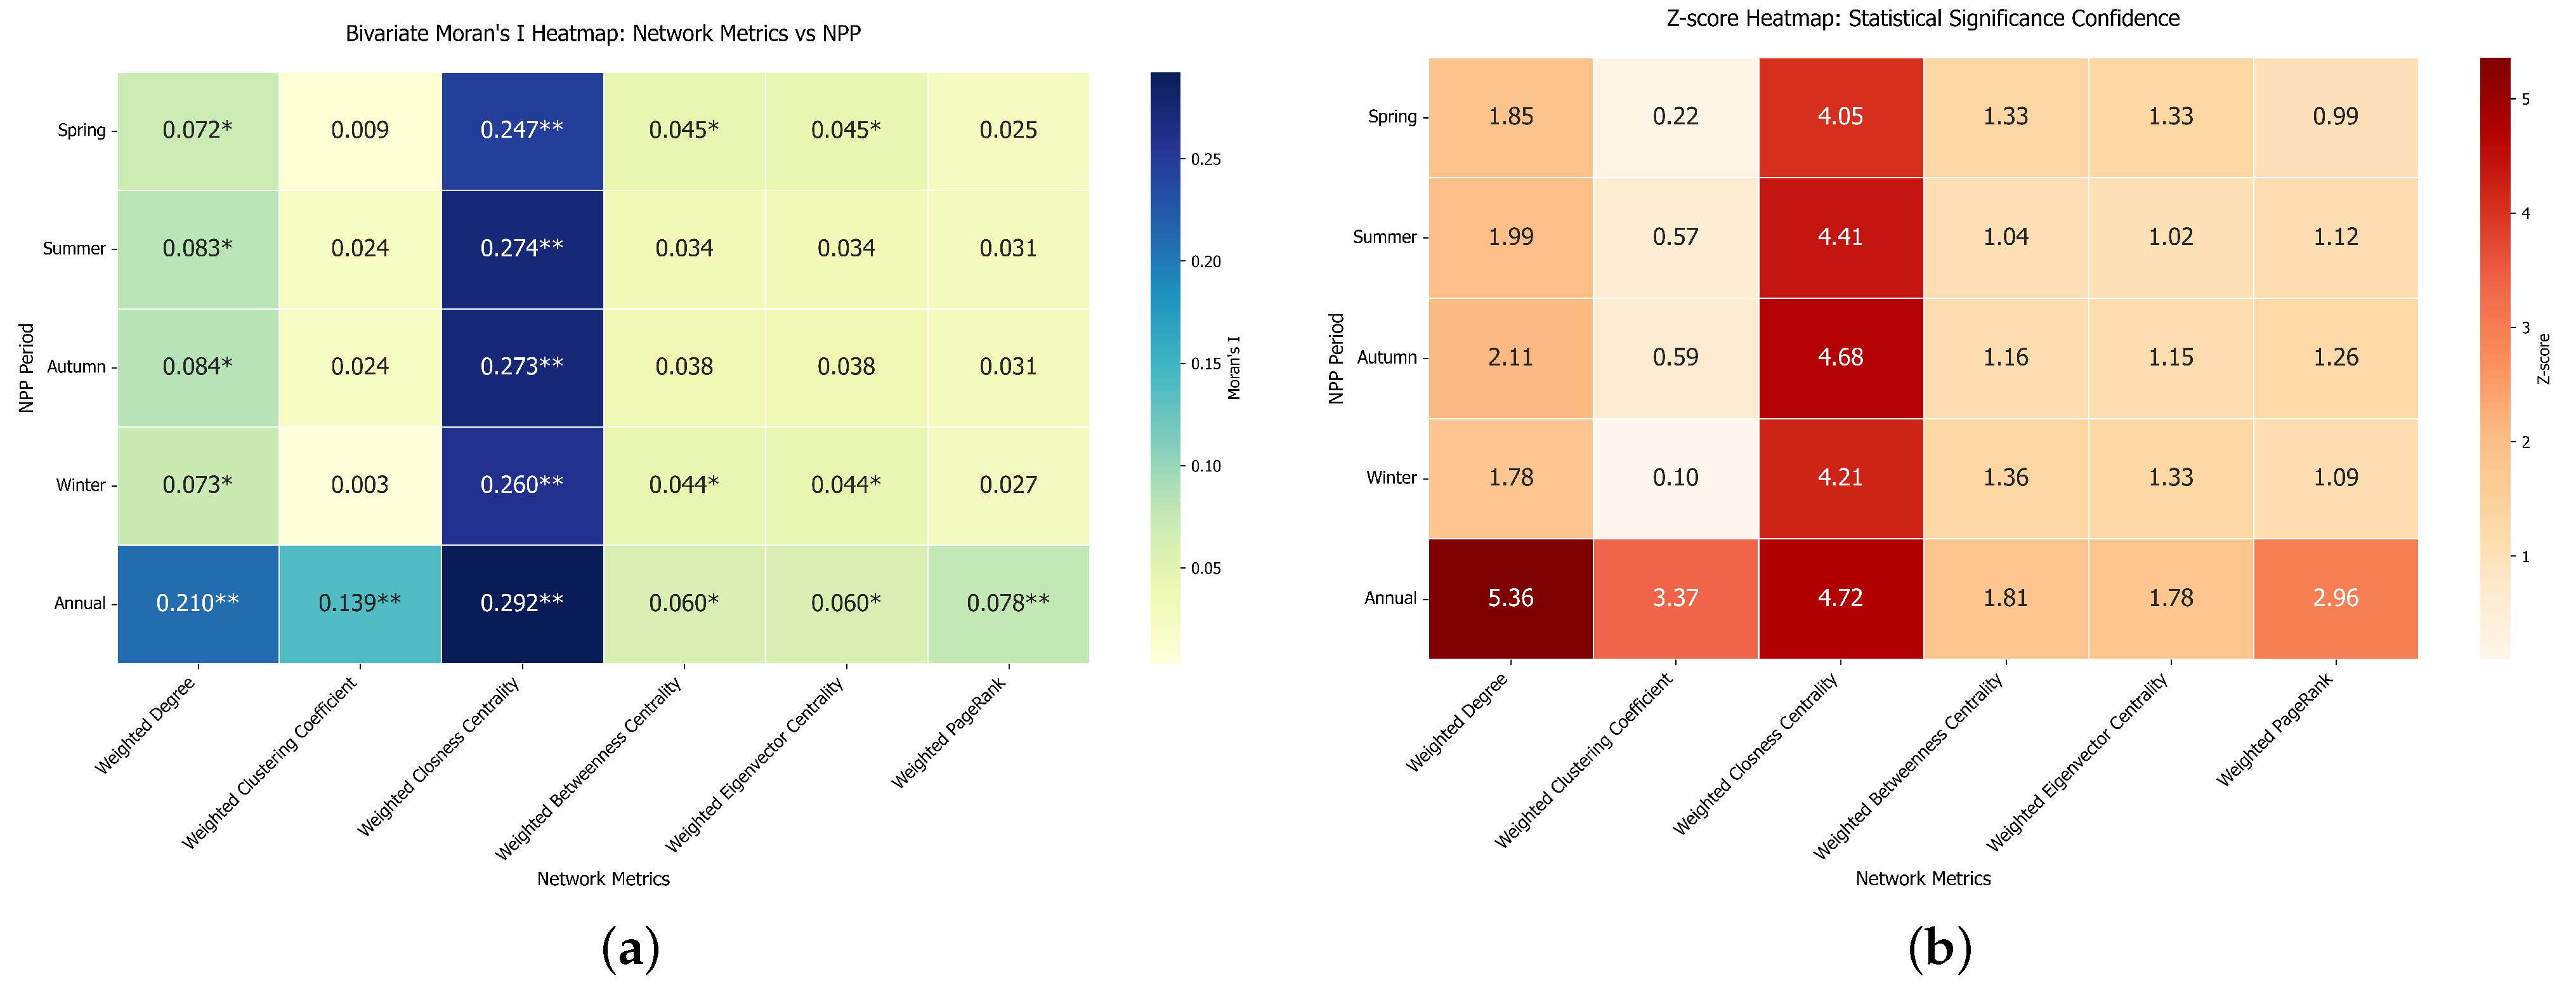
The global bivariate Moran’s I was employed to quantify the spatial association between six network topological metrics and seasonal/annual NPP (Figure 15). Overall, the results demonstrate a positive spatial correlation between network importance and carbon sequestration function. While all reported Moran’s I values are statistically significant ( p < 0.01 , Z > 4.00 ), their magnitudes vary significantly, reflecting different levels of structural-functional dependence.
Among all investigated metrics, weighted closeness centrality consistently exhibits the strongest and most significant spatial coupling with NPP. The Moran’s I values for closeness centrality remain high and stable across all seasons, ranging from 0.25 to 0.27, and peaking at 0.29 for annual NPP ( p < 0.01 ). This is further supported by Z-scores consistently exceeding 4.00, indicating extremely high statistical confidence. This suggests that the “reachability” or proximity of a node to all other nodes in the green highway network is the most reliable structural indicator of its carbon sequestration function.
Weighted degree shows a moderate positive association ( I = 0.21 for annual NPP). Seasonal correlations are lower but remain significant, suggesting that nodes with more robust direct connections are generally located in high-biomass areas. Interestingly, the weighted clustering coefficient exhibits minimal spatial association with seasonal NPP. However, it shows a weak but statistically non-random correlation with annual NPP ( I = 0.14 , Z = 3.37 ). This implies that while local ‘cliques’ or redundant connections do not exhibit immediate spatial overlap with short-term carbon flux, they may manifest a more observable spatial alignment with long-term biomass accumulation at an annual scale.
Other metrics, including weighted betweenness, weighted eigenvector centrality, and weighted PageRank, all show weak but statistically non-random spatial associations with NPP. The Moran’s I values for these metrics typically hover around 0.03–0.08. While these values indicate a lower degree of spatial dependence compared to closeness or degree, their consistent significance ( Z > 4.00 , p < 0.01 ) suggests that nodes acting as structural bridges (betweenness) or those connected to influential hubs (eigenvector/PageRank) show a subtle spatial alignment with relatively higher ecological productivity.
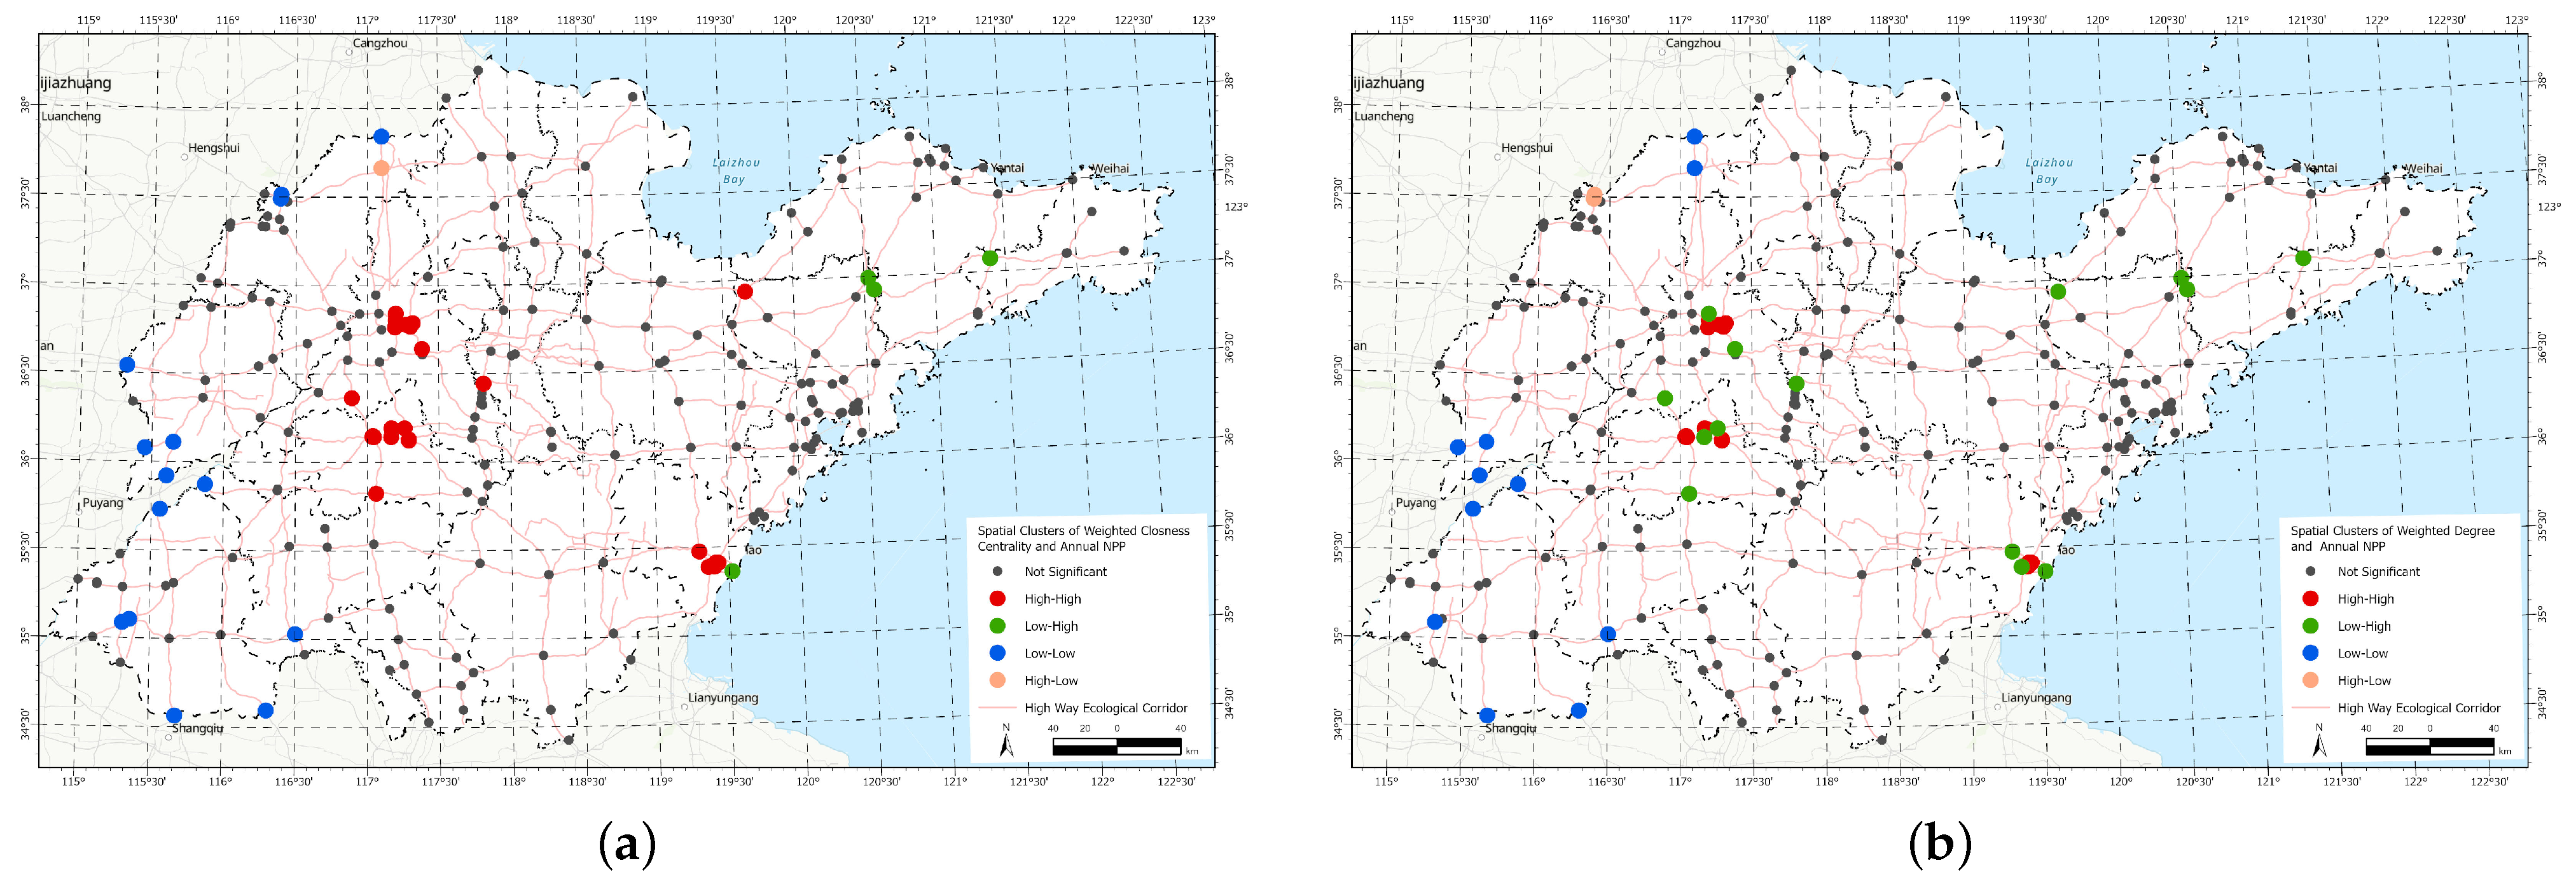
To ensure the rigor of the local spatial analysis, we utilized the global Moran’s I results as a quantitative screening tool. Weighted closeness centrality and weighted degree were selected for bivariate LISA cluster analysis (Figure 16) for two primary reasons: (1) They exhibited the highest Moran’s I and Z-scores, representing the most robust structural-functional coupling patterns in the study area; (2) Closeness centrality captures global reachability within the provincial network, while degree centrality reflects local connectivity, providing a comprehensive two-scale perspective for identifying functional mismatches.
The bivariate LISA cluster maps (Figure 16) reveal significant spatial heterogeneity in the coupling of network structure and ecological functionality, identifying four distinct types of spatial association.
The H-H clusters, representing nodes with both high network importance and superior carbon sequestration function, are primarily concentrated in the Central Hilly Region (the Jinan–Tai’an–Laiwu cluster). These nodes act as the “Ecological Hubs” of the provincial green highway network. Their high accessibility (closeness) and connectivity (degree) are spatially matched with the high biomass of the central mountain forests, forming a stable core for ecological energy flow and carbon storage.
The L-L clusters are predominantly located along the western plains (Liaocheng, Heze) and the area near northern coastal fringe (Yellow River Delta). These areas suffer from “Ecological Isolation,” characterized by both peripheral network positions and degraded ecological quality. In the north, soil salinity limits vegetation growth, while in the west, intensive agricultural land use constrains the development of highway green belts.
The L-H clusters are primarily found in the eastern coastal regions (Qingdao, Weifang) and southern borders. These nodes possess high NPP but remain topologically peripheral in the highway network. They represent “Ecological Reservoirs” that are not yet structurally integrated into the main ecological flux of the province.
The H-L clusters are rare but strategically critical, these are identified in the northern inland regions (Dezhou, Binzhou). These nodes are central hubs for transportation but exhibit poor carbon sequestration function. They are identified as “Restoration Priorities,” where structural prominence provides a strong platform for future ecological enhancement through targeted greening projects.

4. Discussion

4.1. Spatial Synergy and Mismatch Between Network Topology and Carbon Sequestration Function

Taken together, the results indicate that the green highway system in Shandong Province exhibits a highly heterogeneous, heavy-tailed network structure with strong linearity and limited structural redundancy. This study provides evidence that these topological characteristics are significantly associated with carbon sequestration function. Specifically, weighted closeness centrality showed the strongest association with high-NPP nodes.
From a mechanistic perspective, the spatial congruence of closeness centrality and NPP can be attributed to the “corridor effect” and habitat continuity. Nodes with high closeness centrality function as pivotal integrators within the provincial ecological framework, facilitating the efficient flux of nutrients, seeds, and energy along the highway green belts. Such high topological integration often corresponds to high vegetation continuity, which mitigates the edge effects of road surfaces and creates a stable microclimate—characterized by reduced thermal stress and enhanced moisture retention—that fosters higher biomass accumulation. Conversely, nodes with low closeness are often topologically isolated, leading to fragmented habitats where ecological energy exchange is restricted, thereby limiting carbon sequestration potential.
However, it is essential to recognize that network topology is not the sole determinant of NPP patterns; rather, it operates within a complex matrix of environmental constraints. The observed “high southeast–low northwest” gradient is primarily underpinned by regional climatic factors, specifically the hydrothermal gradient of the temperate monsoon climate. In the southeastern hilly regions, abundant precipitation and optimal temperatures provide the fundamental ecological capacity for high NPP, which coincides with the high-closeness network backbone. In contrast, the spatial mismatches observed in northern inland regions (H-L clusters) highlight where structural prominence is “decoupled” from functional output due to limiting factors such as soil salinity, water scarcity, or intensive land-use conversion. While our correlation analysis highlights the structural-functional alignment, future research employing structural equation modeling (SEM) could further disentangle the relative contributions of topological integration versus climatic and anthropogenic drivers.

4.2. Comparison with Extant Research

The findings of this study offer a unique contribution to the emerging field of Infrastructure Ecology, which advocates for treating transportation networks as integrated nature-based solutions for carbon sequestration. By deconstructing the “green-grey infrastructure” balance—a framework similar to that proposed by Sun and Zhu [4,19]—this research provides a multi-dimensional perspective that diverges from traditional landscape studies in terms of topology, climate, and scale.
(1)
Network Type: Linear Infrastructure vs. Planar Ecological Networks.
Previous studies, such as the assessment of the Yellow River Basin [55] and Wuding River Basin [56,57], primarily focus on areal ecological spatial networks. These natural watershed systems typically exhibit high clustering and complex redundant paths. In contrast, our green highway network is a constrained linear system characterized by significantly lower clustering coefficients and a heavy-tailed distribution. While areal networks emphasize “patch-matrix” stability, the functionality of the highway network is highly sensitive to pivotal bridges (high betweenness). This structural linearity implies that infrastructure-based NbS are more vulnerable to fragmentation, necessitating a “topology-guided” management strategy to maintain their role as functional carbon sinks.
(2)
Climatic Context: Monsoon Synergy vs. Arid Stress.
Our observation of a positive synergy between structural centrality and NPP in the warm-temperate monsoon region of Shandong contrasts with research in more extreme environments. For instance, Wang et al. [58] reported a potential negative correlation in arid Inner Mongolia, and Nawaz et al. [59] highlighted that in the Thal Desert, network optimization must focus on mitigating environmental stressors rather than maximizing connectivity. This suggests that the effectiveness of green highways as carbon-sequestration nature-based solution is resource-dependent: in water-sufficient regions, network integration acts as a “productivity multiplier,” whereas in arid systems, it may instead exacerbate resource competition.
(3)
Scale Effects: Corridor-level Nuance vs. Regional Aggregation.
Distinct from regional-scale studies like the Yangtze River Economic Belt analysis by Zhu et al. [4], which focuses on macro-level carbon supply-demand mismatches, our road corridor scale approach (250-m buffer) captures the micro-ecological signatures of transportation infrastructure. By integrating pixel-level NPP with node topology, we identify functional mismatches that are often diluted in landscape-level assessments. This scale-specific insight allows for a more granular implementation of infrastructure ecology principles at the engineering unit level.

4.3. Optimization Recommendations for Green Highway Network

To bridge the gap between topological theory and engineering practice, this study proposes a differentiated optimization framework. Unlike uniform greening standards, this “topology-guided” approach prioritizes interventions based on structural–functional mismatches (LISA results) while considering economic and land-use constraints.
(1)
Precision Restoration of H-L Hubs.
The northern inland regions (e.g., Dezhou, Binzhou) exhibit high structural centrality but low carbon sequestration. These H-L nodes represent the most cost-effective targets for restoration. From an ecological engineering perspective, prioritizing the ecological retrofitting of these H-L hub nodes to approach the provincial mean productivity can yield substantial localized carbon sink increments without expanding the existing infrastructure footprint. Economically, focusing on these existing hubs is more efficient than building new infrastructure, as they utilize existing highway rights-of-way (ROW), thereby minimizing land-acquisition costs and avoiding conflicts with primary farmland.
(2)
Redundancy Enhancement and Resilience Design.
To address the network’s low redundancy, planning should move beyond linear dependence. In the western plains (L-L clusters), we propose the construction of “bypass” ecological loops by utilizing fragmented marginal lands adjacent to interchanges. Simulations suggest that adding strategic “stepping stones” every 50 km could increase the network clustering coefficient by an order of magnitude, significantly enhancing localized connectivity. From a policy perspective, this aligns with the “Beautiful Highway” initiatives of Shandong Province, allowing for the integration of ecological compensation funds into routine highway maintenance budgets.
(3)
Feasibility and Constraint Analysis.
Delivering these targeted recommendations requires careful reconciliation of multiple competing constraints and trade-offs. In densely populated areas such as China’s eastern coast, which are dominated by L-H clusters, ecological corridor expansion is largely restricted by extensive urban and industrial land occupation. Rather than pursuing large-scale outward expansion, optimization in such regions should prioritize vertical greening and multi-layered vegetation configuration to maximize ecological benefits within limited right-of-way spaces.
Environmental limitations represent another key consideration, particularly in the Yellow River Delta, where high soil desalination costs pose a major practical barrier. For this fragile region, a low-maintenance and high-resilience development strategy is proposed, with priority given to native salt-tolerant species such as Tamarix chinensis. This nature-based approach can effectively cut long-term expenditure on irrigation and vegetation replacement, while adapting to local saline land conditions.
Beyond ecological and geographical constraints, policy practicality is critical to long-term implementation. All proposed measures should be fully integrated into the Provincial Comprehensive Transportation Plan (2021–2035). Classifying ecological nodes into three differentiated management categories—strict conservation for H-H clusters, priority restoration for H-L clusters, and connectivity enhancement for L-H clusters—enables local authorities to rationally distribute environmental budgets. Such tiered management helps maximize the ecological benefits and overall cost-effectiveness of nature-based solution interventions.

4.4. Research Limitations and Future Perspectives

While this study offers a novel framework for quantifying the coupling between green highway network topology and carbon sequestration, several critical limitations inherent to the methodology warrant further discussion.
(1)
Spatial Resolution and Mixed Pixel Challenges.
A primary constraint concerns the spatial resolution of the remote sensing data relative to the fine-scale characteristics of highway vegetation. To align with the available 250 m MODIS dataset and ensure data integrity at a provincial scale, this study adopted a road corridor scale (250 m buffer). This selection is justified as it captures the highway system as a coherent landscape unit; however, the “mixed pixel” phenomenon remains a challenge. Since roadside green belts are typically narrow (<50 m), the spectral signals are inevitably blended with impervious pavement and surrounding land covers, which may introduce uncertainties into the precise quantification of NPP.
(2)
CASA Model Assumptions and Data Uncertainties.
Beyond the scale issue, the uncertainties in the CASA model parameterization must be acknowledged. The estimation relies on several assumptions, most notably the use of a fixed maximum light use efficiency ( ε max ) for specific vegetation types. While derived from established literature, the physiological response of roadside vegetation may vary due to traffic-related pollutants or localized microclimates, potentially leading to estimation biases. Additionally, while the climate composites are high-quality, the spatial interpolation processes for temperature and precipitation may introduce localized uncertainties in the water and temperature stress scalars ( T ε and W ε ).
(3)
Resistance Subjectivity and Validation Gaps.
A significant methodological limitation lies in the subjectivity of resistance parameterization. The resistance surfaces were constructed based on expert-knowledge-based weighting (0.2 per factor). While consistent with ecological protocols, these assignments may not fully capture non-linear interactions between anthropogenic disturbances and ecological flux. Furthermore, while NPP estimation was validated ( R 2 = 0.83 ), the topological connectivity remains structurally theoretical. Due to the lack of empirical flux data (e.g., species dispersal rates), the functional reality of these “ecological corridors” remains a potentiality rather than a measured flow.
(4)
Modifiable Areal Unit Problem and Temporal Constraints.
This study is subject to the Modifiable Areal Unit Problem, where results are sensitive to aggregation scales. The observed spatial synergy and Moran’s I values might fluctuate if the buffer width or the spatial weight configuration ( k = 4 ) were modified. Additionally, the cross-sectional design focusing on 2023 captures a static snapshot but overlooks dynamic succession. While the network structure is relatively stable over short periods, the structural-functional coupling may exhibit inter-annual lags or threshold effects following major road construction that a single-year study cannot capture.
(5)
Hypothesis-Driven Future Perspectives.
Future investigations should transition from descriptive assessments toward hypothesis-driven research utilizing high-resolution data (e.g., Sentinel-2, LiDAR). Specifically, work should test the “Edge-Effect Threshold Hypothesis”: whether the realized carbon sequestration of linear green belts is governed by a critical width-to-length ratio that determines microclimate stability. Furthermore, researchers should test the “Structural-Functional Co-evolution Hypothesis”: whether the addition of new topological “hubs” (e.g., interchanges) triggers a non-linear increase in regional carbon sequestration through enhanced habitat connectivity. This transition toward testing mechanisms will be essential for transforming “topology-guided” planning into a predictive science for sustainable transportation.

5. Conclusions

This study constructed an integrated “node-edge” green highway ecological network for Shandong Province, providing a robust analytical framework to decode the structural-functional relationship of linear infrastructure. The principal conclusions and their broader implications are summarized as follows:
First, structurally, the green highway network exhibits a highly heterogeneous, heavy-tailed architecture characterized by “efficiency over robustness.” The heavy-tailed architecture identifies a few high-degree “hub” nodes that facilitate efficient ecological flow across the province. However, the universally low clustering coefficients (<0.01) indicate a scarcity of redundant pathways. This finding offers a critical theoretical insight: while the network is optimized for connectivity, its structural low redundancy makes it vulnerable to fragmentation, suggesting that future planning must prioritize “redundancy enhancement” to ensure ecological stability.
Second, the carbon sequestration function exhibits pronounced spatiotemporal dynamics driven by hydrothermal gradients. The observed “high southeast, low northwest” pattern ( β L o n = 3.52 , β L a t = 4.28 ) provides a quantitative baseline for regional carbon sink assessment. Temporally, the identification of winter as an ecological nadir, yet sustained by central hilly “refugia,” suggests that the network’s resilience depends on maintaining a seasonal carbon sequestration baseline through evergreen vegetation configurations.
Third, a significant spatial synergy exists between network topology and carbon sequestration ( p < 0.01 ). The strong positive correlations identified for weighted closeness centrality (annual I = 0.29 ) and weighted degree (annual I = 0.21 ) provide empirical evidence for the “Structure-Function Hypothesis” in infrastructure ecology. This confirms that topological centrality is a reliable proxy for ecological productivity, allowing planners to identify functional “carbon hubs” based on their network position.
Collectively, this research contributes to the field of Infrastructure Ecology by offering a transferable “topology-guided” optimization strategy. From a policy perspective, the identification of “High-Low” mismatch clusters in northern regions offers a concrete decision-making tool: rather than uniform greening, authorities can achieve cost-effective carbon neutrality by prioritizing the “functional retrofitting” of structurally prominent hubs. These findings provide a scientific basis for advancing the “Beautiful Highway” initiative and zero-carbon transportation goals in Shandong Province. Ultimately, this framework offers a scalable solution for decarbonizing global transportation arteries, supporting international efforts to mitigate climate change and advancing the United Nations’ Sustainable Development Goals for resilient infrastructure.

Author Contributions

Conceptualization, Z.W. and J.H.; methodology, Z.W., J.H. and Q.S.; software, Z.W., Y.Z. and Q.S.; validation, Z.W., J.H. and X.L.; formal analysis, Z.W.; investigation, Z.W. and Y.Z.; resources, J.H. and X.L.; data curation, Z.W.; writing—original draft preparation, Z.W. and Y.Z.; writing—review and editing, J.H. and X.L.; visualization, Z.W. and Y.Z.; supervision, J.H.; project administration, J.H.; funding acquisition, J.H. All authors have read and agreed to the published version of the manuscript.

Funding

This research was funded by Science and Technology Program of Transportation in Shandong Province (No. 2024B66-02).

Institutional Review Board Statement

Not applicable.

Informed Consent Statement

Not applicable.

Data Availability Statement

Data sharing is not applicable to this article as no new data were created.

Acknowledgments

The authors acknowledge the support from Shandong Highway Construction Management Group Co., Ltd. for providing the highway data.

Conflicts of Interest

Authors Zhiwen Wang and Yongfeng Zhao were employed by Shandong High-Speed Infrastructure Construction Co., Ltd.; the remaining authors declare that the research was conducted in the absence of any commercial or financial relationships that could be construed as a potential conflict of interest.

References

  1. Intergovernmental Panel On Climate Change (IPCC). Climate Change 2021—The Physical Science Basis: Working Group I Contribution to the Sixth Assessment Report of the Intergovernmental Panel on Climate Change, 1st ed.; Cambridge University Press: Cambridge, UK, 2023; ISBN 978-1-009-15789-6. [Google Scholar]
  2. Zhan, J.; Wang, C.; Wang, H.; Zhang, F.; Li, Z. Pathways to Achieve Carbon Emission Peak and Carbon Neutrality by 2060: A Case Study in the Beijing-Tianjin-Hebei Region, China. Renew. Sustain. Energy Rev. 2024, 189, 113955. [Google Scholar] [CrossRef]
  3. Li, W.; Li, H.; Zhang, H.; Sun, S. The Analysis of CO2 Emissions and Reduction Potential in China’s Transport Sector. Math. Probl. Eng. 2016, 2016, 1043717. [Google Scholar] [CrossRef]
  4. Zhu, C.; Fan, W.; Wu, X.; Zhang, Z.; Chen, Y. Spatial mismatch and the attribution analysis of carbon storage demand and supply in the Yangtze River Economic Belt, China. J. Clean. Prod. 2024, 434, 140036. [Google Scholar] [CrossRef]
  5. Li, X.; Fan, Y.; Wu, L. CO2 Emissions and Expansion of Railway, Road, Airline and in-Land Waterway Networks over the 1985–2013 Period in China: A Time Series Analysis. Transp. Res. Part D Transp. Environ. 2017, 57, 130–140. [Google Scholar] [CrossRef]
  6. Dong, Y.; Xu, J.; Liu, X.; Gao, C.; Ru, H.; Duan, Z. Carbon Emissions and Expressway Traffic Flow Patterns in China. Sustainability 2019, 11, 2824. [Google Scholar] [CrossRef]
  7. Fu, D.; Bu, B.; Wu, J.; Singh, R.P. Investigation on the Carbon Sequestration Capacity of Vegetation along a Heavy Traffic Load Expressway. J. Environ. Manag. 2019, 241, 549–557. [Google Scholar] [CrossRef]
  8. Li, L.; Zayiti, A.; He, X. Evaluating the Stand Structure, Carbon Sequestration, Oxygen Release Function, and Carbon Sink Value of Three Artificial Shrubs alongside the Tarim Desert Highway. Forests 2023, 14, 2137. [Google Scholar] [CrossRef]
  9. Jin, S.; Zhang, E.; Guo, H.; Hu, C.; Zhang, Y.; Yan, D. Comprehensive Evaluation of Carbon Sequestration Potential of Landscape Tree Species and Its Influencing Factors Analysis: Implications for Urban Green Space Management. Carbon Balance Manag. 2023, 18, 17. [Google Scholar] [CrossRef] [PubMed]
  10. Ge, X.; Zhang, J.; Wen, Y.; Yu, Q.; Liu, M.; Huang, Y.; Zhang, S.; Duan, L. Carbon Sequestration Potential of Biomass Production along Highways in China. Environ. Sci. Technol. 2023, 57, 13818–13827. [Google Scholar] [CrossRef]
  11. Pi, C.; Shu, A.; Rubinato, M.; Zhang, Z.; Zhang, X.; Xiao, Y.; Helmer, C. Optimizing Vegetation Plantation for Carbon Sequestration and Water Consumption: A Case Study on the Beijing-Shanghai Expressway; Research Square: Durham, NC, USA, 2024. [Google Scholar] [CrossRef]
  12. Zhang, Y.; Cao, Y.; Huang, Y.; Wu, J. Integrating Ecosystem Services and Complex Network Theory to Construct and Optimize Ecological Security Patterns: A Case Study of Guangdong-Hong Kong-Macao Greater Bay Area, China. Environ. Sci. Pollut. Res. 2023, 30, 76891–76910. [Google Scholar] [CrossRef]
  13. Xu, C.; Chen, X.; Yu, Q.; Avirmed, B.; Zhao, J.; Liu, W.; Sun, W. Relationship between Ecological Spatial Network and Vegetation Carbon Use Efficiency in the Yellow River Basin, China. GISci. Remote Sens. 2024, 61, 2318070. [Google Scholar] [CrossRef]
  14. Li, M.; Yu, Q.; Xu, C.; Zhao, J.; Zeng, Y.; Wang, Y.; Liu, Y. Research on the Carbon Sequestration Capacity of Forest Ecological Network Topological Features and Network Optimization Based on Modification Recognition in the Yellow River Basin Mining Area: A Case Study of Jincheng City. Remote Sens. 2024, 16, 1986. [Google Scholar] [CrossRef]
  15. Jiang, H.; Peng, J.; Liu, M.; Dong, J.; Ma, C. Integrating Patch Stability and Network Connectivity to Optimize Ecological Security Pattern. Landsc. Ecol. 2024, 39, 54. [Google Scholar] [CrossRef]
  16. Zhao, J.; Li, Z.; Wu, J.; Xu, Z.; Jia, B. Ecological Spatial Network Optimization of Carbon Sink Patches for Enhanced Carbon Sink in Wuhan Metropolitan Area, China. Ecol. Indic. 2024, 165, 112177. [Google Scholar] [CrossRef]
  17. Ouédraogo, D.-Y.; Villemey, A.; Vanpeene, S.; Coulon, A.; Azambourg, V.; Hulard, M.; Guinard, E.; Bertheau, Y.; Flamerie De Lachapelle, F.; Rauel, V.; et al. Can Linear Transportation Infrastructure Verges Constitute a Habitat and/or a Corridor for Vertebrates in Temperate Ecosystems? A Systematic Review. Environ. Evid. 2020, 9, 13. [Google Scholar] [CrossRef]
  18. Wang, Y.; Qu, J.; Han, Y.; Du, L.; Wang, M.; Yang, Y.; Cao, G.; Tao, S.; Kong, Y. Impacts of Linear Transport Infrastructure on Terrestrial Vertebrate Species and Conservation in China. Glob. Ecol. Conserv. 2022, 38, e02207. [Google Scholar] [CrossRef]
  19. Sun, Z.Y.; Zhu, X. Balancing integrated green-grey infrastructure shapes carbon emissions in village-town clusters. iScience 2025, 28, 113902. [Google Scholar] [CrossRef] [PubMed]
  20. Liu, J.; Li, B.; Ma, M. Spatiotemporal Variation and Causes of Typical Extreme Precipitation Events in Shandong Province over the Last 50 Years. Remote Sens. 2024, 16, 1283. [Google Scholar] [CrossRef]
  21. Xing, W.; Guo, B.; Sheng, Y.; Yang, X.; Ji, M.; Xu, Y. Tracing Surface Water Change from 1990 to 2020 in China’s Shandong Province Using Landsat Series Images. Ecol. Indic. 2022, 140, 108993. [Google Scholar] [CrossRef]
  22. Mao, J. Research on Classification of Expressway Service Area Based on K-Means Algorithm. OJTT 2024, 13, 73–80. [Google Scholar] [CrossRef]
  23. Wang, C.; Ding, X.; Wang, C.; Lv, M.; Xu, R.; Bi, Y.; Huang, Z. Expressway Usage Pattern Analysis Based on Tollgate Data: A Case Study of the Shandong Province, China. J. Adv. Transp. 2023, 2023, 2910454. [Google Scholar] [CrossRef]
  24. Liu, G.; Huo, Z.; Wan, H.; Zucaro, A.; Fiorentino, G.; Lu, Y.; Yang, Q. Evaluation of Carbon Sink and Photovoltaic System Carbon Reduction along Roadside Space. J. Clean. Prod. 2024, 477, 143812. [Google Scholar] [CrossRef]
  25. Lv, Z.; Shang, W. Impacts of Intelligent Transportation Systems on Energy Conservation and Emission Reduction of Transport Systems: A Comprehensive Review. Green Technol. Sustain. 2023, 1, 100002. [Google Scholar] [CrossRef]
  26. Zhang, L.; Zhao, M.; Zhao, X.; Huang, B.; Zhou, Z.; Yang, T. Application of Multiple Solid Wastes as Subgrade Material in Expressway Subgrade: Field Test, Microcosmic Mechanism and Sustainability. Mater. Today Sustain. 2025, 32, 101247. [Google Scholar] [CrossRef]
  27. Peng, S.; Ding, Y.; Liu, W.; Li, Z. 1 Km Monthly Temperature and Precipitation Dataset for China from 1901 to 2017. Earth Syst. Sci. Data 2019, 11, 1931–1946. [Google Scholar] [CrossRef]
  28. Shouzhang, P. 1-Km Monthly Mean Temperature Dataset for China (1901–2024); National Tibetan Plateau Data Center: Beijing, China, 2025. [Google Scholar]
  29. Gao, J.; Shi, Y.; Zhang, H.; Chen, X.; Zhang, W.; Shen, W.; Xiao, T.; Zhang, Y. China Regional 250 m Normalized Difference Vegetation Index Data Set (2000–2024); National Tibetan Plateau Data Center: Beijing, China, 2025. [Google Scholar]
  30. Abatzoglou, J.T.; Dobrowski, S.Z.; Parks, S.A.; Hegewisch, K.C. TerraClimate, a High-Resolution Global Dataset of Monthly Climate and Climatic Water Balance from 1958–2015. Sci. Data 2018, 5, 170191. [Google Scholar] [CrossRef]
  31. Yang, J.; Huang, X. The 30 m Annual Land Cover Dataset and Its Dynamics in China from 1990 to 2019. Earth Syst. Sci. Data 2021, 13, 3907–3925. [Google Scholar] [CrossRef]
  32. Elvidge, C.D.; Zhizhin, M.; Ghosh, T.; Hsu, F.-C.; Taneja, J. Annual Time Series of Global VIIRS Nighttime Lights Derived from Monthly Averages: 2012 to 2019. Remote Sens. 2021, 13, 922. [Google Scholar] [CrossRef]
  33. Farr, T.G.; Rosen, P.A.; Caro, E.; Crippen, R.; Duren, R.; Hensley, S.; Kobrick, M.; Paller, M.; Rodriguez, E.; Roth, L.; et al. The Shuttle Radar Topography Mission. Rev. Geophys. 2007, 45, 2005RG000183. [Google Scholar] [CrossRef]
  34. Zhu, W.; Pan, Y.; He, H. Simulation of maximum light use efficiency for different vegetation types in China. Chin. Sci. Bull. 2006, 51, 457–463. [Google Scholar] [CrossRef]
  35. Li, M.; Liang, L.; Huang, Z.; Song, H.; Wang, S.; Wang, Q.; Sun, Y. Spatiotemporal dynamics and driving factors of net primary productivity in Asian terrestrial ecosystems. Ecol. Model. 2025, 514, 111322. [Google Scholar] [CrossRef]
  36. Ye, Y.; Su, Y.; Zhang, H.; Liu, K.; Wu, Q. Construction of an Ecological Resistance Surface Model and Its Application in Urban Expansion Simulations. J. Geogr. Sci. 2015, 25, 211–224. [Google Scholar] [CrossRef]
  37. Cao, C.; Luo, Y.; Xu, L.; Xi, Y.; Zhou, Y. Construction of Ecological Security Pattern Based on InVEST-Conefor-MCRM: A Case Study of Xinjiang, China. Ecol. Indic. 2024, 159, 111647. [Google Scholar] [CrossRef]
  38. Newman, M.E.J. Analysis of Weighted Networks. Phys. Rev. E 2004, 70, 056131. [Google Scholar] [CrossRef] [PubMed]
  39. Opsahl, T.; Agneessens, F.; Skvoretz, J. Node Centrality in Weighted Networks: Generalizing Degree and Shortest Paths. Soc. Netw. 2010, 32, 245–251. [Google Scholar] [CrossRef]
  40. Newman, M. Networks; Oxford University Press: Oxford, UK, 2010; ISBN 978-0-19-920665-0. [Google Scholar]
  41. Barrat, A.; Barthélemy, M.; Pastor-Satorras, R.; Vespignani, A. The Architecture of Complex Weighted Networks. Proc. Natl. Acad. Sci. USA 2004, 101, 3747–3752. [Google Scholar] [CrossRef]
  42. Brandes, U. A Faster Algorithm for Betweenness Centrality. J. Math. Sociol. 2001, 25, 163–177. [Google Scholar] [CrossRef]
  43. Bonacich, P. Power and Centrality: A Family of Measures. Am. J. Sociol. 1987, 92, 1170–1182. [Google Scholar] [CrossRef]
  44. Brin, S.; Page, L. The Anatomy of a Large-Scale Hypertextual Web Search Engine. Comput. Netw. ISDN Syst. 1998, 30, 107–117. [Google Scholar] [CrossRef]
  45. Xing, W.; Ghorbani, A. Weighted PageRank Algorithm. In Proceedings of the Second Annual Conference on Communication Networks and Services Research, Fredericton, NB, Canada, 21–21 May 2004; IEEE: Fredericton, NB, Canada, 2004; pp. 305–314. [Google Scholar]
  46. Potter, C.S.; Randerson, J.T.; Field, C.B.; Matson, P.A.; Vitousek, P.M.; Mooney, H.A.; Klooster, S.A. Terrestrial Ecosystem Production: A Process Model Based on Global Satellite and Surface Data. Glob. Biogeochem. Cycles 1993, 7, 811–841. [Google Scholar] [CrossRef]
  47. Cramer, W.; Kicklighter, D.W.; Bondeau, A.; Moore, B., III; Churkina, G.; Nemry, B.; Ruimy, A.; Schloss, A.L. Comparing Global Models of Terrestrial Net Primary Productivity (NPP): Overview and Key Results. Glob. Chang. Biol. 1999, 5, 1–15. [Google Scholar] [CrossRef]
  48. Running, S.W.; Nemani, R.R.; Heinsch, F.A.; Zhao, M.; Reeves, M.; Hashimoto, H. A Continuous Satellite-Derived Measure of Global Terrestrial Primary Production. BioScience 2004, 54, 547. [Google Scholar] [CrossRef]
  49. Anselin, L. Local Indicators of Spatial Association—LISA. Geogr. Anal. 1995, 27, 93–115. [Google Scholar] [CrossRef]
  50. Stephan, G.E.; Eggers, M.L. Bunge’s Problem in Central Place Theory and Its Generalizations: A Comment. Geogr. Anal. 1985, 17, 257–258. [Google Scholar] [CrossRef]
  51. Anselin, L. Spatial Econometrics: Methods and Models; Studies in Operational Regional Science; Springer: Dordrecht, The Netherlands, 1988; Volume 4, ISBN 978-90-481-8311-1. [Google Scholar]
  52. Getis, A.; Aldstadt, J. Constructing the Spatial Weights Matrix Using a Local Statistic. Geogr. Anal. 2004, 36, 90–104. [Google Scholar] [CrossRef]
  53. Box, G.E.P.; Cox, D.R. An Analysis of Transformations. J. R. Stat. Soc. Ser. B Stat. Methodol. 1964, 26, 211–243. [Google Scholar] [CrossRef]
  54. Anselin, L.; Syabri, I.; Kho, Y. GeoDa: An Introduction to Spatial Data Analysis. Geogr. Anal. 2006, 38, 5–22. [Google Scholar] [CrossRef]
  55. Men, D.; Pan, J. Incorporating Network Topology and Ecosystem Services into the Optimization of Ecological Network: A Case Study of the Yellow River Basin. Sci. Total Environ. 2024, 912, 169004. [Google Scholar] [CrossRef]
  56. Zeng, Y.; Yu, Q.; Wang, X.; Ma, J.; Xu, C.; Qiu, S.; Liu, W.; Wang, F. Research on the Relationship Between the Structure of Forest and Grass Ecological Spaces and Ecological Service Capacity: A Case Study of the Wuding River Basin. Remote Sens. 2023, 15, 2456. [Google Scholar] [CrossRef]
  57. Zeng, Y.; Chen, X.; Yang, Z.; Yu, Q. Study on the Relationship Between Ecological Spatial Network Structure and Regional Carbon Use Efficiency: A Case Study of the Wuding River Basin. Ecol. Indic. 2023, 155, 110909. [Google Scholar] [CrossRef]
  58. Wang, X.; Wang, R.; Yu, Q.; Liu, H.; Liu, W.; Ma, J.; Niu, T.; Yang, L. Study on the Structural Properties of an Ecospatial Network in Inner Mongolia and Its Relationship with NPP. Appl. Sci. 2022, 12, 4872. [Google Scholar] [CrossRef]
  59. Nawaz, T.; Ismail Ansari, M.G.; Avirmed, B.; Zhao, T.; Liu, W.; Lian, J.; Wang, Y.; Liu, Y.; Zhao, J.; Yang, X.; et al. Ecological Network Optimization and Its Correlation with Net Primary Productivity in the Thal Desert: A 20-Year Analysis. Geo-Spat. Inf. Sci. 2025, 1–25. [Google Scholar] [CrossRef]
Figure 1. Overview of the study area.
Sustainability 18 05328 g001
Figure 2. Methodological framework for analyzing the spatial synergy and mismatch between green highway network topology and carbon sequestration function.
Sustainability 18 05328 g002
Figure 3. Spatial distribution maps of various resistance factors.
Sustainability 18 05328 g003
Figure 4. Spatiotemporal distribution map of ecological resistance surface.
Sustainability 18 05328 g004
Figure 5. Spatial distribution map of Shandong province’s green highway network.
Sustainability 18 05328 g005
Figure 6. Statistical and spatial characteristics of node weighted degree in the green highway network. (a) Statistical frequency distribution and empirical power-law trend of node weighted degree; (b) Spatial distribution and kernel density of node weighted degree.
Sustainability 18 05328 g006
Figure 7. Statistical and spatial characteristics of node weighted closeness centrality in the green highway network. (a) Statistical frequency distribution and KDE curve of node weighted closeness centrality; (b) Spatial distribution and kernel density of node weighted closeness centrality.
Sustainability 18 05328 g007
Figure 8. Statistical and spatial characteristics of node weighted clustering coefficient in the green highway network. (a) Statistical frequency distribution and KDE curve of node weighted clustering coefficient; (b) Spatial distribution and kernel density of node weighted clustering coefficient.
Sustainability 18 05328 g008
Figure 9. Statistical and spatial characteristics of node weighted betweenness centrality in the green highway network. (a) Statistical frequency distribution and KDE curve of node weighted betweenness centrality; (b) Spatial distribution and kernel density of node weighted betweenness centrality.
Sustainability 18 05328 g009
Figure 10. Statistical and spatial characteristics of node weighted eigenvector centrality in the green highway network. (a) Statistical frequency distribution and KDE curve of node weighted eigenvector centrality; (b) Spatial distribution and kernel density of node-weighted eigenvector centrality.
Sustainability 18 05328 g010
Figure 11. Statistical and spatial characteristics of node weighted PageRank in the green highway network. (a) Statistical frequency distribution and KDE curve of node weighted PageRank; (b) Spatial distribution and kernel density of node-weighted PageRank.
Sustainability 18 05328 g011
Figure 12. Pearson correlation matrix of the six network centrality metrics. Significance levels are denoted as: *** p < 0.001 .
Sustainability 18 05328 g012
Figure 13. Spatial distribution of NPP in Shandong province.
Sustainability 18 05328 g013
Figure 14. Seasonal variability of NPP at green highway network nodes.
Sustainability 18 05328 g014
Figure 15. Global bivariate Moran’s I and Z-scores representing the spatial coupling between network topological metrics and seasonal/annual NPP. (a) Global bivariate Moran’s I; (b) Z-scores. Significance levels are denoted as: * p < 0.05 , ** p < 0.01 .
Sustainability 18 05328 g015
Figure 16. Bivariate LISA cluster maps. (a) Bivariate LISA cluster maps between weighted closeness centrality and annual NPP; (b) Bivariate LISA cluster maps between weighted degree and annual NPP.
Sustainability 18 05328 g016
Table 1. Classification and Assignment Table of Ecological Resistance Surface Factors.
FactorClassificationResistance Value
Elevation (m)[0, 70.76)1
[70.76, 167.65)3
[167.65, 303.28)5
[303.28, 490.59)7
[490.59, 1524]9
Slope (°)[0, 2.35)1
[2.35, 6.55)3
[6.55, 13.09)5
[13.09, 21.74)7
[21.74, 66.78)9
NDVI[0.49, 0.97)1
[0.41, 0.49)3
[0.31, 0.42)5
[0.11, 0.31)7
[−1, 0.11)9
NTL[0.10, 4.80)1
[4.80, 17.31)3
[17.31, 39.21)5
[39.21, 129.95)7
[129.95, 399.02)9
Land Cover TypeForest, Shrubland, Grassland1
Water Bodies, Wetlands3
Cropland5
Undeveloped Land7
Impermeable Surface9
Disclaimer/Publisher’s Note: The statements, opinions and data contained in all publications are solely those of the individual author(s) and contributor(s) and not of MDPI and/or the editor(s). MDPI and/or the editor(s) disclaim responsibility for any injury to people or property resulting from any ideas, methods, instructions or products referred to in the content.