Article

Research on the Coordinated Development of Natural Resource Utilization and Ecological Resilience in Inland Area

1
College of Mathematical Sciences, Chengdu University of Technology, Chengdu 610059, China
2
Geomathematics Key Laboratory of Sichuan Province, Chengdu University of Technology, Chengdu 610059, China
*
Author to whom correspondence should be addressed.
Sustainability 2026, 18(11), 5277; https://doi.org/10.3390/su18115277
Submission received: 3 March 2026 / Revised: 14 April 2026 / Accepted: 21 May 2026 / Published: 24 May 2026
(This article belongs to the Special Issue Sustainable Utilization of Resources for Environmental Enhancement)

Abstract

China’s inland regions are vital for territorial spatial planning and sustainable development due to their abundant resources. However, the dynamic coordination between natural resource utilization (NRU) and ecological resilience (ER) remains poorly understood. Using panel data from 20 inland provinces in China (2009–2023), this study constructs NRU and ER evaluation systems, with ER assessed through the Pressure–State–Response (PSR) framework. Indicator weights are determined using an AHP–entropy method. Kernel density, panel vector autoregression (P-VAR), and coupling coordination models are applied to examine spatiotemporal evolution patterns, coordination levels, and interaction mechanisms between NRU and ER. The results show that: (1) The NRU index rises overall, peaking around 2020 (0.706), while the intensity of resource development continues to decline. Regional disparities widen, resulting in a spatial pattern of development intensity that was higher in the west and lower in the east. (2) The ER index continues to rise, accelerating at certain stages, and reaches a peak (0.723) between 2018 and 2020. Geographically, the eastern region led the way, with values decreasing in a stepwise manner, and regional disparities showed relatively gradual changes. (3) The degree of coordination between the two continues to improve, evolving from a “low level of dispersion” to a “medium-to-high level of concentration.” This has resulted in a pattern where the eastern region leads, followed by the central and southwestern regions in succession. Specifically, the EC index rose from 0.429 to 0.615, and the CC index rose from 0.384 to 0.533. Eastern and Central China have already reached a medium level of coordination, while Northwest and Southwest China remain primarily at a basic level of coordination. (4) Significant bidirectional dynamic interactions exist between the NRU and ER, with asymmetric pathways. By region, the NE, EC, and NC exhibit greater fluctuations and higher system sensitivity, while the CC experiences more concentrated short-term shocks; the SW and NW exhibit relatively smoother responses and converge more rapidly. Policy implications highlight the need for region-specific coordination strategies, better alignment between resource development and ecological protection, and enhanced cross-regional governance to support sustainable inland development.

1. Introduction

Driven by the United Nations Sustainable Development Goals (SDGs) and the Paris Agreement, the concept of ecological civilization is increasingly a central guiding principle for national development strategies. Achieving a harmonious relationship between the rational utilization of natural resources and the stable functioning of ecosystems is widely recognized as a prerequisite for sustainable development [1,2,3]. Since the beginning of the twenty-first century, global resource consumption expands at an average annual rate of 3.2%, substantially exceeding population growth, while the annual value of global ecosystem services declines by approximately USD 4.7 trillion. This growing imbalance has intensified the conflict between escalating resource demand and ecological conservation. Under traditional extensive development models, unregulated resource exploitation not only accelerates the depletion of renewable resources and the exhaustion of non-renewable reserves, but also induces systemic ecological impacts, triggering global environmental crises such as climate change, biodiversity loss, and land degradation [4,5,6]. Reconciling socioeconomic development needs with the long-term health and stability of ecosystems has therefore emerged as one of the most pressing challenges confronting global sustainability, underscoring the urgent need for new theoretical frameworks and practical pathways.
Ecological resilience theory provides critical theoretical perspectives and analytical tools for addressing this challenge. Holling (1973) introduced “resilience” into ecology based on studies of Canadian boreal forests [7]. He defined it as an ecosystem’s capacity to maintain functional and structural integrity despite external disturbances [7]. Subsequent work by Walker et al. (2004) expanded this notion into the socio-ecological resilience framework, emphasizing adaptive management and transformative capacity [8]. Folke (2006) further refined resilience theory by distinguishing among engineering resilience, ecological resilience, and socio-ecological resilience, thereby establishing a relatively comprehensive conceptual system [9]. In recent years, advances in complex systems theory and sustainability science have continuously enriched the term of ecological resilience, extending it to encompass multiple dimensions such as resistance, recovery, adaptability, and transformation. As a result, ecological resilience has become an increasingly important indicator for assessing ecosystem health and sustainability.
Existing studies conducted extensive, multi-level investigations into both ecological resilience and natural resource utilization. Within the field of ecological resilience, a relatively mature theoretical and methodological framework has gradually formed, with research evolving from early conceptual exploration toward indicator measurement, spatiotemporal pattern analysis, influencing mechanisms, and early-warning assessment [10,11,12,13,14]. Methodologically, the ecological footprint approach provides an intuitive means of characterizing resilience by comparing ecological footprint with carrying capacity, although its outcomes are sensitive to data quality [15,16]. In contrast, comprehensive evaluation approaches based on indicator systems such as the PSR model, the DPSIR framework, and the driver–state–response framework are more widely applied, with the PSR model being particularly favored due to its close alignment with ecosystem dynamic processes. In addition, foreign scholars have developed a range of methodological frameworks for the quantitative assessment of ecological resilience. For instance, some studies employ long-term ecological monitoring data combined with time-series analysis to evaluate ecosystem resilience from perspectives such as recovery capacity following disturbances and thresholds of state transitions [17]. At the structural level of ecosystems, cross-scale resilience models analyze the distribution of functional diversity and functional redundancy across different ecological scales to reveal the capacity of ecosystems to maintain stable states under disturbances [18]. Socio-ecological research utilizes system dynamics and dynamic index models. These models integrate feedback between social, ecological, and governance components to simulate the evolution of system resilience [19]. Analytical techniques including kernel density estimation, Markov chains, and spatial autocorrelation have further enhanced the capacity to reveal the spatiotemporal evolution of ecological resilience [20].
Research on natural resource utilization undergoes, likewise, a transition from single-resource assessment toward integrated, system-based evaluation. Early studies primarily focused on individual resources such as water, land, and minerals, emphasizing static analyses of reserves and exploitation potential [21]. More recently, scholars increasingly adopt a systems perspective to examine the comprehensive utilization efficiency of multiple resources—including water, soil, forests, grasslands, and minerals—by constructing multidimensional and multilevel evaluation frameworks [22,23,24]. Methodologically, efficiency assessment tools such as Data Envelopment Analysis (DEA), Stochastic Frontier Analysis (SFA), and Total Factor Productivity (TFP) measurement are commonly employed, while emerging approaches, including geographic detectors and spatial econometric models, provide valuable insights into spatial heterogeneity and underlying driving mechanisms [14,25]. Meanwhile, foreign scholars incorporate increasingly resource-utilization indices and resource-efficiency evaluation indicators into natural resource-utilization studies to quantitatively analyze resource input–output relationships and resource use efficiency [26]. Furthermore, multi-objective optimization models and integrated resource management frameworks are widely applied in research on the allocation of key resources such as water and energy, improving resource allocation efficiency through scenario simulations and optimized decision-making [5]. Recently, coupled resource models integrate water, energy, land, and climate into a unified framework. These models allow for assessing utilization efficiency and environmental impacts across different policy scenarios [27].
There is no simple linear relationship between natural resource development and ecological resilience; the direction and intensity of their effects vary with changes in the level of development, governance capacity, and ecological carrying capacity. On the one hand, excessive resource development may undermine ecosystem stability and resilience through land-use changes, vegetation destruction, water pollution, and the disruption of ecological processes [28,29,30,31]. On the other hand, when effectively supported by measures such as environmental governance, ecological compensation, and ecological restoration, resource development activities may also be accompanied by improvements in ecological adaptability [25,32,33]. Therefore, rather than making static judgments about the positive or negative ecological impacts of natural resource development, the current focus should be on how these factors evolve and interact across different regions and stages of development, ultimately giving rise to a differentiated pattern of coordination. Based on this, this paper proposes the following research hypothesis: there is an endogenous dynamic interaction between natural resource development and ecological resilience, and the direction and intensity of this interaction will exhibit phased fluctuations and regional heterogeneity depending on the dynamic interplay between development pressures and management responses.
Despite substantial progress, several critical gaps remain in the existing literature. Most studies focus on individual resource categories, with limited efforts devoted to comprehensive assessments that integrate multiple natural resources such as water, soil, forests, grasslands, and minerals. The interactive mechanisms between natural resource utilization and ecological resilience remain insufficiently explored, as the two systems are often examined independently without adequately addressing their coupled and coordinated relationships. Relatively few studies explicitly target the inland area, which is characterized by comparatively weaker economic foundations, abundant resource endowments, and critical ecological functions. This lack of region-specific analysis constrains the development of differentiated theoretical insights and policy guidance.
As a resource-rich zone and a key ecological functional region, China’s inland area occupies a distinctive position within the national development strategy. This area contains more than 60% of the country’s mineral resources and supports essential functions related to water conservation and biodiversity protection, while simultaneously facing the dual pressures of relatively lagging economic development and fragile ecological environments. Against this backdrop, this study focuses on the inland area and constructs a comprehensive natural resource utilization evaluation system alongside an ecological resilience evaluation system based on the PSR framework. By employing kernel density estimation, panel vector autoregression (P-VAR) models, and coupling coordination models, the study systematically examines the spatiotemporal evolution, dynamic interactions, and coupling coordination relationships between the two systems.
The primary contributions of this study are threefold: (1) the development of an integrated theoretical framework for natural resource utilization and ecological resilience in the inland area, elucidating the evolutionary mechanism of “pressure-driven adaptation–coordinated enhancement”; (2) the integration of AHP–entropy weighting with P-VAR dynamic interaction analysis to establish a multidimensional and multiscale analytical framework; and (3) a long-term, large-sample empirical analysis based on panel data from 20 inland provinces spanning 2009–2023, which enhances the robustness of the findings and supports the formulation of differentiated resource development and ecological resilience enhancement strategies tailored to regional conditions.
The structural organization of this study proceeds as follows: Section 2 introduces the study area and data sources, Section 3 delineates the models and methodologies employed, Section 4 presents analytical results, Section 5 discusses the empirical findings, and Section 6 concludes with policy implications and recommendations.

2. Materials

2.1. Study Area

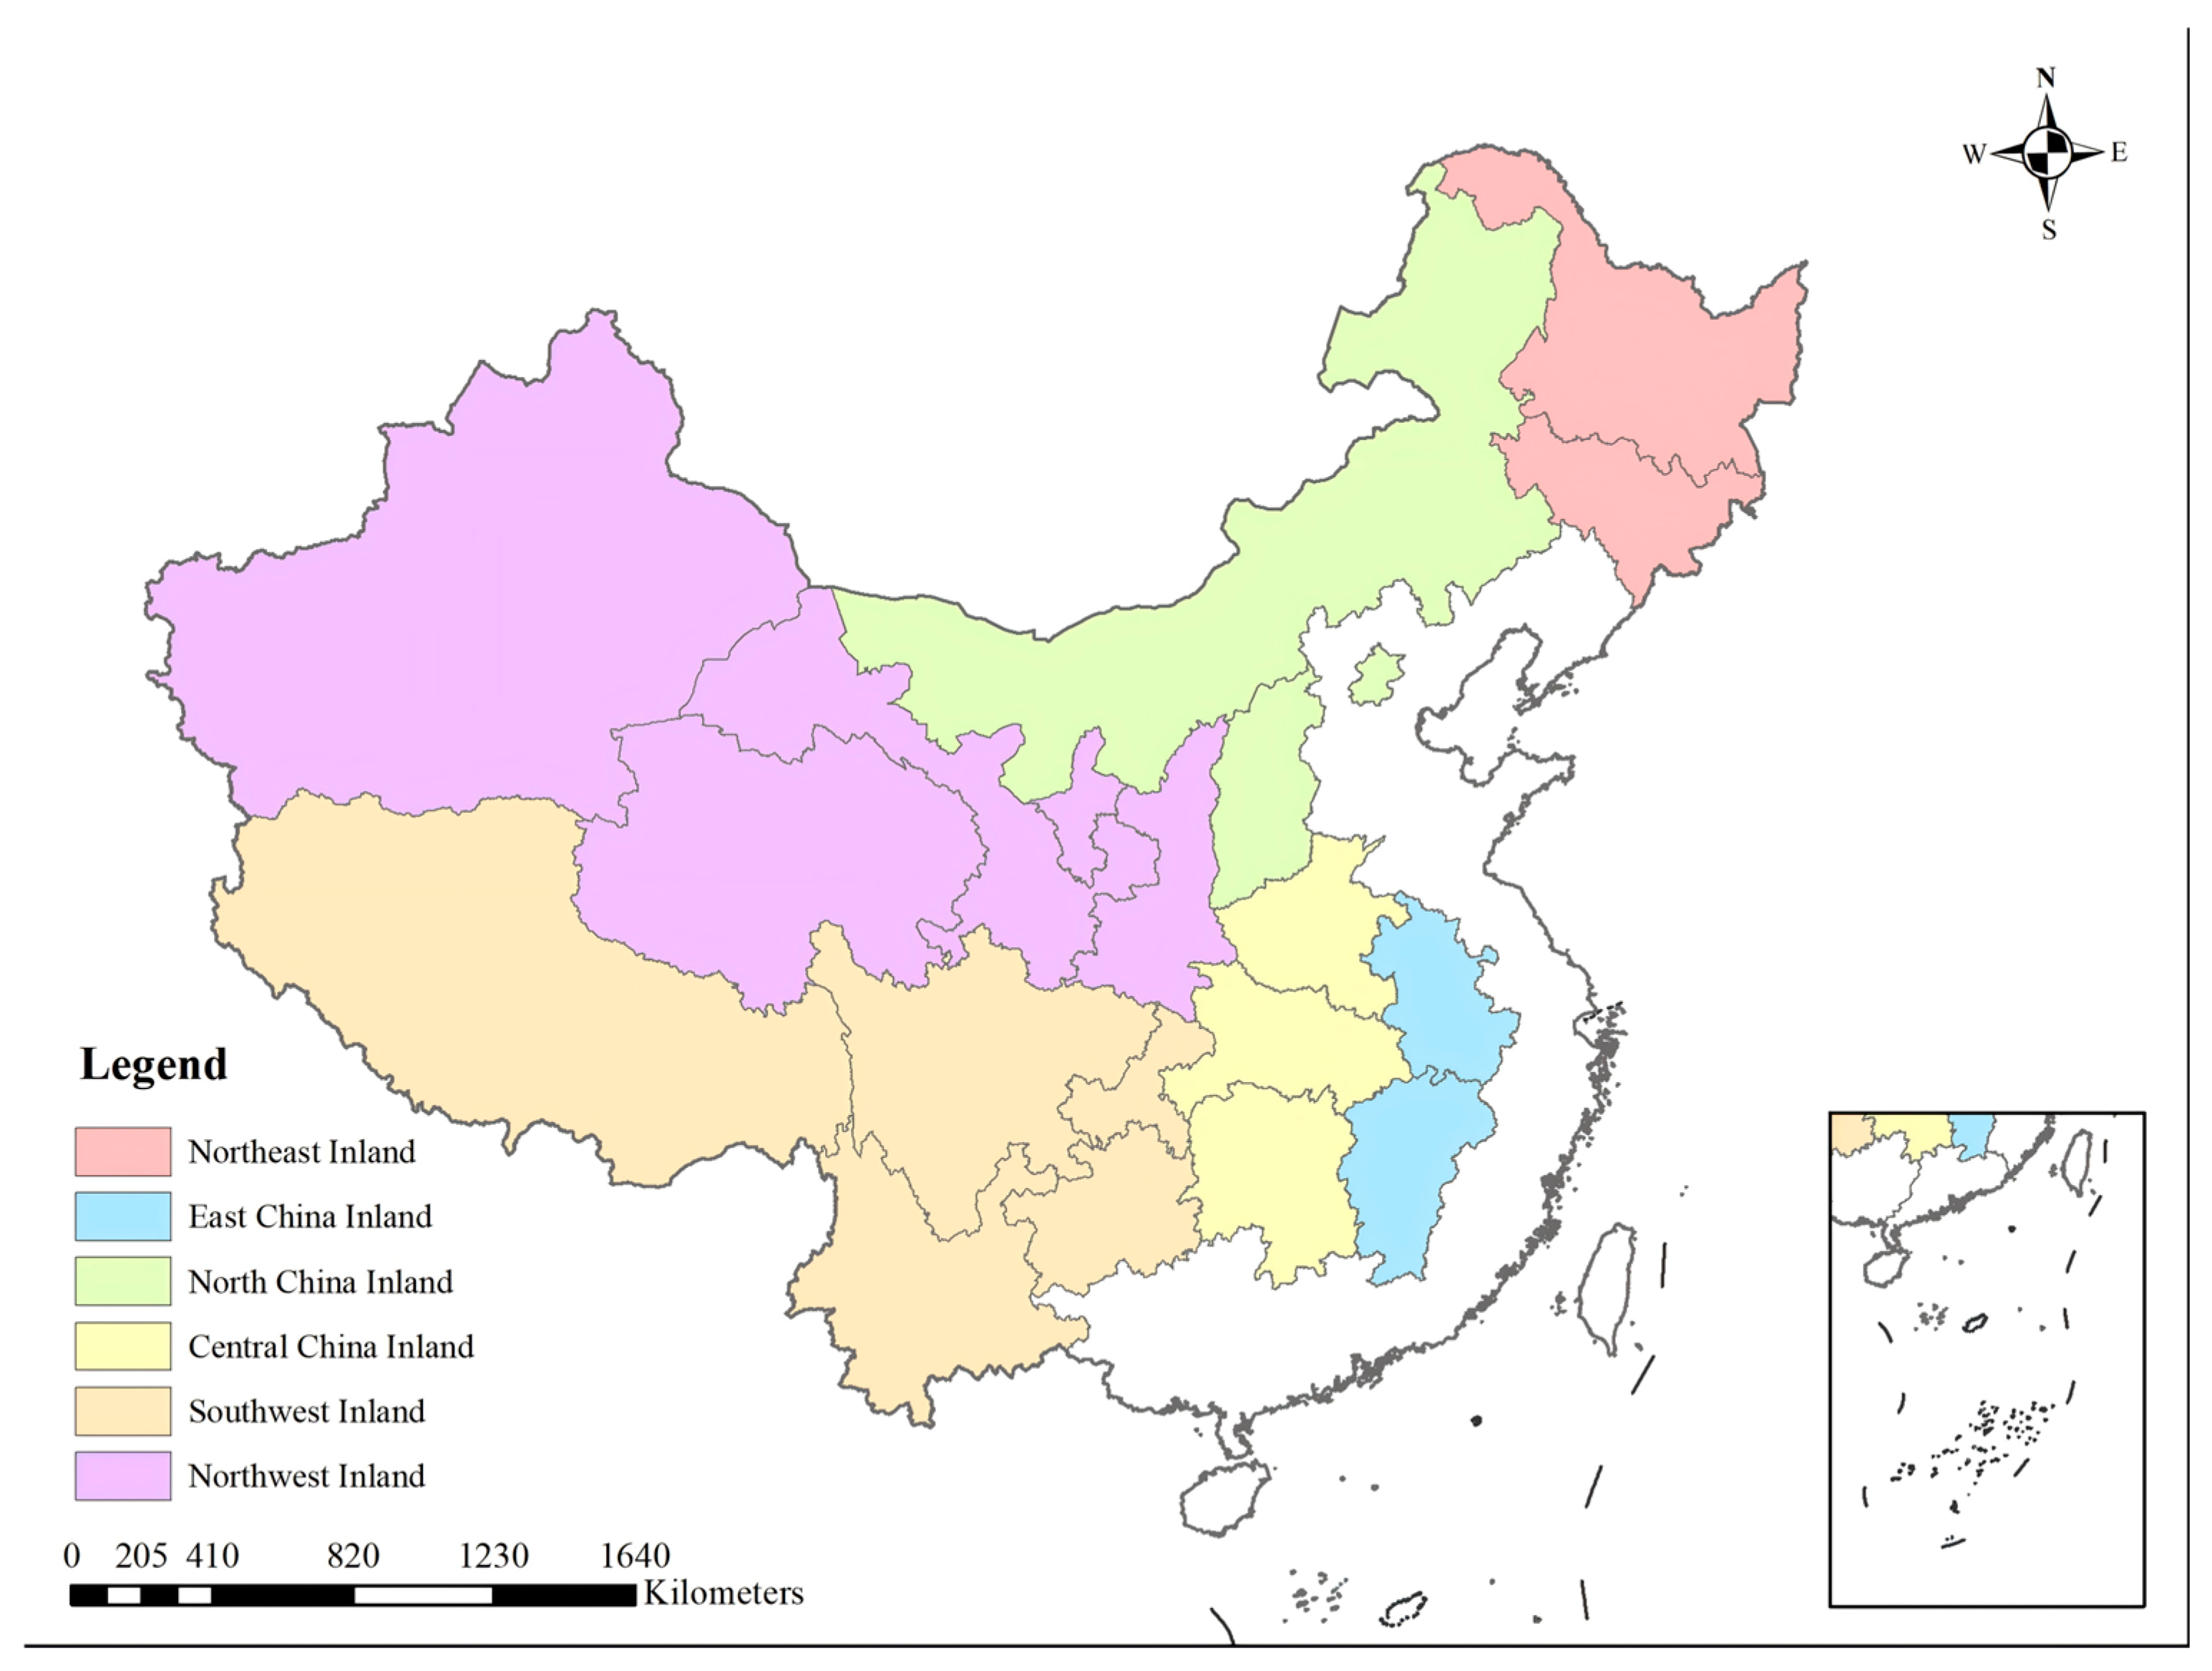
The study area focuses on China’s inland area, which refers to regions within China excluding its coastal zones. According to the China Marine Statistical Yearbook, coastal regions are defined as comprising nine coastal provinces, one autonomous region, and two municipalities directly under the central government, including Liaoning Province, Hebei Province, Tianjin Municipality, Shandong Province, Jiangsu Province, Shanghai Municipality, Zhejiang Province, Fujian Province, Guangdong Province, Hainan Province, and Guangxi Province. The Hong Kong and Macao Special Administrative Regions are also classified as coastal regions. Accordingly, the inland area encompasses 20 provinces, autonomous regions, and municipalities, including Heilongjiang Province, Jilin Province, Beijing Municipality, Henan Province, and the Xinjiang Uygur Autonomous Region. This inland area accounts for approximately 87.6% of China’s total land area and serves as the core spatial entity supporting national resource supply and ecological and environmental functions. Based on regional development levels and geographical characteristics, the inland area is further divided into six major regions, namely Northeast (NE), North China (NC), East China (EC), Central China (CC), Southwest (SW), and Northwest (NW) (Figure 1, Table 1). This classification effectively reflects the differences among regions in terms of resource endowments, locational advantages, and ecological environments and facilitates further analysis of interregional heterogeneity [34].

2.2. Data Sources

The study covers 20 provinces, autonomous regions, and municipalities within China’s inland area, using panel data spanning from 2009 to 2023 as the research basis. Indicators related to natural resource utilization are primarily derived from the China Statistical Yearbook and the China Natural Resources Statistical Yearbook. Ecological resilience indicators are obtained from the China Statistical Yearbook, the China Natural Resources Statistical Yearbook, and the China Environmental Statistical Yearbook. To address missing data, this paper employs linear interpolation and linear extrapolation to impute the missing values. Based on this, a panel unit root test was conducted on the imputed data. The results indicate that all variables passed the test at the 5% significance level, suggesting that the processed data generally satisfy the stationarity requirement, thereby providing a foundation for subsequent model estimation.

3. Methodology

3.1. Logical Relationship Between NRU Systems and ER System

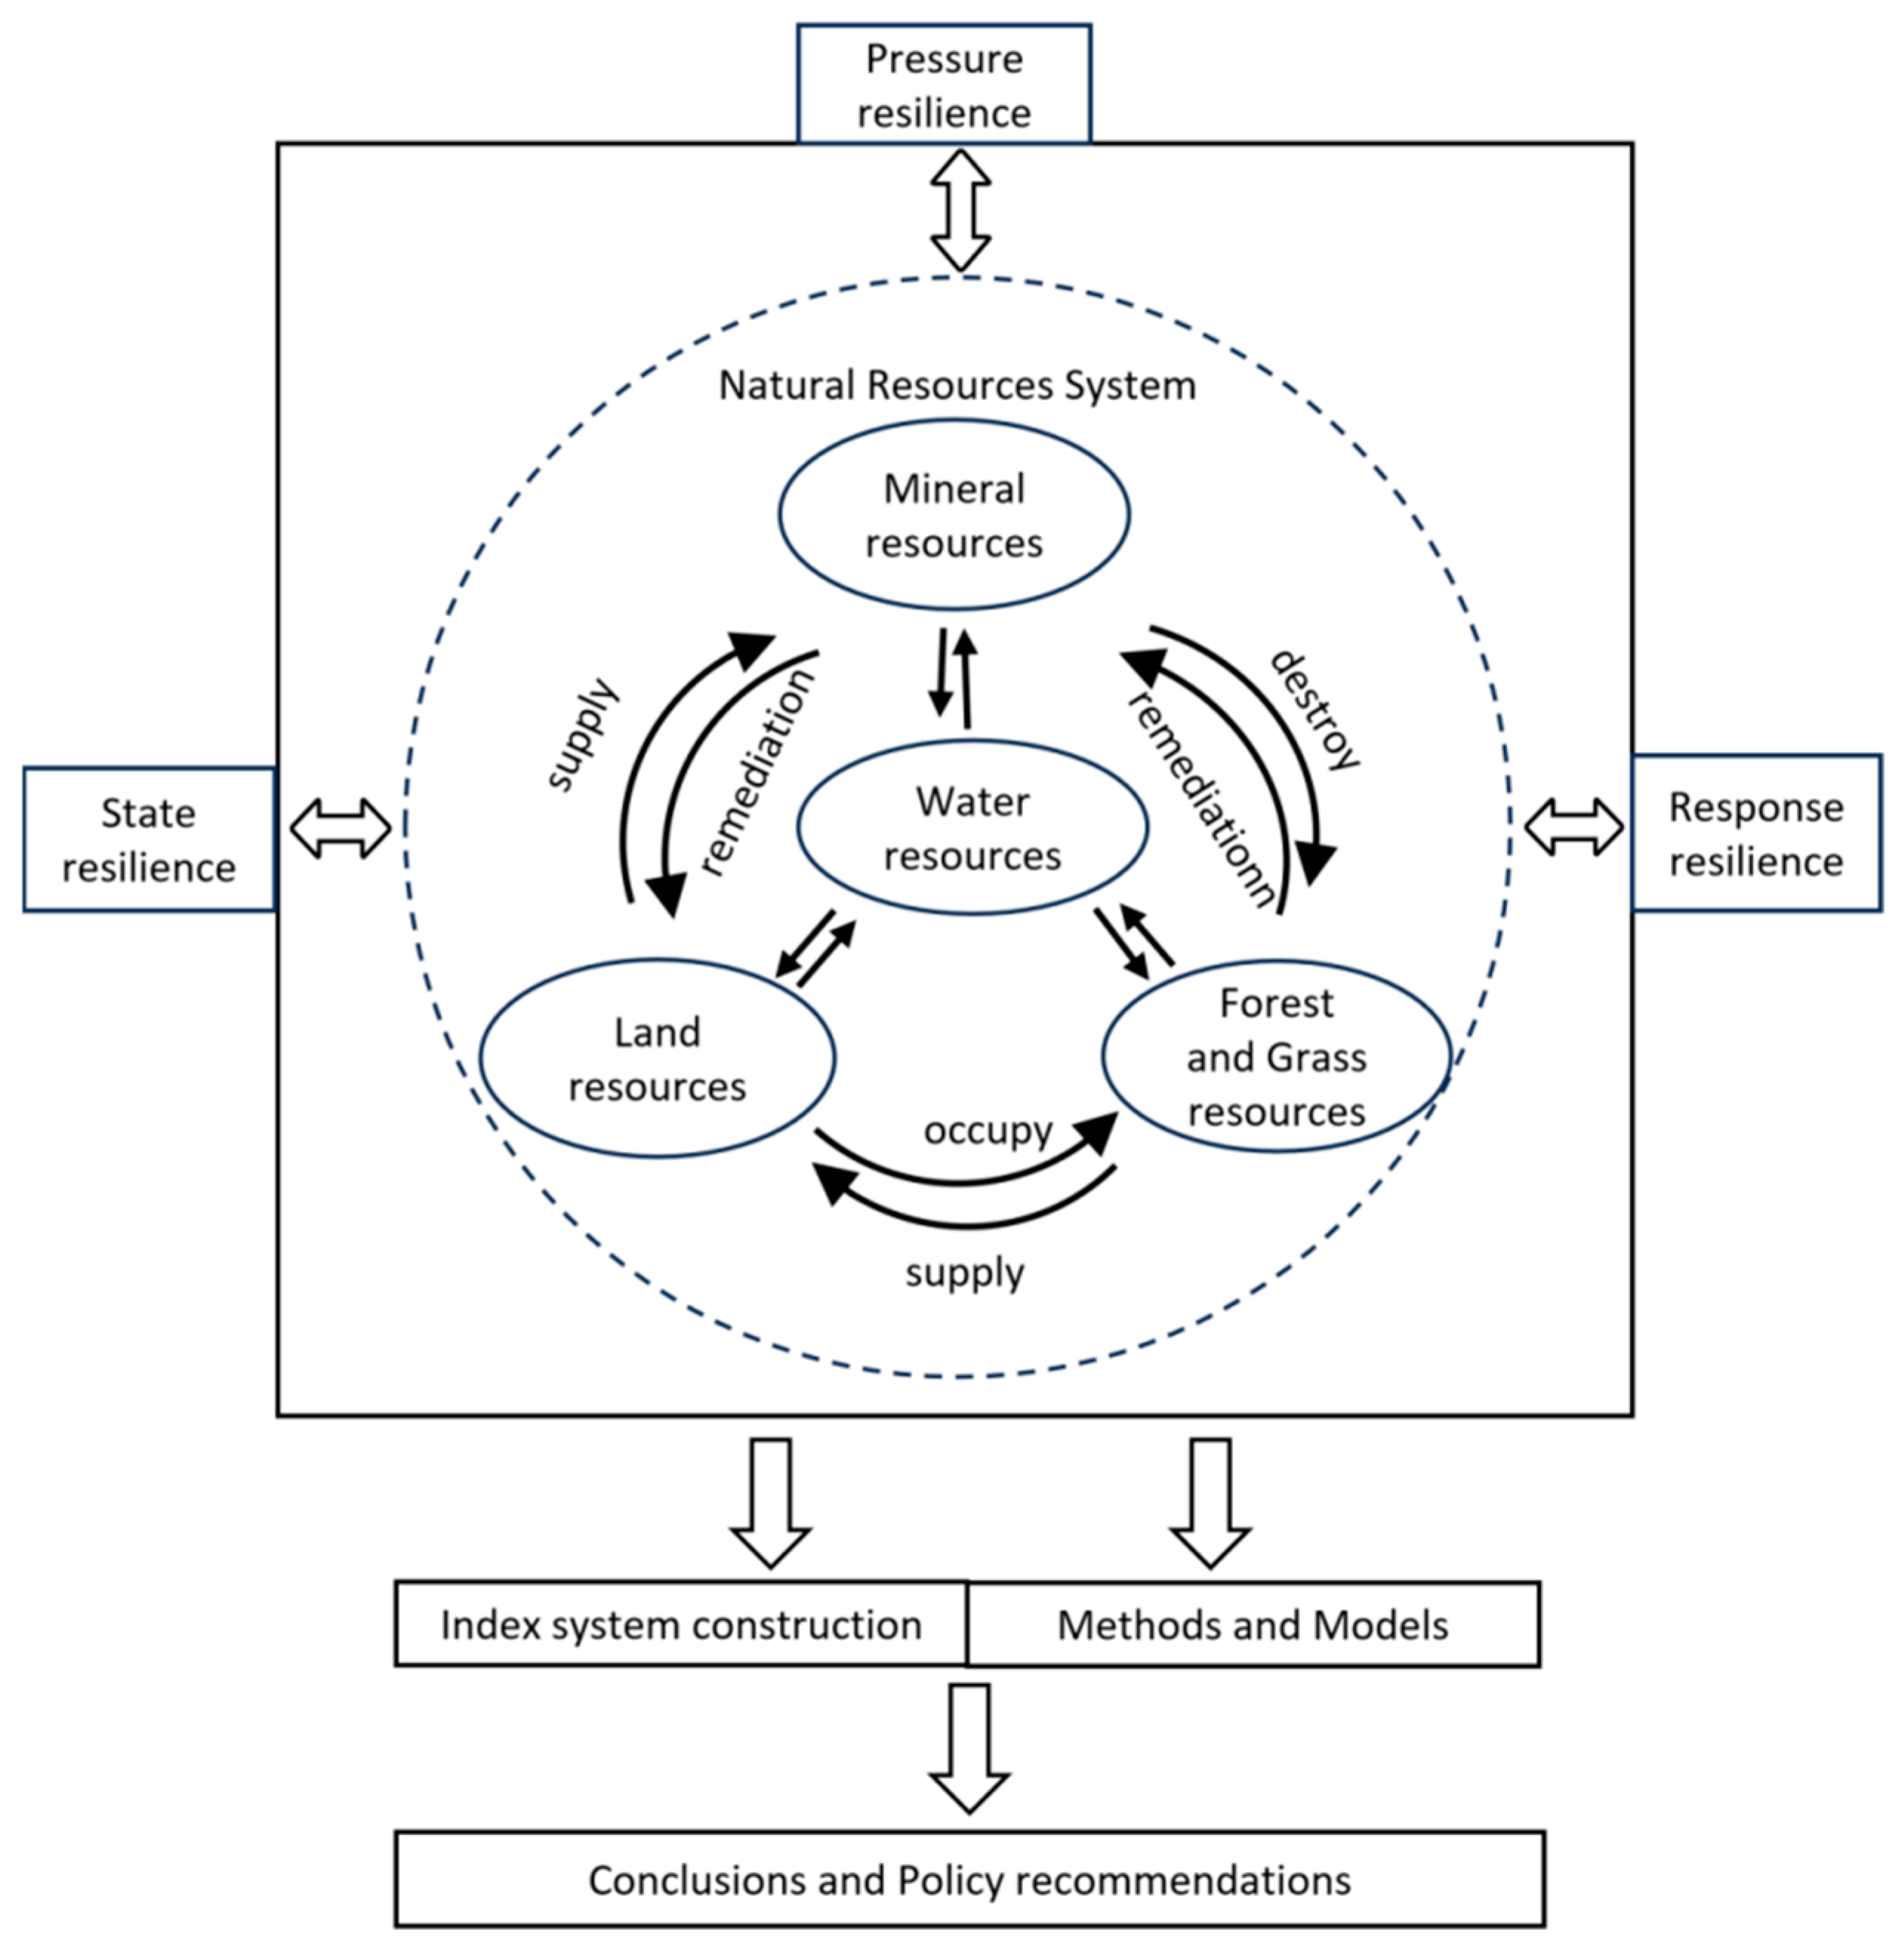
The natural resource utilization (NRU) system is primarily composed of land, mineral, water, forest, and grassland resources, forming a dynamic cycle of resource supply and consumption through human activities such as land reclamation and mineral extraction. This system constitutes a fundamental material basis for socioeconomic development. The ecological resilience (ER) system is constructed within the Pressure–State–Response (PSR) framework and comprises three core criterion layers, namely pressure resilience, state resilience, and response resilience. Through sensing external disturbances, maintaining ecosystem structural integrity, and activating self-regulatory mechanisms, the ER system supports ecosystem stability and long-term sustainability.
The NRU system and the ER system exhibit a complex, interactive, and mutually constraining relationship (Figure 2). Within the NRU system, core resources including minerals, water, land, forests, and grasslands are interlinked, forming an internal transmission mechanism through which development impacts propagate across resource subsystems. The cyclical processes of natural resource utilization interact bidirectionally with the pressure, state, and response dimensions of ecological resilience. When activities such as mineral extraction and land occupation intensify beyond appropriate thresholds, pressure resilience is directly challenged. Simultaneously, the degradation of forest and grassland resources and the inefficient use of water resources weaken state resilience by undermining ecosystem structural stability. As pressure resilience approaches its carrying limit and state resilience declines, constraints are imposed on further resource development. In turn, the self-recovery and adaptive regulation functions embedded in response resilience promote the optimization of the NRU system, facilitating a transition from degradation toward sustainable supply. The coordinated cyclic interaction between the NRU system and the ER system therefore constitutes a fundamental prerequisite for achieving sustainable natural resource utilization and ecological security within the inland area.

3.2. Indicator System Construction of NRU and ER

To more accurately and systematically characterize the dynamic adjustment process of ecological resilience under external disturbances, this study adopts the PSR framework as the basis for constructing the ecological resilience indicator system [13]. Within this framework, stress resilience, state resilience, and response resilience correspond to the pre-impact, impact, and post-impact stages of ecosystem disturbance, respectively. These dimensions are used to capture the ecosystem’s capacities for stress perception, state tolerance, and self-regulation. Drawing on high-frequency indicators widely applied in existing studies [4,35], this study screens and supplements indicators according to scientific validity, data availability, and representativeness. Ultimately, a comprehensive ecological resilience evaluation system is established, consisting of three criterion layers and fourteen indicators with clearly defined positive and negative attributes (Table 2).
Pressure resilience directly influences the level of shocks a system can withstand by characterizing the intensity of external disturbances, such as pollution emissions and resource consumption, thereby determining its resistance. State resilience reflects ecosystem structure and resource endowment, influencing the system’s ability to maintain its functions under disturbances, and corresponds to stability. Response resilience, on the other hand, reflects governance inputs and regulatory measures, influencing the system’s recovery and adjustment processes following disturbances, and thus corresponds to recovery and adaptive capacity. These dimensions do not serve as direct measures of resilience outcomes but rather provide an indirect characterization of ecological resilience by describing its underlying mechanisms [4,13,31].
To address limitations in existing indicator systems for natural resource utilization, this study further enriches the framework by incorporating indicators reflecting energy consumption intensity, mineral resource extraction intensity, grassland grazing intensity, and unit output value of forest land [23,36]. These indicators enhance the ability of the system to capture multidimensional resource utilization characteristics and ensure better alignment with current global sustainable development requirements. The resulting natural resource utilization indicator system provides comprehensive coverage of land, water, energy, mineral, forest, and grassland resources, forming a more integrated basis for subsequent evaluation and analysis (Table 3).
Let x i j denote the j -th evaluation indicator for the i -th region ( i = 1, 2, 3⋯m; j = 1, 2, 3⋯n), and x j denote the j -th evaluation indicator ( j = 1, 2, 3⋯n). To eliminate dimensional differences and ensure comparability among indicators, all variables are standardized according to their respective positive or negative attributes.
Positive indicators:
a i j = x i j min ( x j ) m a x ( x j ) m i n ( x j )
Negative indicators:
a i j = m a x ( x j ) x i j m a x ( x j ) m i n ( x j )
where a i j ( i = 1, 2, 3⋯ m ; j = 1, 2, 3⋯ n ) represents the standardized indicator value for the j -th evaluation criterion of the ith evaluation object; m a x ( x j ) denotes the maximum value of the j -th evaluation criterion; m i n ( x j ) denotes the minimum value of the j -th evaluation criterion.
Based on the standardized indicators and the comprehensive weights obtained through the AHP–entropy weighting method, indices for natural resource utilization, ecological resilience, stress resilience, state resilience, and response resilience are calculated for each region.
I n r = j = 1 n n r s j × a i j ( i = 1 , 2 , 3 , m )
I e r = j = 1 n e r s j × a i j ( i = 1 , 2 , 3 , m )
I p r = j = 1 n p r s j × a i j ( i = 1 , 2 , 3 , m )
I s r = j = 1 n s r s j × a i j ( i = 1 , 2 , 3 , m )
I r r = j = 1 n r r s j × a i j ( i = 1 , 2 , 3 , m )
where s j denotes the composite weight; a i j ( i = 1, 2, 3⋯ m ) represents the standardized indicator value for the j -th evaluation criterion in the i -th region. n n r , n e r , n p r , n s r and n r r denote the numbers of indicators included in the NRU subsystem, the overall ecological resilience subsystem, the pressure resilience subsystem, the state resilience subsystem, and the response resilience subsystem, respectively. I e r denotes the overall ecological resilience index; I p r denotes the pressure resilience index; I s r denotes the state resilience; I r r denotes the response resilience.

3.3. Weight Calculation

Methods for determining indicator weights generally include subjective weighting and objective weighting approaches. Subjective weighting methods, while incorporating expert judgment, may suffer from limited objectivity, whereas objective weighting methods, although data-driven, often fail to adequately reflect the experiential knowledge of experts and may produce weight distributions that deviate from practical conditions [23]. Considering the complementary strengths and limitations of these two approaches, a combined weighting strategy that integrates subjective and objective methods is regarded as more scientific and robust. Specifically, for the subjective weighting component, a decision matrix was constructed based on the principle of equal importance, meaning that each pair of indicators was assigned a value of 1. This resulted in a decision matrix consisting entirely of 1 s, thereby achieving equal weighting. Since this matrix is a fully consistent matrix, the consistency test results meet the requirements. Accordingly, this study adopts a hybrid weighting scheme that linearly combines the Analytic Hierarchy Process (AHP) and the entropy weighting method, expressed as: Combined Weight = 0.5 × AHP + 0.5 × Entropy Weight. In particular, the weighting coefficient of 0.5 was set primarily to account for the combined role of normative judgments and data information in identifying the importance of indicators, thereby achieving a relative balance between subjective perceptions and objective patterns. Sensitivity analysis indicates that when the subjective weight coefficient is adjusted within the range of 0.1–0.9, the overall spatial differentiation patterns of both indices remain essentially unchanged. Only under extreme weight settings do minor changes in the rankings of individual adjacent regions occur, demonstrating that the conclusions of this study possess good robustness.

3.3.1. Entropy-Based Weight Calculation Method

Calculate the characteristic weight p i j for different regions across various indicators:
p i j = a i j i = 1 m a i j
Next, calculate the entropy value e j of the j -th indicator and the indicator weight w j E M :
e j = 1 l n m i = 1 m p i j × l n p i j
w j E M = 1 e j j = 1 n ( 1 e j )
where 1 l n m is a non-negative constant; e j and 1 e j represent information entropy and information utility value, respectively, with 0 e j 1 ; when p i j = 0, p i j × l n p i j = 0; w j ∈ [0, 1], and j = 1 n w j E M = 1 .

3.3.2. Calculating Weights Using the AHP Method

Establish a judgment matrix B = ( b i j ) n × n , where i , j = 1 , 2 , 3 , n , and b i j represents the relative importance between the i -th evaluation criterion and the j -th criterion. Conduct a consistency test on the judgment matrix based on the maximum eigenvalue of matrix B to determine the weights:
w i A H P = W ¯ i j = 1 n W ¯ i
W ¯ i = M i m
M i = j = 1 n b i j
Calculate the weighted matrix.
Combine weights: s j = 0.5 w i A H P + 0.5 w j E M .
Calculate the comprehensive evaluation index:
C I i = j = 1 n s j × a i j ( i = 1 , 2 , 3 , m )
C I i ranges from 0 to 1, with higher values indicating stronger corresponding functionality.

3.4. Methods

3.4.1. Panel Vector Auto Regression Model

The panel vector autoregression (P-VAR) model extends the traditional vector autoregression (VAR) framework originally proposed by Holtz-Eakin by incorporating the advantages of panel data structures. By combining the dynamic analytical strengths of VAR models with cross-sectional and temporal information, the P-VAR model enables a more effective characterization of dynamic interactions among endogenous variables [35,37,38]. In this study, the P-VAR model is employed to quantify the interaction intensity between natural resource exploitation and ecological resilience. The general form of the model is expressed as follows:
P V i t = a 0 + j = 1 k a j P V i t j + α i + β i + ε i t
where P V i t = I n r I e r represents the vector for both natural resource development and utilization and ecological resilience, where P V i t j denotes the j-th-order lag term; i indicates each region, t denotes the year, and j represents the lag order; a 0 is the intercept term, a j is the coefficient vector, α i and β i are the individual fixed and time effect vectors, respectively, and ε i t is the “noise” disturbance.

3.4.2. Coupling Coordination Model

Coupling coordination models are widely employed to examine the interactive and synergistic relationships between two or more systems or factors [13,23]. In this study, ecological resilience and natural resource utilization are treated as two interrelated subsystems that can generate favorable synergistic outcomes through mutual interaction. Let C k ( k = 2009 , 2010 , , 2023 ) denote the coupling degree between the natural resource development and utilization index and the ecological resilience index in year k , T k represent the coordination degree between the two indices, D k denote the coupling coordination degree, and U 1 k and U 2 k denote the natural resource development and utilization index and the ecological resilience index, respectively:
C k = 2 × U 1 k × U 2 k U 1 + U 2
T k = α U 1 k + β U 2 k
D k = C k × T k
where D k value ranges from 0 to 1, with values closer to 1 indicating stronger synergistic promotion between the two systems. α and β represent the natural resource utilization coefficient and ecological resilience coefficient, respectively. Since both ecological resilience and natural resource utilization are indispensable for the sustainable development of inland regions, they are assigned equal values: α = β = 0.5. Based on existing research findings, the coupling coordination degree is categorized into different levels according to its numerical value (Table 4) [14,23]:

4. Results

4.1. Spatiotemporal Evolution of NRU

The NRU index for China’s inland regions from 2009 to 2023 generally exhibits a steady, gradual upward trend throughout the period (Figure 3). Since this index is constructed using negative indicators—meaning that higher values indicate lower resource development intensity—the fact that the index fluctuated slightly within a low range from 2009 to 2015 suggests that resource development intensity was relatively high and remained largely unchanged. After 2016, the index rose gradually, with a particularly noticeable increase from 2018 to 2020, reflecting a gradual reduction in resource exploitation intensity and an optimization of utilization methods. Although the index declined somewhat after reaching a peak of 0.706 in 2020, it remained at a relatively high level overall, indicating that the intensity of resource development and utilization is generally easing.
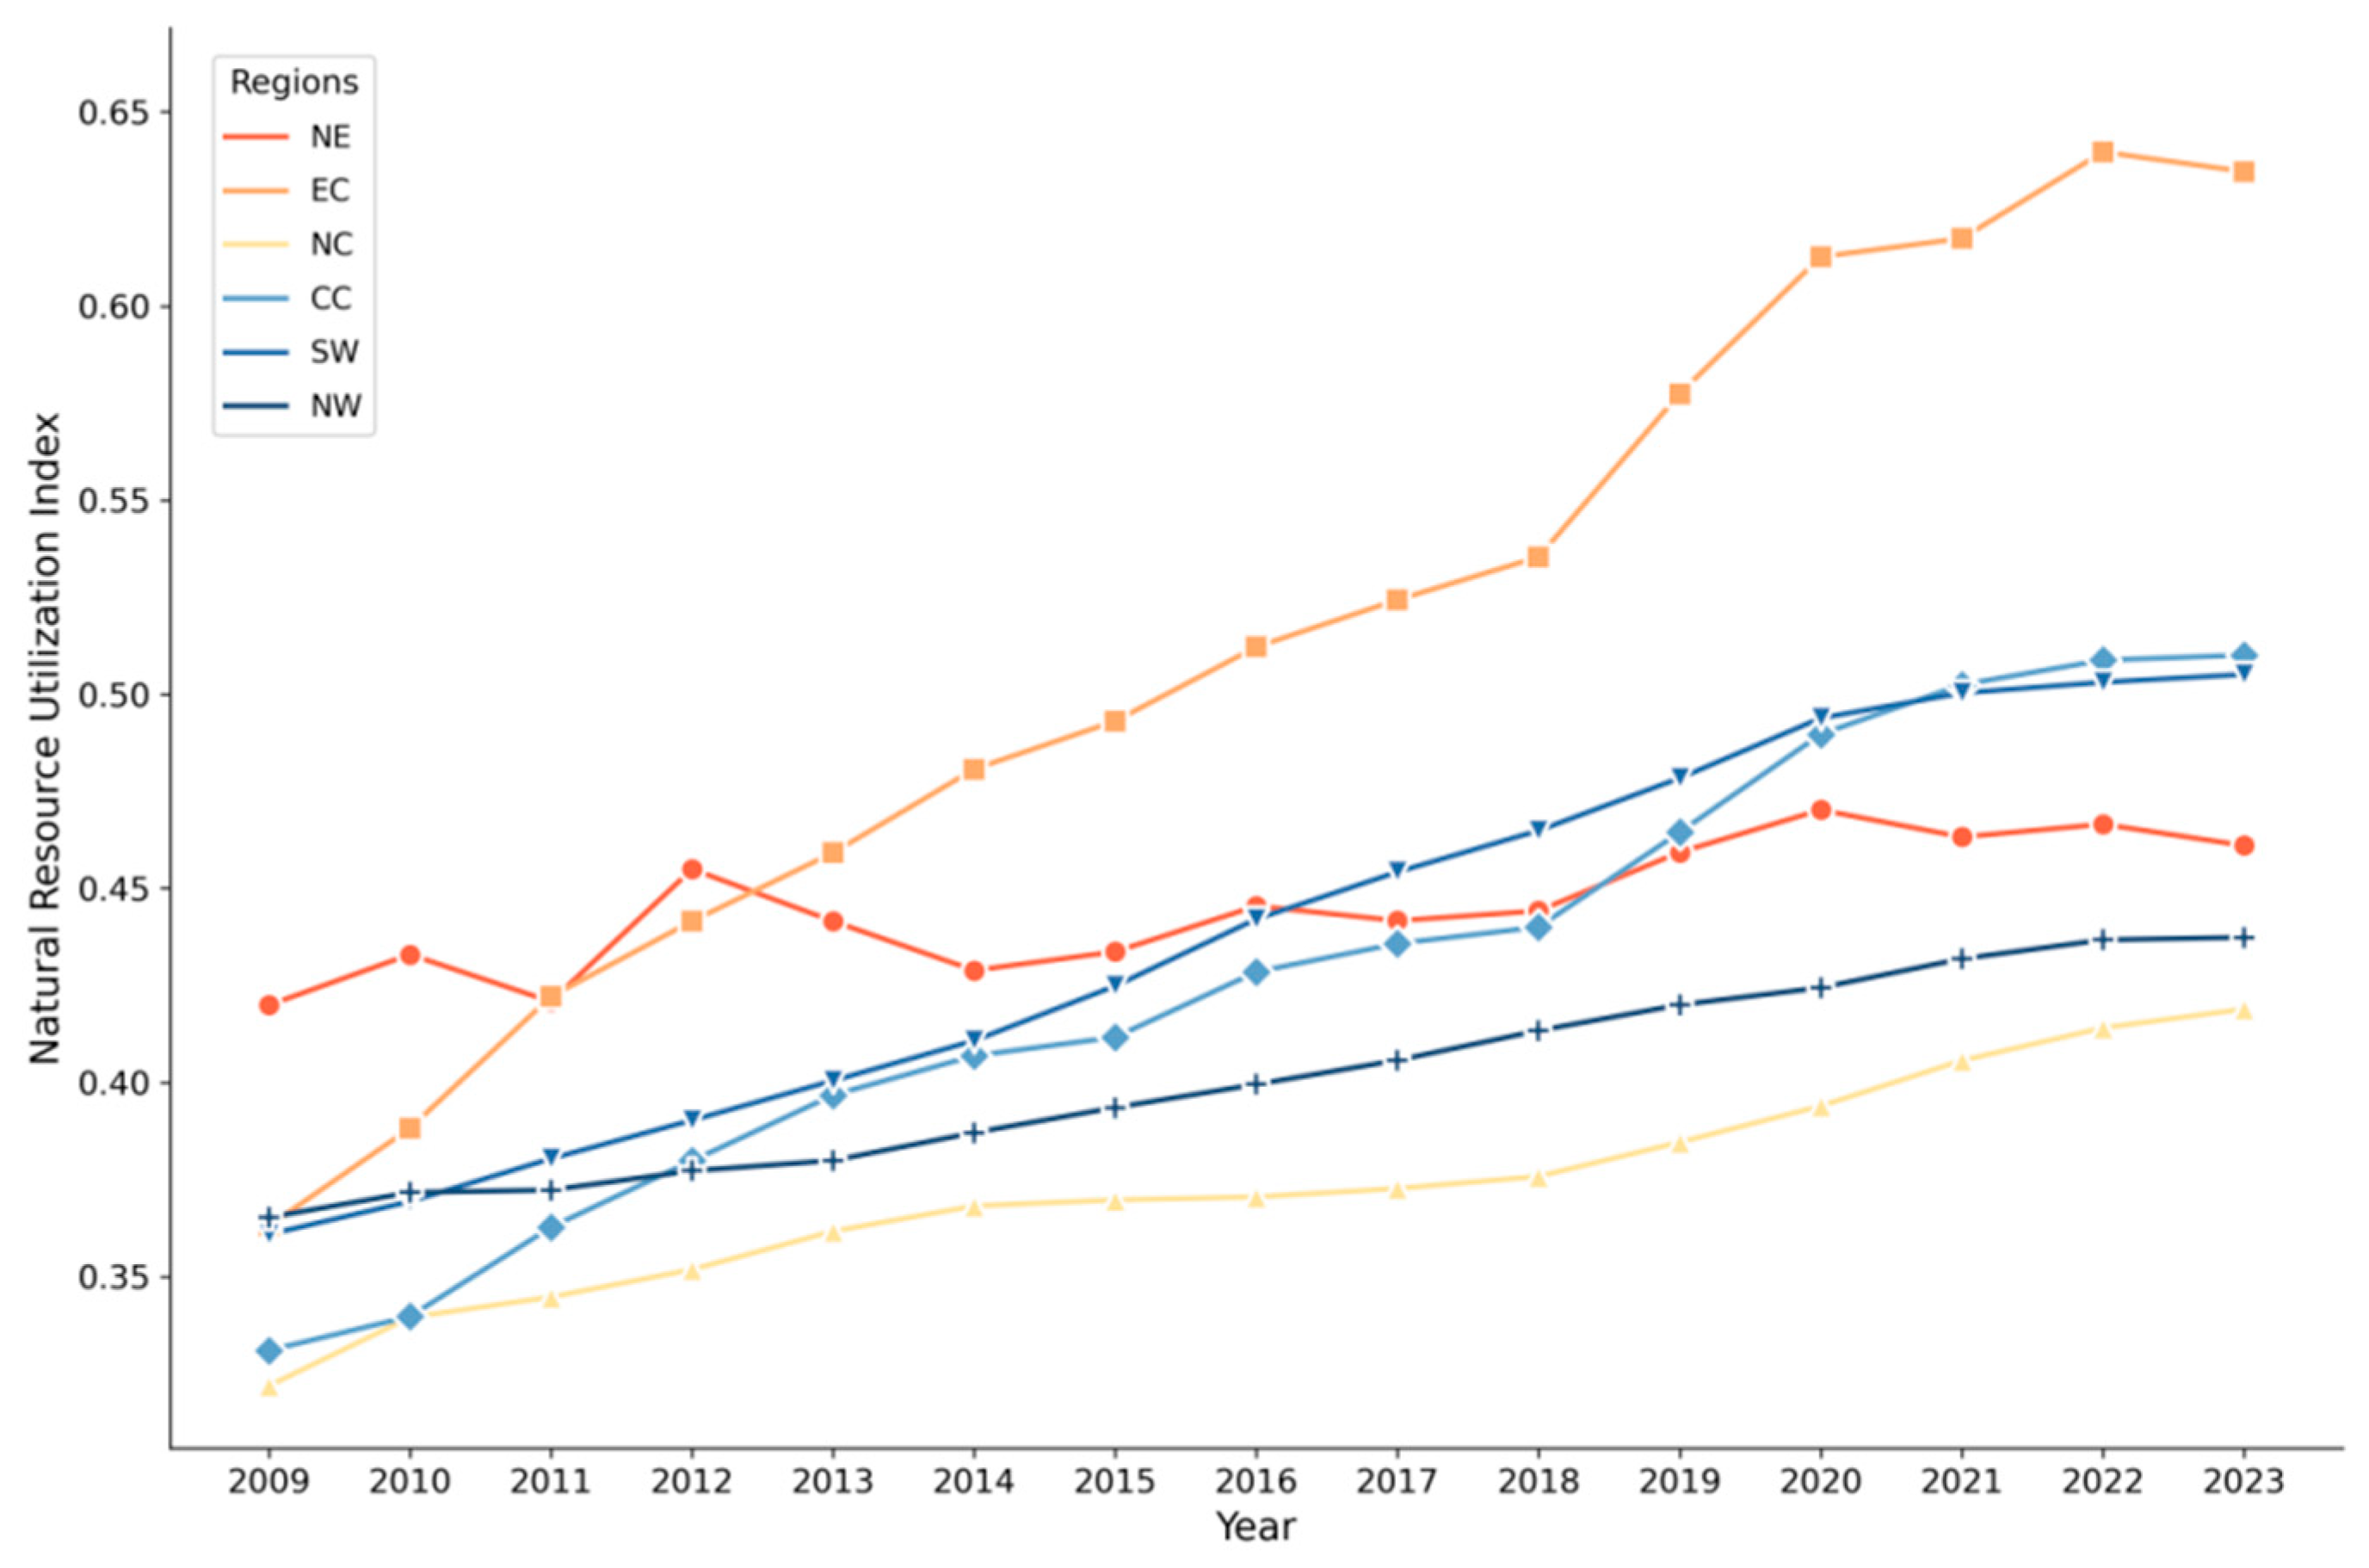
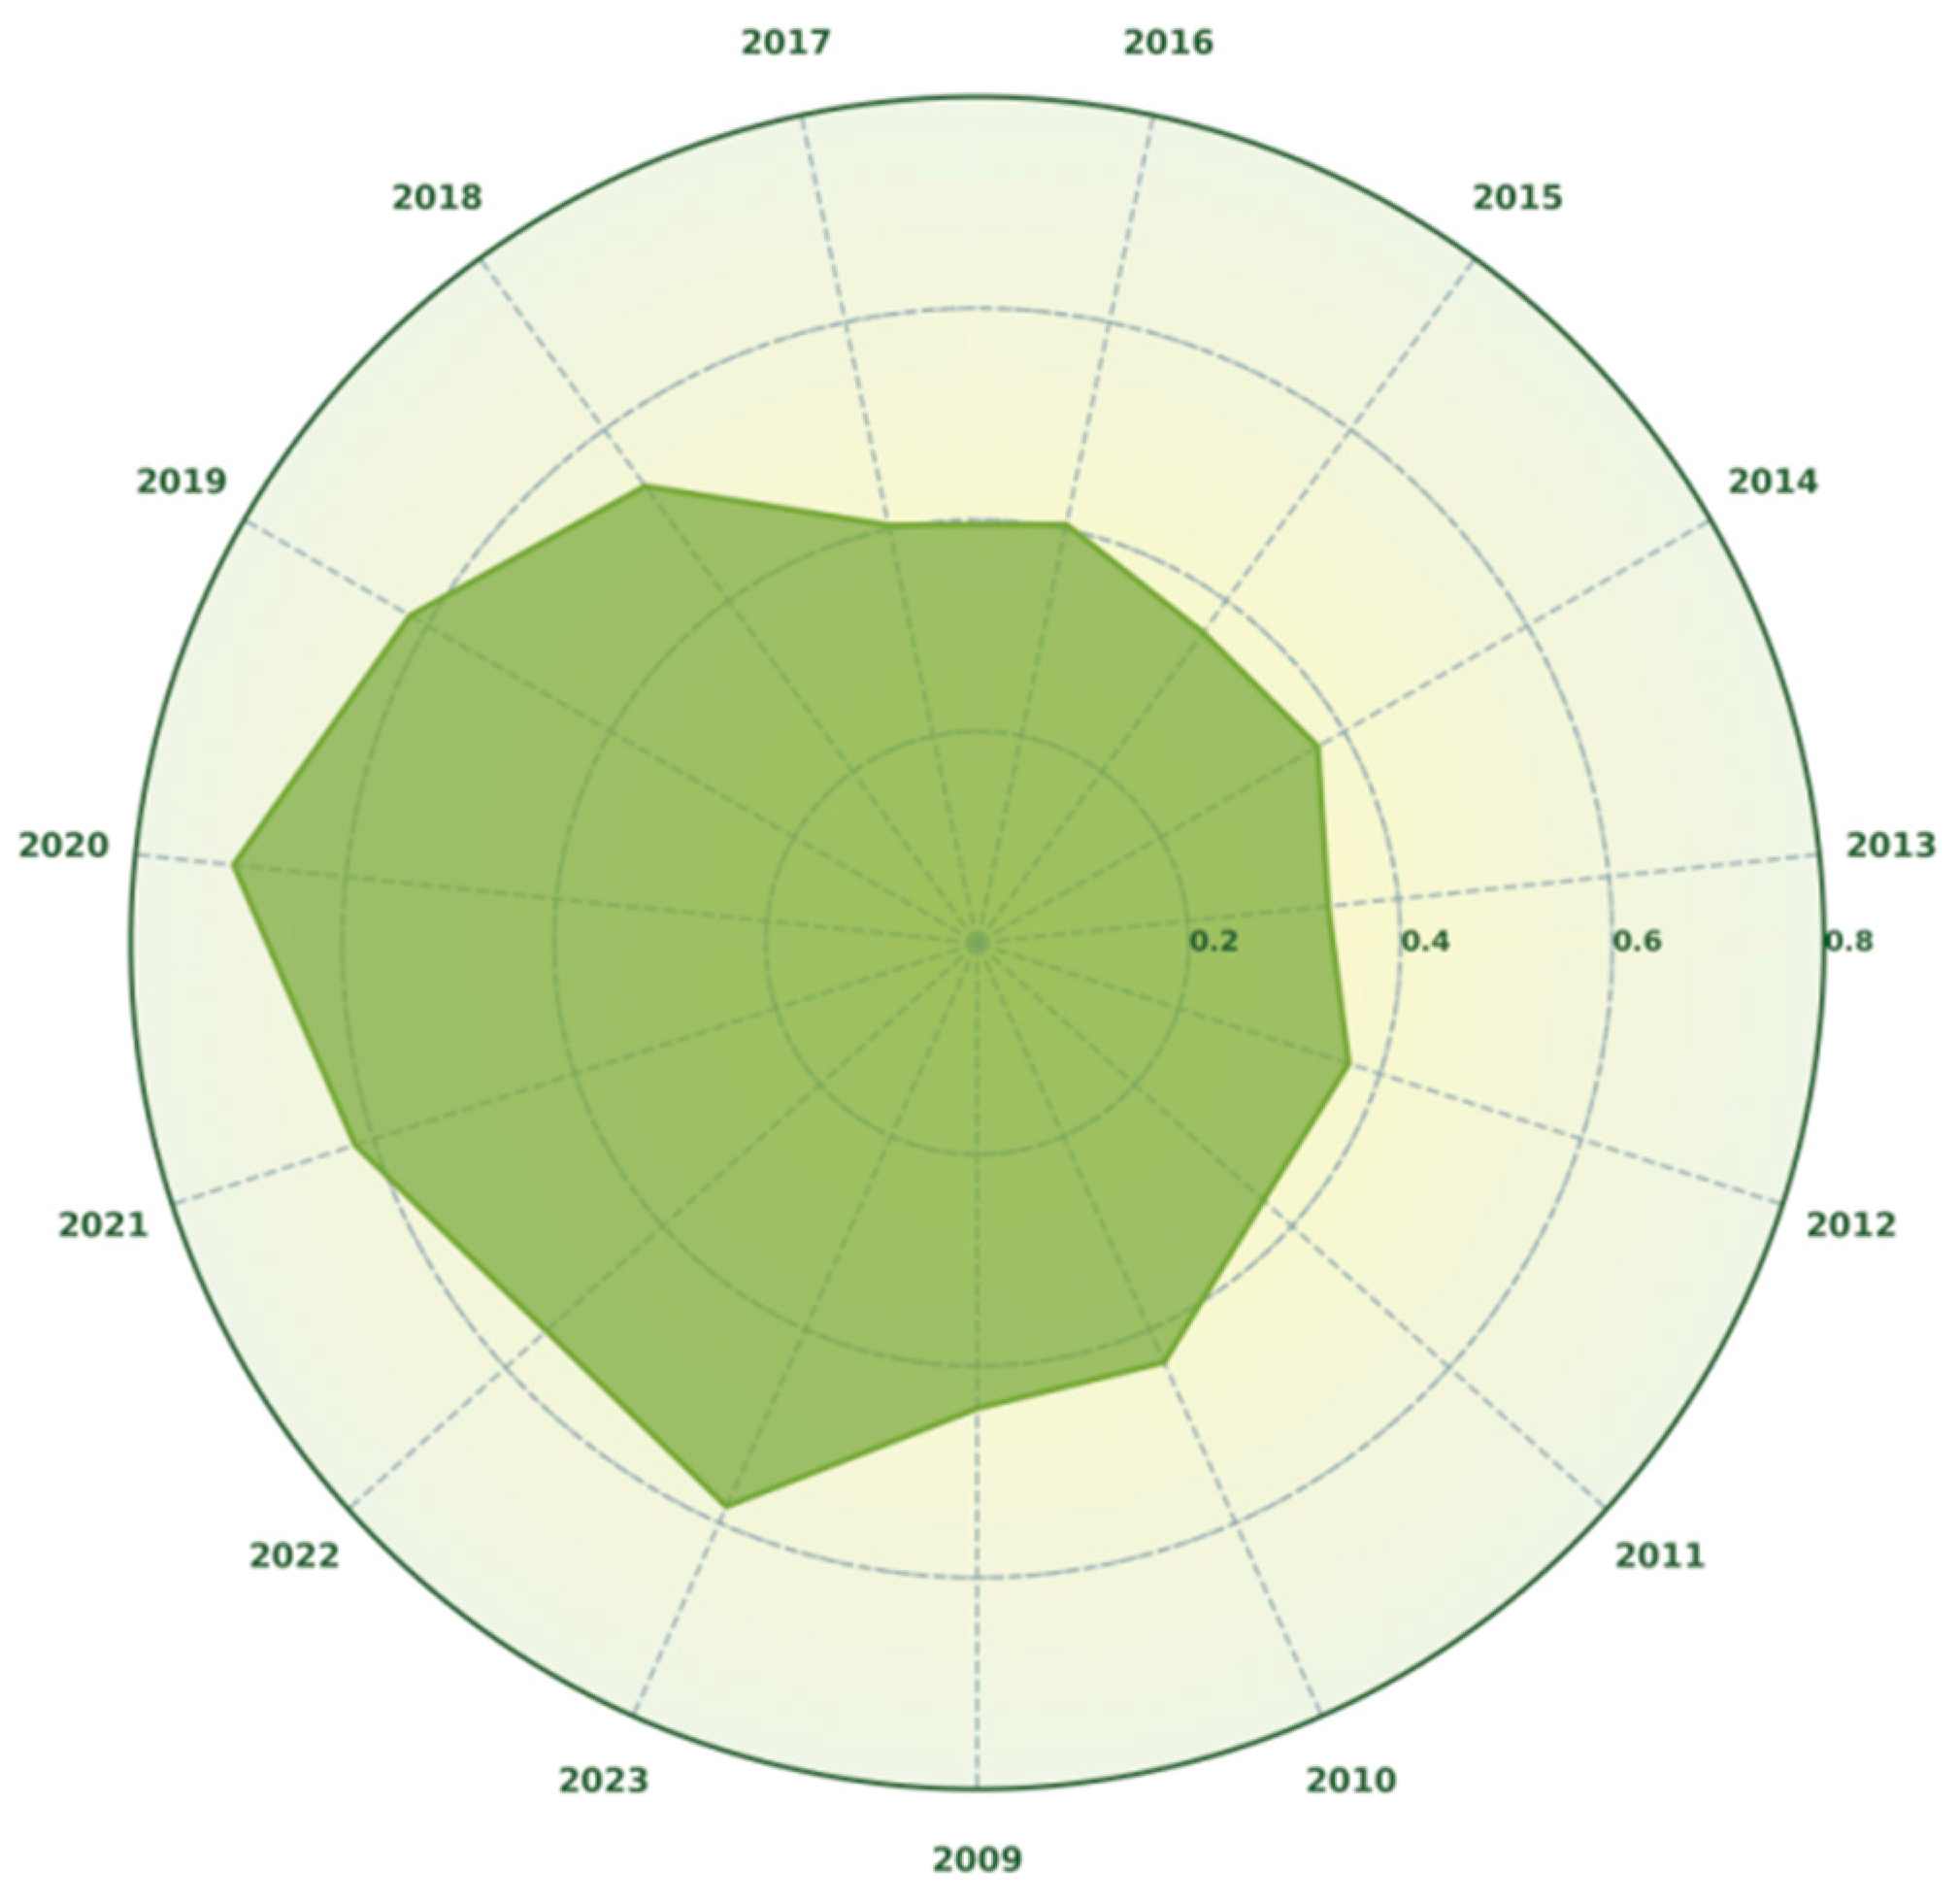
The NRU index for China’s inland regions showed a steady upward trend from 2009 to 2023, but the pace of change varied significantly across regions, resulting in a spatial gradient of development levels characterized by higher levels in the west, lower levels in the east, and intermediate levels in the central regions (Figure 4). Since a higher NRU index indicates a lower degree of natural resource exploitation, the sustained rise in the index suggests that the intensity of resource exploitation is generally decreasing across all regions. In the temporal dimension, the index curves for EC and CC were generally smooth, maintaining continuous and stable growth, indicating a sustained decline in development levels in these two regions; SW and NW exhibited a more pronounced acceleration in their upward trends after 2018, with a significant increase in the slope of their curves, indicating that the rate of decline in development intensity accelerated in the later period; NE and NC showed relatively gradual changes, particularly with a narrowing growth rate between 2014 and 2017, reflecting a distinct phase of deceleration. In the spatial dimension, the indices for EC and CC in 2023 were in the higher range, corresponding to a lower level of natural resource development; NE and SW were in the middle range, with a relatively moderate level of development; the indices for NC and NW were relatively low, reflecting that their levels of development remained high. Overall, against the backdrop of a general slowdown in resource exploitation intensity, there are significant differences in the pace of improvement across different regions: high-value regions improved more rapidly than their low-value counterparts. Consequently, the regional gradient widened over the study period.

4.2. Spatiotemporal Evolution of ER

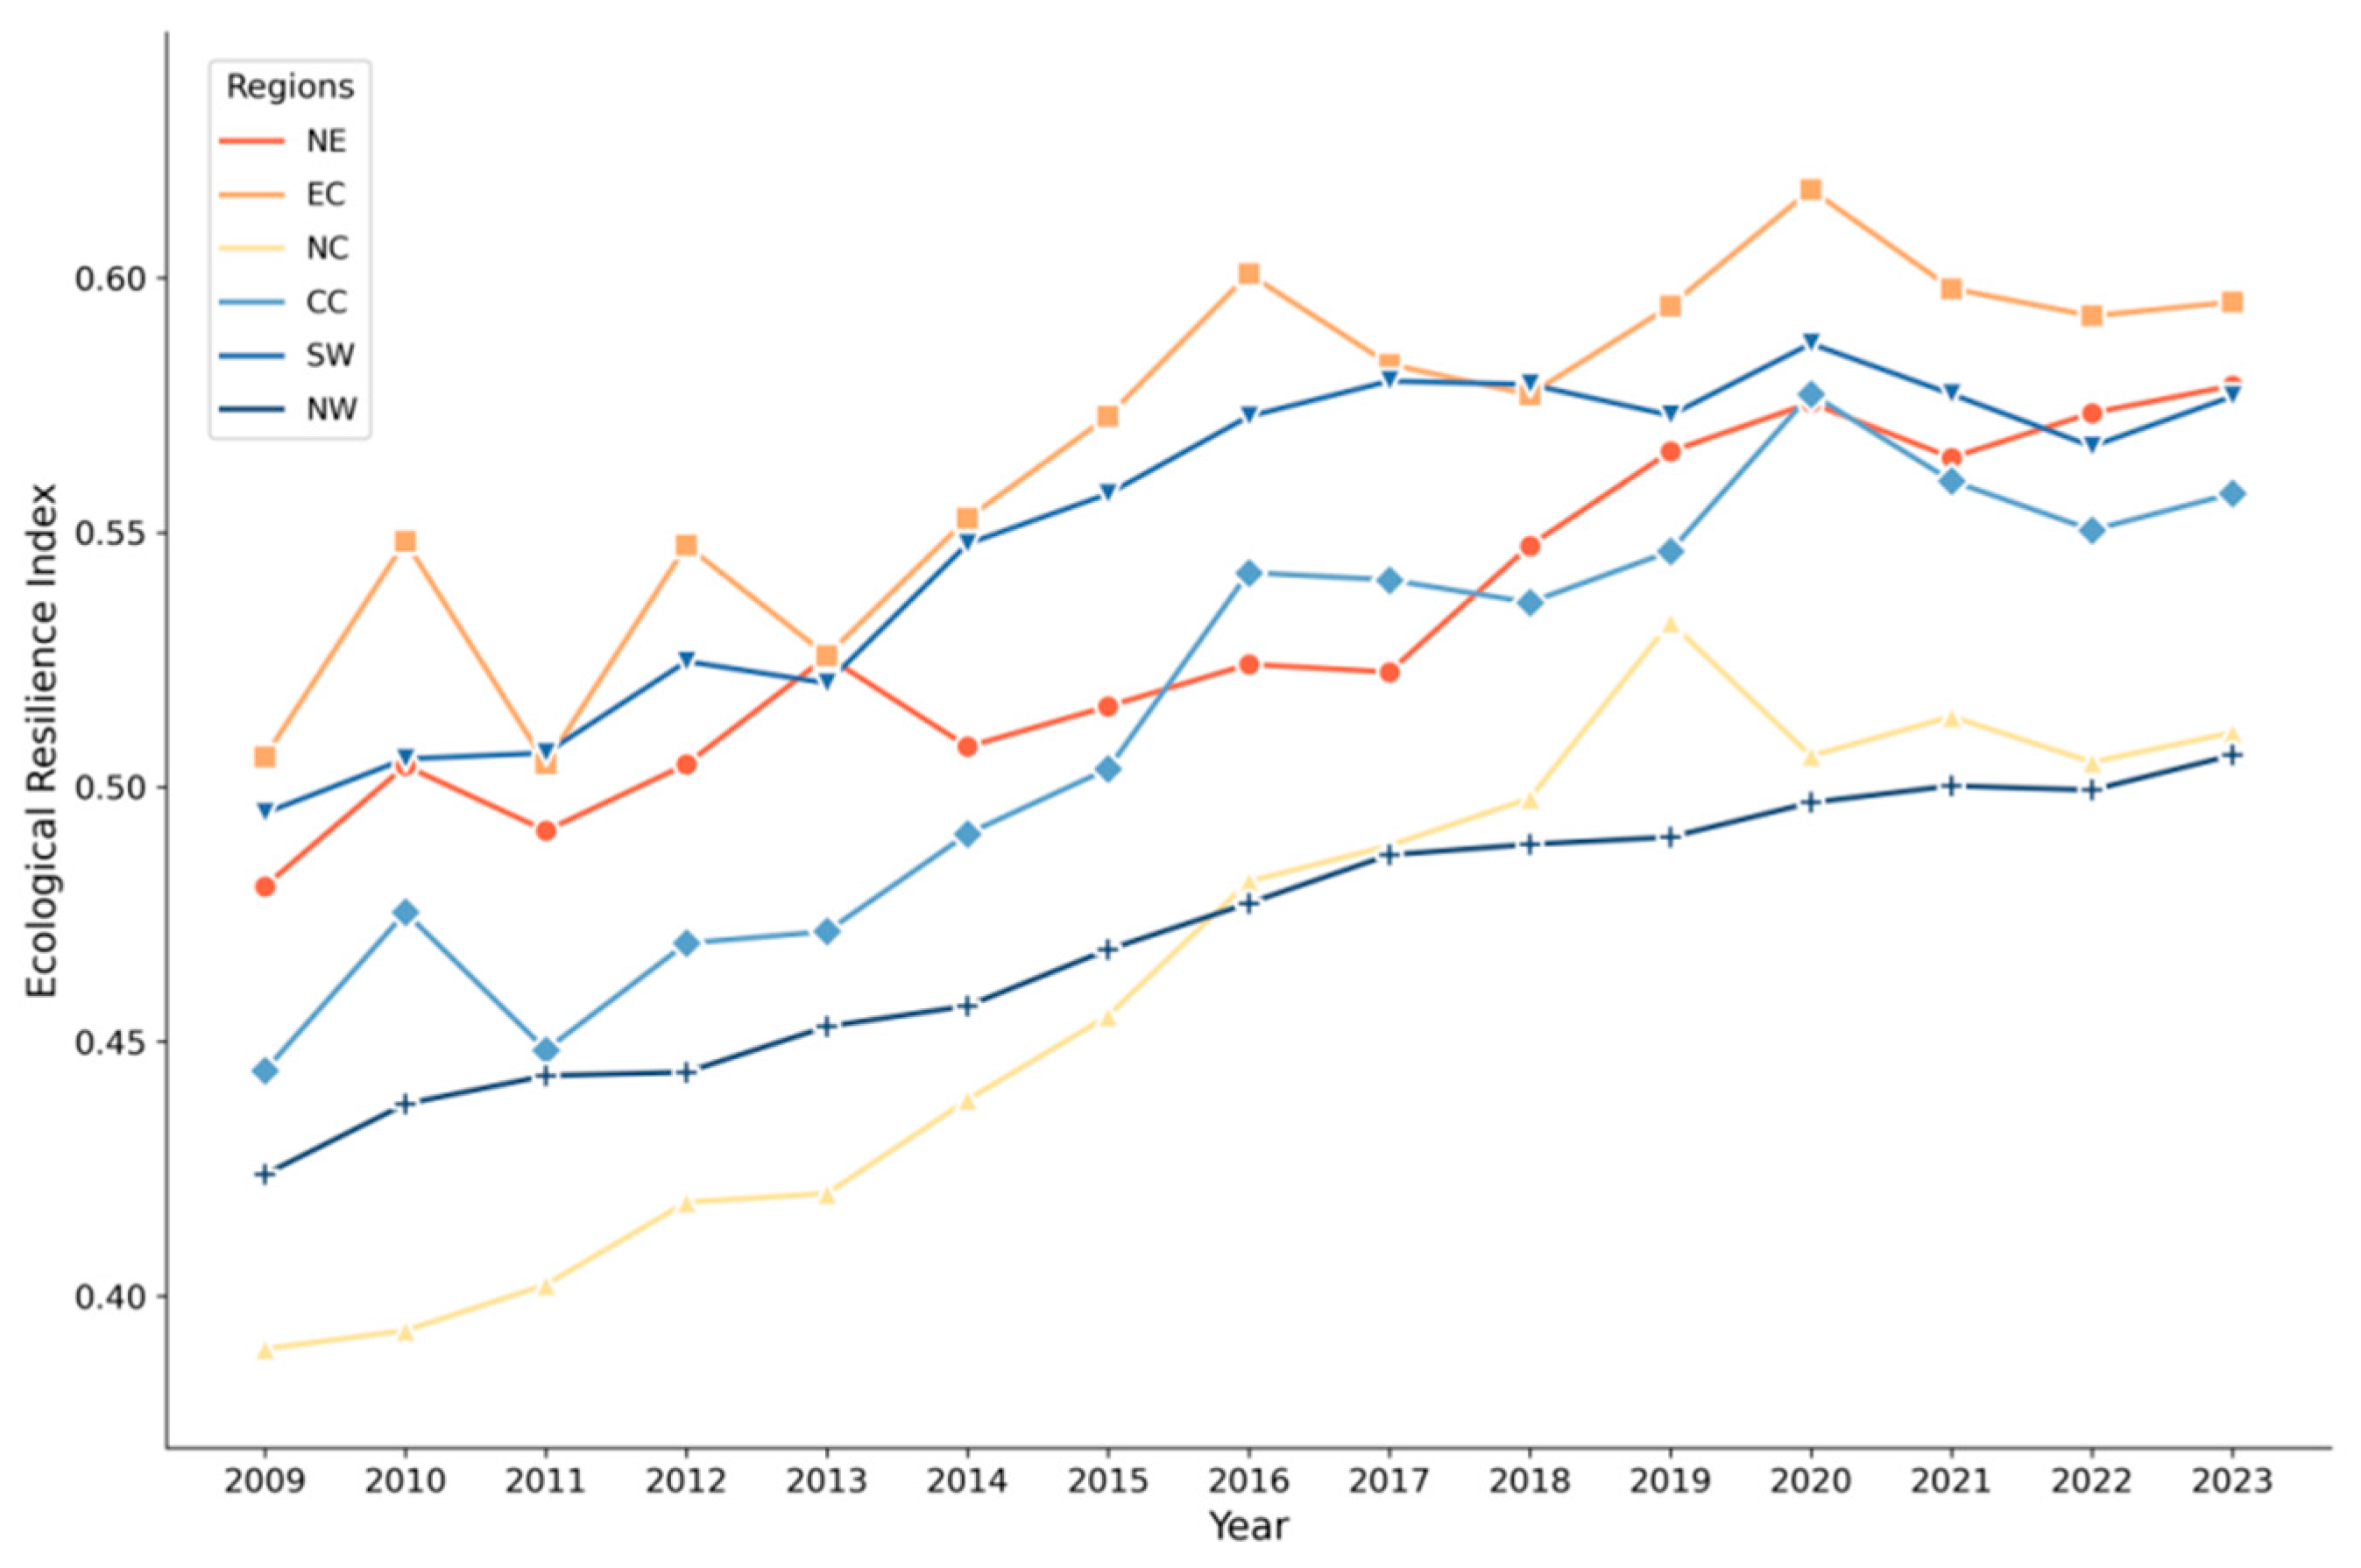
The ER index for China’s inland regions from 2009 to 2023 generally exhibits a pattern of uneven growth characterized by a sustained upward trend with periodic accelerations (Figure 5). Examining the data by phase, the index rebounded significantly from a low point between 2009 and 2014, accompanied by minor fluctuations; while ecological resilience began to improve, it remained at a relatively low level overall. From 2015 to 2017, the index exhibited a sustained and relatively rapid upward trend, with the upward momentum becoming more pronounced than in the previous period. From 2018 to 2020, the growth rate of the index accelerated further, reaching a phase high of 0.723, marking the entry into a phase of accelerated improvement in ecological resilience. From 2021 to 2023, the index fluctuated slightly within a high range but remained at a relatively high level overall.
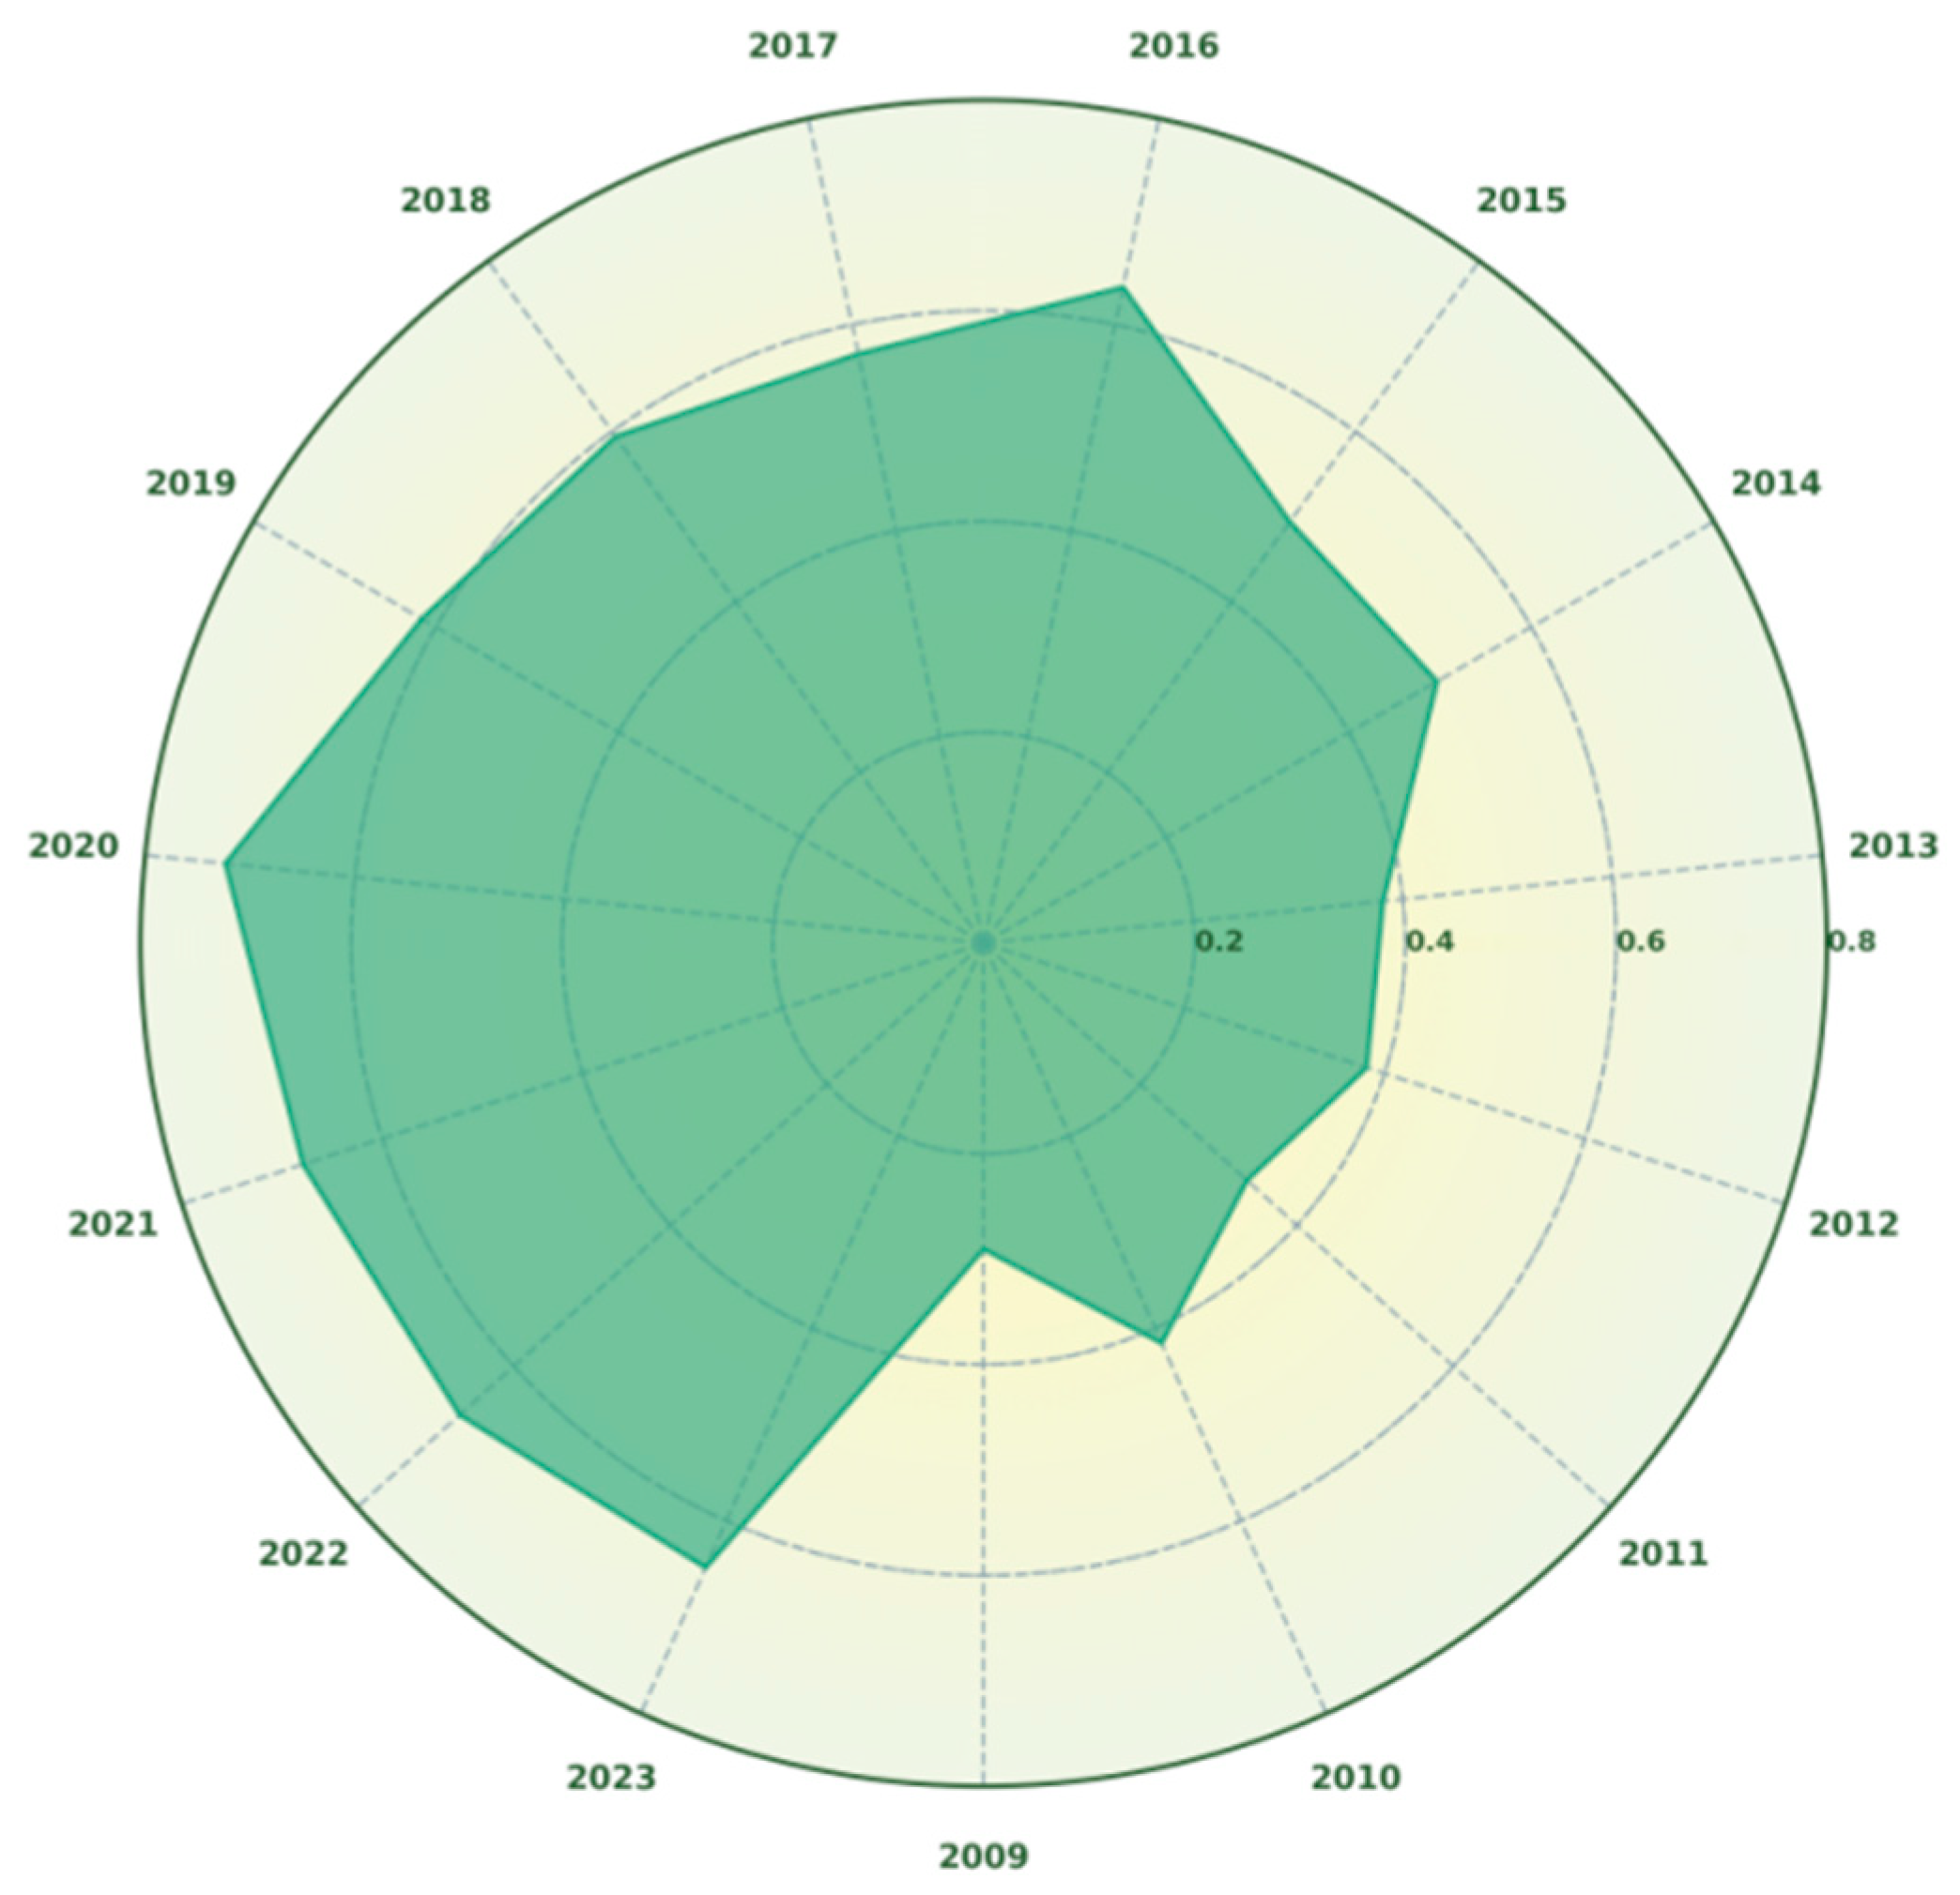
Significant differences exist between the trends in ecological resilience and the development and utilization of natural resources in China’s inland regions from 2009 to 2023. While the latter has generally increased, disparities among regions have gradually widened, resulting in a spatial configuration characterized by a gradient of development intensity: relatively high in the west, moderate in the central regions, and gradually increasing in the east. In contrast, ecological resilience has shown a continuous upward trend with periodic accelerations, but interregional differences have evolved relatively gradually, lacking a definitive convergent trajectory (Figure 6). Specifically, the temporal evolution of the ecological resilience index exhibits distinct phases: steady growth in the early stage, followed by accelerated growth in the later stage. Across the six major sub-regions, the ecological resilience index shows an upward trend in all areas, maintaining the basic pattern of East China leading and Northwest China lagging behind. However, the pace of growth varies across regions; some regions achieved accelerated improvement in the middle and later stages, causing inter-regional disparities to exhibit phased fluctuations rather than continuous convergence. Spatially, ER manifests a pronounced gradient, defined by an “East-high, West-low” stepwise decline. Specifically, EC consistently leads, followed by SW and NE, while NC and NW lag behind. Among these, the EC region consistently ranks at the top, followed closely by the SW and NE regions, with the CC region occupying an intermediate level, while the NC and NW regions are relatively lower. Compared to the evolving trend of widening regional disparities in the development and utilization of natural resources, although ecological resilience has not shown significant convergence, the degree of differentiation remains relatively moderate, reflecting phased differences in the pathways for enhancing ecosystem recovery capacity across different regions.

4.3. Synergistic Effects Analysis of NRU and ER

4.3.1. China’s Inland Area

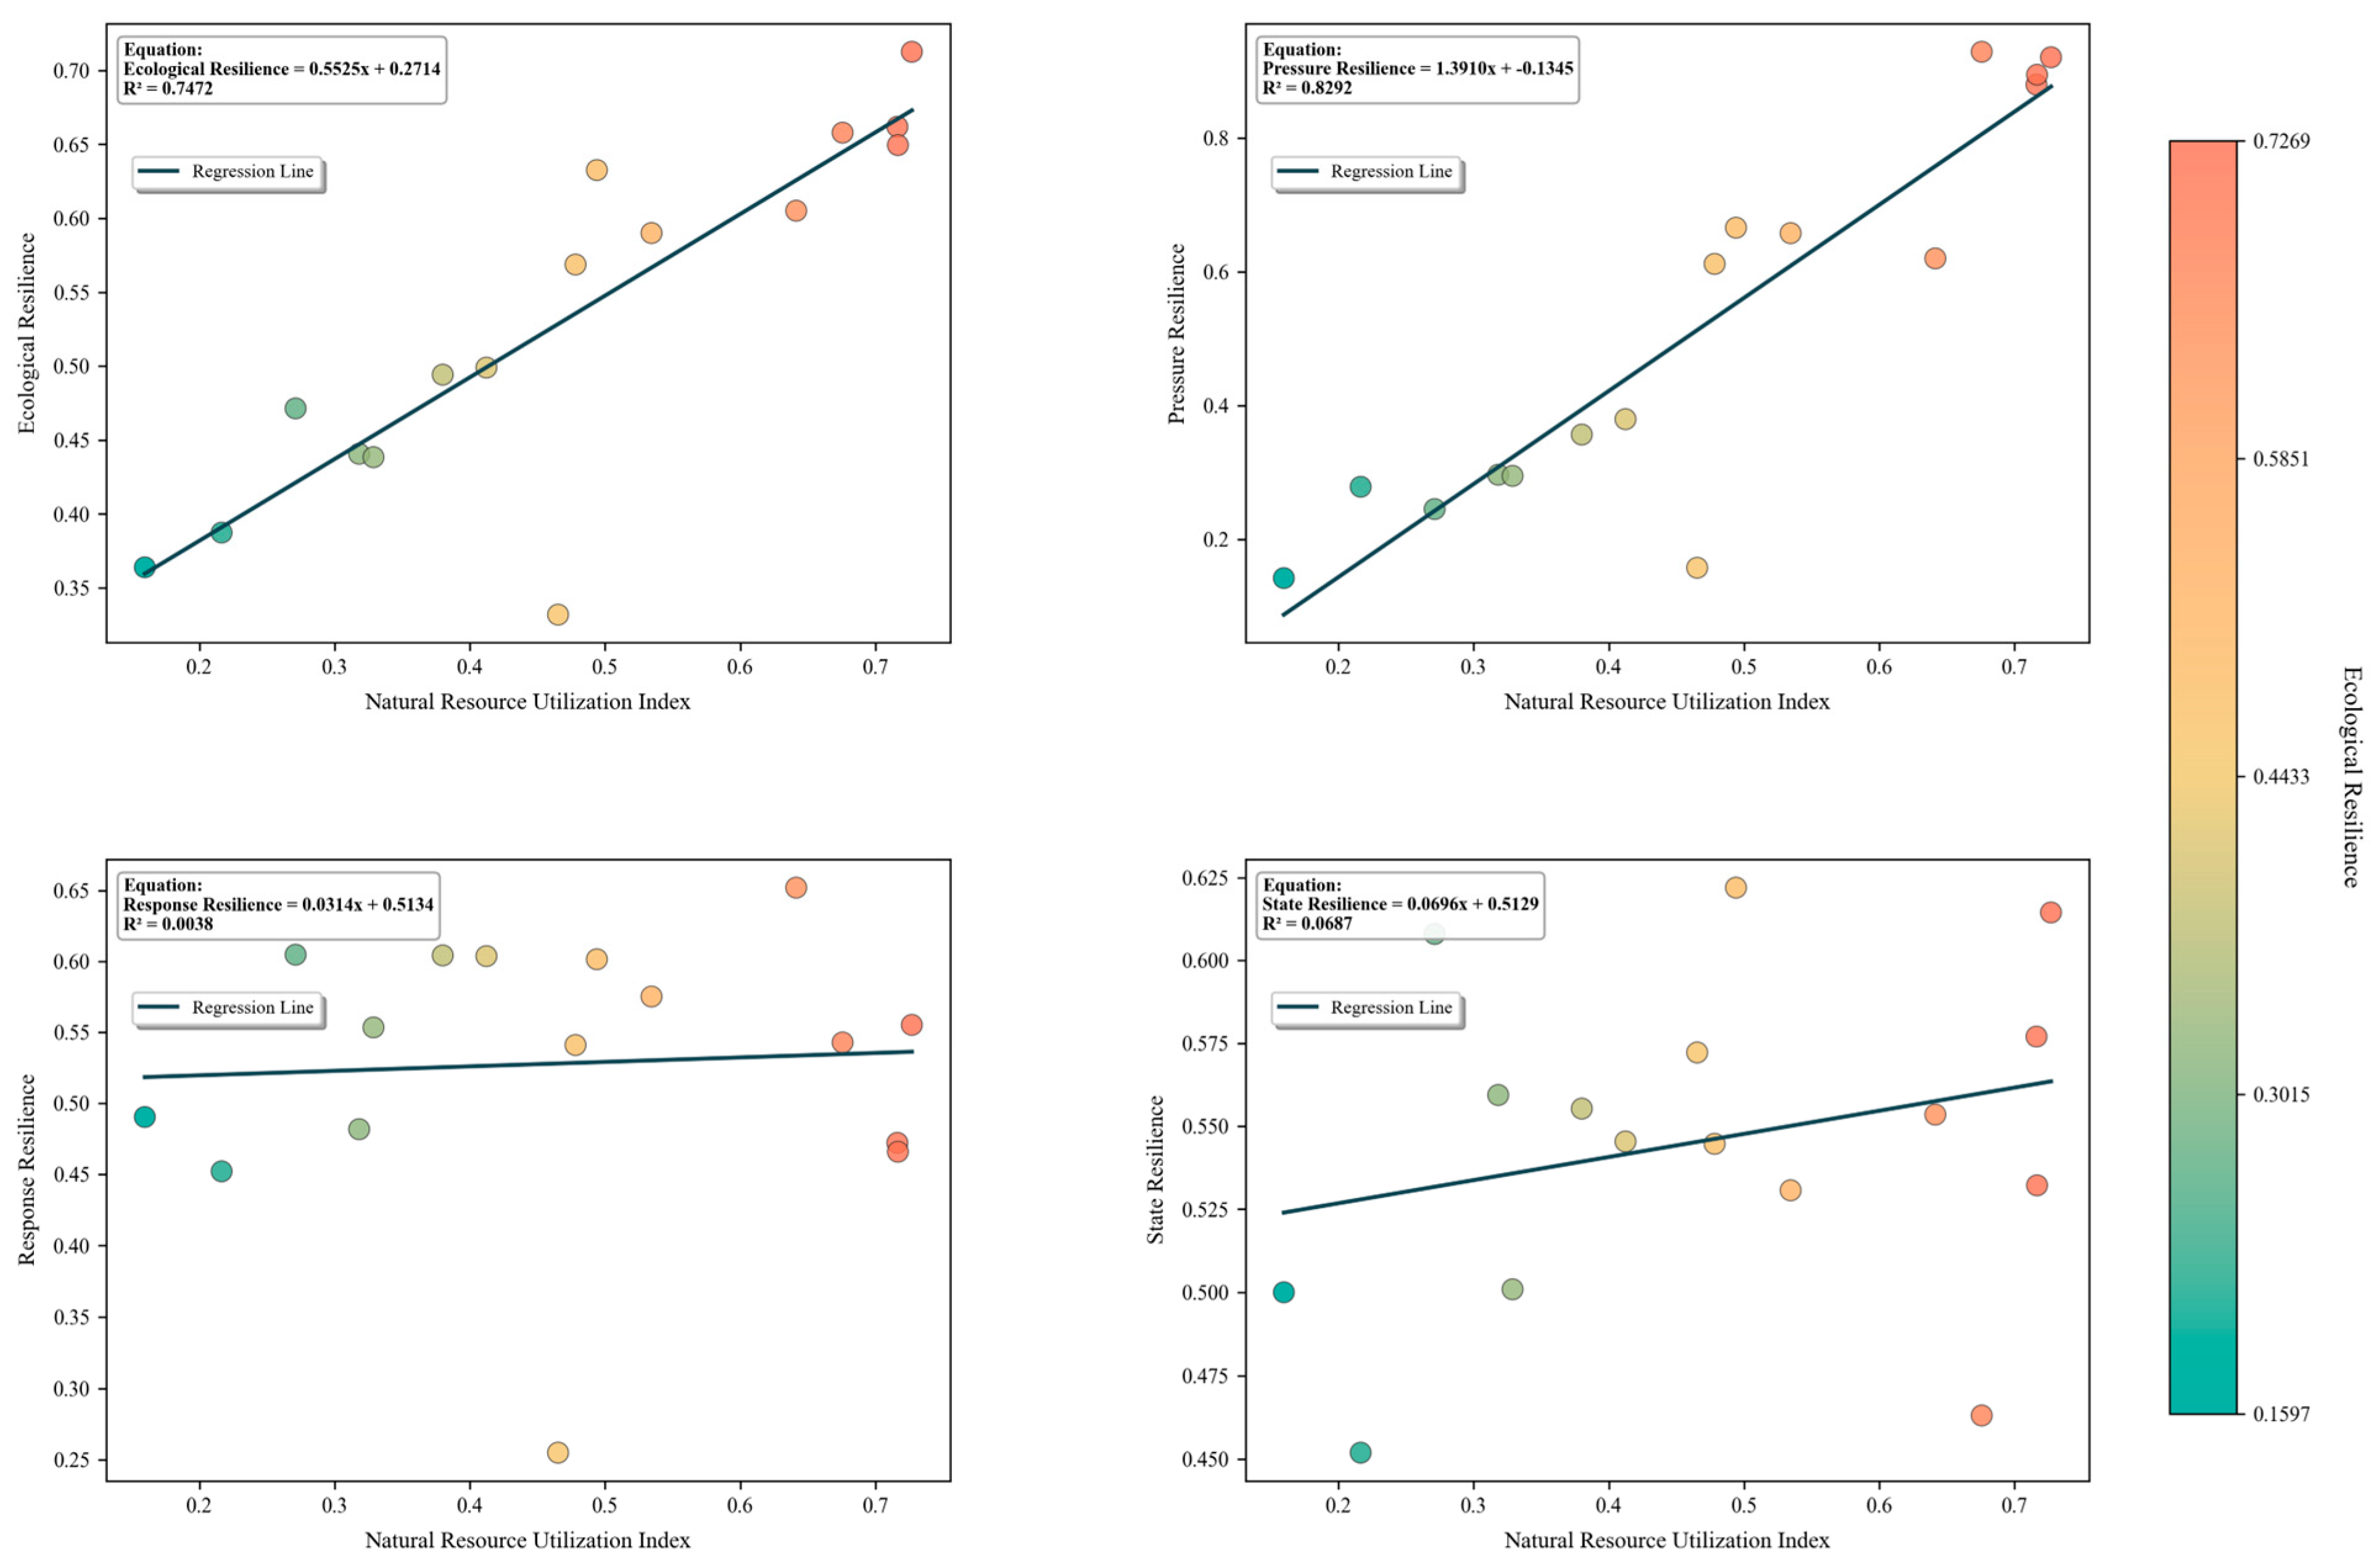
The overall index of NRU exhibits a strong positive correlation with ecological resilience. Empirical results indicate a regression slope of 0.81 and an R 2 value of 0.77, clearly illustrating the synergistic relationship between NR and ER (Figure 7). This relationship reflects that ecological conservation investments accompanying resource development processes are closely associated with improvements in overall ecosystem resilience. The results suggest a relatively tight linkage between the two systems over the study period, indicating the emergence of an initial pattern of coordinated development between resource exploitation and ecological conservation.
Building on the overall positive association reported above, the correlation strength across different tiers of ecological resilience criteria and natural resource exploitation shows marked divergence (Figure 7). The regression fit between pressure resilience and resource utilization ( R 2 = 0.75) is close to that of the overall index, and the strong positive relationship ( s l o p e = 0.79) is consistent with a pressure-driven resilience enhancement pattern, whereby environmental burdens associated with resource development are accompanied by strengthened resistance to ecological disturbances and, in turn, higher tolerance thresholds to external pressures. By comparison, the association for state resilience is weaker ( s l o p e = 0.42; R 2 = 0.38), reflecting the double-edged nature of resource development: although ecological restoration measures may accompany development activities, ecological baselines in some areas remain affected by development-related degradation, and governance efforts have not fully offset these impacts. The relationship is weakest for response resilience ( s l o p e = 0.21; R 2 = 0.19), indicating a misalignment between prevailing resource development modes and ecosystems’ proactive adaptive capacity. In particular, responsive functions such as post-disturbance recovery and dynamic adjustment have not strengthened in tandem with rising levels of resource development, suggesting that ecological governance remains predominantly characterized by passive restoration.
This inter-dimensional disparity indicates an uneven pattern in ecological resilience development. Specifically, resource exploitation is more strongly associated with pressure-related resilience enhancement, whereas its contribution to state stability and proactive responsiveness appears relatively limited. The results further imply that current ecological governance is characterized by an imbalanced emphasis and a comparatively narrow set of approaches, which aligns with the observed weakness in state and response dimensions. Correspondingly, the contrast among dimensions suggests that strengthening ecological foundation protection during resource exploitation and promoting a transition from reactive restoration toward proactive adaptation are closely related to improving the underperforming components of resilience. Overall, these patterns underscore that more balanced gains across resilience dimensions are associated with deeper integration between resource exploitation processes and ecological resilience building.

4.3.2. Six Major Regions

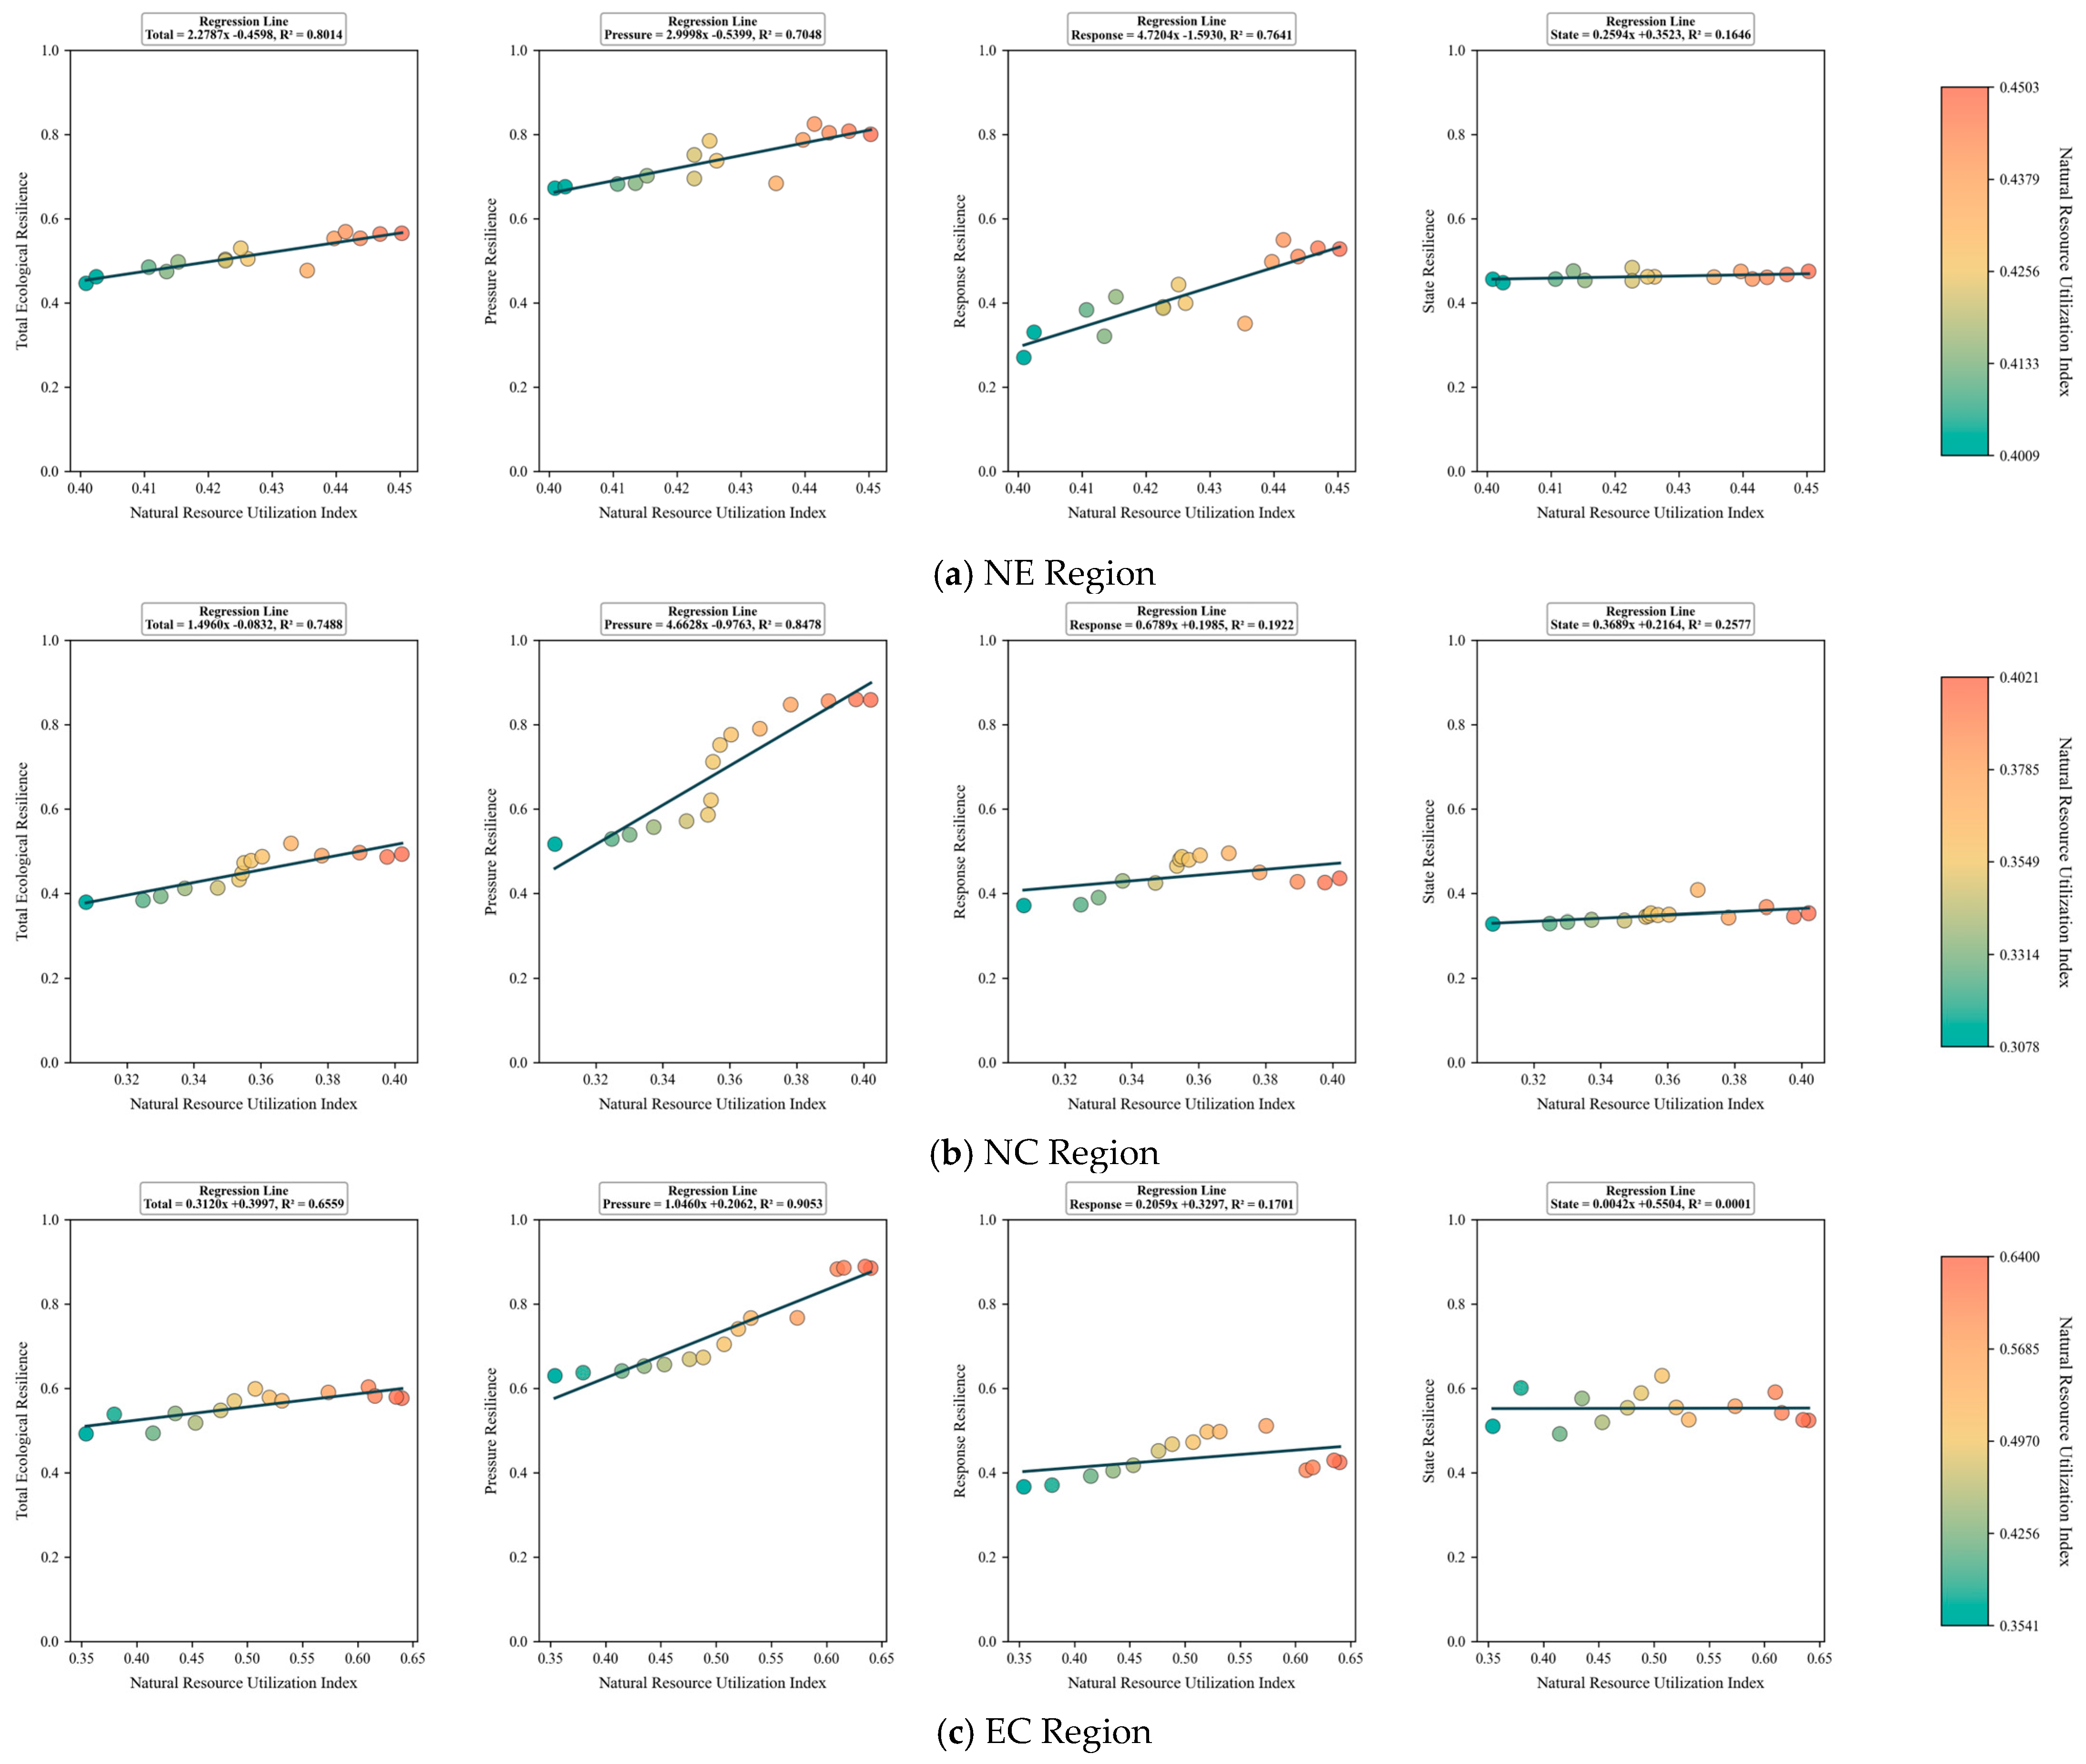
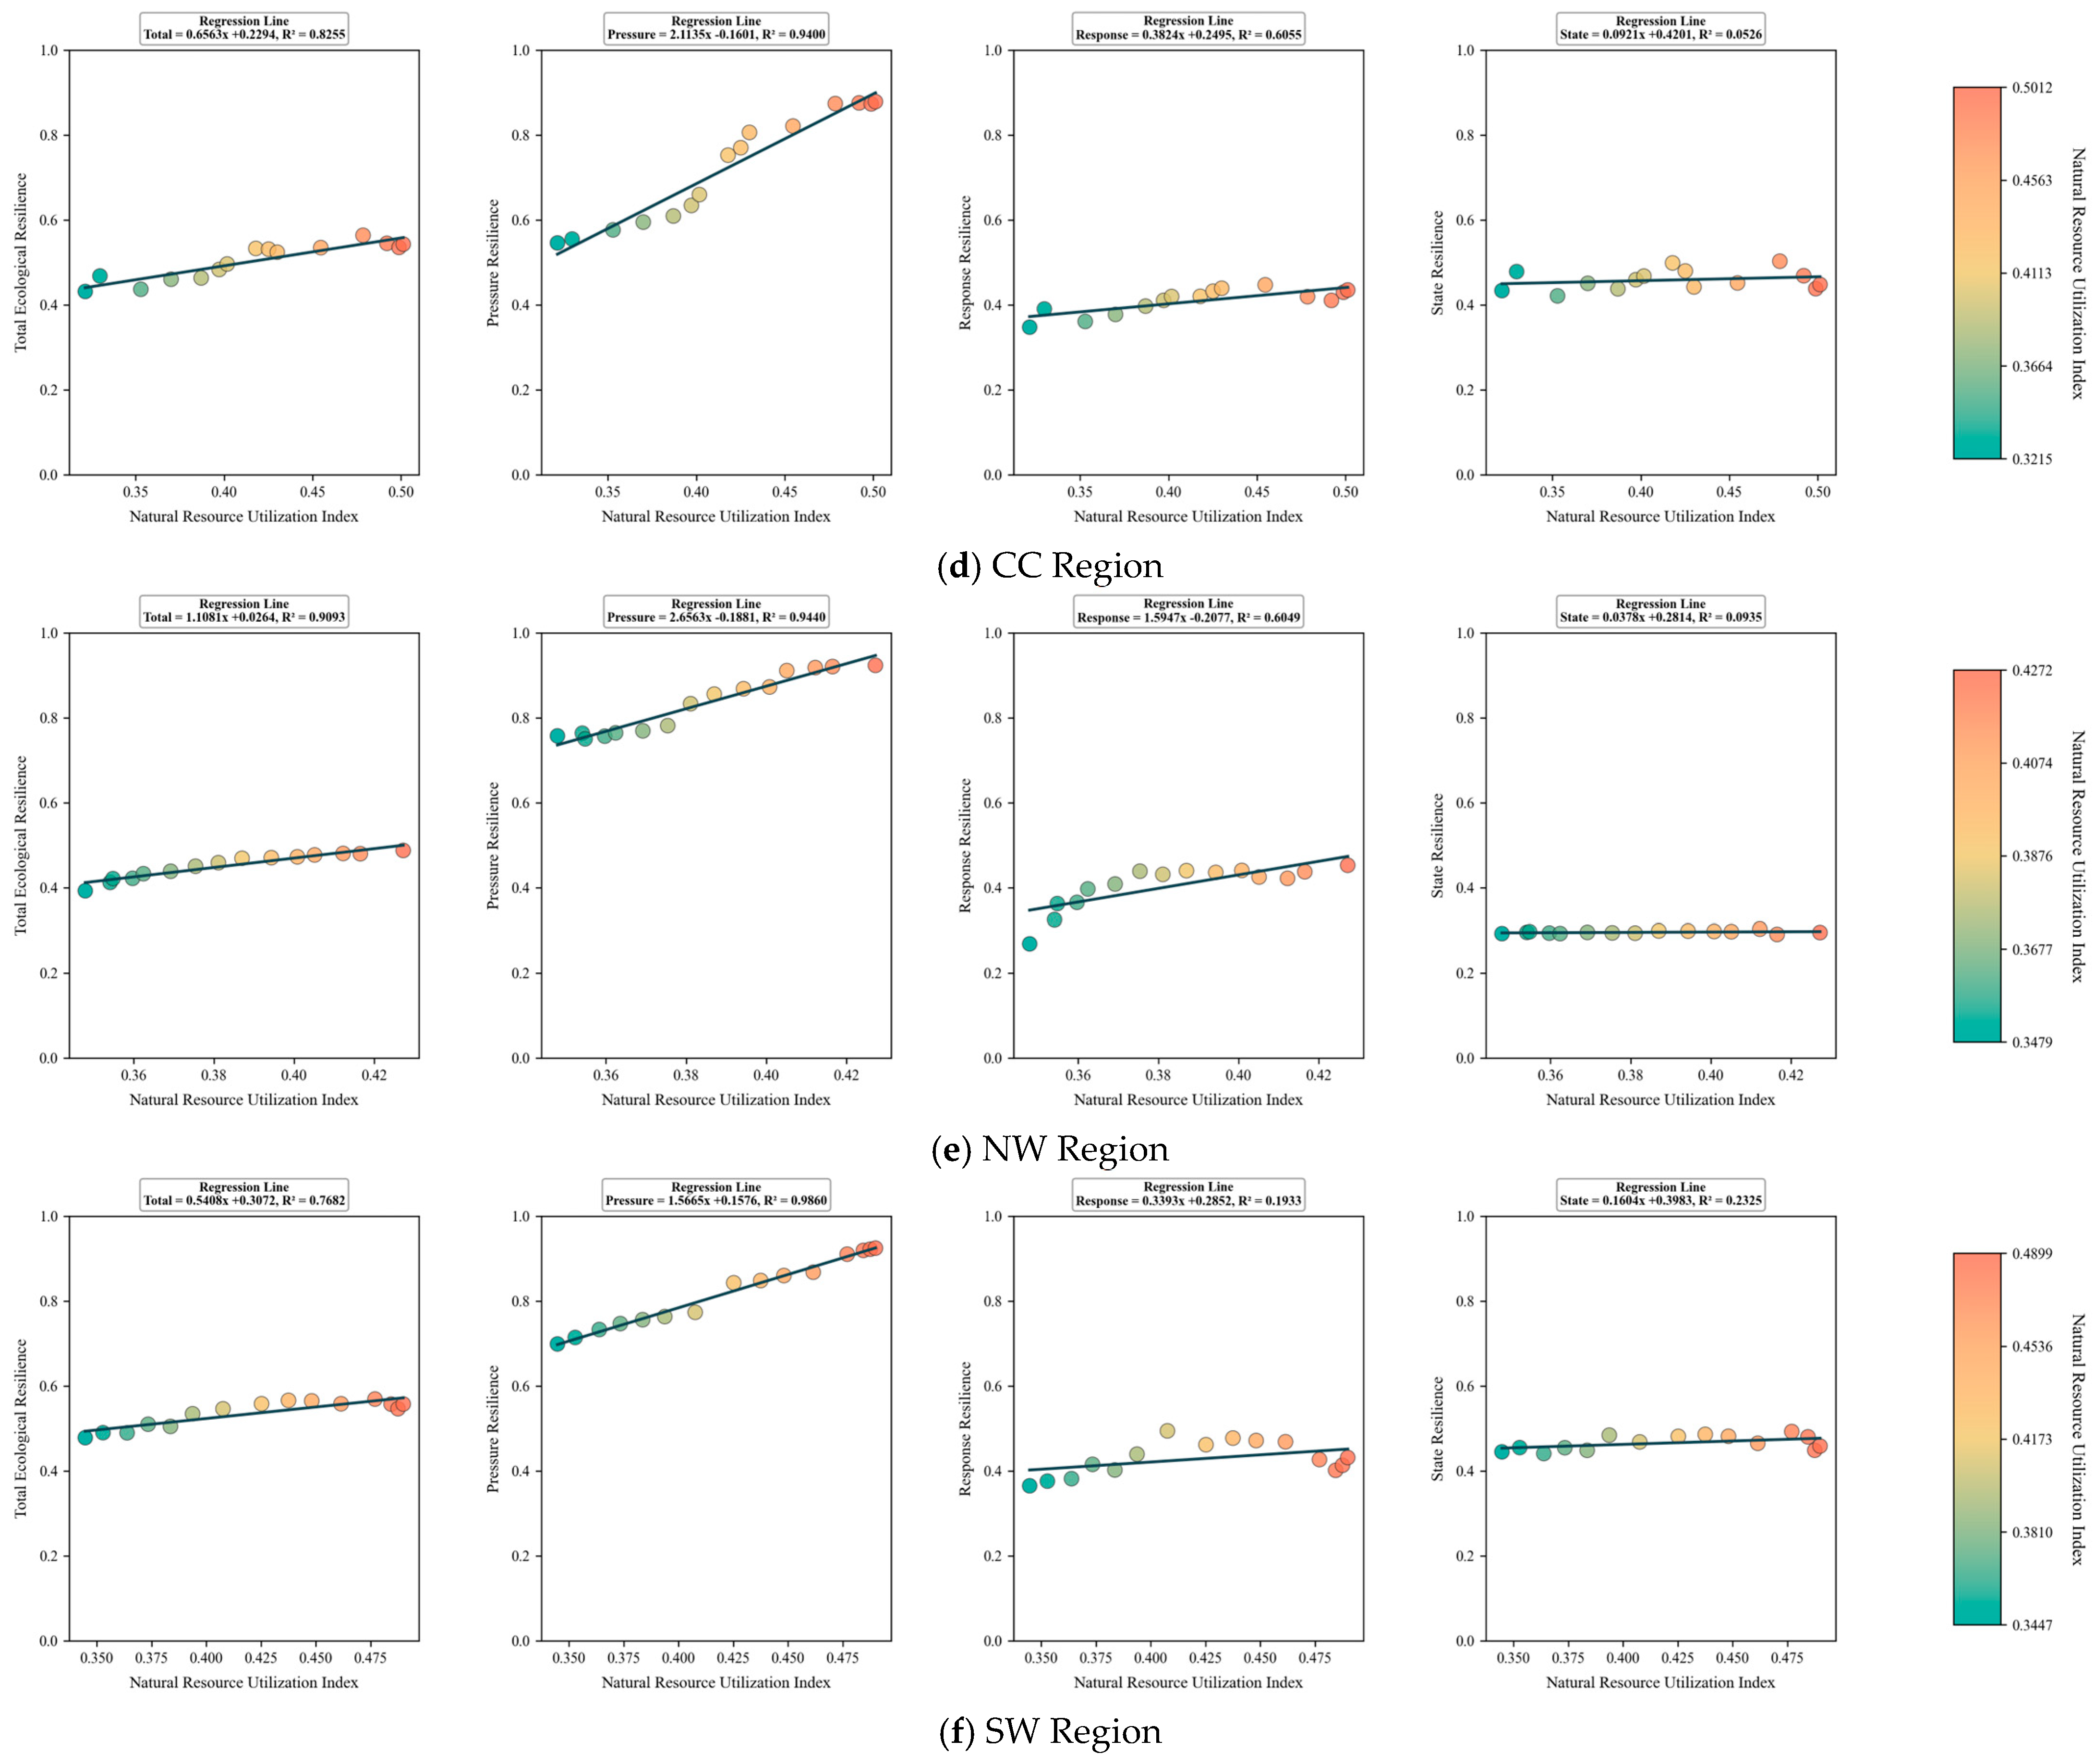
At the national level across China’s inland area, the overall ecological resilience index exhibits a strong positive correlation with resource development. Among the six major regions, substantial variation is observed in the efficiency of the relationship between natural resource utilization and ecological resilience (Figure 8). The regression fit for the overall indices in the EC and CC regions exceeds the national average, with steeper regression slopes. This pattern is consistent with more mature coordination mechanisms in these two regions, where accompanying measures for ecological conservation and governance during resource development appear relatively stronger. As a result, the positive driving efficiency of development on ecological resilience is higher than the overall level for China’s inland area. In contrast, the NE and NW regions show regression fits below the national average, with flatter slopes. This suggests that the synergistic effects between resource development and ecological resilience have not been fully realized in these regions; coordination between ecological governance and resource development remains comparatively weaker, and development therefore drives ecological resilience less efficiently than the national average.
Regional differentiation across resilience dimensions further reveals distinct interrelated patterns (Figure 8). First, differentiation is most pronounced in the pressure-resilience dimension. The regression slopes for the EC and CC regions are substantially higher than those of other regions, with fit levels approaching the national peak. This is consistent with a pressure-driven resilience enhancement mechanism in which environmental burdens associated with resource exploitation are more effectively translated into strengthened ecological disturbance resistance in the eastern and central regions. By contrast, the slopes for the NW and SW regions are markedly lower, indicating gaps in the linkage between pressure transmission and resilience response, where development pressures have not yet translated into comparable resilience gains. Second, regional performance in the response-resilience dimension broadly mirrors the weak correlation observed at the national level, with a more pronounced disconnect between natural resource development and response resilience across regions. Notably, the response-resilience regression curves for the NC and NE regions are nearly flat and exhibit low fit levels, indicating that capacities for proactive recovery and dynamic adjustment have not strengthened in tandem with increased resource exploitation. This pattern reflects the weak driving force of response resilience at the national scale and also points to more evident governance shortcomings at the regional level. Third, regional disparities in state resilience are also notable. The EC region leads all six regions in both regression slope and fit, showing a relatively stable positive correlation with resource exploitation, which is consistent with stronger protection and restoration of ecological foundations during development. In contrast, the state-resilience regression curves for the NW and SW regions show greater volatility; in some periods, higher resource utilization coincides with slight declines in state resilience. This suggests that ecological degradation may exceed governance gains in these regions, indicating that core state-related ecosystem indicators remain insufficiently safeguarded.
The relationship between natural resource utilization and ecological resilience across the six major regions displays clear regional heterogeneity overall (Figure 8). The EC and CC regions show tighter linkages between resilience dimensions and resource development, with coordination levels close to the national optimum, which is consistent with their relatively established ecological governance frameworks and more efficient collaborative mechanisms. By contrast, the NE, NW, and SW regions exhibit generally weaker associations, particularly in the response- and state-resilience dimensions, indicating a comparatively limited alignment between resource development and improvements in these components of resilience. This divergence not only sustains the nationwide pattern of uneven development drivers but also accentuates regional differences in governance capacity and development foundations. Taken together, these regional contrasts highlight differentiated implications: the EC and CC regions are associated with relatively higher coordination efficiency, whereas the NE, NW, and SW regions are characterized by more evident constraints, especially with respect to response and state resilience, which may limit the formation of a stronger positive feedback between resource development and ecological resilience.

4.4. Analysis of Coordinated Development Between NRU and ER

4.4.1. CCD Between NRU and ER in China’s Inland Area

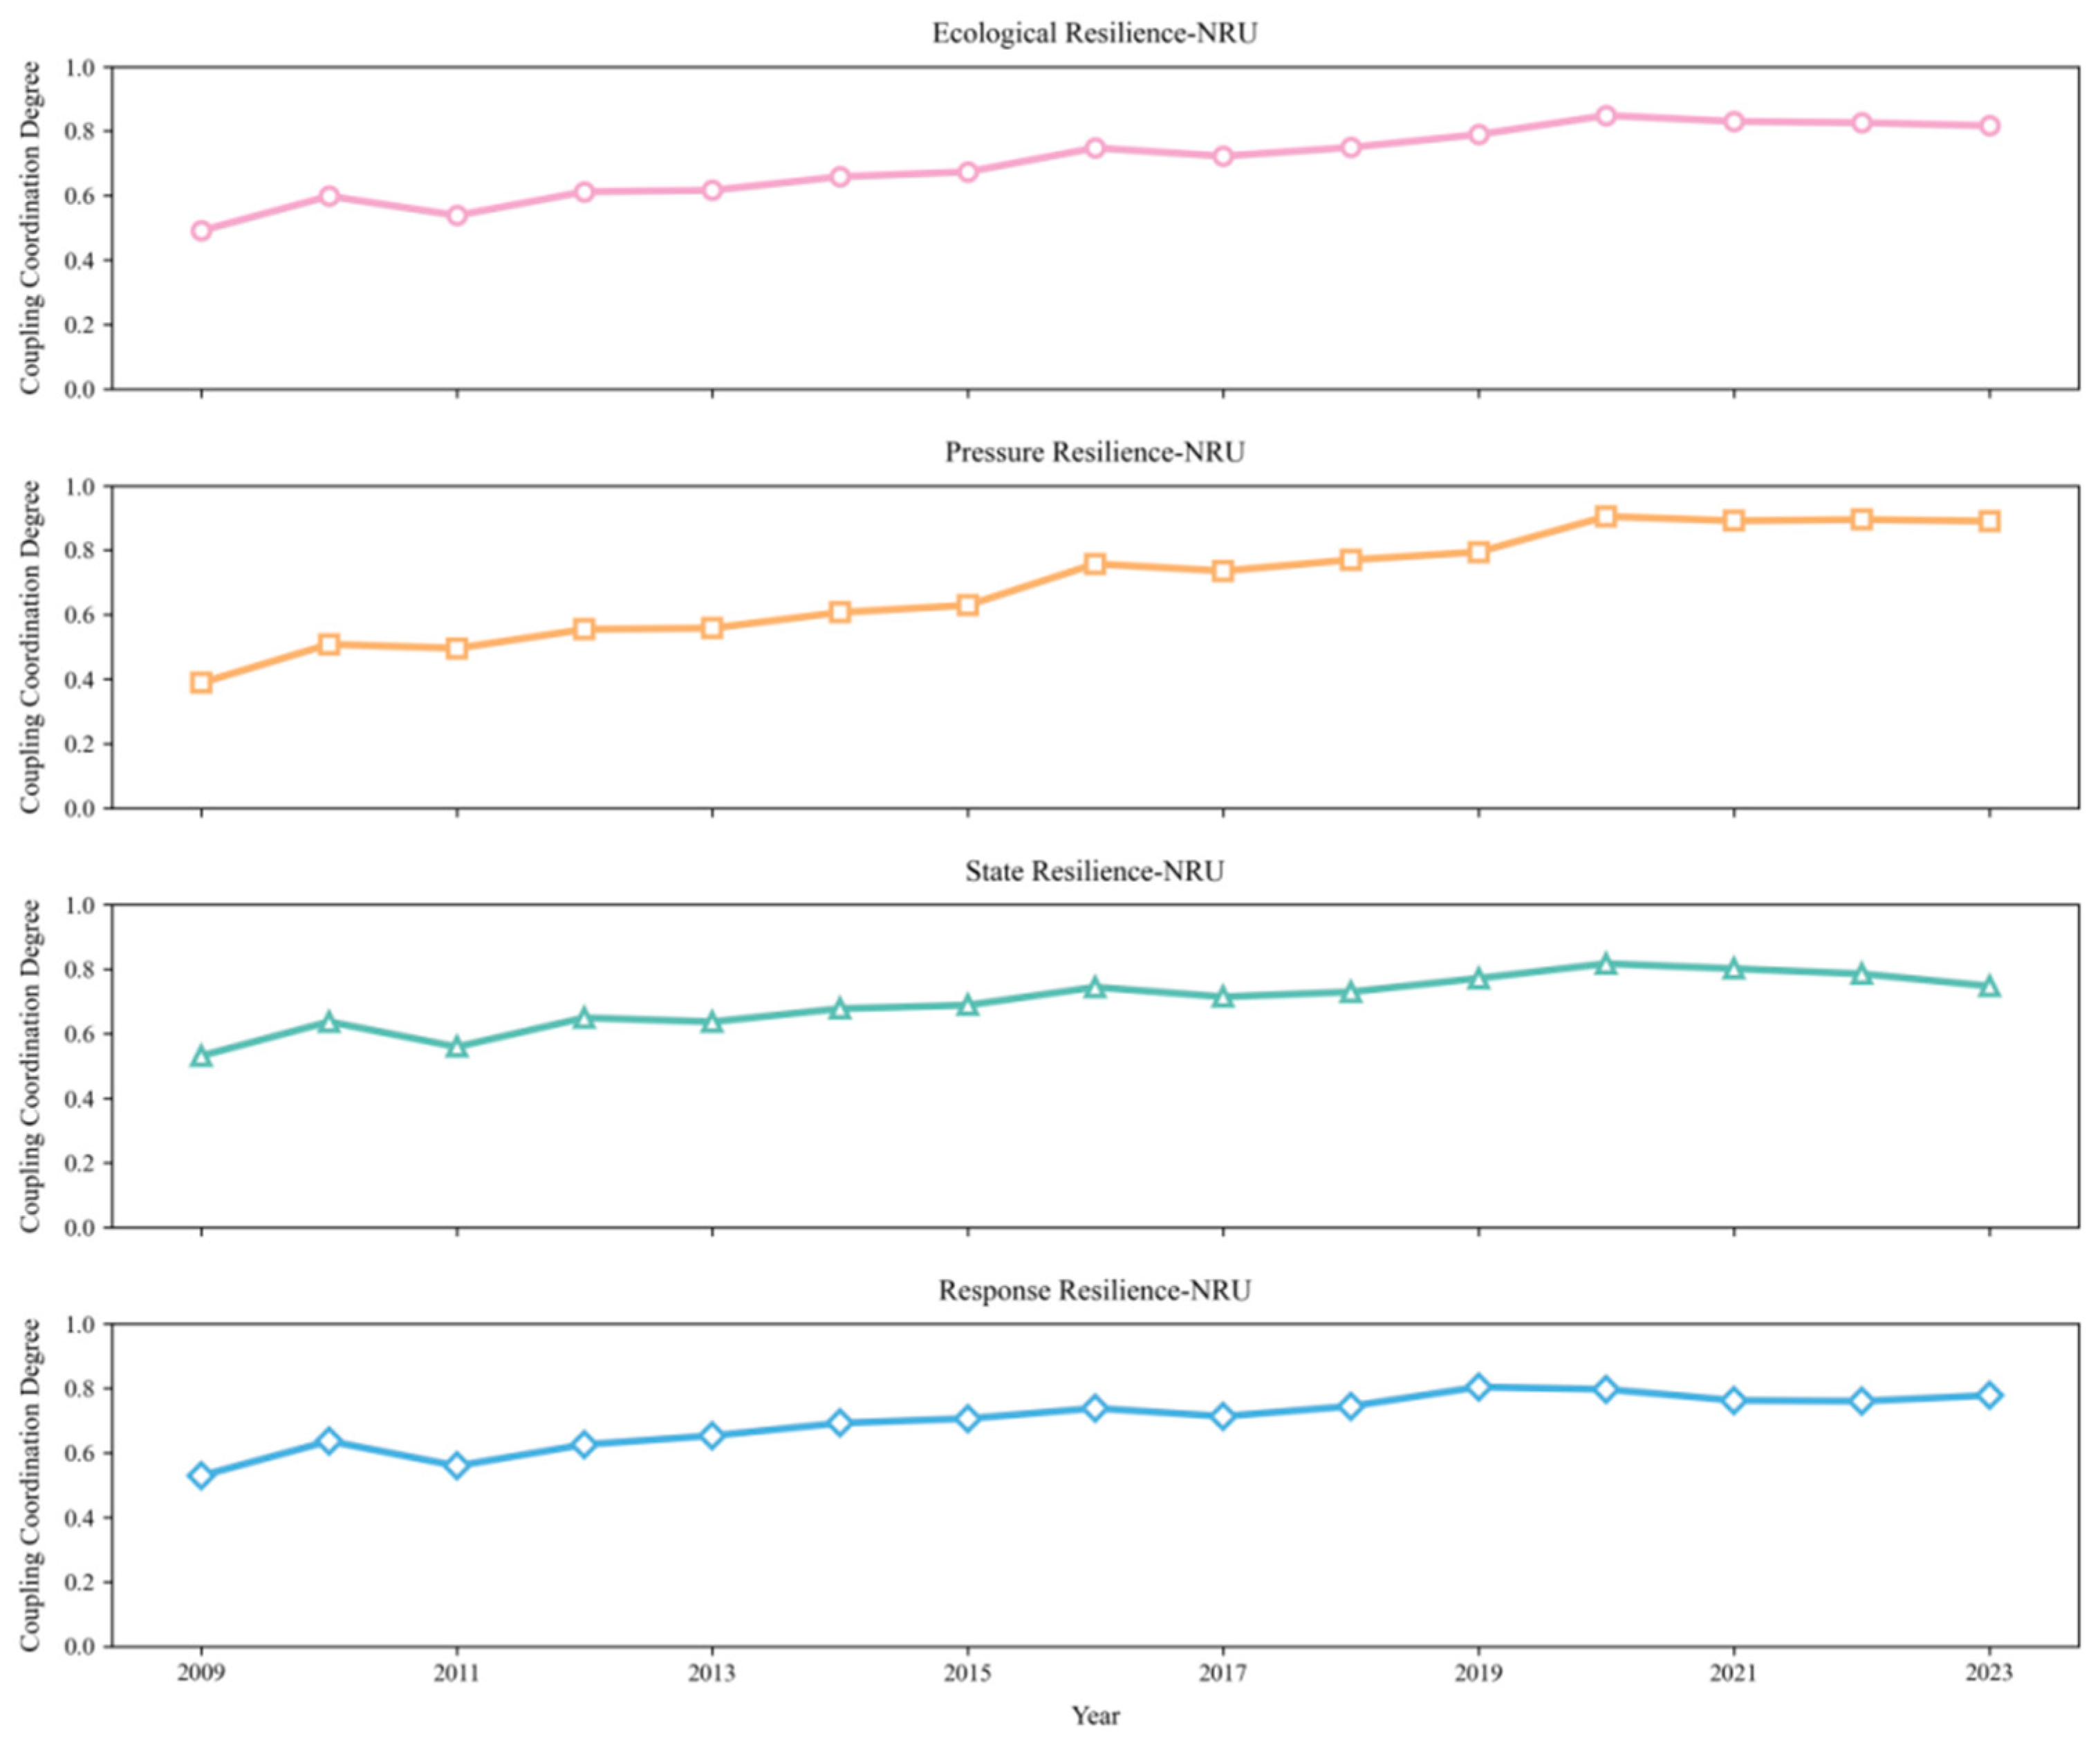
The coupling coordination degree between ecological resilience indicators and resource utilization in China’s inland area shows a sustained increase before stabilizing, remaining overall within a relatively high coordination range (Figure 9). This trajectory is consistent with the strong positive association between natural resource utilization and ecological resilience identified in the preceding dimensional regression analysis. It further illustrates the gradual strengthening of synergistic alignment between resource development and ecological conservation, indicating the emergence of a comparatively stable coupled-development pattern within the inland area.
Coupling performance across guideline layers shows clear dimensional differentiation that corresponds closely to the relationships observed within each component of ecological resilience. The most pronounced increase in coupling coordination occurs between pressure resilience and resource development, with coordination levels stabilizing at a relatively high range in the later period. This pattern is consistent with the stronger association observed within the pressure-resilience dimension and indicates that the linkage between development pressure and ecological resistance capacity has formed a comparatively efficient coupling pathway. In contrast, coupling coordination between state resilience and resource utilization remains mainly within a moderate range but exhibits more pronounced fluctuations, which is consistent with the partial divergence between development intensity and ecological baseline conditions and reflects weaker stability in their synergistic relationship. Coupling coordination between response resilience and resource utilization increases more gradually and remains slightly lower than that of other dimensions, in line with the weaker association between development processes and proactive response capacity, indicating that improvements in response resilience lag behind the pace of resource utilization.
Differences in coupling coordination across resilience dimensions collectively reveal an unbalanced but progressively evolving synergy between resource utilization and ecological resilience in the inland area. Pressure resilience exhibits the most mature coupling mechanism, characterized by strong and stable coordination with resource development. State resilience shows moderate coupling levels with relatively unstable synergy, indicating sensitivity to fluctuations in development intensity and ecological baseline conditions. Response resilience displays the weakest coupling performance, with lower coordination levels and slower improvement rates, highlighting a delayed integration between resource utilization and proactive ecological response. This layered coupling structure is consistent with the heterogeneous correlations identified in the multidimensional regression analysis and provides a systematic basis for understanding differentiated coupling characteristics across resilience dimensions.
Before estimating the P-VAR model, this paper first conducts unit root tests on the original variables; the results are shown in Table 5. The test results indicate that most variables exhibit non-stationary characteristics at the level, with only a few variables being stationary. Therefore, to avoid the problem of spurious regression, this paper applies first-order differencing to the variables and conducts subsequent analyses based on these data.
Furthermore, this paper conducted unit root tests on the variables after first-differencing, with the results shown in Table 6. Overall, the variables for the vast majority of regions passed the stationarity test after differencing, indicating that first-differencing largely eliminated the non-stationary characteristics in the original series, thereby ensuring that the data generally satisfy the prerequisites for P-VAR model estimation. This result demonstrates that differencing the variables is both necessary and effective, thus providing a sound foundation for subsequent model construction and dynamic analysis.
It should be noted that the variable related to natural resource development and utilization in the SW region did not fully pass the unit root test after first-difference transformation; however, the degree of deviation was relatively limited and did not alter the overall assessment of stationarity for the sample. Considering the results of subsequent model stability tests and the convergence characteristics observed in the impulse response functions, it can be concluded that the impact of this local non-stationarity on the model estimation results remains within an acceptable range. Therefore, this paper continues to conduct P-VAR model analysis based on the first-difference data.
Based on these findings, this paper calculates information criteria such as AIC, BIC, and HQIC, and determines the optimal lag order for each regional model based on the minimum BIC criterion. The results indicate that while there are some differences in the optimal lag orders across regions, the models generally capture the dynamic relationships among variables effectively. Furthermore, stability tests reveal that the characteristic roots of all regional models lie within the unit circle, indicating that the models satisfy stability requirements and thereby ensuring the validity and interpretability of the impulse response analysis results (Table 7).
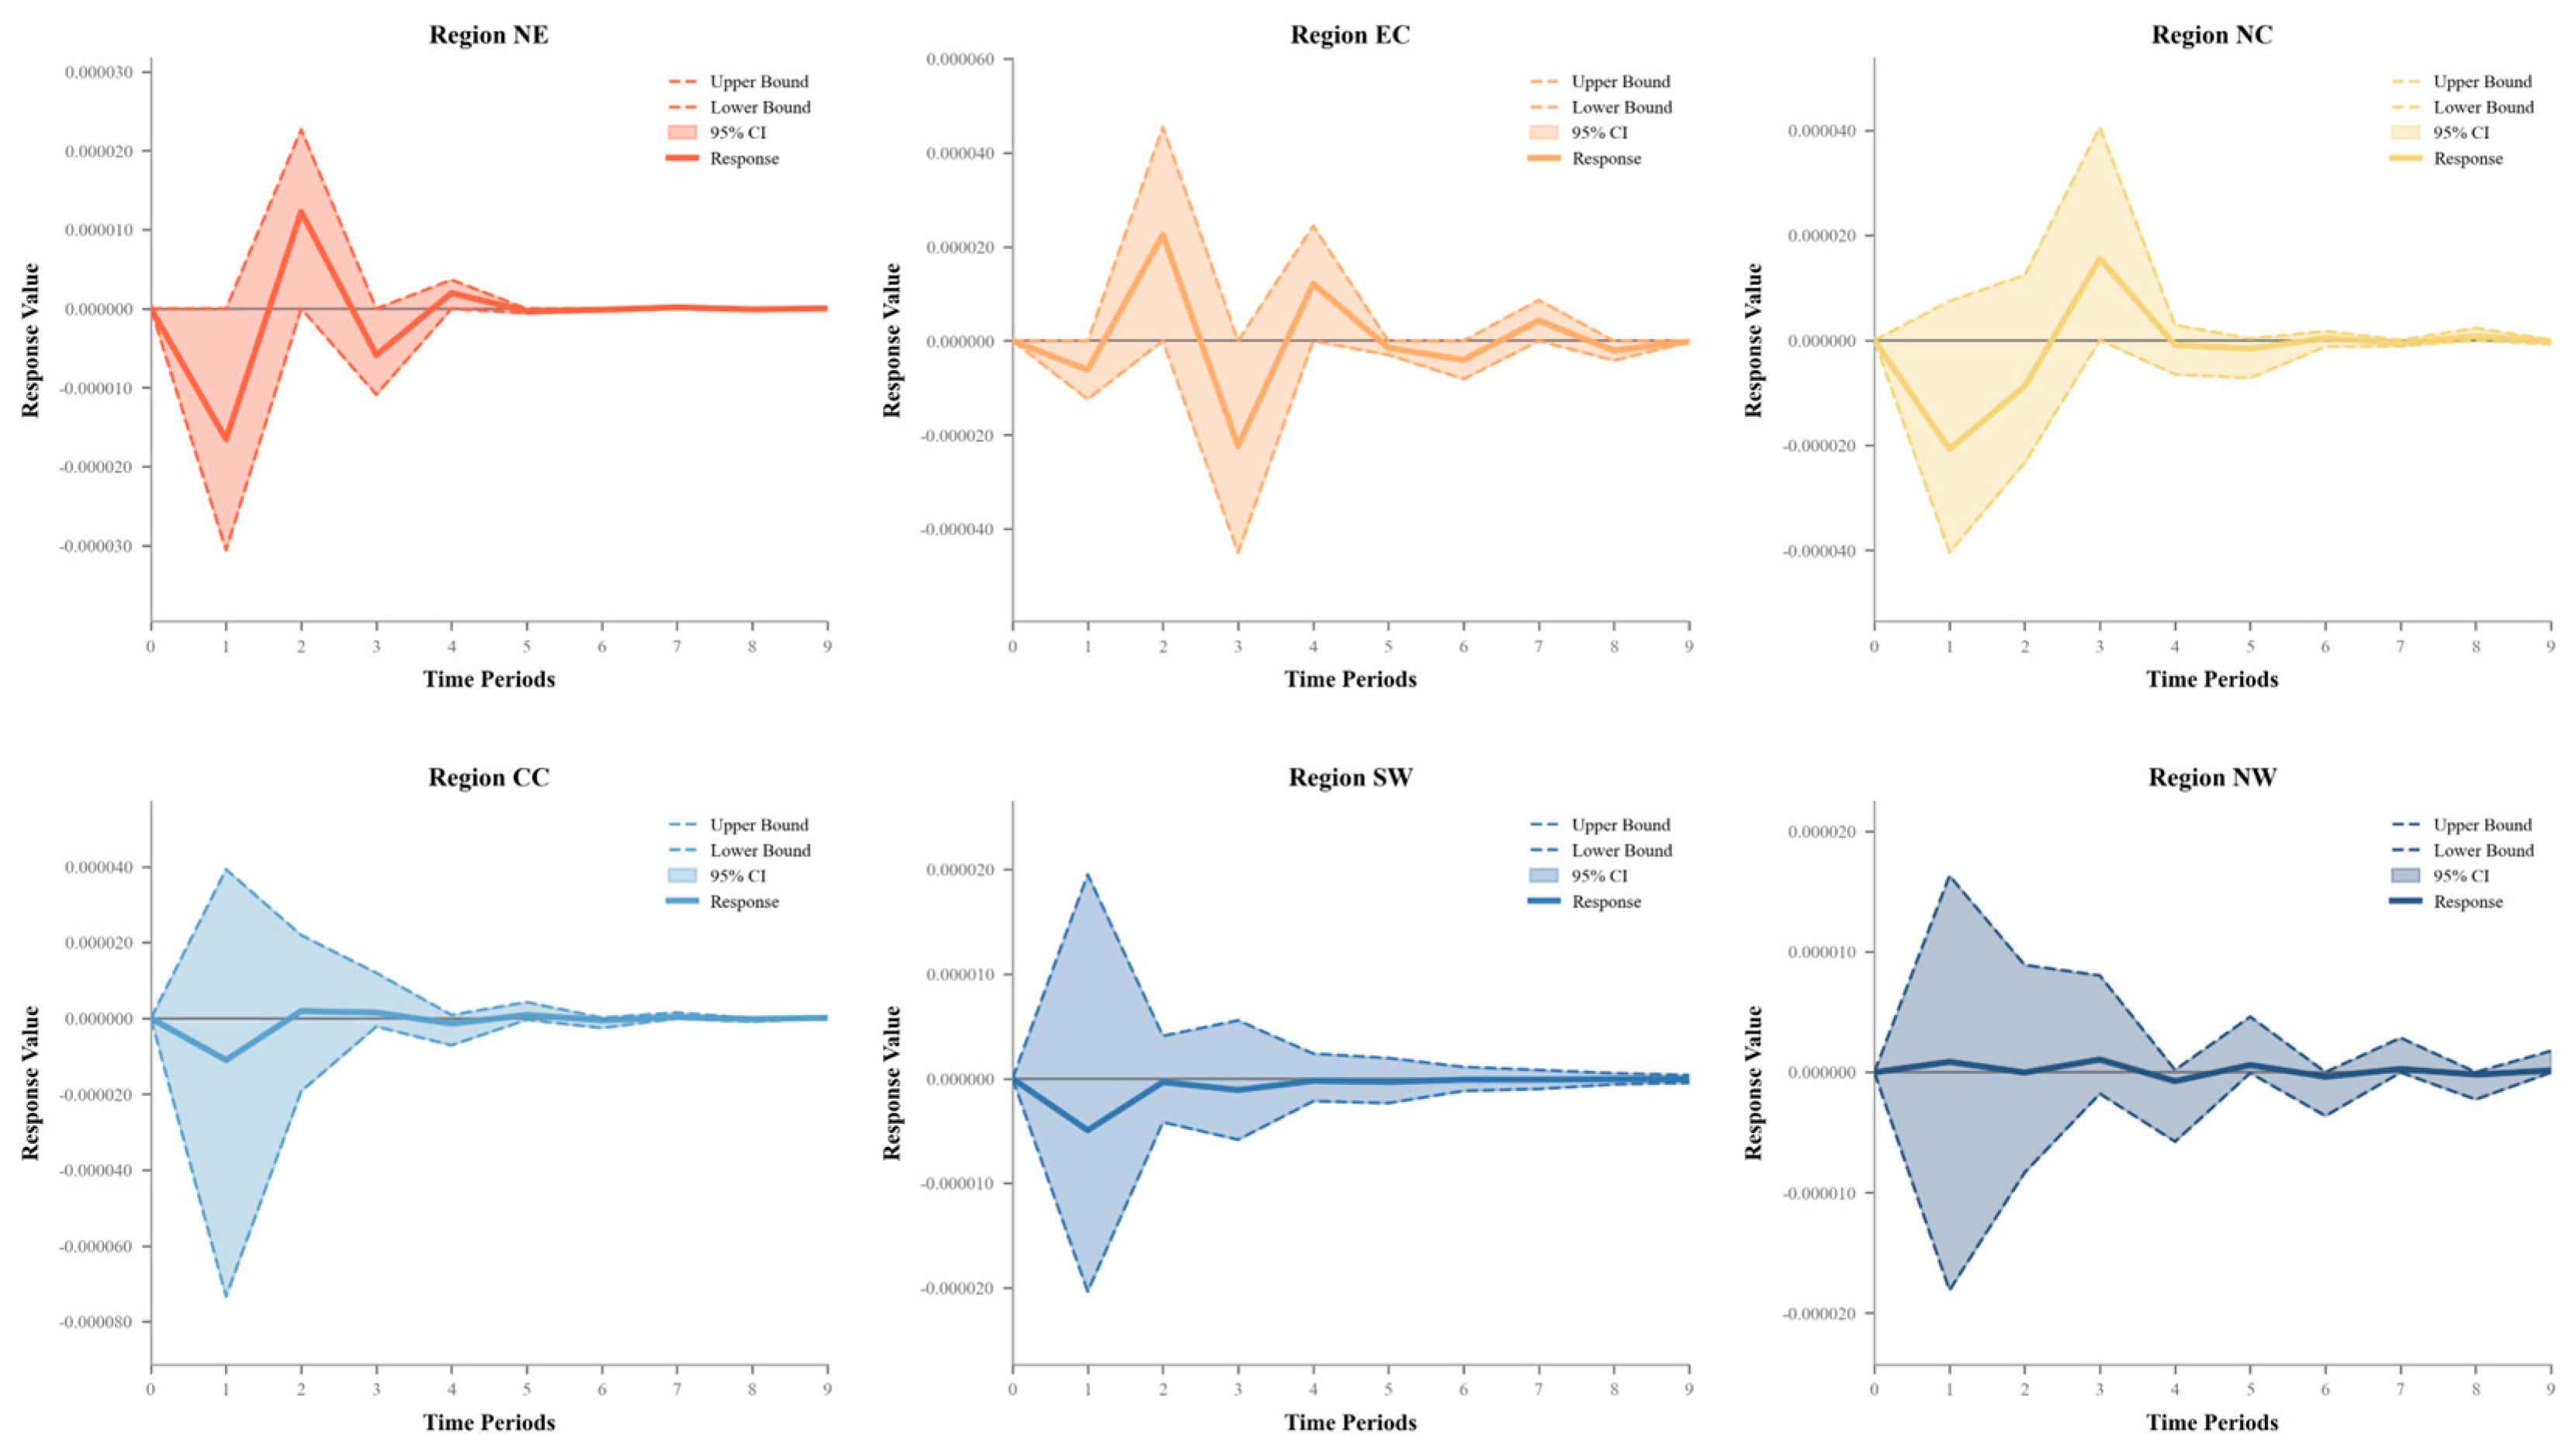
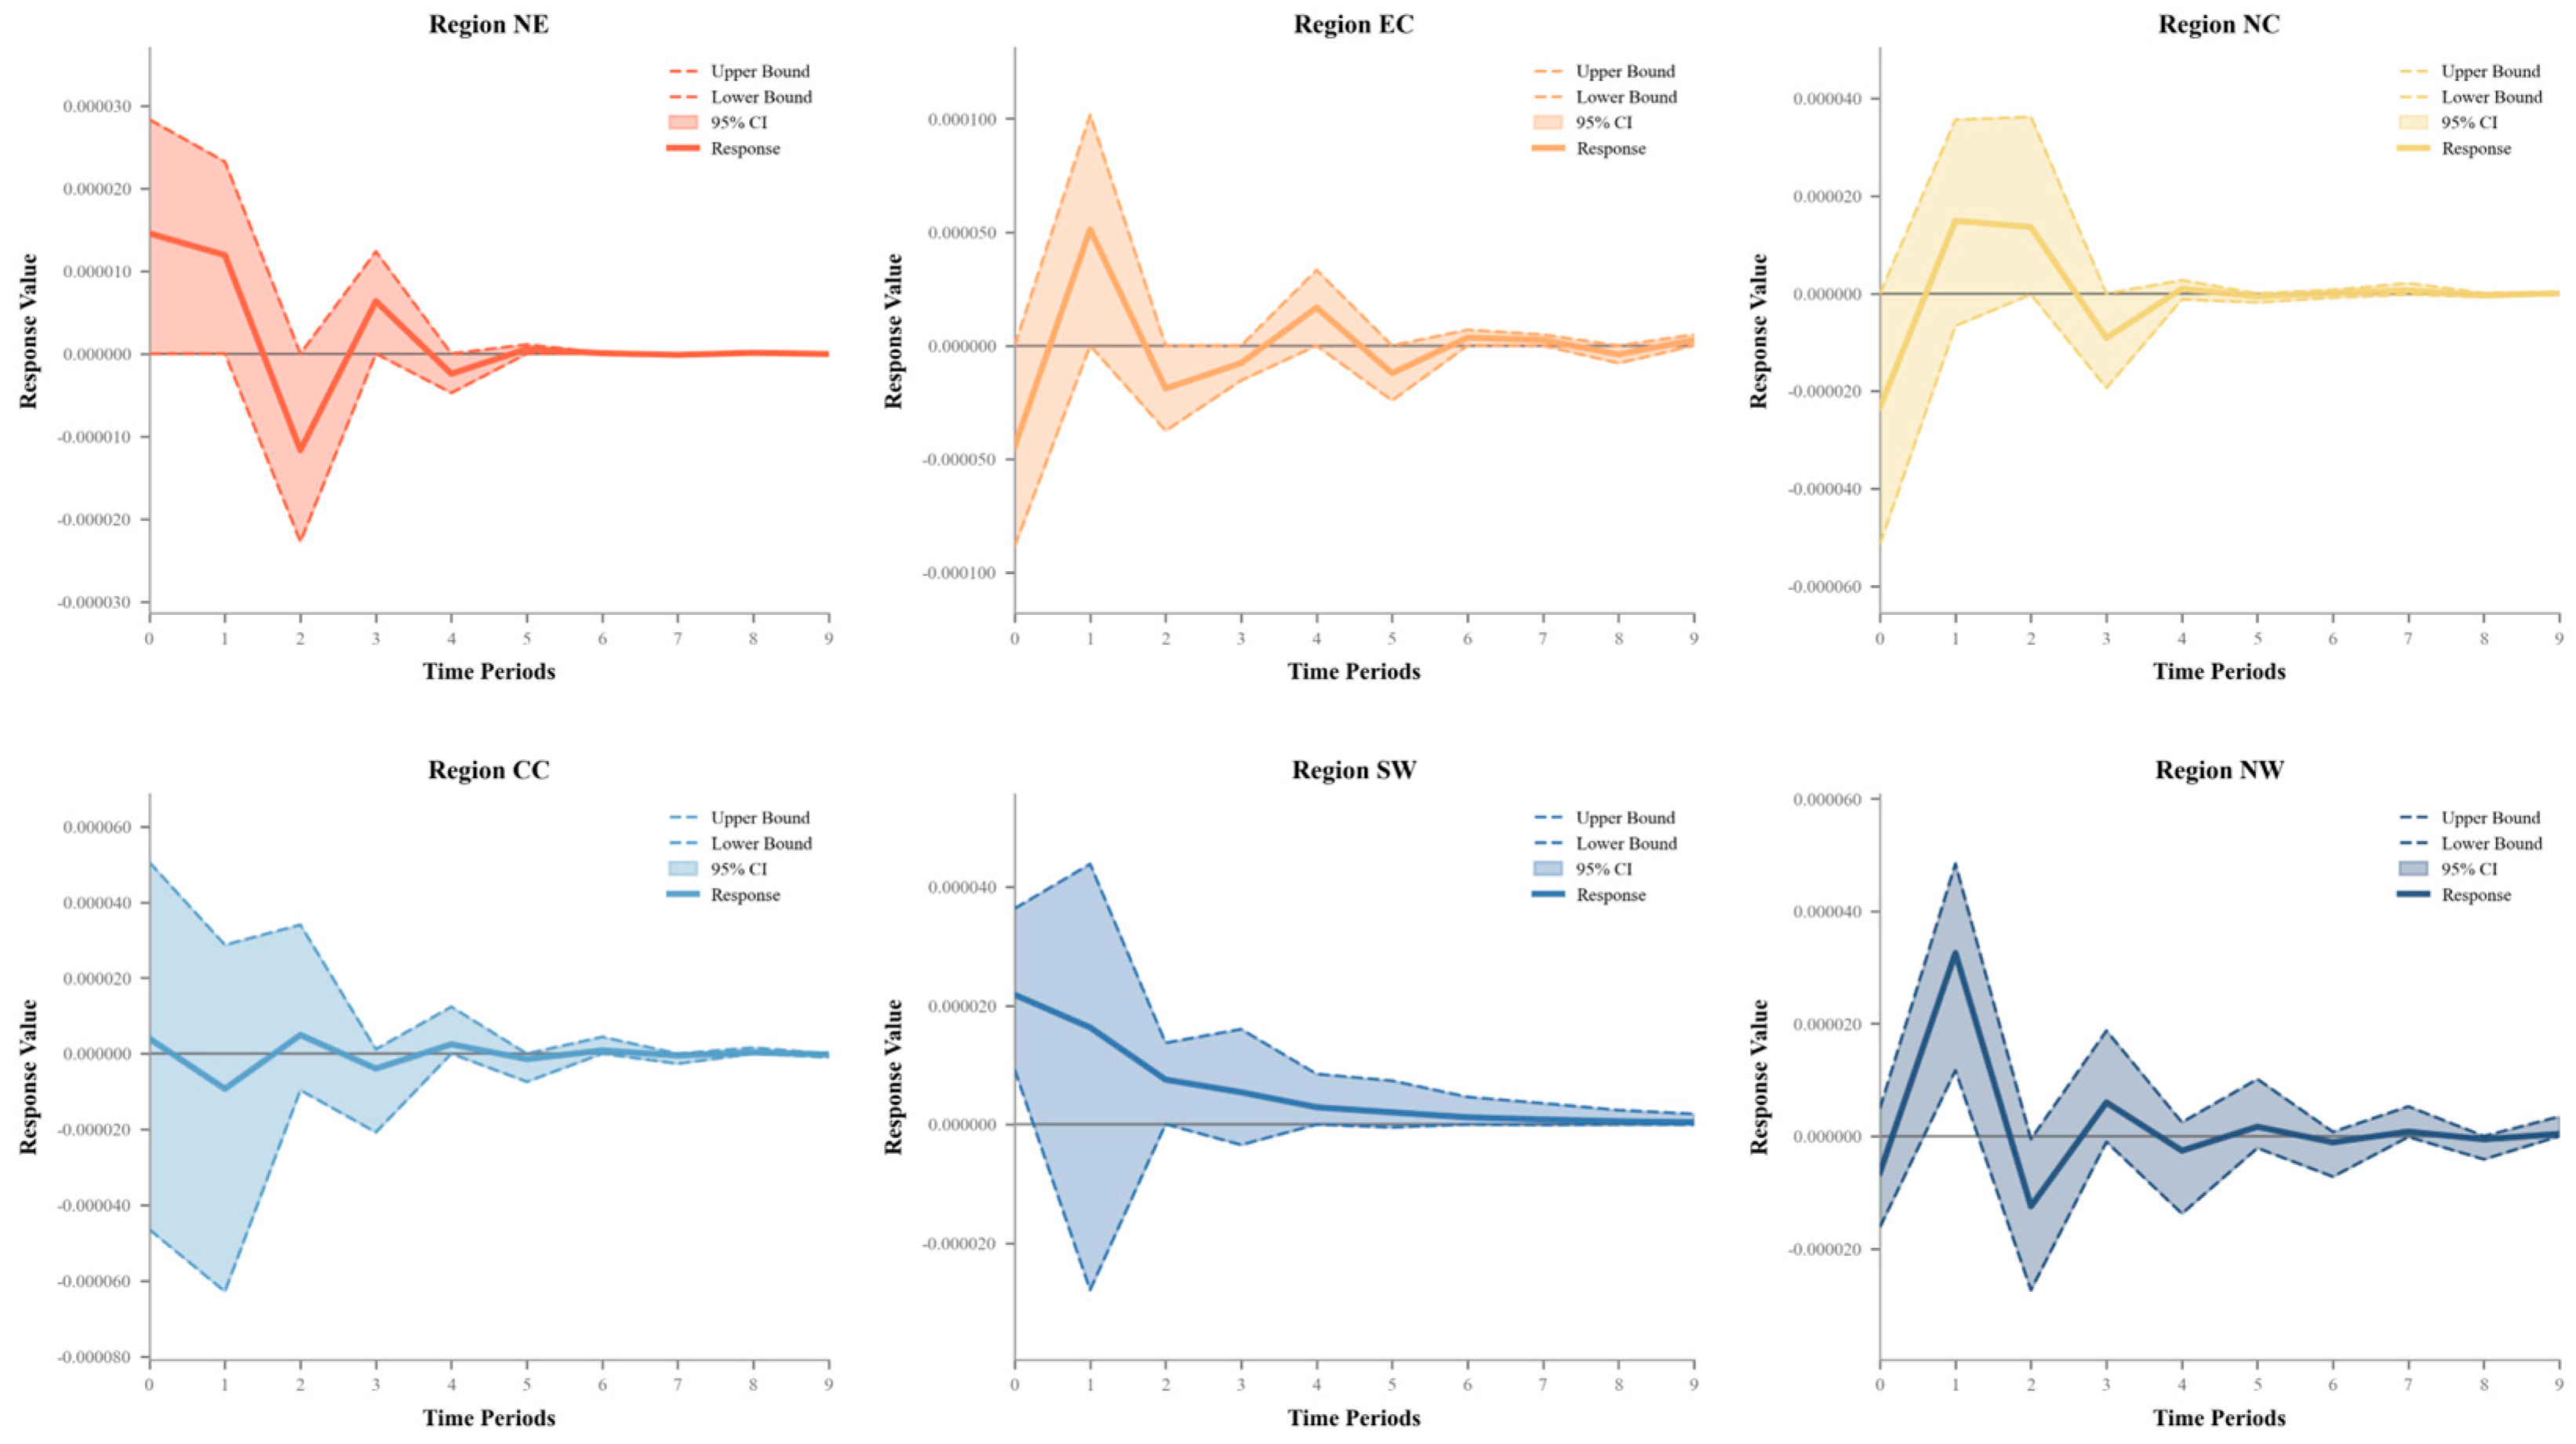
Based on the impulse response results of ER to NRU, the driving effects across the six major regions exhibit distinct phased characteristics and structural divergence (Figure 10). Overall, the response values across all regions generally exhibited negative fluctuations in the early stages of the shock, followed by a gradual recovery and convergence, indicating that the mechanism through which ecological resilience influences resource development is not a unidirectional promotion but rather a dynamic evolutionary process involving “constraint regulation—adaptive adjustment—stable convergence.” Specifically, the NE, EC, and NC regions all exhibited a relatively pronounced “suppression–rebound” trajectory in the short term, with relatively large fluctuations in their response curves. This reflects that, against the backdrop of strengthened ecological constraints, resource development activities in these regions are more sensitive to shocks, and the system’s adjustment process is more pronounced; in contrast, the response curves for the SW and NW regions were generally flatter, with the impact effects fading more rapidly, indicating that the moderating effect of ecological resilience on resource development was relatively mild and system stability was more pronounced. The CC region exhibited a strong short-term negative impact effect, suggesting that its ecological constraints exerted a more concentrated inhibitory effect on resource development; however, its subsequent adjustment also exhibited a gradual convergence pattern.
From a temporal perspective, the impact of ecological resilience on resource development and utilization follows a phased trajectory characterized by “short-term suppression, medium-term recovery, and long-term dissipation.” In Phases 1 and 2, the impact effects are rapidly released, with response values in most regions deviating significantly from equilibrium levels, reflecting the direct constraints that ecological constraints impose on resource development in the short term. Entering Phases 2 to 4, positive recovery or oscillatory adjustments gradually emerge across regions, indicating that the system absorbs and reallocates the impact through internal regulatory mechanisms; From Phase 5 onward, response values gradually converge toward zero, with confidence intervals narrowing simultaneously, indicating that the impact effects are not sustained and the system gradually returns to a steady state. This dynamic process demonstrates that the role of ecological resilience in resource development is primarily manifested in short-term constraints and medium-term regulation, rather than as a long-term driving force.
The driving effect of ecological resilience on resource development is essentially the result of the combined action of regional development foundations and eco-resource coordination mechanisms, which provides important insights for differentiated regulation. For regions with significant fluctuations, such as NE, EC, and NC, the focus should be on strengthening the coordination mechanisms between ecological constraints and resource development; by optimizing resource allocation efficiency and enhancing environmental governance capabilities, the system’s sensitivity to shocks can be reduced. For regions with relatively mild responses, such as SW and NW, efforts should focus on further stimulating the supportive role of ecological resilience to enhance its guiding effect on resource development; meanwhile, the CC region needs to strengthen ecological constraints while improving regulatory mechanisms to mitigate short-term shocks. Overall, based on regional differences, we should promote a shift in the relationship between ecological resilience and resource development from “passive regulation” to “active synergy” to achieve a dynamic balance between resource utilization efficiency and ecological security.
Based on the impulse response results of NRU on ER, the driving effects across the six major regions also exhibit significant phased characteristics and regional variations (Figure 11); however, their transmission mechanisms differ somewhat from the impact of ecological resilience on resource utilization. Overall, the response values across regions mostly exhibit a positive or oscillating upward trend in the early stages of the shock, followed by a gradual decline and convergence, indicating that the impact of resource development on ecological resilience exhibits a dynamic pattern of “initial promotion followed by adjustment.” Among these, the NE and SW regions demonstrate a relatively pronounced positive response in the early stages, suggesting that resource development provides some support for ecological resilience in the short term through capital investment, technological progress, or infrastructure improvements; In contrast, the EC and NC regions follow a fluctuating trajectory of “positive—decline—readjustment,” reflecting that while resource development promotes ecological resilience, it may also impose certain ecological pressures, leading the system into a phased adjustment process; by comparison, the response curves in the CC and NW regions exhibit more pronounced fluctuations with frequent alternations between positive and negative trends, indicating that the interactive relationship between resource development and the ecosystem remains unstable, and the system is highly sensitive to shocks.
From a temporal perspective, the impact of natural resource development on ecological resilience exhibits a phased pattern characterized by “short-term promotion—medium-term fluctuations—long-term convergence.” In periods 1 to 2, response values in most regions rose rapidly, indicating that resource development activities had a certain positive driving effect on ecological resilience in the early stages; from periods 2 to 4, responses in various regions gradually declined or fluctuated, suggesting that as the intensity of development increased, the pressure on the ecosystem gradually became apparent, and the system began to enter a self-regulation phase; from phase 5 onward, response values gradually converged toward zero, with confidence intervals narrowing simultaneously, indicating that this impact effect does not exhibit sustained cumulative characteristics, and the ecosystem ultimately returns to a relatively stable state. This evolutionary process contrasts with the “short-term constraints” that ecological resilience imposes on resource development, as discussed earlier, further revealing the bidirectional interactive relationship between the two.
Upon further examination, regional disparities reflect structural differences between resource development models and ecological carrying capacity. Regions exhibiting relatively stable responses and pronounced positive effects indicate that their resource development has, to a certain extent, provided positive support for ecological resilience, with a high degree of coordination between development and conservation. Conversely, regions with significant fluctuations suggest that a stable synergistic mechanism between resource development and ecosystems has not yet been established, making them prone to oscillating between promotion and constraint. Based on this, resource development pathways should be optimized according to regional differences: For regions such as NE and SW, which exhibit strong short-term positive effects, efforts should be made to further consolidate the supportive role of resource development in ecological resilience and enhance the level of green development; for regions such as EC and NC, which exhibit significant fluctuations, dynamic regulation of the relationship between development intensity and ecological carrying capacity should be strengthened to avoid systemic fluctuations caused by overdevelopment. For regions with unstable responses, such as CC and NW, the focus should be on improving ecological restoration and risk buffering mechanisms to enhance the system’s resilience to shocks. Overall, efforts should be made to shift resource development from a “scale-expansion orientation” to an “ecological resilience orientation,” thereby achieving dynamic synergy and long-term equilibrium between development and ecosystems.
Overall, the relationship between ecological resilience and resource development is not a unidirectional one. Rather, it manifests as a bidirectional interactive structure characterized by the interplay of constraints and feedback, with a distinctly asymmetrical dynamic. Ecological resilience primarily manifests as phased constraints on resource development, whereas resource development exerts a feedback effect on ecosystems—first promoting their growth and then inducing adjustments. This characteristic indicates that the relationship between the two is essentially a process of gradually achieving dynamic rebalancing under the combined influence of constraint and adaptation mechanisms. Furthermore, differences in responses across regions reflect structural constraints related to development foundations and ecological carrying capacity, while the evolutionary path of convergence over time reveals that the ecosystem-resource synergy exhibits characteristics of endogenous adjustment and gradual stabilization. Based on this, ecological constraints and restoration capabilities should be strengthened in regions with relatively weak synergistic foundations, such as NE and NW, while consolidating the synergistic advantages of regions like EC and CC. This will promote a shift in resource development and ecological resilience from phased regulation to endogenous synergy, thereby achieving long-term stable interaction between the two.

4.4.2. CCD Between NRU and ER Across Six Major Regions

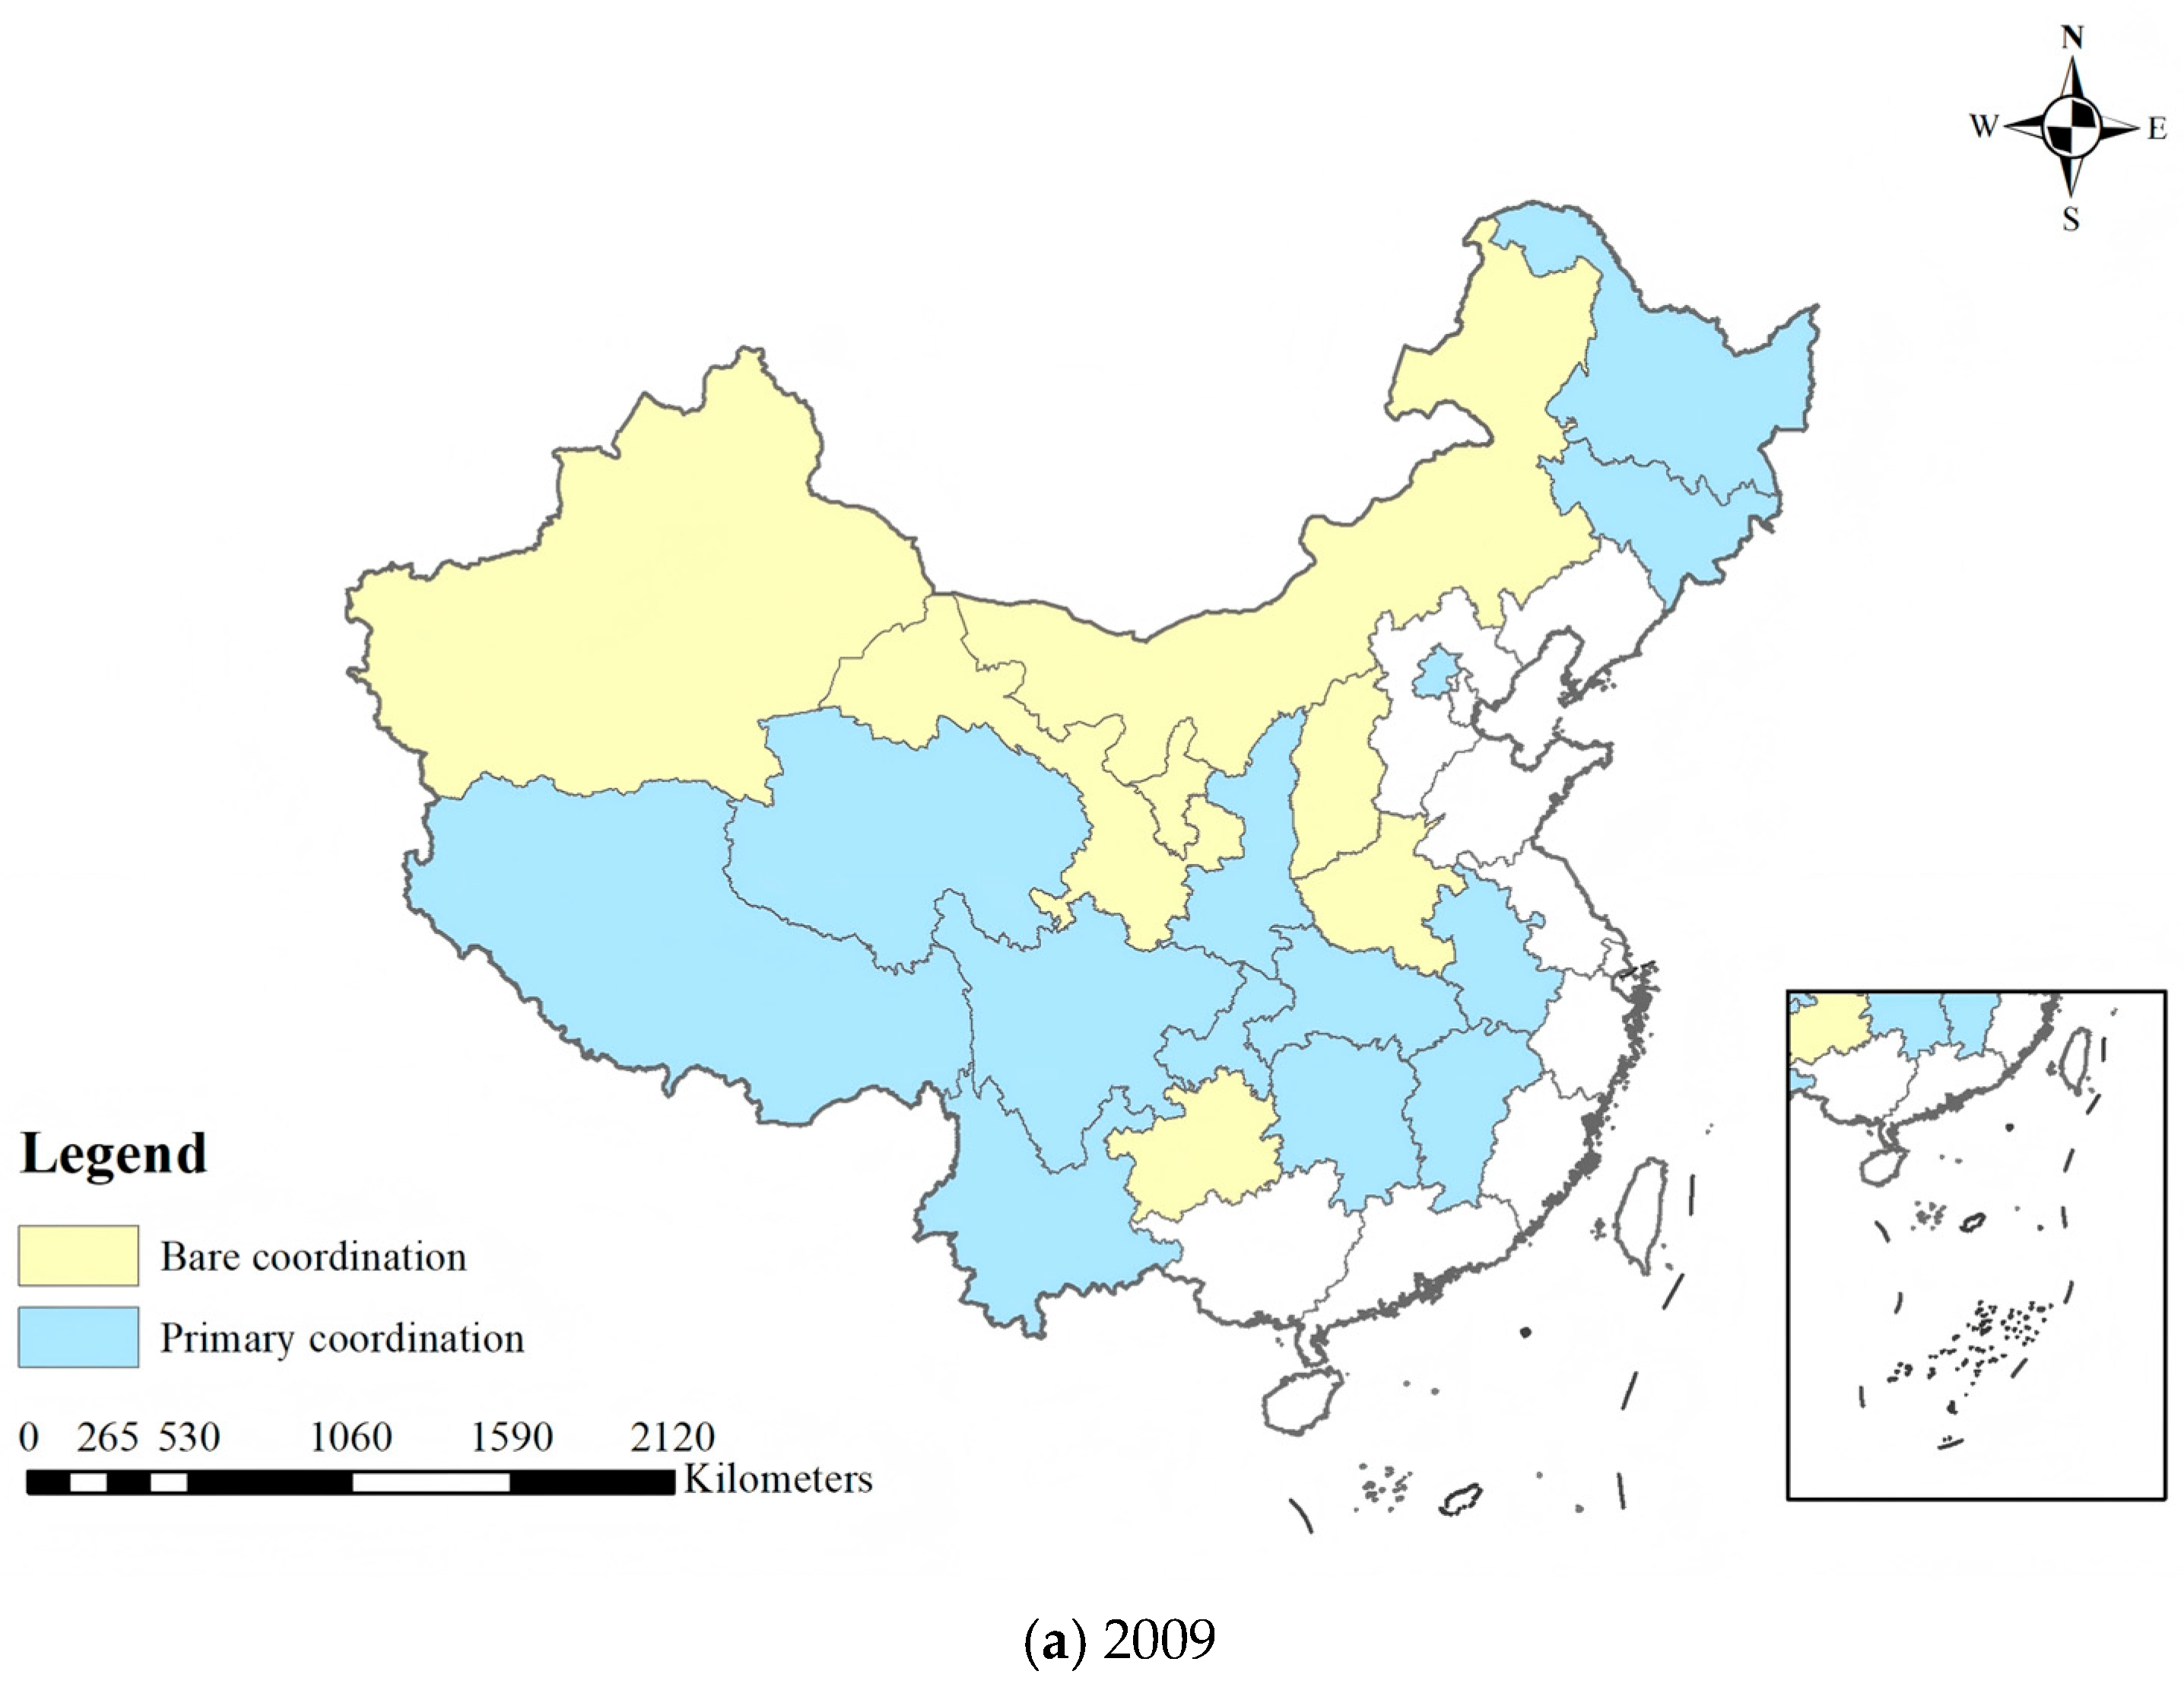
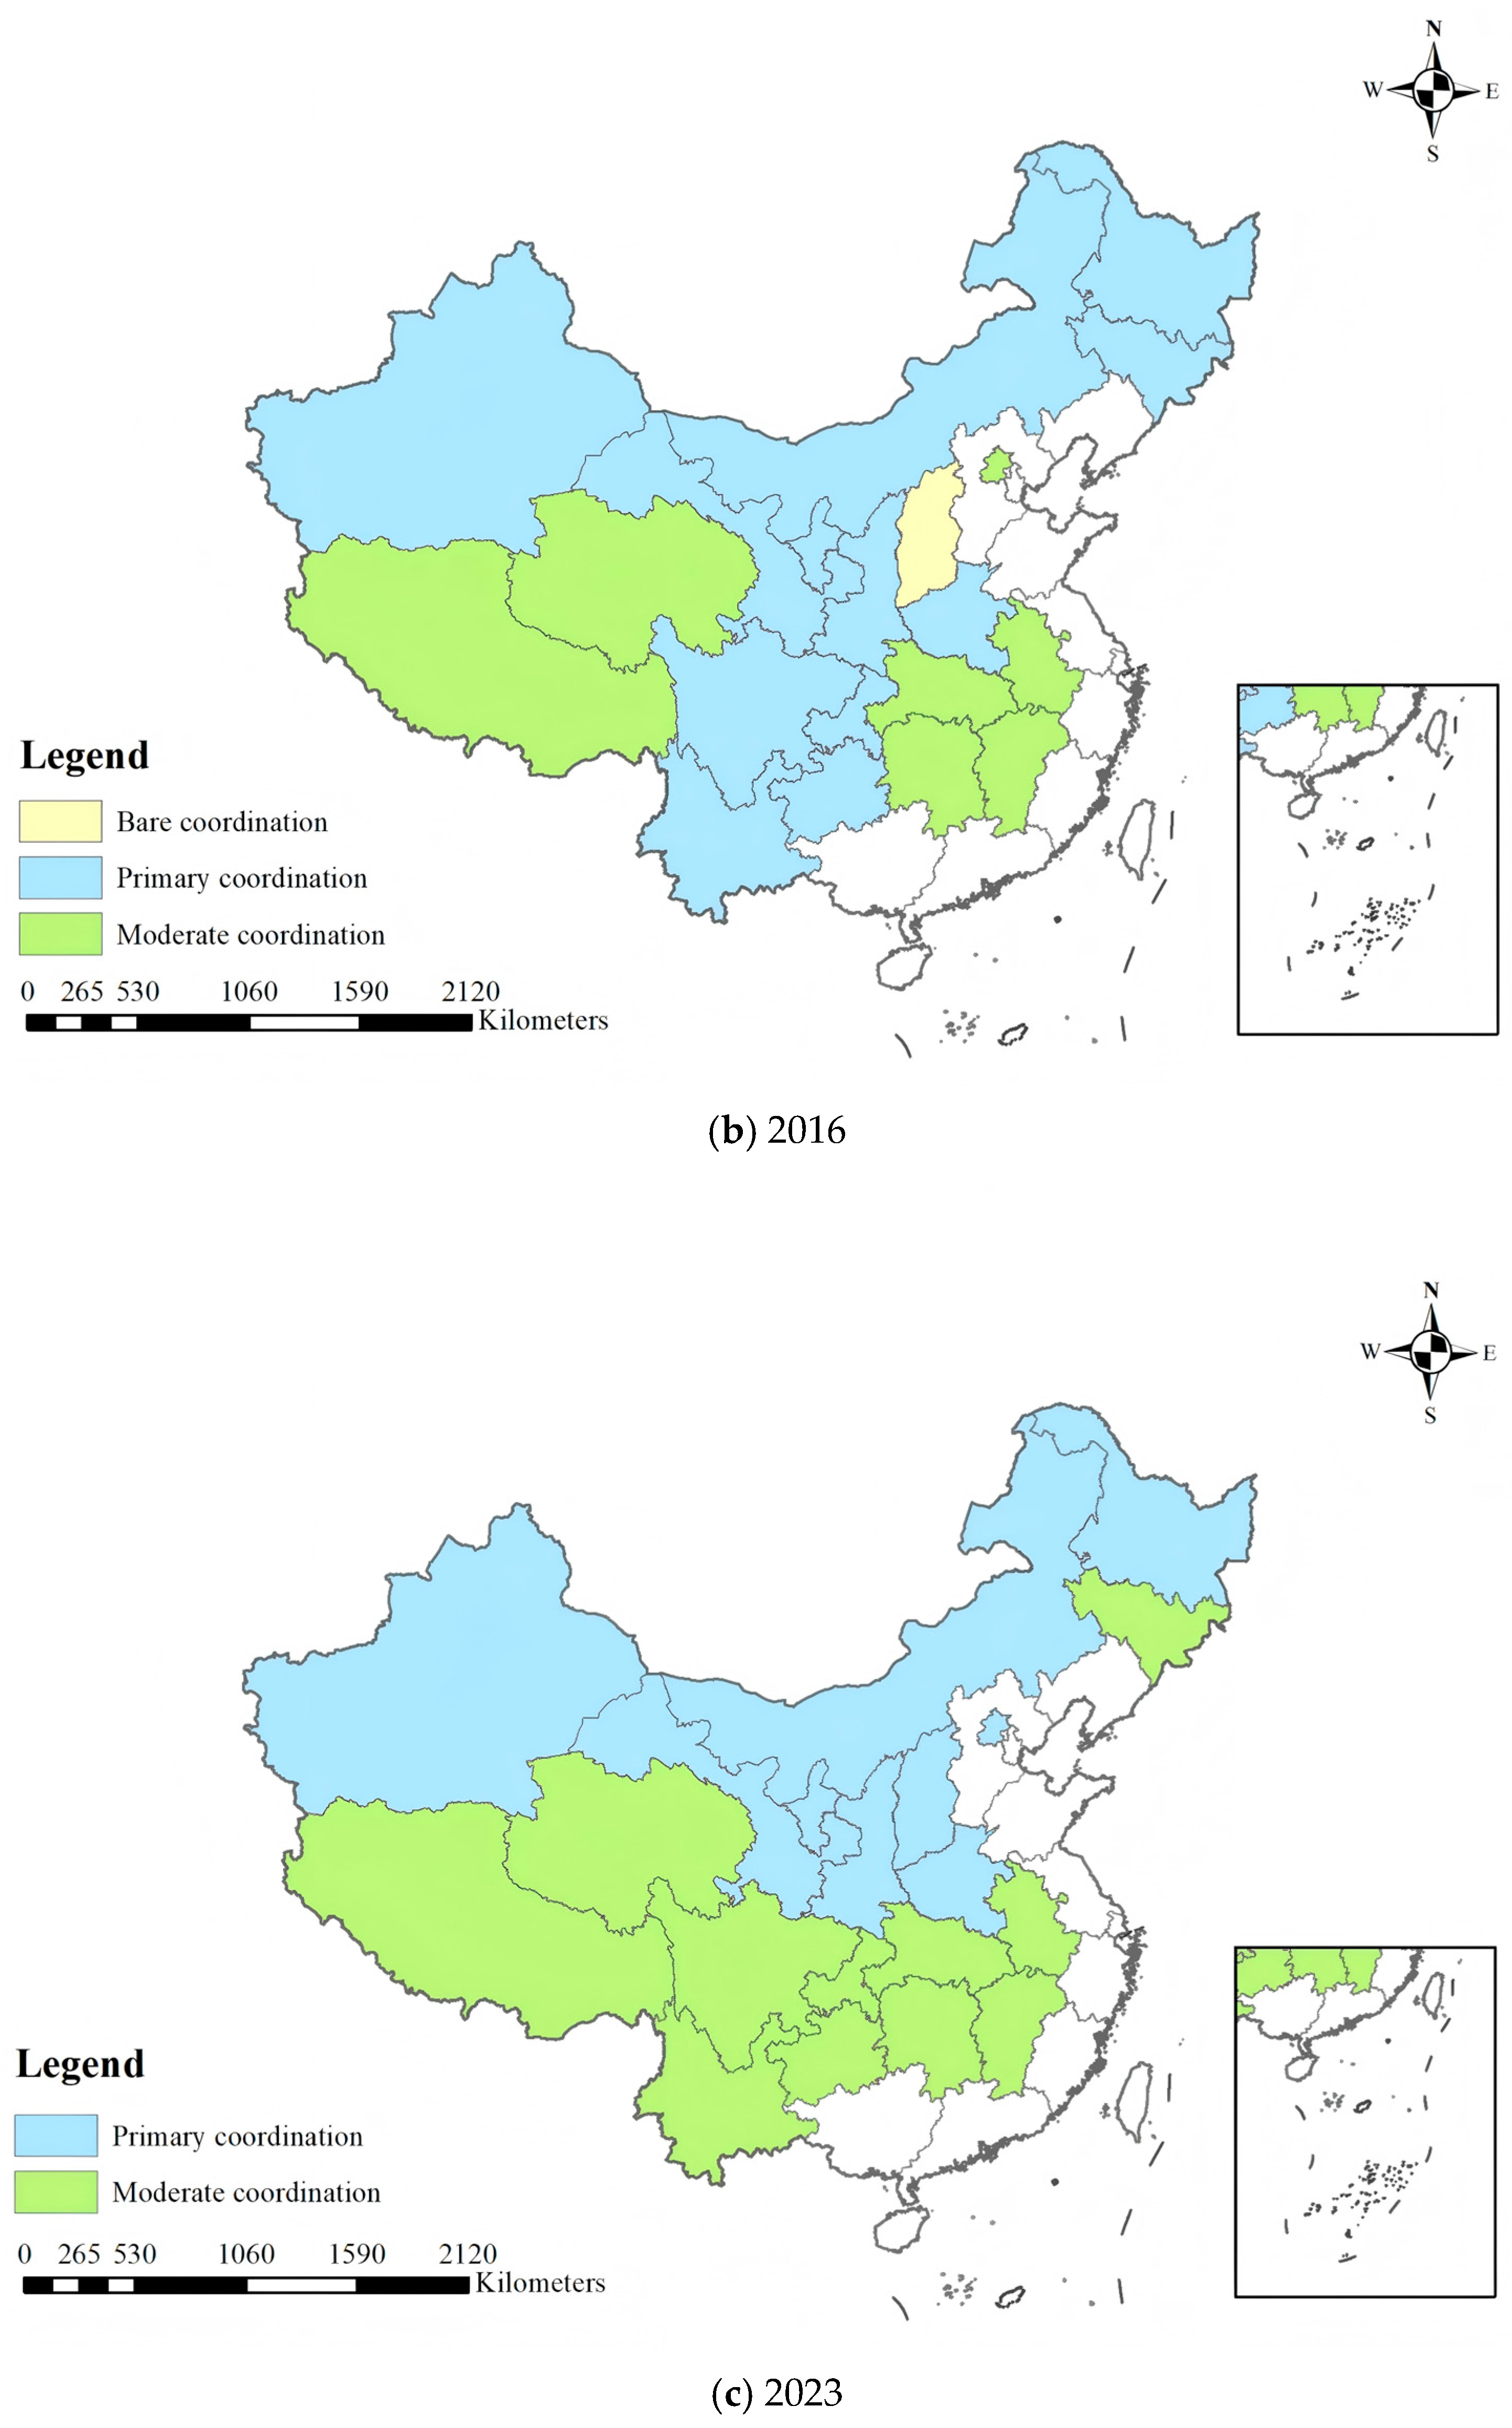
The coordination level across provinces in China’s inland area shows a stepwise improvement from 2009 to 2023 (Figure 12). In 2009, provinces in the EC region such as Anhui and Jiangxi were still at a barely coordinated level. By 2016, central provinces including Hubei and Hunan were among the first to enter primary coordination. By 2023, Anhui and Jiangxi had stabilized at intermediate coordination, while provinces such as Henan and Sichuan had progressed from barely coordinated to primary coordination. This temporal progression is consistent with the national upward trend in coupling coordination and illustrates the gradual strengthening of provincial capacity to align natural resource utilization with ecological resilience.
The coupling coordination level within China’s inland area exhibits a stable spatial differentiation pattern, with the EC and CC regions consistently leading, followed by the NW and SW regions (Figure 12). Provinces in the EC region, such as Anhui and Jiangxi, show the fastest improvement in coordination levels and form the core of intermediate coordination by 2023, which is consistent with the strong regional synergy identified in the previous regression analysis. In contrast, provinces in the NW region, including Gansu and Qinghai, experience continuous growth in coordination levels but remain predominantly at the primary coordination stage in 2023, indicating a substantial gap relative to EC region provinces. This divergence corresponds both to stronger supporting mechanisms for ecological governance and resource development in provinces such as Anhui and Jiangxi and to the more pronounced constraints imposed by ecological baseline conditions in provinces such as Gansu and Qinghai.
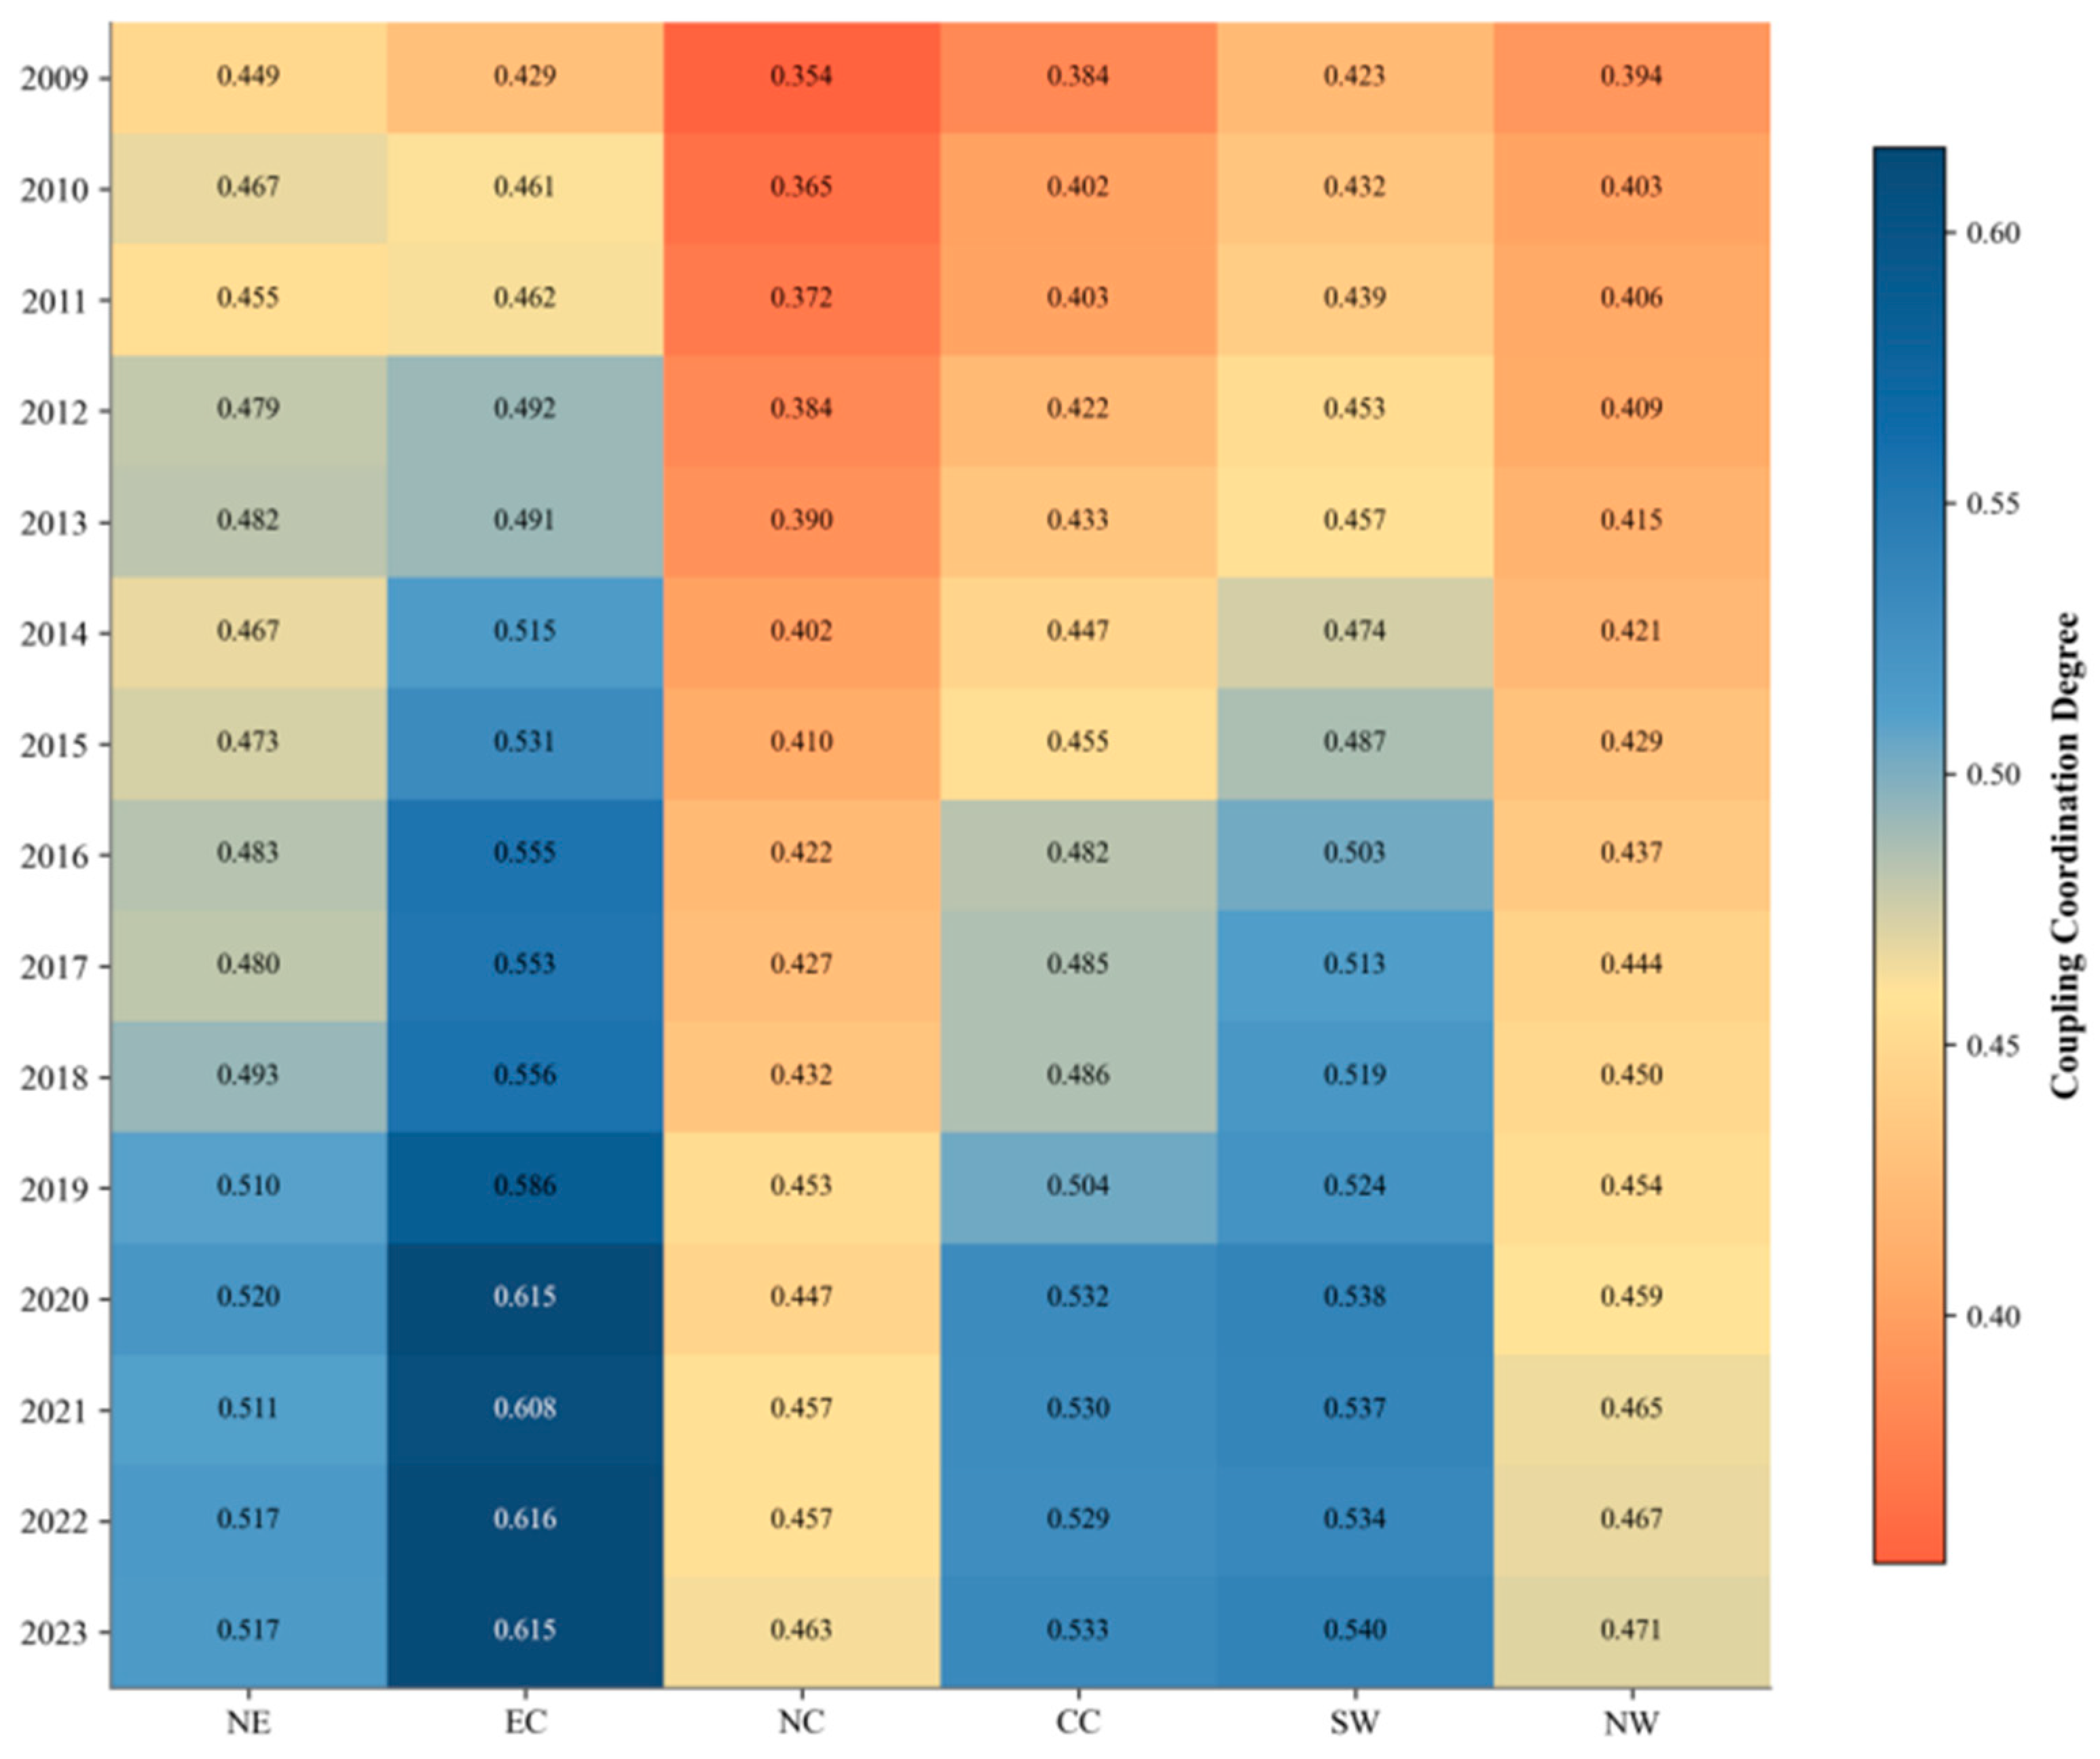
The spatial pattern of coupling coordination in China’s inland regions is characterized by a gradual expansion of high-value areas from EC toward CC and SW (Figure 13). Throughout the study period, EC remained the leading region, with its coupling coordination degree rising from 0.429 to 0.615. Meanwhile, CC and SW increased from 0.384 and 0.423 to 0.533 and 0.540, respectively, and gradually became the principal regions receiving the outward diffusion of high-value coordination. By contrast, although NE, NC, and NW also improved, rising from 0.449, 0.354, and 0.394 to 0.517, 0.463, and 0.471, their overall levels remained relatively low. In stage-specific terms, the post-2016 period saw a broad acceleration in coupling coordination across all regions, with particularly marked gains in CC and SW, further driving the extension of high-value areas from the eastern core toward the central and southwestern hinterlands. Overall, the coupling coordination pattern between natural resource development and ecological resilience in China’s inland regions has evolved from an initially low-level and scattered distribution into a medium- to high-level agglomeration pattern centered on EC and jointly supported by CC and SW, while NC and NW remain key areas for further improvement.
Over the 15-year study period, coordination levels across inland provinces evolved from a pattern of low-level dispersion toward one of medium-to-high aggregation. Provinces such as Anhui and Jiangxi exhibit relatively mature coordination mechanisms, whereas provinces including Gansu and Qinghai remain at lower coordination levels, indicating substantial room for further improvement in synergistic development.


5. Discussion

5.1. Driving Mechanism of Asynchronous Evolution

NRU and ER exhibit asynchronous evolution, characterized by the relative lead of resource development optimization and a lag in the enhancement of ecological resilience. This discrepancy may be related to the differing mechanisms underlying the two processes. Improvements in the NRU index primarily reflect a decline in development intensity and an increase in utilization efficiency and are typically associated with industrial restructuring and resource-constraining policies [4,23], and their effects are more readily apparent in the short term. In contrast, improvements in ecological resilience depend on the restoration of ecosystem structure and function, a process that is relatively slow [9]. Similar temporal mismatches have also been observed in studies of resource-based regions [9], collectively indicating a certain lag in the transmission of optimized resource development to ecosystem restoration.

5.2. Causes of Structural Imbalance in Synergy

Structurally, the synergistic relationship is dominated by stress resilience, while state and response resilience are relatively weaker, reflecting differences in how various dimensions of resilience respond to resource development. Enhancing stress resilience relies more on direct regulatory measures such as environmental oversight and development constraints; such measures can reduce ecological stress relatively quickly [13]. In contrast, the development of state and response resilience depends on the maintenance of ecological baseline conditions, system restoration, and the accumulation of adaptive capacity, a process that is relatively slow [32]. Against this backdrop, synergistic effects are more likely to manifest first in the stress dimension, while improvements in dimensions related to system stability and adaptability lag behind, illustrating the differing pathways through which various resilience dimensions operate during resource development.
5.3. Mechanism Underlying Bidirectional Dynamic Interactions

There is a bidirectional interaction between NRU and ER, characterized by asymmetric pathways and the dominance of different mechanisms at different stages. The short-term inhibitory effect of ecological resilience on resource development is largely related to direct constraints imposed by ecological factors on development activities, such as environmental regulations and resource carrying capacity constraints [28]. In contrast, resource development in the early stages is often accompanied by improvements in infrastructure and investments in governance, which generate certain short-term positive effects on ecosystems [25]. As the intensity of development accumulates, ecological pressures gradually emerge, and the system subsequently enters a phase of adjustment and tends toward convergence. Overall, this dynamic process reflects the phased interactive characteristics between resource development and ecosystems, shaped by the combined effects of constraints and feedback, which aligns with the understanding of the socio-ecological adaptation cycle [9].

5.4. Underlying Causes of Regional Differences

The high level of synergy between the EC and CC regions may be attributed to their diversified industrial structures, higher governance investments, and stronger institutional enforcement capabilities, which facilitate the translation of optimized resource development into enhanced ecological resilience [14]. Related studies also indicate that governance capacity and the level of infrastructure development often contribute to improving ecosystem adaptability and recovery capacity, thereby strengthening the overall resilience of the system [4,10], a trend consistent with the findings of this study.
In contrast, the NW and SW regions are more resource-dependent and have relatively fragile ecological foundations; development activities are more likely to exert sustained pressure on ecosystems, thereby limiting the potential for enhanced synergy. This characteristic is common in resource-dependent regions, where increased intensity of resource development is often accompanied by rising energy consumption and environmental pressures, which further undermine ecosystem stability [39,40]. At the same time, policy orientations in these regions have long prioritized support for resource development, with a relative lack of ecological constraints and restoration mechanisms, making it more difficult to effectively mitigate the negative externalities of resource development activities. This finding is also consistent with research indicating a structural tension between resource utilization efficiency and environmental constraints.
In addition, the NE and NC regions exhibited greater volatility, which to some extent reflects the system’s heightened sensitivity to shocks under conditions where industrialization and ecological constraints coexist. This volatility may be related to the dynamic adjustment effects arising from the concurrent advancement of industrial transformation and environmental regulation policies. Specifically, the phased tension between resource development activities and ecological governance objectives causes the system to exhibit unstable evolutionary characteristics. Similar studies have also found that under the combined influence of environmental regulations and economic development goals, regional ecological resilience often exhibits greater volatility and path dependence [32]. Overall, the synergistic process between resource development and ecological resilience is jointly influenced by differences in developmental foundations, ecological constraints, and regional policy trajectories.

6. Conclusions and Policy Implications

6.1. Conclusions

This study focuses on six major regions within China’s inland area and systematically examines the relationships between natural resource utilization and ecological resilience from three core perspectives: spatial differentiation of indices, coupling coordination characteristics, and the evolution of interaction mechanisms. The main conclusions can be summarized as follows.
(1)
The NRU and ER have shown a sustained trend of improvement, but their evolutionary trajectories and regional differentiation exhibit significant variations. The NRU index has risen steadily overall, indicating a continuous decline in the intensity of resource exploitation. However, the pace of improvement varies markedly across regions, with high-value regions optimizing faster and low-value regions lagging behind. Regional disparities are widening, forming a gradient pattern of development characterized by higher levels in the west, lower levels in the east, and intermediate levels in the central regions. In contrast, the ER index has shown a sustained upward trend with periodic accelerations, with all regions achieving varying degrees of improvement. Regional differences have changed relatively gradually, with no significant convergence observed, resulting in a spatial pattern characterized by the eastern regions leading and levels decreasing in a stepwise manner.
(2)
The coupling coordination degree between natural resource utilization and ecological resilience shows a sustained upward trend over time, accompanied by pronounced regional divergence. Across the inland area, coupling coordination has gradually shifted from low-level dispersion toward medium-to-high-level aggregation. However, the quality of coordination varies substantially among regions. The EC and CC regions have achieved relatively stable intermediate coordination and exhibit the strongest positive associations between development and resilience. The NC and NE regions are transitioning from primary to intermediate coordination, showing favorable overall index synergy but relatively weaker stability in the coordination of state resilience and response resilience. The NW and SW regions continue to improve but remain predominantly at the primary coordination stage. In some provinces, localized divergence between development intensity and ecological baseline protection persists, resulting in comparatively weaker coupling coordination.
(3)
There is a significant bidirectional dynamic relationship between NRU and ER, characterized by asymmetric pathways. ER exerts a “short-term inhibitory—medium-term restorative—long-term convergent” effect on NRU, whereas NRU exerts a “short-term promotional—medium-term fluctuating—long-term dissipating” effect on ER. The impact of both variables converges to near zero after the fifth period, indicating that these effects are not persistent. In terms of regional differences, the NE, EC, and NC regions exhibit greater fluctuations and higher system sensitivity, while the CC region experiences more concentrated short-term impacts. The SW and NW regions, in contrast, demonstrate relatively milder responses and faster convergence. Overall, the relationship between the two is essentially a process of phased adjustment and dynamic rebalancing driven by constraint and adaptation mechanisms.
(4)
The NRU index shows a significant positive correlation with ecological resilience (0.81, R 2 = 0.77), but the co-evolutionary relationship exhibits marked structural imbalances. This positive relationship corresponds to co-evolutionary characteristics against a backdrop of reduced resource development intensity and improved utilization efficiency, essentially manifesting as a constraint relationship between resource development intensity and ecological resilience. The correlation between pressure resilience and NRU index is the strongest (0.79, R 2 = 0.75) and dominates, while state resilience (0.42, R 2 = 0.38) and response resilience (0.21, R 2 = 0.19) are notably weaker. Ecological governance remains focused on pressure response, with insufficient support for stability and adaptability. Regionally, the EC and CC regions exhibit higher levels of synergy, while the NE, NW, and SW regions are generally weaker. Furthermore, there is a disconnect between the state and response dimensions, with localized instances where increased resource development and utilization coexist with fluctuations in ecological status. Overall, the structure is characterized by “intensified pressure, insufficient state, and lagging response,” with significant regional differentiation. This structural framework explains the dynamic characteristics of “short-term constraints—phased adjustments—long-term convergence” observed in the pulse response.
Based on the above conclusions, the theoretical predictions of this study regarding the relationship between NRU and ER are supported by empirical evidence. The two do not exhibit a single static relationship but rather demonstrate asynchrony in their spatiotemporal evolution. In dynamic interactions, they exhibit asymmetry in their bidirectional effects, manifesting at the structural level as a dimensional imbalance characterized by pressure dominance and insufficient state and response. This indicates that the relationship between resource development and ecosystems is not linear, but rather a dynamic rebalancing process formed through the combined action of constraint and adaptation mechanisms. Consequently, this deepens our understanding of the mechanisms of resource-ecosystem co-evolution from an empirical perspective.

6.2. Policy Implications

The NRU-ER system is characterized by the dominance of stress resilience, whereas state and response resilience remain relatively weak. This structural imbalance suggests that current governance approaches primarily focus on scale control. Consequently, there is insufficient consideration given to the restoration of ecosystem functions. In light of this situation, it is necessary to shift the governance perspective from end-of-pipe restrictions to the maintenance of ecosystem functions throughout the entire process. By mandatorily incorporating engineering measures such as vegetation restoration and soil improvement into mineral and land development regulations, and by establishing ecological bottom lines for the use of water and soil resources, we can effectively mitigate the damage caused by resource development to core ecological structures. Furthermore, directing fiscal resources toward ecosystem restoration is a key pathway to addressing the shortcomings in state and response resilience and enhancing the long-term stability of the system.
Given the temporal mismatch between the two systems, the focus of policy design lies in establishing a dynamic adjustment mechanism that aligns with the development cycle. During the initial phase of development, proactive constraints—such as environmental access thresholds and carrying capacity assessments—can help mitigate short-term ecological impacts resulting from reckless resource expansion. Once the system enters the adjustment phase, timely increases in restoration investments and efforts to optimize the industrial structure—in response to the adjustment pressures arising from diminishing resource benefits—will help offset potential systemic risks.
Significant disparities in transformative capacity across regions dictate that governance strategies should adopt differentiated approaches. The eastern and central regions possess advantages in technological spillovers, which can drive the transition of resource utilization toward low-impact, high-value-added models; the northeastern and northern regions, characterized by high systemic volatility, can enhance their resilience to shocks by establishing risk early-warning and dynamic regulatory systems; meanwhile, ecologically fragile areas such as the northwest and southwest can improve their ecological baseline through ecological compensation mechanisms and green development demonstration projects. Establishing cross-regional collaboration platforms to facilitate the orderly flow of governance expertise and resources between regions is an effective means of curbing the continued widening of regional disparities.
The coexistence of a decline in overall resource development intensity and worsening regional imbalances underscores the importance of spatial coordination. Establishing a unified national monitoring and evaluation platform and regularly publishing coordination indices can provide a scientific basis for the cross-regional optimization of resource allocation. For local areas with relatively high development intensity and lagging coordination levels, implementing moderate load reduction in conjunction with industrial relocation policies can prevent the excessive concentration of resource activities in ecologically fragile regions. Through multidimensional spatial coordination and policy synergy, the utilization of natural resources and ecological resilience are expected to evolve from asymmetric coordination toward a high-level dynamic equilibrium.

Author Contributions

Z.L.: conceptualization, methodology, validation, formal analysis, data curation, writing—original draft. D.L.: conceptualization, methodology, writing—original draft, supervision. L.G.: validation, data curation. H.Z.: validation, data curation. All authors have read and agreed to the published version of the manuscript.

Funding

This research was funded by the Sichuan Science and Technology Program (Grant No. 2026NSFSC0236) and the Sichuan Mineral Resources Research Center (No. SCKCZY2024-ZD001). The APC was funded by the above funders.

Institutional Review Board Statement

Not applicable.

Informed Consent Statement

Not applicable.

Data Availability Statement

Data will be made available on request.

Conflicts of Interest

The authors declare no conflict of interest.

References

  1. Han, T.T.; Lu, H.F.; Lü, Y.H.; Fu, B.J. Assessing the effects of vegetation cover changes on resource utilization and conservation from a systematic analysis aspect. J. Clean. Prod. 2020, 293, 126102. [Google Scholar] [CrossRef]
  2. Zhao, R.D.; Fang, C.L.; Liu, J.; Zhang, L.F. The evaluation and obstacle analysis of urban resilience from the multidimensional perspective in Chinese cities. Sustain. Cities Soc. 2022, 86, 104160. [Google Scholar] [CrossRef]
  3. Imran, M.; Tufail, M.; Mo, C.; Wahab, S.; Khan, M.K.; Hoo, W.C.; Ling, Z. From resources to resilience: Understanding the impact of standard of living and energy consumption on natural resource rent in Asia. Energy Strategy Rev. 2025, 57, 101590. [Google Scholar] [CrossRef]
  4. Zhao, R.D.; Fang, C.L.; Liu, H.M.; Liu, X.X. Evaluating urban ecosystem resilience using the DPSIR framework and the ENA model: A case study of 35 cities in China. Sustain. Cities Soc. 2021, 72, 102997. [Google Scholar] [CrossRef]
  5. Buri, E.S.; Keesara, V.R.; Loukika, K.N.; Sridhar, V.; Dzwairo, B.; Montenegro, S. Climate-adaptive optimal water resources management: A multi-sectoral approach for the Munneru river basin, India. J. Environ. Manag. 2025, 374, 124014. [Google Scholar] [CrossRef] [PubMed]
  6. Calafat-Marzal, C.; Vega, V.; Sanz-Torro, V.; Puertas, R. Assessment of the resilience factors associated with European green efficiency. Sci. Total Environ. 2025, 966, 178643. [Google Scholar] [CrossRef]
  7. Holling, C.S. Resilience and stability of ecological systems. Annu. Rev. Ecol. Syst. 1973, 4, 1–23. [Google Scholar] [CrossRef]
  8. Walker, B.; Holling, C.S.; Carpenter, S.R.; Kinzig, A. Resilience, adaptability and transformability in social-ecological systems. Ecol. Soc. 2004, 9, 5. [Google Scholar] [CrossRef]
  9. Folke, C. Resilience: The emergence of a perspective for social–ecological systems analyses. Glob. Environ. Change 2006, 16, 253–267. [Google Scholar] [CrossRef]
  10. Wang, X.R.; Xu, S.; Wang, D. Analysis of regional resilience network from the perspective of relational and dynamic equilibrium. J. Clean. Prod. 2023, 425, 138859. [Google Scholar] [CrossRef]
  11. Wang, H.; Liu, Z.; Zhou, Y. Assessing urban resilience in China from the perspective of socioeconomic and ecological sustainability. Environ. Impact Assess. Rev. 2023, 102, 107163. [Google Scholar] [CrossRef]
  12. Wang, J.; Wang, J.M.; Zhang, J.N. Spatial distribution characteristics of natural ecological resilience in China. J. Environ. Manag. 2023, 342, 107163. [Google Scholar] [CrossRef]
  13. Sun, J.; Zhai, N.N.; Mu, H.R.; Miao, J.C.; Li, W.X.; Li, M.F. Assessment of urban resilience and subsystem coupling coordination in the Beijing-Tianjin-Hebei urban agglomeration. Sustain. Cities Soc. 2024, 100, 105058. [Google Scholar] [CrossRef]
  14. Cui, X.F.; Fu, B.W.; Chen, Y.J.; Bai, S. Bridging digital and ecological resilience: Spatiotemporal dynamics and coordinated development paths in the Yellow River Inverted U-Shaped Belt Metropolitan Area. J. Environ. Manag. 2025, 388, 125990. [Google Scholar] [CrossRef] [PubMed]
  15. Luo, W.; Bai, H.T.; Jing, Q.N.; Liu, T.; Xu, H. Urbanization-induced ecological degradation in Midwestern China: An analysis based on an improved ecological footprint model. Renew. Sustain. Energy Rev. 2018, 137, 113–125. [Google Scholar] [CrossRef]
  16. Zeng, Z.Q.; Yang, Q.; Cao, H.; Ren, Y.F.; Ma, Y.M.; Wang, L. A coupled emergy-ecological footprint model for assessing water resource sustainability: Evidence from the Southern Sichuan Economic Zone. Ecol. Indic. 2025, 178, 113905. [Google Scholar] [CrossRef]
  17. Müller, F.; Bergmann, M.; Dannowski, R.; Dippner, J.W.; Gnauck, A.; Haase, P.; Jochimsen, M.C.; Kasprzak, P.; Kröncke, I.; Kümmerlin, R.; et al. Assessing resilience in long-term ecological data sets. Ecol. Indic. 2016, 65, 10–43. [Google Scholar] [CrossRef]
  18. Roberts, C.P.; Twidwell, D.; Angeler, D.G.; Allen, C.R. How do ecological resilience metrics relate to community stability and collapse? Ecol. Indic. 2019, 107, 105552. [Google Scholar] [CrossRef]
  19. Oliveira, B.M.; Boumans, R.; Fath, B.D.; Othoniel, B.; Liu, W.; Harari, J. Prototype of social-ecological system’s resilience analysis using a dynamic index. Ecol. Indic. 2022, 141, 109113. [Google Scholar] [CrossRef]
  20. Lee, C.-C.; Yan, J.Y.; Li, T. Ecological resilience of city clusters in the middle reaches of Yangtze river. J. Clean. Prod. 2024, 443, 141082. [Google Scholar] [CrossRef]
  21. Tan, Z.F.; Chen, K.T.; Liu, P.K. Possibilities and challenges of China’s forestry biomass resource utilization. Renew. Sustain. Energy Rev. 2015, 41, 368–378. [Google Scholar] [CrossRef]
  22. Zhu, Q.Y.; Wu, J.; Li, X.C.; Xiong, B.B. China’s regional natural resource allocation and utilization: A DEA-based approach in a big data environment. J. Clean. Prod. 2017, 142, 809–818. [Google Scholar] [CrossRef]
  23. Han, S.; Wang, B.; Ao, Y.; Bahmani, H.; Chai, B.B. The coupling and coordination degree of urban resilience system: A case study of the Chengdu–Chongqing urban agglomeration. Environ. Impact Assess. Rev. 2023, 101, 107145. [Google Scholar] [CrossRef]
  24. Shi, C.F.; Li, L.J.; Chiu, Y.-H.; Pang, Q.H.; Zeng, X.Y. Spatial differentiation of agricultural water resource utilization efficiency in the Yangtze River Economic Belt under changing environment. J. Clean. Prod. 2022, 346, 131200. [Google Scholar] [CrossRef]
  25. Hu, H.; Yan, K.; Shi, Y.; Lv, T.G.; Zhang, X.M.; Wang, X.Y. Decrypting resilience: The spatiotemporal evolution and driving factors of ecological resilience in the Yangtze River Delta Urban Agglomeration. Environ. Impact Assess. Rev. 2024, 106, 107540. [Google Scholar] [CrossRef]
  26. Vamza, I.; Kubule, A.; Zihare, L.; Valters, K.; Blumberga, D. Bioresource utilization index—A way to quantify and compare resource efficiency in production. J. Clean. Prod. 2021, 320, 128791. [Google Scholar] [CrossRef]
  27. Ledari, M.B.; Akbarnavasi, H.; Khajehpour, H.; Gardumi, F.; Barkhordar, Z.S.A.; Fonseca, R.H.; Thakur, J. Optimizing resource management for water-smart, low-carbon futures: A CLEWs–IO model for job creation and climate resilience. J. Clean. Prod. 2026, 544, 147543. [Google Scholar] [CrossRef]
  28. Wu, X.; Zhang, J.J.; Geng, X.L.; Wang, T.; Wang, K.; Liu, S.D. Increasing green infrastructure-based ecological resilience in urban systems: A perspective from locating ecological and disturbance sources in a resource-based city. Sustain. Cities Soc. 2020, 61, 102354. [Google Scholar] [CrossRef]
  29. Feng, X.H.; Zeng, F.S.; Loo, B.P.Y.; Zhong, Y.X. The evolution of urban ecological resilience: An evaluation framework based on vulnerability, sensitivity and self-organization. Sustain. Cities Soc. 2024, 116, 105933. [Google Scholar] [CrossRef]
  30. Liu, Y.J.; Huang, Q.; Wang, Y. From resource reliance to sustainable environmental resilience: A digital-green paradigm for BRICS+ nations. J. Environ. Manag. 2025, 394, 127498. [Google Scholar] [CrossRef]
  31. Xu, C.; Huo, X.X.; Hong, Y.X.X.; Yu, C.; Jong, M.; Cheng, B. How urban greening policy affects urban ecological resilience: Quasi-natural experimental evidence from three megacity clusters in China. J. Clean. Prod. 2024, 452, 142233. [Google Scholar] [CrossRef]
  32. Lan, C.L.; Li, X.W.; Peng, B.; Li, X.X. Unlocking Urban Ecological Resilience: The Dual Role of Environmental Regulation and Green Technology Innovation. Sustain. Cities Soc. 2025, 128, 106466. [Google Scholar] [CrossRef]
  33. Liu, M.L.; Lu, M.Y.; Li, Z.Y. Coupling coordination analysis on digital economy-tourism development-ecological environment. J. Clean. Prod. 2024, 470, 143320. [Google Scholar] [CrossRef]
  34. Xu, W.T.; Jin, J.L.; Zhang, J.Y.; Yuan, S.S.; Liu, Y.L.; Guan, T.S.; He, R.M.; Zhu, L.J. Coupling coordination degree, interaction relationship and driving mechanism of water resources carrying capacity of Beijing-Tianjin-Hebei urban agglomeration in China. J. Clean. Prod. 2025, 504, 145433. [Google Scholar] [CrossRef]
  35. Yadav, A.; Gyamfi, B.A.; Agozie, D.Q.; Asongu, S.A. From resource curse to financial opportunity: A quantile-based frontier analysis of resources conversion efficiency in Southeast Asia. Renew. Sustain. Energy Rev. 2026, 228, 116582. [Google Scholar] [CrossRef]
  36. Wang, T.Z.; Jian, S.Q.; Wang, J.Y.; Yan, D.H. Dynamic interaction of water–economic–social–ecological environment complex system under the framework of water resources carrying capacity. J. Clean. Prod. 2022, 368, 133132. [Google Scholar] [CrossRef]
  37. Wu, J.; Lin, K.X.; Sun, J.S. Improving urban energy efficiency: What role does the digital economy play? J. Clean. Prod. 2023, 418, 138104. [Google Scholar] [CrossRef]
  38. Sun, Y.; Raza Abbasi, K.; Hussain, K.; Albaker, A.; Alvarado, R. Environmental concerns in the United States: Can renewable energy, fossil fuel energy, and natural resources depletion help? Gondwana Res. 2023, 117, 41–55. [Google Scholar] [CrossRef]
  39. Miao, C.L.; Fang, D.B.; Sun, L.Y.; Luo, Q.L. Natural resources utilization efficiency under the influence of green technological innovation. Renew. Sustain. Energy Rev. 2017, 126, 153–161. [Google Scholar] [CrossRef]
  40. Li, D.; Yang, W.P.; Huang, R.Y. The multidimensional differences and driving forces of ecological environment resilience in China. Environ. Impact Assess. Rev. 2023, 98, 153–161. [Google Scholar] [CrossRef]
Figure 1. Administrative map of China’s inland regions.
Sustainability 18 05277 g001
Figure 2. Technology framework.
Sustainability 18 05277 g002
Figure 3. Radar chart of the NRU index in China’s inland regions from 2009 to 2023.
Sustainability 18 05277 g003
Figure 4. Temporal changes in the NRU index across six major regions from 2009 to 2023.
Sustainability 18 05277 g004
Figure 5. Radar chart of the ER index in China’s inland regions from 2009 to 2023.
Sustainability 18 05277 g005
Figure 6. Temporal changes in the ER index across six major regions from 2009 to 2023.
Sustainability 18 05277 g006
Figure 7. Regression relationships among guidelines for NRU and ER in China’s inland area.
Sustainability 18 05277 g007
Figure 8. Regression relationships among NRU and ER criteria across six major regions.
Sustainability 18 05277 g008aSustainability 18 05277 g008b
Figure 9. Coupling coordination degree for NRU and ER in China’s inland area.
Sustainability 18 05277 g009
Figure 10. Pulse response of ER to NRU.
Sustainability 18 05277 g010
Figure 11. Pulse response of NRU to ER.
Sustainability 18 05277 g011
Figure 12. Temporal evolution of coupling coordination between NRU and ER.
Sustainability 18 05277 g012aSustainability 18 05277 g012b
Figure 13. Heat map of coupling coordination degree between NRU and ER.
Sustainability 18 05277 g013
Table 1. Administrative divisions of China’s inland regions.
Regional DivisionSpecific Provincial Areas
NEHeilongjiang Province, Jilin Province
ECAnhui Province, Jiangxi Province
NCBeijing Municipality, Inner Mongolia Autonomous Region, Shanxi Province
CCHenan Province, Hubei Province, Hunan Province
SWSichuan Province, Guizhou Province, Yunnan Province, Chongqing Municipality, Tibet Autonomous Region
NWShaanxi Province, Gansu Province, Qinghai Province, Ningxia Hui Autonomous Region, Xinjiang Uygur Autonomous Region
Table 2. ER evaluation indicator system.
Guideline LayerIndicator LayerUnitIndicator ExplanationAttribute
Stress resilienceIndustrial sulfur dioxide emissions10,000 tonsReflecting industrial sulfur dioxide emissions
Industrial dust emissions10,000 tonsReflecting the emission status of industrial fumes
Industrial wastewater discharge10,000 tonsReflecting industrial wastewater discharge conditions
Energy Carbon Emissionsmillion tonsReflecting the energy-related carbon emissions within the region
Solid Waste Discharge10,000 tonsReflecting the solid waste discharge situation within the region
State resiliencePopulation densitypersons/km2Total Population/Total Area
Per capita arable land area103 ha/104 personscultivated land area/population
Proportion of Ecological Land%Percentage of regional green space, water bodies, wetlands, and cultivated land relative to total regional area+
Forest vegetation coverage rate%Forest Area/Total Land Area of the Region+
Water production modulus108 m3/haTotal Water Resources/Total Land Area of the Region+
Response resilienceWastewater Treatment Rate%Reflecting the status of wastewater treatment+
Solid Waste Comprehensive Utilization Rate%Reflecting the comprehensive utilization of solid waste+
Municipal Solid Waste Disposal Rate%Reflecting the status of regional household waste treatment+
Proportion of Environmental Protection Expenditure%Expenditures on environmental protection as a percentage of regional gross domestic product+
Table 3. NRU indicator system.
IndicatorUnitIndicator ExplanationAttribute
Reclamation Index%Arable land area/Total land area
Land Development Intensity%Land area for construction/Total land area
Surface Water Resource Utilization Rate%Total Surface Water Supply/Total Surface Water Resources
Energy consumption intensitymillion tons/billion yuanEnergy consumption per unit of regional GDP
Intensity of Mineral Resource DevelopmentThousandNumber of mining rights
Pasture Grazing Intensitybillion yuan per thousand hectaresLivestock Industry Total Output Value/Regional Grassland Area
Unit Output Value of Forest Landbillion yuan per thousand hectaresTotal Output Value of Forest Land/Regional Forest Land Area
Table 4. Classification standards for the degree of coordination.
Coordination DegreeClassificationCoordination DegreeClassification
[0, 0.1)Extreme disorder[0.5, 0.6)Bare coordination
[0.1, 0.2)Serious disorder[0.6, 0.7)Primary coordination
[0.2, 0.3)Moderate disorder[0.7, 0.8)Moderate coordination
[0.3, 0.4)Mild disorder[0.8, 0.9)High coordination
[0.4, 0.5)Near disorder[0.9, 1]Excellent coordination
Table 5. Unit root test results for variables in levels by region.
RegionVariableUnit Root StatisticLevel p-ValueConclusion
NENRU5.6220210.22921Non-stationary
ER0.4038410.982161Non-stationary
ECNRU1.7704820.777878Non-stationary
ER2.7772360.595768Non-stationary
NCNRU1.8083120.936457Non-stationary
ER7.7758450.25499Non-stationary
CCNRU1.6519820.948768Non-stationary
ER3.7246010.713887Non-stationary
SWNRU81.2745880.00Stationary
ER11.7148130.304596Non-stationary
NWNRU2.573430.989762Non-stationary
ER12.1663490.274078Non-stationary
Table 6. Unit root test results for variables in first differences by region.
RegionVariableUnit Root StatisticLevel p-ValueConclusion
NE NRU40.9002620.00Stationary
ER25.6443980.000037Stationary
EC NRU12.04531712.045317Stationary
ER81.52918881.529188Stationary
NC NRU49.6158230.00Stationary
ER47.12040.00Stationary
CC NRU28.1913520.000086Stationary
ER46.4668410.00Stationary
SW NRU13.71302477.197847Non-stationary
ER77.19784777.197847Stationary
NW NRU56.7519030.00Stationary
ER108.9026330.00Stationary
Table 7. Selection of optimal lag order for first-differenced variables by region.
RegionLagAICBICHQICOptimal LagStability Test
NE1−19.776904−19.583351−19.7211681Stable
2−19.507093−19.114408−19.402913
EC1−18.683088−18.489534−18.6273512Stable
2−19.104573−18.711889−19.000394
NC1−18.437045−18.266423−18.3758272Stable
2−18.930388−18.578495−18.807568
CC1−17.917949−17.747327−17.8567311Stable
2−18.04358−18.04358−18.04358
SW1−19.19257−19.19257−19.192571Stable
2−19.216799−19.216799−19.10757
NW1−19.379144−19.245335−19.1162781Stable
2−19.395524−19.116278−19.286295
Disclaimer/Publisher’s Note: The statements, opinions and data contained in all publications are solely those of the individual author(s) and contributor(s) and not of MDPI and/or the editor(s). MDPI and/or the editor(s) disclaim responsibility for any injury to people or property resulting from any ideas, methods, instructions or products referred to in the content.