Article

Impact of Digital Innovation on Regional Synergistic High-Quality Development

1
School of Economics and Finance, Huaqiao University, Quanzhou 362021, China
2
Center for Quantitative Economic Research, Huaqiao University, Xiamen 361021, China
Sustainability 2026, 18(11), 5237; https://doi.org/10.3390/su18115237
Submission received: 8 March 2026 / Revised: 18 April 2026 / Accepted: 19 May 2026 / Published: 22 May 2026

Abstract

Digital innovation constitutes the core determinant of sustainable digital transformation and functions as a pivotal driver of regional high-quality economic development. As a strategic node in China’s urban agglomeration framework, the Guangdong–Fujian–Zhejiang Coastal Urban Agglomeration plays a critical role in regional synergistic high-quality development. This study examines how digital innovation impacts the coupling coordination of high-quality development in the urban agglomeration. The results show: (1) Synergistic high-quality development shows a steady downward trend in the research region with substantial coordination potential. (2) “Gradient disparity” exists, primarily driven by inter-regional Gini coefficient contributions. (3) Overall coupling coordination remains at the antagonistic stage with significant convergence tendencies. (4) Lack of robust central city and centripetal force hinders effective spatial radiation. Driven by the core-periphery spatial differentiation, the short-run dominance of digital innovation’s polarization effect undermines the coordination level of urban agglomerations through scale expansion, structural optimization, and technological empowerment. It requires vigilance against Yangtze and Pearl River Delta siphoning effects. This study provides theoretical and practical implications for promoting digitally driven, synergistic, sustainable, and balanced high-quality development, as well as for optimizing policy frameworks in the new era.

1. Introduction

Carbon emission reduction constitutes a critical challenge confronting China’s high-quality economic development trajectory. Within the strategic context of advancing dual-carbon objectives, China has formally integrated these targets into its national development blueprint to expedite decarbonization processes [1]. Therefore, incorporating dual-carbon dimensions into high-quality development is critical for advancing its theoretical content. The Fourth Plenary Session of the 20th CPC Central Committee clearly outlines key policy orientations. It stresses fully implementing the new development philosophy, building a new development pattern, and upholding the principle of seeking progress while maintaining stability. It identifies high-quality development as the overarching theme and prioritizes stable economic growth. It also urges accelerating the green transition of economic and social development to advance the Beautiful China initiative. In addition, it emphasizes optimizing regional economic structure to promote coordinated regional development [2]. High-quality development represents the primary strategic task in comprehensively constructing a modern socialist nation. Characterized by a people-centered approach, it necessitates leveraging urban agglomerations and metropolitan circles to establish a coordinated development paradigm encompassing cities of all scales. Concurrently, efforts must be directed toward fostering regional coordination to achieve both qualitative enhancement and quantitative growth of the national economy.
The 14th Five-Year Plan explicitly designates the Guangdong–Fujian–Zhejiang Coastal Urban Agglomeration (GFZ-CUA) as the successor to the West Coast Urban Agglomeration of the Taiwan Strait [3], thereby elevating the coastal urban agglomeration to the status of a national development strategy. As a critical ecological barrier in China, the GFZ-CUA plays a pivotal role in advancing the long-term implementation of the Green China and Healthy China initiatives. For decades, the GFZ-CUA has operated as a narrow coastal economic corridor, yet its internal coordinated development has encountered persistent obstacles. When benchmarked against the Yangtze River Delta and Pearl River Delta mega-urban agglomerations, this region exhibits relatively weaker economic capacity, rendering it vulnerable to the “siphon effect” typically associated with mega-urban agglomerations [4,5,6]. Furthermore, during industrial relocation from these mega-urban agglomerations, the GFZ-CUA exhibits a significant deindustrialization trend [7], which ultimately impedes the realization of regional synergistic high-quality development. To promote internal synergy and strengthen regional economic competitiveness in the GFZ-CUA, efforts should target alleviating the siphon effect of mega-urban agglomerations and preventing the emergence of pollution havens. Accordingly, it is essential to uphold a long-term strategic vision, build sustainable low-carbon development mechanisms, and explore new impetus for synergistic high-quality development.
Against the backdrop of artificial intelligence advancement and the new wave of digital technological transformation, emerging industries, business models, and innovation paradigms are undergoing exponential growth. Sustainable digital transformation has emerged as a core research topic in both academic and practical domains. As the core driver of sustainable digital transformation, digital innovation has profoundly reshaped the landscape of regional economic development and the coordination mechanisms of social resources. Therefore, digital innovation has emerged as a pivotal driver of regional synergistic high-quality development [8,9,10]. Through technological breakthroughs, digital innovation accelerates industrial restructuring and enhances resource allocation efficiency, thereby propelling high-quality regional economic development [11,12]. Concurrently, data-driven decision-making reduces transaction costs and overcomes geographical barriers, thereby effectively promoting regional synergistic high-quality development in resource allocation, talent deployment, fiscal support, and inter-regional coordination [13,14]. This study seeks to systematically examine how digital innovation drives synergistic high-quality development in the GFZ-CUA under dual-carbon goals, and to identify critical breakthroughs for regional coordinated development. Accordingly, we define the operational dimensions of such development, clarify the transmission channels of digital innovation, and put forward targeted policy implications. These constitute the core research questions addressed in this paper.
This study makes marginal contributions as follows: (1) Different from most studies that treat the dual-carbon target as a single exogenous constraint, this study endogenously incorporates dual-carbon constraints into the logical framework of high-quality urban agglomeration development. Considering the spatial characteristics of the GFZ-CUA, it redefines the operational boundaries and evaluation criteria of regional synergistic high-quality development oriented toward green synergy. Breaking the single-dimensional limitation of traditional regional development theories, this study deeply integrates the theory of sustainable digital innovation with the mechanism of regional co-evolution and reconstructs a theoretical analytical framework. It enriches the theoretical connotation of coordinated development among coastal urban agglomerations from the perspective of green transition, effectively addresses the fragmentation in existing research on the integration of dual-carbon strategy and specific urban agglomerations, and expands the application scenarios of digital innovation empowering green coordinated development based on multi-dimensional system coupling and coordination. (2) Compared with existing literature that focuses on the homogeneous effects of the digital economy, this study, under the framework of sustainable digital transformation, identifies the heterogeneous effects and transmission mechanisms of digital innovation on regional synergistic high-quality development, filling gaps in segmented research contexts. The empirical findings are not only consistent with the development reality of the GFZ-CUA but also applicable to other similar export-oriented coastal urban agglomerations with differentiated industrial gradients. This study provides universal references for regional coordination of digital transformation and collaborative governance, extending both the theoretical implications and practical value of relevant research.
Accordingly, this study constructs an evaluation index system for the synergistic high-quality development of the GFZ-CUA by incorporating dual-carbon factors. From the perspective of coupling coordination, it explores regional disparities in the development process and identifies their underlying sources. From a spatiotemporal perspective, it examines the evolutionary patterns of the coupling coordination degree of high-quality development within the coastal urban agglomerations. It also identifies the convergence characteristics of the coupling coordination degree. Furthermore, it takes big data comprehensive pilots as a case study to investigate the impact and mechanism of digital innovation on the coupling coordination degree of high-quality development in coastal urban agglomerations. These findings provide policy implications for accelerating the synergistic high-quality development of the GFZ-CUA.
This paper is structured as follows: Section 2 provides a literature review; Section 3 details the construction of the evaluation index system and methodological specifications for the model; Section 4 presents the results and discussions; Section 5 presents the conclusions and policy implications.

2. Literature Review

(1) Digital Innovation
The academic literature on digital innovation encompasses conceptual frameworks, measurement methodologies, and socioeconomic impact assessments. International research on digital innovation has evolved through successive paradigms, transitioning from the information economy and internet economy to the contemporary digital economy. The conceptualization of the digital economy was first formally articulated by Tapscott [15], who focused on the transformative effects of internet technologies on traditional industrial structures and economic modalities. Subsequent scholarly inquiries have expanded this scope to include digital industrialization, industrial digitization, and digital infrastructure development, while also addressing emerging economic manifestations such as digital services, digital finance, and electronic commerce [16].
Digital innovation constitutes the core driver of digital economic development. Current academic discourse has established two primary methodological approaches for its measurement. The first approach employs national accounting frameworks to evaluate the economic development level of digital innovation and its contributory share to gross domestic product [17]. The second approach constructs multidimensional composite indices through diverse methodologies, including subjective valuation techniques, objective scale measurement, textual analysis, and computational model simulation [18,19,20,21,22,23,24].
Given the intrinsic link between big-data policy implementation and the developmental trajectories of industrialized nations, the promotion of digital innovation holds substantial significance for facilitating industrial restructuring, enhancing governance capacities, improving people’s livelihoods, and fostering high-quality economic growth. The socioeconomic implications of digital innovation primarily manifest through its externalities and operational mechanisms. The external effects of digital innovation encompass its impacts on industrial structure evolution, value chain reconfiguration, total factor productivity enhancement, technological innovation acceleration, collaborative emission reduction efficacy, economic resilience strengthening, and employment structure transformation [25,26,27,28]. Concerning operational mechanisms, scholarly consensus indicates that digital innovation adheres to Metcalfe’s Law, which exhibits a significant threshold effect in empowering individual economic entities while demonstrating reverse spillover effects within regional economic aggregates [29,30,31,32].
(2) High-quality Development
Academic literature on high-quality development primarily encompasses three domains: connotative definition, measurement methodologies, and empirical research applications. The conceptualization of high-quality development remains non-uniform, with scholars adopting diverse theoretical perspectives. The majority of scholarly inquiries are rooted in economic growth frameworks, integrating economic quality factors to focus on developmental transitions. Specifically, the shift from quantitative expansion-oriented accumulation models to quality and efficiency-driven paradigms. Martinez & Mlachila [33] conceptualized high-quality development as socially sustainable development that fulfills escalating public demands for improved livelihoods, with emphasis on equitable resource distribution and operational efficiency. Mlachila et al. [34] further elaborated that high-quality economic development integrates fundamental growth drivers with social welfare outcomes, positing that sustained high growth rates coupled with social sustainability constitute core prerequisites for its achievement.
The theoretical construct of high-quality development was formally introduced in the report of the 19th National Congress of the Communist Party of China, which delineated China’s economic transition from a high-speed growth phase to a high-quality development phase. Currently, the nation is in a critical juncture characterized by development pattern transformation, economic structure optimization, and growth driver conversion. Significant divergence exists in measurement criteria, indicator systems, and methodological approaches for assessing high-quality development. Conventional measurement strategies include both single-indicator [35,36,37] and composite indicator frameworks [38,39]. Methodologically, there has been a gradual transition from parametric to non-parametric analytical approaches. Scholarly consensus recognizes high-quality development as an organic synthesis of quantitative growth and qualitative improvement, embodying five core developmental principles: innovation, coordination, green development, openness, and shared benefits [40]. This framework clarifies developmental impetuses, addresses progressive imbalances, promotes human-nature harmony, and advances social equity and justice.
Despite remaining in the exploratory stage, current research continues to refine the conceptual and theoretical frameworks underpinning high-quality development. Empirically, scholarly investigations have focused on analyzing the motivational factors and challenges inherent in high-quality development strategies, as well as identifying critical driving mechanisms [41,42,43]. Gunby et al. [44] empirically verified that foreign direct investment exerts a significant promotional effect on regional high-quality economic development. Andreoni & Chang [45] posited that optimized institutional arrangements function as facilitative factors for such development. Yang et al. [46] constructed an evaluation framework for the transition from traditional to new growth drivers, revealing pronounced nonlinear spatial spillover effects on high-quality development processes. Lu et al. [47] demonstrated that new productive forces, through mechanisms of enhanced technology transfer efficiency and accelerated knowledge capital accumulation, generate stable and substantial positive impacts on high-quality marine economic development.
(3) Relationship Between Digital Innovation and High-quality Development
The academic discourse concerning the nexus between digital innovation and high-quality development remains contentious, with scholarly perspectives predominantly categorized into three distinct paradigms:
First, digital innovation acts as a catalyst for high-quality development through enhancing total factor productivity, optimizing industrial structure, and stimulating green technological innovation [48,49]. Based on panel data from 281 Chinese cities, Ma & Zhu [50] identified that structural upgrading of digital innovation and green innovation effects constitutes pivotal pathways for achieving high-quality green development.
Second, digital innovation may temporarily exacerbate energy consumption, thereby constraining high-quality development [51]. Xue et al. [52] demonstrated that a 1% increase in China’s digital innovation correlates with an average 0.12% rise in electricity demand, indicating non-negligible energy rebound effects. While digital infrastructure development effectively reduces energy intensity, its expansion concurrently drives increased electricity consumption [53]. The energy-saving dividends derived from digital technology-enabled efficiency improvements are partially offset by consumption growth [54], resulting in significant energy rebound effects. Consequently, digitalization emerges as a critical trigger for energy rebound phenomena [55].
Third, the impact of digital innovation on high-quality development exhibits inherent uncertainty. Lange et al.’s multinational study [56] reveals that the net effect of digital innovation is contingent upon thresholds related to institutional quality, infrastructure, and human capital. In regions with robust institutional frameworks, it operates as a “green accelerator,” whereas in areas with weak institutions, it may manifest as a “digital divide” or even “high-carbon lock-in.” Based on Chinese provincial panel data, Yang et al. [57] identified an “inverted U-shaped” impact of the platform economy on high-quality development, with marginal effects turning negative beyond a critical threshold, thereby validating the uncertainty hypothesis. Jia & Li [58] explored the relationship between digital transformation and green total factor productivity (TFP), uncovering an inverted U-shaped association that indicates an optimal level of digital transformation; excessive digitalization beyond this threshold may lead to a reduction in green TFP.
Furthermore, scholars have examined the impact of digital innovation on high-quality economic development from the emission reduction perspective. Empirical studies indicate that digital innovation exerts a significant threshold effect on high-quality economic development, which is primarily determined by key variables including institutional quality, human capital, infrastructure, and financial development [59,60,61].
We identify critical research gaps: The indicators for high-quality development remain unstandardized, particularly within the dual-carbon policy context, with insufficient attention to the conceptualization, measurement, and empirical investigation of regional synergistic high-quality development that incorporates dual-carbon objectives as a core guiding principle. Despite established correlations between digital innovation and regional economic high-quality development, empirical inquiries into the causal mechanisms driving this relationship remain limited, with the underlying transmission pathways yet to be fully elucidated. A systematic policy framework for advancing synergistic high-quality development in the GFZ-CUA, integrating digital innovation as the driving force and dual-carbon goals as a foundational element, currently lacks scholarly articulation.

3. Construction of the Indicator System and Model Setting

3.1. Theoretical Framework and Hypotheses

Sustainable digital innovation theory extends and expands traditional innovation theory in the digital economy era. Taking digital technologies, data factors and intelligent platforms as core carriers, it breaks the geographical limitations, factor constraints and organizational boundaries of conventional innovation activities. Compared with traditional paradigms, digital innovation is characterized by decentralization, cross-border integration and immediate spillover effects. Through the expansion of digital infrastructure, technological upgrading and data circulation, it reshapes regional production modes, industrial structures and spatial interactions. Within urban agglomerations, digital innovation is not evenly distributed but exhibits agglomeration and hierarchical spatial patterns, providing a theoretical basis for regional divergence and the consolidation of core-periphery structures. Regional coordinated development theory highlights that free factor mobility, rational industrial division and functional complementarity are essential for stable regional cooperation. Cities form specialized divisions based on resource endowments, and alleviate development imbalances through factor sharing, industrial matching and joint governance, thereby improving overall efficiency and narrowing gaps. With the advancement of urban agglomeration integration, the connotation of regional coordination has expanded beyond mere economic convergence to include green and low-carbon coordination, innovation resource sharing, public service linkage and cross-regional joint prevention, forming a multi-dimensional and composite collaborative system. Sustainable digital innovation theory and regional coordinated development theory are not mutually independent but deeply integrated in the evolution of urban agglomerations, jointly shaping the development trajectory of coastal urban agglomerations. Their integration is realized through multiple channels including collaborative empowerment, spatial differentiation and co-opetition dynamics.
Although mainstream literature suggests that digital innovation promotes regional high-quality development through digital transformation [62], and that regional synergistic high-quality development directly reflects the effectiveness of sustainable digital transformation, with the quality and spatial pattern of digital innovation determining the level of regional coordinated development [63], the impact of digital innovation is not simply linear and positive. Drawing on core-periphery theory and the spatial evolution of digital innovation, its influence on regional synergistic high-quality development features typical asymmetric spatial interactions. In the early and middle stages of digital transformation, core cities attract a one-way inflow of high-quality factors such as talent, technology, data, and capital by virtue of superior digital infrastructure, agglomerated innovation resources, and strong industrial foundations. Relying on the cross-regional siphonic effect of digital technologies, core areas strengthen their advantages and form innovation hubs. In contrast, peripheral cities suffer from weak digital foundations and insufficient innovation absorption capacity, failing to share digital spillover benefits and instead facing continuous outflows of factors and declining development momentum. Under this dynamic pattern of core polarization and peripheral weakening, the ’backwash effect’ of digital innovation widens regional structural gaps, polarization, and technological disparities. Core regions achieve rapid growth through digital innovation, while peripheral regions lag in innovation and lack equal collaborative capacity, hindering regional coordination [64]. At this stage, spatial differentiation effects dominate over synergistic spillovers due to spatial factor restructuring, unbalanced digital resource allocation, and widening regional development gaps, reducing overall urban agglomeration coordination. In the long run, with stronger spillovers from core regions, improved digital governance coordination, and enhanced digital absorption capacity in peripheral areas, the regional competition pattern will be reshaped. The polarization effect may gradually shift to a radiation linkage effect, allowing the positive enabling role of digital innovation to emerge. Given that the GFZ-CUA remains in the transitional stage of digital innovation development rather than maturity, we propose Hypothesis 1:
H1. 
Digital innovation exerts a stage-wise inhibitory effect on regional synergistic high-quality development.
Within the framework of sustainable digital transformation, the inhibitory path of digital innovation on regional synergistic high-quality development can be divided into three dimensions. First, the uneven agglomeration of digital innovation resources. According to the theory of unbalanced regional development, Myrdal & Sitohang [65] distinguish between backwash effects and spread effects. Affected by disparities in digital infrastructure, talent, and capital in the early stage of sustainable digital transformation, digital innovation resources show obvious path dependence and agglomeration effects [66]. The backwash effect from resource agglomeration greatly exceeds the spread effect, leading to a strong siphonic effect in core regions. Peripheral regions suffer from insufficient input and lagged development, which widens regional gaps, breaks coordination equilibrium, and reduces the overall coupling coordination level [67,68]. Second, the uneven application of digital innovation. Digital innovation relies heavily on digital factor inputs, and factor endowments differ substantially across regions [69]. Core regions rapidly convert digital innovation into growth momentum and achieve industrial upgrading. Peripheral regions are constrained by insufficient factor endowments and fail to capture digital dividends, further widening development gaps and reducing coupling coordination [70]. Third, the uneven spillover effects of digital innovation. As a new technological paradigm, digital innovation follows Rogers’ S-shaped diffusion curve with significant technological gradient gaps [71,72]. Technological and knowledge spillovers are mainly concentrated within core regions and cannot be effectively transmitted to peripheral areas [73]. Thus, peripheral regions cannot share digital opportunities equally, weakening regional linkage and exacerbating imbalance, which further inhibits coordinated development. Accordingly, Hypotheses 2–5 are proposed:
H2. 
Digital innovation inhibits regional synergistic high-quality development through the structural optimization effect.
H3. 
Digital innovation inhibits regional synergistic high-quality development through the scale expansion effect.
H4. 
Digital innovation inhibits regional synergistic high-quality development through the technology empowerment effect.
H5. 
Digital innovation plays a moderating role in regional synergistic high-quality development.
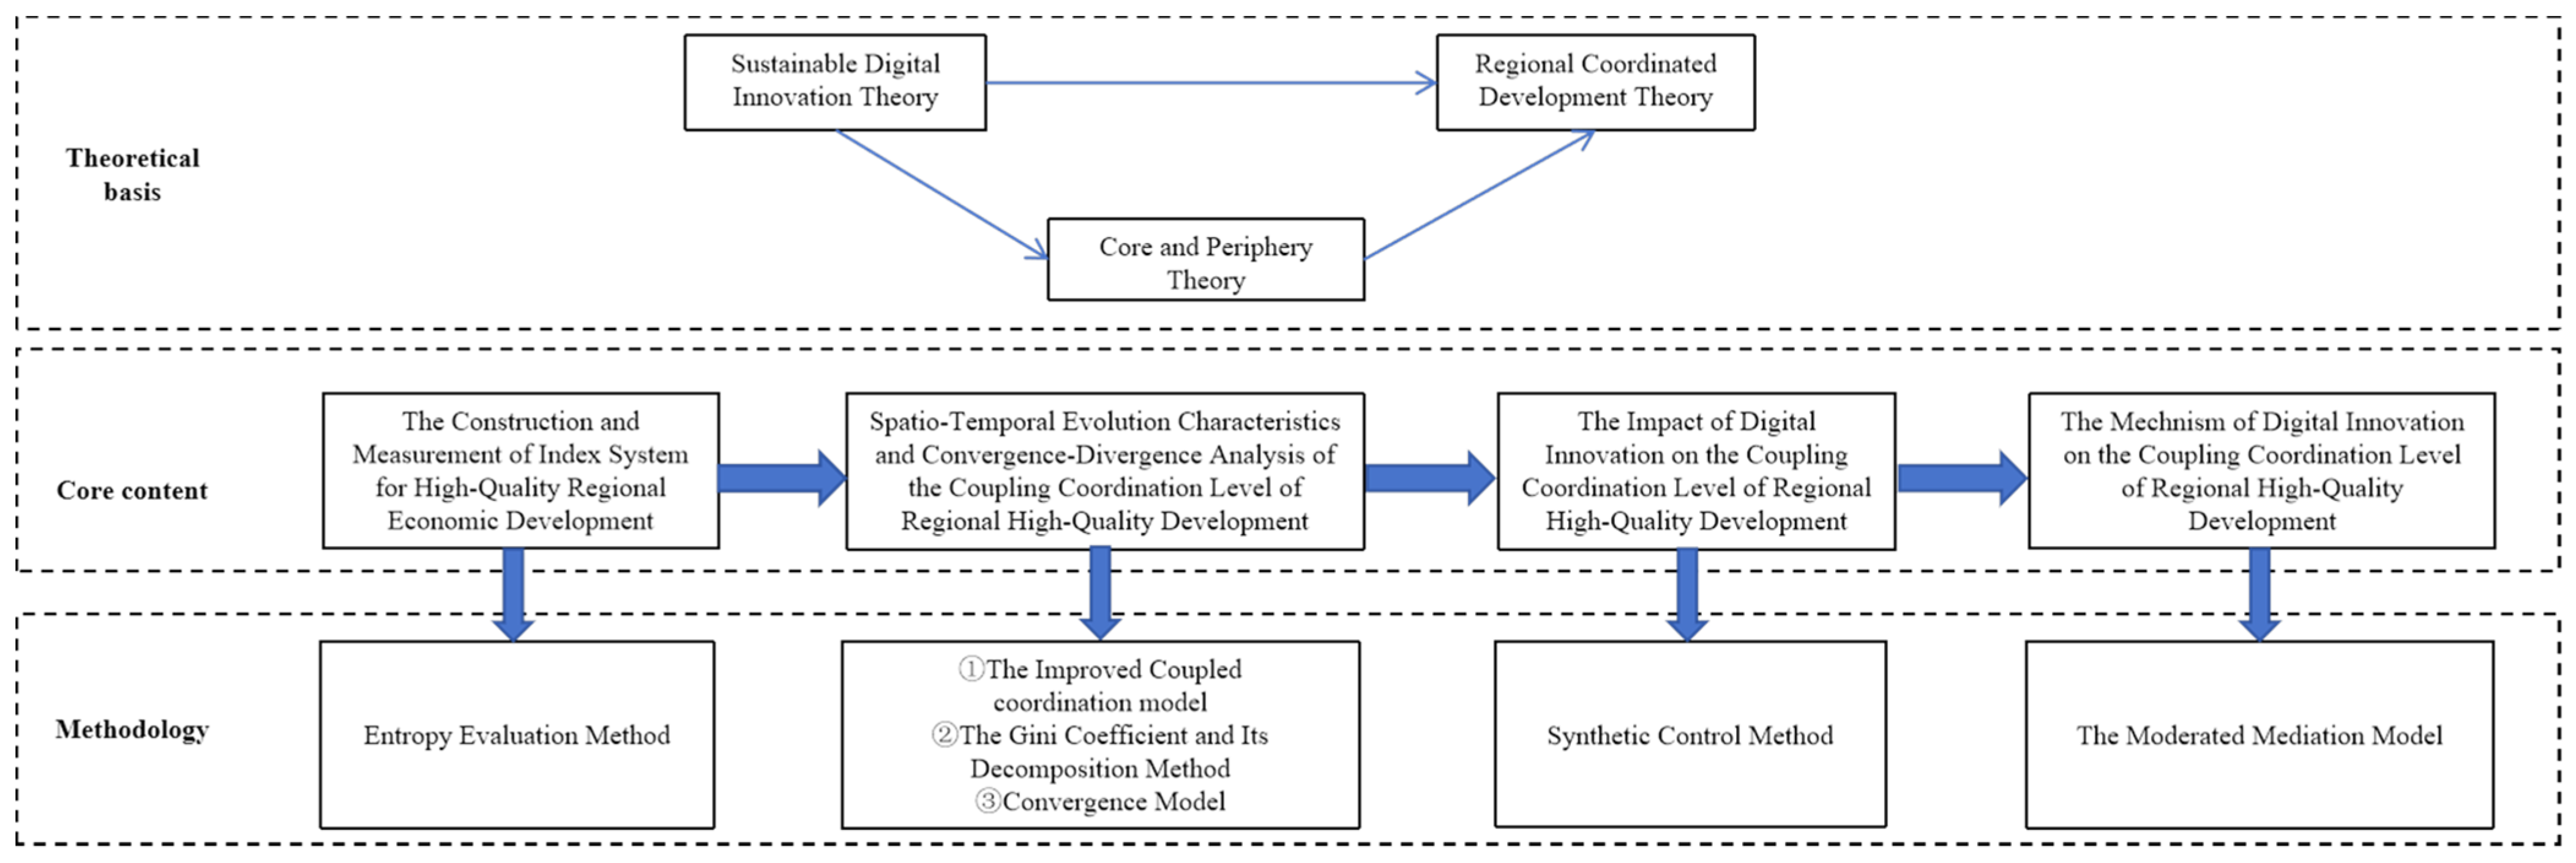
And the research framework is shown in Figure 1.

3.2. Construction of the Indicator System

Dual-carbon factors are integrated into the green development dimension to construct a synergistic high-quality development evaluation index system for the GFZ-CUA under the new development philosophy. The indicators are selected as detailed in Table 1. The data are obtained from China City Statistical Yearbook and local statistical bureaus, covering the period from 2003 to 2022. Notably, it reflects large disparities in urban green governance capacity and the high information content of this indicator. This is consistent with the objective weighting principle of the entropy method.

3.3. Methodology and Model Settings

3.3.1. The Gini Coefficient and Its Decomposition Method

According to the subgroup decomposition Gini coefficient method proposed by Dagum [74], this study clarifies the sources of spatial differentiation and cross—overlapping issues among sub-samples. The Gini coefficient is defined as G = Gw + Gnb + Gz, where G represents the regional Gini coefficient, Gw is the contribution to intra-regional disparity, Gnb is the contribution to inter-regional disparity, and Gz is the transvariation density, as shown in Formulas (1)–(9).
G w = j = 1 k G j j p j s j
G j j = 1 2 Y ¯ j i = 1 n j r = 1 n j y j i y j r / n j 2
G j h = i = 1 n j r = 1 n h y j i y h r / n j n h ( Y ¯ j + Y Y ¯ h )
G n b = j = 2 k h = 1 j 1 G j h ( p j s h + p h s j ) D j h
G z = j = 2 k h = 1 j 1 G j h ( p j s h + p h s j ) ( 1 D j h )
D j h = d j h p j h d j h + p j h
d j h = 0 d F j ( y ) 0 y ( y x ) d F h ( x )
p j h = 0 d F h ( y ) 0 y ( y x ) d F j ( x )
p j = n j n ,   s j = n j Y ¯ j n Y ¯ ,   j = 1 ,   2 ,   3 , , k
Gjh denotes the inter-regional Gini coefficient between region j and region h. Djh represents the impact degree of the coupling coordination contribution rate of high-quality development between region j(h) and the GFZ-CUA. djh stands for the difference in the contribution rate of coupling coordination levels of high-quality development between regions. pjh refers to the hypervariable first-order moment.

3.3.2. Convergence Model

(1) σ convergence model
The σ coefficient is a quantitative metric to characterize the convergence properties of the coupling coordination degree of high-quality development in the GFZ-CUA.
σ = i N ( D D ¯ ) 2 N
(2) β convergence model
β convergence focuses on dynamic catch–up effects, as shown in Formulas (11)–(14).
absolute   β   convergence ln ( D i t + 1 D i t ) = α + β ln ( D i t ) + ε i + η t + λ i t
conditional   β   convergence ln ( D i t + 1 D i t ) = α + β ln ( D i t ) + ξ X i t + ε i + η t + λ i t
spatial absolute   β   convergence ln ( D i t + 1 D i t ) = α + β ln ( D i t ) + θ j = 1 n W i j ln ( D i t + 1 D i t ) + ρ j = 1 n W i j ln ( D i t ) + ε i + η t + λ i t
spatial conditional   β   convergence ln ( D i t + 1 D i t ) = α + β ln ( D i t ) + ξ X i t + θ j = 1 n W i j ln ( D i t + 1 D i t ) + ρ j = 1 n W i j ( ln ( D i t ) + X i j ) + ε i + η t + λ i t
where α is a constant, θ and ρ are respectively the spatial lag coefficient and spatial spillover coefficient, εi represents the individual fixed effect, ηt denotes the time fixed effect, and λit is the error term. Xit serves as the control variable for the coupling coordination level affecting the high-quality development of the GFZ-CUA. When β < 0, the coupling coordination level converges; otherwise, it diverges.
This study employs an economic geography spatial weight matrix Wij that integrates geographical distance and inter-regional disparities in economic development levels. This specification not only captures the distance-decay effect inherent in spatial spillover processes but also quantifies the intensity of spatial correlation among economically similar regions. Compared with conventional adjacency matrices and inverse-distance matrices, the economic geography matrix more accurately reflects the actual spatial interdependencies underlying regional high-quality economic development.

3.3.3. Synthetic Control Method

This study employs the synthetic control method proposed by Abadie & Gardeazabal [75] and Abadie et al. [76] to evaluate the policy effect. The individual causal effect, the intervention status, and the condition of weights W can be expressed respectively as Formulas (15)–(17):
e f f i t = Y 1 i t Y 0 i t , i = 1 , , N + 1 , t = 1 , , T
D i t = 1   i = 1 , t > T 0   0 ,   others
Y 01 t j = 2 N + 1 w j Y j t = j = 2 N + 1 w j s = 1 T 0 λ t n = 1 T 0 λ n λ n 1 λ s ( ε j s ε 1 s )
where effit indicates the policy’s individual causal effect for region i at time t. Y1it denotes the potential outcome for individual i under policy intervention at time t, while Y0it represents the potential outcome without intervention. The intervention status for individual i at time t is denoted by Dit, where Dit = 1 if intervention occurs and 0 otherwise.

3.3.4. The Moderated Mediation Model

Drawing on the analytical framework proposed by Qi et al. [77], the moderated mediation model is formally specified in Equations (18) and (19).
x m i t = a 0 + a 1 s s i t
D i t = b 0 + b 1 x i t + b 2 s s i t + b 3 x m i t s s i t
Within this analytical framework, ssit represents the core independent variable of digital innovation, while xmit functions as the mediating variable for technological empowerment effects, operationalized by the artificial intelligence application level. All other variables adhere to the definitions established in preceding sections.

4. Results and Discussions

4.1. Measurement and Analysis of the Synergistic High-Quality Development Level of GFZ-CUA

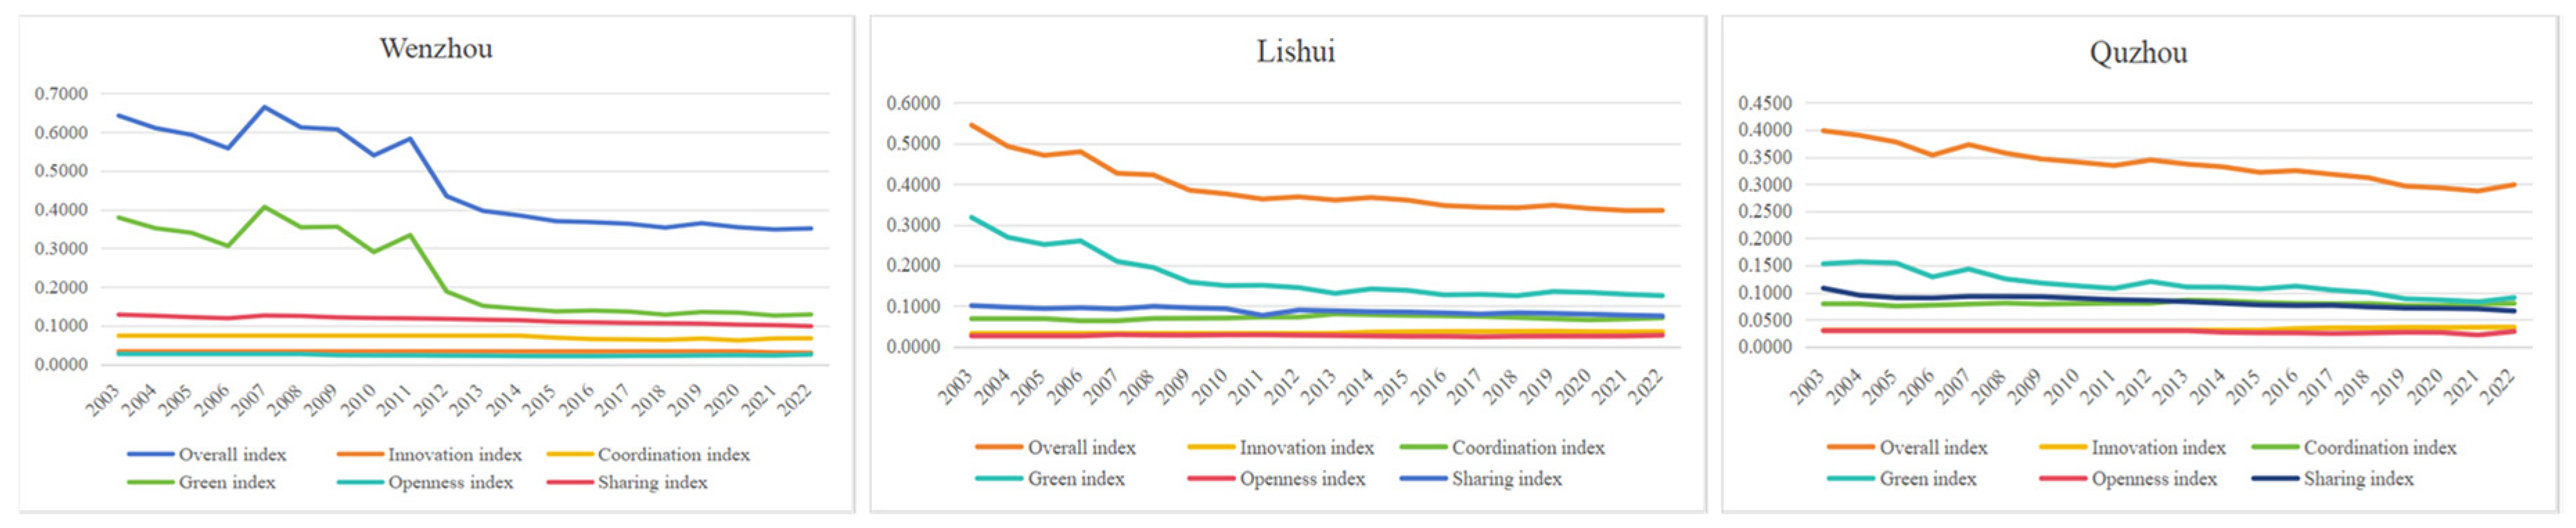
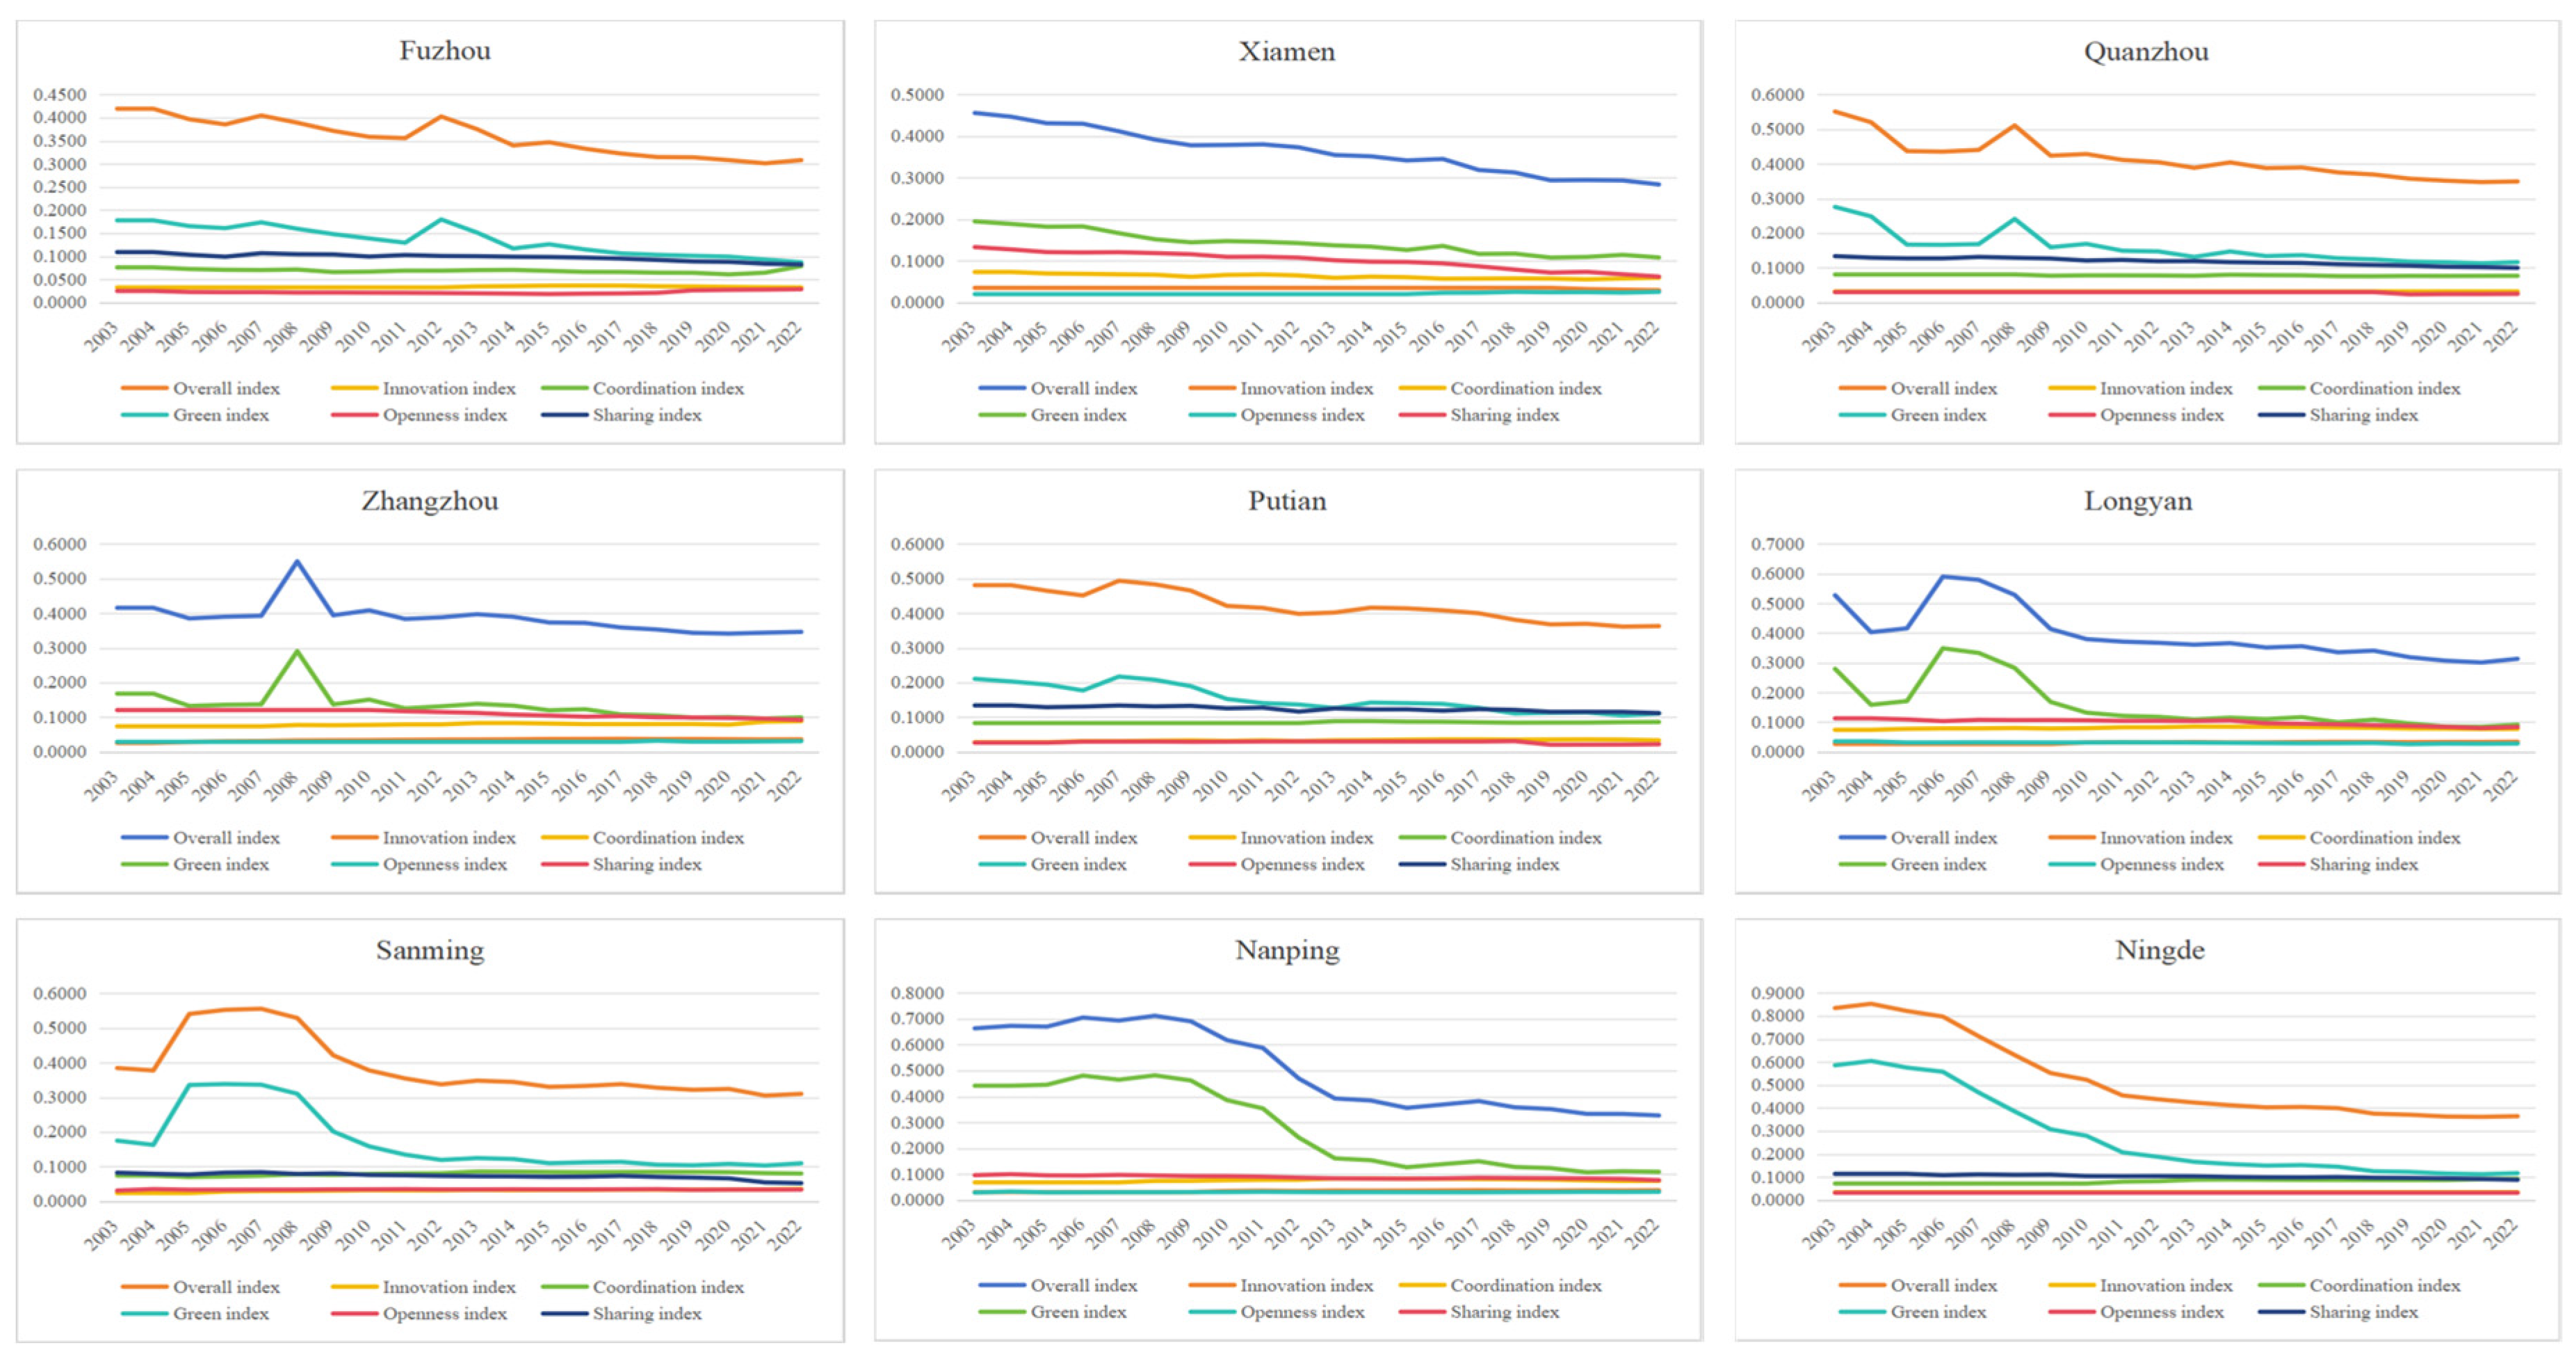
Temporal evolutionary patterns of the high-quality development index and its dimensional sub-indexes across individual cities within the GFZ-CUA are graphically depicted in Figure 2, Figure 3 and Figure 4.
Figure 2, Figure 3 and Figure 4 show that coordinated high-quality development in the GFZ-CUA urban agglomeration exhibits strong common characteristics. The ranking of the five dimensions is consistent across regions: Green Development Index > Shared Development Index > Coordinated Development Index > Innovative Development Index > Open Development Index. Green development serves as the core driver of high-quality development, with low-carbon construction under the dual-carbon targets providing essential support. Innovation and openness are generally weak and represent major constraints. Temporal fluctuations are evident during the 11th and 12th Five-Year Plan periods, but become stable after the 13th Five-Year Plan, consistent with the gradual effects of national energy conservation and green transition policies. Synergistic high-quality development within the GFZ-CUA demonstrates a steady downward trajectory. This finding suggests that current digital innovation within the agglomeration has not yet fully fulfilled its facilitative role in advancing sustainable digital transformation.

4.2. Evolution Characteristics of Coupling Coordination for High-Quality Development in the GFZ-CUA

Referring to Fan et al. [78], this study measures the coupling degree using the distance between system value points and the central axis, so as to reduce the overlap between the coupling degree and the coordination degree and strengthen the contribution of the coupling degree in the coupling coordination model. The grading criteria for each level were adopted from Fang et al. [79] in Appendix A Table A1.
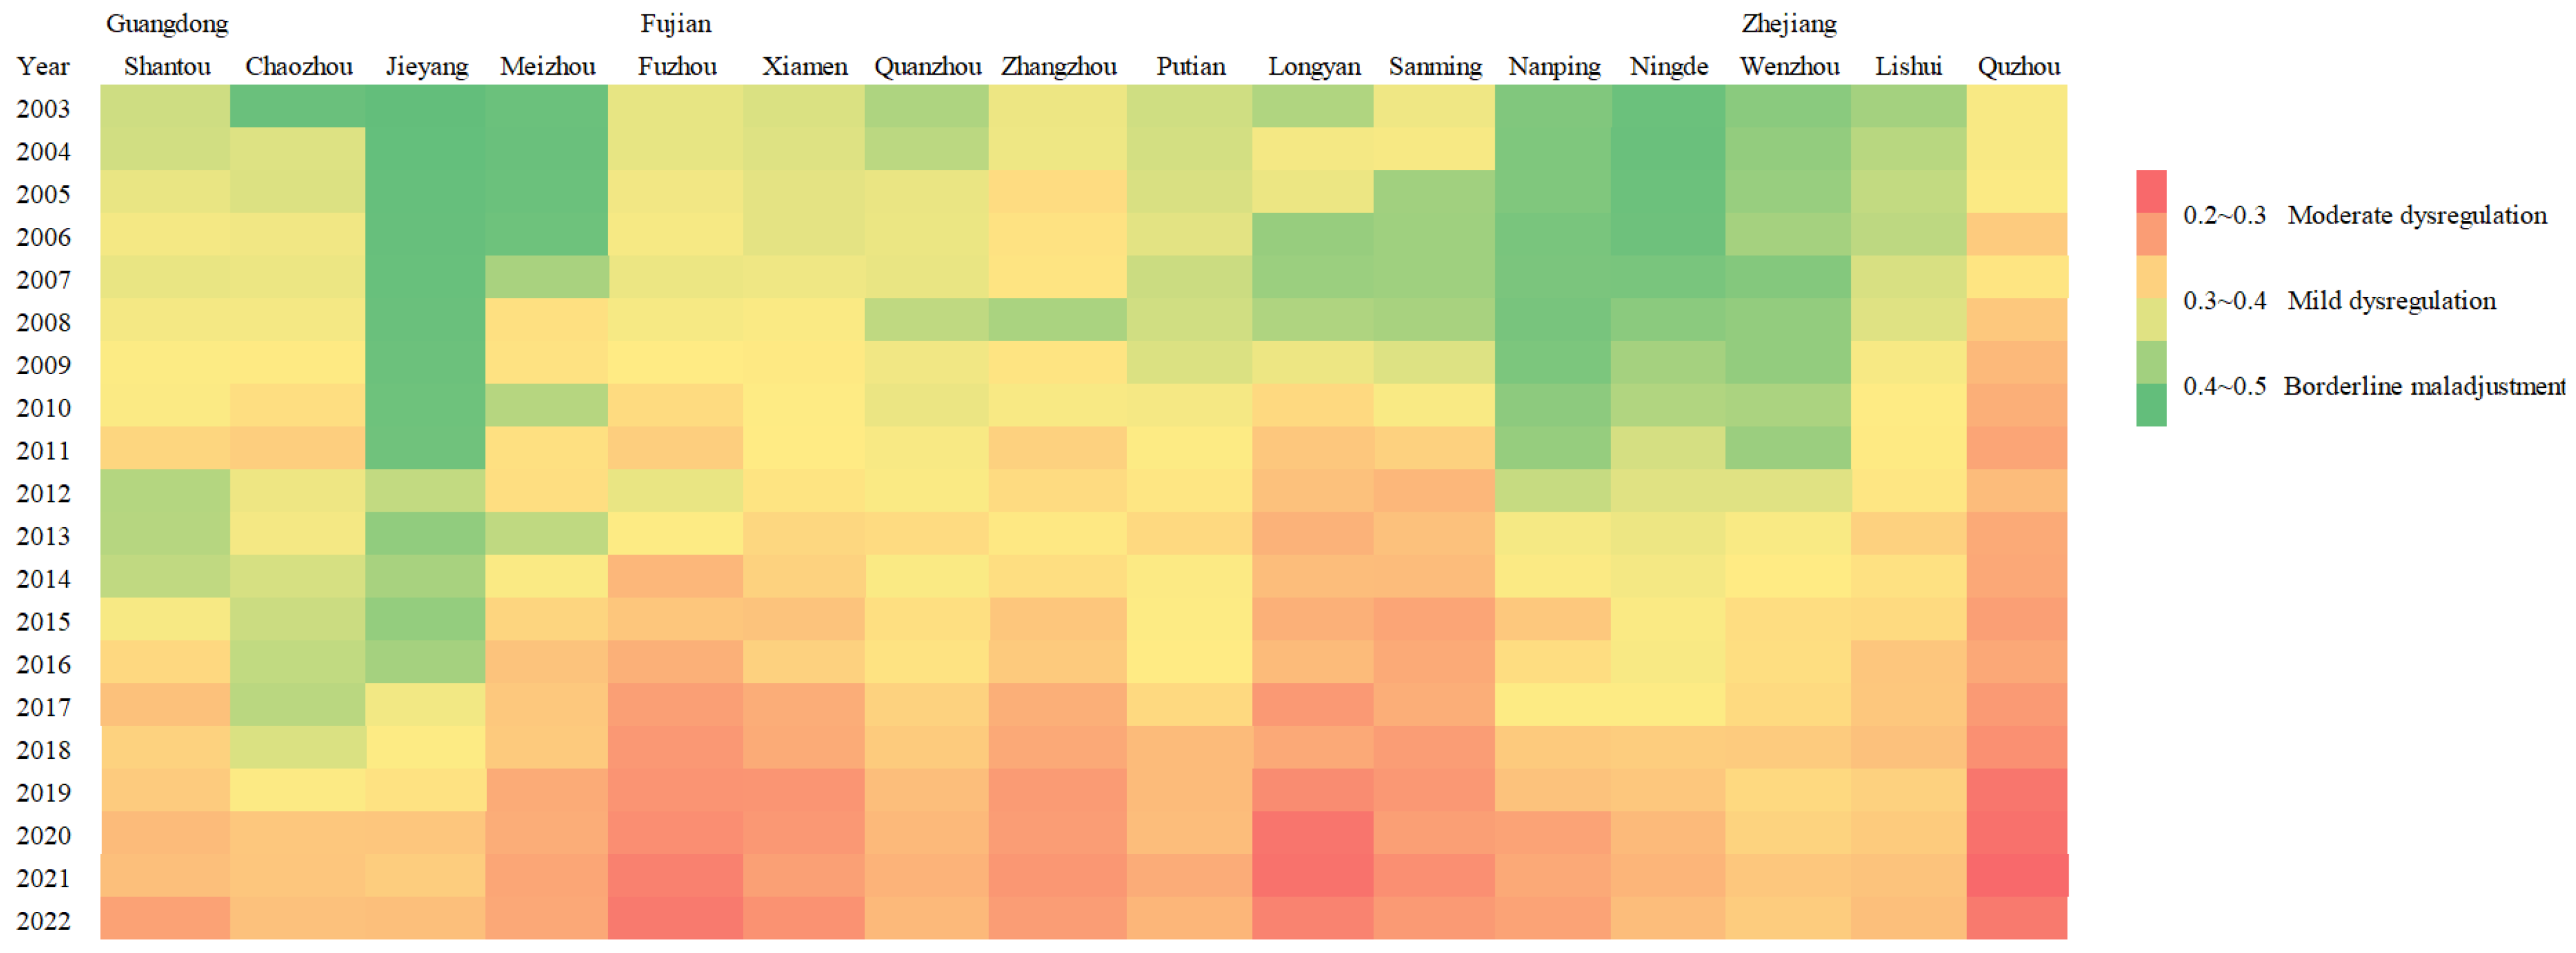
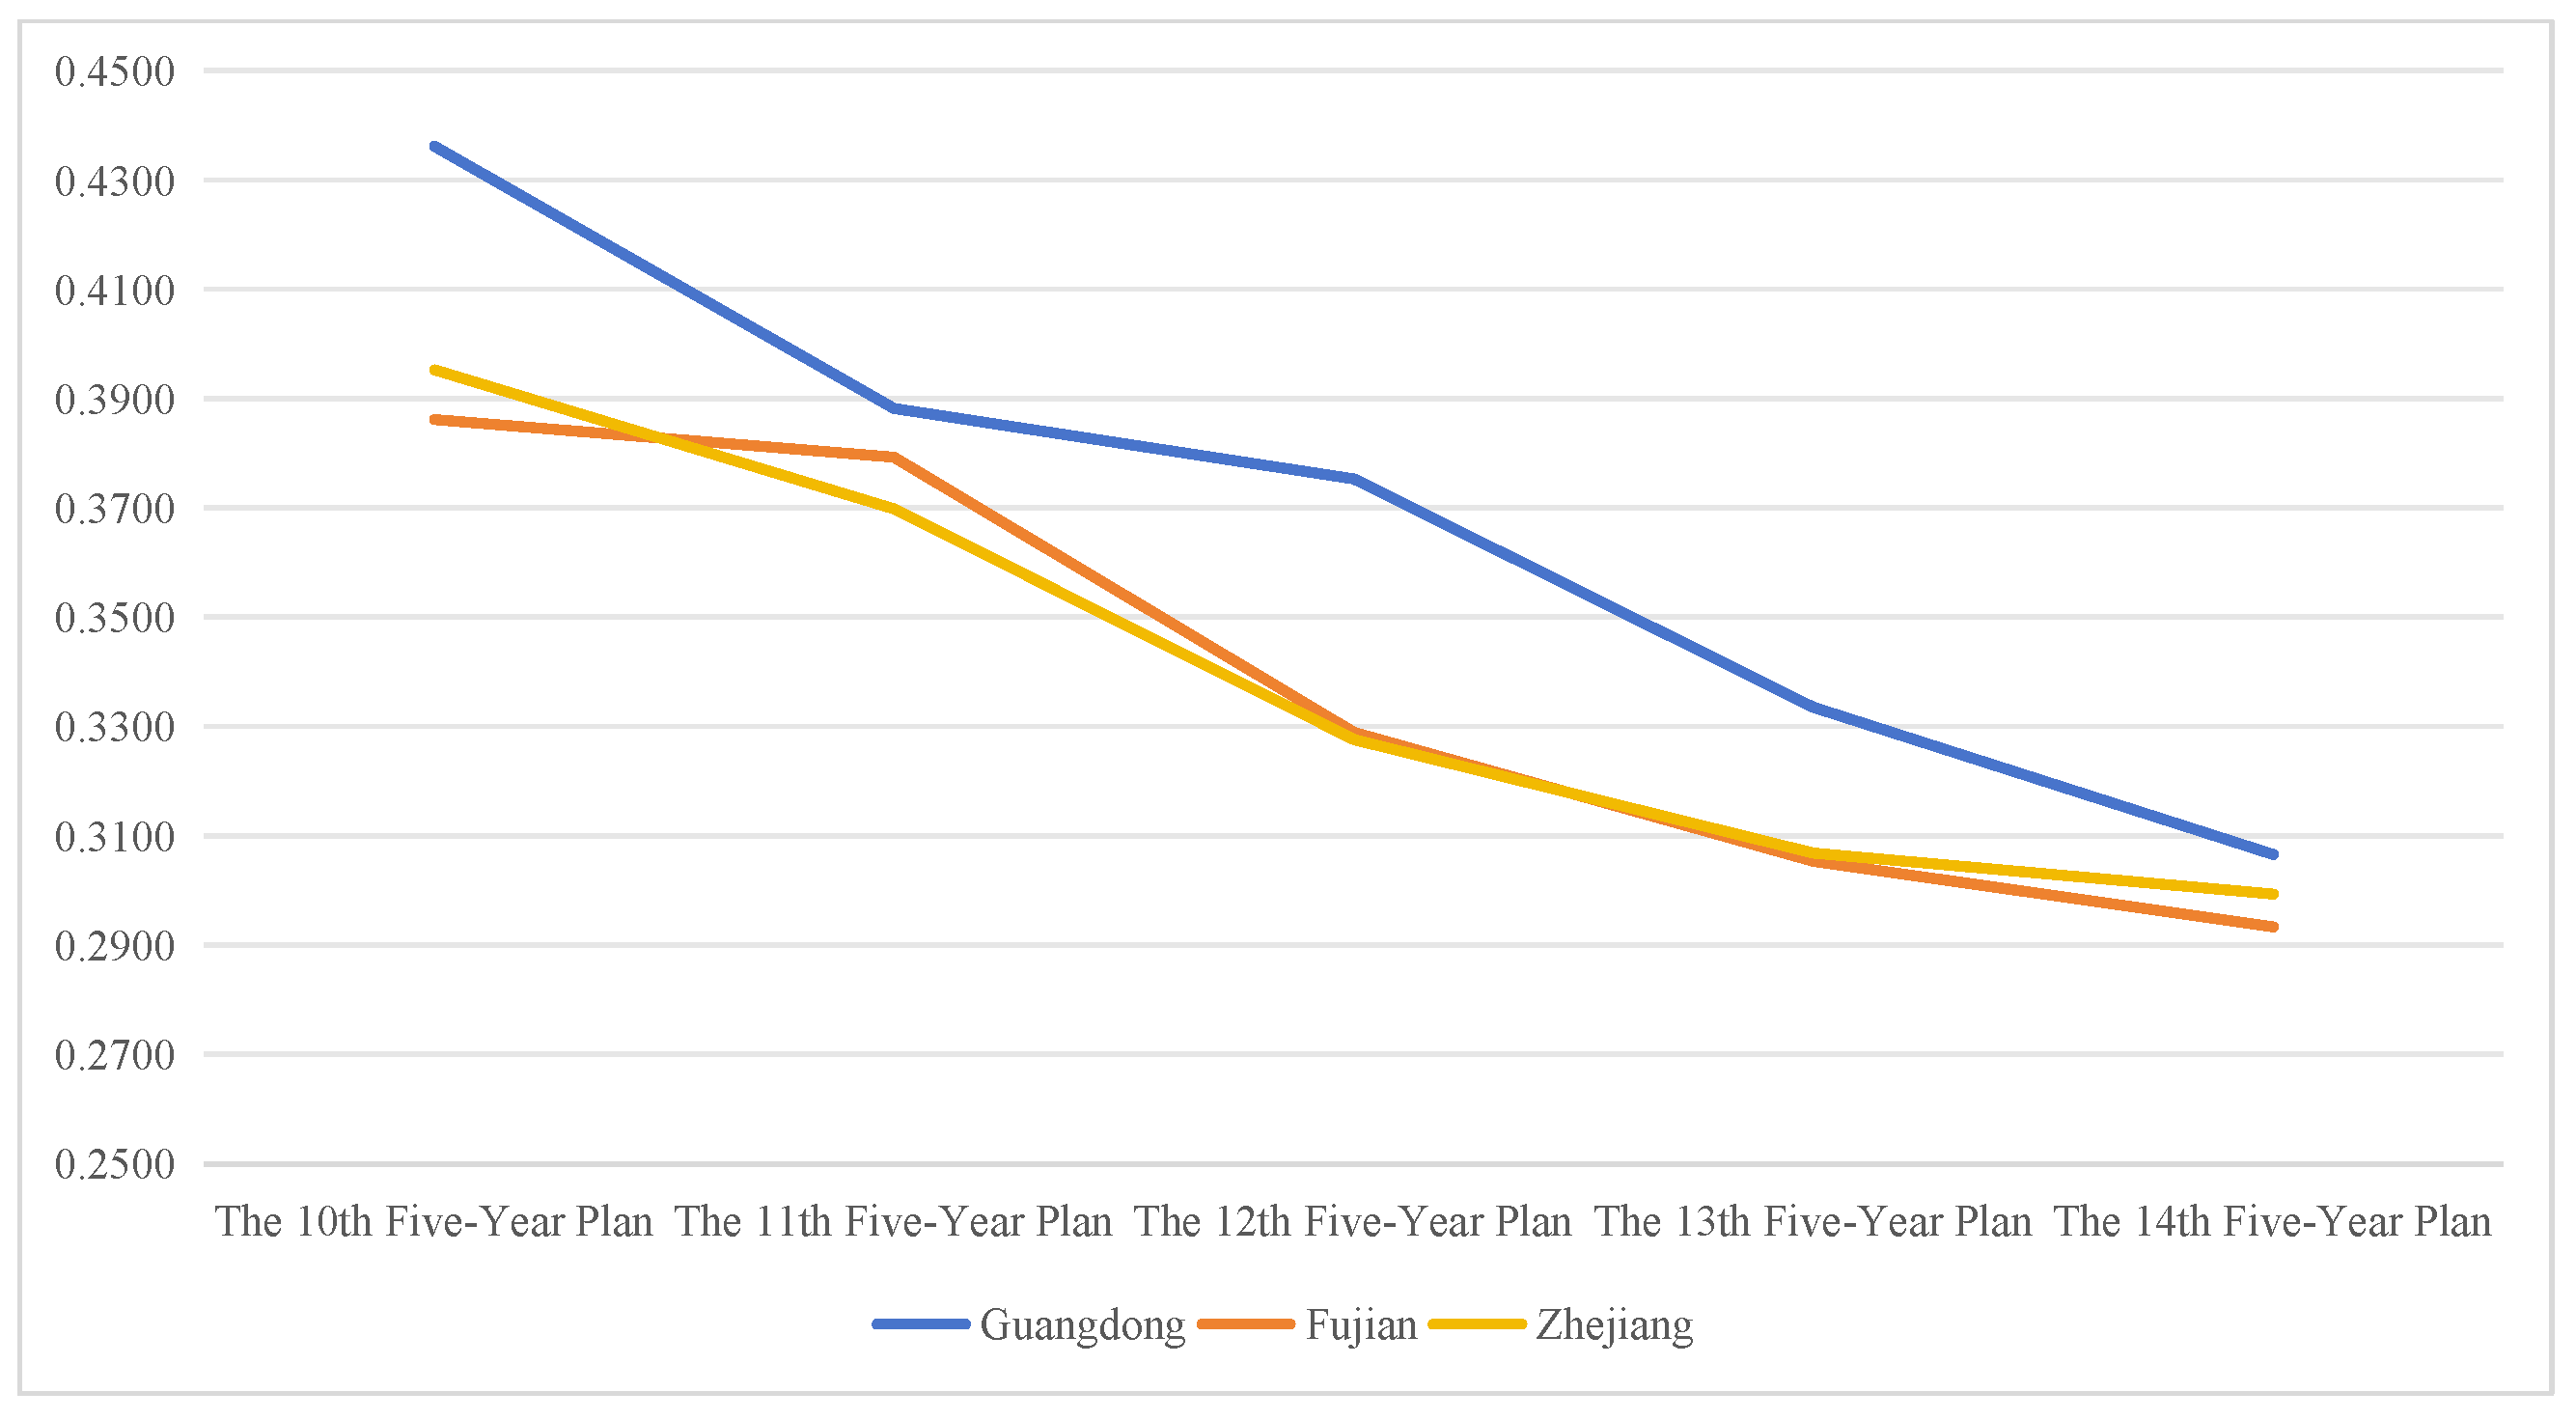
The temporal evolution trajectory of the coupling coordination degree of high-quality development within the GFZ-CUA during the period 2003–2022 is systematically presented in Appendix A Table A2. Regional variations in the grading of the coupling coordination degree of high-quality development are graphically illustrated in Figure 5, while the provincial-level evolutionary patterns of the coupling coordination degree across distinct time intervals are depicted in Figure 6.
The coupling coordination degree of high-quality development within the GFZ-CUA presents a generally stable but slightly decreasing trend. Notably, the entire region remains in the run-in-antagonistic stage. With respect to the spatial distribution of the coupling coordination degree of high-quality development, a hierarchical pattern (Guangdong > Fujian > Zhejiang) is observed. Further analysis is based on the regional average values of the coupling coordination degree across different time periods.
Before the 11th Five-Year Plan period, Guangdong was on the verge of imbalance. From the 11th Five-Year Plan to the mid-to-late period of the 12th Five-Year Plan, it was in a state of mild imbalance. Subsequently, a moderate imbalance emerged in the mid-to-late period of the 12th Five-Year Plan. This phenomenon can be attributed to the weak radiation effect of economic development from the Pearl River Delta (PRD) on eastern Guangdong. Eastern Guangdong is characterized by a “high ecology—low industry” development pattern, with its industrial structure still dominated by traditional industries. Cities in this region face substantial difficulties in industrial restructuring. Meanwhile, talents, resources, and policy support are highly concentrated in the PRD, resulting in inconsistencies in policy guidance, industrial development, and spatial distribution across eastern Guangdong.
Before the mid–to–late phase of the 11th Five—Year Plan, a state of mild disequilibrium prevailed in Fujian Province, which later transitioned to a state of moderate imbalance. Unbalanced regional development in the province is fundamentally driven by large disparities between coastal and inland areas. Such disparities manifest prominently in resource endowments, infrastructure provision, industrial agglomeration, urban-rural integration, and the institutional effectiveness of mountain-sea cooperation. Fujian’s economic development is highly concentrated in coastal regions, while inland areas face problems such as inadequate resource exploitation and low urbanization levels. These challenges are further exacerbated by persistent gaps in urban—rural integration and income inequality. In terms of the industrial structure, traditional industries still dominate Fujian’s economy, leading to a relatively monotonous industrial layout. Despite recent progress in the cultural and tourism sector, the lagging industrial development remains an unresolved constraint on regional progress. Compounding these challenges is the incomplete establishment of Fujian’s mountain—sea cooperation mechanism. Specifically, insufficient regional scientific and technological innovation capacity, coupled with an incomplete industrial chain system, constitutes a major obstacle to enhancing the coupling coordination level of high-quality regional development.
The coupling coordination degree of high-quality development shows similar evolutionary patterns in Zhejiang and Fujian, with the mid-to-late period of the 11th Five-Year Plan (2006–2010) as the critical turning point. Specifically, both provinces maintained a state of mild imbalance before this period, and gradually shifted to moderate imbalance thereafter. This pattern can be attributed to several factors. Relative to northeastern Zhejiang, southwestern Zhejiang lags considerably in economic development. Its industrial structure remains dominated by traditional sectors, accompanied by weak scientific and technological innovation, insufficient infrastructure, and constraints in policy support and resource openness. In addition, the radiation effect of the Yangtze River Delta Urban Agglomeration on southwestern Zhejiang is relatively weak. Although geographically adjacent to Fujian Province, southwestern Zhejiang has not fully exploited its locational advantages.
Southwestern Zhejiang acts as a key ecological barrier in Zhejiang Province, while eastern Guangdong functions as an ecological safeguard for Guangdong Province. Fujian has been designated as a national demonstration zone for ecological civilization construction. Given the comprehensive characteristics and geographical positioning of the GFZ-CUA, it is essential to fully exploit the core role of green ecology and low-carbon development in promoting regional synergistic high-quality development. This will gradually facilitate cross-regional coupling coordination in high-quality development.

4.3. Spatial Differentiation and Sources of Coupling Coordination for High-Quality Development in the GFZ-CUA

This study utilizes the Dagum Gini coefficient and its decomposition approach to examine the spatial disparity and intrinsic sources of coupling coordination in high-quality development within the GFZ-CUA, with empirical results detailed in Table 2.
(1) Overall Disparity and Its Sources
As demonstrated in Table 2, the overall Gini coefficient of coupling coordination for high-quality development within the GFZ-CUA exhibited a fluctuating downward trajectory over the period 2003–2022, ranging from 0.0448 to 0.1600. This empirical evidence indicates a gradual narrowing of the overall disparity in the coupling coordination degree of high-quality development across the urban agglomeration.
From the perspective of disparity source decomposition, the contribution of intra-regional disparity maintained relative stability with minor fluctuations. In contrast, inter-regional disparity contribution displayed the most pronounced volatility, followed by transvariation density, with these latter two components demonstrating symmetric variation patterns.
On average, inter-regional disparity accounted for 43.65% of the total annual disparity, indicating that the overall gap in coupling coordination primarily stems from inter-regional differences, with significant interactive effects observed among regions in their high-quality development coupling coordination dynamics.
The transvariation density contribution rate captures the overlapping effects between intra- and inter-regional inequalities. It comprehensively quantifies the sources of overall regional disparity while incorporating cross-regional interaction effects. This component reached a peak contribution of 49.88% in 2008 and a trough of 3.99% in 2013, with an average contribution of 24.25% across the 10th to 14th Five-Year Plan periods.
Accordingly, to mitigate the overall disparity in coupling coordination for high-quality development within the GFZ-CUA, prioritized policy interventions should focus on narrowing inter-regional gaps.
(2) Regional Disparity
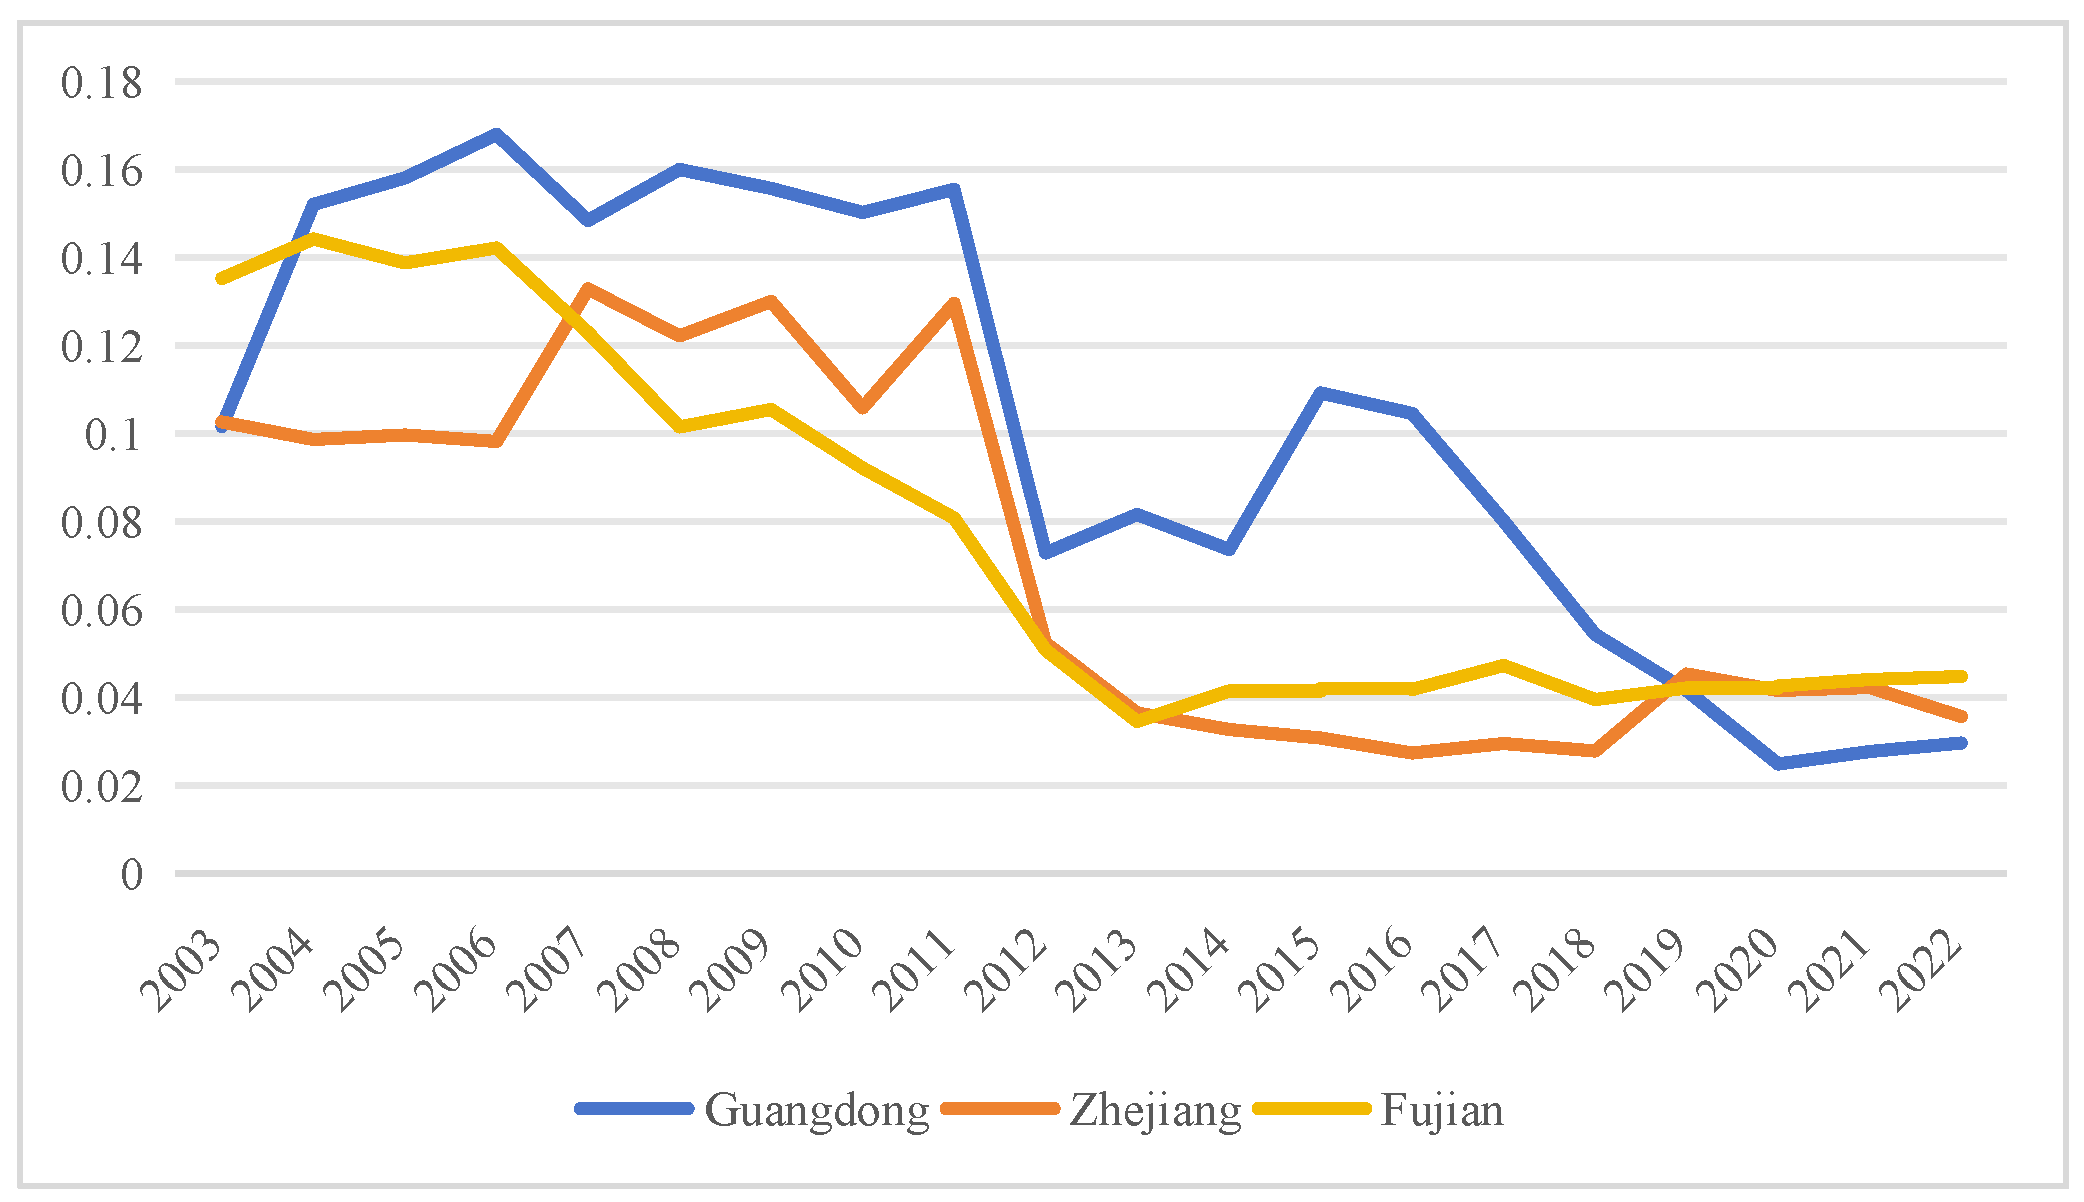
As illustrated in Figure 7, from the perspective of intra-regional disparity, the intra-regional differences in the coupling coordination degree of high-quality development across Guangdong, Zhejiang, and Fujian Provinces exhibit a fluctuating downward trend. This empirical observation indicates a gradual narrowing of intra-regional disparity in the coupling coordination of high-quality development within the GFZ-CUA. Among the three provinces, Guangdong demonstrates the most significant intra-regional disparity, whereas Zhejiang and Fujian maintain relatively balanced and stable intra-regional development. This phenomenon suggests that compared with Zhejiang and Fujian, Guangdong exhibits a more pronounced polarization in the spatial distribution of factors. In contrast, Zhejiang and Fujian have not yet formed robust agglomeration and spatial radiation effects, characterized by the absence of core central cities and regional centripetal force, resulting in relatively low levels of coupling coordination for high-quality development.
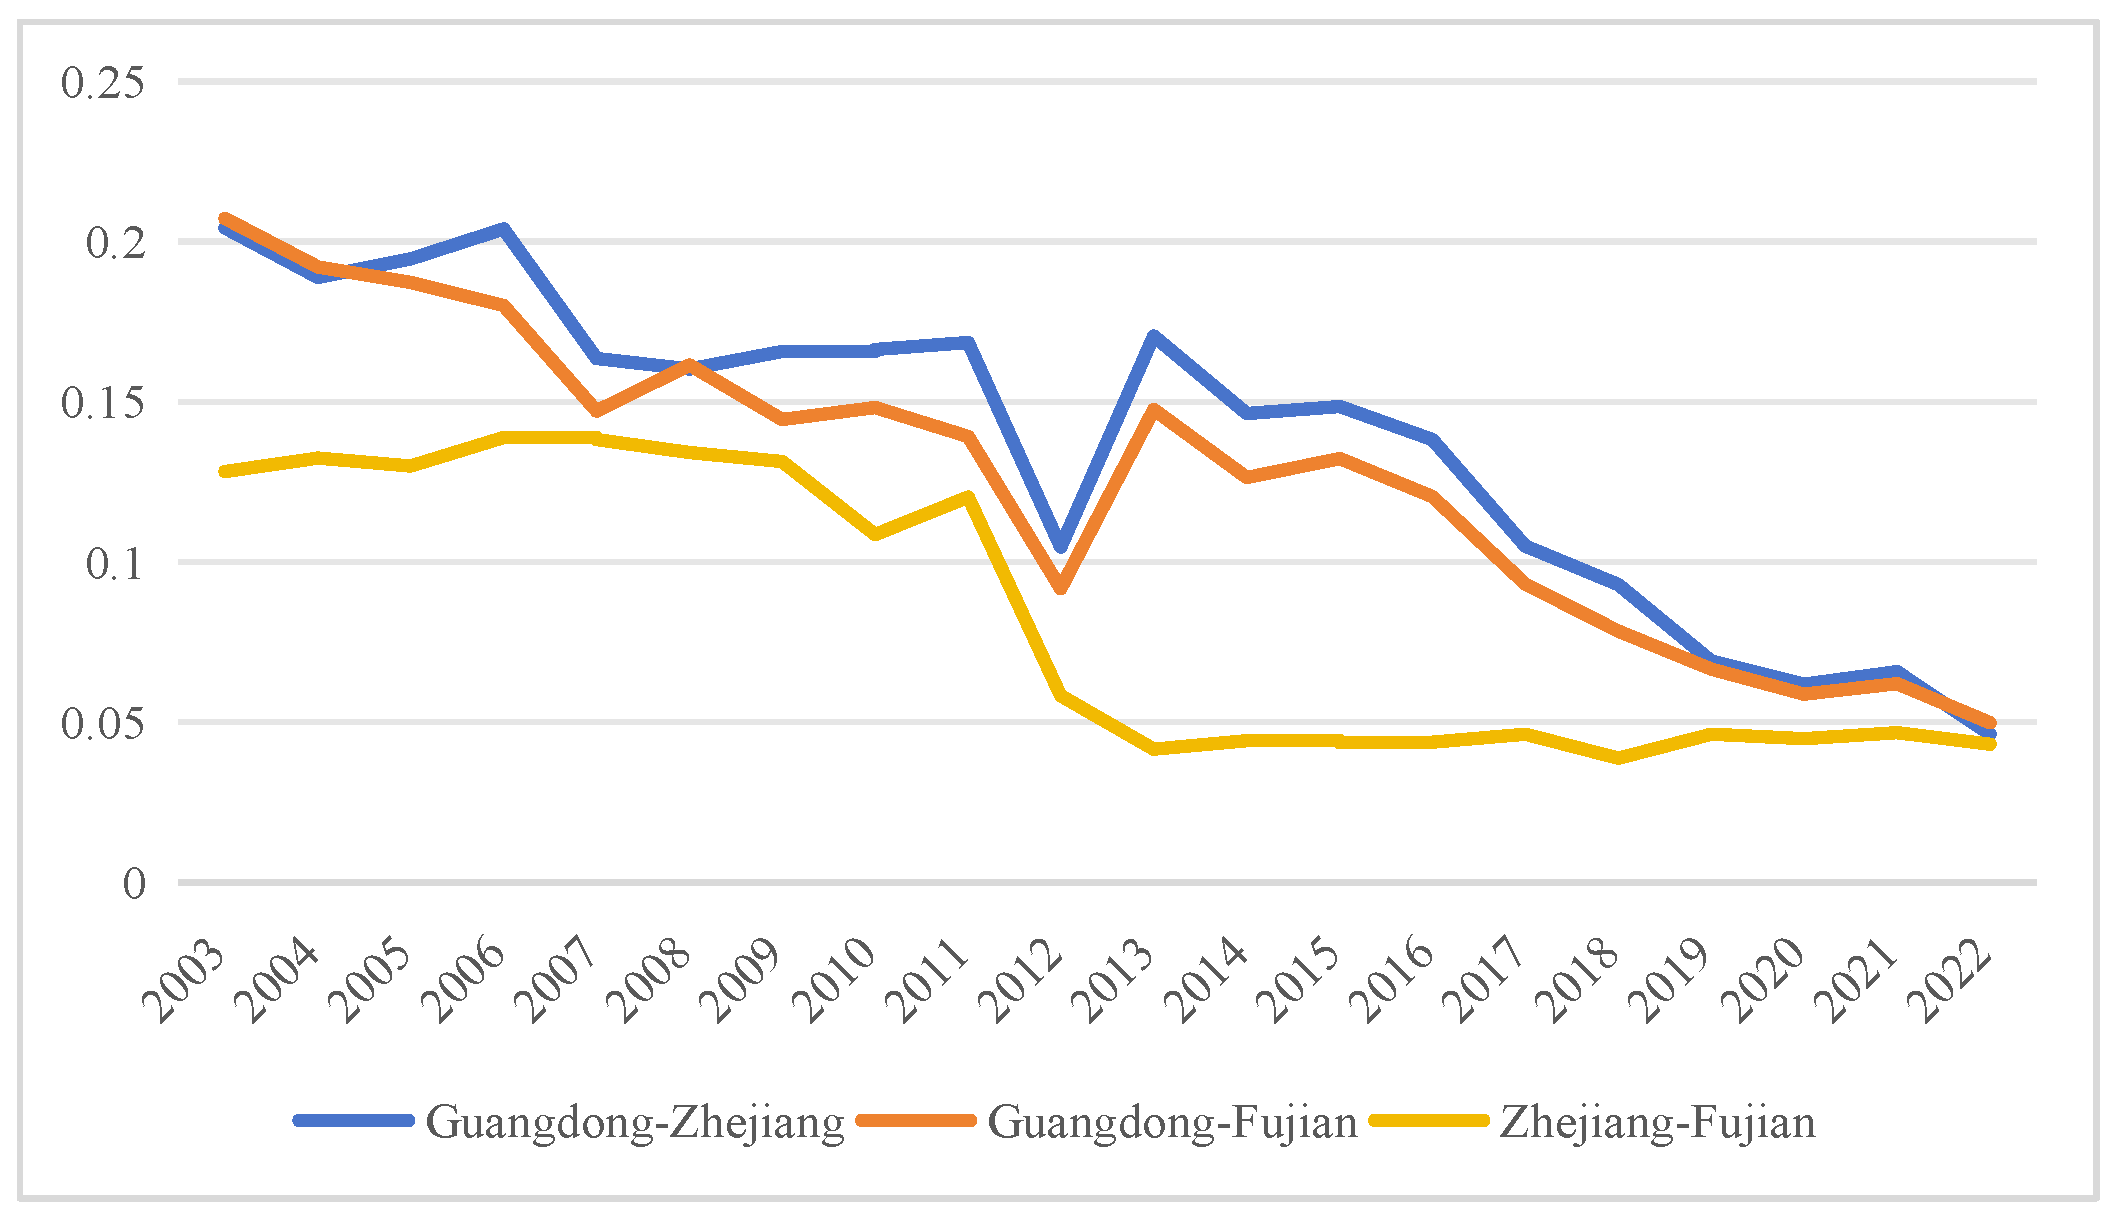
As shown in Figure 8, inter-regional disparities in the coupling coordination of high-quality development among Guangdong, Zhejiang, and Fujian exhibit a fluctuating downward trend. This suggests a gradual narrowing of regional differentials in coupling coordination within the GFZ-CUA. The Guangdong-Zhejiang region exhibits the highest Gini coefficient for high-quality development coupling coordination, followed by the Guangdong-Fujian region, with the Zhejiang-Fujian region demonstrating the lowest Gini coefficient. This spatial pattern arises from the geographical configuration of the three provinces, which form a narrow southeastern coastal urban belt. The greater geographical distance between Guangdong and Zhejiang results in the most pronounced inter-regional disparities, whereas adjacent regions exhibit smaller differences. The Gini coefficient of the coupling coordination degree for high-quality development between Guangdong and Fujian exceeds that between Zhejiang and Fujian. Concurrently, the inter-regional disparity measured by the Gini coefficient between Guangdong and Zhejiang shows a gradual narrowing trend, likely attributed to the higher growth rate of the coupling coordination degree in Zhejiang relative to Guangdong.

4.4. Analysis on the Convergence and Divergence of the Coupling Coordination Degree of High-Quality Development of GFZ-CUA

(1) σ convergence
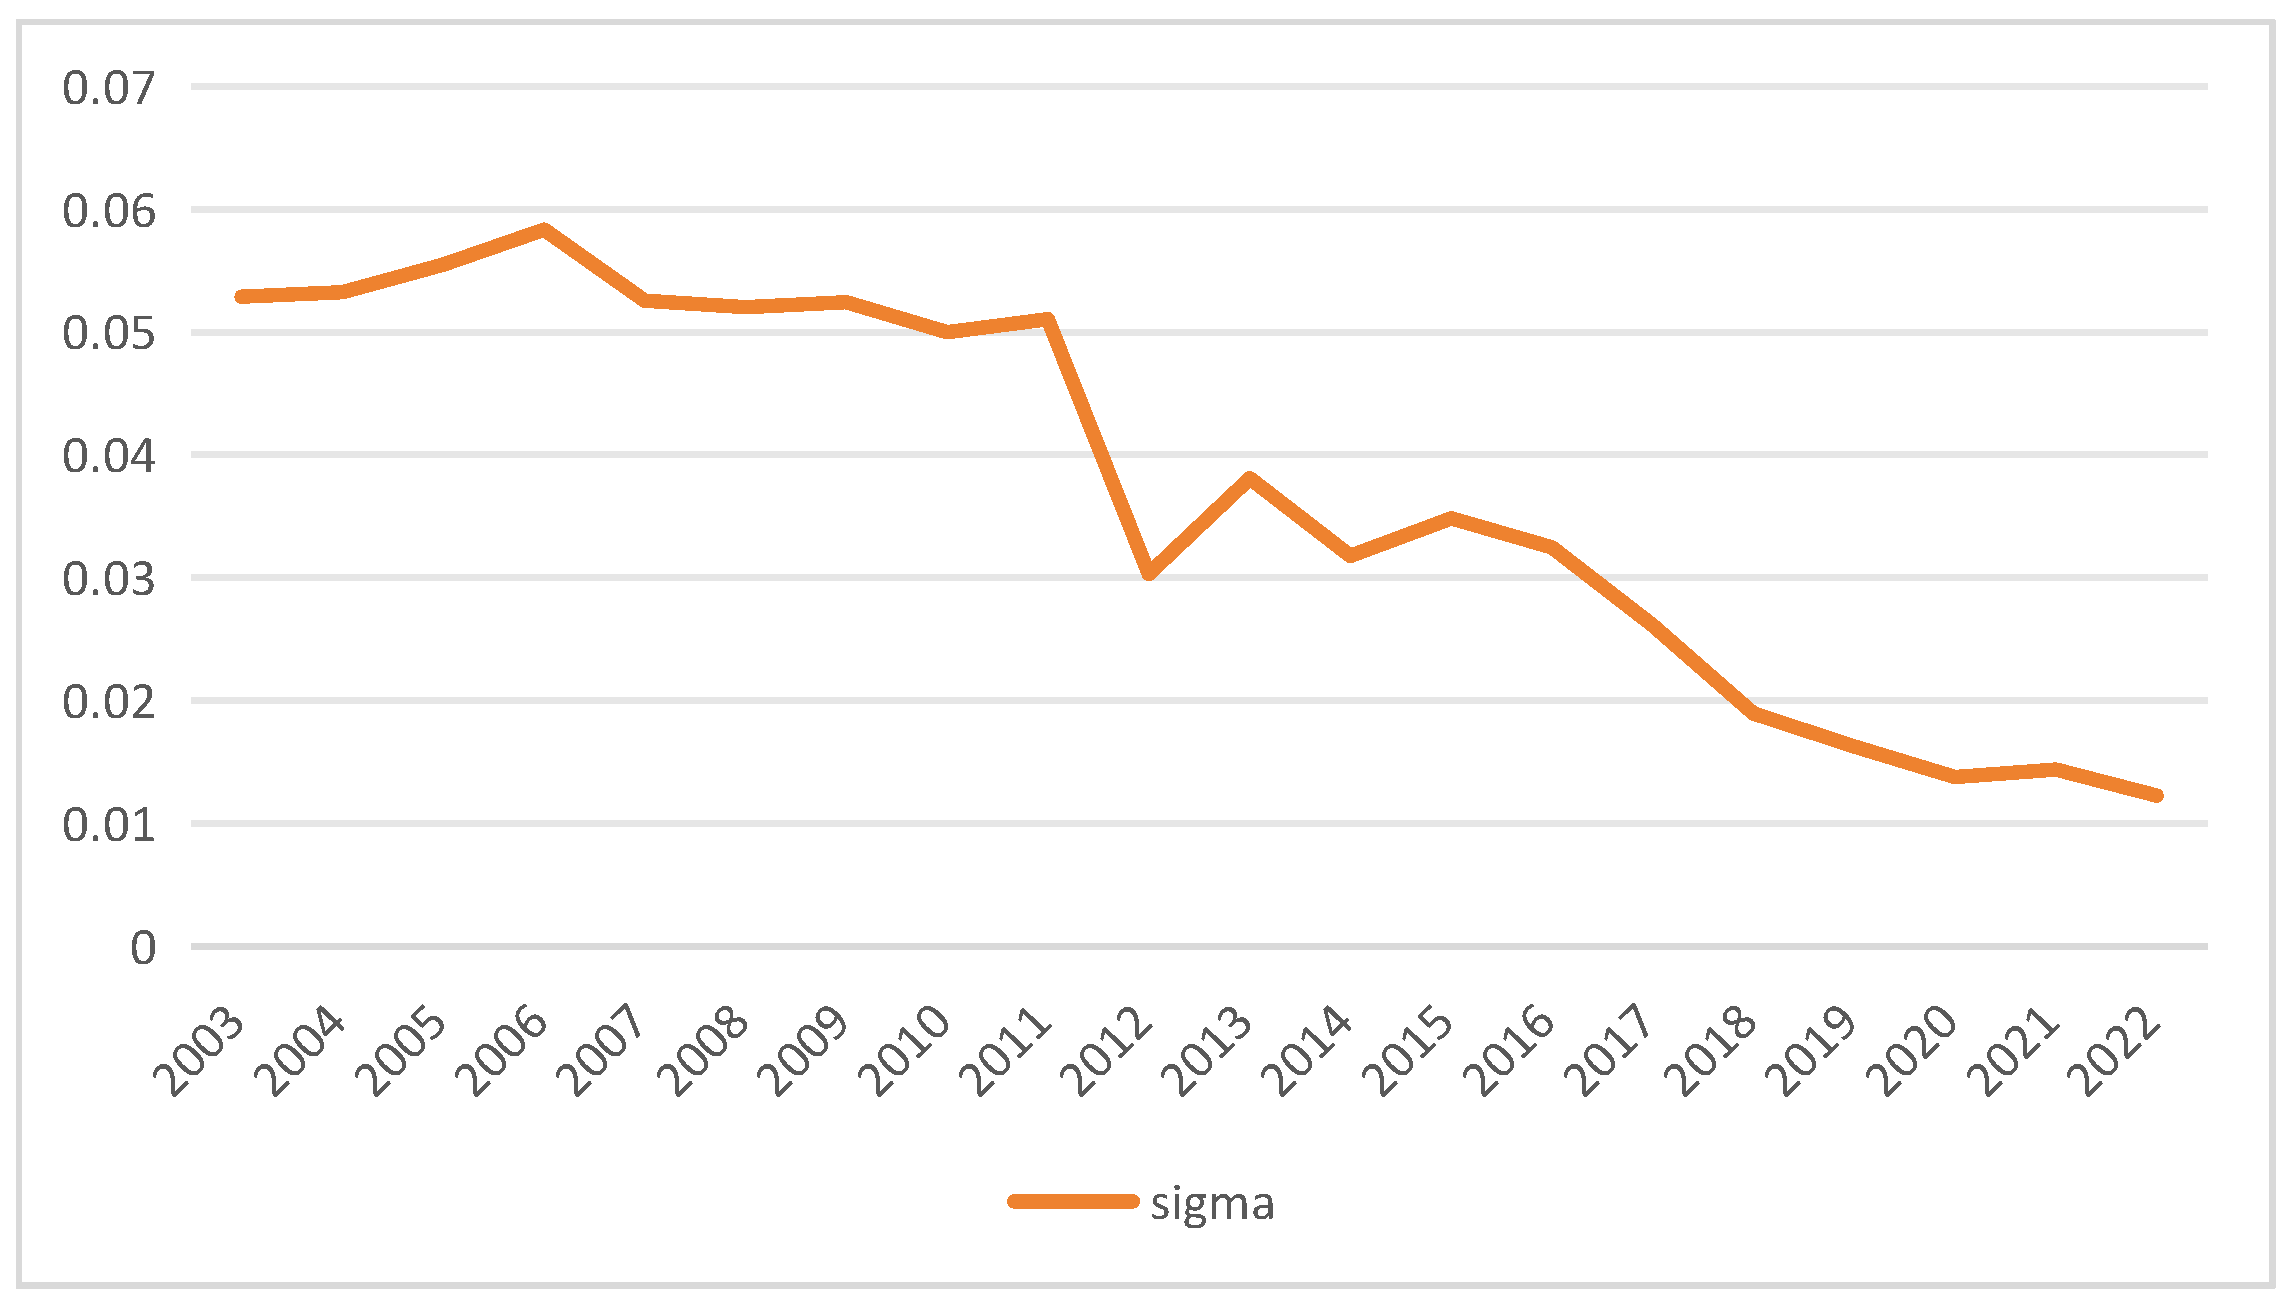
The σ convergence test results for the coupling coordination degree of high-quality development in the GFZ-CUA, as depicted in Figure 9, indicate that the coefficient exhibited a year-on-year fluctuating downward trajectory during the period 2003–2022. This empirical evidence confirms that the high-quality development of the study area demonstrates distinct σ convergence characteristics.
(2) β Convergence
To further analyze the convergence and divergence of high-quality development coordination among coastal urban agglomerations, this study conducted a β convergence analysis. The study tests for β absolute convergence, β conditional convergence, spatial β absolute convergence, and spatial β conditional convergence, with the results presented in Table 3.
The β coefficients derived from the convergence tests exhibit statistical significance with negative values, indicating that the coupling coordination degree of high-quality development in the GFZ-CUA demonstrates β absolute convergence characteristics. Upon inclusion of control variables, the β conditional convergence test yields valid results, thereby confirming the presence of β conditional convergence in the high-quality development of the urban agglomeration. Furthermore, empirical results reveal the absence of spatial absolute β convergence in the coupling coordination of high-quality development within the GFZ-CUA. Nevertheless, following the incorporation of control variables, the spatial conditional β convergence test is satisfied, accompanied by a significant improvement in model goodness-of-fit, which validates the effectiveness of introducing control variables.

4.5. The Impact of Digital Innovation on the Coupling Coordination Degree of High-Quality Development of GFZ-CUA

China’s National Big Data Comprehensive Pilot represents a major reform initiative to promote the marketization of data factors and support regional development. Launched in 2016 in accordance with the Action Plan for Promoting Big Data Development issued by the State Council in 2015, the pilot project designates data factors as a core driving force. It centers on data openness and sharing, data security governance, industrial innovation, and cross-regional collaboration, with the goal of removing regional data barriers and improving cross-regional data connectivity and factor allocation efficiency. Backed by an integrated digital governance platform, the pilot fosters coordinated actions in ecological conservation, public services, and market regulation. It enhances the intelligence of regional governance, helps bridge the regional digital divide, and acts as a critical digital infrastructure and institutional instrument for advancing regional integration and high-quality development.
Although the Big Data Comprehensive Pilot is intended to promote high-quality economic development, existing studies suggest that the impact of digital innovation on regional synergistic high-quality development is stage-dependent and controversial. As a major national-level urban agglomeration, the GFZ-CUA plays an indispensable role in advancing the green development of China. Accordingly, it is necessary to investigate the impact of digital innovation on regional synergistic high-quality development in this urban agglomeration. Using a panel dataset of prefecture-level cities in the GFZ-CUA over the period 2003–2022, this study applies the synthetic control method to empirically investigate how digital innovation affects the coupling coordination degree of high-quality development. The analysis also evaluates the policy effectiveness of the Big Data Comprehensive Pilot.
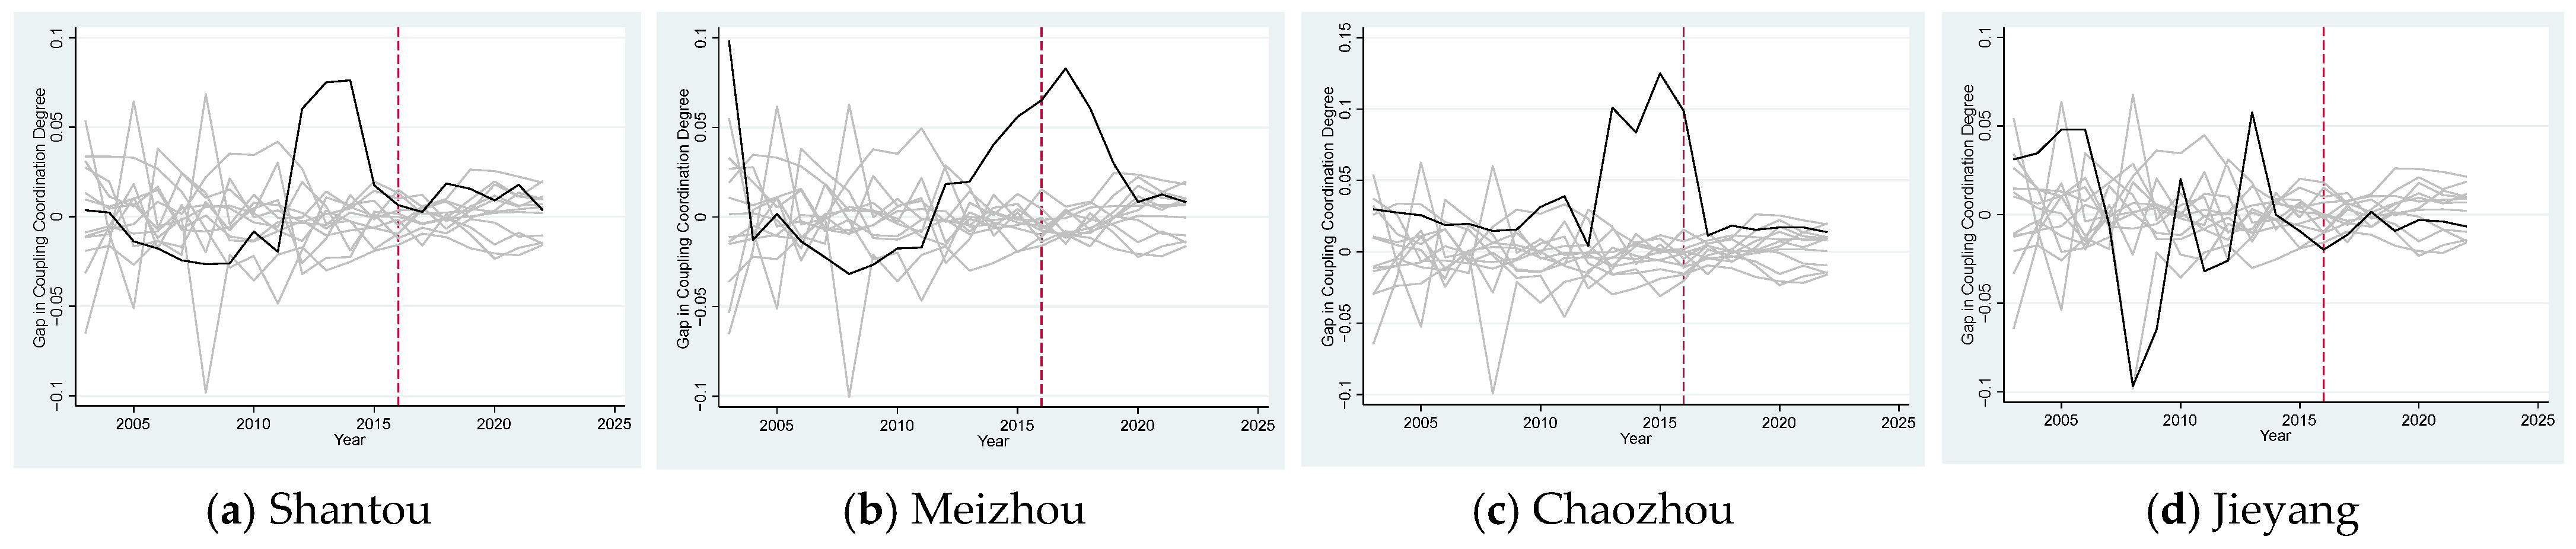
The synthetic control method critically relies on the specification of weights assigned to control units. Detailed results on the weight distribution are reported in Appendix A Table A3. The five-dimensional drivers of high-quality development and the coupling coordination degree of regional high-quality development for the years 2004, 2007, 2011, and 2015 were incorporated as explanatory variables in the synthetic control model. A comparative analysis of estimated results for all indicators between the actual and synthetic pilot regions is provided in Table 4.
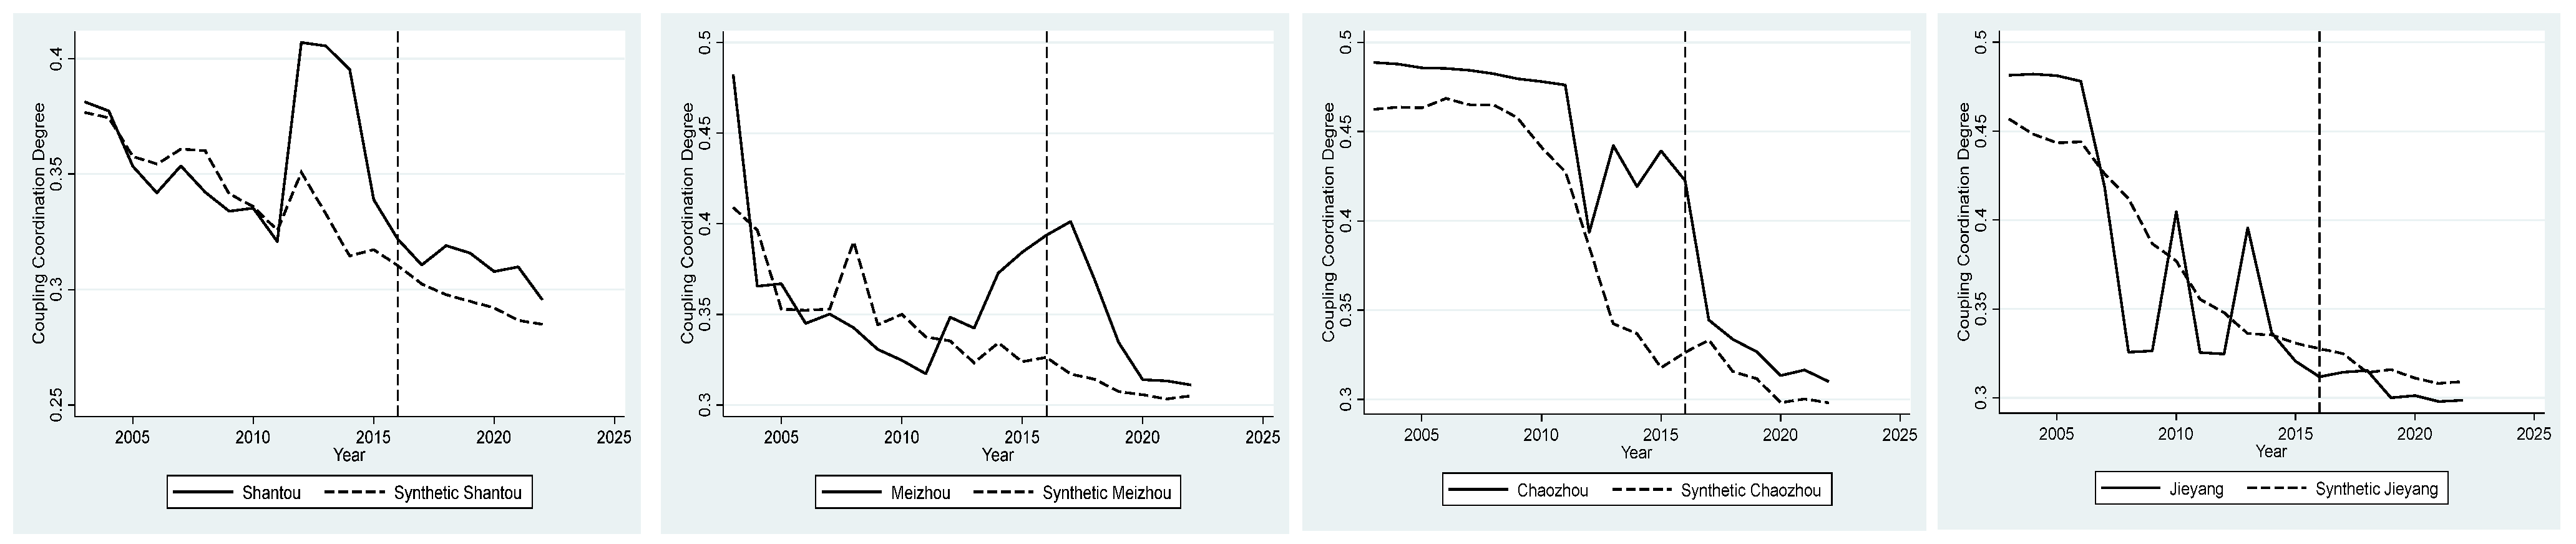
As presented in Table 4, during the policy implementation year, indicators for all actual and synthetic pilot regions demonstrated a robust pre-policy fitting effect, thereby enabling the rigorous construction of counterfactual states in the post-policy period. Detailed evaluation results of policy effects for the Big Data Comprehensive Pilots are provided in Appendix A Table A4 and Figure 10. Empirical results indicate that post-policy implementation, Shantou, Meizhou, and Chaozhou exhibited statistically significant policy effects, with digital innovation driving enhanced regional coordination. In contrast, Jieyang demonstrated limited policy responsiveness.
This differential outcome can be attributed to two primary mechanisms: (1) The gradual policy implementation timeline and inherent temporal lag effects have resulted in industrial digital transformation lagging behind digital innovation advancements in Jieyang, leading to misalignment between digital and traditional industrial sectors. Despite the Big Data Comprehensive Pilot policy promoting regional digital technology development, insufficient inter-regional coordination has delayed industrial restructuring, precluding full policy effect realization and yielding statistically insignificant short-term outcomes. (2) Jieyang’s geographical positioning within the GFZ-CUA, bordering the Guangdong-Hong Kong-Macao Greater Bay Area to the west and the Yangtze River Delta to the east, renders it vulnerable to the “siphon effect” exerted by these two mega-urban agglomerations. This phenomenon induces the concentration of talent, resources, capital, technology, and policy resources in the aforementioned regions. The implementation of the Big Data Comprehensive Pilot policy has further exacerbated this siphoning dynamic, thereby reducing the coupling coordination degree of high-quality development within the GFZ-CUA.
Under the integrated framework of sustainable digital innovation and regional coordinated development, the siphoning effect represents the unequal spatial allocation of development resources in the digital age. It erodes the technological foundations of regional synergy through digital factor monopolization while simultaneously destabilizing the spatial equilibrium of factor structures, thereby impeding the endogenous drivers of high-quality regional coordination and constituting a critical structural barrier to the holistic upgrading of urban agglomerations. Mega-urban agglomerations, with inherent advantages in resource endowments, policy support, and industrial foundations, exert a strong pull on diverse production factors such as capital, technology, and talent from surrounding areas. The continuous inflow of factors into core agglomerations leaves peripheral regions plagued by insufficient growth momentum, sluggish industrial upgrading, weakened innovation capacity, and constrained green and low-carbon transition. Such unbalanced factor agglomeration further widens the development gap between mega-urban agglomerations and the GFZ-CUA, preventing the latter from breaking its development bottleneck. A typical spatial pattern of “core concentration and peripheral stagnation” eventually emerges. Consequently, the siphon effect acts as a major binding constraint on the advancement of regional high-quality development in GFZ-CUA. The pathway of siphon effect is shown in Figure 11.
Furthermore, the placebo test is shown in Figure 12. And it exhibited statistical significance, thereby validating the robustness and reliability of the research conclusions. Results Supported Hypothesis 1.

4.6. Mechanism Test

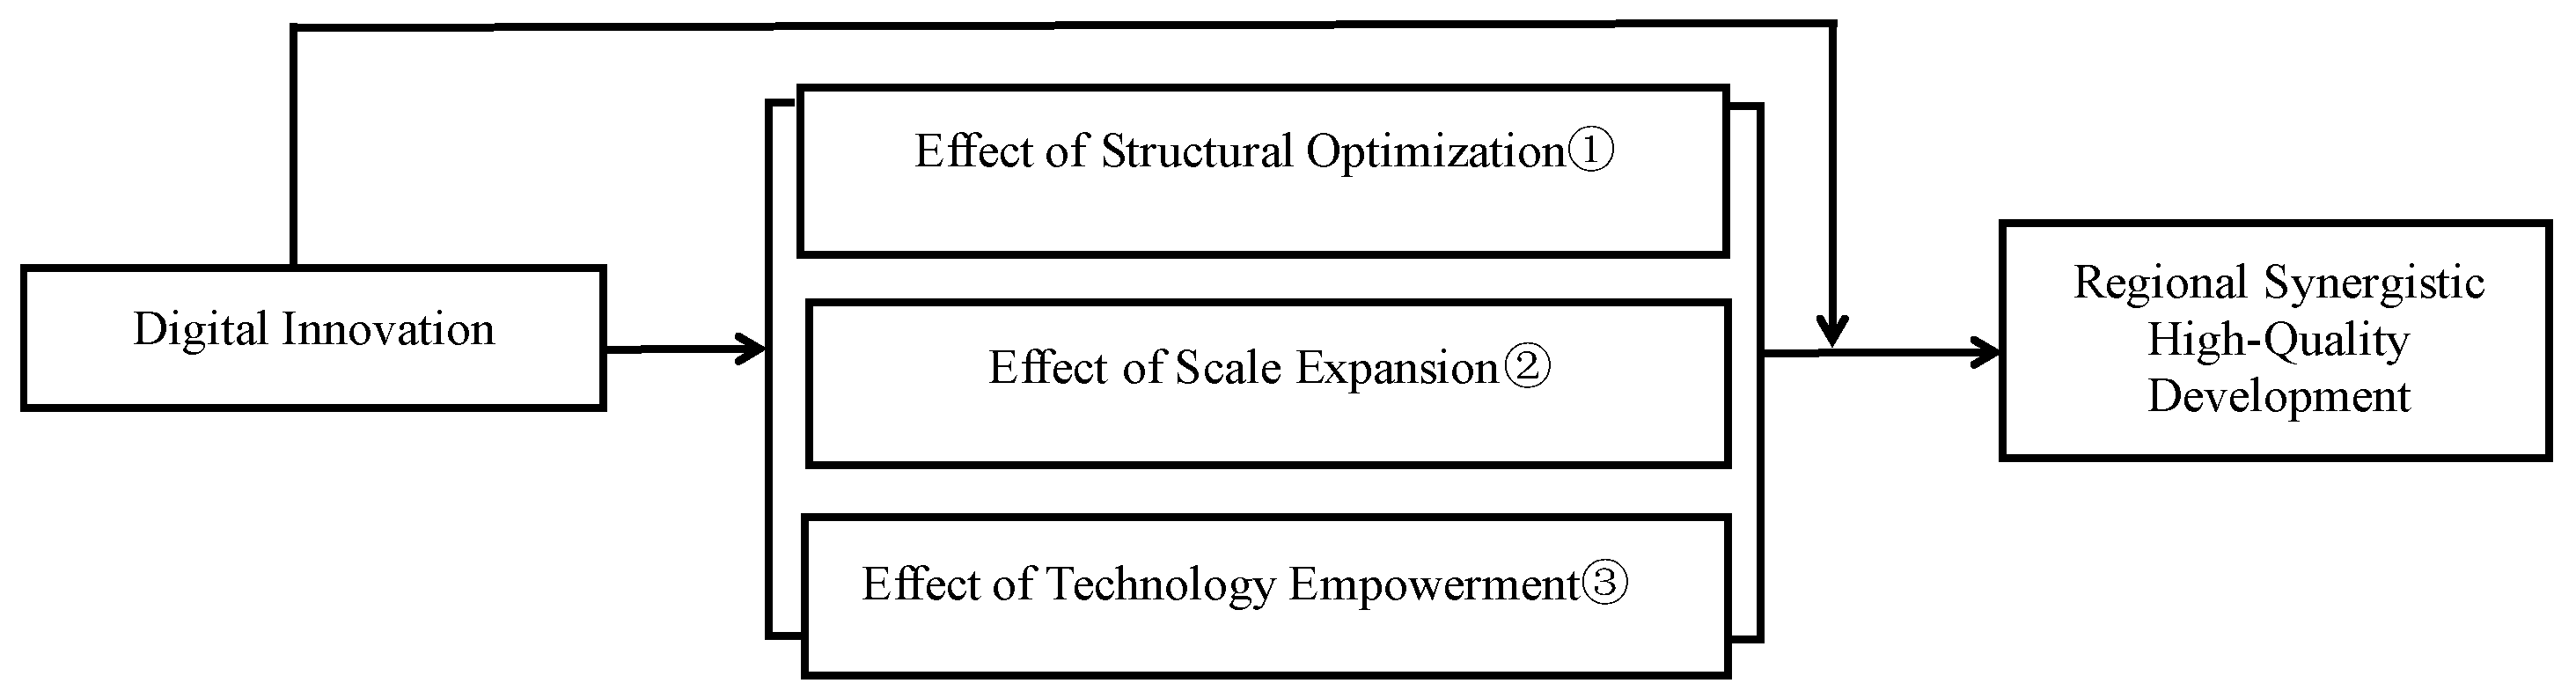
Drawing on Formulas (18) and (19), a moderated mediation model is employed to empirically examine the structural optimization effect, scale expansion effect, and technological empowerment effect of digital innovation on the coupling coordination degree of synergistic high-quality development within the GFZ-CUA. The mechanism of the moderated mediating effect model is shown in Figure 13. Estimation results are presented in Table 5. And the conditional indirect effects are detailed in Table 6.
In Table 5, mi denotes mediator variables (i = 1, 2, 3), corresponding to structural optimization, scale expansion, and technological empowerment, respectively. x represents digital innovation, and mix denotes the interaction term. x demonstrated a statistically significant positive influence on both m1 and m2, thereby confirming its capacity to effectively induce variations in m1 and m2. However, the interaction term m1x and m2x failed to exert a significant effect on y, indicating that x did not significantly regulate the impacts of m1 and m2 on y, respectively. The reason for the result is that m1 and m2 exert stable effects on y. x influences y primarily through m1 and m2, rather than by altering the marginal effects of m1 and m2. Consequently, the impacts of m1 and m2 on y are not significantly moderated by the level of x. Such rigidity leads to an insignificant moderating effect of x, as reflected in the statistically insignificant coefficient of the interaction term m1x and m2x. Other key variables exhibit statistical significance, confirming that the moderated mediation model effectively captures the influence mechanism of digital innovation on the coupling coordination degree of regional synergistic high-quality development. The incorporation of digital innovation as a moderating variable is deemed theoretically sound and empirically credible for explaining this mechanism.
Table 6 demonstrates that the three models exhibit variations in their moderating variables. As the moderating level changes, the coefficients for structural optimization effects and scale expansion effects in the corresponding models gradually diminish with increasing digital innovation levels, yet remain statistically significant. This indicates that digital innovation has a limited capacity to enhance the coupling coordination degree of regional synergistic high-quality development through structural optimization. In contrast, the technological empowerment effect shows a significant positive coefficient growth as digital innovation levels increase, suggesting that the GFZ-CUA’s synergistic high-quality development can achieve leapfrog progress through technological empowerment. These findings validate the suitability of the moderated mediation model for analyzing the mechanism relationships examined in this study.
Further analysis shows that against the background of sustainable digital innovation, it challenges the conventional wisdom of “unidirectional digital dividend empowerment.” Drawing on the integrated perspective of digital innovation theory and regional coordinated development theory, this study re-examines the complex transmission mechanisms through which digital innovation shapes regional synergy. The findings reveal that digital innovation does not invariably function as a positive driver of coordinated development. Instead, it reshapes intra-regional interaction logics through three core effects, technological empowerment, structural optimization, and scale expansion, thereby generating structural constraints on high-quality collaborative development within urban agglomerations at specific stages.
(1) Technological empowerment through “decentralization” erodes the endogenous momentum for regional collaboration. The defining characteristic of digital innovation lies in its decentralization and capacity to transcend spatial constraints. Leveraging digital platforms and intelligent technology systems, development actors can effectively circumvent inherent resource endowments and geographic boundaries, forging autonomous endogenous growth trajectories. According to regional coordinated development theory, cross-regional collaboration stems fundamentally from factor complementarity and resource interdependence. Yet digital technological empowerment substantially enhances local actors’ self-sufficient development capabilities, attenuating inter-urban resource dependence and complementarity demands. Consequently, local initiatives for collaborative engagement diminish, and the foundations for integrated, coordinated development across urban agglomerations weaken.
(2) The “heterogeneous differentiation” of the digital divide elevates institutional barriers to collaborative coordination. The realization of regional coordinated development hinges upon the equalization of development capabilities and the rationalization of division structures. However, digital innovation theory explicitly posits that the diffusion and transformation efficiency of digital technologies exhibit substantial heterogeneity across individual regions. Driven jointly by structural optimization effects and scale expansion effects, digital innovation further amplifies regional development disparities: core cities rapidly accomplish digital transformation by leveraging industrial and capital advantages, whereas peripheral cities—constrained by weak digital infrastructure and limited absorptive capacities—fail to share innovation dividends. The resulting digital fragmentation and development gaps directly inflate institutional, communication, and governance costs for cross-regional collaboration. This disrupts the balanced collaborative pattern requisite for regional coordination, rendering the formation of stable and effective synergistic forces within urban agglomerations untenable.
(3) Factor competition effects compress the external space for regional synergy. The superimposed influence of the three effects reshapes competitive-collaborative relationships within urban agglomerations, intensifying regional competition and progressively constraining cooperative space. Against the dual backdrop of digital innovation and carbon constraints, inter-regional interactions undergo fundamental reconfiguration. Whereas traditional regional coordination theory emphasizes division-based collaboration and mutual gains, digital innovation transforms data, technology, and emerging industries into core competitive assets. Confronted with rigid resource constraints, localities engage in increasingly fierce competition over digital trajectories and innovation outcomes. Territorial development tendencies strengthen accordingly, enabling “competition effects” to consistently override and suppress “synergy effects.” Excessive territorial competition narrows the scope for cross-regional industrial collaboration, factor mobility, and joint governance. This deviation from the developmental orientation of coordinated regional governance ultimately drives sustained decline in the overall coordinated development level of urban agglomerations.
Results Supported Hypotheses 2–5.

5. Conclusions and Policy Implications

5.1. Conclusions

Within the theoretical framework of sustainable digital transformation, this study constructs an evaluation index system for synergistic high-quality development of the GFZ-CUA incorporating dual-carbon factors. It systematically analyzes the evolutionary characteristics of regional synergistic high-quality development and further investigates the driving mechanism of digital innovation on its enhancement in coastal urban agglomerations. The main conclusions are as follows:
(1) During the 10th to 14th Five-Year Plan periods, against the backdrop of sustainable digital transformation, the level of synergistic high-quality development of the GFZ-CUA generally showed a steady downward trend. The hierarchical order of dimensional indices is as follows: green development index > shared development index > coordinated development index > innovative development index > open development index. The green development index plays a leading and driving role in the synergistic high—quality development of the coastal urban agglomeration.
(2) The coupling coordination degree of high-quality development in the GFZ-CUA remains relatively low, lying in the transition zone between moderate imbalance and incipient imbalance. The primary source of disparity in coupling coordination levels stems from inter-regional Gini coefficient contributions, specifically manifested as “gradient disparities” among regions.
(3) The coupling coordination degree of high-quality development in the GFZ-CUA exhibits significant σ convergence and β absolute convergence characteristics, while spatial β absolute convergence is not observed. Following the introduction of control variables, the coupling coordination degree demonstrates both β conditional convergence and spatial β conditional convergence traits.
(4) As a core driver of sustainable digital transformation, digital innovation exerts a stage-wise inhibitory effect on regional synergistic high-quality development of the GFZ-CUA. Notwithstanding the notable policy impacts of big data comprehensive pilots in advancing sustainable digital transformation, vigilance is warranted regarding the potential “siphon effect” exerted by the Yangtze River Delta and Pearl River Delta mega-urban agglomerations on regional digital resources.

5.2. Policy Implications

The policy implications for improving the coupling coordination level of high-quality development in GFZ-CUA are as follows:
(1) Strengthen the capacity for independent innovation in sustainable digital transformation to foster robust momentum for economic development. Digital technological innovation serves as a pivotal driver for synergistic high-quality development within the GFZ-CUA. Through enhancing regional digital innovation capabilities, adjusting energy structures, developing new and renewable energy sources, and optimizing energy management, energy efficiency can be improved. This will reduce regional carbon emissions and pollution, facilitate high-quality development, and accelerate the alignment between the “dual carbon” goals of coastal urban agglomerations and regional high-quality development.
(2) Facilitate the achievement of sustainable development and dual-carbon goals through sustainable digital transformation while guiding the synergistic high-quality development of regions. The synergistic effects of pollution reduction and carbon mitigation should be maximized. Specifically, the “dual carbon” goals ought to guide the synergistic high-quality development of the GFZ-CUA, while this development should concurrently underpin the attainment of the dual-carbon goals, thereby fostering interactive dynamics between low-carbon development systems and high-quality development systems. Efforts should be made to promote the coordinated development of traditional industries and digital industries, establish a timely adjustment mechanism for industrial restructuring and pilot policies, and prevent the “siphon effect” in mega-urban agglomerations to ensure the balanced mobility of factors.
(3) Optimize multi-dimensional policy frameworks and enhance the capacity building for regional green development through sustainable digital transformation. To advance the coupled coordination process of high-quality development and green development in the GFZ-CUA, optimization of the spatial layout of regional digital innovation and promotion of regional integrated development are imperative. This necessitates establishing a spatial foundation for synergistic growth through the creation of ecological demonstration zones, while interconnected infrastructure systems should be constructed to realize policy advantage complementarity. Furthermore, it is critical to develop multi-dimensional long-term institutional safeguards, encompassing effective incentive and penalty mechanisms, to facilitate sustainable ecological improvement within these coastal urban agglomerations.
(4) Broaden openness and deepen cooperation through sustainable digital transformation to enhance the core competitiveness of regional industries. Leveraging digital innovation platforms facilitates the enhancement of external openness. On one hand, government authorities can promote the production and export of low-carbon products and strengthen international low-carbon economic cooperation through incentive mechanisms. On the other hand, governments can guide enterprises in implementing low-carbon technological transformation and enhance the core competitiveness of regional industries via reverse mechanisms, thereby achieving pollution and carbon emission reduction goals.
(5) Establish a regional joint prevention and control mechanism driven by sustainable digital transformation for collaborative governance outcome sharing. Industrial transfer remains associated with significant carbon emission leakage and environmental pollution effects. As a core node in China’s economic development layout, the GFZ-CUA should, under the principle of coordinating overall interests, transcend administrative boundary constraints, collaboratively formulate regional carbon reduction and environmental governance objectives and strategies, establish regional joint prevention and control mechanisms, collectively address climate challenges and pollution incidents, and share the phased outcomes of collaborative governance.

Funding

This work was supported by Huaqiao University’s Academic Project Supported by the Fundamental Research Funds for the Central Universities [Grant NO. 23SKGC-QG01] to support this study.

Institutional Review Board Statement

Not applicable.

Informed Consent Statement

Not applicable.

Data Availability Statement

Data will be made available on request.

Conflicts of Interest

The author declares no conflicts of interest.

Appendix A

Table A1. Classification and Corresponding Stages of Coupling Coordination Levels.
Coupling Coordination DegreeClassificationStageCoupling Coordination DegreeClassificationStage
[0, 0.1)Severe imbalanceLow coupling[0.5, 0.6)Barely coordinatedBreak-in period
[0.1, 0.2)Major maladjustment[0.6, 0.7)primary dysregulation
[0.2, 0.3)Moderate dysregulation[0.7, 0.8)Intermediate dysregulationModerate Coupling
[0.3, 0.4)Mild dysregulationAntagonistic stage[0.8, 0.9)Poor adaptation
[0.4, 0.5)Borderline maladjustment[0.9, 1]Unbalanced qualityHigh coupling
Table A2. The Evolution Trend of Coupling Coordination Degree for High-Quality Development in the GFZ-CUA, 2003–2022.
PeriodYearGuangdongFujian
ShantouChaozhouJieyangMeizhouFuzhouXiamenQuanzhouZhangzhou
The late stage
of the 10th
Five-Year Plan
20030.38140.48220.48870.48150.35520.36890.41330.3494
20040.37750.36560.48790.48210.35530.36470.40010.3482
20050.35340.36690.48580.48130.34500.35900.35210.3237
Mean0.37070.40490.48750.48160.35180.36420.38850.3404
the 11th
Five-Year Plan
20060.34200.34500.48540.47800.34070.35910.35160.3266
20070.35360.35020.48430.41880.35060.34790.35340.3278
20080.34220.34260.48240.32570.34060.33660.39610.4176
20090.33390.33060.47960.32650.33110.32990.34590.3279
20100.33530.32460.47810.40490.32320.33200.35200.3386
Mean0.34140.33860.48200.39080.33720.34110.35980.3477
the 12th
Five-Year Plan
20110.32080.31730.47600.32560.31690.33120.33820.3188
20120.40700.34840.39350.32470.35330.32790.33610.3235
20130.40550.34240.44220.39570.33350.32140.32350.3295
20140.39530.37280.41920.33650.30580.31900.33600.3250
20150.33900.38430.43910.32070.31310.31200.32510.3133
Mean0.37350.35300.43400.34060.32450.32230.33180.3220
the 13th
Five-Year Plan
20160.32190.39370.42260.31190.30270.31880.32710.3152
20170.31070.40120.34450.31440.29460.30120.31890.3020
20180.31900.36920.33360.31530.29100.30040.31570.2992
20190.31590.33450.32660.30000.28900.28990.30930.2925
20200.30780.31390.31340.30130.28630.29120.30720.2933
Mean0.31500.36250.34810.30860.29270.30030.31570.3004
The early stage
of the 14th
Five-Year Plan
20210.30990.31330.31640.29790.28000.29470.30430.2905
20220.29570.31100.31010.29880.27650.28800.30690.2933
Mean0.30280.31220.31320.29830.27820.29140.30560.2919
PeriodYearFujianZhejiang
PutianLongyanSanmingNanpingNingdeWenzhouLishuiQuzhou
The late stage
of the 10th
Five-Year Plan
20030.37980.41090.34760.45910.48150.44930.42380.3384
20040.37600.34210.33960.46040.48220.44030.40270.3388
20050.37000.35100.42660.46030.48050.43550.39340.3355
Mean0.37530.36800.37130.45990.48140.44170.40660.3376
the 11th
Five-Year Plan
20060.35970.43680.42890.46680.47840.42280.39770.3158
20070.38440.43210.42900.46460.46720.45610.37050.3282
20080.37890.41220.41900.46780.44840.44100.36340.3141
20090.36770.34910.36570.46400.42210.44060.33900.3069
20100.34180.32240.33700.44670.41010.41620.33260.3021
Mean0.36650.39050.39590.46200.44520.43530.36070.3134
the 12th
Five-Year Plan
20110.33360.31390.31880.43710.37400.43290.33040.2975
20120.32850.31100.30580.38940.36240.36270.32850.3084
20130.32250.30360.31100.34120.34930.33730.31830.2998
20140.33480.30880.30860.33580.34210.33100.32630.2986
20150.33340.30280.29740.31430.33670.32440.32280.2943
Mean0.33050.30800.30830.36350.35290.35770.32530.2997
the 13th
Five-Year Plan
20160.33110.30810.29970.32410.33830.32500.31340.2986
20170.32240.29170.30170.33310.33330.32270.31360.2920
20180.30820.29930.29360.31540.31670.31590.31110.2872
20190.30780.28550.29120.31120.31390.32220.31860.2748
20200.30880.27420.29460.29640.30770.31940.31580.2723
Mean0.31570.29180.29620.31600.32200.32110.31450.2850
The early stage
of the 14th
Five-Year Plan
20210.30100.27260.28660.29940.30530.31370.31190.2682
20220.30550.28100.29220.29630.30880.31590.30970.2765
Mean0.30320.27680.28940.29780.30710.31480.31080.2724
Table A3. Weight Determination for Each Synthetic Policy Pilot.
CitySynthetic ShantouSynthetic MeizhouSynthetic ChaozhouSynthetic Jieyang
Shantou0000
Fuzhou0.727000
Xiamen00.09900
Quanzhou0000
Zhangzhou0000
Putian0.1890.90100
Longyan000.850
Sanming0000
Nanping0000
Ningde0.08400.150.574
Wenzhou0000
Lishui0000
Quzhou0000.426
Table A4. Evaluation of Policy Effects in Big Data Pilots.
PilotsShantouMeizhouChaozhouJieyang
Year Policy EffectRate of ChangePolicy EffectRate of ChangePolicy EffectRate of ChangePolicy EffectRate of Change
20030.00460.01210.07330.15190.02630.05380.02460.0511
20040.00300.0080−0.0310−0.08470.02420.04960.03370.0699
2005−0.0043−0.01220.01410.03830.02250.04630.03790.0787
2006−0.0124−0.0362−0.0073−0.02120.01690.03480.03400.0711
2007−0.0073−0.0207−0.0027−0.00760.01920.0397−0.0072−0.0172
2008−0.0180−0.0526−0.0476−0.13900.01750.0363−0.0865−0.2657
2009−0.0076−0.0228−0.0136−0.04130.02190.0456−0.0602−0.1844
2010−0.0006−0.0017−0.0254−0.07830.03690.07720.02780.0687
2011−0.0049−0.0153−0.0202−0.06380.04840.1016−0.0298−0.0917
20120.05620.13800.01310.03770.00820.0208−0.0233−0.0718
20130.07260.17890.01910.05590.09980.22570.05960.1507
20140.08080.20440.03850.10320.08250.19670.00110.0034
20150.02160.06380.06050.15740.12150.2767−0.0101−0.0316
20160.01150.03590.06740.17110.09640.2281−0.0158−0.0505
20170.00820.02650.08400.20950.01140.0330−0.0105−0.0333
20180.02120.06650.05500.14900.01800.05410.00100.0033
20190.02090.06630.02710.08100.01500.0459−0.0159−0.0531
20200.01580.05130.00830.02650.01530.0489−0.0098−0.0326
20210.02320.07480.01000.03180.01620.0512−0.0102−0.0343
20220.01070.03630.00600.01920.01190.0384−0.0104−0.0349

References

  1. Qi, X.Y.; Han, Y. The impact of technological innovation for emission reduction on decision-making for intertemporal carbon trading. Comput. Ind. Eng. 2023, 186, 109739. [Google Scholar] [CrossRef] [Scilit]
  2. The Central Committee of the Communist Party of China. Communique of the Fourth Plenary Session of the 20th Central Committee of the Communist Party of China [Official Communiqué]. 23 October 2025. Available online: https://www.gov.cn/yaowen/liebiao/202510/content_7045444.htm (accessed on 8 March 2026).
  3. The State Council of the People’s Republic of China. Approval of the State Council on the Territorial and Spatial Planning of Fujian Province (2021–2035) (Guohan [2023] No. 131) [Electronic Government Document]. 19 November 2023. Central People’s Government of the People’s Republic of China. Available online: https://www.gov.cn/zhengce/zhengceku/202311/content_6917492.htm (accessed on 8 March 2026).
  4. Wang, J.; Guo, D. Siphon and radiation effects of ICT agglomeration on green total factor productivity: Evidence from a spatial Durbin model. Energy Econ. 2023, 126, 106953. [Google Scholar] [CrossRef] [Scilit]
  5. Ren, Y.; Liu, K. Green siphon or green spillover: Analyzing the spatial implications of industrial relocation on green development. Energy Strategy Rev. 2024, 55, 101536. [Google Scholar] [CrossRef] [Scilit]
  6. Qiu, Y.; Gao, C.; Song, N. Trickle-down or siphon: The spillover effects of the digital economy on green innovation from the perspective of the circular economy. Socio-Econ. Plan. Sci. 2025, 102, 102328. [Google Scholar] [CrossRef] [Scilit]
  7. Liu, L.; An, S. Spillover across borders: Industrial robotics applications in developed countries and deindustrialization in developing countries. Technol. Forecast. Soc. Change 2026, 223, 124424. [Google Scholar] [CrossRef] [Scilit]
  8. Fan, X.; Ding, G.; Long, S.; Dong, Y.; Yan, J. Digital divide or dividend? Exploring the impact of digital economy on regional gaps of high-quality economic development in China using relational data model. Int. Rev. Econ. Financ. 2025, 101, 104222. [Google Scholar] [CrossRef] [Scilit]
  9. Parente, R.; Rong, K.; Shi, X.; Kang, Z.; Zhou, D. How do platform multinational corporations address emerging challenges in the global landscape? A ‘READ’ framework. Long Range Plan. 2024, 57, 102455. [Google Scholar] [CrossRef] [Scilit]
  10. Lyu, Y.; Wang, W.; Wu, Y.; Zhang, J. How does digital economy affect green total factor productivity? Evidence from China. Sci. Total Environ. 2023, 857, 159428. [Google Scholar] [CrossRef] [Scilit] [PubMed]
  11. Chen, C.; Ye, A. Heterogeneous effects of ICT across multiple economic development in Chinese cities: A spatial quantile regression model. Sustainability 2021, 13, 954. [Google Scholar] [CrossRef] [Scilit]
  12. Vlasov, M.; Polbitsyn, S.N.; Olumekor, M.; Oke, A. The influence of socio-cultural factors on knowledge-based innovation and the digital economy. J. Open Innov. Technol. Mark. Complex. 2022, 8, 194. [Google Scholar] [CrossRef] [Scilit]
  13. Tong, T.; Hu, K.; Chen, Z.; Liu, Q. How do data transactions promote economic growth? Evidence from China. J. Digit. Econ. 2025, 4, 351–365. [Google Scholar] [CrossRef] [Scilit]
  14. Abir, S.I.; Sarwer, M.; Hasan, M.; Sultana, N.; Dolon, M.S.A.; Arefeen, S.S.; Shimanto, A.H.; Zakaria, R.M.; Shiam, S.A.A.; Saha, T. Accelerating BRICS economic growth: AI-driven data analytics for informed policy and decision making. J. Econ. Financ. Account. Stud. 2024, 6, 102–115. [Google Scholar] [CrossRef] [Scilit]
  15. Tapscott, D. The Digital Economy: Promise and Peril in the Age of Networked Intelligence; McGraw-Hill: New York, NY, USA, 1995. [Google Scholar]
  16. Nathan, M.; Rosso, A. Mapping digital businesses with big data: Some early findings from the UK. Res. Policy 2015, 44, 1714–1733. [Google Scholar] [CrossRef] [Scilit]
  17. Sutherland, E. Trends in regulating the global digital economy. In Proceedings of the 4th Annual Competition and Economic Regulation Conference, Johannesburg, South Africa, 19–20 July 2018; pp. 16–20. [Google Scholar]
  18. Tranos, E.; Reggiani, A.; Nijkamp, P. Accessibility of cities in the digital economy. Cities 2013, 30, 59–67. [Google Scholar] [CrossRef] [Scilit]
  19. Trașcă, D.L.; Ștefan, G.M.; Sahlian, D.N.; Hoinaru, R.; Șerban-Oprescu, G.L. Digitalization and business activity. The struggle to catch up in CEE countries. Sustainability 2019, 11, 2204. [Google Scholar] [CrossRef] [Scilit]
  20. Cirillo, V.; Evangelista, R.; Guarascio, D.; Sostero, M. Digitalization, routineness and employment: An exploration on Italian task-based data. Res. Policy 2021, 50, 104079. [Google Scholar] [CrossRef] [Scilit]
  21. Chen, W.; Zhang, L.; Jiang, P.; Meng, F.; Sun, Q. Can digital transformation improve the information environment of the capital market? Evidence from the analysts’ prediction behaviour. Account. Financ. 2022, 62, 2543–2578. [Google Scholar] [CrossRef] [Scilit]
  22. Wang, X.; Sun, X.; Zhang, H.; Xue, C. Digital economy development and urban green innovation capability: Based on panel data of 274 prefecture-level cities in China. Sustainability 2022, 14, 2921. [Google Scholar] [CrossRef] [Scilit]
  23. Yue, X.; Shi, Q. Digital Economy, Innovation Capability, and New Quality Productivity. Financ. Res. Lett. 2025, 88, 109112. [Google Scholar] [CrossRef] [Scilit]
  24. Sun, Y.; Chen, C. Digital rural construction, financial development and regional economic resilience: Mechanism analysis and empirical test. Int. Rev. Econ. Financ. 2025, 101, 104146. [Google Scholar] [CrossRef] [Scilit]
  25. Sareen, S.; Haarstad, H. Digitalization as a driver of transformative environmental innovation. Environ. Innov. Soc. Transit. 2021, 41, 93–95. [Google Scholar] [CrossRef] [Scilit]
  26. Liu, Y.; Yang, Y.; Li, H.; Zhong, K. Digital economy development, industrial structure upgrading and green total factor productivity: Empirical evidence from China’s cities. Int. J. Environ. Res. Public Health 2022, 19, 2414. [Google Scholar] [CrossRef] [Scilit] [PubMed]
  27. Ma, Y. Entrepreneurs’ spirit and corporate green development: The mediating role of new-quality productivity. Sustainability 2024, 16, 7648. [Google Scholar] [CrossRef] [Scilit]
  28. Chen, Z.; Xing, R. Digital economy, green innovation and high-quality economic development. Int. Rev. Econ. Financ. 2025, 99, 104029. [Google Scholar] [CrossRef] [Scilit]
  29. Madureira, A.; den Hartog, F.; Bouwman, H.; Baken, N. Empirical validation of Metcalfe’s law: How Internet usage patterns have changed over time. Inf. Econ. Policy 2013, 25, 246–256. [Google Scholar] [CrossRef] [Scilit]
  30. Van Hove, L. Testing Metcalfe’s law: Pitfalls and possibilities. Inf. Econ. Policy 2016, 37, 67–76. [Google Scholar] [CrossRef] [Scilit]
  31. Zhang, X.; Ji, C.E.; Zhang, H.; Wei, Y.; Jin, J. On the role of the digital industry in reshaping urban economic structure: The case of Hangzhou, China. J. Econ. Anal. 2023, 2, 123–139. [Google Scholar] [CrossRef] [Scilit]
  32. Xin, C.; Fan, S.; Mbanyele, W.; Shahbaz, M. Towards inclusive green growth: Does digital economy matter? Environ. Sci. Pollut. Res. 2023, 30, 70348–70370. [Google Scholar] [CrossRef] [Scilit] [PubMed]
  33. Martinez, M.M.; Mlachila, M.M. The Quality of the Recent High-Growth Episode in Sub-Saharan Africa; International Monetary Fund: Washington, DC, USA, 2013. [Google Scholar]
  34. Mlachila, M.; Tapsoba, R.; Tapsoba, S.J. A quality of growth index for developing countries: A proposal. Soc. Indic. Res. 2017, 134, 675–710. [Google Scholar] [CrossRef] [Scilit]
  35. Solow, R.M. A contribution to the theory of economic growth. Q. J. Econ. 1956, 70, 65–94. [Google Scholar] [CrossRef] [Scilit]
  36. Zhang, C.Z.; Kong, J. Effect of equity in education on the quality of economic growth: Evidence from China. Int. J. Hum. Sci. 2010, 7, 47–69. [Google Scholar]
  37. Mei, L.; Chen, Z. The convergence analysis of regional growth differences in China: The perspective of the quality of economic growth. J. Serv. Sci. Manag. 2016, 9, 453–476. [Google Scholar] [CrossRef]
  38. Liu, W.B.; Zhang, D.Q.; Meng, W.; Li, X.X.; Xu, F. A study of DEA models without explicit inputs. Omega 2011, 39, 472–480. [Google Scholar] [CrossRef] [Scilit]
  39. Frolov, S.M.; Kremen, O.I.; Ohol, D.O. Scientific methodical approaches to evaluating the quality of economic growth. Actual Probl. Econ. 2015, 173, 393. [Google Scholar]
  40. Zheng, H.; He, Y. How does industrial co-agglomeration affect high-quality economic development? Evidence from Chengdu-Chongqing Economic Circle in China. J. Clean. Prod. 2022, 371, 133485. [Google Scholar] [CrossRef] [Scilit]
  41. Kayalvizhi, P.N.; Thenmozhi, M.J.E.M.R. Does quality of innovation, culture and governance drive FDI?: Evidence from emerging markets. Emerg. Mark. Rev. 2018, 34, 175–191. [Google Scholar] [CrossRef] [Scilit]
  42. Spranz, R.; Lenger, A.; Goldschmidt, N. The relation between institutional and cultural factors in economic development: The case of Indonesia. J. Inst. Econ. 2012, 8, 459–488. [Google Scholar] [CrossRef] [Scilit]
  43. Zhou, B.; Zeng, X.; Jiang, L.; Xue, B. High-quality economic growth under the influence of technological innovation preference in China: A numerical simulation from the government financial perspective. Struct. Change Econ. Dyn. 2020, 54, 163–172. [Google Scholar] [CrossRef] [Scilit]
  44. Gunby, P.; Jin, Y.; Reed, W.R. Did FDI really cause Chinese economic growth? A meta-analysis. World Dev. 2017, 90, 242–255. [Google Scholar] [CrossRef] [Scilit]
  45. Andreoni, A.; Chang, H.J. Industrial policy and the future of manufacturing. Econ. Politica Ind. 2016, 43, 491–502. [Google Scholar] [CrossRef] [Scilit]
  46. Yang, Z.; Zhan, J.; Wang, C.; Liu, W.; Wang, H.; Bai, C. Spatial spillover effects of conversion of new and old driving forces on high-quality development: Evidence from 283 cities in China. Sustain. Cities Soc. 2024, 108, 105487. [Google Scholar] [CrossRef] [Scilit]
  47. Lu, J.; Zhang, S.; He, B. Driving the high-quality development of the marine economy: A mechanism-effect-space integrated framework of new-quality productive forces. Reg. Stud. Mar. Sci. 2025, 92, 104586. [Google Scholar] [CrossRef] [Scilit]
  48. Pan, W.; Xie, T.; Wang, Z.; Ma, L. Digital economy: An innovation driver for total factor productivity. J. Bus. Res. 2022, 139, 303–311. [Google Scholar] [CrossRef] [Scilit]
  49. Cheng, Y.; Zhou, X.; Li, Y. The effect of digital transformation on real economy enterprises’ total factor productivity. Int. Rev. Econ. Financ. 2023, 85, 488–501. [Google Scholar] [CrossRef] [Scilit]
  50. Ma, D.; Zhu, Q. Innovation in emerging economies: Research on the digital economy driving high-quality green development. J. Bus. Res. 2022, 145, 801–813. [Google Scholar] [CrossRef] [Scilit]
  51. Ren, S.; Hao, Y.; Xu, L.; Wu, H.; Ba, N. Digitalization and energy: How does internet development affect China’s energy consumption? Energy Econ. 2021, 98, 105220. [Google Scholar] [CrossRef] [Scilit]
  52. Xue, Y.; Tang, C.; Wu, H.; Liu, J.; Hao, Y. The emerging driving force of energy consumption in China: Does digital economy development matter? Energy Policy 2022, 165, 112997. [Google Scholar] [CrossRef] [Scilit]
  53. Yang, Z.; Ye, L. Digital economy and energy intensity: The light and dark side. Rev. Econ. Assess. 2024, 3, 70–92. [Google Scholar] [CrossRef] [Scilit]
  54. Huang, C.; Lin, B. The impact of digital economy on energy rebound effect in China: A stochastic energy demand frontier approach. Energy Policy 2025, 196, 114023. [Google Scholar] [CrossRef] [Scilit]
  55. Peng, H.R.; Qin, X.F. Digitalization as a trigger for a rebound effect of electricity use: Evidence from China. Energy 2024, 300, 131586. [Google Scholar] [CrossRef] [Scilit]
  56. Lange, S.; Pohl, J.; Santarius, T. Digitalization and energy consumption. Does ICT reduce energy demand? Ecol. Econ. 2020, 176, 106760. [Google Scholar] [CrossRef] [Scilit]
  57. Yang, G.; Deng, F.; Wang, Y.; Xiang, X. Digital Paradox: Platform Economy and High-Quality Economic Development—New Evidence from Provincial Panel Data in China. Sustainability 2022, 14, 2225. [Google Scholar] [CrossRef] [Scilit]
  58. Jia, K.; Li, L. The moderate level of digital transformation: From the perspective of green total factor productivity. Math. Biosci. Eng. 2024, 21, 2254–2281. [Google Scholar] [CrossRef] [Scilit]
  59. Zhang, Z.; Chen, L.; Li, J.; Ding, S. Digital economy development and carbon emission intensity—Mechanisms and evidence from 72 countries. Sci. Rep. 2024, 14, 28459. [Google Scholar] [CrossRef] [Scilit]
  60. Bai, L.; Guo, T.; Xu, W.; Liu, Y.; Kuang, M.; Jiang, L. Effects of digital economy on carbon emission intensity in Chinese cities: A life-cycle theory and the application of non-linear spatial panel smooth transition threshold model. Energy Policy 2023, 183, 113792. [Google Scholar] [CrossRef] [Scilit]
  61. Cheng, S.; Qu, G. Research on the effect of digital economy on carbon emissions under the background of “Double Carbon”. Int. J. Environ. Res. Public Health 2023, 20, 4931. [Google Scholar] [CrossRef] [Scilit]
  62. Ruan, J.; Zou, L.; Liu, R.; Pan, H. The impact of digital economy development on regional income gaps: A perspective on multidimensional inequality decomposition and threshold effects. Mathematics 2024, 12, 4024. [Google Scholar] [CrossRef] [Scilit]
  63. Cai, B.; Li, P.; Shi, J.; Huang, X. Digital Innovation and Regional Income Disparities in China: Impact, Mechanism, and Empirical Evidence. Sustainability 2026, 18, 2971. [Google Scholar] [CrossRef] [Scilit]
  64. Zhou, M.; Shao, W.; Huang, L. From digital island to resilient networks: The impact of digital economy agglomeration on urban resilience in China. Humanit. Soc. Sci. Commun. 2025, 12, 1610. [Google Scholar] [CrossRef] [Scilit]
  65. Myrdal, G.; Sitohang, P. Economic Theory and Under-Developed Regions; Harper & Row: Manhattan, NY, USA, 1957. [Google Scholar]
  66. Zhang, H.; Zhang, K.; Yan, T.; Cao, X. The impact of digital infrastructure on regional green innovation efficiency through industrial agglomeration and diversification. Humanit. Soc. Sci. Commun. 2025, 12, 220. [Google Scholar] [CrossRef] [Scilit]
  67. Bloom, N.; Garicano, L.; Sadun, R.; Van Reenen, J. The distinct effects of information technology and communication technology on firm organization. Manag. Sci. 2014, 60, 2859–2885. [Google Scholar] [CrossRef] [Scilit]
  68. Piketty, T. Capital in the Twenty-First Century; Harvard University Press: Cambridge, MA, USA, 2014. [Google Scholar]
  69. Heckscher, E.F.; Ohlin, B. Heckscher-Ohlin Trade Theory; Flam, H., Flanders, M.J., Eds.; The MIT Press: Cambridge, MA, USA, 1991; Available online: https://mitpress.mit.edu/9780262082013/heckscher-ohlin-trade-theory/ (accessed on 8 March 2026).
  70. Zhang, Y.; Xing, M. Digital Innovation Networks for Regional Sustainability: An Analysis of Evolutionary Characteristics and Driving Mechanisms in China. Sustainability 2025, 17, 10835. [Google Scholar] [CrossRef] [Scilit]
  71. Rogers, E.M. Diffusion of Innovations; Free Press: New York, NY, USA, 1995. [Google Scholar]
  72. Samuelson, P.A. International trade and the equalisation of factor prices. Econ. J. 1948, 58, 163–184. [Google Scholar] [CrossRef] [Scilit]
  73. Wang, R.; Ding, C.; Yao, D. Matthew or diffusion effect: Impact of digital finance on the green innovation gap? Pol. J. Environ. Stud. 2025, 34, 7437–7455. [Google Scholar] [CrossRef] [Scilit]
  74. Dagum, C. A new approach to the decomposition of the Gini income inequality ratio. Empir. Econ. 1997, 22, 515–531. [Google Scholar] [CrossRef] [Scilit]
  75. Abadie, A.; Diamond, A.; Hainmueller, J. Synthetic control methods for comparative case studies: Estimating the effect of California’s tobacco control program. J. Am. Stat. Assoc. 2010, 105, 493–505. [Google Scholar] [CrossRef] [Scilit]
  76. Abadie, A.; Gardeazabal, J. The economic costs of conflict: A case study of the Basque Country. Am. Econ. Rev. 2003, 93, 113–132. [Google Scholar] [CrossRef] [Scilit]
  77. Qi, X.; Han, Y.; Kou, P. Population urbanization, trade openness and carbon emissions: An empirical analysis based on China. Air Qual. Atmos. Health 2020, 13, 519–528. [Google Scholar] [CrossRef] [Scilit]
  78. Fan, D.; Ke, H.; Cao, R. Modification and Improvement of Coupling Coordination Degree Model. Stat. Decis. 2024, 40, 41–46. [Google Scholar]
  79. Fang, C.D.; Cheng, J.H.; Zhao, P.D. Temporal and spatial evolution of mineral-economic-environment coordination degree in the Yangtze River Economic Belt under the great protection strategy. China Popul. Resour. Environ. 2019, 29, 65–73. [Google Scholar]
Figure 1. Research Framework.
Sustainability 18 05237 g001
Figure 2. Trend of dimensional development indexes in Guangdong.
Sustainability 18 05237 g002
Figure 3. Trend of dimensional development indexes in Fujian.
Sustainability 18 05237 g003
Figure 4. Trend of dimensional development indexes in Zhejiang.
Sustainability 18 05237 g004
Figure 5. Grades of the Evolution Trend for Coupling Coordination Degree of High-Quality Development in the GFZ-CUA.
Sustainability 18 05237 g005
Figure 6. Evolution trend of coupling coordination degree of high-quality development level by province in different periods.
Sustainability 18 05237 g006
Figure 7. Trends in the Intra-regional Gini Coefficient of Coupling Coordination for High-quality Development in the GFZ-CUA.
Sustainability 18 05237 g007
Figure 8. Trends in the Inter-regional Gini Coefficient of Coupling Coordination for High-quality Development in the GFZ-CUA.
Sustainability 18 05237 g008
Figure 9. Trend of σ Convergence Index for Coupling Coordination in High-Quality Development of GFZ-CUA.
Sustainability 18 05237 g009
Figure 10. Policy effect on the Coupling Coordination Degree of High-quality Development. Note: Solid lines represent actual indicator levels, while dashed lines show composite levels.
Sustainability 18 05237 g010
Figure 11. The pathway of siphon effect.
Sustainability 18 05237 g011
Figure 12. The placebo test. Note: All solid lines represent pilots, while gray lines stand for control areas.
Sustainability 18 05237 g012
Figure 13. Mechanism of the moderated mediating effect model.
Sustainability 18 05237 g013
Table 1. Construction of High-quality Development Index System for GFZ-CUA.
DimensionTarget LayerIndex LevelAttributeVariableWeight
InnovationInnovation investmentInternal R&D expenditure/Regional GDP+X10.0049
Average annual number of R & D personnel+X20.0076
Innovation outputNumber of patent grants per annual population +X30.0061
Carbon emissions/Energy consumptionX40.0097
Innovative environment(Science expenditure + Education expenditure)/Local fiscal expenditure+X50.0109
Number of teachers per student in higher education institutions+X60.0046
CoordinationIndustrial coordinationValue added of tertiary industry/Value added of secondary industry+X70.0267
Theil indexX80.0341
Coordination between urban and rural areasUrban per capita disposable income/Rural per capita disposable incomeX90.0084
Urban construction land/Urban area+X100.0118
Urbanization rate+X110.0309
Regional coordinationRegional per capita GDP/Provincial per capita GDP+X120.0088
Registered urban unemployment rateX130.0078
GreennessEnvironmental pollutionIndustrial waste gas emissions/Total output value of industrial enterprises above designated sizeX140.0061
Industrial wastewater discharge per unit of regional GDPX150.0051
Industrial SO2 emissions per unit of regional GDPX160.0081
Industrial solid waste (soot and dust) emissions per unit of regional GDPX170.0039
Annual average concentration of inhalable fine particulate matterX180.0088
Comprehensive ecological improvementDomestic sewage treatment rate+X190.0013
Rate of harmless disposal of domestic waste+X200.3840
Comprehensive utilization rate of industrial solid waste+X210.0079
Per capita green space area+X220.0306
Green coverage rate of built-up area+X230.0707
Carbonation indexCarbon emission/GDPX240.0139
Carbon emissions per capitaX250.0353
Carbon reduction indexGreen finance index+X260.0388
Total number of granted green patents+X270.0078
Intensity of talent introduction+X280.0134
OpennessDependence on foreign tradeTotal value of imports and exports/Regional GDP+X290.0092
Actual utilized foreign capital/Regional GDP+X300.0070
Dependence on domestic tradeTotal retail sales of consumer goods/regional GDP+X310.0194
SharingEducational resourceNumber of higher education institutions/Regional population+X320.0217
Expenditure on education/Expenditure on local finance+X330.0110
Medical resourceNumber of doctors/Number of regional population+X340.0259
Number of hospital beds/Number of regional population+X350.0211
InfrastructureNumber of public libraries/Number of regional population+X360.0438
Road area per capita+X370.0181
Internet penetration rate+X380.0049
Mobile phone user share+X390.0099
Note: “+” indicates a positive indicator, and “−” indicates a negative indicator. R&D is the abbreviation for Research and Development. SO2 is the abbreviation for Sulfur Dioxide. GDP is the abbreviation for Gross Domestic Product.
Table 2. Gini Coefficient and Contribution Rates of Coupling Coordination for High-Quality Development in the GFZ-CUA, 2003–2022.
YearGGwGnbGz
GuangdongZhejiangFujianGuangdong-ZhejiangGuangdong-FujianZhejiang-FujianWithinBetweenTransvariation Density
20030.15950.10160.10260.13520.20430.20730.12830.31370.46080.2255
20040.16000.15210.09860.14420.18890.19210.13240.35850.34580.2957
20050.15740.15810.09970.13880.19460.18720.13000.35920.35340.2875
20060.15930.1680.09820.14220.20400.18010.13890.37100.31550.3134
20070.13890.14840.13290.12300.16350.14720.13830.38050.17780.4416
20080.13490.16000.12220.10150.16020.16150.13410.34820.15300.4988
20090.13200.15570.13000.10550.16570.14450.13140.36050.15230.4872
20100.12400.15020.10580.09210.16630.14830.10860.33990.34510.3150
20110.12130.15550.12950.08080.16850.13910.12030.32730.25090.4218
20120.07110.07280.05240.05080.10470.09170.05830.31480.47420.2110
20130.08780.08160.03650.03450.17050.14760.04160.20080.75930.0399
20140.08020.07360.03270.04150.14640.12640.04420.23660.70130.0621
20150.08490.10920.03080.04200.14860.13230.04360.25590.67530.0688
20160.07940.10460.02740.04180.13820.12050.04370.26700.64760.0854
20170.06790.08010.02950.04730.10490.09310.04620.31080.56850.1207
20180.05660.05430.02780.03950.09300.07850.03880.29670.61120.0920
20190.05270.04160.04530.04210.06910.06660.04630.32790.44960.2225
20200.04830.02480.04160.04260.06190.05870.04480.33540.47110.1935
20210.05070.02770.04230.04410.06580.06200.04670.33300.47680.1902
20220.04480.02960.03560.04480.04630.04990.04320.38180.34130.2769
Notes: G denotes the overall Gini coefficient; Gw represents the intra-regional Gini coefficient; Gnb refers to the inter-regional Gini coefficient; and Gz indicates the contribution rate.
Table 3. Convergence Test of Coupling Coordination Degree of High-quality Development of GFZ-CUA.
Variableβ Absolute Convergenceβ Conditional ConvergenceSpatial β Absolute ConvergenceSpatial β Conditional Convergence
β−0.145 ***−0.862 ***−0.176 ***−0.870 ***
ρ −0.299−4.164 **
θ 2.252 ***−4.646 ***
X01 −2.083 *** −1.913 ***
X02 0.521 *** 0.562 ***
X03 0.357 *** 0.360 ***
X04 −0.475 * −0.357
X05 0.705 *** 0.692 ***
Constant0.0449 ***0.199 ***
R20.0890.8310.0180.532
Note: *, ** and *** indicate significance at the 10%, 5%, and 1% levels, respectively.
Table 4. Evaluation of Policy Effects in Big Data Comprehensive Pilots.
VariableReal ShantouSynthetic ShantouReal MeizhouSynthetic MeizhouReal ChaozhouSynthetic ChaozhouReal JieyangSynthetic Jieyang
y (2004(1)2015)0.36050.34640.35950.35400.46480.42280.39250.3923
Innovative0.03220.03360.03380.03330.03370.03340.03390.0339
Coordinated0.07700.07240.08010.0779 0.08620.07510.08110.0739
Green0.18600.17540.19330.17520.46980.35670.29740.2867
Open0.01850.02350.02640.02750.02810.03000.02450.0296
Shared0.13160.10710.13050.12330.13840.09330.10840.1002
y (2004)0.38140.37680.48220.40890.48870.46240.48150.4569
y (2007)0.3536 0.36090.35020.35280.48430.46500.41880.4260
y (2011)0.32080.32570.31730.33750.47600.42760.32560.3555
y (2015)0.33900.31730.38430.32380.43910.31760.32070.3308
Table 5. Estimation of Moderated Mediation Effect.
VariablesModel 1Model 2Model 3
m1ym2ym3y
mi −0.0684 *** −0.00127 *** −0.00779 ***
x0.108 ***−0.02917.475 ***−0.00439−0.883 ***0.0969 ***
mix 0.0344 0.000468 −0.0222 ***
Constant0.857 ***0.408 ***15.35 ***0.369 ***5.700 ***0.394 ***
Observations320320320320320320
Note: *** indicate significance at the 1% levels.
Table 6. Conditional Indirect Effect.
Degree of AdjustmentModel 1Model 2Model 3
CoefficientConfidence IntervalsCoefficientConfidence IntervalsCoefficientConfidence Intervals
Low−0.00807 ***[−0.013398, −0.0027401]−0.0101 **[−0.0197121, −0.0005853]0.00328 *[−0.0002702, 0.0068211]
Medium−0.00646 ***[−0.0111634, −0.0017486]−0.00863 **[−0.0161236, −0.0011407]0.0118 ***[0.0060455, 0.0175232]
High−0.00484 **[−0.0095894, −0.0000965]−0.00712 **[−0.0127784, −0.0014528]0.0203 ***[0.0106797, 0.0299068]
Note: *, ** and *** indicate significance at the 10%, 5%, and 1% levels, respectively.
Disclaimer/Publisher’s Note: The statements, opinions and data contained in all publications are solely those of the individual author(s) and contributor(s) and not of MDPI and/or the editor(s). MDPI and/or the editor(s) disclaim responsibility for any injury to people or property resulting from any ideas, methods, instructions or products referred to in the content.