Article

Research on Green Supply Chain Investment Strategies Considering Multi-Dimensional Consumer Preferences and Distrust Under Government Intervention

College of Economics and Management, Tianjin University of Science and Technology, Tianjin 300222, China
*
Author to whom correspondence should be addressed.
Sustainability 2026, 18(11), 5236; https://doi.org/10.3390/su18115236
Submission received: 16 April 2026 / Revised: 8 May 2026 / Accepted: 13 May 2026 / Published: 22 May 2026
(This article belongs to the Section Economic and Business Aspects of Sustainability)

Abstract

To address the “greenwashing” trust crisis induced by information asymmetry in sustainable supply chains, this study develops a comprehensive game-theoretic model integrating Stackelberg and evolutionary game theories (EGT). We quantitatively investigate the dynamic interactions among multi-dimensional consumer preferences, blockchain implementation costs, and boundedly rational government interventions. Our analysis yields three core contributions. First, we analytically reveal the “double-edged sword effect” of blockchain adoption. While structural transparency unlocks a trust dividend, exorbitant technological costs trigger a “budget crowding-out effect.” Quantitative results demonstrate that breaching the absolute Feasibility Threshold completely cannibalizes the environmental budget, driving substantive green investments strictly to zero. Second, EGT analysis proves that isolated punitive carbon taxes trap supply chains in a suboptimal “shallow greening” equilibrium. A composite tax-subsidy policy is structurally required to expand the feasible cost space and hedge against technological risks. Finally, we formulate a dynamic policy exit mechanism. As blockchain infrastructure matures and the endogenous green premium effectively offsets implementation costs, regulators must systematically phase out subsidies and converge toward a single-taxation regime to prevent corporate policy arbitrage and alleviate long-term public financial burdens.

1. Introduction

Prompted by swift global economic expansion, the environmental challenges linked to industrialization have gained increasing prominence, attracting extensive focus on the low-carbon and sustainable development of enterprises. Recent macro-strategic policies strongly promote green consumption and the shift toward low-carbon production and lifestyles. As living standards and consumer awareness grow, environmental consciousness keeps increasing; surveys show that more than half of consumers are ready to pay extra for eco-friendly products [1]. Manufacturers within supply chains are driven to adopt green technological innovations due to the dual pressures from governments and markets. However, this shift requires increased R&D investment and higher production costs, which often reduce manufacturers’ natural motivation to innovate. Therefore, motivating companies to embrace green technological innovation has become a key priority in the corporate green transition [2].
However, significant information gaps and manufacturer “greenwashing” continue to exist in the market for green products. While consumers are becoming more environmentally conscious, they frequently find it difficult to tell authentic green products from ordinary ones, which results in a sharp drop in trust in the sustainability claims of products [3]. Recent empirical reports rigorously quantify this trust deficit. According to a comprehensive screening by the European Commission, authorities found that in 42% of cases, online environmental claims were exaggerated, false, or deceptive, and in 59% of cases, traders failed to provide easily accessible evidence to support their claims [4]. Furthermore, academic empirical models confirm that widespread market opportunism generates profound consumer skepticism toward corporate environmental claims, significantly increasing the cognitive cost of verification [5]. This skepticism is equally pronounced in emerging markets; research highlights a structural lack of trust in domestic eco-labels among consumers in developing economies such as Malaysia and China [6]. Enterprises often spread misleading environmental claims to maximize profits. Notable examples include H&M’s deceptive “Conscious” collection, where independent investigations revealed that up to 96% of its sustainability claims flouted regulatory guidelines, with some “eco-friendly” garments containing 72% synthetic fibers—a higher proportion than its conventional lines [7]. Similarly, Coca-Cola faced intense backlash for promoting “100% recycled plastic” initiatives while simultaneously generating approximately 3 million metric tons of new plastic packaging annually, rendering the green claims statistically marginal [8].
To address these challenges and enhance consumer confidence, many enterprises have implemented blockchain technology to trace and monitor product flows. For example, JD.com launched its “ZhiZhen Chain” anti-counterfeiting and traceability platform to combat skepticism in eco-sensitive supply chains. According to empirical data jointly released by JD Digits and the China Europe International Business School (CEIBS), the implementation of blockchain in high-trust-dependent sectors yielded concrete market gains: the return rate for infant formula dropped dramatically by 31.7%, and the repurchase rate for nutritional health products surged by 44.6% [9]. These empirical observations demonstrate that blockchain can mathematically mitigate information asymmetry, effectively translating restored consumer trust into tangible market competitiveness [10].
Furthermore, beyond the consumer market, blockchain automates and simplifies carbon footprint tracking, boosting operational efficiency for supply chain members. Crucially, this high-fidelity traceability allows governments to fully track the entire product lifecycle [11], effectively fighting corporate greenwashing at the regulatory level. It provides a reliable, data-driven basis for governments to intervene and support corporate green transitions through precise policy instruments, primarily imposing carbon taxes and offering targeted green subsidies.
Therefore, to capture these dual dynamics—the demand-side “trust dividend” and the supply-side regulatory compliance—this study incorporates blockchain technology into a green supply chain framework, emphasizing its key features of immutability, decentralization, and trust-building [12]. Considering consumers’ multi-dimensional preferences and distrust under government intervention, we address the following three research questions:
(i)
Can the adoption of blockchain technology incentivize green product manufacturers to allocate more effort toward green production?
(ii)
Under different combinations of government intervention policies, which mechanism is optimal for encouraging manufacturers to adopt blockchain technology for green production?
(iii)
What are the evolutionary stable strategies (ESS) for the two heterogeneous populations: the government and the green supply chain?
Distinct from recent prominent studies that address multi-dimensional consumer distrust strictly within the context of circular closed-loop supply chains [13] or focus on internal fairness concerns under static emission taxes [14], this paper makes unique theoretical contributions in three fundamental dimensions. First, we shift the analytical lens to the forward green supply chain to quantitatively examine the resolution of information asymmetry through blockchain. Drawing on recent insights into how blockchain structurally alleviates information asymmetry [15], we explicitly formulate a novel three-dimensional demand function encompassing consumer green sensitivity, green trust level, and price sensitivity. This structure accurately captures the exact market-breaking points and cost thresholds triggered by information asymmetry, mathematically demonstrating the operational boundaries of shifting from fragile exogenous trust to blockchain-enabled structural transparency. Second, rather than treating blockchain as a strictly positive technological enabler, we mathematically characterize its “budget crowding-out effect.” We analytically identify the strict operational boundaries—specifically the Empowerment and Feasibility Thresholds—where exorbitant implementation costs paradoxically cannibalize substantive green production budgets. Third, moving beyond static policy evaluations, we employ evolutionary game theory (EGT) to endogenize the boundedly rational government, designing a dynamic, composite tax-subsidy governance mechanism capable of mitigating this crowding-out risk and preventing long-term policy arbitrage.
By creating a comprehensive sustainable supply chain model that structurally integrates these elements, this study elucidates how multi-dimensional consumer behaviors and dynamic government interventions jointly dictate the feasibility of blockchain-enabled green production. The remainder of this paper is organized as follows: Section 2 reviews the relevant literature. Section 3 formulates the Stackelberg game models under two operational scenarios and derives the corresponding equilibrium results. Section 4 presents numerical simulations across different parameter combinations to analyze their impacts on optimal decisions. Section 5 investigates the government’s and the supply chain’s long-term strategic choices using an evolutionary game model. Finally, Section 6 and Section 7 concludes the study and provides managerial insights.

2. Literature Review

This study primarily intersects with four streams of literature(see Table 1). These include the application of blockchain technology in supply chain management, green supply chains, government intervention policies, and supply chain digital Integration and resilience.

2.1. The Application of Blockchain Technology

Blockchain technology inherently enhances supply chain transparency, reduces transaction costs, and bolsters consumer confidence. Facilitating information sharing among multiple agents enables more efficient and transparent transactions, thereby generating profound positive impacts on supply chain management.
However, it is imperative to view blockchain adoption through a critical lens. While it acts as a powerful catalyst for trust recovery, its implementation is not a cost-free panacea. The high initial setup investments, operational complexity, and continuous maintenance of decentralized nodes can impose severe financial burdens on supply chain members. Consequently, a critical balance must be maintained; without strategic alignment, the pursuit of absolute information transparency may inadvertently drain the resources needed for core manufacturing processes. For instance, Naoum et al. [16] analytically investigated the strategic adoption of blockchain technology to deter deceptive counterfeits, highlighting the economic trade-offs between traceability investments and product quality differentiation. In the context of luxury supply chains, Choi et al. [17] developed a utility-driven game model to explore the strategic value of blockchain-supported authentication platforms, focusing on the trade-off between consumer shopping convenience and blockchain authentication benefits across different sales channels.
Recent literature has increasingly integrated blockchain into classical supply chain management and pricing frameworks. Fang et al. [18] highlighted that the critical determinant in both wholesale and reselling modes is the allocation of blockchain implementation costs. Pun et al. [19] examined the decision to adopt blockchain to combat counterfeiting in secondary markets. Considering consumer preferences, risk attitudes, and testing costs, Cao et al. [10] endogenized the level of blockchain utilization to investigate its application mechanism in semiconductor supply chains. Similarly, Awasthy et al. [20] proposed a bilateral supply chain comprising a buyer and a supplier and analyzed optimal blockchain utilization levels and pricing decisions. Incorporating retailer risk aversion, Liu et al. [21] explored blockchain investment decisions in fresh agricultural supply chains, designing revenue-sharing and buyback-compensation contracts to achieve supply chain coordination.
In the realm of sustainable operations, addressing consumers’ distrust regarding low-carbon information, Babich et al. [22] noted that blockchain enables the precise tracking and recording of carbon footprints, thereby strengthening consumers’ purchasing confidence. Xu et al. [23] studied the impact of cap-and-trade policies on a supply chain consisting of a manufacturer and an e-commerce platform. They concluded that under specific conditions, blockchain adoption yields higher profits for manufacturers and facilitates coordination among supply chain members. Focusing on stochastic dynamic characteristics, Wang et al. [2] investigated the effects of a manufacturer’s emission reduction motivation, consumer parameters, and random disturbances on equilibrium decisions and optimal profits. Shen and Dai [24] examined the operational and blockchain-adoption decisions of manufacturers and e-commerce platforms under both marketplace and reselling modes. Wei et al. [25] explored the profit motives and underlying mechanisms driving manufacturers’ investments in blockchain within low-carbon closed-loop supply chains, while Zhang et al. [26] evaluated the impact of blockchain investment on emission reduction strategies for enterprises producing both regular and low-carbon products under carbon trading policies. Biswas et al. [27] developed a game-theoretic model to evaluate the trade-off between the traceability benefits of blockchain and its environmental sustainability drawbacks in a static setting without external regulations.
While prior research provides a comprehensive overview of blockchain’s value, our understanding could be further enriched by examining its role from a different perspective. First, existing studies predominantly focus on blockchain’s application in physical anti-counterfeiting, luxury authentication, or internal cost coordination [16,17,18]. Its structural role in addressing the intangible “greenwashing” trust crisis within sustainable operations remains largely underexplored. Second, regarding environmental management, prior research either omits external regulations or treats them as static exogenous variables [23,27], failing to capture the interactive nature of government interventions. To bridge these gaps, our study redirects the analytical lens from static internal coordination to environmental transparency. By employing an evolutionary game theory framework, we endogenize the boundedly rational government, thereby systematically investigating the long-term dynamic co-evolution of supply chain green investments and composite tax-subsidy interventions.

2.2. Green Supply Chain

Within the domain of green supply chain management (GSCM), recent studies have increasingly explored the intersection of blockchain adoption, consumer distrust, and carbon policies. For instance, Li et al. [14] evaluated green investment decisions under emission taxes, but their primary analytical focus is on the internal emotional fairness concerns of retailers. Sarabi et al. [13] incorporated multidimensional consumer distrust into an evolutionary game framework alongside carbon taxes and subsidies. However, their model is structurally tailored to circular closed-loop supply chains (CLSC), specifically addressing trust and operational issues inherent in reverse logistics and product recycling. However, our research shifts the analytical lens to the forward green supply chain. Addressing fulfillment risks in agricultural supply chains. Cao et al. [28] demonstrated that integrating blockchain and Internet of Things (IoT) platforms can enhance information transparency and contract enforceability, thereby incentivizing greater green investment.
In parallel, extensive research has focused on the interactive mechanisms of contracts and sales modes regarding green innovations. Cheng et al. [29] investigate the interactive effects of a manufacturer’s green technology improvements and an e-tailer’s store brand introduction on the strategic choice between reselling and agency sales modes. Their findings reveal that higher store brand quality stimulates manufacturer green innovation which paradoxically deters store brand market entry and that both parties often achieve optimal profitability and environmental performance under the reselling mode. Guo et al. [30] examined the impact of eco-labels on GSCM from profitability and environmental perspectives. Furthermore, Zhang et al. [31] confirmed the effectiveness of a revenue-sharing mechanism in optimizing income distribution, boosting overall profitability, and incentivizing green sales. Song et al. [32] comparatively analyzed the differential impacts of two distinct revenue-sharing contracts on supply chain equilibrium outcomes. Jiang et al. [33] developed game models incorporating a greenness variable and used numerical simulations to determine the impact of the revenue-sharing coefficient on the profitability of supply chain members. Foundational studies by Xie et al. [34,35,36] have also extensively evaluated the influences of environmental impacts, consumer environmental awareness, and corporate social responsibility. Xiong et al. [37] utilized mean-variance theory to formulate a static game model, primarily investigating the impact of supply chain members’ internal risk aversion on dual-channel pricing and green investment decisions.
While the aforementioned literature provides valuable insights into green supply chain management, two critical limitations remain. First, regarding green technology adoption [13,14,28], existing studies either confine multi-dimensional distrust models strictly to reverse logistics in closed-loop systems [13] or treat blockchain as a positive enabler limited merely by static cost thresholds [14,28]. This conventional approach fails to capture the exact market-breaking points of forward green supply chains, specifically the “budget crowding-out effect” where exorbitant implementation costs paradoxically cannibalize substantive green production. Second, regarding supply chain coordination, prior research heavily relies on internal contractual mechanisms (e.g., revenue-sharing, sales mode selections) and internal risk adjustments. These internal profit-allocation tools cannot structurally resolve the external information asymmetry between manufacturers and consumers. To address these limitations, our study focuses on the forward green supply chain and formulates a three-dimensional demand function encompassing consumer green sensitivity, green trust level, and price sensitivity. Furthermore, rather than relying on internal contractual adjustments, we introduce blockchain technology as a structural mechanism to restore external market trust, fundamentally bridging the gap between verifiable green investments and multi-dimensional consumer behaviors.

2.3. Government Intervention Policies

To curb carbon emissions, governments primarily deploy carbon pricing policies, encompassing carbon taxes, cap-and-trade systems, and carbon offsets [38]. Chen et al. [39] applied evolutionary game theory to investigate the impact of various carbon tax policies on supply chain decisions. Choi et al. [40] incorporated government subsidies and three distinct taxation schemes when using blockchain to address data quality issues in sustainable fashion supply chain operations. Liu et al. [41] explored the effects of carbon tax policies and consumer demand on blockchain adoption strategies. Addressing the dual regulation of carbon caps and taxes, Miao et al. [42] examined optimal pricing and production decisions when firms implement trade-in subsidy strategies. Furthermore, Zhang et al. [43] comparatively analyzed game equilibria under manufacturer-led and retailer-led structures.
Regarding green supply chains under government subsidies, Yang et al. [44] dissected the impact of intervention mechanisms on optimal pricing and green levels. Cao et al. [45] statically evaluate the impact of varying subsidy targets on supply chain green efforts. Similarly, Wen et al. [46] assessed the static effects of various government subsidy policies under basic consumer green preferences. Considering corporate social responsibility (CSR). Feng et al. [47] explore the impact of manufacturer’s corporate social responsibility (CSR) and different government subsidy mechanisms on green innovation efforts and supply chain profitability. Moreover, Chen et al. [48] formulated a differential game model to investigate the optimal production and subsidy rates by considering dynamic consumer environmental awareness under the government’s dual orientations of social welfare and governmental utility maximization. Finally, Zeng et al. [49] investigated optimal pricing and greenness investment decisions in a green closed-loop supply chain under government subsidies, proposing a revenue-sharing and cost-sharing contract to achieve coordination.
While the aforementioned literature provides critical insights into the efficacy of government interventions, two fundamental limitations remain. First, the majority of existing studies evaluate regulatory policies—whether taxes or subsidies—as static, exogenous parameters [45,46,49]. This conventional approach fails to capture the bounded rationality of regulators and the long-term, dynamic adjustments between policy shifts and corporate compliance. Second, prior research predominantly explores these interventions under the assumption of perfect consumer trust, largely overlooking the prevalent “greenwashing” crisis that neutralizes green investments. Although some studies address CSR or internal contracts [47,49], they cannot structurally resolve external information asymmetry. Moving beyond these static frameworks and ideal assumptions, our research incorporates blockchain technology as a structural mechanism to eliminate information asymmetry and restore consumer trust. By employing an evolutionary game theory framework, we endogenize government behavior to systematically explore the long-term dynamic co-evolution of composite tax-subsidy interventions and supply chain strategic transitions, thereby providing a comprehensive paradigm for digital and green supply chain governance.

2.4. Supply Chain Digital Integration and Resilience

The advent of digital transformation has heralded a new era of resilience and transparency within supply chain management. Comprehensive reviews of current literature underscore that integrating digital technologies—such as the Internet of Things (IoT), artificial intelligence (AI), and blockchain—offers unparalleled opportunities to enhance operational agility and foster sustainability, albeit accompanied by infrastructural and implementation challenges [50]. These macro-level studies emphasize that while digital tools resolve information asymmetry, the exorbitant capital requirements for their deployment necessitate a critical balance to prevent technological investments from overwhelming the substantive operational budget.
To substantiate these macro-level insights, recent studies have evaluated specific mechanisms of digital integration. For instance, Wang et al. [51] conducted an empirical study on manufacturing and logistics firms in Central and Eastern Europe, demonstrating that supply chain digital integration significantly bolsters operational resilience through the mediating roles of operational and knowledge synergy. Their findings emphasize that the stability of inter-firm relationships further amplifies the resilience-enhancing effects of digitalization. In the context of green agri-food supply chains, Liu et al. [52] investigated the micro-level investment decisions involved in adopting blockchain and big data (ISBD), identifying the specific cost thresholds within which supply chain members can achieve internal coordination through revenue-sharing contracts.
Moving beyond the broad qualitative consensus and the empirical evaluation of post-integration resilience, our research elevates the analytical focus from general operational disruptions to the specific resolution of the “greenwashing” trust crisis. Furthermore, unlike studies that rely on the static coordination of digital investments through internal revenue-sharing contracts, our study shifts the paradigm toward macro-level dynamic governance. Rather than focusing solely on supply chain profitability under fixed cost thresholds, we analytically characterize the “budget crowding-out effect” of blockchain implementation—demonstrating how exorbitant traceability costs can paradoxically cannibalize substantive green production. To mitigate this structural risk, we employ evolutionary game theory to endogenize boundedly rational government behavior, systematically investigating how composite tax-subsidy interventions dynamically co-evolve with, and structurally safeguard, the adoption of digital traceability tools in forward supply chains.

2.5. Research Implications and Contributions

Synthesizing the aforementioned literature streams reveals that while significant strides have been made independently in green operations, blockchain application, and policy interventions, several dimensions at their intersection warrant deeper scholarly exploration.
First, existing studies on multi-dimensional distrust predominantly concentrate on circular closed-loop supply chains (CLSC) or reverse logistics. In the context of forward green supply chains, how the complex interplay among consumer green trust, price sensitivity, and green sensitivity jointly dictates market boundaries remains to be further refined. Second, digital investment is conventionally viewed as a strictly positive enabling tool. However, the underlying operational risks it may trigger under financial constraints—specifically, the mechanism by which exorbitant technological costs cannibalize the substantive green production budget—have not been sufficiently quantified. Finally, environmental policies are often simplified as static exogenous variables, failing to capture the bounded rationality and the logic of strategic co-evolution in the long-term interactions between regulators and enterprises.
Motivated by the need to extend these research perspectives, the primary contributions of this paper are manifested in three aspects:
(i)
First, this study provides a quantitative micro-foundation for how blockchain mitigates information asymmetry in sustainable supply chain operations. While recent literature highlights that blockchain can structurally alleviate information asymmetry to optimize supply chain resource allocation [15], the specific operational boundaries and pricing dynamics of such technological interventions in green markets remain underexplored. Drawing on this premise, our study conceptualizes blockchain as a disruptive mechanism that transitions the supply chain from fragile exogenous signaling (e.g., traditional eco-labels) to immutable structural transparency. By introducing a novel three-dimensional demand function—encompassing consumer green sensitivity, green trust, and price sensitivity—our model mathematically captures the interactive effects of these preferences. This allows us to precisely identify the economic boundaries and market-breaking points triggered by the resolution of information asymmetry, bridging the theoretical framework of blockchain with the analytical rigor of green supply chain governance.
(ii)
Breaking away from the idealized assumption that technology adoption is inherently beneficial, this paper mathematically derives and defines the “budget crowding-out effect” of blockchain technology in green production. By explicitly identifying the Empowerment Threshold and the Feasibility Threshold, we uncover the intrinsic economic mechanism through which technology implementation costs erode substantive green R&D investments, offering theoretical support for delineating the structural boundaries of corporate digital transformation.
(iii)
Employing evolutionary game theory, we endogenize boundedly rational government entities to construct a long-term co-evolutionary model of composite tax-subsidy policies and supply chain strategic transitions. This dynamic perspective not only overcomes the limitations of static policy assumptions but also provides a systematic governance paradigm for how regulators can leverage flexible policy toolkits to hedge against technological cost risks and guide the green transition of supply chains.

Table 1. Comparison of related literature.
ArticlesSC StructureBlockchain TechnologyGovernment Intervention PoliciesEGT Consumer Price Sensitivity & Green TrustProduct Greenness
[16]Two S,
One R
Yes----
[13]One M,
One R,
One C
YesTax & subsidyYesYesYes
[14]One M,
One R
YesTax-YesYes
[28]One S,
One R
YesSubsidy-YesYes
[40]One M,
One R
YesTax & subsidy--Yes
[43]Two RYes---Yes
[48]One G,
One M,
One R
YesTax--Yes
[42]One M,
One G
YesTax---
[45]One M,
One R
-Tax-YesYes
[47]One M,
One R
-Subsidy-Yes-
[20]One S,
One R
Yes--YesYes
Our articleOne M,
One R
YesTax & subsidyYesYesYes
Note: S = Supplier; R = Retailer; M = Manufacturer; C = Recycler; G = Government.

3. Problem Definition and Stackelberg Model

We consider a sustainable supply chain for green products comprising a single manufacturer and a single retailer, which is very common in the literature [24,45]. We formulate a manufacturer-led Stackelberg game in which the manufacturer is the leader and the retailer is the follower. In the first stage, anticipating the retailer’s optimal response, the manufacturer determines the wholesale price and the green investment level. Subsequently, in the second stage, the retailer determines the retail price based on the observed wholesale price and green investment level (See Table 2).
Assumption 1.
We assume that carbon emissions are exclusively generated during the manufacturing process of green products. Drawing on the framework of Wang et al.’s literature [39], which identifies the upstream production stage as the primary emission source, we assume the carbon tax is borne solely by the manufacturer. Consequently, the manufacturer is subject to an environmental tax based on these carbon emissions, with the carbon tax rate denoted as τ , τ 0 , 1 .
Assumption 2.
Agricultural product manufacturers manifest the green attributes of their products—defined as product greenness—by implementing measures such as carbon-emission reduction, environmental protection protocols, and organic certification during manufacturing. A higher investment yields a higher degree of product greenness. Specifically, to achieve a greenness level of g , the manufacturer incurs a green investment cost of  1 2 g 2 . This formulation aligns with the widely adopted quadratic cost functions in existing literature [37].
Assumption 3.
To incentivize the manufacturer to adopt a blockchain traceability system for green production, the government provides a unit subsidy based on a product’s greenness [49]. This policy effectively reduces the manufacturer’s green investment cost to 1 2 g B 2 1 s , s 0 , 1 .
Assumption 4.
Following prevalent practice in the literature [29,53], we assume that consumers exhibit varying sensitivities to green product attributes, denoted by the parameter γ . Concurrently, let  β  represent the consumer’s baseline price sensitivity. However, to account for the severe information asymmetry inherent in real-world markets, we introduce the parameter  θ 0 < θ < 1 to denote the consumer’s trust level regarding the product’s disclosed greenness.
Crucially, market skepticism towards a product’s green attributes not only discounts its perceived environmental value but also significantly amplifies the consumer’s price sensitivity [5,54]. Real-world market phenomena corroborate this dynamic: premium agricultural products with geographical indications—which are backed by rigorous traceability and monitoring systems—continue to command strong consumer demand despite substantial price premiums [55]. Incorporating these behavioral dynamics, the market demand functions are structurally formulated as follows:
D = 1 β θ p + γ θ g m
To clearly distinguish between the decision scenarios in subsequent analyses, equilibrium variables will be denoted by the superscripts N and B . Under Model N (without blockchain adoption), consumers do not fully trust the disclosed greenness levels of the products; that is, θ 0 , 1 . Conversely, upon the adoption of blockchain technology, we assume that the product’s green information is comprehensively and immutably recorded within the traceability system. Consequently, consumers exhibit complete trust in the product’s greenness, yielding θ = 1 [56]. Furthermore, to ensure that the supply chain members’ objective functions are strictly concave and yield economically viable (i.e., strictly positive) equilibrium solutions across both models, the core parameters must inherently satisfy the condition 4 β 1 s > γ 2 1 τ . This feasibility constraint mathematically guarantees that consumer price sensitivity ( β ) is sufficiently high relative to green sensitivity ( γ ), preventing anomalous scenarios where infinite green investments lead to unbounded market demand and profits.
Assumption 5.
Drawing on the descriptions of blockchain costs in Shen et al. [24] and Liu et al. [52], this study models the unit blockchain implementation cost ( C b ) as an exogenous parameter equally incurred by both the manufacturer and the retailer. In practical applications, physical supply chain enterprises rarely develop underlying blockchain infrastructures independently; instead, they adopt Blockchain-as-a-Service (BaaS) platforms provided by third-party technology giants (e.g., IBM, Alibaba, JD). Under the BaaS paradigm, enterprises act strictly as technology price-takers, paying a standardized per-transaction fee predetermined by the platform. Furthermore, to ensure end-to-end traceability and the immutability of the distributed ledger, both the manufacturer and the retailer must operate as independent authenticating nodes. Consequently, both members must upload their respective operational data to the chain, thereby incurring the identical exogenous unit operational cost ( C b > 0 ) per product unit.
Assumption 6.
To simplify the model formulation and following Tian et al. [57], we assume that the manufacturer’s production cost is 0 .

3.1. Model Without Blockchain

In this model, the profit functions of the manufacturer and the retailer are respectively formulated as follows:
π m N = w N 1 τ D N 1 2 g N 2
π R N = p N w N D N
The first term of Equation (1) represents the manufacturer’s revenue adjusted for the carbon tax, while the second term accounts for the green investment cost. In the scenario without blockchain adoption (Model N), the manufacturer acts as the Stackelberg leader, initially determining the wholesale price w N and the green investment level g N . Subsequently, the retailer determines the retail price p N . We employ backward induction to derive the equilibrium outcomes. The strict concavity of the retailer’s profit function ensures a unique optimal retail price response. Anticipating this, the manufacturer optimizes its wholesale price and green investment level. The resulting equilibrium decisions are summarized in Proposition 1.
Proposition 1.
(i) 
The optimal values of retail price, wholesale price and greenness:
w N = 2 θ 4 β γ 2 1 τ θ 3 ,   p N = 3 θ 4 β γ 2 1 τ θ 3 ,   g N = γ 1 τ θ 2 4 β γ 2 1 τ θ 3
(ii) 
Optimal values of market demand, manufacturers’ profits and retailers’ profits:
D N = β 4 β γ 2 1 τ θ 3 ,   π m N = θ 1 τ 2 4 β γ 2 1 τ θ 3 ,   π R N = β θ 4 β γ 2 1 τ θ 3 2
Proposition 1 analytically establishes that in a conventional, opaque market, the equilibrium greenness level is not merely an internal operational cost decision, but a fragile optimization constrained by a strict “double squeeze.” Economically, the manufacturer faces internal market friction driven by severe information asymmetry and a consumer trust deficit alongside external regulatory penalties, namely the carbon tax. Without a credible structural mechanism to verify environmental efforts, the manufacturer cannot effectively translate costly green investments into a market price premium. Consequently, the rational strategic response is inherently conservative. This demonstrates that demand-side skepticism and policy-driven profit pressures place a hard structural ceiling on the sustainable transition potential of a traditional supply chain.
Proposition 2.
In Model N, the equilibrium outcomes ( w N ,  p N ,  D N ,  π m N π R N ) are strictly decreasing in the consumer price sensitivity ( β ), and strictly increasing in the consumer green trust  θ .
Proposition 2 indicates that heightened price sensitivity restricts market demand, its structural impact on the green supply chain extends far beyond simple volume contraction. Economically, extreme price sensitivity neutralizes the “green premium.” Unable to pass the costs of environmental innovations down the supply chain (a failure of cost pass-through), the manufacturer faces a severe margin squeeze. This cost-absorption dilemma fundamentally disincentivizes upstream green investments. The supply chain thus enters a downward spiral: stripped of high-margin green attributes, the product is forced to compete solely on price, triggering a race-to-the-bottom in wholesale pricing that ultimately erodes the profitability of the entire ecosystem. This dynamic perfectly mirrors the commercial reality in highly price-elastic agricultural markets.
As empirically confirmed by Ghosh et al. [58], when the end-market fails to absorb the “green premium,” upstream producers are financially compelled to abandon sustainable practices and revert to conventional, high-emission models to survive the margin squeeze.
Conversely, consumer green trust acts as a critical counterweight to price elasticity. In traditional markets, trust relies heavily on fragile external signals, such as media endorsements or third-party certifications. When this exogenous trust increases, it lowers consumers’ perceived risk, thereby generating a robust “trust premium.” This premium absorbs the upstream R&D costs, enabling the retailer to command higher retail prices without sacrificing demand, which subsequently trickles up to expand the manufacturer’s margin. However, because this trust in Model N is strictly exogenous, it is highly vulnerable to “greenwashing” scandals. Real-world supply chain disruptions—such as the recurrent mislabeling controversies and fraudulent certifications in traditional organic food markets—illustrate how a single transparency failure can instantly evaporate this trust premium and trigger a collapse in market demand [59]. This inherent vulnerability establishes the theoretical imperative for introducing a structural, immutable trust mechanism—blockchain technology—which will be analyzed in the subsequent section.

3.2. Model with Blockchain

In this model, the profit functions of the supplier and the retailer are as follows:
π s B = w B 1 τ C b D B 1 2 g B 2 1 s
π R B = p B w B C b D B
Blockchain technology enables real-time tracking of carbon footprints throughout the production process, thereby fostering complete consumer trust in the product’s environmental attributes ( θ = 1 ). To promote such transparency, the government provides subsidies to incentivize blockchain adoption, as reflected in the green subsidy rate. Under this framework, we model a Stackelberg game where the manufacturer acts as the leader, first determining the green investment level and the wholesale price. Subsequently, the retailer, acting as the follower, sets the retail price. Employing backward induction, we derive the unique equilibrium outcomes.
Proposition 3.
(i) 
The optimal values of wholesale price, retail price and greenness:
w B = 2 1 s 1 τ + C b β τ C b γ 2 1 τ 1 τ 4 β 1 s γ 2 1 τ
p B = 1 s 3 1 τ + C b β 2 τ C b γ 2 2 + τ 2 3 τ 1 τ 4 β 1 s γ 2 1 τ
g B = γ 1 τ β C b 2 τ 4 β 1 s γ 2 1 τ
(ii) 
The optimal values of market demand and profits are:
D B = β 1 s 1 τ C b β 2 τ 1 τ 4 β 1 s γ 2 1 τ
π m B = 1 s 1 τ C b β 2 τ 2 2 1 τ 4 β 1 s γ 2 1 τ
π R B = β 1 s 2 1 τ C b β 2 τ 2 1 τ 2 4 β 1 s γ 2 1 τ 2
Proposition 4.
There exist two critical thresholds for the unit blockchain implementation cost  C b :
(i) 
The Feasibility Threshold ( C b f ¯ ): When  C b > C b f ¯ , the manufacturer’s optimal green investment in the blockchain mode drops to zero ( g B = 0 ).
(ii) 
The Empowerment Threshold ( C b e ¯ ): There exists a unique threshold  C b e ¯  strictly satisfying  C b e ¯ < C b f ¯ . The blockchain-enabled mode achieves higher product greenness than the traditional mode ( g B > g N ) if and only if  C b ¯ < C b e ¯ .
The proof of this proposition is available in Appendix A.
Proposition 4 mathematically operationalizes the “double-edged sword” nature of blockchain technology via a two-stage structural deterioration. Below the Empowerment Threshold ( C b e ¯ ), the technology unlocks a massive “trust dividend,” eliminating market skepticism and enabling the manufacturer to fully capture the green premium. This demand-side pull strongly incentivizes green physical investments.
However, as the implementation cost crosses C b e ¯ , the supply chain falls victim to a severe “budget crowding-out effect.” The exorbitant operational expenses of maintaining the digital ledger begin to cannibalize the capital available for actual green R&D, causing the physical environmental performance to regress below the traditional baseline. If costs further escalate to breach the Feasibility Threshold ( C b f ¯ ), the dual pressures of technological overhead and consumer price sensitivity entirely obliterate the profit margin. The system plunges into a “death zone” where sustainable production is completely abandoned. This highlights a profound managerial insight: technological transparency is not a panacea; without stringent cost control, forcing digital adoption can paradoxically degrade physical sustainability.
Corollary 1.
C b f ¯ β < 0 ,   C b f ¯ τ < 0 .
Corollary 1 exposes the acute vulnerability of the blockchain-enabled supply chain to external market and policy shocks. It mathematically proves that extreme consumer price sensitivity and aggressive punitive carbon taxes severely compress the viable cost space ( C b f ¯ ) for technological adoption. From a policy perspective, this reveals the inherent danger of “unilateral punitive regulations.” Relying exclusively on high carbon taxes to force compliance triggers a margin collapse, paradoxically accelerating the supply chain’s descent into the aforementioned “death zone.” Therefore, a composite policy framework—pairing taxation with targeted subsidies for digital infrastructure—is imperative to prevent regulatory backfiring and to financially de-risk the digital-green transition.
Proposition 5.
A comparative static analysis of the equilibrium greenness levels ( g N  and  g B ) and their differential ( Δ g = g B g N ) yields the following sensitivity properties:
(i) 
Δ g θ < 0
(ii) 
g B β < 0  and  g N β < 0
(iii) 
g B γ > 0  and  g N γ > 0
(iv) 
g B s > 0  and  Δ g s > 0
(v) 
g B τ < 0  and  g N τ < 0 .
Proposition 5 distills the comparative statics into several core economic mechanisms governing the digital-green transition. First, it reveals a clear substitution effect of brand equity ( θ ). While an increase in initial market trust predictably boosts greenness in the traditional model, it concurrently diminishes the marginal advantage of blockchain adoption ( Δ g θ < 0 ). Economically, for leading agricultural enterprises with established public credibility, the exorbitant costs of blockchain yield diminishing marginal returns. Conversely, for startups or small-to-medium enterprises (SMEs) suffering from a severe “trust deficit,” blockchain acts as a critical equalizer. By structurally bridging the information gap, it unlocks the green premium, a dynamic consistent with recent literature on digital traceability acting as a powerful market signaling mechanism [60].
Furthermore, the analytical results underscore the absolute dominance of consumer price elasticity ( β ). Heightened price sensitivity structurally depresses green investments across both operational modes. This reiterates the “cost pass-through failure” established in Model N: when consumers prioritize ultimate affordability over verifiable sustainability, the profit margin is severely squeezed. This financial pressure suffocates the economic viability of both physical green R&D and digital traceability. As empirically documented in sustainable operations research [54] extreme price sensitivity remains the most formidable barrier to sustainable consumption, forcing supply chains into a defensive, cost-minimizing posture regardless of their technological capabilities.
Crucially, Proposition 5 highlights the asymmetric and often counter-intuitive impacts of policy interventions on the supply chain. Financial subsidies ( s ) exert a strictly positive amplification effect on both the absolute green investment and the comparative advantage of blockchain. By directly absorbing the technological overhead, subsidies effectively neutralize the “budget crowding-out effect,” serving as a direct financial de-risking tool for synergistic digital-green transformations [48].
Strikingly, however, elevated carbon taxes ( τ ) present a crowding-out dilemma, strictly suppressing green investment in both scenarios. Rather than stimulating sustainable transitions, excessive punitive taxation acts as a direct drain on operational cash flow, cannibalizing the budget fundamentally required for eco-innovations. This unintended regulatory backfiring strongly aligns with the recent findings of Shen et al. [61], who demonstrate that excessive carbon penalties in supply chains can become counterproductive—forcing firms to adopt defensive commercial strategies that ultimately degrade, rather than improve, overall environmental performance. This also corroborates the classical insights of Krass et al. [62] regarding the stifling effect of overly stringent taxes on green fixed-cost investments. Finally, the indeterminate analytical signs regarding how parameters such as β , γ and τ affect the greenness differential ( Δ g ) suggest the presence of non-monotonic, complex trade-offs. These analytical ambiguities fundamentally necessitate a more granular examination through numerical simulation, which is systematically conducted in the subsequent section.

4. Numerical Simulations and Analysis of the Results

This section further validates and elaborates on the previously discussed analytical findings by performing numerical simulations in MATLAB R2025a. Following the methodological framework of Biswas et al. (2023) [27], we select parameter values that satisfy the model’s assumptions and the existence conditions of equilibrium solutions.
To rigorously ground our numerical analysis in empirical reality, our parameter selection reflects real-world constraints through normalized scalars rather than absolute monetary values. This approach captures the relative magnitudes and structural trade-offs inherent in sustainable operations without violating the dimensional consistency of the game-theoretic model. Specifically, to capture the dynamics of real-world carbon pricing, the baseline carbon tax is modeled proportionally τ = 0.1 As articulated by Trinks et al. (2026) [63], this normalized tax-to-margin ratio allows the model to analyze the relative impact of carbon costs on profitability. For example, an introductory carbon price in emerging national carbon markets (e.g., the transitional phase of China’s national ETS) perfectly corresponds to this moderate baseline ratio. Consistent with the modeling of environmental fiscal policies [62], the government subsidy rate is concurrently constrained to a moderate fractional bound s = 0.1 . This establishes a balanced initial regulatory environment, reflecting realistic public budget constraints where the government provides targeted financial de-risking without inducing extreme corporate arbitrage.
Furthermore, we calibrate the market demand and consumer behavior parameters to reflect the dominant commercial realities of green supply chains. Following classical demand modeling, we set the baseline price sensitivity to a normalized β = 1 . Empirical evidence consistently demonstrates that while consumers value environmental attributes, ultimate affordability remains the primary driver of purchasing decisions in mass agricultural markets [54]. Setting the green sensitivity to γ = 0.6 strictly satisfies β > γ , mathematically capturing the reality that price elasticity heavily outweighs the green premium. Concurrently, a baseline initial trust level of θ = 0.7 reflects a market environment where traditional exogenous certifications exist but are insufficient to eliminate information asymmetry. This aligns with behavioral findings by Leonidou et al. [5], indicating that while consumers are not entirely skeptical ( θ > 0.5 ), residual fears of “greenwashing” systematically discount the perceived green value in non-blockchain scenarios.
By substituting these empirically grounded relative parameters ( β = 1 , γ = 0.6 , θ = 0.7 , τ = 0.1 , s = 0.1 ) into our derived equilibrium expressions, the system intrinsically satisfies the strict concavity and operational feasibility conditions (i.e., 4 β 1 s > γ 2 1 τ ). With this robust mathematical foundation established, we systematically analyze the sensitivities of the greenness differential and supply chain decisions to variations in technological costs, market heterogeneity, and dynamic policy interventions.

4.1. Analysis of the Impact of Blockchain Implementation Costs on the Greenness Differential

Holding other parameters constant and ensuring that both market demand and product greenness remain non-negative, we perform a comparative static analysis on the unit blockchain implementation cost C b . Derived from Proposition 4, the enabling threshold of blockchain C b e ¯ is approximately 0.278, and the “death threshold” C b f ¯ is approximately 0.474. To evaluate strategic shifts across different cost intervals, we select a low-cost scenario ( C b = 0.2 ) and a high-cost scenario ( C b = 0.42 ) to analyze their respective impacts on the manufacturer’s green investment level. The simulation results are illustrated in Figure 1.
As demonstrated in Figure 1a, under a fixed low blockchain implementation cost ( C b = 0.2 ), the greenness differential remains significantly greater than zero across the entire parameter range. This verifies that when the implementation cost is strictly controlled below the Empowerment Threshold ( C b < C b e ¯ ), the system enters an absolute gain zone. In this state, the trust dividend generated by blockchain provides a robust strategic buffer. Even if the government imposes a higher carbon tax or market price sensitivity increases, the manufacturer retains sufficient financial latitude to convert profits into green investments. Technology functions as an absolute enabler here, ensuring that the demand-pull effect driven by transparency consistently outweighs the operational friction.
Conversely, Figure 1b illustrates the high-cost scenario ( C b = 0.42 ) where the implementation cost rapidly approaches the Feasibility Threshold ( C b f ¯ ). Under this mechanism, the environmental performance of the system becomes extremely fragile, with the greenness differential swiftly plunging into negative territory ( Δ g < 0 ) as β or τ increases. This dynamically confirms the structural vulnerability established in Corollary 1. When C b remains at a high level, the dual squeeze of punitive taxation and price pressure triggers a severe budget crowding-out effect. In price-sensitive lower-tier markets or regions with aggressive carbon pricing, the manufacturer is forced to allocate the bulk of its marginal profits to maintain the expensive underlying blockchain infrastructure, directly cannibalizing the budget designated for substantive green production. This indicates that without targeted cost controls or external subsidies, the introduction of digital traceability technologies may paradoxically lead to a regression in the sustainability of the supply chain.

4.2. The Dual Impacts of Consumer Trust, Price Sensitivity, and Green Sensitivity on the Greenness Difference

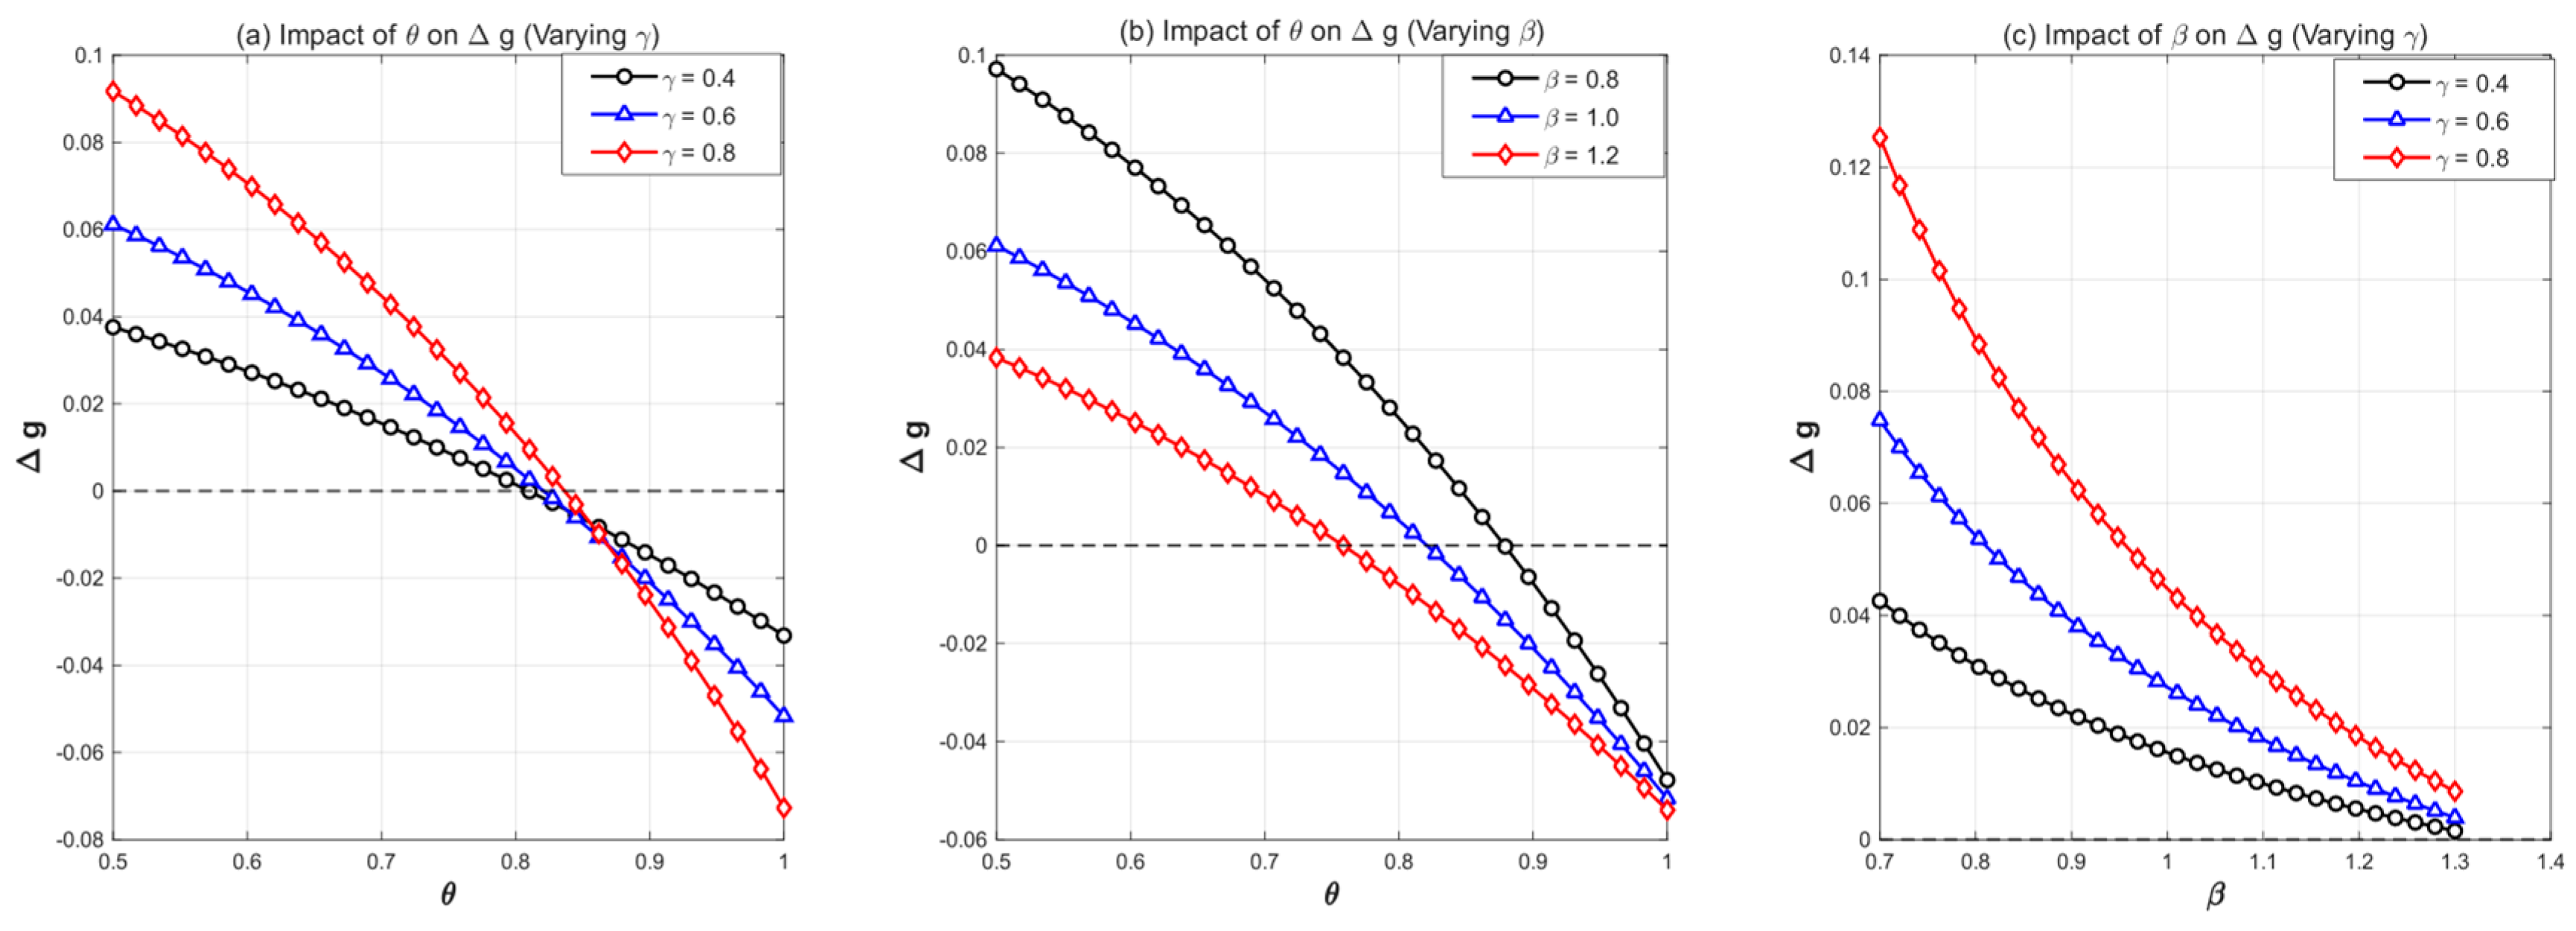
Figure 2 delineates the commercial breaking points of blockchain technology across various market segments by characterizing the interactive effects of multi-dimensional consumer preferences.
As shown in Figure 2a, the enhancement effect of blockchain on product greenness peaks when the initial trust level is low and the green sensitivity is high. From a managerial perspective, this precisely identifies the optimal application scenario for traceability technologies. Emerging organic farms that lack brand endorsement and face severe greenwashing skepticism but cater to a highly environmentally conscious audience benefit the most. In such contexts, blockchain serves as an indispensable structural bridge that cures the market failure caused by information asymmetry.
However, Figure 2b,c expose the harsh commercial realities associated with market penetration. As price sensitivity ( β ) increases, the greenness differential curve sharply crosses the zero axis and sinks deep into the negative zone. This intersection represents an absolute commercial breaking point rather than a mere mathematical nadir. In extremely price-sensitive markets, even if blockchain achieves absolute information transparency, the resulting trust premium is entirely insufficient to offset consumer resistance to cost pass-through. This explains why forcing high-end traceability technologies into lower-tier markets frequently fails. The technological dividends are completely neutralized by strict budget constraints, leading to a structural mismatch between technological application and market logic.

4.3. The Dual Impact of Environmental Carbon Tax and Government Subsidy Rates on the Greenness Differential

To address the complexity of real-world environmental policies such as the hedging mechanisms within the EU ETS framework, this section examines the composite effects of carbon taxes, subsidies, and technological costs.
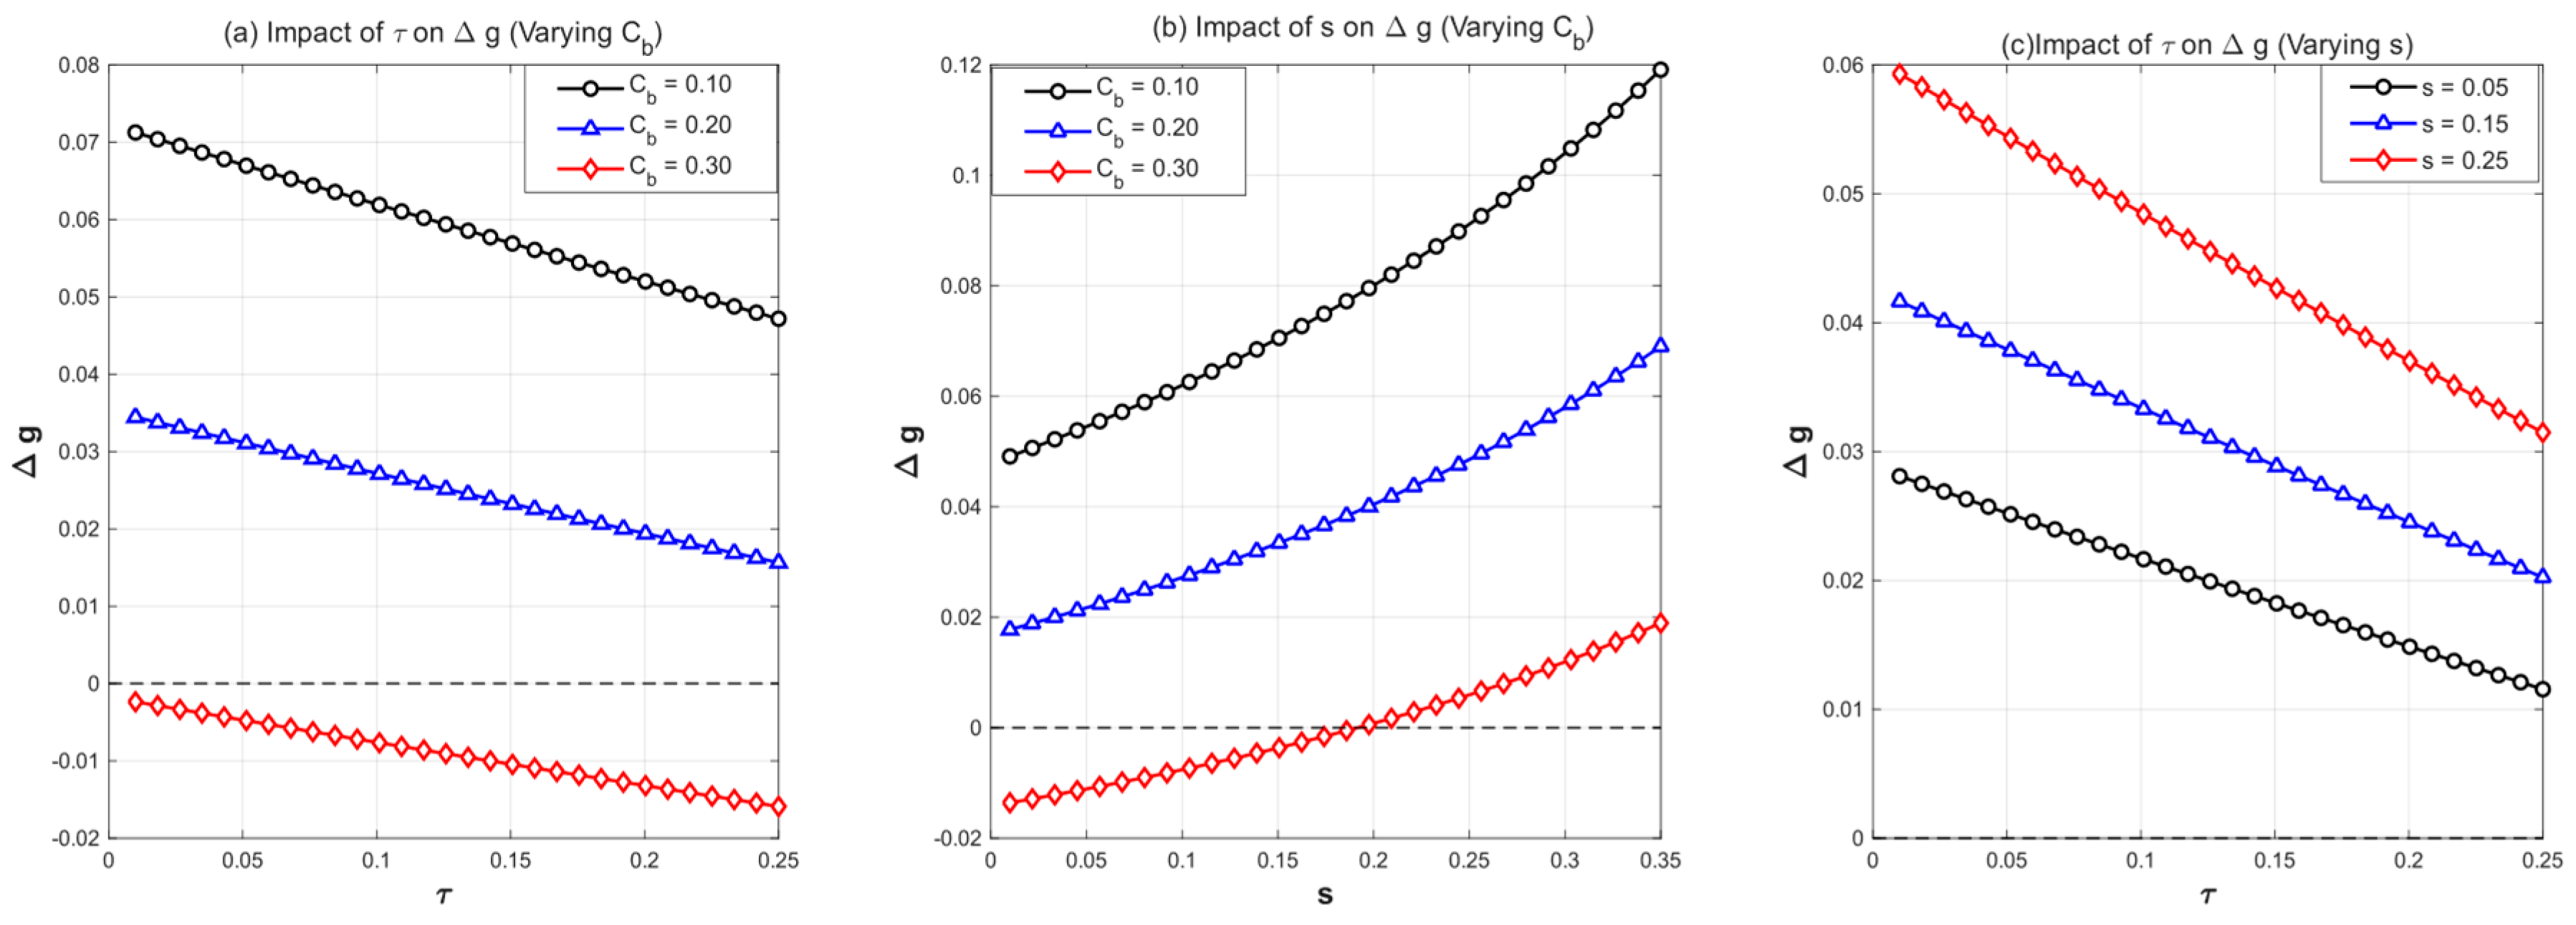
As illustrated in Figure 3a, the superposition of a punitive carbon tax ( τ ) and exorbitant technological costs ( C b ) drastically compresses corporate profit margins, causing the greenness differential to rapidly turn negative. This dynamically demonstrates the inherent limitations of unilateral punitive policies. Over-relying on carbon taxes to force digital transformation easily triggers financial runs, compelling enterprises to covertly reduce substantive green investments for survival, thereby entirely cannibalizing the blockchain trust dividend.
Crucially, Figure 3c visualizes the structural necessity of composite policy design. The greenness differential decreases as the carbon tax rises but climbs with increased subsidies. This reveals the substitution and complementary boundaries inherent in real-world interventions. High subsidies effectively hedge against the survival pressure induced by punitive taxation. For any given stringent carbon tax level, the government must provide a minimum proportion of targeted subsidies to sustain the system within the green gain zone. This proves that government subsidies should not be viewed merely as profit embellishments for enterprises but must be treated as structural hedging tools. Within a complex governance context, carbon taxes must be coupled with technological subsidies to neutralize the threshold-compressing effect of the tax itself. Only through this composite mechanism can policymakers achieve the synergistic transformation of digitalization and sustainability without breaching the survival baseline of the supply chain.

4.4. Robustness Check and Market Heterogeneity Analysis

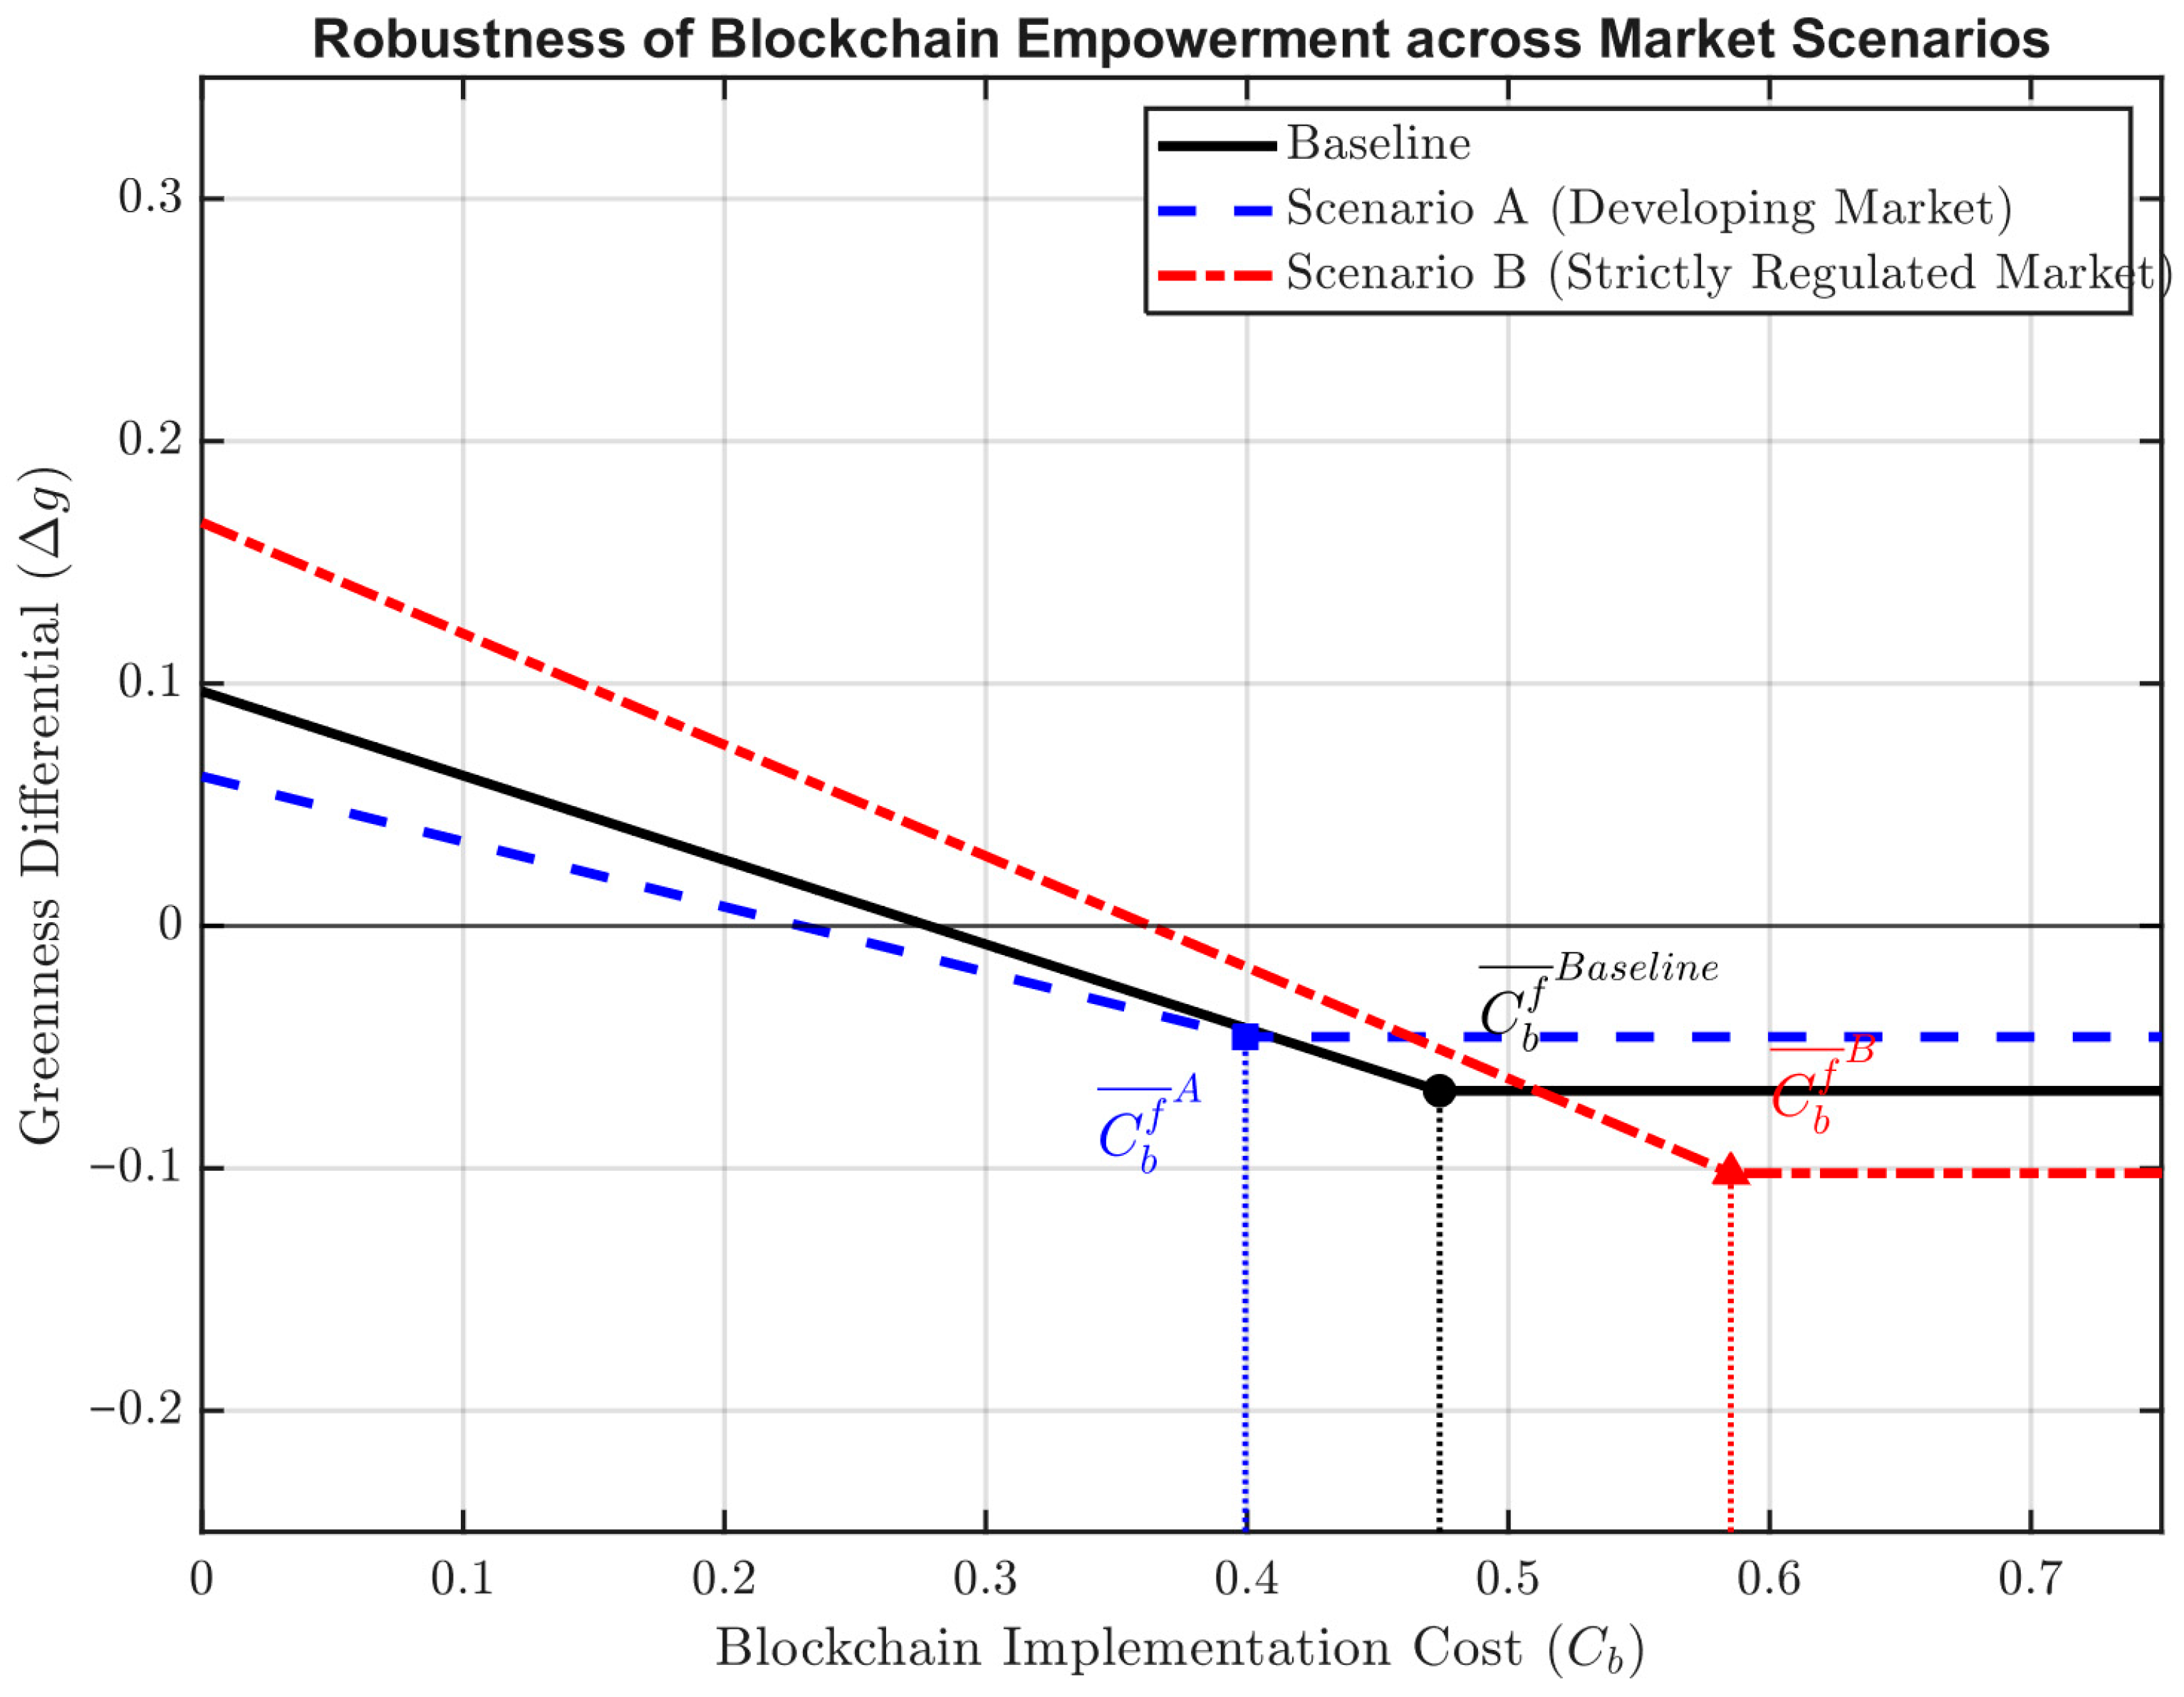
To validate the properties in Corollary 1 and assess sensitivity to diverse markets, we perform a scenario-based robustness analysis. Following recent operations management literature, we calibrate the model to simulate two distinct macroeconomic scenarios: (i) Scenario A (Developing Market): Characterized by high price sensitivity, low willingness to pay for green premiums, and lax environmental regulation. The parameters are adjusted to: β = 1.2 ,   γ = 0.48 ,   τ = 0.08 ,   s = 0.10 . (ii) Scenario B (Strictly Regulated Market): This scenario represents mature economies governed by stringent environmental policies, such as the European Union Emissions Trading System (EU ETS). Within this regulatory paradigm, elevated carbon pricing is structurally coupled with dedicated technological subsidies—most notably the EU Innovation Fund, which recycles carbon revenues to underwrite corporate green tech implementations [64,65]. The parameters are adjusted to: β = 0.8 ,   γ = 0.72 ,   τ = 0.12 ,   s = 0.12 .
Figure 4 depicts the product greenness differential ( Δ g ) as a function of the unit blockchain implementation cost ( C b ). The structural trajectory of remains robust across all scenarios, exhibiting a monotonic decline that culminates in a flat horizontal segment. The marked kink points ( C b f ¯ A , C b f ¯ B a s e l i n e , C b f ¯ B ) denote the exact corner solutions of the model. At these critical nodes, the marginal cost of blockchain implementation fully erodes the operational margin, driving the manufacturer to abandon green investment entirely ( g B = 0 ).
The spatial distribution of these kink points substantiates the comparative statics established in Corollary 1. In the highly price-sensitive environment of Scenario A, the kink point shifts inward to the left ( C b f ¯ A ). This visualizes the analytical property C b f ¯ β < 0 . The lack of consumer willingness to pay a green premium severely restricts the feasible cost space for blockchain adoption. Consequently, unless technological costs are strictly minimized, the manufacturer will prematurely cross this compressed threshold, resulting in a corner solution that impedes the green transition.
Conversely, Scenario B illustrates an outward expansion of the feasibility threshold ( C b f ¯ B ), highlighting the structural necessity of composite policy design. Corollary 1 analytically proves that a higher carbon tax compresses the feasibility threshold ( C b f ¯ τ < 0 ). Relying exclusively on a punitive tax ( τ = 0.12 ) would theoretically narrow the feasible region for blockchain adoption, potentially yielding counterproductive environmental outcomes. However, the composite policy mechanism in Scenario B which couples the elevated carbon tax with a corresponding technology subsidy ( s = 0.12 )—effectively offsets this compression, significantly expanding the boundary of the feasible region.
From a regulatory perspective, this analysis reveals the inherent limitations of isolated punitive mechanisms. To incentivize the sustainable adoption of traceability technologies, policy frameworks must extend beyond unilateral carbon taxation. Punitive taxes must be structurally complemented by targeted subsidies for blockchain implementation. Such a composite intervention mitigates the financial friction induced by technological costs, neutralizes the threshold-compressing effect of taxation, and sustains a broader feasible space for digital and green supply chain transformations.

5. Evolutionary Game Theory Model

In this section, we employ Evolutionary Game Theory (EGT) to investigate the dynamic interactions between two heterogeneous macro-populations: the government and the supply chain. While the supply chain internally comprises manufacturers and retailers (as modeled in the Stackelberg game), we treat them as a cohesive macro-population in the long-term evolutionary process to evaluate their collective strategic response to government interventions. We assume that both the government and the supply chain members exhibit bounded rationality. Given the prevalence of incomplete information, their initial strategies are typically sub-optimal. However, through a continuous process of learning and trial-and-error, these agents gradually converge on their respective stable behavioral strategies.
The supply chain members can choose among three strategies: (i) “Conventional Production,” referring to a strategy involving neither green production nor blockchain technology; (ii) “Green Production,” meaning the strategy involves green production exclusively; (iii) “Green Production with Blockchain,” meaning the implementation of blockchain technology in green production. The government also has three regulatory options: (i) “Neither tax nor subsidy,” meaning the government neither levies carbon taxes nor grants subsidies to firms; (ii) “Taxation,” which means the government exclusively levies carbon taxes on enterprises; (iii) “Taxation and subsidy,” which means the government not only imposes carbon taxes on enterprises but also subsidizes a certain proportion of their green production costs.
Assumption 7.
Following the conceptual framework of Sarabi et al. (2025) [13], we characterize the environmental benefits to the government resulting from the strategic choices of supply chain members. Specifically, when supply chain members refrain from green production, the government derives no environmental benefits. In the scenario in which members exclusively engage in green production, the government gains an environmental benefit, as denoted by H 1 . Furthermore, when supply chain members simultaneously implement both green production and blockchain technology, the government realizes greater environmental benefits, as represented by  H 2 , which  H 2 > H 1 .
Following the established evolutionary game framework in recent green and closed-loop supply chain literature [13], we treat the decentralized supply chain members as a cohesive macro-population during the long-term evolutionary process. Given that blockchain infrastructure requires high vertical synergy, the aggregate supply chain profit ( π S C = π s + π m ) is utilized as the fitness function to evaluate the evolutionary stable strategies against government interventions.
Accordingly, when supply chain members opt for the first strategy, the total profit is defined as the aggregate profit of both the supplier and the retailer in a non-blockchain benchmark scenario with zero green investment (i.e., g N = 0 ). This is expressed as: π S C 1 = π s N g N = 0 + π m N g N = 0 .
In the second strategy, supply chain profit is the sum of supplier and retailer profits in a traditional setting (without blockchain), formulated as: π S C 2 = π S N + π m N .
The third strategy defines supply chain profit as the sum of the supplier’s and retailer’s profits within a blockchain-enabled framework, given by: π S C 3 = π S B + π m B .
Considering different strategy combinations, the profit functions of the supply chain and the government under each strategy combination are shown in Table 3.
Based on the payoff matrix presented in Table 3, the expected payoffs for the government when choosing each of the three strategic options are formulated as follows:
E g 1 = y 2 H 1 + ( 1 y 1 y 2 ) H 2
E g 2 = y 1 w N s D N + y 2 ( H 1 + w N D N τ ) + ( 1 y 1 y 2 ) ( H 2 + w B D B τ )
E g 3 = y 1 w N s D N + y 2 ( H 1 + w N D N τ ) + ( 1 y 1 y 2 ) ( H 2 + w B D B τ g B 2 2 s )
The mean expected payoff for the government is given by:
E g = x 1 E g 1 + x 2 E g 2 + ( 1 x 1 x 2 ) E g 3
The expected payoffs for the supply chain under its three respective strategies are formulated as:
E s c 1 = x 1 ( π s c 1 + w N D N τ ) + x 2 π s c 1 + ( 1 x 1 x 2 ) π s c 2
E s c 2 = x 1 ( π s c 2 + w N D N τ ) + x 2 π s c 2 + ( 1 x 1 x 2 ) π s c 2
E s c 3 = x 1 ( π s c 3 + w B D B τ g B 2 2 s ) + x 2 ( π s c 2 g B 2 2 s ) + ( 1 x 1 x 2 ) π s c 3
The mean expected payoff for the supply chain is expressed as:
E s c = y 1 E s c 1 + y 2 E s c 2 + ( 1 y 1 y 2 ) E s c 3
In Evolutionary Game Theory, the replicator dynamic equation is a differential equation that characterizes the time-dependent evolution of strategy frequencies within a population. Accordingly, the replicator dynamic systems for the government and the supply chain are defined as follows:
F ( x 1 ) = d x 1 d t = x 1 ( x 1 + x 2 1 ) ( y 1 + y 2 1 ) g B 2 s 2 ( x 1 1 ) τ [ ( y 1 + y 2 ) ( w B D B w N D N ) w B D B ] 2
F ( x 2 ) = d x 2 d t = x 2 ( x 1 + x 2 1 ) ( y 1 + y 2 1 ) g B 2 s 2 x 1 τ [ ( y 1 + y 2 ) ( w B D B w N D N ) w B D B ] 2
F ( y 1 ) = d y 1 d t = y 1 ( 1 y 1 ) [ 2 ( π s c 1 π s c 3 ) + ( x 1 + x 2 ) g B 2 s ] + y 2 [ 2 ( π s c 3 π s c 2 ) ( x 1 + x 2 ) g B 2 s ] 2
F ( y 2 ) = d y 2 d t = y 2 ( 1 y 2 ) [ 2 ( π s c 2 π s c 3 ) + ( x 1 + x 2 ) g B 2 s ] + y 1 [ 2 ( π s c 3 π s c 1 ) ( x 1 + x 2 ) g B 2 s ] 2

5.1. Model Analysis

Based on the aforementioned four replicator dynamic equations, let d x 1 d t = 0 ,   d x 2 d t = 0 ,   d y 1 d t = 0 ,   d y 2 d t = 0 . By solving this system of equations, we identify the equilibrium points of the evolutionary system as follows:
(0, 0, 1, 0, 0, 1), (0, 1, 0, 0, 0, 1), (1, 0, 0, 0, 0, 1), (1, 0, 0, 0, 1, 0), (1, 0, 0, 1, 0, 0),
2 π s c 3 π s c 1 2 τ w N D N w B D B + g B 2 s ,   0 ,   1 x 1 ,   2 w B D B τ g B 2 s 2 τ w B D B w N D N g B 2 s ,   0 ,   1 y 1 ,
2 π s c 3 π s c 2 2 τ w N D N w B D B + g B 2 s ,   0 ,   1 x 1 ,   0 ,   2 w B D B τ g B 2 s 2 τ w B D B w N D N + g B 2 s ,   1 y 2 ,
2 π s c 1 π s c 3 + g B 2 s 2 τ w N D N w B D B ,   1 x 1 ,   0 ,   0 ,   w B D B w B D B w N D N ,   1 y 2 ,
2 π s c 2 π s c 3 + g B 2 s 2 τ w B D B w N D N ,   1 x 1 ,   0 ,   w B D B w B D B w N D N ,   0 ,   1 y 1
The equilibrium points derived from the replicator dynamic system are not necessarily stable. According to the method proposed by Friedman (1991) [66], the local stability of these equilibrium points can be determined by analyzing the signs of the determinant and the trace of the Jacobian matrix. For the aforementioned replicator dynamic system, the Jacobian matrix is formulated as follows:
J = [ F ( x 1 ) x 1 F ( x 1 ) x 2 F ( x 1 ) y 1 F ( x 1 ) y 2 F ( x 2 ) x 1 F ( x 2 ) x 2 F ( x 2 ) y 1 F ( x 2 ) y 2 F ( y 1 ) x 1 F ( y 1 ) x 2 F ( y 1 ) y 1 F ( y 1 ) y 2 F ( y 2 ) x 1 F ( y 2 ) x 2 F ( y 2 ) y 1 F ( y 2 ) y 2 ] = [ c 11 c 12 c 13 c 14 c 21 c 22 c 23 c 24 c 31 c 32 c 33 c 34 c 41 c 42 c 43 c 44 ]
An equilibrium point of the replicator dynamic system is identified as an Evolutionary Stable Strategy (ESS) if it satisfies the following two stability conditions:
(1). trJ = c11 + c22 + c33 +c44 < 0; (2). detJ > 0.
According to the Routh-Hurwitz criteria [67], these conditions ensure that the equilibrium point is locally asymptotically stable, meaning that the system will return to this state following small perturbations.
Proposition 6.
The stability analysis of each equilibrium point is summarized in Table 4.
Proposition 7.
Proposition 6 indicates that the Evolutionary Stable Strategy (ESS) of the supply chain is profoundly influenced by governmental policy orientations. In a laissez-faire scenario in which the government remains inactive, all three strategic supply chain alternatives may emerge as ESSs. Conversely, when the government provides targeted subsidies to incentivize the integration of blockchain into green production, the supply chain is most predisposed to converge toward the blockchain-enabled green production strategy.
The presence of mixed strategies reveals the possibility of strategic oscillation among supply chain members, who shift between green production and blockchain-enabled green production (strategies y2 and y3), or between conventional production and blockchain-enabled green production (strategies y1 and y3). These findings underscore the critical importance of flexibility in supply chain management and governmental policymaking. Both parties must dynamically calibrate their strategic trajectories in response to evolving exogenous and endogenous factors.
Proposition 8.
When the blockchain implementation cost Cb is prohibitively high and government subsidies are absent (s = 0), even the imposition of a substantial carbon tax τ fails to drive the system toward the equilibrium (0, 1, 0, 0, 0, 1) (Taxation, Green Production with Blockchain). In this scenario, the supply chain falls into a “green compromise” trap, where the system stabilizes at (0, 1, 0, 0, 1, 0) (Taxation, Green Production exclusively).
When the condition s g B 2 > 2 D B τ w B 2 D N τ w N + 2 Π S C 2 2 Π S C 3 is satisfied, the government’s subsidy benefits effectively cover the supply chain’s risk exposure associated with blockchain adoption. Consequently, the system transcends the saddle point and converges robustly to the Pareto-optimal state at (0, 0, 1, 0, 0, 1) (Taxation and Subsidy, Green Production with Blockchain).

5.2. Numerical Simulation

To solve the replicator dynamic system and verify the Evolutionary Stable Strategies (ESS) derived in Section 5.1, we utilize MATLAB to simulate the dynamic trajectories. It should be noted that since both the government and the supply chain populations select from three strategic options, the complete phase space of this asymmetric game is mathematically four-dimensional (4D), as each population possesses two independent degrees of freedom. However, for the purpose of visual clarity and to overcome the interpretational barriers of higher-dimensional spaces, we employ three-dimensional (3D) phase portraits to illustrate the evolutionary paths within a specific projection subspace.
In this visualization, we define the explicit 3D coordinate axes as x (the probability of government choosing “Taxation and Subsidy”), y (the probability of the supply chain choosing “Green Production exclusively”), and z (the probability of the supply chain choosing “Green Production with Blockchain”). Although these axes represent a projection of the full 4D system, they effectively capture the core strategic transitions and the convergence behavior toward the ESS. This approach allows us to intuitively map the dense mathematical stability conditions from Table 4 onto observable “basins of attraction” within the designated 3D space.
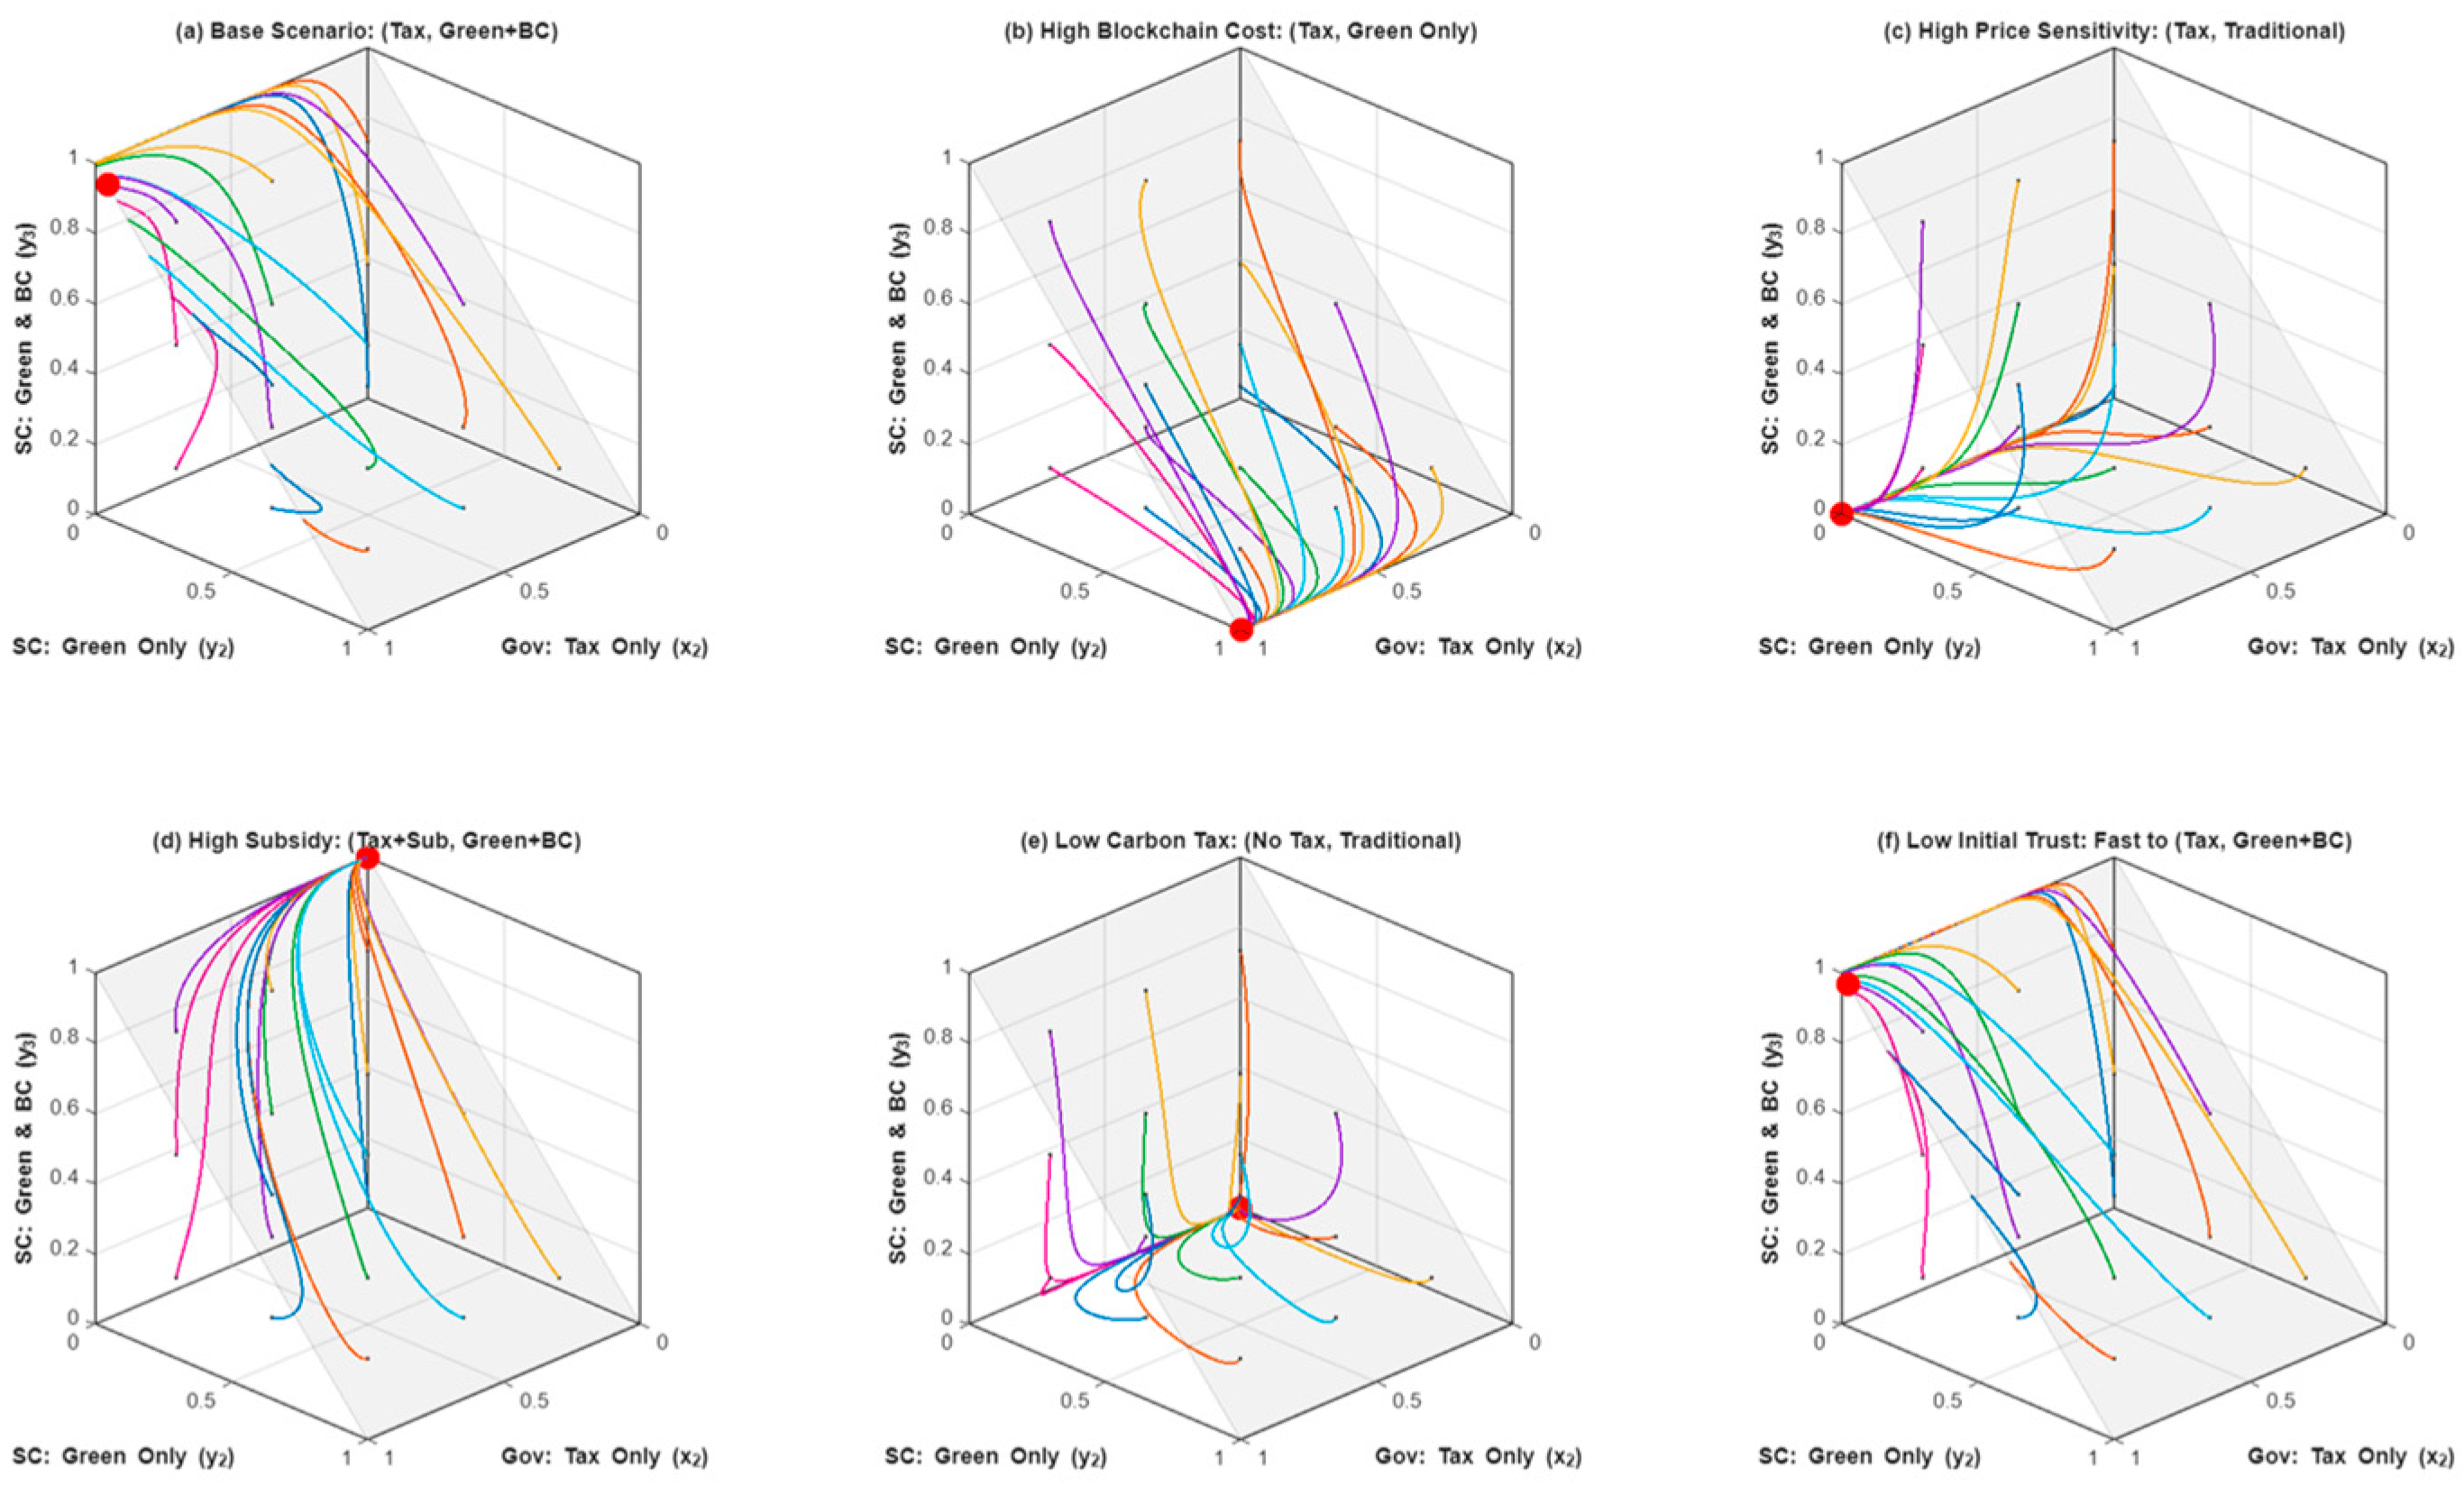
Figure 5a–f illustrate the 3D evolutionary trajectories under diverse parametric scenarios. The colored streamlines represent the dynamic paths starting from various initial probabilities, while the solid red dots denote the final ESS. This visualized mapping enables a direct observation of how parameter thresholds—such as implementation costs and policy intensities—physically alter the system’s convergence.
In Figure 5a,f, the government’s “Taxation” and the supply chain’s “Green Production with Blockchain” exhibit absolute dominance over conventional strategies. All trajectories converge smoothly toward the equilibrium point 1 , 0 , 0 , 0 , 0 , 1 . Comparing the two figures reveals a dynamic confirmation of the Stackelberg results from Section 3: as initial consumer trust decreases, the rate of convergence toward the ESS accelerates significantly. This dynamically illustrates that in markets suffering from severe “greenwashing” skepticism, the marginal “trust dividend” of blockchain is maximized, strongly incentivizing the supply chain to adopt traceability technologies to bridge the information asymmetry.
Figure 5b,c visualize the exact boundary conditions that lead to system degradation, perfectly mirroring the static mathematical constraints derived in Proposition 4 and Section 4.4. Figure 5b highlights the systemic collapse when blockchain implementation costs cross the Feasibility Threshold ( C b f ¯ ). As theoretically predicted in Section 3, when costs become prohibitive, the third strategy (“Green Production with Blockchain”) loses its basin of attraction. To avoid severe financial risk, the supply chain is forced into a corner solution, stabilizing at “Green Production” 1 , 0 , 0 , 0 , 1 , 0 . Furthermore, Figure 5c demonstrates the dynamic impact of highly price-sensitive markets (analogous to Scenario A in Section 4.4). Extreme price sensitivity mathematically compresses the feasible cost space, rendering the green premium unviable. Consequently, the system completely collapses into the “death zone,” stabilizing at “conventional production” 1 , 0 , 0 , 1 , 0 , 0 .
Figure 5d demonstrates the powerful guiding effect of government intervention, directly verifying the robustness analysis of Scenario B. When targeted subsidies are high, the government’s long-term strategy shifts to “Taxation with Subsidy,” effectively neutralizing the threshold-compressing effect of technological costs. As a result, the supply chain robustly converges toward blockchain-enabled green production 0 , 0 , 1 , 0 , 0 , 1 . This proves that while upfront subsidies temporarily increase fiscal burdens, they are an indispensable structural tool for overcoming the enterprise’s cost concerns and pushing the system past the Empowerment Threshold ( C b e ¯ ).
Conversely, Figure 5e reveals the systemic backlash of failed punitive mechanisms. If the carbon tax is set too low to reflect the true environmental cost, the government’s regulatory strategies lose support, reverting to laissez-faire (“Neither tax nor subsidy”). Lacking external constraints, all trajectories collapse to the origin (“Conventional Production”). However, raising environmental carbon taxes alone—as shown in the transition dynamics—does not guarantee blockchain adoption. Imposing a stringent carbon tax (e.g., matching the high EU ETS allowance prices) without complementary subsidies merely compresses the profit margin. This forces the system into a suboptimal equilibrium or “shallow green” trap: manufacturers adopt basic green production to evade taxes but reject blockchain traceability to survive the financial squeeze, leaving the fundamental issue of information asymmetry unresolved.
Ultimately, these evolutionary trajectories strongly align with real-world industry observations. Policymakers must recognize that punitive measures (carbon taxes) only establish a baseline for compliance. To shatter the “digitalization ceiling,” upfront subsidy incentives are strictly required. Based on the stability conditions in Table 4, “Taxation with Subsidy” serves as a crucial transitional ESS during the early stages of industrial change. However, as blockchain infrastructure matures and the endogenous green premium naturally offsets operational costs, policy must be dynamically calibrated. Governments must gradually phase out subsidies to prevent policy arbitrage (e.g., subsidy fraud) and excess fiscal strain, smoothly transitioning the system toward the single-taxation regime (“Taxation”, “Green Production with Blockchain”) as technology adoption solidifies.

6. Conclusions

This study develops a green supply chain model integrating Stackelberg and evolutionary game theories to investigate the dynamic interactions among multi-dimensional consumer preferences, blockchain implementation costs, and government interventions. Moving beyond the qualitative consensus on blockchain’s “trust dividend,” our analytical framework establishes strict operational boundaries for its strategic viability. Specifically, we demonstrate that the efficacy of blockchain adoption is governed by a two-stage structural deterioration dictated by two closed-form boundaries: the Empowerment Threshold and the Feasibility Threshold. Blockchain maximizes the perceived value of product greenness only when the unit implementation cost is strictly maintained below the Empowerment Threshold. Once the cost exceeds this critical node, the exorbitant technological overhead cannibalizes the green production budget, triggering a “budget crowding-out effect.” Ultimately, if the cost breaches the absolute survival boundary, the manufacturer is analytically driven to abandon substantive green investments entirely.
Furthermore, our comparative statics reveal that these structural thresholds are highly sensitive to market heterogeneity and external regulatory pressures. Analytically, the Feasibility Threshold is strictly negatively correlated with both consumer price sensitivity and the environmental carbon tax rate. In highly price-sensitive market segments, this property translates into a severe compression of the feasible cost space for technological adoption. Consequently, forcing blockchain integration in lower-tier markets without extreme cost minimization invariably backfires, prematurely pushing the supply chain into a “death zone” where the financial margin cannot sustain both digital traceability and physical sustainability.
From a regulatory perspective, the evolutionary game analysis exposes the inherent limitations of isolated punitive mechanisms. Relying exclusively on stringent carbon taxation inherently shrinks the feasibility threshold, trapping the supply chain in a suboptimal equilibrium of “shallow greening”—where manufacturers maintain basic environmental compliance to evade taxes but reject digital traceability. To steer the system toward the Pareto-optimal Evolutionary Stable Strategy (ESS) of synergistic digital-green transformation, the government must deploy a composite policy framework. Targeted subsidies are structurally required to neutralize the threshold-compressing effect of taxation, thereby expanding the feasible operational region and absorbing the technological risk exposure.
Finally, our evolutionary dynamics demonstrate that the system exhibits strong path dependence, necessitating dynamic policy calibration. During the nascent stages of industrial transformation—characterized by severe initial consumer distrust and high implementation barriers—aggressive bidirectional interventions (coupled taxation and subsidies) are indispensable to jolt the system out of the conventional production equilibrium. However, as the blockchain infrastructure matures and the endogenous green premium successfully offsets implementation costs, this transitional composite ESS must be dynamically phased out. Policymakers should eventually converge toward a single-taxation regime to prevent corporate policy arbitrage and alleviate long-term public financial burdens.

7. Management Implications

7.1. Managerial Implications for Supply Chain Enterprises

First, supply chain managers must recognize that the indiscriminate adoption of blockchain technology does not invariably bolster market competitiveness. When consumer price sensitivity is high, or implementation costs are prohibitive, the incremental expenses associated with blockchain cannot be recovered, potentially diminishing the products’ actual greenness. Consequently, firms must rigorously manage technological expenditures and explore cost-reduction opportunities through collaborative strategies, such as joint procurement.
Second, enterprises should avoid strategic indecision between fostering consumer trust (via blockchain adoption) and intensifying green investments. In market segments characterized by low initial trust but high green sensitivity, implementing blockchain can significantly enhance product greenness and stimulate authentic demand. Conversely, in price-sensitive “lower-tier” markets where affordability is the primary driver of consumer behavior, firms should defer blockchain adoption and prioritize maintaining price competitiveness.

7.2. Policy Implications for the Government

First, at the beginning of the move toward digital and green industries, the government should not only raise carbon taxes to force green production, but also invest in green infrastructure. Just using penalties can cause negative effects for companies. Instead, the government should use policies such as funding research or granting grants for blockchain use to help address the high start-up costs.
Second, while governmental subsidies can effectively elevate product greenness and mitigate implementation costs, neither singular taxation nor indefinite subsidization can ensure the long-term sustainability of green production. Policymakers must accurately assess enterprises’ fiscal resilience to taxation. Once consumer green trust has matured and an endogenous market premium mechanism has been established, the government should implement a gradual policy retrogression. This strategic withdrawal facilitates a dynamic transition from a policy-driven to a market-driven evolutionary equilibrium.

8. Limitations and Future Research

While this study establishes the analytical boundaries of blockchain adoption, several idealized assumptions limit its immediate generalizability. First, extending our dyadic model to incorporate horizontal market competition and physical capacity constraints would reveal how competitive pressures and resource scarcity interact with the “budget crowding-out effect.” Second, relaxing the assumption of perfect post-blockchain transparency to account for the “oracle problem”—where fraudulent data may enter the digital ledger—would provide a more realistic evaluation of the Empowerment Threshold. Finally, exploring these structural dynamics within stochastic market environments and multi-period games remains a critical direction for future sustainable supply chain research.

Author Contributions

Conceptualization, C.L.; methodology, R.Z.; validation, C.L.; formal analysis, R.Z.; writing—original draft preparation, R.Z.; visualization, R.Z. All authors have read and agreed to the published version of the manuscript.

Funding

This research received no external funding.

Institutional Review Board Statement

Not applicable.

Informed Consent Statement

Not applicable.

Data Availability Statement

Data is contained within the article. The original contributions presented in this study are included in the article. Further inquiries can be directed to the corresponding author.

Conflicts of Interest

The authors declare no conflicts of interest.

Appendix A. Mathematical Proofs of Each Proposition

Proof of Proposition 1.
  • By solving the joint first-order conditions d π m N d w N = 0 and d π m N d g N = 0 . H = β 1 τ θ γ θ 1 τ 2 γ θ 1 τ 2 1
It can be obtained through conversion that, when 4 β 1 τ γ 2 1 τ 2 θ 3 > 0 , π m N is a strictly jointly concave function with respect to w N and g N , and the manufacturer’s profit has a maximum value. This completes the proof.
Differentiating π m N with respect to w N and g N , the Hessian matrix of π m N with respect to w N and g N is obtained as:
Since the second-order derivative d 2 π R N d p N 2 = 2 β θ < 0 , the retailer’s profit π R N is strictly concave with respect to the retail price p N . By equating the first-order condition (FOC) to zero, i.e., d π R N d p N = 0 , we obtain the retailer’s best-response function for the retail price: p N = θ 1 + γ θ g N + β w N 2 β . Anticipating the retailer’s best response, the manufacturer then optimizes its wholesale price and green investment level. □
Proof of Proposition 2.
(1)
  w N β < 0 ,   p N β < 0 ,   D N β < 0 ,   π m N β < 0 ,   π R N β < 0
(2)
  w N θ > 0 ,   p N θ > 0 ,   D N θ > 0 ,   π m N θ > 0 ,   π R N θ > 0
Proof of Proposition 3.
  • The proof procedure for Proposition 3 is strictly analogous to that of Proposition 1; hence, it is omitted here for brevity. □
Proof of Proposition 4.
  • To simplify the algebraic expressions, we denote the strictly positive denominators of the optimal greenness in the traditional and blockchain models as A N = 4 β γ 2 1 τ θ 3 > 0 and A B = 4 β 1 s γ 2 1 τ > 0 , respectively. The greenness functions can thus be rewritten as:
    g N = γ 1 τ θ 2 A N ,   g B = γ 1 τ β C b 2 τ A B
First, we determine the Feasibility Threshold ( C b f ¯ ) by setting the manufacturer’s green investment in the blockchain mode to zero ( g B = 0 ).
1 τ β C b f ¯ 2 τ = 0
From this, it can be concluded that, C b f ¯ = 1 τ β 2 τ .
For any C b ¯ C b f ¯ , the technological cost exceeds the margin tolerance, leading to g B = 0 .
Second, we determine the Empowerment Threshold ( C b e ¯ ) by evaluating the condition where blockchain adoption yields no comparative green advantage, i.e., g B = g N :
γ 1 τ β C b e 2 τ A B = γ 1 τ θ 2 A N
Isolating the C b e ¯ term yields:
1 τ β C b e ¯ 2 τ = A B A N 1 τ θ 2
β C b e ¯ 2 τ = 1 τ A B A N 1 τ θ 2 = 1 τ 1 A B A N θ 2
C b e ¯ = 1 τ β 2 τ 1 A B A N θ 2
By substituting the above equations, we uncover the structural relationship between the two thresholds:
C b e ¯ = C b f ¯ × 1 A B A N θ 2
Given the feasible parameter regions where consumer trust θ 0 , 1 and the ratio of denominators A B A N > 0 , the multiplier 1 A B A N θ 2 is strictly less than 1. Therefore, the inequality C b e ¯ < C b f ¯ holds strictly.
Proof of Corollary 1.
  • Take the first-order partial derivatives of the critical threshold with respect to the consumer price sensitivity and the tax rate respectively, and the derivation process is as follows:
    C b f ¯ β = 1 τ β 2 ( 2 τ ) < 0 C b f ¯ τ = β ( 2 τ ) ( 1 τ ) ( β ) [ β ( 2 τ ) ] 2 = β β 2 ( 2 τ ) 2 < 0
From the above fact that the partial derivatives are always less than 0, it follows that the critical threshold C b f ¯ decreases strictly monotonically with the increase of β and τ . This completes the proof. □
Proof of Proposition 5.
  • To simplify the expression, define the optimal greenness denominators of the traditional model and the blockchain model as respectively A N = 4 β γ 2 1 τ θ 3 > 0 and A B = 4 β 1 s γ 2 1 τ > 0 , and the numerator is defined as N B = 1 τ C b β 2 τ > 0 .
(i)
For consumer trust level θ :
Since the system assumes that the trust level rises to an absolute value ( θ = 1 ) after adopting blockchain, it follows that g B θ = 0 . Taking the first-order partial derivative of g N yields:
g N θ = 2 γ 1 τ θ A N γ 1 τ θ 2 3 γ 2 1 τ θ 2 A N 2 = γ 1 τ θ 8 β + γ 2 1 τ θ 3 A N 2 > 0
Therefore, the partial derivative of the difference term is a strictly negative value:
(ii)
For consumer price sensitivity: Take the partial derivatives of the difference terms, respectively:
Δ g θ = g B θ g N θ = 0 g N θ < 0
Taking the difference between the two yields the partial derivative function of the difference term:
Δ g β = γ 1 τ 4 θ 2 A N 2 4 1 s γ 2 C b 2 τ A B 2
(iii)
For the consumer green sensitivity γ :
Similarly, take the partial derivatives with respect to γ respectively:
g N γ = ( 1 τ ) θ 2 [ 4 β + γ 2 ( 1 τ ) θ 3 ] A N 2 > 0 g B γ = N B [ 4 β ( 1 s ) + γ 2 ( 1 τ ) ] A B 2 > 0
The partial derivative of the difference item is:
Δ g γ = N B 4 β 1 s + γ 2 1 τ A B 2 1 τ θ 2 4 β + γ 2 1 τ θ 3 A N 2
(iv)
For the government subsidy rate s :
Since the traditional model does not receive subsidies for blockchain research and development or operations, g N is independent of s , so g N s = 0 . Take the derivative of g B with respect to s :
g B s = 0 · A B γ N B · 4 β A B 2 = 4 β γ N B A B 2 > 0
Therefore, the partial derivative of the difference term is strictly positive:
Δ g s = g B s 0 = 4 β γ N B A B 2 > 0
(v)
For the environmental carbon tax rate τ :
Take the partial derivative of g N with respect to τ :
g N τ = γ θ 2 A N γ 1 τ θ 2 · γ 2 θ 3 A N 2 = 4 β γ θ 2 A N 2 < 0
Take the partial derivative of g B with respect to τ . Since the numerator N B = 1 τ β C b 2 τ = 1 2 β C b τ 1 β C b , it follows that N B τ = 1 β C b . From the feasible region condition N B > 0 , we can derive 1 τ > β C b 2 τ , and further obtain 1 > β C b . Therefore:
g B τ = γ 1 β C b A B γ N B · γ 2 A B 2 = γ 1 β C b A B + γ 2 N B A B 2 < 0
The partial derivative of the difference term is:
Δ g τ = 4 β γ θ 2 A N 2 γ 1 β C b A B + γ 2 N B A B 2
This completes the proof. □
Proof of Proposition 6.
For solving the mixed strategy equilibrium, for example, where
x 1 = 2 ( π s c 3 π s c 1 ) 2 τ ( w N D N w B D B ) + g B 2 s y 1 = 2 w B D B τ g B 2 s 2 τ ( w B D B w N D N ) g B 2 s
The underlying logic of its solution is as follows: when the government engages in a mixed-strategy game between the first strategy (no taxation and no subsidies) and the third strategy (taxation plus subsidies), and the supply chain engages in a mixed-strategy game between the first strategy (traditional production) and the third strategy (green production with blockchain adoption), the expected payoffs of the participants choosing different strategies must be strictly equal. □
The premise assumes that the system is in the state where and. At this time, and must be satisfied. According to the payoff matrix in Table 1, substituting yields the specific expected payoff equation:
Government revenue equation:
1 y 1 H 2 = y 1 w N D N τ + 1 y 1 H 2 + w B D B τ g B 2 2 s
Supply Chain Profit Equation:
x 1 π s c 1 + w N D N τ + 1 x 1 π s c 1 = x 1 π s c 3 + w B D B τ g B 2 2 s + 1 x 1 π s c 3
By simultaneously establishing and solving the above system of equations, the specific expressions for the equilibrium probabilities x 1 * and y 1 * under the mixed strategy can be obtained.
The coordinates of the four equilibrium points of the hybrid strategy are:
x 11 = 2 ( π s c 3 π s c 1 ) 2 τ ( w N D N w B D B )   +   g B 2 s ,   y 11 2 w B D B τ g B 2 s 2 τ ( w B D B w N D N )   +   g B 2 s ,   x 12 = 2 ( π s c 3 π s c 2 ) 2 τ ( w N D N w B D B )   +   g B 2 s ,   y 22 = 2 w B D B τ g B 2 s 2 τ ( w B D B w N D N )   +   g B 2 s ,   x 13 = 2 ( π s c 1 π s c 3 )   +   g B 2 s 2 τ ( w N D N w B D B ) ,   y 23 = w B D B w B D B w N D N x 14 = 2 ( π s c 1 π s c 3 )   +   g B 2 s 2 τ ( w N D N w B D B ) ,   y 14 = w B D B w B D B w N D N
Proof of Proposition 8.
  • According to the evolutionary game stability criterion proposed by Friedman, the sufficient and necessary condition for an equilibrium point to become an Evolutionarily Stable Strategy (ESS) of the system is that all eigenvalues of its Jacobian matrix are strictly negative.
(1)
For Case (1):
When the government provides no subsidies ( s = 0 ) and the on-chain cost C b of blockchain is extremely high.
Suppose the system attempts to converge to  0 , 1 , 0 , 0 , 0 , 1  (i.e., x 2 = 1 , y 3 = 1 ). At this point, the government adopts a strategy of “taxation only”. For the supply chain, the payoff of choosing “green production with blockchain adoption” is π s c 3 , and the payoff of choosing “green production only” is π s c 2 . Since C b is extremely large, the cost of technology introduction directly causes a reversal in the net profit of the supply chain, such that π s c 3 < π s c 2 .
In the replicator dynamic equation, this implies that the fitness of strategy y 3 is strictly lower than that of y 2 . At this time, the eigenvalue corresponding to the y 2 direction in the Jacobian matrix changes from negative to positive, and 0 , 1 , 0 , 0 , 0 , 1 degenerates into an unstable saddle point. To avoid the high on-chain cost, the supply chain will unilaterally deviate from strategy y 3 and shift toward y 2 . Under the rigid constraint of the high carbon tax τ imposed by the government, traditional production y 1 is always eliminated. Consequently, the system trajectory will eventually fall into and be locked at the suboptimal local equilibrium point 0 , 1 , 0 , 0 , 1 , 0 , thus falling into a state of “green compromise”.
(2)
For Case (2):
When the condition s g B 2 > 2 D B τ w B 2 D N τ w N + 2 Π S C 2 2 Π S C 3 is satisfied.
Consider the target pure-strategy node 0 , 0 , 1 , 0 , 0 , 1  (i.e., x 3 = 1 , y 3 = 1 ). For this point to be an ESS, the expected payoff of the supply chain choosing y 3 must be strictly greater than those of choosing y 1 and y 2 , and the expected payoff of the government choosing x 3 must also be stable.
By rearranging and simplifying the above inequality, we obtain:
1 2 s g B 2 + Π S C 3 Π S C 2 > τ D B w B D N w N
The economic essence of this inequality is as follows: The special green blockchain subsidy provided by the government ( 1 2 s g B 2 ) plus the incremental market profits brought by the blockchain ( Π S C 3 Π S C 2 ) is absolutely greater than the potential crowding-out risk caused by tax and price changes.
When this condition is satisfied, it can be known from the stability judgment conditions in Table 3 that the eigenvalues of the Jacobian matrix corresponding to this point are all forced to be suppressed to negative numbers (that is, the trace t r J < 0 and the determinant d e t J > 0 are strictly satisfied). At this time, as a strong external potential energy, the government’s subsidy completely hedges the initial exposure of the supply chain in adopting new technologies, and changes the topological structure of the system and the gravitational field of the phase diagram. Therefore, all evolutionary streamlines in the space will cross the saddle point of the internal mixed strategy, eliminate other strategies with absolute evolutionary disadvantages, and strongly converge to the Pareto optimal state of 0 , 0 , 1 , 0 , 0 , 1 . This completes the proof. □

References

  1. Asgari, E.; Hammami, R.; Frein, Y.; Nouira, I. The effect of greenness-and price-based competition on a product’s environmental performance. Int. J. Prod. Econ. 2021, 234, 108062. [Google Scholar] [CrossRef]
  2. Wang, D.; Dong, H.; Zhang, K. Differential Game of Dynamic Low-Carbon Supply Chain Driven by Block-Chain Technology and Considering Enthusiasm for Emission Reduction. J. Syst. Sci. Math. Sci. 2024, 44, 1412–1431. [Google Scholar] [CrossRef]
  3. Baksi, S.; Bose, P. Credence Goods, Efficient Labelling Policies, and Regulatory Enforcement. Environ. Resour. Econ. 2007, 37, 411–430. [Google Scholar] [CrossRef]
  4. European Commission. Screening of Websites for ‘Greenwashing’: Half of Green Claims Lack Evidence. Available online: https://ec.europa.eu/commission/presscorner/detail/en/ip_21_269 (accessed on 5 May 2026).
  5. Leonidou, C.N.; Skarmeas, D. Gray Shades of Green: Causes and Consequences of Green Skepticism. J. Bus. Ethics 2017, 144, 401–415. [Google Scholar] [CrossRef]
  6. Yang, D.; Yu, Y.; Feng, Z. Ecolabel Selection Strategy of Environmentally Responsible Manufacturer with Consumer Skepticism Behavior. Chin. J. Manag. Sci. 2023, 31, 73–82. [Google Scholar] [CrossRef]
  7. Changing Markets Foundation. Synthetics Anonymous: Fashion Brands’ Addiction to Fossil Fuels. Available online: https://changingmarkets.org/report/synthetics-anonymous-fashion-brands-addiction-to-fossil-fuels/ (accessed on 5 May 2026).
  8. Eaton, C. Throwing Away the Future: How Companies Still Have It Wrong on Plastic Pollution “Solutions”. Available online: https://www.greenpeace.org/usa/how-companies-still-have-it-wrong-on-plastic-pollution-solutions/ (accessed on 5 May 2026).
  9. JD Digits. 2020 JD Blockchain Technology Practice White Paper. Available online: https://jdcorporateblog.com/wp-content/uploads/2020/10/2020%E4%BA%AC%E4%B8%9C%E5%8C%BA%E5%9D%97%E9%93%BE%E6%8A%80%E6%9C%AF%E5%AE%9E%E8%B7%B5%E7%99%BD%E7%9A%AE%E4%B9%A6.pdf (accessed on 5 May 2026).
  10. Cao, C.; He, Y.; Liu, Y.; Huang, H.; Zhang, F. Blockchain technology adoption mechanism for semiconductor chip supply chains considering information disclosure under cost-sharing contract. Int. J. Prod. Econ. 2025, 282, 109496. [Google Scholar] [CrossRef]
  11. Saberi, S.; Kouhizadeh, M.; Sarkis, J.; Shen, L. Blockchain technology and its relationships to sustainable supply chain management. Int. J. Prod. Res. 2019, 57, 2117–2135. [Google Scholar] [CrossRef]
  12. Liu, K.; Song, H. Contract and incentive mechanism in low-carbon R&D cooperation. Supply Chain Manag. Int. J. 2017, 22, 270–283. [Google Scholar] [CrossRef]
  13. Sarabi, M.A.; Taleizadeh, A.A.; Bhattacharya, A. Towards blockchain-enabled circular closed-loop supply chain and impact of consumers’ distrust in price, product greenness sensitivity and carbon tax and subsidy. Eur. J. Oper. Res. 2025, 328, 105–121. [Google Scholar] [CrossRef]
  14. Li, Q.; Ma, M.; Shi, T.; Zhu, C. Green investment in a sustainable supply chain: The role of blockchain and fairness. Transp. Res. Part E Logist. Transp. Rev. 2022, 167, 102908. [Google Scholar] [CrossRef]
  15. Sun, G.; Xu, D.; Hu, X. Digital Innovation and Supply Chain Financing in China. Digital 2026, 6, 12. [Google Scholar] [CrossRef]
  16. Naoum-Sawaya, J.; Elhedhli, S.; De Carvalho, P. Strategic blockchain adoption to deter deceptive counterfeiters. Eur. J. Oper. Res. 2023, 311, 373–386. [Google Scholar] [CrossRef]
  17. Choi, T.-M. Blockchain-technology-supported platforms for diamond authentication and certification in luxury supply chains. Transp. Res. Part E Logist. Transp. Rev. 2019, 128, 17–29. [Google Scholar] [CrossRef]
  18. Fang, C.; Chi, M.; Fan, S.; Choi, T.-M. Who should invest in blockchain technology under different pricing models in supply chains? Eur. J. Oper. Res. 2024, 319, 777–792. [Google Scholar] [CrossRef]
  19. Pun, H.; Swaminathan, J.M.; Chen, J.J. Application of blockchain in the secondary market with counterfeiting. Transp. Res. Part E Logist. Transp. Rev. 2025, 197, 104079. [Google Scholar] [CrossRef]
  20. Awasthy, P.; Haldar, T.; Ghosh, D. Blockchain enabled traceability—An analysis of pricing and traceability effort decisions in supply chains. Eur. J. Oper. Res. 2025, 321, 760–774. [Google Scholar] [CrossRef]
  21. Liu, L.; Li, F.; Qi, E. Research on risk avoidance and coordination of supply chain subject based on blockchain technology. Sustainability 2019, 11, 2182. [Google Scholar] [CrossRef]
  22. Babich, V.; Hilary, G. OM Forum—Distributed ledgers and operations: What operations management researchers should know about blockchain technology. Manuf. Serv. Oper. Manag. 2020, 22, 223–240. [Google Scholar] [CrossRef]
  23. Xu, X.; He, P.; Zhou, L.; Cheng, T. Coordination of a platform-based supply chain in the marketplace or reselling mode considering cross-channel effect and blockchain technology. Eur. J. Oper. Res. 2023, 309, 170–187. [Google Scholar] [CrossRef]
  24. Shen, X.; Dai, L. Coordination of Blockchain Adoption and Sales Mode for Green Products. Chin. J. Manag. Sci. 2024; early access. [CrossRef]
  25. Wei, G.; Yang, C.; Li, X. Selection Strategies of Low-Carbon E-CLSC Sales Mode Under the Introduction of Blockchain Technology. J. Syst. Sci. Math. Sci. 2025, 45, 3047–3075. [Google Scholar] [CrossRef]
  26. Zhang, L.; Wang, F.; Liu, X. Research on Emission Reduction Decision-Making of Dual-Product Low-Carbon Supply Chain Under Carbon Trading and Blockchain Technology. J. Ind. Eng. Eng. Manag. 2025, 39, 239–250. [Google Scholar] [CrossRef]
  27. Biswas, D.; Jalali, H.; Ansaripoor, A.H.; De Giovanni, P. Traceability vs. sustainability in supply chains: The implications of blockchain. Eur. J. Oper. Res. 2023, 305, 128–147. [Google Scholar] [CrossRef]
  28. Cao, Y.; Yi, C.; Wan, G.; Hu, H.; Li, Q.; Wang, S. An analysis on the role of blockchain-based platforms in agricultural supply chains. Transp. Res. Part E Logist. Transp. Rev. 2022, 163, 102731. [Google Scholar] [CrossRef]
  29. Cheng, F.; Chen, T.; Shen, Y.; Jing, X. Impact of green technology improvement and store brand introduction on the sales mode selection. Int. J. Prod. Econ. 2022, 253, 108587. [Google Scholar] [CrossRef]
  30. Guo, X.; Cheng, L.; Liu, J. Green supply chain contracts with eco-labels issued by the sales platform: Profitability and environmental implications. Int. J. Prod. Res. 2020, 58, 1485–1504. [Google Scholar] [CrossRef]
  31. Zhang, C.-T.; Liu, L.-P. Research on coordination mechanism in three-level green supply chain under non-cooperative game. Appl. Math. Model. 2013, 37, 3369–3379. [Google Scholar] [CrossRef]
  32. Song, H.; Gao, X. Green supply chain game model and analysis under revenue-sharing contract. J. Clean. Prod. 2018, 170, 183–192. [Google Scholar] [CrossRef]
  33. Jiang, S.; Li, S. Green Supply Chain Game Models and Revenue Sharing Contract with Product Green Degree. Chin. J. Manag. Sci. 2015, 23, 169–176. [Google Scholar] [CrossRef]
  34. Xie, G.; Wang, S.; Lai, K.K. Quality improvement in competing supply chains. Int. J. Prod. Econ. 2011, 134, 262–270. [Google Scholar] [CrossRef]
  35. Liu, Z.L.; Anderson, T.D.; Cruz, J.M. Consumer environmental awareness and competition in two-stage supply chains. Eur. J. Oper. Res. 2012, 218, 602–613. [Google Scholar] [CrossRef]
  36. Hafezalkotob, A. Competition, cooperation, and coopetition of green supply chains under regulations on energy saving levels. Transp. Res. Part E Logist. Transp. Rev. 2017, 97, 228–250. [Google Scholar] [CrossRef]
  37. Xiong, F.; Wei, Y.; Wang, Q.; Li, Z.; Shao, L. Study on Pricing and Green Input Decision of Dual-channel Green Supply Chain Based on Risk Aversion of Members. Chin. J. Manag. Sci. 2022, 30, 267–276. [Google Scholar] [CrossRef]
  38. Malladi, K.T.; Sowlati, T. Impact of carbon pricing policies on the cost and emission of the biomass supply chain: Optimization models and a case study. Appl. Energy 2020, 267, 115069. [Google Scholar] [CrossRef]
  39. Chen, W.; Hu, Z.-H. Using evolutionary game theory to study governments and manufacturers’ behavioral strategies under various carbon taxes and subsidies. J. Clean. Prod. 2018, 201, 123–141. [Google Scholar] [CrossRef]
  40. Choi, T.-M.; Luo, S. Data quality challenges for sustainable fashion supply chain operations in emerging markets: Roles of blockchain, government sponsors and environment taxes. Transp. Res. Part E Logist. Transp. Rev. 2019, 131, 139–152. [Google Scholar] [CrossRef]
  41. Liu, Z.; Yang, T.; Xia, X.; Hu, B. Research on the introduction strategy of blockchain considering consumer demand under carbon tax policy. Chin. J. Manag. Sci. 2026; early access. [CrossRef]
  42. Miao, Z.; Mao, H.; Fu, K.; Wang, Y. Remanufacturing with trade-ins under carbon regulations. Comput. Oper. Res. 2018, 89, 253–268. [Google Scholar] [CrossRef]
  43. Zhang, N.; Zhang, Z. Manufacturer or retailer? The optimal remanufacturing channel choice under carbon tax policy. J. Ind. Manag. Optim. 2025, 21, 3362–3392. [Google Scholar] [CrossRef]
  44. Yang, D.; Xiao, T. Pricing and green level decisions of a green supply chain with governmental interventions under fuzzy uncertainties. J. Clean. Prod. 2017, 149, 1174–1187. [Google Scholar] [CrossRef]
  45. Cao, Y.; Xun, J.; Li, Q. A Comparative Study of Green Efforts in Supply Chain Based on Different Government Subsidy Strategies. Oper. Res. Manag. Sci. 2020, 29, 108–118. Available online: https://kns.cnki.net/kcms2/article/abstract?v=iO0L29morZl_yIRrUM4Vb_zaAybwHF27trHa1gCzLUv7c0mfYkEFtN-9jklobF6qZ-Z3q-TibIqDWVwuHFqoisEyTmf2bjTdI9ecY7p2jtcaKp6-iKiRAvvForl2T70BJEx-GhVnSFITiZCUtWNZrJH65YhxN23zZrlTOkFrh_aRn12yGkYdiqEFptYta18g&uniplatform=NZKPT&language=CHS (accessed on 5 May 2026).
  46. Wen, X.; Cheng, H.; Cai, J.; Lu, C. Government Subside Policies and Effect Analysis in Green Supply Chain. Chin. J. Manag. Sci. 2018, 15, 625–632. [Google Scholar] [CrossRef]
  47. Feng, Y.; Wang, M.; Zhang, Y.; Feng, C. The government subsidy mechanism in a green supply chain with the manufacturer assuming social responsibility. J. Ind. Eng./Eng. Manag. 2022, 36, 156–167. [Google Scholar] [CrossRef]
  48. Chen, S.; Su, J.; Wu, Y.; Zhou, F. Optimal production and subsidy rate considering dynamic consumer green perception under different government subsidy orientations. Comput. Ind. Eng. 2022, 168, 108073. [Google Scholar] [CrossRef]
  49. Zeng, Y.; Sheng, L.; Wu, J. Construction and Optimization of Green Closed-loop Supply Chain Based on Government Subsidies. Math. Pract. Theory 2023, 53, 26–36. [Google Scholar] [CrossRef]
  50. Singh, P. Measuring the Broader Value Proposition of Digital Transformation in Supply Chains. Int. J. Supply Chain Manag. 2024, 13, 16–24. [Google Scholar] [CrossRef]
  51. Wang, H. Supply Chain Digital Integration and Operational Resilience: An Empirical Study Based on Matched Data Between Manufacturing and Logistics Firms in Central and Eastern Europe. Int. Sci. Tech. Econ. Res. 2026, 4, 23–46. [Google Scholar] [CrossRef]
  52. Liu, P.; Long, Y.; Song, H.-C.; He, Y.-D. Investment decision and coordination of green agri-food supply chain considering information service based on blockchain and big data. J. Clean. Prod. 2020, 277, 123646. [Google Scholar] [CrossRef]
  53. Li, J.; Li, Y.; Liu, L.; Xue, K. Mechanism decisions to encourage product eco-design implemented by green supply chain enterprises. Syst. Eng.-Theory Pract. 2019, 39, 2287–2299. [Google Scholar] [CrossRef]
  54. Gleim, M.R.; Smith, J.S.; Andrews, D.; Cronin, J.J. Against the Green: A Multi-method Examination of the Barriers to Green Consumption. J. Retail. 2013, 89, 44–61. [Google Scholar] [CrossRef]
  55. Deselnicu, O.C.; Costanigro, M.; Souza-Monteiro, D.M.; McFadden, D.T. A Meta-Analysis of Geographical Indication Food Valuation Studies: What Drives the Premium for Origin-Based Labels? J. Agric. Resour. Econ. 2013, 38, 204–219. [Google Scholar]
  56. Song, Y.; Liu, J.; Zhang, W.; Li, J. Blockchain’s role in e-commerce sellers’ decision-making on information disclosure under competition. Ann. Oper. Res. 2023, 329, 1009–1048. [Google Scholar] [CrossRef]
  57. Tian, L.; Vakharia, A.J.; Tan, Y.; Xu, Y. Marketplace, Reseller, or Hybrid: Strategic Analysis of an Emerging E-Commerce Model. Prod. Oper. Manag. 2018, 27, 1595–1610. [Google Scholar] [CrossRef]
  58. Ghosh, D.; Shah, J. A comparative analysis of greening policies across supply chain structures. Int. J. Prod. Econ. 2012, 135, 568–583. [Google Scholar] [CrossRef]
  59. Wu, L.; Wang, H.; Zhu, D.; Hu, W.; Wang, S. Chinese consumers’ willingness to pay for pork traceability information—The case of Wuxi. Agric. Econ. 2016, 47, 71–79. [Google Scholar] [CrossRef]
  60. Niu, B.; Dong, J.; Liu, Y. Incentive alignment for blockchain adoption in medicine supply chains. Transp. Res. Part E Logist. Transp. Rev. 2021, 152, 102276. [Google Scholar] [CrossRef]
  61. Shen, T.; Cai, Y.; Liu, L. Green supply chain with strategic retailers: Transportation-based carbon penalty. Energy Econ. 2025, 145, 108411. [Google Scholar] [CrossRef]
  62. Krass, D.; Nedorezov, T.; Ovchinnikov, A. Environmental Taxes and the Choice of Green Technology. Prod. Oper. Manag. 2013, 22, 1035–1055. [Google Scholar] [CrossRef]
  63. Trinks, A.; Hille, E. Carbon costs and industrial firm performance: Evidence from international microdata. Energy Econ. 2026, 153, 109077. [Google Scholar] [CrossRef]
  64. Lehmann, P. Justifying a Policy Mix for Pollution Control: A Review of Economic Literature. J. Econ. Surv. 2012, 26, 71–97. [Google Scholar] [CrossRef]
  65. Skjærseth, J.B. Towards a European Green Deal: The evolution of EU climate and energy policy mixes. Int. Environ. Agreem. Politics Law Econ. 2021, 21, 25–41. [Google Scholar] [CrossRef]
  66. Friedman, D. Evolutionary games in economics. Econom. J. Econom. Soc. 1991, 59, 637–666. [Google Scholar] [CrossRef]
  67. Routh, E.J. A Treatise on the Stability of a Given State of Motion, Particularly Steady Motion, Being the Essay to Which the Adams Prize Was Adjudged in 1877, in the University of Cambridge; Macmillan and Company: London, UK, 1877. [Google Scholar]
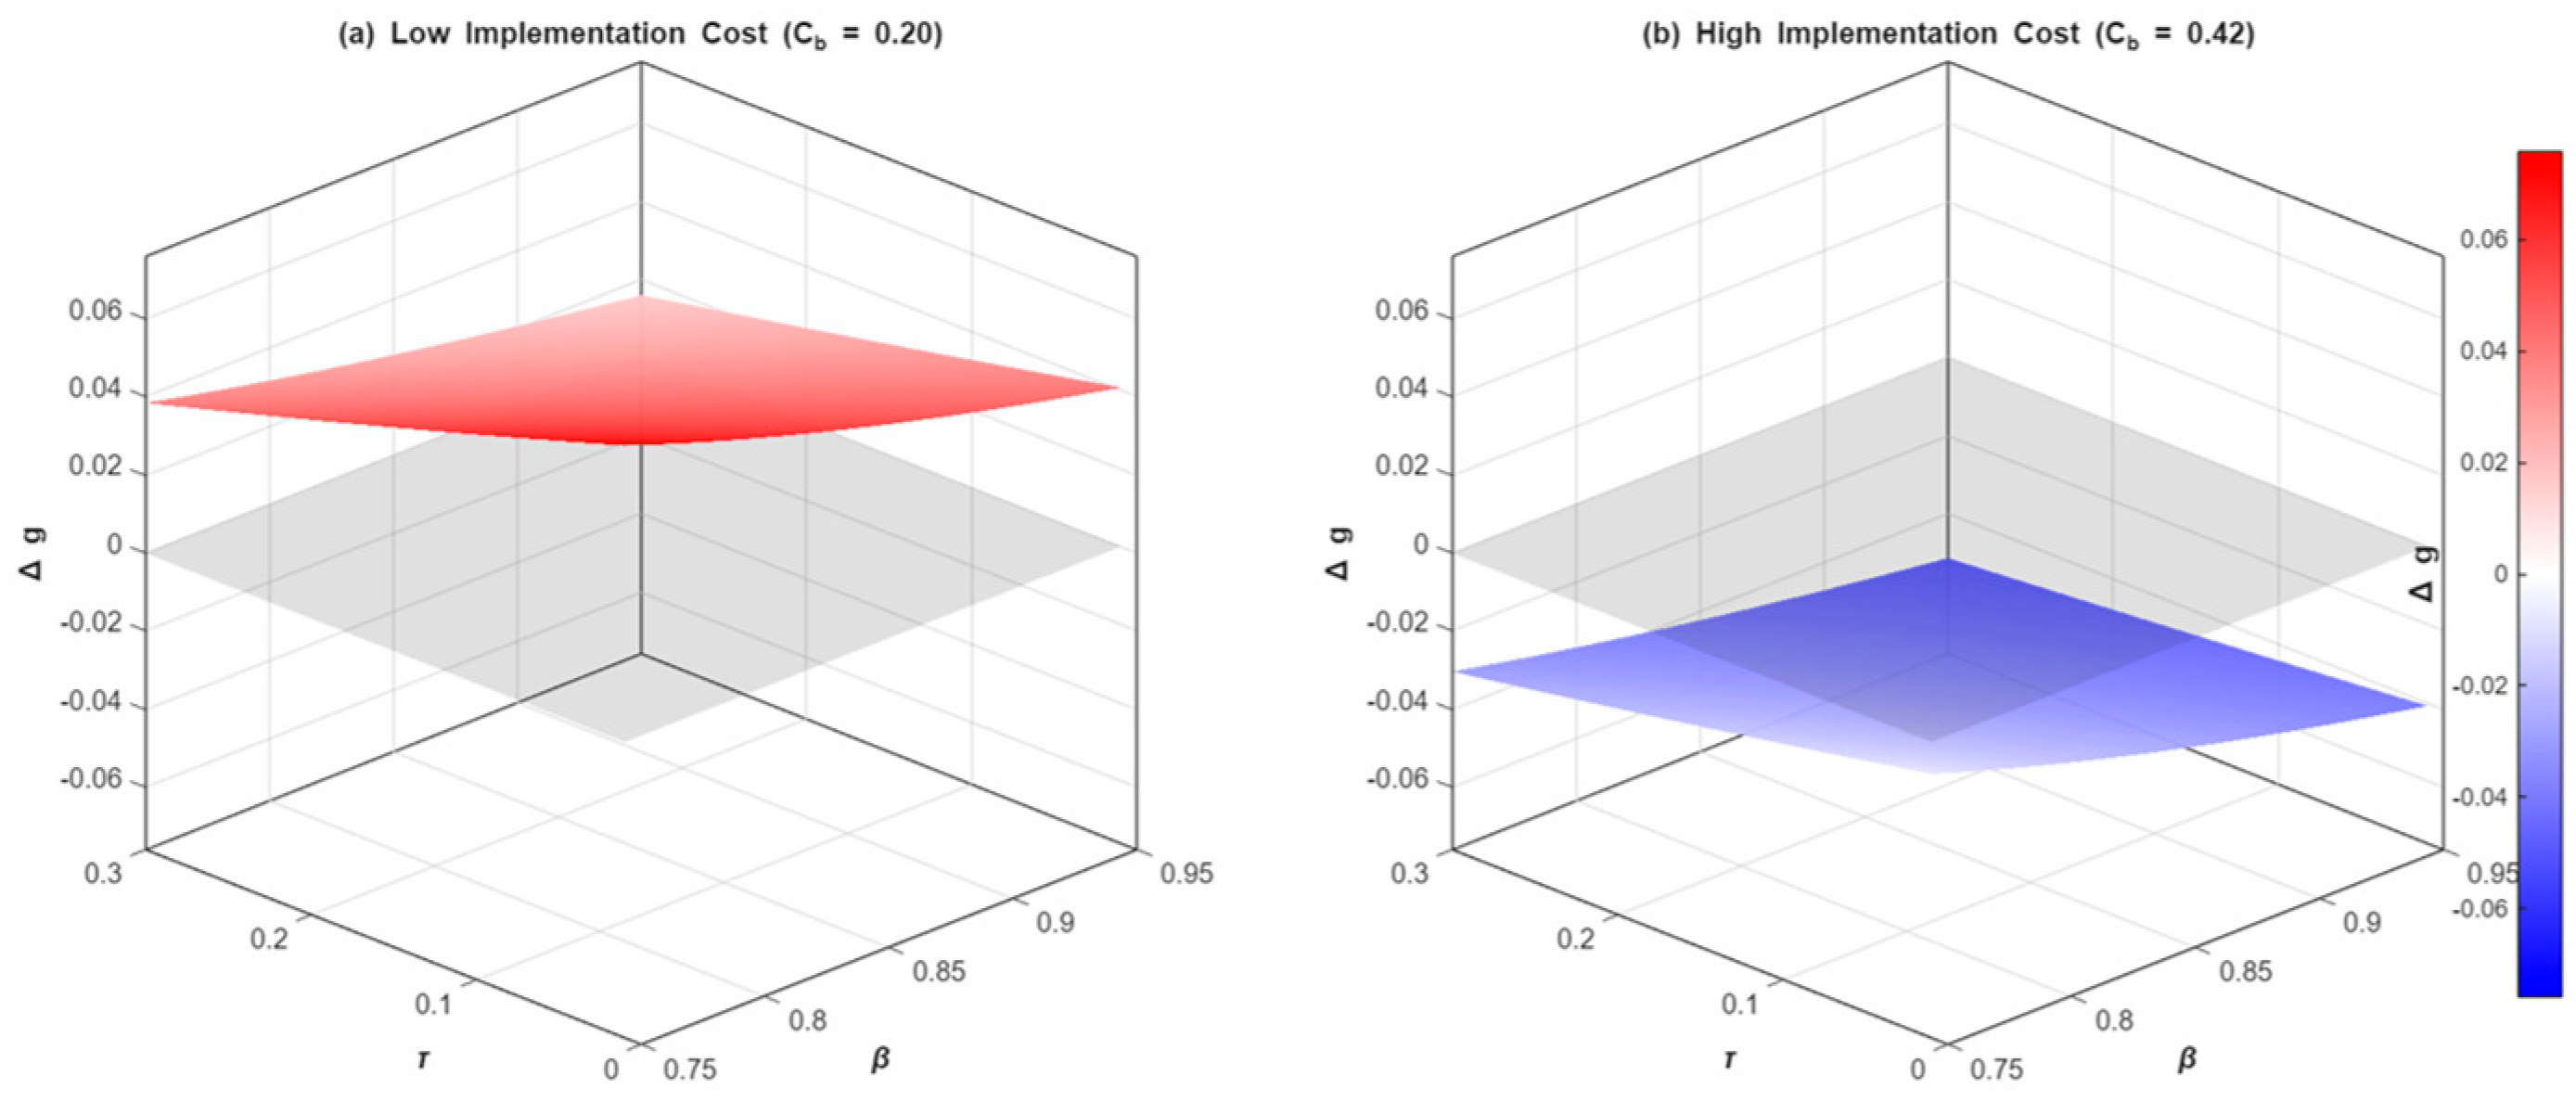
Figure 1. The dual impact of consumer price sensitivity ( β ) and environmental carbon tax rate ( τ ) on the product greenness differential ( Δ g ).
Sustainability 18 05236 g001
Figure 2. The impacts of consumer trust ( θ ), price sensitivity ( β ), and green sensitivity ( γ ) on the product greenness differential ( Δ g ). The black dashed line ( Δ g = 0 ) represents the critical threshold where blockchain adoption ceases to provide a greenness advantage.
Sustainability 18 05236 g002
Figure 3. The interactive effects of policy interventions and technological costs on the product greenness differential ( Δ g ). Subplots (a,b) illustrate the impact of the environmental carbon tax rate ( τ ) and the government subsidy rate ( s ) under varying blockchain implementation costs ( C b ), respectively. Subplot (c) demonstrates the dual impact of τ under varying s .
Sustainability 18 05236 g003
Figure 4. Robustness of the product greenness differential across varying market scenarios. The marked kink points represent the corner solutions where the feasibility threshold becomes binding.
Sustainability 18 05236 g004
Figure 5. D evolutionary phase portraits of the government and the supply chain under different parametric scenarios (red dots represent the ESS).
Sustainability 18 05236 g005
Table 2. Summary of notations.
CategorySymbolDefinition
Indices i N , B Index for the supply chain scenario ( N denotes the scenario without blockchain; B denotes the blockchain adoption scenario)
j m ,   R Index for the supply chain member ( m denotes the manufacturer; R denotes the retailer)
Parameters β Consumer’s price sensitivity coefficient
γ Consumer’s green sensitivity coefficient
θ Consumer’s trust level regarding product greenness
g Product greenness level
τ Carbon tax rate
s Government subsidy rate for green investment cost
C b Unit cost of blockchain implementation
H 1 , H 2 Environmental benefits accrued to the government when the supply chain invests solely in green production ( H 1 ), or simultaneously in green production and blockchain technology ( H 2 )
Decision
variables
p i Retail price of the product in scenario i
g i Manufacturer’s green investment level in scenario i
w i Wholesale price of the product in scenario i
Dependent
variables
D i Market demand in scenario i
Π j i Profit function of member j in scenario i
Π j i * Optimal profit of member j under equilibrium in scenario i
Table 3. Payoff matrix of the evolutionary game between the government and the supply chain.
Supply Chain
PayoffConventional Production (y1)Green Production (y2)Green Production with Blockchain (1 − y1y2)
GovernmentNeither tax nor subsidy (x1) 0 ,
π s c 1 + w N D N τ
H 1 , π s c 2 + w N D N τ H 2 ,
π s c 3 + w B D B τ g B 2 2 s
Taxation (x2) w N D N τ , π s c 1 H 1 + w N D N τ , π s c 2 H 2 + w B D B τ ,
π s c 2 g B 2 2 s
Taxation and subsidy (1 − x1x2) w N D N τ , π s c 1 H 1 + w N D N τ , π s c 2 H 2 + w B D B τ g B 2 2 s ,
π s c 3
Table 4. The stability analysis of each equilibrium point.
Equilibrium PointTr J < 0Det J > 0
0 , 0 , 1 , 0 , 0 , 1 Π S C 1 + Π S C 2 + s g B 2
< D B τ w B + 2 Π S C 3
s g B 2 + 2 D B τ w B Π S C 2 Π S C 3
Π S C 1 Π S C 3 > 0
0 , 1 , 0 , 0 , 0 , 1 Π S C 1 + Π S C 2 + s g B 2
< D B τ w B + 2 Π S C 3
s g B 2 + 2 Π S C 2 2 Π S C 3
s g B 2 + 2 Π S C 1 2 Π S C 3 > 0
1 , 0 , 0 , 0 , 0 , 1 2 w N D N τ + Π S C 1
+ Π S C 2 < 2 Π S C 3 + g B 2 s 2
2 D B τ w B s g B 2 > 0
1 , 0 , 0 , 0 , 1 , 0 w B D B w N D N τ + Π S C 1
+ Π S C 3 < s g B 2 2 + Π S C 2
Π S C 2 Π S C 1
s g B 2 2 D B τ w B + 2 D N τ w N + 2 Π S C 2 2 Π S C 3 > 0
1 , 0 , 0 , 1 , 0 , 0 w B D B w N D N τ + Π S C 2
+ Π S C 2 < 2 Π S C 1 + s g B 2 2
Π S C 1 Π S C 2
s g B 2 2 D B τ w B + 2 D N τ w N + 2 Π S C 1 2 Π S C 3 > 0
x 11 * , 0 , 1 x 11 * , y 11 * , 0 , 1 y 11 * w N s g B 2 2 Π S C 1 + 2 Π S C 2 D N 2 D B w B Π S C 2 Π S C 1 τ + s g B 2 Π S C 2 Π S C 1 2 D B w B + 2 D N w N τ + s g B 2 < 0 s g B 2 + 2 D B τ w B Π S C 2 Π S C 1 Π S C 3 Π S C 1
s g B 2 2 D B τ w B + 2 D N τ w N 2 Π S C 3 + 2 Π S C 1 > 0
x 12 * , 0 , 1 x 12 * , 0 , y 22 * , 1 y 22 * w N s g B 2 + 2 Π S C 1 2 Π S C 2 D N + 2 D B w B Π S C 2 Π S C 1 τ s g B 2 Π S C 2 Π S C 1 2 D B w B + 2 D N w N τ + s g B 2 < 0 s g B 2 + 2 D B τ w B Π S C 2 Π S C 3
Π S C 1 Π S C 2 s g B 2 + 2 D B τ w B 2 D N τ w N 2 Π S C 2 + 2 Π S C 3 > 0
x 13 * , 1 x 13 * , 0 , 0 , y 23 * , 1 y 23 * w N s g B 2 2 Π S C 1 + 2 Π S C 2 D N + 2 D B w B Π S C 1 + Π S C 2 2 D B w B 2 D N w N < 0 D B w B D N w N Π S C 2 Π S C 1
s g B 2 + 2 Π S C 2 2 Π S C 3 s g B 2 2 D B τ w B + 2 D N τ w N + 2 Π S C 2 2 Π S C 3 < 0
x 14 * , 1 x 14 * , 0 , y 14 * , 0 , 1 y 14 * w N s g B 2 + 2 Π S C 1 2 Π S C 2 D N + 2 D B w B Π S C 1 Π S C 2 2 D B w B 2 D N w N < 0 D B w B D B w B Π S C 2 Π S C 1
c g s g M B 2 + 2 Π S C 1 2 Π S C 3 s g B 2 2 D B τ w B + 2 D N τ w N + 2 Π S C 1 2 Π S C 3 > 0
Note: The specific values ( x 11 * , x 12 * , x 13 * , x 14 * , y 11 * , y 22 * , y 23 * , y 14 * ) are in the Appendix A.
Disclaimer/Publisher’s Note: The statements, opinions and data contained in all publications are solely those of the individual author(s) and contributor(s) and not of MDPI and/or the editor(s). MDPI and/or the editor(s) disclaim responsibility for any injury to people or property resulting from any ideas, methods, instructions or products referred to in the content.