1. Introduction
The green and low-carbon transformation of agriculture has become a critical issue in global climate governance and an essential pathway toward sustainable development [
1]. According to the most recent FAOSTAT release, which reports data up to 2023, global agrifood-system emissions reached 16.5 Gt CO2eq in 2023, representing a 21% increase from 2001 and accounting for 32% of total anthropogenic emissions [
2]. Moreover, most countries still rely on extensive agricultural development models, which further exacerbate resource constraints and ecological pressures. In this context, accelerating the transformation of agricultural development models and advancing low-carbon agricultural transition have become important strategic pathways for addressing global climate change and achieving the United Nations Sustainable Development Goals [
3].
In September 2023, China introduced the concept of “new quality productivity” [
4], which is generally defined as an advanced form of productivity characterized by high technology, high efficiency, and high quality, and driven by technological innovation [
1]. In the agricultural context, agricultural new quality productivity (ANQP) refers to an innovation-oriented form of advanced productivity that improves production efficiency through breakthroughs in key agricultural technologies and their wider application. By integrating digital and low-carbon technologies into agricultural production and management, ANQP creates favorable conditions for the green and low-carbon transformation of agriculture [
5,
6]. It therefore provides a useful analytical perspective for understanding how productivity upgrading can contribute to agricultural carbon reduction.
Prior research has examined total agricultural carbon emissions (TACE) and ANQP from separate perspectives. For example, one study analyzed regional differences and the dynamic evolution of agricultural carbon emission efficiency in China [
7]. Other studies identified stage-specific changes in agricultural carbon emissions and their influencing factors, or evaluated agricultural carbon emission efficiency and its determinants at the regional level [
8,
9]. In relation to ANQP, a recent study examined the coupling and coordination between new productive forces and high-quality economic development [
10]. However, the direct relationship between ANQP and TACE remains insufficiently examined. In addition, although technological innovation, land productivity improvement, and labor productivity enhancement are theoretically plausible channels through which ANQP may promote carbon emission reduction, existing studies have not systematically conceptualized these pathways, nor have they provided corresponding empirical evidence. Moreover, whether this effect differs across regions with distinct resource endowments remains insufficiently understood. Against this backdrop, two important questions arise: Does the development of ANQP contribute to the reduction in TACE? Through what mechanisms does it exert this effect?
In the context of global climate governance and China’s “dual carbon” strategy, this study uses panel data for 30 provincial-level regions in China from 2012 to 2023, excluding the Xizang Autonomous Region, Hong Kong, Macao, and Taiwan (hereinafter referred to as “provinces”). It systematically investigates the effect of ANQP on TACE and the channels through which this effect operates. It further examines potential carbon-reduction pathways from three dimensions—agricultural technological innovation, rural labor productivity, and agricultural land productivity, thereby providing theoretical support and practical insights for advancing the green, low-carbon, and high-quality development of agriculture.
This study contributes to the existing literature in three main ways. First, it extends research on agricultural carbon reduction by introducing ANQP as a new explanatory perspective. While previous studies have mainly examined agricultural carbon emissions from the perspectives of digital economy, agricultural modernization, factor inputs, or environmental regulation, relatively limited attention has been paid to how the emerging concept of ANQP affects agricultural carbon emissions. By linking ANQP with TACE, this study provides new empirical evidence on how productivity upgrading contributes to low-carbon agricultural transformation. Second, this study advances the literature by opening the black box of the ANQP–TACE relationship. Existing studies on ANQP have primarily focused on its economic and developmental effects, while its environmental consequences and transmission channels remain insufficiently explored. This study identifies three potential channels—agricultural technological innovation, rural labor productivity, and agricultural land productivity—thereby offering a more structured understanding of how ANQP may contribute to carbon reduction. Third, this study enriches the discussion on heterogeneous pathways of agricultural carbon reduction. By examining differences across geographic regions, grain-function zones, and digital infrastructure levels, this study shows that the carbon-reduction effect of ANQP is context-dependent. This provides a more nuanced understanding of when and where ANQP is more likely to generate environmental benefits.
2. Literature Review
Early studies on TACE primarily focused on measurement approaches. Scholars have pointed out that TACE largely originates from the intensive use of agricultural inputs [
11]. Subsequent research has expanded measurement approaches to multiple dimensions, encompassing fields such as livestock production, energy consumption, and waste management [
12]. Another study highlights that both direct emissions from mineral fertilizers and indirect emissions resulting from soil leaching are significant sources of carbon emissions in agricultural soil management [
13]. These studies have progressively enriched the measurement dimensions of TACE and deepened the multidimensional understanding of their sources and processes.
At the same time, the spatiotemporal characteristics of TACE have attracted considerable attention, with increasing evidence revealing the complexity and dynamic nature of their patterns. For example, one study found that although agricultural carbon emission intensity in China generally declined, it still showed significant spatial clustering and regional disparities [
14]. Similarly, related research has shown that agricultural carbon emission efficiency differs significantly across provinces, reflecting clear interprovincial heterogeneity [
15]. Moreover, related research has found that although TACE generally shows an increasing trend, carbon emission efficiency in some developed regions, such as eastern China, exceeds the national average [
16].
A substantial body of literature has examined the determinants of TACE from multiple perspectives. From the standpoint of the digital economy, one study using data from 269 Chinese cities found that the digital economy can enhance carbon emission efficiency [
17]. Another study analyzed the carbon-emission-reduction effect of the digital economy from the perspective of biased technological progress, showing that technological progress is an important channel through which digitalization affects carbon emissions [
18]. Related research examined the spatial and temporal evolution of carbon emissions in the context of the digital economy and identified significant spatial spillover effects [
19]. From the perspective of high-quality development, one study investigated the regional coupling coordination between high-quality economic development and carbon emission intensity and identified the associated driving mechanisms [
20]. Another study assessed the performance and influencing factors of high-quality development in resource-based cities under pollution and carbon-emission constraints [
21]. Further research examined the coupling relationship and driving factors between carbon emission intensity and high-quality economic development in the Yellow River Basin, providing policy implications for ecological protection and high-quality development [
22]. Beyond these perspectives, the effects of agricultural economic activities and urbanization have also been widely discussed. For example, strengthening farmers’ adaptive capacity [
23], adopting green technologies [
24], adjusting production factor inputs [
25], and utilizing productive services [
25] all contribute to changes in carbon emissions. Other macro-level factors, including agricultural modernization [
26], agricultural carbon emission efficiency [
27], and environmental regulation [
16], have also been incorporated into the analysis.
ANQP is generally understood as an advanced form of productivity driven by technological innovation and the reorganization of production factors [
28]. The emergence of ANQP has opened up new possibilities for strengthening the agricultural sector and has gradually become an important force driving high-quality agricultural development. Existing studies have examined the defining features of the “new” and “quality” dimensions from a theoretical perspective and have further clarified the connotations and attributes of ANQP. On this basis, researchers have constructed multidimensional evaluation systems, such as frameworks based on the three elements of labor, labor objects, and labor means [
1], or broader multidimensional perspectives emphasizing technological, green, and digital development [
29]. Correspondingly, measurement methods also exhibit considerable diversity. At the same time, existing research has further examined the broader socioeconomic effects of ANQP. Specifically, one study links new quality productive forces with urban–rural integration and industrial-chain resilience, indicating that productivity upgrading can facilitate factor mobility, industrial coordination, and the integration of urban and rural development [
30]. Another study shows that ANQP promotes high-quality agricultural development by improving technological innovation, factor allocation, and green transformation [
31]. Related research further indicates that ANQP contributes to agricultural modernization by promoting the upgrading of agricultural production modes and the reorganization of agricultural production factors [
32]. In addition, evidence from enterprise-level research suggests that new quality productive forces affect the share of labor income, highlighting their distributional implications for income structure [
33].
Existing studies have provided valuable insights into TACE and ANQP, thereby establishing an important theoretical foundation for further exploration of agricultural carbon reduction pathways. However, several limitations remain in the existing literature. First, most current studies focus on the role of the digital economy in shaping TACE, whereas direct empirical evidence on how ANQP affects TACE remains relatively limited. Second, although some studies have analyzed the impact of ANQP on TACE from a theoretical perspective, empirical evidence remains limited and insufficient to fully verify its carbon reduction effect. Third, the specific pathways and mechanisms through which ANQP affects TACE remain unclear and require further investigation.
3. Mechanism Analysis and Research Hypotheses
3.1. The Impact of Agricultural New Quality Productivity on Agricultural Carbon Emissions
In the context of carbon emission challenges and ecological constraints associated with traditional agricultural development, ANQP represents an advanced form of productivity characterized by the optimized combination and transformation of new types of labor, labor means, and labor objects. ANQP can effectively address the challenges of high emissions and low efficiency in traditional agriculture [
34], thereby providing essential support for the low-carbon transformation and sustainable development of the agricultural sector [
1].
First, as the core actors in low-carbon agricultural development, new types of agricultural laborers are also the direct implementers of agricultural carbon reduction. New agricultural practitioners with better education, stronger professional skills, and modern management concepts can effectively master and apply low-carbon production technologies, adopt green management practices [
35], actively reduce the excessive input and extensive use of agricultural chemicals such as fertilizers and pesticides, and replace the experience-based production decisions of traditional smallholders with more scientific decision-making, thereby directly reducing carbon emissions from the production process [
36]. High-quality new agricultural workers can also effectively promote low-carbon agricultural technologies and concepts, thereby making low-carbon production methods the mainstream choice in agricultural production and management.
Second, as the technological carrier and instrumental support for agricultural production [
37], new agricultural labor means provide the direct material basis for achieving carbon reduction in agriculture. New agricultural labor means, centered on digital and intelligent equipment, can replace traditional high-energy-consuming agricultural production tools, thereby improving production efficiency and optimizing production processes [
38]. At the same time, new agricultural labor means rely on intelligent production equipment to enable precision fertilization and intelligent control, thereby directly avoiding inefficient resource use and excessive carbon emissions associated with traditional production methods [
32]. The integration of new forms of labor, such as agricultural technological innovation, has further facilitated innovation in agricultural production technologies, thereby directly promoting carbon reduction and efficiency improvement in agricultural production.
Finally, new agricultural labor objects provide direct practical scenarios and development space for agricultural carbon reduction through boundary expansion and form transformation. New agricultural labor objects break through the limitations of traditional agriculture [
39], in which material products are regarded as the sole final output, give rise to new production forms and models such as ecological agriculture and smart agriculture, and promote the transformation of agriculture from single-product output to diversified functions such as leisure tourism and ecological services. By reconstructing the agricultural production system and extending the industrial chain, this transformation improves the efficiency of agricultural factor allocation and reduces the intensity of resource consumption [
40]. At the same time, by relying on a new low-carbon-oriented agricultural development model, it promotes the transformation of agriculture from traditional high-carbon production to green and efficient production [
41], thereby providing a concrete practical scenario for reducing TACE. In summary, this study proposes the following research hypothesis:
H1. Improvements in the level of agricultural new quality productivity help reduce agricultural carbon emissions.
3.2. Mechanism Analysis of the Effect of Agricultural New Quality Productivity on Agricultural Carbon Emissions
The theory of technological progress suggests that technological innovation is a key pathway for improving productivity and reducing resource consumption [
42]. Innovation is the core driving force of ANQP [
43]. By reshaping factor inputs, optimizing output models, and establishing adaptive production relations, it achieves a systematic and leapfrog improvement in the level of agricultural science and technology innovation [
44].
First, ANQP guides agricultural technological innovation through green and low-carbon demands, thereby promoting the low-carbon transformation of agricultural production [
45]. The government’s strategic emphasis on ANQP, together with its inherent green orientation, has driven agricultural technological innovation to shift from a traditional output-increasing model toward a development pattern that emphasizes both productivity enhancement and carbon reduction, thereby directing agricultural research and development toward energy conservation and emission reduction. Guided by such demands, agricultural technological innovation will place greater emphasis on the research and development of low-carbon agricultural technologies [
46], thereby reducing carbon emissions and resource consumption at the source of agricultural production and achieving synergistic improvements in production efficiency and ecological benefits. Second, ANQP introduces new production factors, such as intelligent equipment, into the agricultural system, thereby providing factor support and a material foundation for agricultural technological innovation. For example, new technologies can be used to achieve precise monitoring of crop growth and soil conditions and, when combined with intelligent irrigation and variable fertilization, can reduce the waste of inputs such as water and fertilizers [
47]. At the same time, the diffusion of renewable energy technologies, together with advances in low-carbon agricultural machinery and equipment, can reduce reliance on fossil fuels and lower direct carbon emissions [
48], thereby enabling low-carbon operation throughout the agricultural production process. Recent studies further provide concrete evidence that technological innovation can translate into directly measurable low-energy and low-carbon outcomes. For example, low-energy system design can significantly reduce energy consumption while maintaining functional performance, illustrating how innovation-oriented technological upgrading can generate observable energy-saving effects and strengthen the link between technological progress and carbon reduction [
49].
Finally, ANQP promotes the transformation of agricultural practitioners into new agricultural business entities characterized by skill and innovation [
50], enhances workers’ environmental awareness and capacity to apply technology, strengthens the innovation vitality of agricultural science and technology at the level of key actors, and accelerates the development, diffusion, and adoption of green technologies [
51]. Based on this, this study proposes the following research hypothesis:
H2. Agricultural new quality productivity can reduce agricultural carbon emissions by promoting agricultural technological innovation.
Rural labor productivity is one of the core indicators for measuring agricultural production efficiency and an important reflection of the development level of ANQP [
41]. ANQP directly increases agricultural output per unit of labor by enhancing the technological capabilities and green awareness of new agricultural business entities, thereby promoting the low-carbon transformation of agriculture.
First, with the improvement and wider adoption of rural digital infrastructure, agricultural workers can apply inputs such as fertilizers and pesticides more accurately and scientifically, thereby reducing resource waste and excessive input caused by technological limitations or extensive decision-making, as well as lowering the use of agricultural chemicals per unit of output and the carbon emissions generated during their production and application at the source [
52,
53]. Second, by promoting the application of intelligent equipment and agricultural technologies, ANQP directly improves the efficiency and precision of labor operations [
54], reduces the inefficient use of traditional machinery, and enables the on-demand application of chemical inputs, thereby significantly reducing direct energy consumption and carbon emissions in agricultural production. In addition, by strengthening the environmental awareness of agricultural workers, ANQP promotes a more efficient allocation of production factors and facilitates improvements in production organization. Under the impetus of ANQP, the adoption of advanced management models and the reconfiguration of key production factors, such as land and capital, further enhance the labor productivity of new agricultural workers [
50]. Recent empirical evidence also indicates that agricultural labor productivity can serve as an important efficiency channel through which digital agricultural development contributes to agricultural carbon-emission reduction, while labor substitution and green environmental awareness can further support agricultural low-carbon transformation [
53,
55]. Finally, ANQP breaks down market information barriers and efficiently transmits consumers’ green preferences to the production side [
56,
57]. This market-oriented systemic transformation fundamentally changes the way labor productivity is realized in value terms. To respond to growing demand for green consumption, agricultural producers will actively shift toward green agricultural production models characterized by higher value and lower costs. Based on this, this study proposes the following research hypothesis:
H3. Agricultural new quality productivity can reduce agricultural carbon emissions by improving rural labor productivity.
Agricultural land productivity is a key indicator for measuring the output capacity of a unit of land and intuitively reflects the quantity and output value of agricultural products generated per unit area over a given period. ANQP improves agricultural land productivity through technological innovation and factor optimization [
1], thereby directly or indirectly reducing carbon emissions per unit of agricultural output.
On the one hand, agricultural land productivity directly contributes to agricultural carbon reduction by reducing resource consumption per unit of output. At the technical level, ANQP relies on precision agriculture and digital management technologies to optimize factor inputs, reduce carbon emissions per unit of output [
58], and lessen the extensive dependence of agricultural production on land resources and high-carbon input factors. At the factor level, the introduction of new labor forms, such as agricultural mechanization, within ANQP has alleviated labor shortages, improved the accuracy and timeliness of land cultivation, and reduced reliance on traditional energy inputs such as human and animal power [
25]. At the management level, the integration of modern management science into ANQP promotes the allocation of production factors toward greater efficiency and cleanliness [
59], continuously reducing the marginal cost of carbon reduction while increasing land output value and making low-carbon production more economically feasible and sustainable.
On the other hand, agricultural land productivity indirectly reduces TACE by protecting natural carbon sinks and promoting industrial transformation [
60]. Improvements in agricultural land productivity suppress the demand for farmland expansion, protect natural carbon sinks such as forests and wetlands, and enhance the carbon sequestration capacity of farmland itself. With a significant increase in land output per unit area, the pressure to reclaim new farmland to meet total production demand decreases, thereby reducing damage to natural ecosystems. At the same time, improvements in land output efficiency also incentivize producers to shift toward crops and production models with higher market value and lower resource and environmental costs. This transformation, combined with technological changes such as mechanization and energy substitution, promotes the overall shift of agriculture from high-energy-consumption and high-emission modes to green and low-carbon models and curbs the expansion of carbon sources at the source. Related studies also show that improvements in land productivity and land-use efficiency can enhance agricultural carbon productivity and help reduce agricultural carbon emissions [
61,
62]. Based on this, this study proposes the following research hypothesis:
H4. Agricultural new quality productivity can reduce agricultural carbon emissions by increasing agricultural land productivity.
4. Empirical Design
4.1. Sample Selection and Data Sources
Given data availability, this study constructs a panel dataset covering 30 provincial-level regions in China from 2012 to 2023, excluding the Xizang Autonomous Region, Hong Kong, Macao, and Taiwan (hereinafter referred to as “provinces”). This choice helps ensure data completeness, cross-provincial comparability, and a balanced panel structure. Data for the relevant variables were collected from the National Bureau of Statistics of China, the China Rural Statistical Yearbook, the China Urban Statistical Yearbook, the China Statistical Yearbook, provincial statistical yearbooks, and official statistical bulletins. Agricultural patent data were obtained from the patent database of China National Knowledge Infrastructure, while data on total imports and exports were sourced from the General Administration of Customs of the People’s Republic of China. Missing values for relevant indicators in some provinces and cities were supplemented using the interpolation method, and some variables were transformed into logarithmic form.
4.2. Variable Definitions
4.2.1. Dependent Variable
Total agricultural carbon emissions (TACE). The dependent variable in this study is TACE. Drawing on relevant research [
63,
64,
65], this study estimates TACE from six major sources in crop production, namely pesticides, fertilizers, agricultural film, machinery, tillage, and irrigation. It should be noted that the TACE measure used in this study mainly captures carbon emissions associated with crop production inputs, including fertilizers, pesticides, agricultural plastic film, diesel use, irrigation, and tillage. This measurement focuses on input-based agricultural carbon emissions. Therefore, TACE in this study represents a relatively narrow measure of agricultural carbon emissions, rather than total emissions from the entire agricultural system. Specifically, the amount associated with each carbon emission source is multiplied by its corresponding emission coefficient, and the resulting values are then summed to obtain total TACE. The formula for estimating TACE is as follows:
In Equation (1),
denotes total agricultural carbon emissions;
denotes the carbon emissions from each source;
denotes the amount of each carbon emission source; and
denotes the carbon emission coefficient of each source. The specific coefficients and corresponding emission sources are presented in
Table 1.
4.2.2. Independent Variable
Agricultural New Quality Productivity (ANQP). Unlike the traditional productive forces defined in Marxist theory, which consist of three major components—laborers, means of labor, and objects of labor [
67]—the three elements of new quality productive forces have undergone qualitative transformation. Agricultural laborers should no longer merely master traditional farming skills, but should instead become high-quality, interdisciplinary talents equipped with both modern production technologies and innovation capabilities; agricultural means of labor have also been upgraded from traditional agricultural tools and simple machinery to intelligent agricultural machinery and digital information systems; agricultural objects of labor continue to expand with the emergence of new technologies, industries, and models, giving rise to greener, more environmentally friendly, and more modern forms of agricultural production. Based on the connotation of new quality productivity, most scholars construct indicator systems from three dimensions—laborers, means of labor, and objects of labor—for comprehensive measurement. This study draws on existing research methods [
1] and constructs a three-dimensional comprehensive evaluation index system for ANQP, covering new agricultural laborers, new agricultural means of labor, and emerging agricultural objects of labor. The specific indicators are presented in
Table 2. In addition, the entropy weight method is employed to assign objective weights to the 22 specific indicators in
Table 2. The entropy weight method determines indicator weights according to the information content and dispersion degree of each indicator. Indicators with greater variation across the sample contain more discriminating information and are therefore assigned higher weights, while indicators with lower variation receive lower weights. This data-driven method helps reduce subjective interference in the construction of the composite ANQP index and is suitable for measuring a multidimensional concept such as ANQP [
68]. To ensure intertemporal comparability, this study calculates the weights based on the pooled provincial panel sample and applies a unified weighting scheme across the sample period. In the subsequent empirical analysis, year fixed effects are further included to absorb common time-level shocks and macro-level changes during 2012–2023. After multiplying the weight of each indicator by its standardized value, the comprehensive development index of ANQP is obtained by summing the weighted values.
4.2.3. Control Variable
Given that agricultural carbon emissions may also be influenced by a range of other factors, and following existing studies [
1,
31], this study includes the following control variables to improve the accuracy of the results and minimize estimation bias: Urbanization rate (urban), measured as the share of the urban population in the total population; Industrial structure (IS), measured as the share of value added in the primary industry in regional gross domestic product; Agricultural planting structure (plant), measured as the proportion of grain crop sown area to total crop sown area; Foreign direct investment (fdi), converted from U.S. dollars into Chinese yuan using the annual average exchange rate and measured as the ratio of actual utilized FDI to regional GDP; Openness (open), measured as the proportion of total imports and exports to GDP; and Financial support for agriculture (FSA), measured as the share of expenditure on agriculture, forestry, and water affairs in local general budget expenditure. Additional variables used in the robustness tests include industrialization level (ind), government intervention (gov), rural transportation infrastructure (ROAD), annual average temperature (TEMP), annual precipitation (PRCP), and the Climate Physical Risk Index (CPRI). The detailed definitions of these variables are presented in
Table 3.
4.3. Model Construction
4.3.1. Benchmark Regression Model
The fixed-effects panel model can, to some extent, alleviate endogeneity problems arising from unobservable factors that are time-invariant and correlated with the core explanatory variables. Considering the influence of location conditions, historical accumulation, and other factors, this study employs a two-way fixed-effects regression model to estimate the impact of ANQP on TACE, controls for unobservable individual-specific characteristics and common time effects, and constructs the following benchmark regression model. Compared with methods primarily designed for efficiency measurement or spatial dependence analysis, the two-way fixed-effects panel model is more consistent with the objective of this study, which is to estimate the within-province relationship between ANQP and TACE over time:
In this model, represents agricultural carbon emissions in province in year ; represents the level of ANQP in province in year ; is the coefficient to be estimated for , capturing the effect of ANQP on TACE; represents other control variables; denotes the coefficients of the control variables; denotes the individual fixed effect; denotes the year fixed effect; is the constant term, and is the random error term.
4.3.2. Mechanism Testing Model
To further test the theoretical hypotheses concerning the mechanisms of agricultural technological innovation (AT), rural labor productivity (RLP), and agricultural land productivity (ALP), the corresponding variables and their interaction terms with ANQP were introduced into the benchmark model in Equation (2) for empirical testing. The model specifications are as follows:
In this model, denotes the mechanism variable, including agricultural technological innovation (AT), rural labor productivity (RLP), and agricultural land productivity (ALP). Equation (3) is used as an interaction-based mechanism test to examine whether the proposed mechanism channels strengthen the carbon-reduction effect of ANQP. Specifically, the coefficient α3 of the interaction term ANQP × M captures whether the effect of ANQP on TACE varies with the level of the corresponding mechanism variable. Accordingly, the interaction results are interpreted as mechanism-related evidence that agricultural technological innovation, rural labor productivity, and agricultural land productivity may reinforce the relationship between ANQP and TACE.
5. Empirical Analysis
5.1. Descriptive Statistics
The descriptive statistics for each variable are shown in
Table 4. The mean value of TACE is 2.795, with a maximum of 8.721 and a minimum of 0.117, indicating substantial regional differences in TACE across China. The mean level of ANQP is 0.236, with a maximum of 0.465 and a minimum of 0.075, indicating that the development of ANQP remains unbalanced across regions in China.
5.2. Benchmark Model Regression
To examine the impact of ANQP on TACE, Equation (2) was estimated, and the results are reported in
Table 5. Specifically, column (1) excludes control variables, whereas column (2) includes all control variables. According to the regression results in column (1) of
Table 5, when control variables are excluded, the coefficient on the core explanatory variable, ANQP, is −2.680 and significantly negative at the 1% level. This indicates that ANQP has a significant inhibitory effect on TACE. Column (2) of
Table 5 reports the regression results after including a series of control variables. The coefficient on the core explanatory variable, ANQP, is −2.119 and remains significantly negative at the 1% level, indicating that the carbon-reduction effect of ANQP is not merely driven by observed socioeconomic and agricultural structural factors. The decline in the coefficient magnitude after adding controls also suggests that these socioeconomic and agricultural structural factors explain part of the variation in TACE, while ANQP still exerts an independent inhibitory effect. These results are consistent with the expectations of the preceding theoretical analysis, and Hypothesis H1 is therefore supported. A possible explanation is that ANQP is primarily driven by digital technologies, intelligent equipment, and green biotechnology, which can reduce redundant inputs of high-carbon elements such as fertilizers, pesticides, and energy through precision fertilization, water-saving irrigation, and the coordinated use of intelligent agricultural machinery, thereby lowering carbon emissions per unit of output.
5.3. Robustness Test
To verify the reliability of the benchmark regression results, this study conducts robustness tests from the following six aspects. First, the core explanatory variable is replaced. A recent study has adopted a broader multidimensional system to measure agricultural new-quality productive forces, emphasizing technological progress, green development, and digital advancement [
69]. Following this line of research, this study reconstructs an alternative composite index of agricultural new-quality productivity (ANQP1) based on indicators of human capital, technological input, green development, and digital infrastructure, and then re-estimates the benchmark model. Second, the core explanatory variable is lagged by one period [
70]. Considering that the carbon-reduction effect of ANQP may be delayed, the one-period-lagged agricultural new-quality productivity variable (L.ANQP) is introduced for re-estimation. Third, municipalities directly under the central government are excluded from the sample [
71]. Beijing, Shanghai, Tianjin, and Chongqing are generally more advanced in economic development, digital infrastructure, innovation capacity, and policy resources, while their agricultural sectors account for relatively small shares of the regional economy. Their agricultural production patterns and carbon-emission structures may therefore differ substantially from those of ordinary provinces. Accordingly, excluding these municipalities helps examine whether the estimated carbon-reduction effect of ANQP is driven by structurally atypical and leading regions. The regression is then re-estimated after excluding Beijing, Shanghai, Tianjin, and Chongqing. Fourth, special years are excluded [
72]. The extreme shock of the COVID-19 pandemic may have had a complex impact on economic activity, thereby leading to abnormal fluctuations in TACE. Therefore, the observations for 2020 and 2021 are excluded for robustness testing. Fifth, to further eliminate the interference of other potential factors affecting TACE, the level of industrialization, government intervention, and rural transportation infrastructure are included in the benchmark model for regression analysis. Sixth, climate-related control variables are further included. Climatic conditions may affect agricultural inputs, production decisions, and agricultural carbon emissions. Following related studies that measure general climate conditions using annual average temperature and annual precipitation [
73,
74], this study additionally controls for TEMP, PRCP, and CPRI. CPRI is a composite indicator constructed from extreme low-temperature days, extreme high-temperature days, extreme rainfall days, and extreme drought days [
75]. The results reported in
Table 6 show that, across multiple robustness tests, the inhibitory effect of ANQP on TACE remains significant at the 1% level. This indicates that the benchmark regression findings are highly robust. More specifically, the negative coefficient of ANQP remains significant when the core explanatory variable is reconstructed, when the lagged ANQP variable is used, when municipalities directly under the central government are excluded, when the COVID-19 shock years are removed, when additional socioeconomic control variables are included, and when climate-related control variables are further added. These results indicate that the estimated carbon-reduction effect of ANQP is not driven by a particular measurement method, possible delayed effects, structurally atypical municipalities, abnormal pandemic shocks, omitted socioeconomic controls, or omitted climatic factors.
5.4. Endogeneity Test
5.4.1. Instrumental Variable (IV) Test
Although the two-way fixed-effects model employed in this study mitigates endogeneity to some extent, endogeneity concerns may still persist because measurement errors in the variables, omitted-variable bias, and potential reverse causality between ANQP and TACE cannot be fully ruled out.
(1) Following previous research [
76], this study uses the average level of ANQP in other provinces in the same year as an instrumental variable (ANQP_IV) and applies the two-stage least squares (2SLS) method to re-examine the effect of ANQP on TACE. The rationale is that ANQP development may exhibit interregional spillover effects through channels such as technological diffusion, policy learning, and competitive pressure, making the ANQP level in other provinces strongly correlated with local ANQP. At the same time, after controlling for province fixed effects, year fixed effects, and a set of socioeconomic variables, the ANQP level of other provinces is unlikely to directly affect agricultural carbon emissions in a given province. Agricultural carbon emissions are primarily determined by local production structure, input intensity, resource endowment, and policy environment. In contrast, the ANQP level of other provinces mainly reflects external influences that operate through spillover and demonstration effects. Therefore, the instrument is expected to affect local TACE primarily through its impact on local ANQP rather than through a direct channel. Taken together, these considerations provide a plausible basis for the relevance condition and the exclusion restriction, and the instrumental variable is used to provide additional evidence for the robustness of the baseline findings.
Table 7 presents 2SLS estimation results for the instrumental variable. Column (1) reports the first-stage regression, in which the coefficient of the instrumental variable ANQP_IV is significantly negative at the 1% level. The LM statistic is 327.793 with a
p-value below 0.1, rejecting the null hypothesis of under-identification, while the Cragg–Donald Wald F statistic of 7272.22 exceeds the 10% critical value, rejecting the weak instrument hypothesis. Column (2) presents the second-stage regression results, where the coefficient of ANQP is significantly negative at the 1% level, confirming that the baseline regression results remain robust after accounting for endogeneity.
(2) Drawing on the idea of generated instruments in Lewbel (1997) [
77], this study constructs the instrumental variable ANQP_IV as the cubic difference between local ANQP and the average ANQP of other provinces in the same year and applies the two-stage least squares (2SLS) method for analysis.
Table 8 presents the two-stage least squares (2SLS) estimation results for the instrumental variable. Column (1) reports the first-stage regression, in which the coefficient of ANQP_IV is significantly positive at the 1% level. The LM statistic is 214.129 with a
p-value below 0.1, rejecting the null hypothesis of under- identification, while the Cragg–Donald Wald F statistic of 494.517 exceeds the 10% critical value, rejecting the weak instrument hypothesis. Column (2) presents the second-stage regression results, where the coefficient of ANQP is significantly negative at the 1% level, confirming that the baseline regression results remain robust after accounting for endogeneity.
5.4.2. Placebo Test
To ensure that the estimated relationship between ANQP and TACE is not driven by time trends or random factors, this study conducts a placebo test following the logic of placebo-based falsification tests in causal inference [
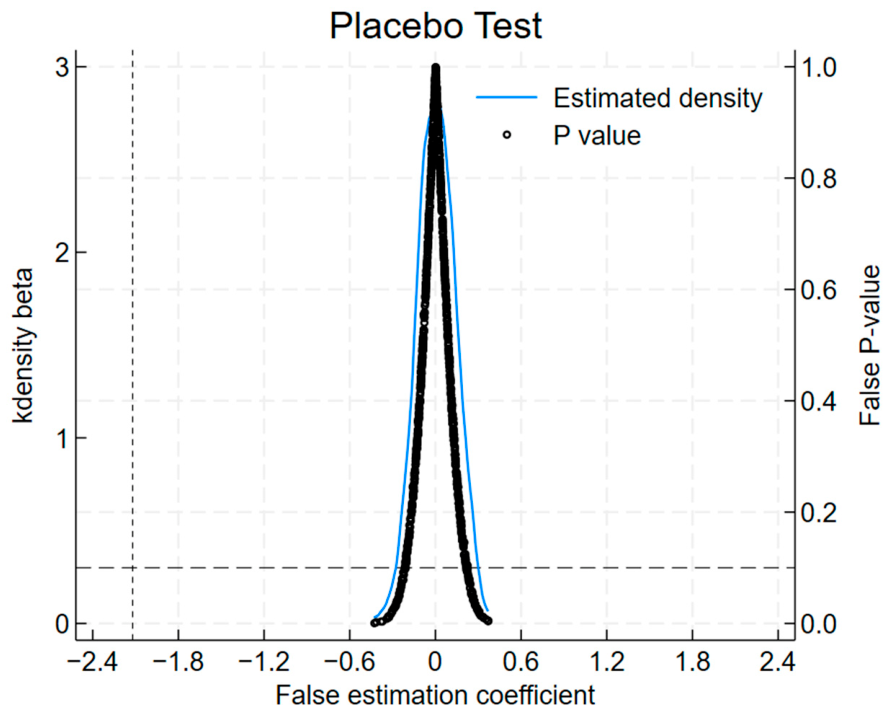
78]. Specifically, a randomly assigned treatment-group sample is constructed using a random reassignment approach, and the baseline model is re-estimated 1000 times. This procedure generates probability density curves of the regression coefficients, scatter plots of the
p-value distribution, and coefficient estimates including control variables as well as year and individual fixed effects. (see
Figure 1).
Figure 1 shows that the estimated coefficients for the randomly generated treatment groups are primarily concentrated around zero, and that most estimates are not statistically significant at the 10% level. This finding indicates that the suppressive effect of ANQP on TACE is unlikely to be driven by random or spurious factors.
5.4.3. Entropy Balancing Matching
To address potential sample selection bias, this study adopts entropy balancing, which reweights observations to satisfy prespecified covariate balance conditions and thus provides a more precise balance than conventional propensity score matching [
79]. Specifically, the sample is divided according to the annual median of ANQP: observations above the median are assigned to the treatment group, whereas those below the median are assigned to the control group.
To further verify whether entropy balancing effectively improves the comparability between the treatment and control groups, we additionally report covariate balance diagnostics in
Appendix A,
Table A1. Specifically, we compare the mean, variance, and skewness of the covariates before and after reweighting, and further calculate the standardized mean differences (SMDs), defined as the difference in covariate means between the treatment and control groups divided by the pooled standard deviation. An absolute SMD below 0.1 is generally considered to indicate adequate balance. As shown in
Appendix A,
Table A1, before entropy balancing, several covariates exhibit observable differences between the treatment and control groups. After reweighting, the differences in covariate moments, including the mean, variance, and skewness, are substantially reduced, and the SMDs are close to zero. This indicates that the entropy-balancing procedure effectively improves covariate balance and enhances the comparability of the two groups.
Based on the improved balance, we further re-estimate the benchmark model using the reweighted sample, and the results are reported in
Table 9.
5.4.4. Heckman Two-Stage Regression
To address potential endogeneity arising from non-random sample selection in the agricultural carbon-emission context, this study further employs the Heckman two-stage procedure [
80]. The rationale is that province-year observations with relatively high agricultural carbon emissions may not be randomly distributed. Instead, they may be associated with structural characteristics such as urbanization, industrial structure, planting structure, and other local conditions. If these selection-related factors are correlated with both ANQP and TACE but are not fully captured in the outcome equation, the estimated effect of ANQP may be biased. Therefore, this study uses a Probit selection equation to model whether a province-year observation belongs to the relatively high-emission group and then incorporates the inverse Mills ratio (IMR) into the second-stage regression to correct for potential selection bias. Specifically, in the first stage, an indicator variable, TA_DUM, is constructed based on the median level of TACE and used as the dependent variable. TA_DUM equals 1 when TACE is above the median and 0 otherwise. In the second stage, the IMR estimated from the first-stage Probit model is incorporated into the baseline regression model. The regression results are reported in
Table 10. In column (1), the coefficient on the inverse Mills ratio is statistically significant, indicating the presence of sample selection bias. In column (2), the coefficient of ANQP is −5.828 and remains significantly negative at the 1% level. This result confirms the robustness of the baseline findings.
5.5. Mechanism Analysis
Having examined the effect of ANQP on TACE, this section further explores the underlying mechanisms by examining whether key productivity-related factors strengthen the carbon-reduction effect of ANQP. Based on the interaction-term specification in Equation (3), agricultural technological innovation, rural labor productivity, and agricultural land productivity are introduced to assess whether these factors reinforce the impact of ANQP on TACE.
5.5.1. Agricultural Technological Innovation (AT)
To examine the role of agricultural technological innovation (AT) in the proposed mechanism, this study introduces the interaction term between ANQP and AT based on Equation (3). This specification allows us to assess whether technological innovation strengthens the carbon-reduction effect of ANQP on TACE, thereby providing evidence for the technological-innovation channel. Following the relevant literature [
81], this study measures AT using innovation output, proxied by the total number of patents in agriculture, forestry, animal husbandry, and fisheries.
Table 11 reports the results of the mechanism test for AT. Column (1) reports the regression results without control variables, whereas Column (2) reports the results with control variables included. Both columns include year and individual fixed effects. As shown in
Table 11, the coefficients of the core explanatory variable, ANQP, are −1.910 and −1.510, respectively, both significantly negative at the 1% level, further confirming its inhibitory effect on TACE. The coefficients of the key interaction term, ANQP × AT, are −5.038 and −4.348, respectively, and both are significantly negative at the 1% level. This result indicates that the carbon-reduction effect of ANQP is more pronounced when the level of agricultural technological innovation is higher, thereby providing empirical support for the technological-innovation channel. This finding is consistent with the theoretical mechanism that the strategic emphasis on ANQP increases the demand for agricultural technological innovation, while improvements in such innovation help reduce resource and energy consumption and lower TACE at the source. Therefore, Hypothesis H2 is supported.
5.5.2. Rural Labor Productivity (RLP)
To examine the role of rural labor productivity (RLP) in the proposed mechanism, this study introduces the interaction term between ANQP and RLP based on Equation (3). RLP captures a key dimension of factor efficiency, allowing us to assess whether improvements in labor productivity strengthen the carbon-reduction effect of ANQP on TACE and provide evidence for the labor-productivity channel. Following previous research [
42], RLP is measured as the ratio of added value in the primary sector to the number of employees in that sector. It should be noted that labor productivity is also included as one sub-indicator in the composite ANQP index. However, in this analysis, RLP is introduced to examine whether factor-efficiency improvement strengthens the carbon-reduction effect of ANQP, rather than to mechanically reproduce the composite index. Since ANQP is a multidimensional composite index, RLP captures only one specific dimension of the broader productivity system.
Table 12 reports the results of the mechanism test for rural labor productivity. Column (1) reports the regression results without control variables, whereas Column (2) reports the results with control variables included. Both columns include year and individual fixed effects. As shown in
Table 12, the coefficients of the interaction term ANQP × RLP are −0.529 and −0.665, respectively, both significantly negative at the 1% level. This result indicates that the carbon-reduction effect of ANQP is more pronounced when rural labor productivity is higher, thereby providing empirical support for the labor-productivity channel. This finding is consistent with the theoretical mechanism that ANQP improves factor efficiency and rural labor productivity through mechanization, technological upgrading, and production organization optimization. Higher RLP allows for more efficient energy use and a lower-carbon production structure, thereby contributing to the reduction in TACE. Therefore, Hypothesis H3 is supported.
5.5.3. Agricultural Land Productivity (ALP)
To further examine the role of agricultural land productivity (ALP) in the proposed mechanism, this study introduces the interaction term between ANQP and ALP based on Equation (3). This specification is used to assess whether land productivity strengthens the carbon-reduction effect of ANQP on TACE, thereby providing evidence for the land-productivity channel. Following prior research [
32,
82], ALP is measured as the ratio of total agricultural output value to crop sown area.
Table 13 reports the results of the mechanism test for agricultural land productivity. Column (1) reports the regression results without control variables, whereas Column (2) reports the results with control variables included. Both columns include year and individual fixed effects. As shown in
Table 13, the coefficients of the interaction term ANQP × ALP are −5.788 and −4.730, respectively, both significantly negative at the 1% level. This result indicates that the carbon-reduction effect of ANQP is more pronounced when agricultural land productivity is higher, thereby providing empirical support for the land-productivity channel. This finding is consistent with the theoretical mechanism that ANQP improves land productivity by increasing output per unit sown area through technological innovation and factor optimization. Higher land productivity enables more intensive and efficient agricultural production with lower resource use, thereby contributing to the reduction in TACE. Therefore, Hypothesis H4 is supported.
5.6. Heterogeneity Analysis
Given the substantial differences in geographic location, functional zoning, and digital infrastructure across provinces, the effect of ANQP on TACE may vary accordingly. Therefore, a heterogeneity analysis is conducted from the following perspectives.
5.6.1. Heterogeneity Across Geographic Regions
Given China’s vast territory, the development of ANQP across provinces, autonomous regions, and municipalities is unbalanced. The eastern region is more industrialized, whereas agriculture still accounts for a relatively large share of the economy in the central and western regions. To examine whether ANQP has differential effects on TACE across regions, following common regional classification practices in studies on agricultural heterogeneity, the sample is divided into the eastern region and the central–western regions for subsample analysis [
83]. The specific results are presented in
Table 14. The estimated coefficients of ANQP on TACE are 0.164 and −6.647 for the two regions, respectively. In terms of statistical significance, the coefficient for the central and western regions is significant at the 1% level, whereas that for the eastern region is positive but statistically insignificant. This result indicates that the emission reduction effect of ANQP is more pronounced in regions with stronger agricultural production foundations. In the central and western regions, agriculture accounts for a relatively large share, and the agricultural production foundation is comparatively solid. Therefore, the role of ANQP in optimizing agricultural production methods is more prominent, thereby significantly suppressing TACE. However, the agricultural production foundation in the eastern region is relatively weak, and its emission reduction effect is not significant.
5.6.2. Heterogeneity Across Functional Zoning Categories
Considering the differences in resource endowments, production conditions, and technological application between China’s major grain-consuming areas and major grain-producing areas, the impact of ANQP on TACE may exhibit distinct regional characteristics [
84]. This study conducts a heterogeneity analysis by dividing 30 provinces, autonomous regions, and municipalities directly under the central government into major grain-consuming areas and major grain-producing areas based on the Opinions on Reforming and Improving Several Policy Measures for Comprehensive Agricultural Development issued by the Ministry of Finance in 2003. The specific results are presented in
Table 15. The estimated coefficients of ANQP on TACE are −0.196 and −6.098 for the two regions, respectively. In terms of statistical significance, the coefficient for major grain-producing areas is significant at the 1% level, whereas that for major grain-consuming areas is statistically insignificant. This result indicates that the carbon reduction effect of ANQP is more pronounced in regions with more prominent agricultural functions. Agricultural production in major grain-producing areas is more concentrated and larger in scale, and the role of ANQP in promoting green transformation is therefore stronger; however, agricultural functions in major grain-consuming areas are relatively weaker, and their emission reduction effects are not significant.
5.6.3. Heterogeneity Across Digital Infrastructure Levels
Digital infrastructure is a critical prerequisite for integrating digital technology into the agricultural economic system and for facilitating technological diffusion, value creation, and green transformation in agriculture [
85]. The application of digital technology can promote green and low-carbon transformation while enhancing value creation, which is essential for enabling the carbon-reduction effect of ANQP. The capacity of mobile telephone exchanges reflects the carrying and coverage capacity of a region’s basic communication network and captures the underlying physical conditions for the transmission, exchange, and diffusion of digital information. This study measures the level of regional digital infrastructure based on the capacity of mobile telephone exchanges and divides the sample into high- and low-level groups according to the median for subgroup regression analysis. The corresponding results are reported in
Table 16. In terms of statistical significance, the carbon-reduction effect of ANQP is significant only in regions with low levels of digital infrastructure, whereas it is not significant in regions with high levels of digital infrastructure.
To further interpret this pattern, the heterogeneous effect can be explained from the perspective of nonlinear marginal returns to digital infrastructure. In regions with relatively low levels of digital infrastructure, digital development is still at an early stage, and additional investment can generate substantial marginal improvements in agricultural information access, resource allocation, production coordination, and technology adoption. Under these conditions, even moderate enhancements in digital infrastructure may significantly strengthen the carbon-reduction effect of ANQP. However, as digital infrastructure continues to improve, its marginal contribution to agricultural carbon reduction may gradually diminish. In regions where digital infrastructure is already relatively well developed, basic digital access and communication networks have largely been established, leaving limited scope for further efficiency gains from additional infrastructure expansion. This pattern may suggest that the role of digital infrastructure exhibits a nonlinear relationship, in which its carbon-reduction enabling effect is stronger before a certain threshold is reached but may weaken as digital development approaches a more mature or saturated stage, potentially reflecting diminishing marginal returns in its impact on agricultural carbon emissions.
5.7. Discussion
The above findings can be further understood in relation to existing research. First, the benchmark result is consistent with studies showing that agricultural digital transformation, the digital economy, and green technology innovation can reduce agricultural carbon emissions or improve agricultural green performance [
5,
6,
17,
18]. However, compared with studies focusing on a single digital or technological factor, this study examines ANQP as an integrated productivity system and provides evidence that system-level productivity upgrading can generate measurable carbon-reduction effects in agriculture.
Second, the mechanism results complement studies emphasizing the roles of technological innovation, agricultural labor productivity, production technical efficiency, land-use efficiency, and agricultural carbon productivity in agricultural carbon reduction [
46,
53,
55,
61]. By incorporating agricultural technological innovation, rural labor productivity, and agricultural land productivity into a unified analytical framework, this study further clarifies how innovation-driven upgrading and factor-efficiency improvement jointly support the ANQP–TACE relationship.
Third, the heterogeneity results enrich the discussion on the regional conditions under which productivity upgrading generates environmental benefits. The stronger effects observed in the central and western regions, major grain-producing areas, and regions with relatively weak digital infrastructure indicate that the carbon-reduction effect of ANQP is context-dependent. This finding suggests that the environmental returns of ANQP may be greater in regions where agriculture remains more central to the local economy and where there is still substantial room for productivity and efficiency improvement.
6. Conclusions and Policy Recommendations
Green and low-carbon development has become a fundamental requirement for modernizing agriculture, and ANQP—driven by technological innovation and green transformation—constitutes an important engine of this transition. Drawing on provincial panel data from China for 2012–2023, this study combines theoretical analysis with empirical evidence to investigate how ANQP affects TACE and through what channels this effect operates. The main conclusions are threefold. First, the baseline results indicate that ANQP exerts a significant inhibitory effect on TACE. Second, the mechanism analysis shows that this effect operates mainly through agricultural technological innovation, rural labor productivity, and agricultural land productivity. Third, the emission-reduction effect displays clear regional heterogeneity, with stronger effects observed in the central and western regions, major grain-producing areas, and areas with relatively weak digital infrastructure. In the context of ongoing global climate governance and the continued implementation of China’s “dual carbon” strategy, greater emphasis should be placed on fostering ANQP to advance the green and low-carbon transformation of agriculture.
Building on the above analysis, a set of policy directions can be outlined to enhance the low-carbon role of ANQP and support the sustainable transformation of agriculture, with particular attention to technological progress, regional differentiation, institutional support, and industrial upgrading.
Technological innovation and improvements in factor efficiency remain central to strengthening the low-carbon enabling effect of ANQP. The underlying channels through which ANQP contributes to emission reduction are closely associated with technological progress, labor productivity, and land-use efficiency. In this regard, greater emphasis should be placed on advancing green and low-carbon agricultural technologies, including precision agriculture, efficient cultivation and breeding practices, and resource recycling. At the same time, improving farmers’ capacity to adopt and apply such technologies through targeted training programs is essential for sustaining gains in labor productivity. Optimizing land-use structure and promoting more intensive and standardized production models can further enhance both productivity and ecological outcomes, thereby reinforcing the joint improvement of factor efficiency and carbon reduction.
At the same time, the effectiveness of ANQP in reducing emissions varies across regions, suggesting the importance of region-specific strategies. In areas with relatively limited resource endowments, strengthening technological support and increasing financial investment remain important for narrowing development gaps and unlocking the potential for low-carbon transformation. In major grain-producing regions, greater emphasis should be placed on balancing food security with ecological protection by promoting high-yield and low-carbon production models, as well as technologies that enhance agricultural carbon sinks. In regions with more advanced digital infrastructure, attention may shift toward deepening the integration of digital technologies into agricultural production, improving monitoring and management systems, and enhancing the efficiency of resource allocation.
In addition, institutional support and market-based incentive mechanisms play an important role in sustaining long-term low-carbon development. Establishing a more comprehensive policy framework, including financial subsidies, tax incentives, and green finance instruments, can encourage the adoption of low-carbon agricultural practices. Further development of agricultural carbon markets and carbon-sink compensation mechanisms may help incorporate emission-reduction activities into market-based systems and strengthen endogenous incentives. At the same time, promoting interregional technological cooperation and resource sharing can facilitate the diffusion of advanced low-carbon technologies and support coordinated improvements in productivity and environmental performance.
Finally, advancing the transformation of the agricultural energy structure, together with broader industrial integration, can help consolidate the foundation for low-carbon agricultural development. Reducing reliance on fossil fuels and expanding the use of renewable energy sources, such as solar and biomass energy, can lower emissions associated with agricultural production. Meanwhile, promoting the integrated development of primary, secondary, and tertiary agricultural industries and extending green and low-carbon value chains can support the emergence of new growth drivers while contributing to the sustainable transformation of the agricultural sector as a whole.
7. Limitations of the Study
Although this study contributes to understanding the effect of ANQP on TACE and its underlying mechanisms, several limitations remain.
First, this study is subject to several data-related constraints. Owing to the release schedule of official statistics, the empirical analysis covers the period up to 2023. Although the sample adequately captures medium- and long-term trends, it does not fully reflect the latest policy developments or market changes. This may somewhat limit the timeliness of the analysis, although it does not affect the overall value of the study in identifying broad patterns and structural relationships. In addition, this study is based on provincial-level panel data. While this design is well suited to ensuring adequate sample coverage and reliable estimation, it is less able to capture the behavioral responses and underlying mechanisms of micro-level economic agents in a highly detailed manner.
Second, the selection of variables also has certain limitations. For example, the measurement of agricultural carbon emissions in this study mainly focuses on crop-production-related sources. As a result, broader emission sources, such as livestock production, agricultural transportation, agricultural product processing, and agricultural waste treatment, are not included, partly due to constraints in data availability and consistency of measurement.
Finally, this study is bound by its macro-institutional setting. Both the analytical framework and the indicator system were constructed in light of China’s specific development stage and institutional environment. While the findings yield useful policy insights, their applicability beyond the Chinese context should be tested further through comparative research across countries or through empirical replication in other major agricultural economies.
In light of these limitations, future research can be advanced along three main lines. First, extending the observation period and incorporating micro-level survey data from farmers and agricultural enterprises would help uncover the behavioral underpinnings and heterogeneous effects behind the macro-level relationships identified in this study. Second, future research could extend the analysis by incorporating a more comprehensive range of emission sources, which would provide a more complete assessment of agricultural carbon emissions and further enrich the understanding of the relationship between ANQP and environmental outcomes. Third, further validation through comparative analysis and replication in representative agricultural countries or regions would help generate theoretical insights and policy implications with broader applicability.