Article

Mechanisms of Urban Expansion’s Impact on Flood Susceptibility in Mountainous Dam Areas and Implications for Sustainable Planning: A Case Study of Zhaotong, China
1
School of Earth Sciences, Yunnan University, Kunming 650504, China
2
Kunming Engineering Corporation Limited, Kunming 650051, China
*
Authors to whom correspondence should be addressed.
Sustainability 2026, 18(10), 5158; https://doi.org/10.3390/su18105158
Submission received: 6 April 2026 / Revised: 9 May 2026 / Accepted: 18 May 2026 / Published: 20 May 2026
(This article belongs to the Topic Disaster Risk Management and Resilience)

Abstract

Under the dual pressures of global climate change and rapid urbanization, the spatial contradiction between urban expansion and flash flood disasters in mountainous dam areas is increasingly evident. However, the mechanisms by which the multi-dimensional characteristics of urban expansion affect regional flash flood susceptibility (FFS) remain unclear, limiting scientific guidance for source-level disaster prevention. This study uses Zhaotong City, a flash flood-prone area in the lower Jinsha River basin of southwestern China, as a case study. Using land use and multi-source remote sensing data from 2000 and 2025, we identify urban expansion patterns and morphological characteristics, apply the XGBoost-SHAP model to evaluate flash flood susceptibility and determine dominant factors, and employ the generalized additive model (GAM) to quantify the nonlinear responses of expansion dimensions to FFS. Results show the following: (1) Urban expansion in Zhaotong City is primarily edge (51%) and leapfrog (46%), clustering along river valleys, dam areas, and transportation corridors. (2) The XGBoost model performs well (AUC = 0.877). Elevation, slope, normalized difference vegetation index (NDVI), and precipitation are the primary natural factors influencing FFS. About 15.66% of the city falls within the high/very high FFS zones, mainly in the Zhaolu Dam area, riverbanks of main and tributary streams, and the urban built-up area. (3) Urban expansion-related indicators explain 28.6% of the spatial variation in FFS, with leapfrog expansion as the primary driver (contribution rate 32.75%). Disorderly urban growth and morphological imbalance significantly increase flash flood susceptibility. This study provides a scientific basis for spatial planning, flash flood prevention and control, and climate-adaptive urban development in similar mountainous dam areas in Southwest China and Asia, supporting regional sustainable development goals.

1. Introduction

Flash floods in mountainous areas are sudden and highly destructive, often causing catastrophic loss of life, ecological damage, and the destruction of infrastructure. They can also trigger secondary disasters, including soil erosion, landslides, and debris flows [1,2]. According to the International Disaster Database, between 2000 and 2023, over 700 flash flood events occurred worldwide, resulting in more than 25,000 deaths, which account for 70% of flood-related fatalities, and causing direct economic losses exceeding 80 billion USD [3]. As China’s policy and economic focus shifts toward the central and western regions, southwestern China has become an emerging hotspot for urban expansion in recent years [4]. Mountainous, dam-affected towns are built in intermontane basins and river valley alluvial plains [5]; however, the rugged terrain, heavy rainfall, and dense river networks make these towns highly susceptible to flash flood hazards [6]. In 2025, areas such as Zhaotong in Yunnan and Rongjiang in Guizhou experienced flash floods that exceeded standard thresholds, resulting in varying degrees of flooding in urban areas. Rapid urbanization and changes in land use patterns have further amplified flood risks [7], making flood disasters one of the primary challenges to sustainable urban development [8]. Balancing development with flood prevention and disaster mitigation during urbanization has become a critical issue in current urban planning and environmental management.
The sudden and localized nature of flash floods often constrains emergency response and rescue efforts [9]. Therefore, advancing rigorous flash flood susceptibility mapping is crucial for flood risk mitigation and infrastructure optimization in mountainous regions [10,11]. Flash flood susceptibility (FFS) refers to the probability or spatial propensity of a region to experience flash floods under specific natural, geographical, and climatic conditions [10]. Flash flood susceptibility evaluation methods are categorized into four types: physics-based models [6,12], multi-criteria decision analysis [13], statistical models [14], and data-driven machine learning approaches [15]. Machine learning (ML) methods, by analyzing complex relationships between historical disaster data and causal factors, enable efficient and high-precision predictions of regional flash flood susceptibility [16] and have become a mainstream tool in contemporary research. For example, Luan et al. [17] and Z. Wu et al. [18] leveraged the MaxEnt model, which requires only presence data, to predict regional flood susceptibility. Ke et al. [19] used Random Forest and CatBoost to assess susceptibility to flash flood occurrences. Zhuang et al. [3] utilized social media data and the XGBoost model to map flash flood susceptibility and recognize spatial patterns across China. Hoang et al. [20] applied six machine learning algorithms (MLP, GNB, SVM, KNN, XGBoost, RF) to predict flash flood probability and selected the best model to generate flood susceptibility maps. In recent years, an increasing number of studies have incorporated the Shapley Additive Explanations (SHAP) method to enhance the interpretability and decision transparency of machine learning models [19]. SHAP values quantify the marginal contribution of each input feature, offering a clear visualization of the model’s decision-making process [21]. Various visualization methods, including swarm plots, waterfall plots, force plots, and interaction value plots, facilitate multi-dimensional analysis of the impact of different causal factors on flood susceptibility prediction [22,23]. Therefore, combining machine learning with the SHAP method not only improves prediction accuracy but also enhances the model’s interpretability, offering more reliable support for flash flood risk management and scientific decision-making.
Urban expansion significantly affects regional flood susceptibility by altering surface cover structures and hydrological processes [24,25,26]. Significant differences exist in the effects of urban expansion patterns (UEP)—infilling (high-density development), edge expansion (sprawl), and leapfrog (fragmentation)—on flood susceptibility, yet existing conclusions remain divergent [27]. Huang et al. [28] analyzed the correlation between flood vulnerability and different urban expansion patterns and found a significant positive correlation between infilling expansion and flood vulnerability. However, other studies suggest that edge and leapfrog expansions are the dominant factors. For instance, Wang et al. [29] found that edge expansion was most strongly correlated with flood susceptibility in the flood-prone areas of the North China Plain. Similarly, Han et al. [30] found that leapfrog and edge expansion in cities along the Yangtze River Economic Belt of China were significantly associated with flood occurrence, whereas no such correlation was found with infilling expansion. These discrepancies may be attributed to regional variations, such as geographical environment and urban development stages. Additionally, the morphological characteristics of urban expansion indirectly shape the spatial patterns of flood susceptibility by regulating surface runoff generation and convergence processes [31]. From a hydrological perspective, Zhu et al. [32] argued that compact, contiguous impervious surface expansion slows runoff convergence, whereas fragmented expansion accelerates surface runoff. Mei et al. [33] further indicated that road density and patch uniformity are negatively correlated with flood inundation areas, and that both influence peak flow and velocity by altering the confluence efficiency and connectivity of surface runoff. Overall, urban expansion and flooding exhibit a multi-dimensional, heterogeneous, and region-specific relationship, providing a crucial foundation for understanding flood responses in the context of rapid urbanization.
However, previous studies have primarily focused on urban agglomerations [25] or developed cities [31], leaving the relationship between the expansion of rapidly urbanizing emerging towns in mountainous dam areas and flash floods insufficiently explored. Mountainous dam areas feature pronounced topographic relief, with human settlements mostly confined to narrow dams [34]. Urban expansion increases flash flood risk by modifying surface permeability, disrupting natural runoff pathways, and reducing ecological regulation space [35]. Previous research on urban expansion and flash floods in mountainous dam areas has largely examined the effects of land use change on macro-hydrological processes [36] or reduced urban expansion to a single indicator for evaluation [25], lacking a systematic, integrated analysis of its multidimensional characteristics, including patterns and morphologies. Furthermore, flash flood susceptibility is not solely governed by natural factors, as human activities increasingly influence and modify it [20]. However, most studies focus on flood risk or vulnerability [28], and a direct connection between urban expansion and flood susceptibility remains unestablished, limiting scientific support for source-level disaster prevention and control.
The study aims to address the following key scientific questions: (1) What are the spatiotemporal characteristics of urban expansion in rapidly urbanizing towns in mountainous regions? (2) How can interpretable flash flood susceptibility evaluation be achieved to reveal its spatial heterogeneity and dominant factors? (3) How do the multi-dimensional characteristics (patterns and morphologies) of urban expansion influence flash flood susceptibility? This study selects Zhaotong City, located in the lower reaches of the Jinsha River in southwestern China, as the study area. First, it examines the spatiotemporal characteristics of urban expansion from 2000 to 2025. Next, it constructs an XGBoost-SHAP model to assess flash flood susceptibility and identify its dominant factors. Finally, it employs a GAM to analyze the nonlinear response between urban expansion and flood susceptibility. This study aims to deepen the understanding of flash flood susceptibility in mountainous towns from the “patterns-morphologies” perspective, providing essential scientific evidence for climate-adaptive planning, disaster risk prevention and mitigation, and sustainable development.

2. Materials and Methods

2.1. Study Area

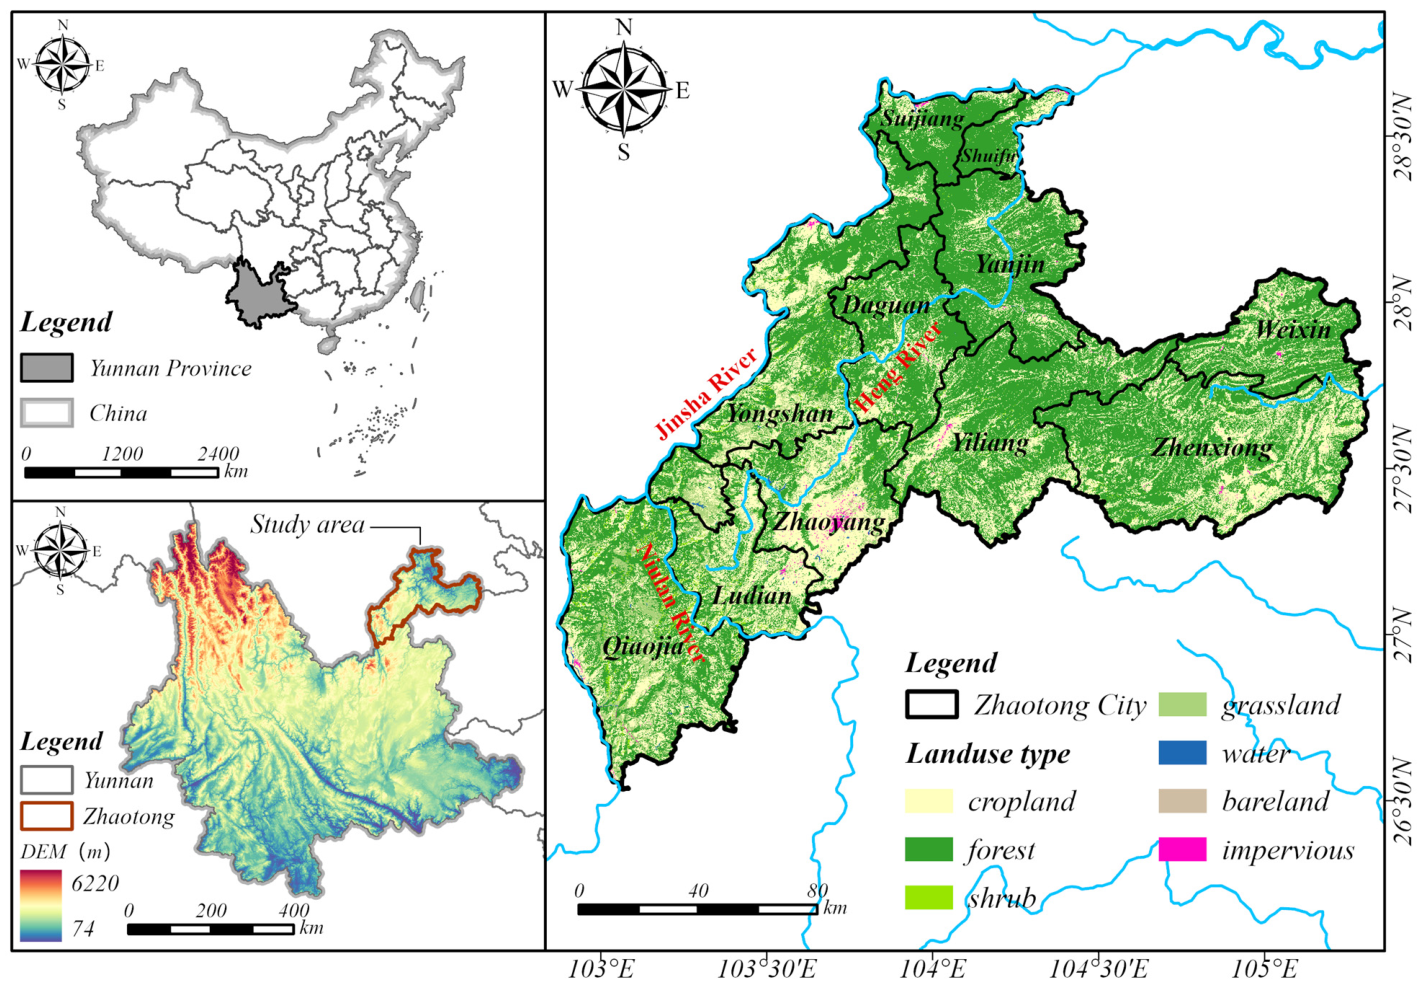
The study area is located in Zhaotong City, Yunnan Province, China (Figure 1), in the hinterland of the Wumeng Mountain region, where the provinces of Yunnan, Guizhou, and Sichuan converge (102°52′ E–105°19′ E, 26°55′ N–28°36′ N), in the lower reaches of the Jinsha River. The city covers an area of approximately 23,000 square kilometers, including 9 counties (Ludian, Qiaojia, Zhenxiong, Yiliang, Weixin, Yanjin, Daguang, Yongshan, and Suijiang), as well as Shuifu City and Zhaoyang District. Zhaotong has a typical plateau monsoon climate with distinct seasonal variations and significant vertical gradients. The average annual temperature ranges from 11 °C to 21 °C, with annual precipitation ranging from 660 to 1100 mm. Precipitation is unevenly distributed both spatially and temporally, with approximately 70% to 85% of rainfall concentrated in the rainy season from May to October, often as high-intensity, short-duration rainstorms. The terrain is higher in the southwest and lower in the northeast, sloping northward, presenting a typical plateau-mountain landscape. Rivers such as the Jinsha, Niulan, and Hengjiang rivers have deeply incised valleys, forming numerous V-shaped gorges and steep slopes. The surface is fragmented, with generally steep slopes and fragile geological structures, resulting in significant risks of landslides, mudflows, and other geological hazards. The combined influence of climate and topography has made Zhaotong one of the most flood- and disaster-prone regions in Yunnan Province.
Zhaotong City is a critical ecological security barrier in the upper reaches of the Yangtze River, serving as an important hub for Yunnan’s integration into the Yangtze River Economic Belt and its connection with the Chengdu-Chongqing Twin-city Economic Circle, as well as a gateway linking the central Yunnan urban agglomeration to the upper Yangtze River Economic Belt [4]. However, urbanization continues to encroach upon ecological spaces, with urban expansion spreading into surrounding dam areas, gentle slopes, and river valleys. This expansion often alters natural landforms and hydrological processes, resulting in significant changes in regional runoff generation and convergence conditions. In addition to climate change, the risks of flash floods have significantly increased in recent years.

2.2. Data Sources and Preprocessing

This study uses data from several sources, including land use, hydrometeorological, and other datasets, as outlined in Table 1. Land use/land cover (LULC) data are obtained from China’s National Land Use and Cover Change (CNLUCC) database. The primary classification comprises six categories—cropland, forest, grassland, water, construction land, and unused land—which are used to extract urban expansion from 2000 to 2025. SRTM DEM has demonstrated superior performance in previous flood susceptibility assessments [37], with slope, curvature, and the topographic wetness index (TWI) calculated from the DEM. Using river and road vector data, two factors—distance to rivers and distance to roads—are derived using ArcMap 10.8’s Euclidean distance tool. To account for interannual precipitation variability, this study utilizes long-term data from 2000 to 2025. Rainfall frequency is derived from the CHIRPS daily precipitation dataset on the GEE cloud platform by extracting the number of days with daily precipitation exceeding 50 mm and calculating the pixel-wise annual average of rainstorm days. Nighttime light (NTL) data are derived from annual NPP-VIIRS observations, which are cropped, projected, and processed using median filtering and low-threshold denoising to remove outliers and background noise. Due to data update limitations, NTL and soil data correspond to years near 2025. To maintain consistency, all raster data are standardized to a spatial resolution of 100 m, and the UTM coordinate system is used throughout the study.

2.2.1. Flood Inventory Construction

Flood inventories are employed to record detailed information, including location, frequency, and other attributes, of historical floods. In this study, flood sample points are derived from two data sources: (1) Yearbook disaster records: The Yunnan Disaster Reduction Yearbook and the Yunnan Volume of the China Meteorological Disaster Encyclopedia provide flood records in Yunnan Province from 2000 to 2020, encompassing extreme hydrological events, including flash floods and river floods. Place names reported in these records are primarily used to determine the spatial locations of disasters. For example, if a specific village or river is explicitly reported as the disaster location, the corresponding coordinates are assigned to the event using GIS spatial registration. If disaster information only specifies the administrative region, the centroid of the administrative polygon represents the flood point, following the approach used in previous studies [37,38]. (2) Global Flood Database: To expand the sample size for machine learning, we employed historical flood inundation extent data (2000–2018, spatial resolution 250 m) from the Global Flood Database “http://global-flood-database.cloudtostreet.info/” (accessed on 4 March 2026) [39]. To exclude sporadic events, raster cells with inundation frequency ≥ 2 were selected, and within each independent flood area, the raster with the highest frequency was chosen as the representative point, yielding a total of 220 flood samples. Ultimately, 335 flash flood outbreak points served as positive samples for machine learning.
To ensure sample quality, this study employs a stratified random sampling method to select non-flood points as negative samples. The procedure is as follows: (1) A 1 km buffer zone is established around each flood point, and this area is excluded to reduce the risk of sample misclassification due to flood boundary uncertainty [40]; (2) The remaining area is spatially stratified according to three key environmental factors: altitude, slope, and land use type; (3) Within each stratum, non-flood candidate points are randomly selected based on the area ratio of each stratum, yielding a total of 335 non-flood points. Flood points are assigned a value of 1, and non-flood points a value of 0.

2.2.2. Flood Conditioning Factors

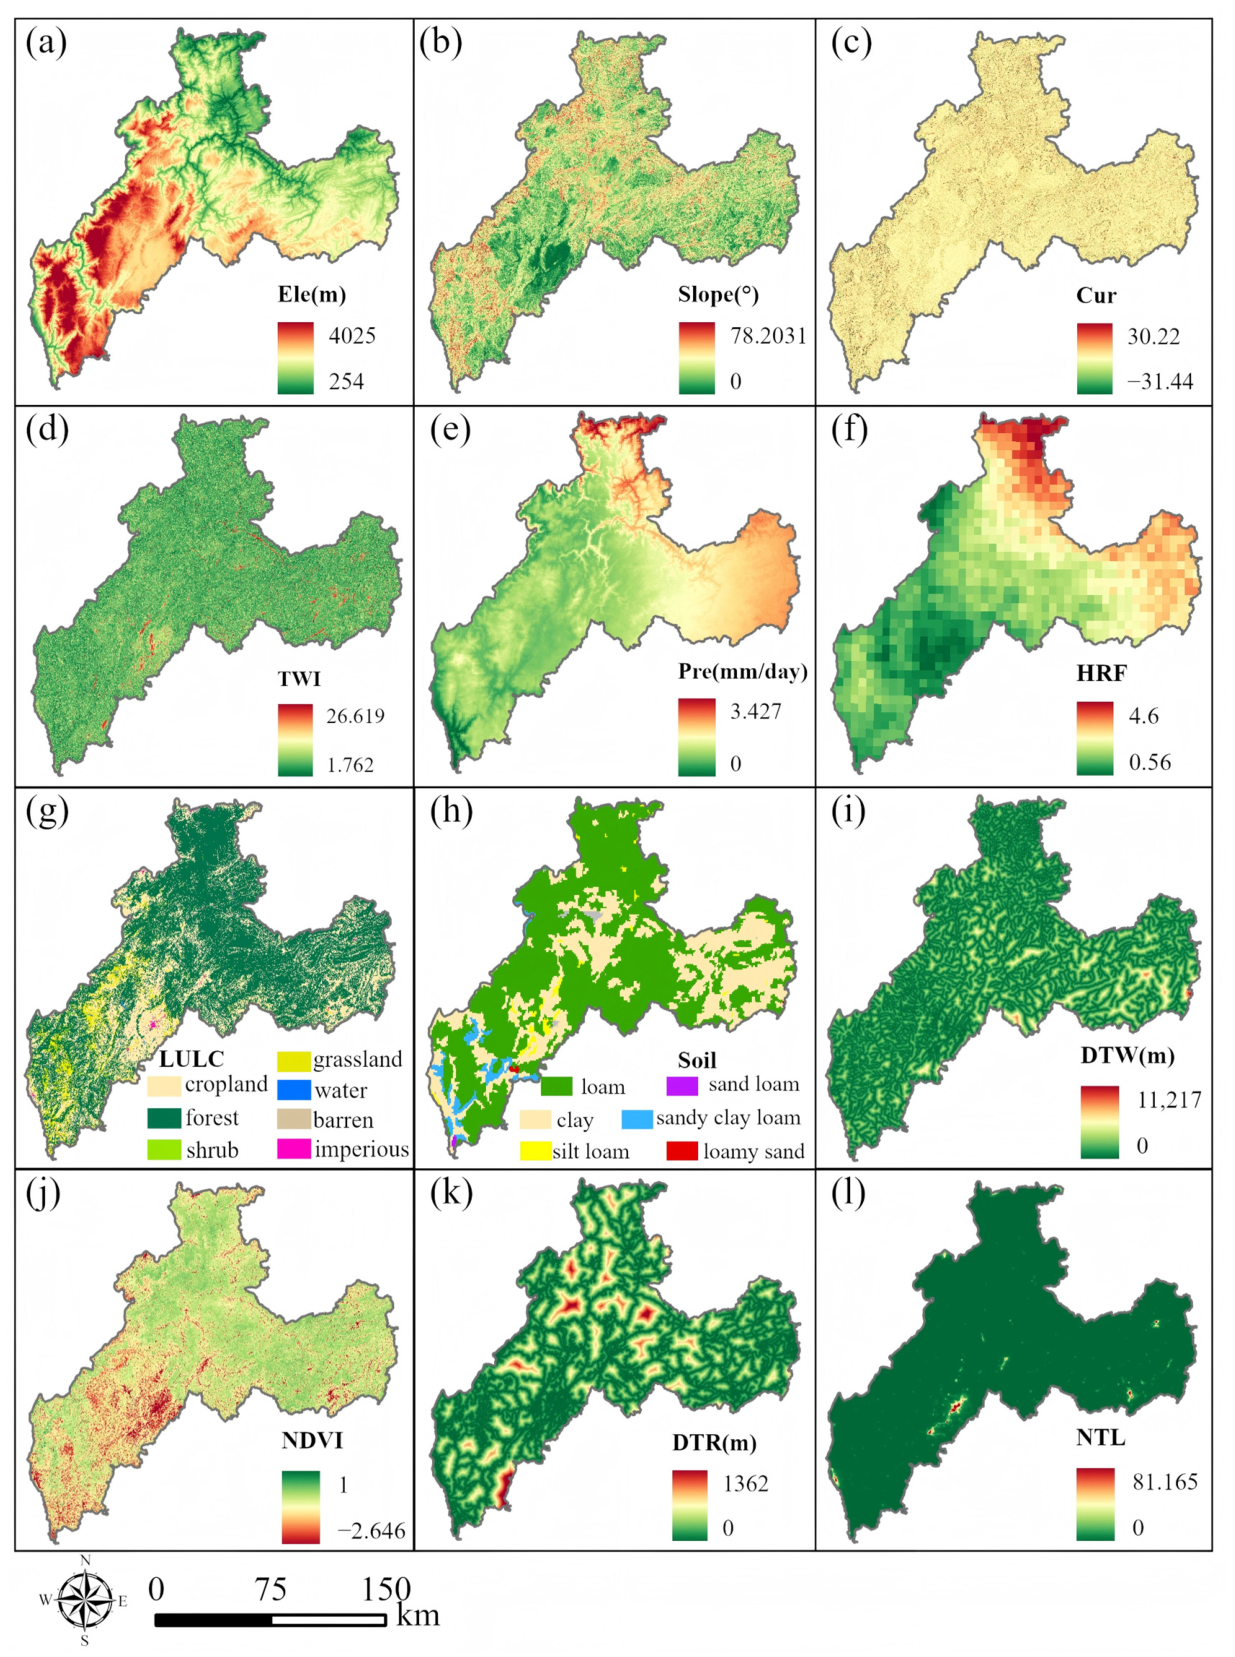
Flood conditioning factors refer to those that influence or regulate the occurrence, propagation, and intensity of floods. Considering the natural and social environment of Zhaotong City, data availability, and the applicability of indicators [3], 12 factors were selected from four categories—topography, climate, environment, and human activities—as flood conditioning factors, as shown in Table 2 and Figure 2. Previous studies have confirmed that these variables are associated with flood susceptibility [41,42]. The raster of each factor was projected and resampled to a 100 m × 100 m resolution to balance the consistency of multi-source data, computational efficiency, and spatial accuracy. To avoid multicollinearity affecting the accuracy of subsequent machine learning models, we used the variance inflation factor (VIF) measure. The VIF of the 12 independent variables is <2.06 (a VIF < 10 is considered acceptable, see Table S1 and Figure S1), indicating no multicollinearity problem between the variables.

2.3. Methods and Models

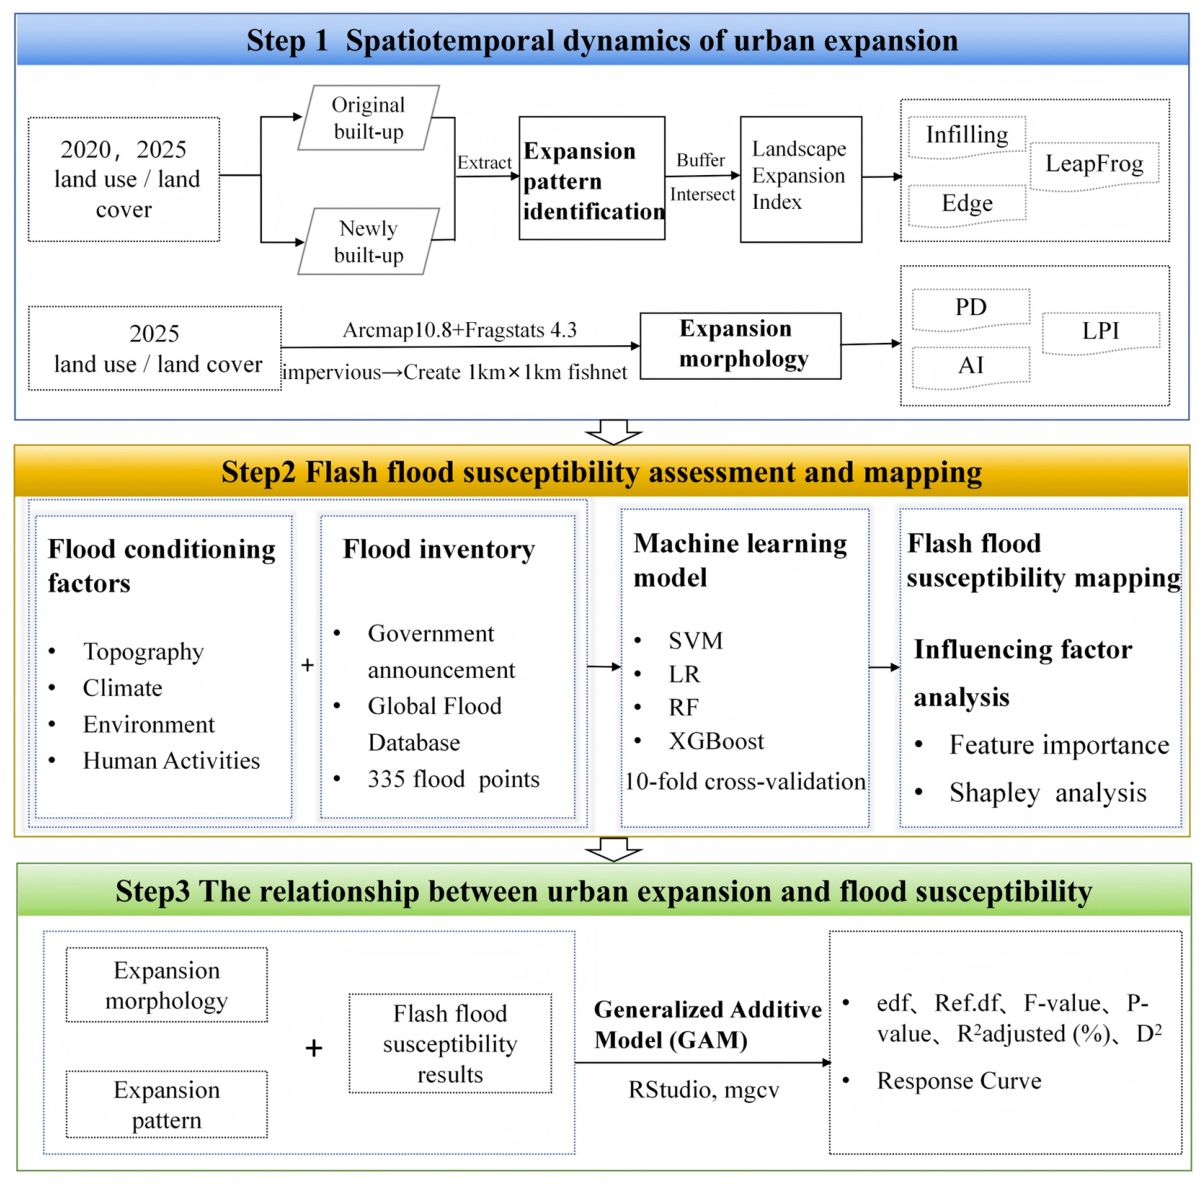
This study systematically investigates the impact of urban expansion on flash flood susceptibility in Zhaotong City from two perspectives: expansion patterns and spatial morphology. The overall research framework comprises three core steps:
(1)
Urban expansion feature extraction: Using land use data from 2000 and 2025, the urban built-up areas of the study area are delineated. Three urban expansion patterns are identified using the Landscape Expansion Index (LEI), and three urban spatial morphology indicators are calculated based on the 2025 land use data;
(2)
Flash flood susceptibility assessment and spatial mapping: A flood sample inventory and a flood regulation factor index system are constructed. Four machine learning models—XGBoost, Support Vector Machine (SVM), Logistic Regression (LR), and Random Forest (RF)—are compared. The optimal model is selected to perform flash flood susceptibility prediction and spatial mapping, and the SHAP framework is applied to analyze influencing factors;
(3)
Nonlinear response analysis: Using the six urban expansion indicators from step one as independent variables and the flood susceptibility index from step two as the dependent variable, a generalized additive model (GAM) is constructed to quantify the nonlinear response of each expansion indicator to the flash flood susceptibility index (FFSI).
The technical approach is illustrated in Figure 3.

2.3.1. Urban Expansion Indicator Construction

(1)
Urban Expansion Patterns
The Landscape Expansion Index (LEI) [54] is used to quantify the spatial relationship between original and newly developed urban patches to identify different patterns of urban expansion. Specifically, edge expansion refers to new urban patches extending outward along the periphery of existing urban areas. Leapfrog expansion refers to newly developed urban patches that are independent of existing built-up areas. Infilling expansion refers to new urban patches filling vacant spaces within existing urban areas [55,56]. The L E I is calculated as follows:
L E I = A O A O + A V
Here, A O represents the extent of original urban land within the buffer zone of newly developed areas, and A V represents the area of non-urban land located within the buffer zone of newly developed urban patches. Following J. Liu et al. [57], this study sets the buffer radius to 30 m to ensure consistency with the resolution of the land use data. The L E I ranges from 0 to 100. When the L E I is between 0 and 50 (0 < L E I < 50), it indicates edge expansion. When newly developed urban patches do not overlap with existing urban patches and their L E I is 0, this is considered leapfrog expansion. When the L E I exceeds 50 ( L E I ≥ 50), any newly developed urban patch is considered infilling expansion [58].
(2)
Urban Expansion Morphology
This study selects three landscape pattern indices to characterize the morphological features of urban expansion, as presented in Table 3. These three morphological features represent the influence of urban spatial form on surface runoff generation and convergence processes and are among the most widely used and representative indicators in studies of urban expansion and flood risk [32,33]. The formula is as follows. All indices are calculated on a 1 km × 1 km grid scale using Fragstats 4.3 software.
P D = N i A × 10,000 × 100
Here, N i represents the number of patches of a specific land use type, and A is the total area of the study region. P D measures the number of patches per unit area.
L P I = ( m a x ( a i j ) / A ) × 100 %
Here, m a x ( a i j ) is the area of the largest patch in the built-up area, and A is the total area of the entire landscape.
A I = g i i m a x g i i × 100
Here, g i i represents the actual number of adjacent edges between pixels of the same land use type.

2.3.2. Flash Flood Susceptibility Evaluation

Frequency Ratio
The Frequency Ratio (FR) model is a bivariate statistical method used to quantify the contribution of each factor category to disaster occurrence by calculating the distribution frequency of flash flood events across various flood conditioning factor categories [59]. The FR for each factor is calculated using the equation below:
FR = ( N ( F i ) / N ( S i ) ) / ( N ( F ) / N ( S ) )
Here, N ( F i ) represents the number of flood pixels within each flood conditioning factor subclass, N ( S i ) represents the total number of pixels within the subclass; N ( F ) represents the overall distribution of flood occurrences for the conditioning factor, and N ( S ) represents the total number of pixels in the area. In general, FR > 1 indicates a strong relationship between environmental conditions and flood conditioning factors, while FR < 0 indicates a weak relationship [59]. Finally, FR will be used as input for machine learning models to perform integrated modeling.
Machine Learning Algorithms and Performance Evaluation
To ensure the robustness of the models, this study compares XGBoost with three other models—SVM, LR, and RF—all of which are trained using the same sample set and factor system. The dataset was randomly stratified into training (70%) and validation (30%) subsets to preserve the integrity of the class distribution. The key hyperparameters of each model are optimized using a combination of randomized search (RandomizedSearchCV) and 10-fold hierarchical cross-validation. The resulting optimal hyperparameters are presented in Table S3. Model performance was assessed using the ROC curve, area under the curve (AUC), accuracy, recall, precision, and F1 score. The output of the machine learning model is the Flash Flood Susceptibility Index (FFSI).
(1)
eXtreme Gradient Boosting Tree (XGBoost)
XGBoost, based on Gradient Boosting Decision Trees (GBDT), incorporates second-order gradient optimization and regularization techniques to prevent overfitting [60], while also improving the model’s generalization and interpretability [21]. It automatically adjusts the tree structure to minimize errors and accelerates training through parallel computing, making it well-suited for large-scale data. This method has demonstrated superior performance in various susceptibility evaluations when compared to other methods [47,61].
(2)
Random Forest (RF)
RF model improves prediction performance by constructing multiple independent decision trees [62]. For classification tasks, each tree generates a class prediction, and the final result is determined by majority voting [3]. RF shows strong predictive ability in flood susceptibility assessments, owing to its high accuracy and computational efficiency [63].
(3)
Support Vector Machine (SVM)
SVM uses a kernel function to map the original input data into a high-dimensional feature space, transforming non-linearly separable problems into linearly separable ones. In this space, it constructs an optimal separating hyperplane that maximizes the margin between classes [3]. As a result, SVM can effectively capture the complex nonlinear relationships between environmental factors and flood occurrence [63].
(4)
Logistic Regression (LR)
LR is a multivariate statistical method used to estimate and predict the likelihood of an event occurring by analyzing multiple variables. This method uses binary classification data, such as 1 or 0 (presence or absence), to establish the relationship between flash floods and the factors influencing them [64].
SHAP Attribution Analysis and Factor Contribution Identification
Shapley Additive Explanations (SHAP) is a game-theoretic method used to explain complex machine learning models by quantifying feature importance and identifying potential multicollinearity among input variables [65]. It assigns a Shapley value to each feature, reflecting its average marginal contribution to the model’s prediction across all possible feature combinations [66]. By analyzing the positive and negative SHAP values and their alignment with the trends of flood conditioning factors, the impact of these factors on flood occurrence can be identified. When the SHAP value aligns with the trend of the factor’s value change, it indicates a monotonic influence on flood susceptibility. If the trend is opposite or there is no clear alignment, it indicates a non-monotonic influence [67].
g ( z ) = ϕ 0 + j = 1 M ϕ j z  
Specifically, g ( z ) is the simple explanatory model, z   { 0 ,   1 } M represents the observed state of the features, ϕ 0 is the baseline value, and ϕ j is the Shapley value of feature j .

2.3.3. Measurement of the Response Between Urban Expansion and Flood Susceptibility

The Generalized Additive Model (GAM) is a powerful tool for nonlinear semiparametric regression analysis, revealing the complex interactions between multiple independent variables and a single dependent variable. In addition to quantitatively explaining how independent variables affect the dependent variable, it employs nonlinear smoothing terms to achieve an optimal fit [68]. This study employs GAM to measure the complex response relationship between urban expansion indicators and FFS, with the VIF of the six urban expansion indicators being <6 (see Table S2 and Figure S2). The Effective Degrees of Freedom (EDF) is a key indicator in GAM used to characterize the degree of nonlinear response of urban expansion to flood susceptibility. Specifically, EDF = 1 indicates a linear relationship; 1 < EDF < 2 indicates weak nonlinearity; and EDF ≥ 2 indicates significant nonlinearity [69]. The mathematical expression is given below:
g ( E ( Y ) )   =   α   +   S 1 ( X 1 i )   +   S 2 ( X 2 i )   +   S p ( X pi )
Here, g is the link function, E ( Y ) is the mathematical expectation of the response variable, α is the intercept term, S p is a non-parametric function within the explanatory variables, and X p i represents the predictor variable. The GAM process is implemented using the “mgcv” package in R version 4.4.1.

3. Results

3.1. Spatial Changes in Urban Expansion

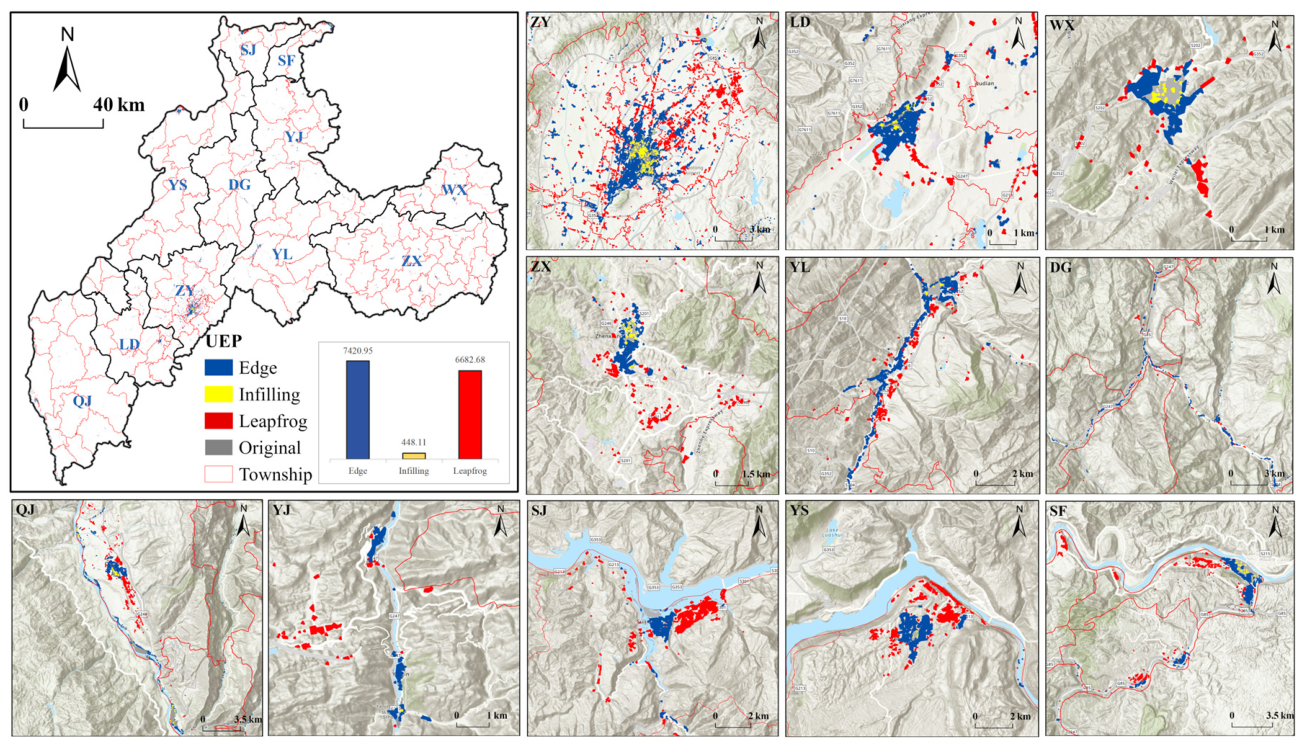
Between 2000 and 2025, the total area of urban construction land in Zhaotong City expanded by 145.52 km2, with an average annual growth of 6.06 km2. Overall, urban expansion follows a pattern of “linear spreading along transportation corridors and river valleys, with the central urban area as the core.” Among different expansion types, edge expansion dominates (~51%), whereas leapfrog expansion constitutes ~46%. As shown in Figure 4, the urban spatial expansion patterns of counties under Zhaotong City exhibit marked regional differentiation. Zhaoyang, Ludian, Weixin, and Zhenxiong display typical “spreading pancake” expansion, characterized by continuous outward growth of urban built-up areas coupled with numerous fragmented leapfrog developments. Yiliang and Daguan are primarily characterized by linear edge expansion along river valleys and major transportation routes. Constrained by topography and river networks, the built-up areas of Qiaojia, Yanjin, Suijiang, Yongshan, and Shuifu remain relatively limited. Urban expansion in these areas is primarily scattered, leapfrog development along major rivers, exhibiting a low degree of spatial agglomeration.

3.2. Spatial Heterogeneity of Flash Flood Susceptibility

3.2.1. Model Evaluation

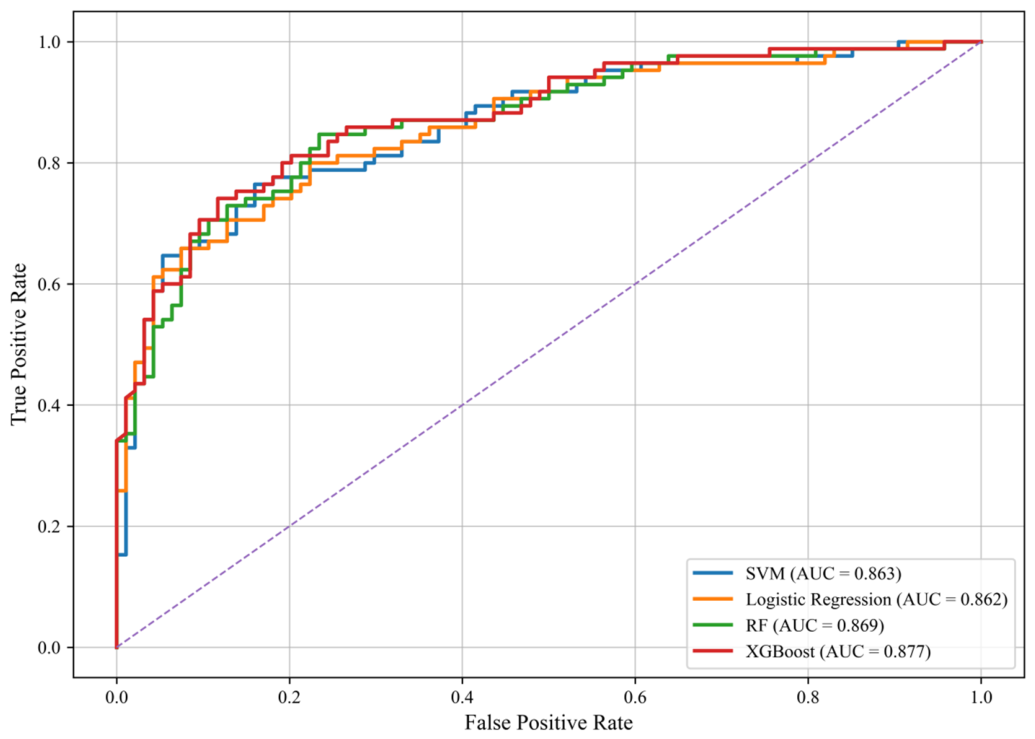
This study evaluated the flash flood susceptibility prediction performance of four models using the AUC-ROC curve and five metrics (see Figure 5 and Table 4). The hyperparameters of the ML classifiers were adjusted through ten-fold cross-validation using the training samples. XGBoost performed exceptionally well, with accuracy (0.793), recall (0.786), and F1 score (0.781) outperforming those of the other three models. Additionally, the AUC value of this model reached 0.877, indicating its excellent stability and classification capability, effectively distinguishing between flood and non-flood samples. Therefore, the XGBoost model was chosen for the subsequent flash flood susceptibility assessment in this study.

3.2.2. Flash Flood Susceptibility Assessment

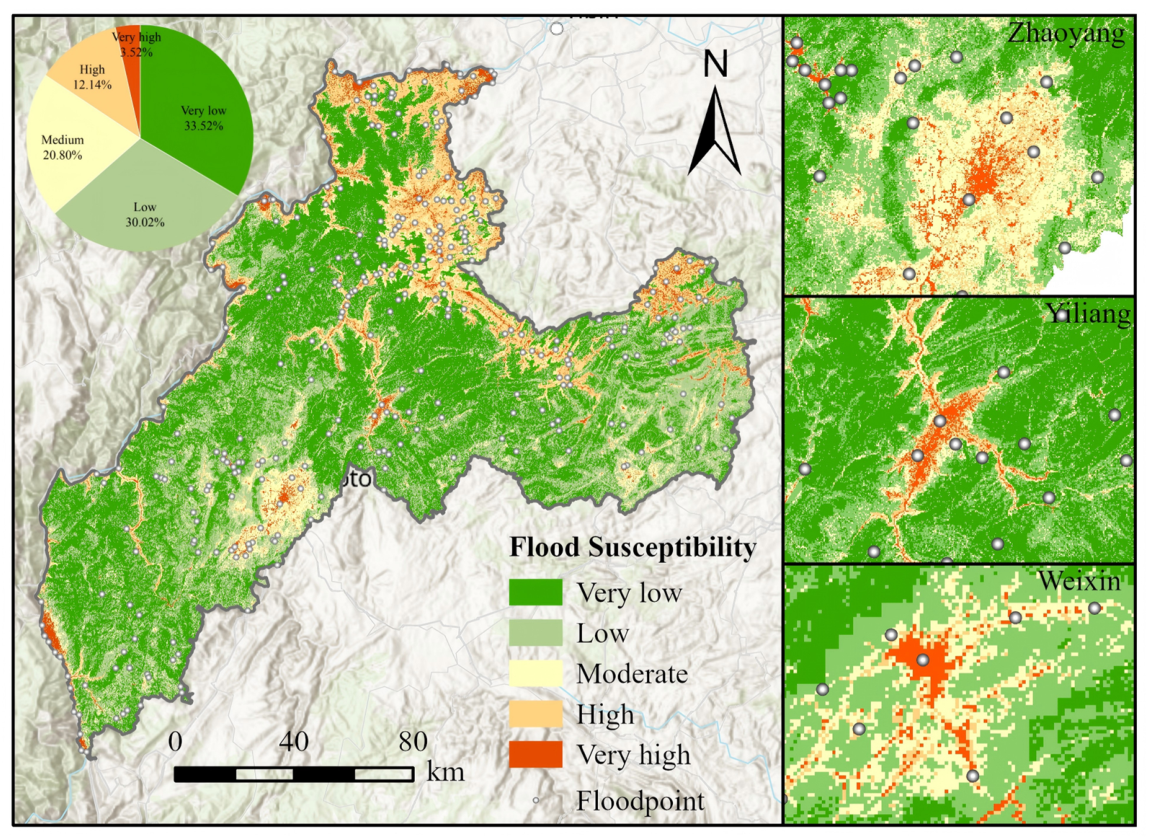
Based on the FFS calculated using the XGBoost model, the index was categorized into five levels: very low, low, moderate, high, and very high, using the natural breaks method (Figure 6). The flash flood susceptibility of Zhaotong City exhibits a spatial distribution pattern of “high in the northeast and low in the southwest.” The very low and low susceptibility areas account for 33.52% and 30.02%, respectively, totaling 63.54%. These areas are predominantly located in the mountainous and hilly regions with higher elevations and steeper slopes. The moderate susceptibility area accounts for 20.80%, mostly located in the valley and gentle slope transition zones. These areas act as critical transitional zones where surface runoff converges toward river channels and are more sensitive to rainfall and upstream water variations. The high and very high susceptibility areas account for 12.14% and 3.52%, respectively, with a total of 15.66%. These areas demonstrate considerable spatial clustering and are mainly concentrated in the gentle dam areas such as the Zhaolu Dam area, along the main and tributary rivers of the Jinsha, Hengjiang, and Niulanjiang rivers, and around urban built-up areas. Specifically, Yanjin County, Daguan County, and Weixin County are the highest-risk areas. These regions are both naturally high-risk areas with concentrated surface runoff and flood vulnerability, as well as areas with high population and socio-economic concentrations. They represent the key regions for future flash flood disaster prevention and risk management in Zhaotong City.

3.2.3. Influencing Factors of Flood Susceptibility

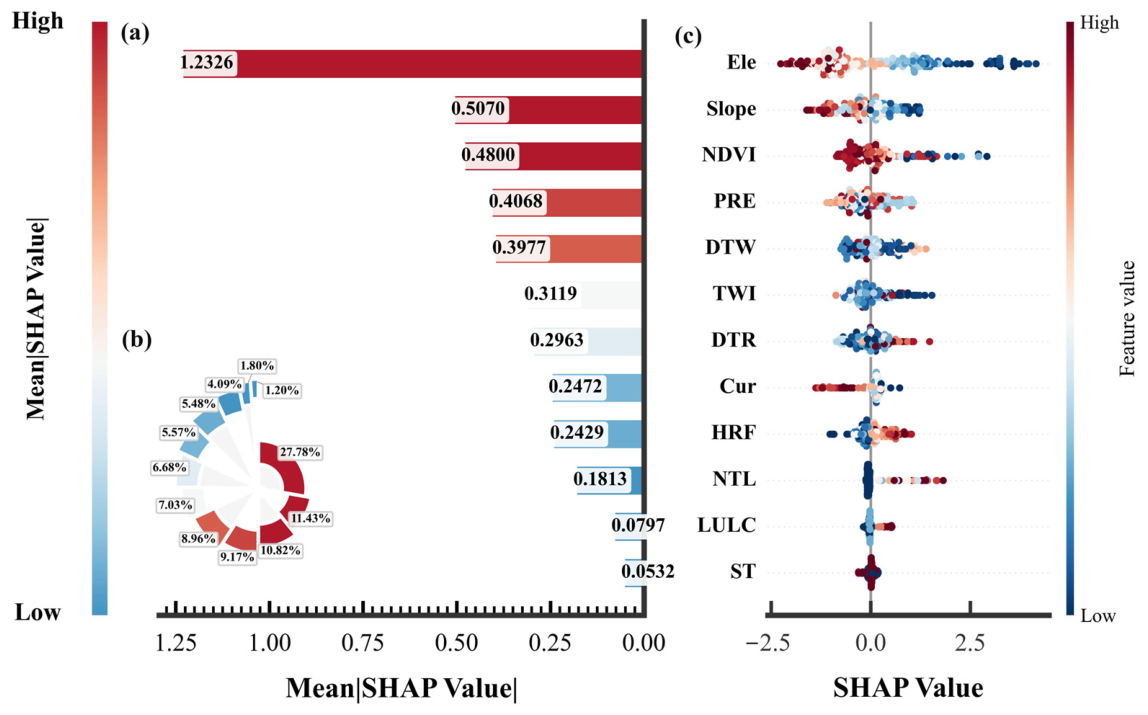
SHAP interpretability analysis not only provides the global ranking of feature importance but also reveals the direction and magnitude of the impact of individual feature values on the prediction results. Based on the SHAP mean absolute contribution values (Figure 7a,b), the primary contributing factors include Ele (Mean | SHAP Value = 1.233), Slope (0.507), NDVI (0.480), Pre (0.407), and DTW (0.398), with a cumulative contribution of 68.16%. These are the dominant factors influencing the spatial pattern of FFS in Zhaotong City. TWI (0.312), DTR (0.296), Cur (0.247), and HRF (0.243) are moderate contributing factors, which exert a significant regulatory effect on regional FFS. NTL (0.181, LULC (0.080), and ST (0.053) are low contributing factors, with mean absolute SHAP values all below 0.2, indicating their weaker influence on the overall FFS pattern in Zhaotong City.
The SHAP swarm plot (Figure 7c) illustrates the direction of influence and the nonlinear characteristics of each factor in Zhaotong City. Each point represents a single SHAP value of a data sample, and its horizontal position indicates the direction of the variable’s influence on the prediction, i.e., whether it increases or decreases FFS. In terms of elevation, the SHAP values in medium-altitude areas are mostly distributed along the positive axis, while in high-altitude mountainous areas, the SHAP values tend to be negative. Slope exhibits a non-linear response, with moderate slope ranges having a more pronounced positive contribution to FFS, while areas with very gentle or steep slopes show relatively lower contributions. The SHAP values of NDVI are predominantly negative, indicating that higher vegetation coverage has a stronger suppressive effect on flood susceptibility. Both Pre and HRF exhibit an increasing positive contribution to SHAP values as the factor values increase. In terms of distance, both DTW and DTR show that the closer the proximity, the stronger the positive bias in SHAP values, indicating higher FFS in areas closer to water bodies and roads. The results of TWI and curvature indicate that areas with stronger topographic runoff potential are more likely to increase FFS. NTL and LULC reflect that human activities such as urban development and expansion of impermeable surfaces correspond to higher FFS, while ecological land uses such as forests exhibit a suppressive effect.

3.3. Non-Linear Influence of Urban Expansion Patterns and Morphology on Flood Susceptibility

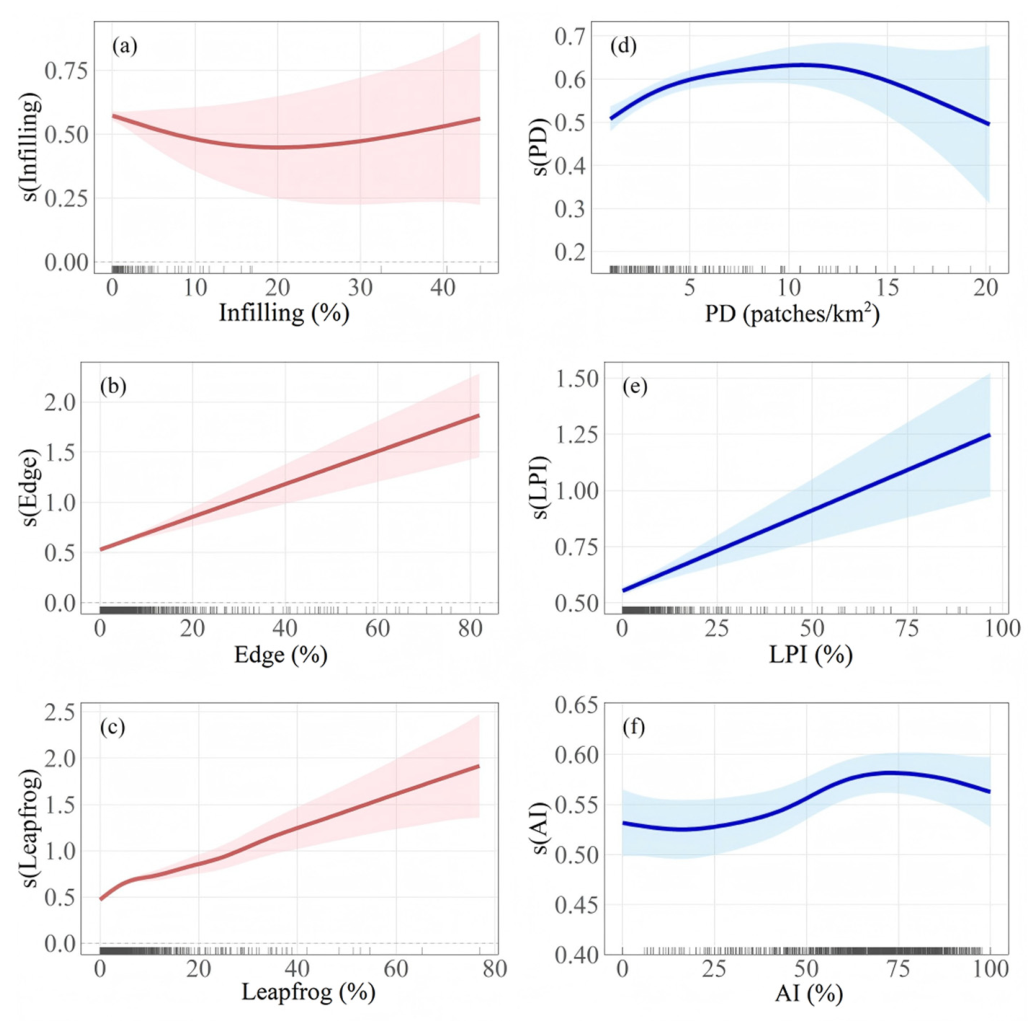
The analysis based on the GAM model (Table 5) shows that the six selected urban expansion indicators together explain 28.6% of the variance in flood susceptibility (R2 adjusted), with a deviation explanation (D2) of 29.2%. Considering that urban flash flood susceptibility is jointly regulated by natural conditions and human activities [20], this study focuses exclusively on the dimension of urban expansion, providing an acceptable level of explanation in the complex study of flash flood susceptibility in mountainous urban areas (Figure 8). Overall, the proportion of leapfrog expansion (Leapfrog%, 32.75%), PD (17.51%), Edge% (17.23%), and AI (21.58%) are the core driving factors of flood susceptibility changes, while Infilling% and LPI contribute relatively less. Among the six indicators, five showed highly significant statistical effects (p < 0.001), with infilling% being the only indicator not reaching a significant level. Among these, LPI shows a linear response, while the remaining four significant indicators exhibit clear non-linear characteristics, highlighting the pronounced non-linear and dimensional differences in the impact of urban expansion in mountainous dam areas on flash flood susceptibility.
Infilling expansion exerts a weak influence on FFS and is not statistically significant (Figure 8a). The response curve exhibits a gentle “U-shaped” pattern, with the smoothing effect lowest at a medium fill ratio (≈20%), slightly increasing at higher fill ratios, while the sample size is small and explanatory power is low in the high fill ratio interval. Edge expansion demonstrates a weak but highly significant nonlinear driving effect (Figure 8b). As the edge expansion ratio increases, the FFS smoothing effect generally rises, indicating a positive response between edge expansion ratio and FFS. Leapfrog expansion is the primary driving factor influencing FFS Figure 8c), with the overall curve trending upward, indicating that FFS increases with the leapfrog expansion ratio. In the low-percentage interval, sample points are relatively concentrated, and the curve exhibits a robust upward trend; in contrast, in the high-percentage interval, sample distribution is sparse, and the 95% confidence interval widens substantially, reflecting greater uncertainty in model predictions.
PD demonstrates a highly significant unimodal (increasing then decreasing) nonlinear relationship (Figure 8d). At moderate patch density (≈10–13 patches/km2), the FFS smoothing effect reaches its maximum, while both excessively high and low patch densities reduce FFS. LPI exhibits a highly significant linear positive correlation (Figure 8e). As LPI increases, the maximum patch contiguousness in urban built-up areas rises, and the FFS smoothing effect continues to increase. AI demonstrates a highly significant fluctuating nonlinear trend (Figure 8f). FFS changes gradually across the low to medium AI range and increases slightly across the medium to high AI range. The sample size is larger in the medium to high AI range, leading to more robust model predictions.

4. Discussion

4.1. Dominant Factors of Flash Flood Susceptibility in Mountainous Dam Areas

The flash flood susceptibility in Zhaotong City is the result of the combined influence of natural geographic conditions and the intensity of human activities. The XGBoost model performed optimally across various evaluation metrics, demonstrating its superior ability to capture the non-linear relationships between influencing factors and flash flood susceptibility. This is consistent with the current mainstream research conclusions in the field of flash flood susceptibility assessment [3,70]. Notably, some historical flood events occur in low-risk areas. This primarily results from normal biases in model predictions (recall = 0.776, ~22.4% false negative rate) and spatial inaccuracies in historical disaster site locations. Furthermore, although the flood moderation factor explains most spatial variation, its accuracy in capturing localized extreme flood events can be further improved. Such local biases are common in machine learning models and do not compromise the model’s overall predictive performance at the regional scale [71]. The flash flood susceptibility in Zhaotong City exhibits a spatial differentiation pattern of “low in the mountains, high in the dam areas and river valleys,” consistent with previous research findings [6]. Although high and very high susceptibility areas account for only 15.66% of the total area of the city, these regions are highly concentrated along the main and tributary river valleys, mountainous dam areas, and urban peripheries, posing a considerable threat to regional population safety and long-term development. This pattern is closely coupled with Zhaotong City’s urban development model of “building along rivers and thriving along valleys.” In the context of frequent short-duration heavy rainfall, the combination of low-lying convergent topography and increased impervious surfaces due to urban expansion has further amplified the flash flood susceptibility in local areas. SHAP analysis further quantified the contribution weights and directions of each factor. Topographic conditions remain the core controlling factor for regional flash flood susceptibility [19]. The natural characteristics of low-elevation dam areas and gentle topography that are prone to water accumulation constitute the spatial foundation for high flash flood susceptibility regions. Meanwhile, vegetation cover in the southwestern mountainous areas plays a key ecological buffering role, effectively reducing runoff and disaster risks. Precipitation and rainfall frequency, as direct triggering factors of flash floods, further exacerbate the localized disaster potential when coupled with topographic conditions [3].

4.2. Interactive Influence of Urban Expansion Pattern Differences and Morphological Complexity on Flood Susceptibility

The evolution of flood susceptibility in mountainous towns represents a dynamic interplay between urban spatial expansion and natural hydrological resilience. GAM analysis indicates that urban expansion indicators explain only about 28.6% of the variation in the flood susceptibility index, highlighting that natural factors, including topography and precipitation, remain the primary drivers. Although urban expansion patterns and spatial morphology play an important moderating role in local flash flood susceptibility, their effects primarily amplify baseline natural risks locally rather than comprehensively dominating flash flood susceptibility.
Specifically, the disorderly spread of marginal expansion continuously encroaches on slope toes and valley buffer zones, disrupting natural runoff pathways, while leapfrog expansion further severs hydrological connectivity, substantially exacerbating flash flood susceptibility. Moderate infill expansion improves infrastructure utilization efficiency and effectively reduces FFS by leveraging the “compact city” concept; however, excessive infilling compresses permeable surfaces and ecological storage space, resulting in a rebound in FFS. This pattern aligns with existing research findings [29,30], underscoring the challenge of balancing development needs and ecological constraints in mountainous towns.
From a landscape morphology perspective, the linear positive influence of LPI and the “first increasing, then decreasing” non-linear feature of PD indicate that together, the increase in FFS in mountainous towns is not due to expansion itself, but rather the result of disorderly expansion and morphological imbalance. The runoff aggregation effect generated by large-scale contiguous impermeable surfaces and the runoff disruption caused by fragmented patches are essentially the consequence of excessive urban spatial development encroaching upon sensitive hydrological units such as river valleys and dam areas, leading to a decline in natural regulation capacity and an imbalance in hydrological processes [32]. Therefore, the coordinated regulation of urban expansion patterns and spatial morphology is a key approach to reducing flood susceptibility in mountainous dam areas.

4.3. Policy Implications for Mountainous Urban Planning and Flash Flood Risk Management

In the study area, Zhaotong City promotes the “One City, Three Districts” new-type urbanization based on the Zhaolu Dam area, with urban space rapidly expanding towards river valleys, lowlands, and dam areas, guided by policy-driven strategies [4]. This means that the policy-driven direction of urban development significantly overlaps with naturally flood-prone high-risk areas. Mountainous dam areas often experience compounded disasters such as flash floods and debris flows, which exacerbate the risks linked to urban development. Daguan County has implemented collective relocation of the county seat, and Yanjin County has carried out the restructuring of the old city area, suggesting that “risk avoidance” has become a practical choice for dealing with flood threats in the region.
The nonlinear mechanisms identified in this study provide a scientific foundation for urban planning and flash flood risk mitigation. For the continuously expanding “spreading pancake” areas in Zhaoyang, Ludian, Weixin, and Zhenxiong, optimizing urban drainage systems while maintaining appropriate infill levels is recommended to mitigate the impact of continuous development on local flash flood susceptibility. In Yiliang and Daguan counties, expansion along river valleys and road network edges should avoid disorderly extension, and flood storage facilities should be constructed in low-lying, flood-prone areas [30] to enhance flood retention and drainage capacity. In Qiaojia, Yanjin, Suijiang, Yongshan, and Shuifu, leapfrog expansion along rivers necessitates establishing ecological buffer zones along major rivers, while avoiding the creation of small, fragmented leapfrog patches. For unavoidable leapfrog development, priority should be given to areas protected by existing flood control facilities. Furthermore, structural measures remain the cornerstone of flood control; however, the construction of most dikes in China lags behind socio-economic development [29], and their cost-effectiveness varies spatially. Therefore, in densely populated, high-risk areas, such as the Zhaolu Dam area and urban regions along the Jinsha, Niulan, and Hengjiang Rivers, implementing flood control projects and constructing dikes can substantially enhance flood control capacity.
To achieve sustainable flood risk management, a clear cross-departmental collaborative governance framework is necessary. Vertically, a three-tiered linkage system is proposed at the provincial, municipal, and county levels: the provincial level coordinates policy guidance and resource allocation; the municipal level manages emergency dispatch and cross-regional coordination; and the county level implements specific flood control measures and on-site management, enabling tiered responses and closed-loop decision-making. Horizontally, a multi-departmental collaborative platform for flood risk management is established, led by the emergency management department, with regular involvement of relevant departments, including water resources, urban and rural planning, construction management, and ecological and environmental protection. A closed-loop operation is formed through information sharing, joint analysis, and unified dispatch: departments share flood monitoring and rainfall warning data in real time; risk assessments and emergency decisions are jointly conducted based on shared information; and resources, personnel, and engineering measures are coordinated to enable rapid response. Key operational mechanisms include regular cross-departmental joint meetings, standardized operating procedures, and closed-loop management of “early warning–response–evacuation,” ensuring that flood control measures are scientific, coordinated, and sustainable.

4.4. Limitations and Future Research Directions

This study reveals the mechanisms through which urban expansion factors influence flood susceptibility, but there are still some limitations. First, this study uses a 1 km grid as the unit to calculate urban expansion morphological indicators, which can reflect the macro pattern but may obscure local variations at finer scales. Future research could conduct multi-scale comparative analyses to explore the “scale effect” of urban expansion on flood susceptibility and identify the optimal analytical unit. Second, due to limitations in the completeness and accuracy of historical disaster data, some flash flood points in small watersheds or data-sparse mountainous areas are not fully recorded. Furthermore, locations extracted from disaster yearbooks and flood databases exhibit certain spatial positioning biases. Future research may integrate flood time-series records with Sentinel-1 SAR or Gaofen-3 data to derive more precise flood inundation extents, thereby further refining the flood inventory. Third, this study focuses on macro-scale analysis of the impact of urban spatial patterns on flash flood susceptibility, without conducting micro-scale coupled analyses with key hydrological processes, such as runoff coefficients, return periods, and surface roughness. Future research may build upon this foundation by selecting representative urban zones and integrating urban hydrological models, such as SWMM and ICM Inforworks, to combine landscape pattern analysis with runoff process simulation, thereby more precisely assessing the impact of urban morphology on local flood risk. Last, this study only investigates the correlation between urban expansion and flood susceptibility based on a long-term static analysis, without revealing dynamic evolution patterns. Future research could expand into multi-period time series studies to track the phased response relationship between urban expansion and flood susceptibility.

5. Conclusions

Mountainous dam areas represent one of the most prominent regional types in Southwest China, characterized by intense urbanization and frequent flash flood disasters. This study focuses on Zhaotong City, a representative city in a mountainous dam area, and systematically investigates the nonlinear mechanisms by which urban expansion influences flash flood susceptibility from a dual “pattern–morphology” perspective, providing a theoretical basis for spatial optimization and disaster prevention in mountainous towns. The key conclusions are summarized as follows:
(1)
Urban expansion in Zhaotong City is primarily edge (51%) and leapfrog (46%) in nature. Spatially, expansion clusters along river valleys, dam areas, and transportation corridors, exhibiting continuous core-area extension and fragmented leapfrog development at the periphery.
(2)
Natural environmental factors, including elevation, slope, NDVI, precipitation, and distance to rivers, remain the primary determinants of flood susceptibility in Zhaotong City. High and very high susceptibility areas comprise 15.66% of the city’s total area, concentrated in the Zhaolu Dam area, along the main and tributary rivers of the Jinsha, Hengjiang, and Niulan Rivers, and in towns.
(3)
Urban expansion indicators account for 28.6% of the spatial variation in the flood susceptibility index (FFS), with leapfrog expansion serving as the primary anthropogenic driver (contribution rate 32.75%). Disorderly Edge expansion, fragmented leapfrog development, and morphological imbalances collectively exacerbate flood susceptibility.
This study enhances the theoretical understanding of urban expansion and flash flood response in mountainous dam areas from a “pattern-morphology” perspective. The findings provide scientific evidence and decision-making guidance for optimizing spatial patterns and climate-adaptive urban development in mountainous towns in Southwest China and similar regions across Asia. In practice, it is recommended that urban expansion control disorderly edge expansion and fragmented leapfrog development, coordinate flood control projects with ecological space protection, and achieve the coordinated development of urban expansion and flood management in mountainous towns.

Supplementary Materials

The following supporting information can be downloaded at: https://www.mdpi.com/article/10.3390/su18105158/s1, Figure S1. Correlation heatmap of 12 flood conditioning factors; Table S1. Variance inflation factors (VIF) of 12 flood conditioning factors; Figure S2. Correlation heatmap of six urban expansion indicators; Table S2. Variance inflation factors (VIF) of six expansion indicators; Table S3. Detailed hyperparameter ranges and final values of the four machine learning models.

Author Contributions

Conceptualization, L.Y. and X.Y.; methodology, L.Y. and Z.X. (Zhiqiang Xie); software, P.W.; validation, Z.X. (Zhiqiang Xie); formal analysis, L.Y. and Y.W.; investigation, Z.X. (Zhenglong Xiao); resources, X.W. (Xiaodong Wu) and H.F.; data curation, X.W. (Xianjun Wu); writing—original draft preparation, L.Y.; writing—review and editing, Z.X. (Zhiqiang Xie) and P.W.; visualization, L.Y.; supervision, P.W.; project administration, P.W. and Z.X. (Zhiqiang Xie); funding acquisition, P.W. and X.W. All authors have read and agreed to the published version of the manuscript.

Funding

This research was made possible through the generous support of several grants: National Natural Science Foundation of China (Grant No. 72361035), Yunnan Fundamental Research Projects (Grant No. 202401BF070001-026), the 2024 Yunnan Province Graduate Supervisor Team Project, Yunnan University 2025 Special Science and Technology Project for Serving Local Development (YDFWDF202502), Research on the Safety and Resilience of Municipal Infrastructure in the Context of Smart City Development (2025530103004739).

Institutional Review Board Statement

Not applicable.

Informed Consent Statement

Not applicable.

Data Availability Statement

The original data that support the findings of this study are contained within the article. Further inquiries can be directed to the corresponding author.

Acknowledgments

During the preparation of this manuscript, the authors used ChatGPT 5 to help improve the language and readability of the text. Following the use of this tool, the authors thoroughly reviewed and revised the content as necessary and accept full responsibility for the integrity and accuracy of the final manuscript.

Conflicts of Interest

Authors Ping Wen, Ying Wang, Zhenglong Xiao, Xiaodong Wu, Xianjun Wu and Hang Fu were employed by the company Kunming Engineering Corporation Limited. The remaining authors declare that the research was conducted in the absence of any commercial or financial relationships that could be construed as a potential conflict of interest.

References

  1. Al-Ruzouq, R.; Shanableh, A.; Jena, R.; Gibril, M.B.A.; Hammouri, N.A.; Lamghari, F. Flood Susceptibility Mapping Using a Novel Integration of Multi-Temporal Sentinel-1 Data and eXtreme Deep Learning Model. Geosci. Front. 2024, 15, 101780. [Google Scholar] [CrossRef]
  2. Fu, X.; He, X.; Ding, L. Stochastic Flood Simulation Method Combining Flood Intensity and Morphological Indicators. Sustainability 2023, 15, 14032. [Google Scholar] [CrossRef]
  3. Zhuang, Y.; Gong, T.; Fang, J.; Shen, D.; Tang, W.; Lin, S.; Chen, X.; Zhang, Y. Integrating Social Media Data and Machine Learning Methods for Flash Flood Susceptibility Mapping in China. J. Hydrol. 2025, 664, 134397. [Google Scholar] [CrossRef]
  4. Hu, Y.; Li, Y.; Li, Y.; Wu, J.; Zheng, H.; He, H. Balancing Urban Expansion with a Focus on Ecological Security: A Case Study of Zhaotong City, China. Ecol. Indic. 2023, 156, 111105. [Google Scholar] [CrossRef]
  5. Wang, C.; Wu, D.; Shen, Z.; Peng, M.; Ou, X. How Do Physical and Social Factors Affect Urban Landscape Patterns in Intermountain Basins in Southwest China? Landsc. Ecol. 2021, 36, 1893–1911. [Google Scholar] [CrossRef]
  6. Li, K.; Guo, L.; Wang, G.; Gao, J.; Ma, J.; Li, J.; Huang, P.; Zhai, B.; Sun, X. A Novel Hybrid Framework of High-Resolution Flood Susceptibility Mapping in Ungauged Mountainous Regions. Weather Clim. Extrem. 2025, 50, 100822. [Google Scholar] [CrossRef]
  7. Tang, X.; Huang, X.; Tian, J.; Pan, S.; Ding, X.; Zhou, Q.; Sun, C. A Novel Framework for the Spatiotemporal Assessment of Urban Flood Vulnerability. Sustain. Cities Soc. 2024, 109, 105523. [Google Scholar] [CrossRef]
  8. Luo, L.; Wang, Y.; Li, Q.; Li, M.; Wang, J.; Zhao, G.; Ma, M. Exploration of the Spatiotemporal Characteristics and Triggering Factors of Flash Flood in China. Ecol. Indic. 2025, 176, 113698. [Google Scholar] [CrossRef]
  9. Liu, Q.; Fu, L.; Xiong, J.; Liu, J.; Shen, G.; Yong, Z.; Xu, Y.; Jia, Q.; Li, Q. Enhancing Flash Flood Susceptibility Modeling Using the Optimal Parameter Geographical Detector (OPGD) Method. Adv. Space Res. 2025, 76, 4838–4857. [Google Scholar] [CrossRef]
  10. Sun, D.; Zhang, D.; Cheng, X. Framework of National Non-Structural Measures for Flash Flood Disaster Prevention in China. Water 2012, 4, 272–282. [Google Scholar] [CrossRef]
  11. Tripathi, G.; Pandey, A.C.; Parida, B.R. Flood Hazard and Risk Zonation in North Bihar Using Satellite-Derived Historical Flood Events and Socio-Economic Data. Sustainability 2022, 14, 1472. [Google Scholar] [CrossRef]
  12. Mosavi, A.; Ozturk, P.; Chau, K. Flood Prediction Using Machine Learning Models: Literature Review. Water 2018, 10, 1536. [Google Scholar] [CrossRef]
  13. Tayyab, M.; Hussain, M.; Zhang, J.; Ullah, S.; Tong, Z.; Rahman, Z.U.; Al-Aizari, A.R.; Al-Shaibah, B. Leveraging GIS-Based AHP, Remote Sensing, and Machine Learning for Susceptibility Assessment of Different Flood Types in Peshawar, Pakistan. J. Environ. Manag. 2024, 371, 123094. [Google Scholar] [CrossRef]
  14. Fidelis, G.D.; Eziz, A.; Ahmed, T.; Azadi, H.; Ozuzu, S.A.; Ullah, S.; Kurban, A. Geospatial Analysis of Flood Susceptibility through a Combined Bivariate Statistical Model and Sentinel-1 SAR Data in Qarqan River Basin, China. Heliyon 2025, 11, e44074. [Google Scholar] [CrossRef]
  15. Arabameri, A.; Saha, S.; Chen, W.; Roy, J.; Pradhan, B.; Bui, D.T. Flash Flood Susceptibility Modelling Using Functional Tree and Hybrid Ensemble Techniques. J. Hydrol. 2020, 587, 125007. [Google Scholar] [CrossRef]
  16. Islam, R.; Chowdhury, P. Local-Scale Flash Flood Susceptibility Assessment in Northeastern Bangladesh Using Machine Learning Algorithms. Environ. Chall. 2024, 14, 100833. [Google Scholar] [CrossRef]
  17. Luan, B.; Luo, J.; Ye, X.; Huang, W.; Yu, L.; Yu, G. Urban Flood Risk Prediction and Influencing Factors Analysis Based on the MaxEnt–PLUS Model. Landsc. Archit. Front. 2025, 13, 80. [Google Scholar] [CrossRef]
  18. Wu, Z.; Lin, J.; Li, S.; Zhang, X. Urban Waterlogging Risk Prediction Considering the Influence of Land Use Patterns: A Case Study of Shenzhen. Trans. GIS 2026, 30, e70252. [Google Scholar] [CrossRef]
  19. Ke, X.; Wang, N.; Li, T.; Liu, Z.; Li, Z.; Zuo, G.; Chen, Y. From Prediction to Regionalization: Enhancing Flash Flood Susceptibility Mapping Using Machine Learning and GeoDetector. Geosci. Front. 2025, 17, 102213. [Google Scholar] [CrossRef]
  20. Hoang, D.-V.; Liou, Y.-A. Assessing the Influence of Human Activities on Flash Flood Susceptibility in Mountainous Regions of Vietnam. Ecol. Indic. 2024, 158, 111417. [Google Scholar] [CrossRef]
  21. Fu, X.; Wang, M.; Zhang, D.; Chen, F.; Peng, X.; Wang, L.; Tan, S.K. An XGBoost-SHAP Framework for Identifying Key Drivers of Urban Flooding and Developing Targeted Mitigation Strategies. Ecol. Indic. 2025, 175, 113579. [Google Scholar] [CrossRef]
  22. Waleed, M.; Sajjad, M. High-Resolution Flood Susceptibility Mapping and Exposure Assessment in Pakistan: An Integrated Artificial Intelligence, Machine Learning and Geospatial Framework. Int. J. Disaster Risk Reduct. 2025, 121, 105442. [Google Scholar] [CrossRef]
  23. Yousefi, S.; Mardanian, S.; Jaafari, A.; Tavangar, Z. A Reinforcement Learning Approach with Explainable AI for Spatial Flood Susceptibility Analysis. J. Hydrol. Reg. Stud. 2026, 63, 103035. [Google Scholar] [CrossRef]
  24. Do, T.A.T.; Do, A.N.T.; Tran, H.D. Quantifying the Spatial Pattern of Urban Expansion Trends in the Period 1987–2022 and Identifying Areas at Risk of Flooding Due to the Impact of Urbanization in Lao Cai City. Ecol. Inf. 2022, 72, 101912. [Google Scholar] [CrossRef]
  25. Wei, Y.; Li, H.; Zhou, Y.; Commey, N.A.; Zhu, Z.; Ishidaira, H.; Jiang, Z.; Yang, D. Flood Vulnerability Assessment of Urban Agglomeration under the Background of Urban Expansion. J. Hydrol. 2025, 662, 133962. [Google Scholar] [CrossRef]
  26. Idowu, D.; Zhou, W. Global Megacities and Frequent Floods: Correlation between Urban Expansion Patterns and Urban Flood Hazards. Sustainability 2023, 15, 2514. [Google Scholar] [CrossRef]
  27. Yi, D.; Guo, J.; Pueppke, S.G.; Han, Y.; Ding, G.; Ou, M.; Koomen, E. What Dominates the Variation of Ecosystem Services across Different Urban Expansion Patterns?—Evidence from the Yangtze River Delta Region, China. Environ. Impact Assess. Rev. 2025, 110, 107674. [Google Scholar] [CrossRef]
  28. Huang, D.; Xiao, G. Exploring Urban Expansion Pattern Associations with Flood Vulnerability: Spatial Heterogeneity in Multidimensional Linkages across China’s Min Delta Urban Agglomeration. J. Environ. Manag. 2025, 394, 127449. [Google Scholar] [CrossRef]
  29. Wang, G.; Hu, Z.; Liu, Y.; Zhang, G.; Liu, J.; Lyu, Y.; Gu, Y.; Huang, X.; Zhang, Q.; Tong, Z. Impact of Expansion Pattern of Built-up Land in Floodplains on Flood Vulnerability: A Case Study in the North China Plain Area. Remote Sens. 2020, 12, 3172. [Google Scholar] [CrossRef]
  30. Han, Y.; Huang, Q.; He, C.; Fang, Y.; Wen, J.; Gao, J.; Du, S. The Growth Mode of Built-up Land in Floodplains and Its Impacts on Flood Vulnerability. Sci. Total Environ. 2020, 700, 134462. [Google Scholar] [CrossRef]
  31. Zhong, M.; Chen, T.; Zhuo, L.; Wang, Z.; Ling, F.; Han, D. Exploring Characteristics and Drivers of Flood Hazard under Different Urban Development Patterns. Environ. Sustain. Indic. 2025, 28, 100955. [Google Scholar] [CrossRef]
  32. Zhu, Y.; Burlando, P.; Zhang, Y.; Chi, D.; Wang, J.; Qiu, Y.; Bonatesta, M.; Zou, W.; Geiß, C.; Tan, P.Y. The Influence of Urban Morphological Changes on Pluvial Flooding during Urban Expansion. Sustain. Cities Soc. 2025, 135, 107018. [Google Scholar] [CrossRef]
  33. Mei, C.; Shi, H.; Liu, J.; Song, T.; Wang, J.; Gao, X.; Wang, H.; Li, M. Analyzing Urban Form Influence on Pluvial Flooding via Numerical Experiments Using Random Slices of Actual City Data. J. Hydrol. 2024, 633, 130916. [Google Scholar] [CrossRef]
  34. Li, Z.; Tan, J.; Yang, L.; Xie, Z.; Qin, Y.; Li, Y. Revealing the Dynamics and Multidimensional Resilience of Rainstorm-Flood Cascade Disasters in Mountain Valley Cities: An Interpretable Machine Learning Case Study from Southwestern China. Reliab. Eng. Syst. Saf. 2026, 274, 112418. [Google Scholar] [CrossRef]
  35. Li, Z.; Yang, L.; Zhu, L.; Tan, J.; Xie, Z.; Wang, Y.; Zhang, H.; Xie, J.; Cui, S.; Bai, S. Revealing the Causes of Inequality in Rainstorm Flood Disaster Resilience between Town and Rural Areas in Southwestern China: Based on Natural and Social System Dimensions. J. Rural Stud. 2026, 121, 103932. [Google Scholar] [CrossRef]
  36. Tang, J.; Liu, D.; Shang, C.; Niu, J. Impacts of Land Use Change on Surface Infiltration Capacity and Urban Flood Risk in a Representative Karst Mountain City over the Last Two Decades. J. Clean. Prod. 2024, 454, 142196. [Google Scholar] [CrossRef]
  37. Kaiser, M.; Günnemann, S.; Disse, M. Regional-Scale Prediction of Pluvial and Flash Flood Susceptible Areas Using Tree-Based Classifiers. J. Hydrol. 2022, 612, 128088. [Google Scholar] [CrossRef]
  38. Yang, L.; Ji, X.; Li, M.; Yang, P.; Jiang, W.; Chen, L.; Yang, C.; Sun, C.; Li, Y. A Comprehensive Framework for Assessing the Spatial Drivers of Flood Disasters Using an Optimal Parameter-Based Geographical Detector–Machine Learning Coupled Model. Geosci. Front. 2024, 15, 101889. [Google Scholar] [CrossRef]
  39. Rentschler, J.; Avner, P.; Marconcini, M.; Su, R.; Strano, E.; Vousdoukas, M.; Hallegatte, S. Global Evidence of Rapid Urban Growth in Flood Zones since 1985. Nature 2023, 622, 87–92. [Google Scholar] [CrossRef]
  40. Zhang, Y.; Wei, Y.; Yao, R.; Sun, P.; Zhen, N.; Xia, X. Data Uncertainty of Flood Susceptibility Using Non-Flood Samples. Remote Sens. 2025, 17, 375. [Google Scholar] [CrossRef]
  41. Costache, R.; Arabameri, A.; Costache, I.; Crăciun, A.; Islam, A.R.M.T.; Abba, S.I.; Sahana, M.; Pham, B.T. Flood Susceptibility Evaluation through Deep Learning Optimizer Ensembles and GIS Techniques. J. Environ. Manag. 2022, 316, 115316. [Google Scholar] [CrossRef] [PubMed]
  42. Fang, X.; Zhang, Y.; Xiang, Y.; Zou, J.; Li, X.; Hao, C.; Wang, J. A Spatial Model for Coastal Flood Susceptibility Assessment Using the 2D-SPR Method with Complex Network Theory: A Case Study of a Reclamation Island in Zhoushan, China. Environ. Impact Assess. Rev. 2023, 98, 106953. [Google Scholar] [CrossRef]
  43. Xu, Z.; Yang, W.; Zhang, X.; Gu, C.; Shen, L.; Hu, H. Satellite-Based Monitoring and Hazard Assessment of Multiple Flooding Types in the Haihe River Basin Induced by the July 2023 Extreme Rainstorm. J. Hydrol. 2025, 663, 134243. [Google Scholar] [CrossRef]
  44. Li, S.; Ge, X.; Jin, G.; Lou, Z.; Yang, H. Flood Dynamic Monitoring and XGBoost-SHAP Based Risk Assessment: Case Study of the 23·7 Extreme Rainstorm in BTH Region, China. Environ. Sustain. Indic. 2025, 28, 101020. [Google Scholar] [CrossRef]
  45. Shahabi, H.; Shirzadi, A.; Ronoud, S.; Asadi, S.; Pham, B.T.; Mansouripour, F.; Geertsema, M.; Clague, J.J.; Bui, D.T. Flash Flood Susceptibility Mapping Using a Novel Deep Learning Model Based on Deep Belief Network, Back Propagation and Genetic Algorithm. Geosci. Front. 2021, 12, 101100. [Google Scholar] [CrossRef]
  46. Wu, Q.; Sun, Z.; Wang, Z.; Zheng, L.; Jiang, J.; Zhong, Z.; Jia, Y. Flood Risk in Mountainous Settlements: A New Framework Based on an Interpretable NSGA-II-GB from a Point-Area Duality Perspective. J. Environ. Manag. 2025, 373, 123842. [Google Scholar] [CrossRef]
  47. Demissie, Z.; Rimal, P.; Seyoum, W.M.; Dutta, A.; Rimmington, G. Flood Susceptibility Mapping: Integrating Machine Learning and GIS for Enhanced Risk Assessment. Appl. Comput. Geosci. 2024, 23, 100183. [Google Scholar] [CrossRef]
  48. Wang, R.; Chen, Y.; Wu, H.; Liu, J.; Wang, M.; Duan, J. A Flood Susceptibility Prediction Method for Climate Change Scenarios Driven by Coupled Land Simulation and Spatiotemporal Dual Convolution Synergy. J. Hydrol. 2026, 664, 134366. [Google Scholar] [CrossRef]
  49. Zhu, K.; Lai, C.; Wang, Z.; Zeng, Z.; Mao, Z.; Chen, X. A Novel Framework for Feature Simplification and Selection in Flood Susceptibility Assessment Based on Machine Learning. J. Hydrol. Reg. Stud. 2024, 52, 101739. [Google Scholar] [CrossRef]
  50. Yao, J.; Zhang, X.; Luo, W.; Liu, C.; Ren, L. Applications of Stacking/Blending Ensemble Learning Approaches for Evaluating Flash Flood Susceptibility. Int. J. Appl. Earth Obs. Geoinf. 2022, 112, 102932. [Google Scholar] [CrossRef]
  51. Li, B.; Zhang, Z.; Jia, Y.; Ren, S. Flood Susceptibility Prediction Using Tree-Based Machine Learning Models and Social Media Data—A Case Study of Zhengzhou, China. Sustain. Cities Soc. 2025, 130, 106636. [Google Scholar] [CrossRef]
  52. Amiri, A.; Soltani, K.; Ebtehaj, I.; Bonakdari, H. A Novel Machine Learning Tool for Current and Future Flood Susceptibility Mapping by Integrating Remote Sensing and Geographic Information Systems. J. Hydrol. 2024, 632, 130936. [Google Scholar] [CrossRef]
  53. Tikuye, B.; Ray, R.; Abeysingha, N.S.; Gurau, S. Integrating Multi-Criteria Decision Analysis and Geospatial Data for Flood Susceptibility Mapping in Texas, USA. Prog. Disaster Sci. 2025, 28, 100462. [Google Scholar] [CrossRef]
  54. Liu, X.; Li, X.; Chen, Y.; Tan, Z.; Li, S.; Ai, B. A New Landscape Index for Quantifying Urban Expansion Using Multi-Temporal Remotely Sensed Data. Landsc. Ecol. 2010, 25, 671–682. [Google Scholar] [CrossRef]
  55. Chen, M.; Zhou, Y.; Hu, M.; Zhou, Y. Influence of Urban Scale and Urban Expansion on the Urban Heat Island Effect in Metropolitan Areas: Case Study of Beijing–Tianjin–Hebei Urban Agglomeration. Remote Sens. 2020, 12, 3491. [Google Scholar] [CrossRef]
  56. Feng, X.; Wang, S.; Li, Y.; Yang, J.; Wu, X.; Zhang, Q.; Wang, X. Which Urban Expansion Pattern Dominates the Variation of Carbon Emission Performance?—Evidence from 244 Cities in China. J. Clean. Prod. 2025, 519, 145984. [Google Scholar] [CrossRef]
  57. Liu, J.; Jiao, L.; Dong, T.; Xu, G.; Zhang, B.; Yang, L. A Novel Measure Approach of Expansion Process of Urban Landscape: Multi-Order Adjacency Index. Geogr. Sci. 2018, 38, 1741–1749. [Google Scholar] [CrossRef]
  58. Jiao, L.; Mao, L.; Liu, Y. Multi-Order Landscape Expansion Index: Characterizing Urban Expansion Dynamics. Landsc. Urban Plan. 2015, 137, 31–39. [Google Scholar] [CrossRef]
  59. Liu, J.; Xiong, J.; Chen, Y.; Sun, H.; Zhao, X.; Tu, F.; Gu, Y. A New Avenue to Improve the Performance of Integrated Modeling for Flash Flood Susceptibility Assessment: Applying Cluster Algorithms. Ecol. Indic. 2023, 146, 109785. [Google Scholar] [CrossRef]
  60. Tian, B.; Gu, C.; Jia, H.; Gao, P.; Guo, L.; Mu, X. Effects of Urbanization on the Ephemeral Lake Flood Risks under Subtropical Humid Monsoon Climate. J. Hydrol. Reg. Stud. 2025, 57, 102094. [Google Scholar] [CrossRef]
  61. Choubin, B.; Jaafari, A.; Henareh, J.; Karimi, O.; Hosseini, F.S. Explainable Artificial Intelligence (XAI) for Interpreting Predictive Models and Key Variables in Flood Susceptibility. Results Eng. 2025, 27, 105976. [Google Scholar] [CrossRef]
  62. Leo Breiman Arcing the Edge|Department of Statistics. Available online: https://statistics.berkeley.edu/tech-reports/486 (accessed on 23 April 2025).
  63. Hussain, M.A.; Chen, Z.; Pradhan, B.; Meena, S.R.; Zhou, Y. Hybrid Heterogeneous Ensemble Learning Framework for Flood Susceptibility Mapping in Balochistan, Pakistan. J. Hydrol. Reg. Stud. 2025, 61, 102718. [Google Scholar] [CrossRef]
  64. Elghouat, A.; Algouti, A.; Algouti, A.; Baid, S.; Ezzahzi, S.; Kabili, S.; Agli, S. Integrated Approaches for Flash Flood Susceptibility Mapping: Spatial Modeling and Comparative Analysis of Statistical and Machine Learning Models. A Case Study of the Rheraya Watershed, Morocco. J. Water Clim. Change 2024, 15, 3624–3646. [Google Scholar] [CrossRef]
  65. Shapley, L.S. A Value for n-Person Games. In Contributions to the Theory of Games, Volume II; Kuhn, H.W., Tucker, A.W., Eds.; Princeton University Press: Princeton, NJ, USA, 1953; pp. 307–318. [Google Scholar]
  66. Wang, N.; Zhang, H.; Dahal, A.; Cheng, W.; Zhao, M.; Lombardo, L. On the Use of Explainable AI for Susceptibility Modeling: Examining the Spatial Pattern of SHAP Values. Geosci. Front. 2024, 15, 101800. [Google Scholar] [CrossRef]
  67. Wang, Z.; Lyu, H.; Zhang, C. Urban Pluvial Flood Susceptibility Mapping Based on a Novel Explainable Machine Learning Model with Synchronous Enhancement of Fitting Capability and Explainability. J. Hydrol. 2024, 642, 131903. [Google Scholar] [CrossRef]
  68. Zhang, K.; Liu, Q.; Fang, B.; Zhang, Z.; Liu, T.; Yuan, J. Research on the Cool Island Effect of Green Spaces in Megacity Cores: A Case Study of the Main Urban Area of Xi’an, China. Sustain. Cities Soc. 2025, 122, 106255. [Google Scholar] [CrossRef]
  69. Ma, C.; Li, M.; Jiang, P. The Multiscale Response of Global Cropland Cropping Intensity to Urban Expansion. Agric. Syst. 2024, 221, 104138. [Google Scholar] [CrossRef]
  70. Das, P.K.; Sahu, R.L.; Swain, P.C. Comparative Machine Learning for Flood Susceptibility in Subarnarekha Basin, Odisha. J. Atmos. Sol. Terr. Phys. 2025, 274, 106578. [Google Scholar] [CrossRef]
  71. Ya, R.; Wu, J.; Tang, R.; Zhou, Q. Increased Flood Susceptibility in the Tibetan Plateau with Climate and Land Use Changes. Ecol. Indic. 2023, 156, 111086. [Google Scholar] [CrossRef]
Figure 1. Location map of the study area.
Sustainability 18 05158 g001
Figure 2. Flood conditioning factors. (a) Elevation (Ele); (b) Slope; (c) Curvature (Cur); (d) Topographic Wetness Index (TWI); (e) Daily mean precipitation (Pre); (f) Heavy rainfall frequency (HRF); (g) Land use/land cover (LULC); (h) Soil type (ST); (i) Distance to water (DTW); (j) Normalized Difference Vegetation Index(NDVI); (k) Distance to roads (DTR); (l) Night-time light intensity (NTL).
Sustainability 18 05158 g002
Figure 3. Research framework.
Sustainability 18 05158 g003
Figure 4. Identification of urban expansion patterns in Zhaotong city’s counties.
Sustainability 18 05158 g004
Figure 5. ROC-AUC curves of four machine learning models for flood susceptibility.
Sustainability 18 05158 g005
Figure 6. Spatial mapping of flood susceptibility in Zhaotong city based on the XGBoost model.
Sustainability 18 05158 g006
Figure 7. Factor analysis of flash flood susceptibility. (a) Feature importance derived from SHAP values, indicating the average contribution of each feature to model predictions; (b) Annular rose plot illustrating the percentage contribution of each feature; (c) SHAP honeycomb plot depicting the impact of features on the prediction for individual samples. Red and blue indicate higher and lower feature values, respectively, with positive values increasing susceptibility and negative values decreasing susceptibility.
Sustainability 18 05158 g007
Figure 8. Response curves of urban expansion factors on flood susceptibility. (a) Infill (%); (b) Edge (%); (c) Leapfrog (%); (d) PD; (e) LPI; (f) AI. The shaded area represents the 95% confidence interval, and the black-edged carpet plot shows the sample distribution.
Sustainability 18 05158 g008
Table 1. Data sources and characteristics used in this study.
DataResolutionTime PeriodSource
Land Use/Land Cover30 m2000, 2025Resources and Environmental Science Data Platform “https://www.resdc.cn/” (accessed on 1 March 2026)
SRTM DEM30 m2000NASA “http://srtm.csi.cgiar.org” (accessed on 1 March 2026)
NDVI30 m2025Resources and Environmental Science Data Platform “https://www.resdc.cn/” (accessed on 2 March 2026)
Soil1 km2023HarmonizedWorldSoilDatabase (HWSD) “https://gaez.fao.org/pages/hwsd“ (accessed on 2 March 2026)
River network\\MERITHydro
https://hydro.iis.u-tokyo.ac.jp/~yamadai/MERIT_Hydro/“ (accessed on 2 March 2026)
Road network\2025Openstreetmap “https://www.openstreetmap.org/“ (accessed on 3 March 2026)
Precipitation1 km2000–2025National Tibetan Plateau Data Center “https://data.tpdc.ac.cn/home“ (accessed on 3 March 2026)
Heavy Rainfall Frequency0.05°2000–2025Climate Hazards Group InfraRed Precipitation with Station data. Daily rainfall estimates
https://developers.google.com/earth-engine/datasets/catalog/UCSB-CHG_CHIRPS_DAILY” (accessed on 4 March 2026)
NTL750 m2024NPP/VIIRSS “https://ncc.nesdis.noaa.gov/VIIRS/” (accessed on 4 March 2026)
Table 2. Explanation of flood conditioning factors based on the Zhaotong region.
DimensionIndicatorDescriptionReferences
TopographyElevation(Ele)Influences precipitation, vegetation cover, soil depth and texture, ultimately affecting runoff.[38,43]
SlopeFlat areas are more prone to flooding compared to steeper regions, where surface runoff is typically higher.[41,44]
Curvature (Cur)Planar curvature affects the convergence and divergence of flow; concave and flat areas tend to accumulate water more readily.[45,46]
Topographic Wetness Index (TWI)Quantifies the control of topography on runoff concentration and moisture retention; high TWI values cause runoff to concentrate and become more difficult to drain.[19,44]
MeteorologicalAnnual Precipitation (Pre)Higher precipitation leads to greater soil moisture saturation, increasing the likelihood of infiltration-excess surface runoff and flash flood occurrence during intense rainfall events.[47,48]
Heavy Rainfall Frequency (HRF)Flash floods are more frequent during extreme precipitation events, which rapidly increase surface runoff, exceeding natural drainage capacity and thereby increasing flood probability.[3,19]
EnvironmentalLand Use/Land Cover (LULC)Land use/land cover plays a critical role in regulating surface runoff, infiltration, interception, and evapotranspiration. Built-up areas are more vulnerable to flooding than forested areas.[41,49]
Soil Texture (ST)Reflects the soil’s resistance to water infiltration and movement.[3,44]
Distance to River (DTW)Areas closer to rivers are more susceptible to flooding than those further away.[44,50]
NDVIVegetation helps mitigate flooding by enhancing soil permeability and reducing surface runoff velocity and volume.[46,51]
Human ActivitiesDistance to Roads (DTR)Road networks typically guide flood flow or channel water into rivers and reservoirs via drainage systems.[52,53]
Nighttime Lights (NTL)Areas with strong nighttime lights reflect dense settlements and infrastructure, which, due to impervious surfaces and exposure, increase flood risk.[43,44]
Table 3. Explanation of Urban Expansion Indicator Formulas.
IndicatorRangeDescription
Patch Density (PD)>0Indicates the degree of landscape fragmentation
Largest Patch Index (LPI)[0, 100]Represents the dominance and expansion polarization trend of major urban patches
Aggregation Index (AI)[0, 100]Indicates the spatial aggregation level of built-up areas
Table 4. Accuracy evaluation metrics for flood susceptibility ML models.
ModelACCPrecisionRecallF1-ScoreAUC
SVM0.7910.7930.7460.7780.863
RF0.7820.7800.7530.7660.869
LR0.7770.7780.7410.7590.862
XGBoost0.7930.7860.7760.7810.877
Table 5. GAM results for the impact of urban expansion indicators on flood susceptibility.
Independent VariableedfRef.dfF-ValueContribution %
s(Infilling%)1.0001.0000.5835.47%
s(Edge%)3.151 ***3.9186.20417.23%
s(Leapfrog%)5.990 ***7.06216.29432.75%
s(PD)3.202 ***4.03712.77417.51%
s(LPI)1.030 ***1.03516.7645.47%
s(AI)3.946 ***4.8174.81621.58%
AIC−1246.026R2 adjusted (%)0.286
BIC−1080.01D2 (%)29.2%
Note: edf = Estimated Degrees of Freedom; D2 = Explained Deviation. *** indicates p < 0.001, highly significant.
Disclaimer/Publisher’s Note: The statements, opinions and data contained in all publications are solely those of the individual author(s) and contributor(s) and not of MDPI and/or the editor(s). MDPI and/or the editor(s) disclaim responsibility for any injury to people or property resulting from any ideas, methods, instructions or products referred to in the content.