Article

Managing Rural Decline in the 21st Century: Spatial Insights from European Shrinking Regions

by
Jurgis Zagorskas
1,*,
Daiva Makutėnienė
1,
Gintaras Stauskis
2 and
Dalia Dijokienė
2
1
Department of Engineering Graphics, Faculty of Fundamental Sciences, VILNIUSTECH—Vilnius Gediminas Technical University, Saulėtekio al. 11, LT-10223 Vilnius, Lithuania
2
Department of Urban Design, Faculty of Architecture, VILNIUSTECH—Vilnius Gediminas Technical University, Saulėtekio al. 11, LT-10223 Vilnius, Lithuania
*
Author to whom correspondence should be addressed.
Sustainability 2026, 18(10), 5091; https://doi.org/10.3390/su18105091
Submission received: 22 March 2026 / Revised: 7 May 2026 / Accepted: 13 May 2026 / Published: 18 May 2026
(This article belongs to the Section Sustainable Urban and Rural Development)

Abstract

Depopulation and urban–rural population redistribution are challenges that reshape settlement patterns, landscapes, and local economies in many regions, from Europe to China and from Japan to North America. This study examines spatial and demographic transformations in the Baltic States (Europe), using Lithuania as a detailed case study. The analysis is based on high-resolution GIS population data derived from official population registers and linked to georeferenced settlement polygons for the years 2011 and 2021, combined with a linear projection of population change to 2026 (five-year period). The results reveal that population decline, which appears modest at the aggregated statistical level (approximately −1.1% to −1.5% per year), is territorially concentrated and reaches 45–48% in the most affected areas, which can only be identified through fine-scale spatial analysis. The most pronounced decline (−46%) is observed in the population of detached rural dwellings between 2011 and 2021, with trend-based estimation indicating that vacant rural houses may exceed 50% by 2026. At the same time, peri-urban zones surrounding the largest cities show clear population growth, largely driven by internal migration from ageing urban districts, smaller towns, and peripheral rural areas, compensating aggregated values and masking underlying processes. The findings reveal a dual process of rural shrinkage and suburban expansion, increasing pressures on territorial cohesion, service provision, infrastructure planning, and the preservation of cultural landscapes. The application of high-resolution spatial data allows the detection of localized demographic processes that remain insufficiently captured in conventional municipality-level statistics and that have rarely been analyzed at this level of spatial detail. Based on these results, this study emphasizes policy approaches such as adaptive rural regeneration and managed shrinkage. Although the empirical analysis is focused on Lithuania, the identified trends are relevant to many shrinking regions worldwide and may be reproduced using local population register data in other countries to support evidence-based regional planning.

1. Introduction

Rural depopulation and settlement decline is a global spatial development challenge, and it is taking place in both developed and emerging economies. Across regions in East Asia [1,2], Europe [3], and North America [4], long-term processes of demographic ageing, declining fertility, and sustained rural-to-urban migration are changing rural landscapes, leading to shrinking of settlements, abandoned housing, and weakening local economies.
In Japan, rapid population ageing and low birth rates have produced thousands of vacant rural homes, commonly referred to as akiya, alongside entire villages at risk of disappearance [5]. Similar patterns are evident in China, where large-scale rural–urban migration has resulted in so-called “hollow villages,” characterized by underutilized housing and declining rural populations, despite continued agricultural land use [6]. In the United States, many rural counties have experienced persistent population loss over several decades, driven by economic restructuring, agricultural consolidation, and limited employment opportunities [7].
Rural depopulation is also a widespread phenomenon across Europe, particularly pronounced in eastern and southern regions as well as in other peripheral areas, where long-term structural transformations have resulted in significant population decline and increasing spatial imbalances [8]. In the interior of Spain, often named España vaciada [9], large territories have experienced decades of population loss, resulting in ageing communities, declining service provision, and increasing territorial marginalization [10]. Similarly, in Italy, many villages in all regions have undergone progressive abandonment since the mid-20th century, driven by industrialization, agricultural decline, and outmigration toward urban and coastal areas [11,12]. In Portugal, comparable dynamics of rural exodus, emigration, and declining birth rates have led to long-term depopulation and economic decline in interior regions, although recent years have shown limited signs of revitalization linked to return migration, labor immigration in agriculture, and emerging counter-urbanization trends following the COVID-19 pandemic [13]. In response, European Union (EU) policy initiatives have focused on revitalization through tourism development [14], cultural heritage preservation, and incentives for new forms of rural residency, including the attraction of remote workers and international migrants [15].
Beyond southern Europe, rural decline has become a broader European spatial development trend, particularly in central and eastern Europe, following post-socialist economic transformation. It is especially visible in the eastern part of the continent, particularly the Balkan region (countries of the Western Balkans; also Bulgaria, Romania, and Moldova) and Baltic States (Lithuania, Latvia, Estonia) [16]. The transition from centrally planned to market economies after 1990 triggered large-scale restructuring of agriculture and industry, leading to job losses, outmigration, and the weakening of rural settlement systems [17]. While western European countries experienced similar rural-to-urban migration earlier in the 20th century, these processes have been more abrupt and spatially uneven in post-socialist contexts, where institutional change, globalization, and integration into the European Union have accelerated demographic decline [18].
In response to these changes, European territorial policy increasingly recognizes rural depopulation and spatial imbalances as critical issues for sustainable development and regional cohesion. To support rural areas, the EU promotes territorial cohesion, aiming to ensure that all regions have equitable access to economic, social, and environmental opportunities. The ESPON program contributes by assessing the spatial impacts of EU policies through Territorial Impact Assessments (TIAs), providing evidence for policymakers and the Committee of the Regions to design more sustainable and balanced interventions. Through its research initiatives, ESPON has systematically mapped and analyzed shrinking regions across Europe. Notably, the ESCAPE project (European Shrinking Rural Areas: Challenges, Actions, and Perspectives) documents the scale and spatial distribution of rural population decline, highlighting eastern and southern Europe as regions experiencing structural shrinkage [19].
ESPON studies emphasize that rural depopulation is not merely a demographic trend but a complex, multi-scalar transformation affecting economic structures, service provision, and spatial organization. Consequently, they advocate a shift from traditional growth-oriented regional policies toward adaptive, place-based strategies, including “smart shrinking” approaches that maintain quality of life, secure access to essential services, and reconfigure infrastructure and land use in line with declining populations. Within this policy framework, peripheral regions, particularly in central and eastern Europe, are identified as priority areas where demographic, economic, and spatial disadvantages intersect, requiring integrated and context-sensitive policy responses.
The Baltic States represent one of the most extreme cases for examining the spatial and demographic dynamics of rural shrinkage in European regions. As peripheral EU regions, Lithuania, Latvia, and Estonia face sustained outmigration, low fertility, and rapid population ageing [20]. These processes are further influenced by their geopolitical position, small domestic markets, and integration into transnational labor mobility systems, which facilitate large-scale emigration to western Europe [21]. Rural areas in the Baltic region exhibit accelerated forms of decline, including high rates of housing vacancy, reduction of local services, and the near disappearance of traditional dispersed settlements [22,23].
A key research gap remains the limited availability of fine-scale spatial demographic studies capable of identifying where decline is occurring within municipalities rather than only between them. Most previous studies on the Baltic States have relied on aggregated regional or municipal statistics, which are valuable for identifying broad tendencies but often conceal simultaneous rural shrinkage, suburban expansion, and demographic divergence within the same administrative territory [24,25,26,27]. This study addresses that gap by applying high-resolution geolocated population data and GIS analysis to reveal settlement-level patterns of change that are not visible in conventional aggregated datasets.
The population changes in rural areas are influenced by a range of broader socio-economic and demographic processes, which are not explicitly modeled in the quantitative framework but are widely recognized in the literature as key drivers of spatial demographic change. These include:
  • labor-driven migration toward urban centers and regions with higher employment opportunities;
  • educational mobility, particularly the relocation of younger population groups to university cities and their limited return to rural areas;
  • persistent income disparities between rural and urban regions;
  • unequal access to infrastructure and public services, including healthcare, education, and administrative facilities;
  • differences in perceived quality of life, including housing conditions, environmental quality, and lifestyle preferences;
  • transport connectivity and communication accessibility, affecting mobility and regional integration;
  • population ageing, resulting in a higher proportion of elderly residents and an increased natural death rate.
These factors collectively contribute to long-term depopulation trends in dispersed rural settlements and provide a socio-demographic context for interpreting the spatial patterns observed in the empirical data.
The Baltic case examined in this study reflects region-specific demographic and spatial dynamics shaped by post-socialist transformation, migration patterns, and institutional context and should not be directly generalized to other regions. However, the methodological approach applied in this research demonstrates how high-resolution, geolocated census data combined with GIS analysis can be used to identify fine-scale spatial patterns of population change. This enables the detection of localized dynamics of decline, ageing, and housing transformation that are not captured by aggregated statistics. While the empirical findings are specific to the Baltic context, the analytical framework is transferable to other regions where detailed spatial data are available, supporting policymakers and spatial planners in developing context-sensitive, place-based strategies for managing territories.
At the aggregate level, population decline may appear moderate, often expressed as relatively small annual percentage losses. However, such indicators frequently mask the scale and intensity of local transformations. When examined at a finer spatial resolution, these changes reveal substantially more pronounced impacts, driven not only by overall population loss but also by internal migration processes, particularly the redistribution of populations from rural areas to peri-urban and urban territories. Even a seemingly modest annual decline of around 1% can hide significant local effects, including extensive depopulation, housing vacancy, and the emergence of large areas with limited or no permanent residents. The case examined in this study demonstrates where the most problematic areas can be located, particularly focusing on abandonment of dispersed settlements and a rapid increase in vacant rural detached housing.
The principal contribution of this paper is both empirical and methodological. Empirically, it provides the first detailed spatial assessment of rural housing vacancy, settlement shrinkage, and peri-urban growth in Lithuania using more than 250,000 georeferenced territorial units. Methodologically, it demonstrates how official register-based demographic data integrated with GIS can improve the diagnosis of territorial change and support more precise place-based planning responses in shrinking regions.
This study primarily focuses on rural detached houses, a settlement category that has received limited attention in both the scientific literature and policy discourse. In this context, rural detached houses refer to isolated residential properties located within the rural landscape, typically constructed several generations ago and historically inhabited by farming households managing the surrounding land or farmstead complexes. The condition of this housing stock has become increasingly critical, as revealed by the present analysis. However, detailed empirical studies on this process remain scarce. For this reason, particular emphasis is placed on the phenomenon of housing abandonment and its spatial implications.

2. Depopulation in Europe, the Baltic States, and Lithuania

Today, the whole of Europe is experiencing a major demographic transformation characterized by an ageing population, declining birth rates, and a reduction in the working-age population. Projections suggest that the European Union’s total population will decrease from about 451 million in 2025 to around 406 million by 2050, representing a decline of roughly 10%. The number of working-age adults is expected to fall by more than 20%, while the number of older adults will continue to grow and the number of children will diminish [28]. These changes point to significant challenges for Europe’s economic stability, social systems, and regional development.
Beginning in the 1950s and accelerating through the 1960s and 1970s, western European countries such as Germany, France, and the United Kingdom experienced major waves of rural depopulation [29]. Agricultural mechanization reduced the demand for rural labor, while expanding urban economies attracted people seeking employment, education, and improved living conditions. As a result, millions migrated from villages and small towns to urban centers.
Over the past century—but particularly since the mid-20th century—Europe has experienced profound demographic and spatial transformations driven by sustained rural-to-urban migration [30]. This internal population movement has fundamentally reshaped the continent’s human geography. The trend originated after World War II, when industrialization, urban reconstruction, and industry modernization policies promoted labor mobility and concentrated economic activity in and around big cities.
Comparable processes occurred later in southern and eastern Europe, including Spain [10], Italy, Poland, and the Baltic States, though under distinct socio-political circumstances. In post-socialist countries such as Lithuania, the rural-to-urban shift intensified after the collapse of the Soviet Union in 1991, with economic liberalization, land privatization, the dissolution of collective farms, and accelerated migration toward cities. Younger generations in particular moved in search of better opportunities, leaving behind ageing rural populations.

Baltic States in the European Context: Regional Dynamics and Internal Comparisons

While immigration may partially offset population decline at the European scale, its effects are unevenly distributed across regions [31,32]. Central and eastern European countries, including the Baltic states, continue to experience population loss despite overall EU-level gains [33]. In Lithuania, Latvia, and Estonia, limited immigration, persistent outmigration, and natural decrease have combined to accelerate demographic ageing and rural depopulation [34]. Many rural territories can be described as socio-demographically disadvantaged areas, long affected by outmigration and the decline of small-scale farming. In these regions, population ageing and settlement abandonment have intensified over the past few decades, reflecting trends seen across much of post-socialist Europe [35].
The spatial development of Lithuania during the post-World War II period was oriented toward a polycentric network of regional centers rather than the dominance of a single capital. In contrast to the more capital-centered development patterns observed in Latvia and Estonia, Lithuania’s strategy contributed to the growth of small towns into functional regional centers during the second half of the 20th century [36]. Under current demographic decline, the lowest-order settlements—particularly villages with very small populations—are disproportionately affected, as population levels fall below thresholds necessary to sustain even basic services.
As a result, many rural regions in central and eastern Europe have experienced sustained population losses during the past two decades, while suburban zones around major cities have expanded. This dual dynamic has restructured national settlement systems. In shrinking rural areas, school closures, service withdrawal, and infrastructure underuse have become common. At the same time, peri-urban growth has generated new spatial pressures, including dispersed housing development and increased commuting problems.
In Lithuania, these trends have led to a visible fragmentation of the historically dense network of villages and dispersed homesteads. While metropolitan and peri-urban areas continue to attract residents, numerous small settlements face advanced demographic ageing and rapidly declining population numbers.
Demographic decline and spatial restructuring in rural and peri-urban regions have been widely documented across Europe, particularly in post-socialist contexts shaped by economic and institutional transitions [37]. In the Baltic region, the legacy of Soviet spatial planning and subsequent post-socialist transformation has generated distinctive urban–rural development patterns [38]. Studies of Baltic city systems show that metropolization and spatial polarization dominate, while smaller towns and peripheral rural areas face depopulation and stagnation [39,40,41]. Peripheralization manifests through service decline, limited job opportunities, and restricted mobility, leaving some residents “left behind” and others compelled to migrate [42].
The Baltic experience aligns with broader European patterns of shrinking regions, but has important distinctions. Similar processes of rural population loss, ageing, service withdrawal, and settlement concentration can be observed in inland Spain, southern Italy, Bulgaria, Romania, and some old industrial territories of western Europe. Across Europe, shrinking regions are typically characterized by selective outmigration of younger residents, weakening local labor markets, and increasing dependence on a limited number of regional centers. However, the Baltic case is shaped by post-socialist restructuring, emigration after European integration, and the rapid transformation of agricultural and settlement systems after 1990. In this sense, Lithuania differs partly in the historical mechanisms through which shrinkage has occurred.
In Lithuania, extensive research has analyzed demographic and spatial transformations in rural settlement systems. Early work [43] mapped rural population decline, ageing, and the erosion of small farms [44], while later studies refined the concept of rural peripheralization, showing that most settlements lost residents regardless of size, though proximity to urban centers or infrastructure moderated these trends [42,45]. Research on suburbanization highlights continuing rural decline alongside rapid peri-urban growth near major cities such as Vilnius [25,26]. Ubarevičienė and Burneika [46] describe dispersed and weakly regulated suburbanization, linking it to broader national depopulation.
Parallel studies examine rural abandonment and landscape transformation. Jaszczak et al. [47] document abandoned villages across Lithuania and neighboring regions, attributing them to migration, consolidation of agriculture, and demographic ageing. Even protected rural areas, such as regional parks, continue to lose residents despite their conservation status [48]. Broader socio-economic analyses point to structural disparities in productivity, employment, and poverty rooted in the Soviet industrial geography and globalization pressures [49].
Recent scholarship identifies the Baltic states as among Europe’s fastest-shrinking regions. Kondratieva [50] attributes persistent depopulation to out-migration and natural decrease despite EU integration, while Chmielewski [51] highlights Latvia’s ongoing population loss and policy inaction. In Estonia, many settlements experience rapid shrinkage, with over 360 villages recording vacancy increases above 15% in seven years [52]. Similarly, in Latvia, suburban migration around Riga has not offset peripheral decline [53].
Lithuania, Latvia, and Estonia share common demographic processes but differ in the intensity and spatial distribution of shrinkage. In all three countries, long-term low fertility, ageing, outmigration, and the concentration of investment and employment in metropolitan regions have contributed to rural depopulation and settlement restructuring. However, from an urban perspective, Latvia is characterized by primacy of the Riga metropolitan region and pronounced decline in peripheral territories; Estonia has experienced moderate shrinkage due to stronger metropolitan performance and periodic migration gains. Lithuania shares the broader Baltic pattern of peripheral decline but retains a less monocentric settlement structure due to the role of several larger urban centers beyond the capital (see Table 1).
Overall, urban research in the Baltic region demonstrates interconnected processes of depopulation, population ageing, housing abandonment, and suburban expansion. Yet, most studies rely on macro-scale administrative data, overlooking fine-grained spatial patterns that newer, more precise datasets now enable. While some works employ GIS for land use mapping [54] or regional analysis [55,56], detailed spatial investigation of demographic change and housing transformation remains limited. This paper addresses this gap by using GIS to localize population redistribution and settlement change in the territory of Lithuania, contributing to a deeper understanding of Baltic regional dynamics.
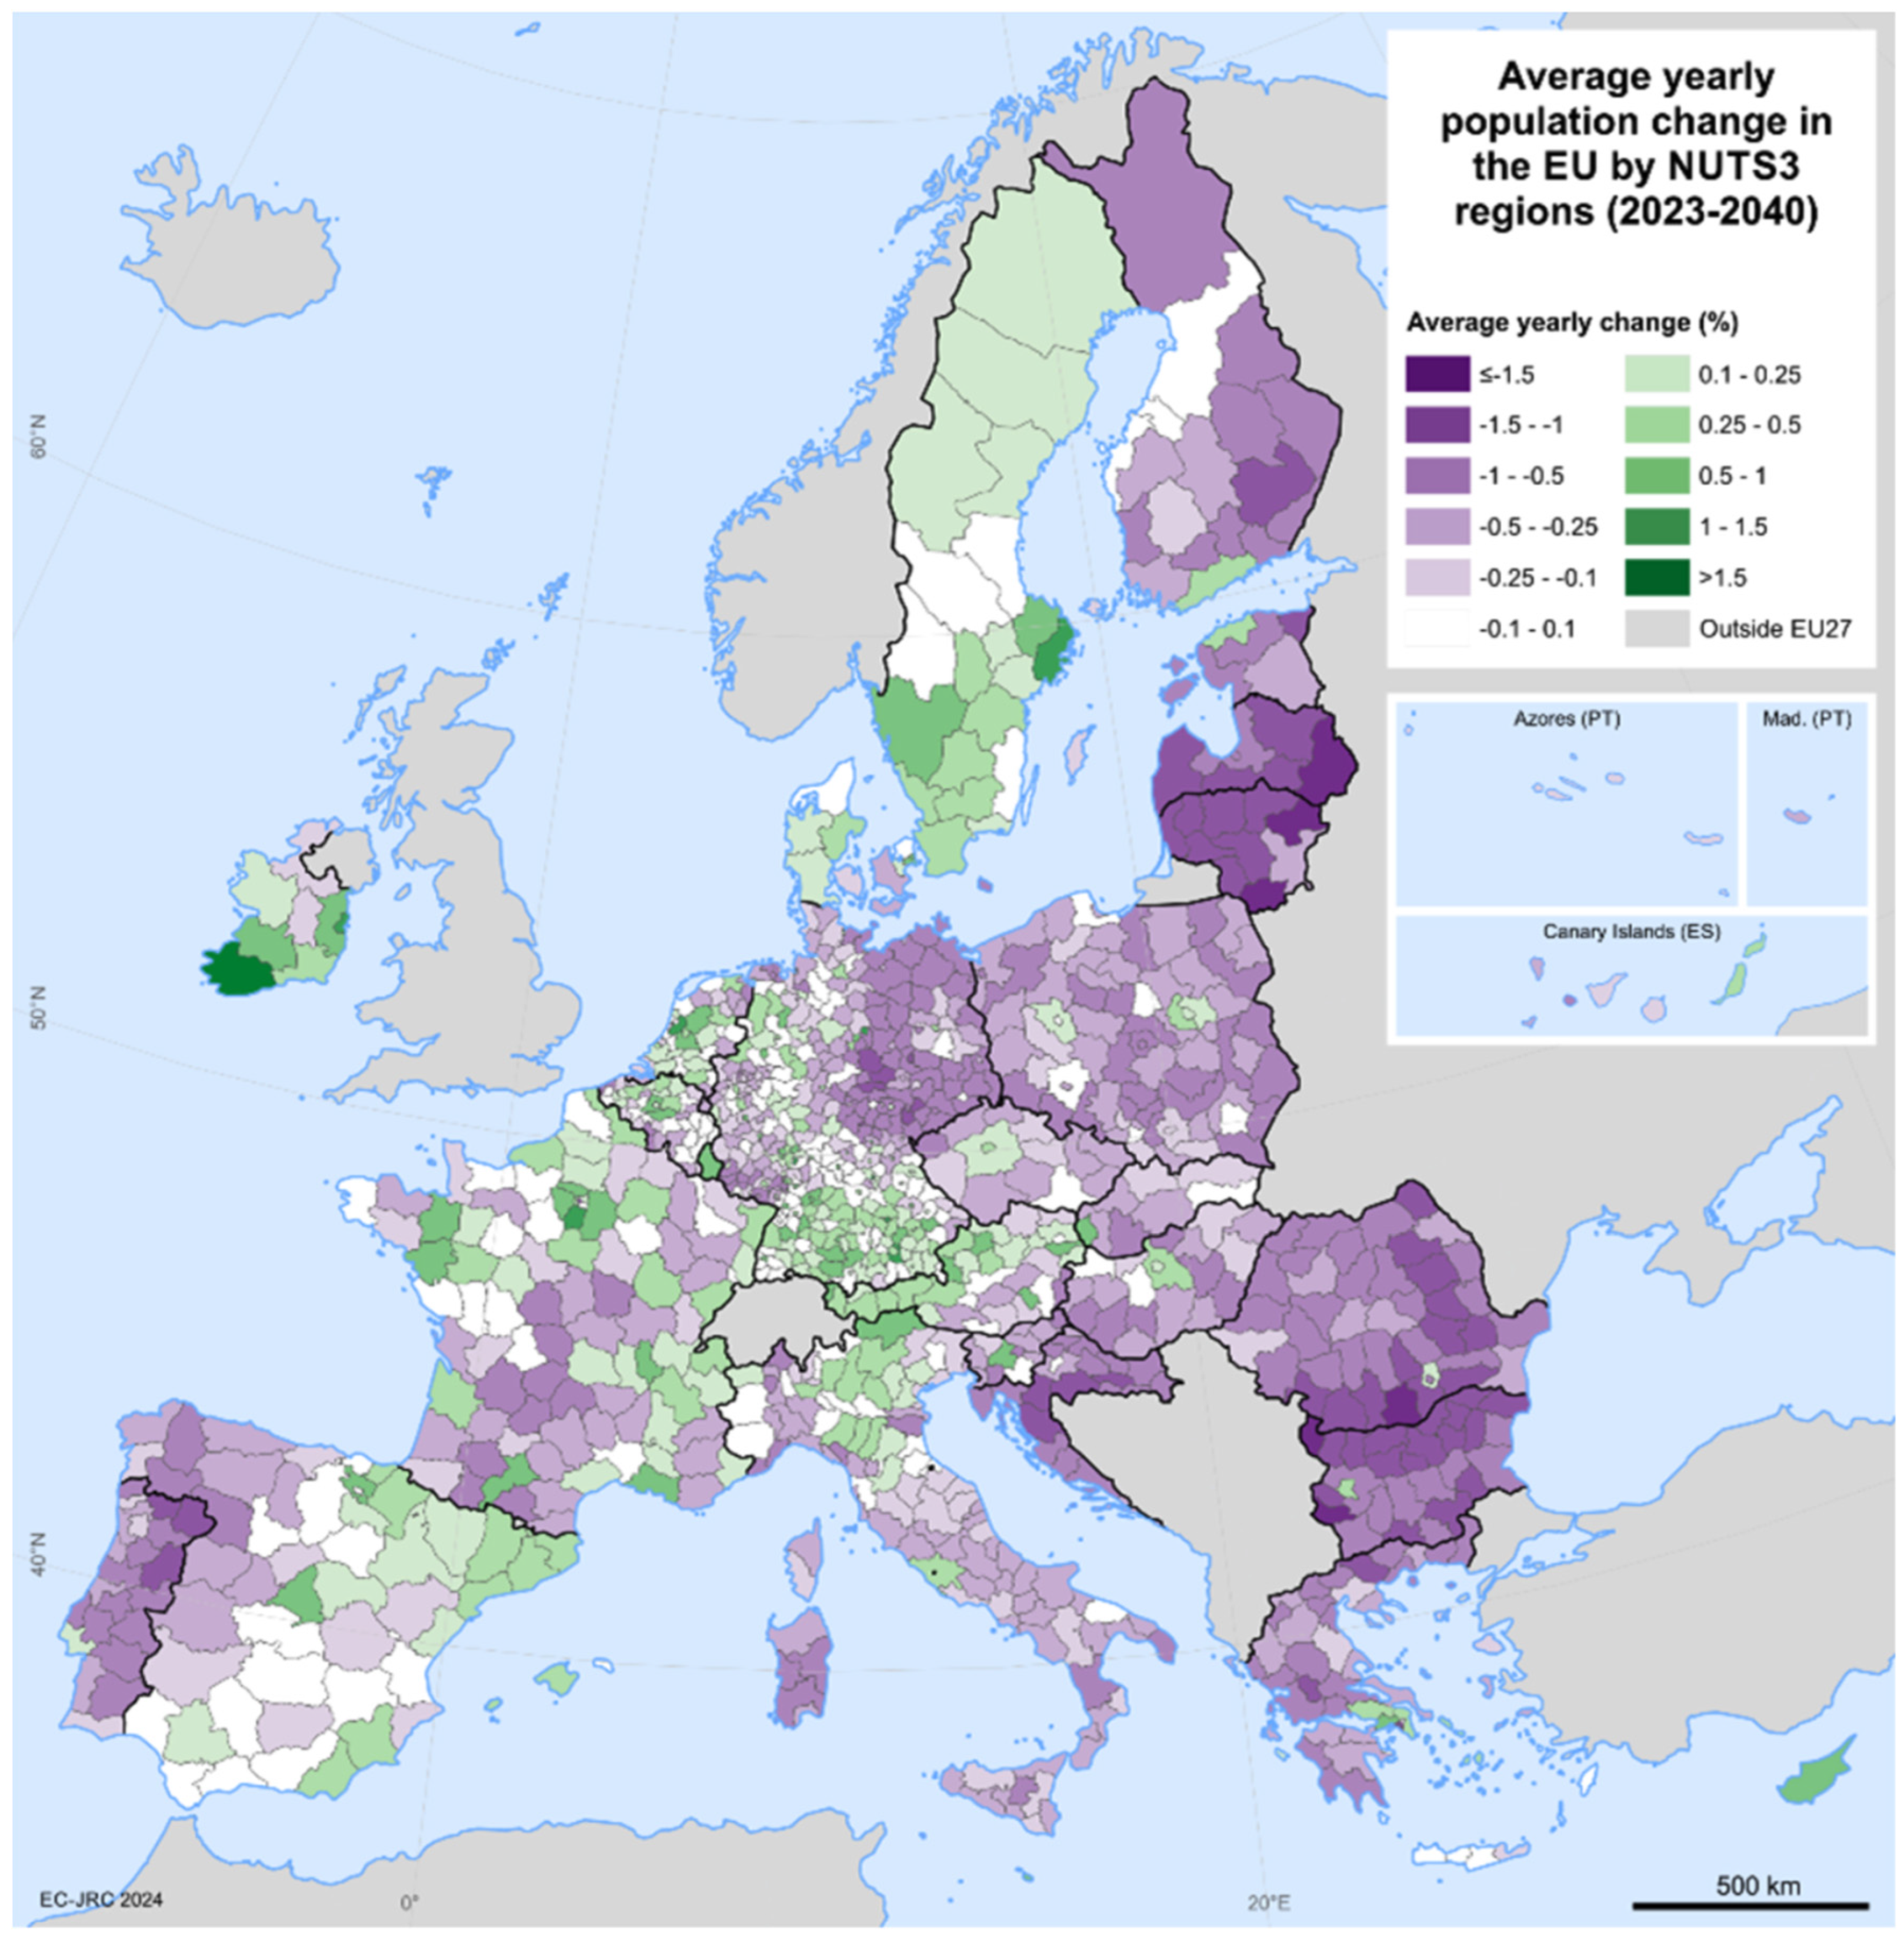
Lithuania, together with the other countries to the west of the Baltic Sea region, ranks among the fastest-depopulating regions in Europe. Current projections indicate that these trends are likely to persist in the coming decades. According to official European Union forecasts, Lithuania, together with other countries in the Baltic Sea region, is expected to remain among the fastest-depopulating areas in Europe (see Figure 1). Over the three decades following independence, Lithuania’s population declined by approximately 800,000 inhabitants, with total numbers falling to 2.884 million residents in 2026. More than one-fifth of the population is now above retirement age, reflecting rapid demographic ageing. The combined effects of sustained emigration and persistently low fertility continue to accelerate population decline. In recent years, annual births have remained at around 22,000, while the number of deaths has been approximately 40,000 per year.
Between 1990 and 2025, Lithuania’s population density declined from 59 to 46 inhabitants per square kilometer. Although the level of urbanization has remained relatively stable (68.5% urban population compared with 68% in 1990), the spatial distribution of the population has changed substantially. All municipalities in the country have experienced population loss to varying degrees. Official statistics show that between 1990 and 2023, approximately 1.17 million people emigrated, while 670,000 immigrated, resulting in a negative net migration balance of nearly half a million residents.
The demographic challenges confronting Lithuania are also evident in Latvia and Estonia, both of which have experienced substantial population decline since the early 1990s [51]. According to the 2021 Population and Housing Census, Latvia’s population stood at 1.89 million, representing an 8.5% decrease since 2011 [57]. Persistent emigration, natural population decrease, and limited internal migration towards smaller regional centers have reinforced this downward trend [58]. Estonia exhibits slightly different dynamics due to its smaller population and somewhat stronger economic performance; however, its long-term trajectory similarly reflects demographic contraction [25]. The country’s total population declined from 1.37 million in 2023 to approximately 1.31 million in 2025, following several years of minor fluctuations associated with post-pandemic migration adjustments [59]. Despite temporary gains linked to inward migration from Ukraine and other neighboring countries, demographic forecasts indicate that all three Baltic states will continue to face structural depopulation, ageing, and spatial imbalance between capital regions and peripheral rural areas. Collectively, these processes reveal a regional pattern of urban concentration, suburban expansion around metropolitan centers, and widespread rural decline, trends that are reshaping the human geography of the post-socialist Baltic space.
In the Baltic States, according to the EUROSTAT prognosis, the projected population change for the period 2026 – 2040 is estimated to be approximately −1% to −1.5% per year (see Table 1 and Figure 1). More moderate negative trends are expected only in the capital regions, including Vilnius, Riga, and Tallinn, where demographic decline is partially offset by internal migration and economic concentration. Overall, these dynamics correspond to a cumulative population decrease of approximately 15% over the period 2026–2040, with significantly stronger impacts anticipated in peripheral and rural areas.

3. Methodology

This study is based on open-access geolocated population datasets obtained from the Lithuanian State Data Agency (https://vda.lrv.lt/en/, accessed on 5 May 2026), covering the 2011 and 2021 population censuses. In these datasets, country citizens are assigned to specific urban blocks or rural dwellings, enabling high-resolution GIS-based analysis of spatial population dynamics.
All spatial analyses and cartographic visualizations were performed using QGIS (version 3.34 LTR). Population data for the period 2022–2026 were estimated through extrapolation of observed trends. Validation was performed with aggregated data of total population changes on January 1st of the years 2022–2026, taking into account the factor of war immigration of 104,441 people from Ukraine during these years.
The spatial units used in this study are polygon-based territorial entities derived from the aggregation of individual-level population register data. The original dataset consists of georeferenced point records representing the place of residence of each registered individual. These point data are aggregated by the Lithuanian State Data Agency into spatial units representing built-up areas, hereafter referred to as urban zones.
The dataset comprises 251,829 polygon entities (urban blocks), of which 171,799 are inhabited (i.e., contain at least one resident). In addition to population numbers and spatial information, the dataset includes key demographic variables such as age, occupation, education, employment status, and nationality, providing a comprehensive basis for analysis (see Appendix A).
These urban zones do not correspond to cadastral parcels or individual buildings. Instead, they are delineated according to settlement structure, typically following street networks in urban areas and spatial clustering of buildings in rural landscapes. As a result, each polygon may include one or multiple residential buildings. Importantly, even isolated rural homesteads located outside compact settlements are represented as individual urban zones, which allows the identification of dispersed settlement patterns at a very fine spatial scale.
The spatial resolution varies depending on the morphology and internal structure of built-up areas. Polygon areas range from approximately 0.017 ha to 189.5 ha, with a mean area of 1.07 ha. In urban environments, larger polygons are often associated with extensive multifunctional or industrial zones and large residential blocks bounded by major street corridors, while smaller polygons may occur in more finely subdivided central areas. In rural landscapes, polygon size reflects the spatial distribution of homesteads and settlement clusters, which may result in both small and relatively large units depending on local configuration.
The spatial framework of these units is consistent between the 2011 and 2021 datasets, as both are derived from the same national georeferenced population and address register system, ensuring full temporal comparability without the need for additional spatial harmonization procedures.
The use of highly disaggregated polygon units reduces the level of aggregation inherent in conventional municipality-based analyses and allows more precise identification of local demographic processes. The spatial units are defined according to built-up structure rather than a uniform grid. In practice, small variations in polygon boundaries may affect values at the administrative unit level. Nevertheless, the main spatial patterns identified in this study—particularly the concentration of population growth in peri-urban areas and the widespread decline of dispersed rural settlements—are consistent across different settlement contexts and not dependent on the specific configuration of individual polygons. Additional technical details are provided in Appendix A.

3.1. Spatial Modelling of Population Dynamics

To estimate population change beyond the latest census year, a linear regression model was applied to the 2011–2021 time series for each spatial unit i . The baseline population trajectory was defined as
P b a s e i ( t ) = a i t + b i
where P b a s e i ( t ) represents the estimated population in year t and a i and b i are regression parameters estimated independently for each polygon using least-squares fitting. This formulation preserves spatial heterogeneity in long-term demographic trends.
The model incorporates age-structured population data available for each spatial unit. Demographic change is further adjusted using a survival-weighted formulation that incorporates the age structure of each spatial unit. Rather than implementing a full cohort-component model based on detailed life tables, a simplified approximation was applied to account for spatial differences in age composition.
The survival coefficient S i ( t ) was derived from the age distribution within each spatial unit using grouped age categories and corresponding survival weights. These weights approximated relative survival probabilities based on national demographic patterns and life expectancy statistics, reflecting the general increase in mortality risk with age. The formulation was expressed as
S i ( t ) = a = 0 A m a x w a i s a ( t )
where w a i denotes the proportion of the population in age group a and s a ( t ) represents the corresponding survival weight.
This approach did not aim to replicate full life table dynamics but to introduce a first-order demographic correction reflecting the higher likelihood of population decline in older communities. The simplification was justified by the short projection horizon (2022–2026), the very high spatial resolution of the dataset, and the primary objective of capturing spatial differentiation rather than producing precise demographic forecasts.
To address uncertainty in future demographic trajectories, three scenario pathways—optimistic, baseline, and pessimistic—were implemented. Rather than representing precise forecasts, these scenarios were designed to capture a plausible range of demographic outcomes under varying socio-economic conditions.
The magnitude of scenario adjustments was intentionally kept moderate to reflect short-term uncertainty (to 2026) rather than long-term structural shifts.
The scenario adjustments were introduced through a multiplicative factor applied to the baseline projection:
P s i ( t ) = P i ( t ) ( 1 + δ s )
where δ s represents a scenario-specific adjustment parameter. The optimistic scenario reflected conditions of reduced outmigration, improved economic opportunities, or increased residential attractiveness, particularly in peri-urban areas. The pessimistic scenario captured the continuation or intensification of current trends, including sustained outmigration, population ageing, and weakening rural economies. The baseline scenario assumed continuation of observed dynamics without additional acceleration or mitigation.
All computations were implemented in Python 3.10 using the PyCharm IDE (JetBrains), primarily employing ArcPy, GeoPandas, NumPy, and Pandas libraries. Linear regression models were fitted independently for each spatial unit, while spatial coefficients, survival weights, and scenario adjustments were applied within an automated geospatial processing workflow.

3.2. Additional Robustness Check of Projection Specification

To evaluate the robustness of the projection approach, an additional comparison between linear and exponential functional forms was conducted at an aggregated spatial level, including major Lithuanian cities (Vilnius, Kaunas, Klaipėda, Panevėžys) and a representative shrinking rural region (Kelmė district). The exponential specification assumes a constant proportional rate of change, in contrast to the linear trend applied in the main model. The comparison shows that projected population values for 2026 differed only marginally between the two approaches. In major cities, deviations remained very small, typically within the range of approximately 0.05–0.15%, while in shrinking rural regions, the difference was larger, reaching up to about 2.2% in the tested case. Both specifications produced consistent directional trends, confirming continued growth in metropolitan areas and decline in smaller cities and rural regions.
When applied at the level of individual spatial units (polygons), the exponential formulation produced unstable and systematically biased results. This was primarily due to the presence of zero and low-population units, where small absolute changes translated into disproportionately large growth rates, leading to artificial overestimation of population in expanding areas.
These results indicate that for the relatively short projection horizon used in this study (2022–2026), the choice of functional form did not materially affect aggregated outcomes, while linear extrapolation provided a more stable, transparent, and robust approach for fine-scale spatial modeling.
Below is the code of the population projection function written in Python used to calculate the estimated population for 2022–2026:
  • def project_population(pop_2011, pop_2021, age_structure, year):
  •   “““ Population projection model with spatial coefficient, age structure,
  •   and scenario-based uncertainty.
  •   Parameters:
  •   -----------
  •   pop_2011: float, Population in 2011
  •   pop_2021: float, Population in 2021
  •   age_structure: list of tuples
  •   Example: [(75,1), (21,2), (30,1)]
  •   format: (age, count)
  •   year: int, Target projection year (e.g., 2025)
  •  
  •   Returns: tuple, (pessimistic, baseline, optimistic)
  •   ”””
  •  
  •   # --- linear annual trend ---
  •   years = 2021 - 2011
  •   annual_change = (pop_2021 - pop_2011)/years
  •  
  •   t = year - 2021
  •   base = pop_2021 + annual_change * t
  •  
  •   # --- age survival weighting (simplified deterministic form) ---
  •   survival = 0.0
  •   total = 0.0
  •   for age, count in age_structure:
  •       total += count
  •   # simple survival approximation based on life expectancy threshold
  •       if age < 65:
  •           weight = 1.0
  •       elif age < 77:
  •           weight = 0.85
  •       else:
  •           weight = 0.60
  •       survival += weight * count
  •  
  •   survival_factor = survival/total if total > 0 else 1.0
  •   base = base * survival_factor
  •  
  •   # --- scenario definition ---
  •   pessimistic = base * 0.95 # stronger decline
  •   baseline = base # central estimate
  •   optimistic = base * 1.05 # mild mitigation effect
  • return pessimistic, baseline, optimistic
The survival weighting implemented in the model represented a simplified deterministic approximation of age-dependent mortality and should be interpreted as a spatial differentiation factor rather than a full demographic projection mechanism.

4. Research Findings

According to official statistics, Lithuania experienced a total population decline of 241,827 individuals between 2011 and 2021, corresponding to approximately 6.3% of the population. Growth patterns in urban settlements were observed almost exclusively in the Vilnius region, the national capital and largest city; other regions, including secondary cities and rural areas, experienced only population decline during the study period. Over the same period, newly developed single-family housing areas and central districts of Vilnius recorded substantial population growth, partially offsetting broader population losses. Locally, the largest absolute population losses were observed in post-war and Soviet-era (1950–1990) multi-family housing districts, while the most significant relative declines occurred in rural detached houses, which represent a key component of the traditional settlement structure in rural Lithuania.

4.1. Consistency of Key Figures

To ensure internal consistency of the reported results, it is important to clarify that population change figures presented in this study are derived from different levels of spatial aggregation and therefore are not directly additive. National-level population change reflects the total balance of all spatial units, including both declining rural settlements and growing urban and peri-urban areas. In contrast, figures reported for specific settlement types (e.g., rural detached houses, urban districts, or newly developed suburban zones) represent disaggregated components of this total and capture localized dynamics that may differ substantially in magnitude and direction (see Table 2).
For example, the reported decline in rural detached housing population reflects a specific subset of the national settlement system, while simultaneous population gains in peri-urban areas partially offset these losses at the aggregate level. As a result, differences between absolute losses reported at the national scale and those observed within individual settlement categories arise from internal population redistribution processes.

4.2. Main Finding Details

Rural standalone houses, numbering 90,571 in 2011 and accommodating 353,480 residents, experienced a decline of 146,632 residents by 2021, leaving 206,848 inhabitants. In total, 31,530 of these households (around 15%) were occupied exclusively by individuals aged 65 years and over, indicating advanced demographic ageing. Projections based on observed trends suggest a further reduction of approximately 58,650 residents by 2025, resulting in a cumulative population loss of about 205,282 individuals, or 58% relative to the 2011 baseline. These findings underscore the severe depopulation and demographic aging in Lithuania’s traditional dispersed rural settlements.
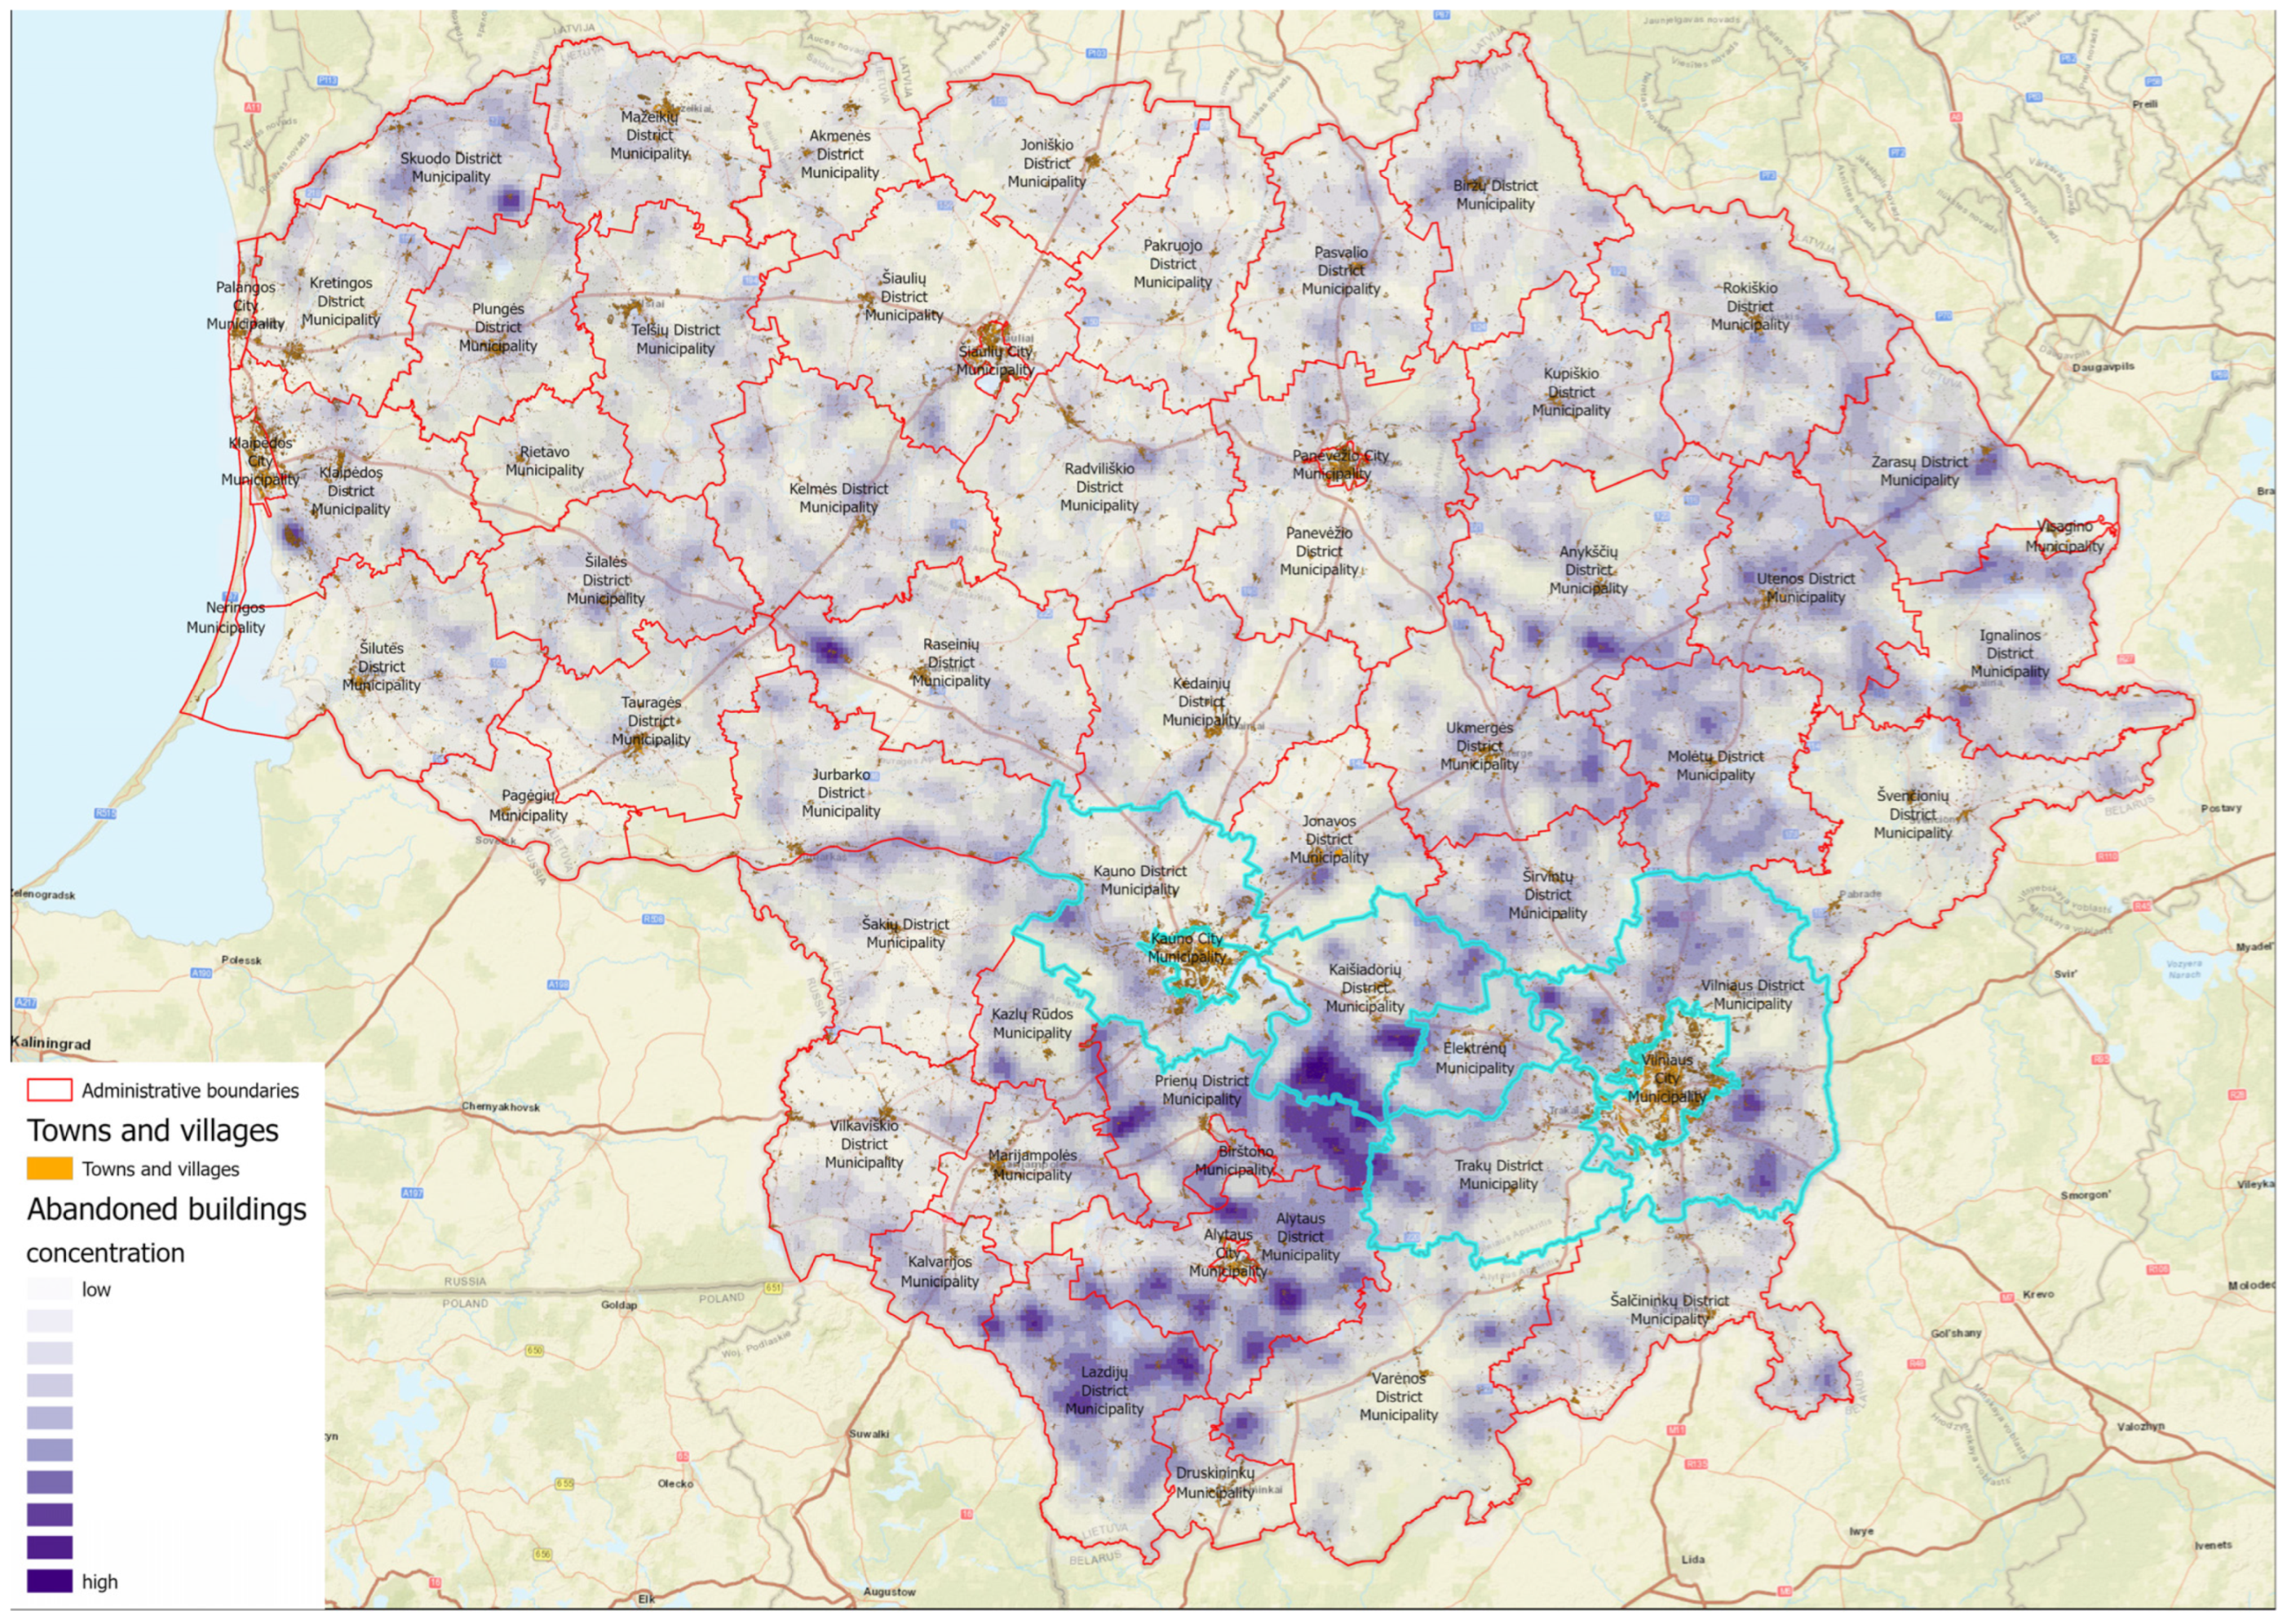
The spatial distribution of abandoned houses is particularly striking in the area between Vilnius and Kaunas, extending south toward Alytus and the Polish border (see Figure 2). While this area exhibits the highest density of abandoned homesteads, the total number of active detached rural houses is still higher than in northern Lithuania near the Latvian border, where remaining houses are sparse.
Big urban centers trigger intensive central gravity for the residents in Lithuania by providing multiple educational, employment, business, and cultural opportunities differently from rural areas. Even though the distances between these big urban centers do not exceed one hour travel time, many young citizens migrate from small settlements to bigger urban centers initially for studies and eventually become urban residents following their employment locations [60]. The tradition of remote working slightly counterbalances this, but mainly in later stages of a professional career.
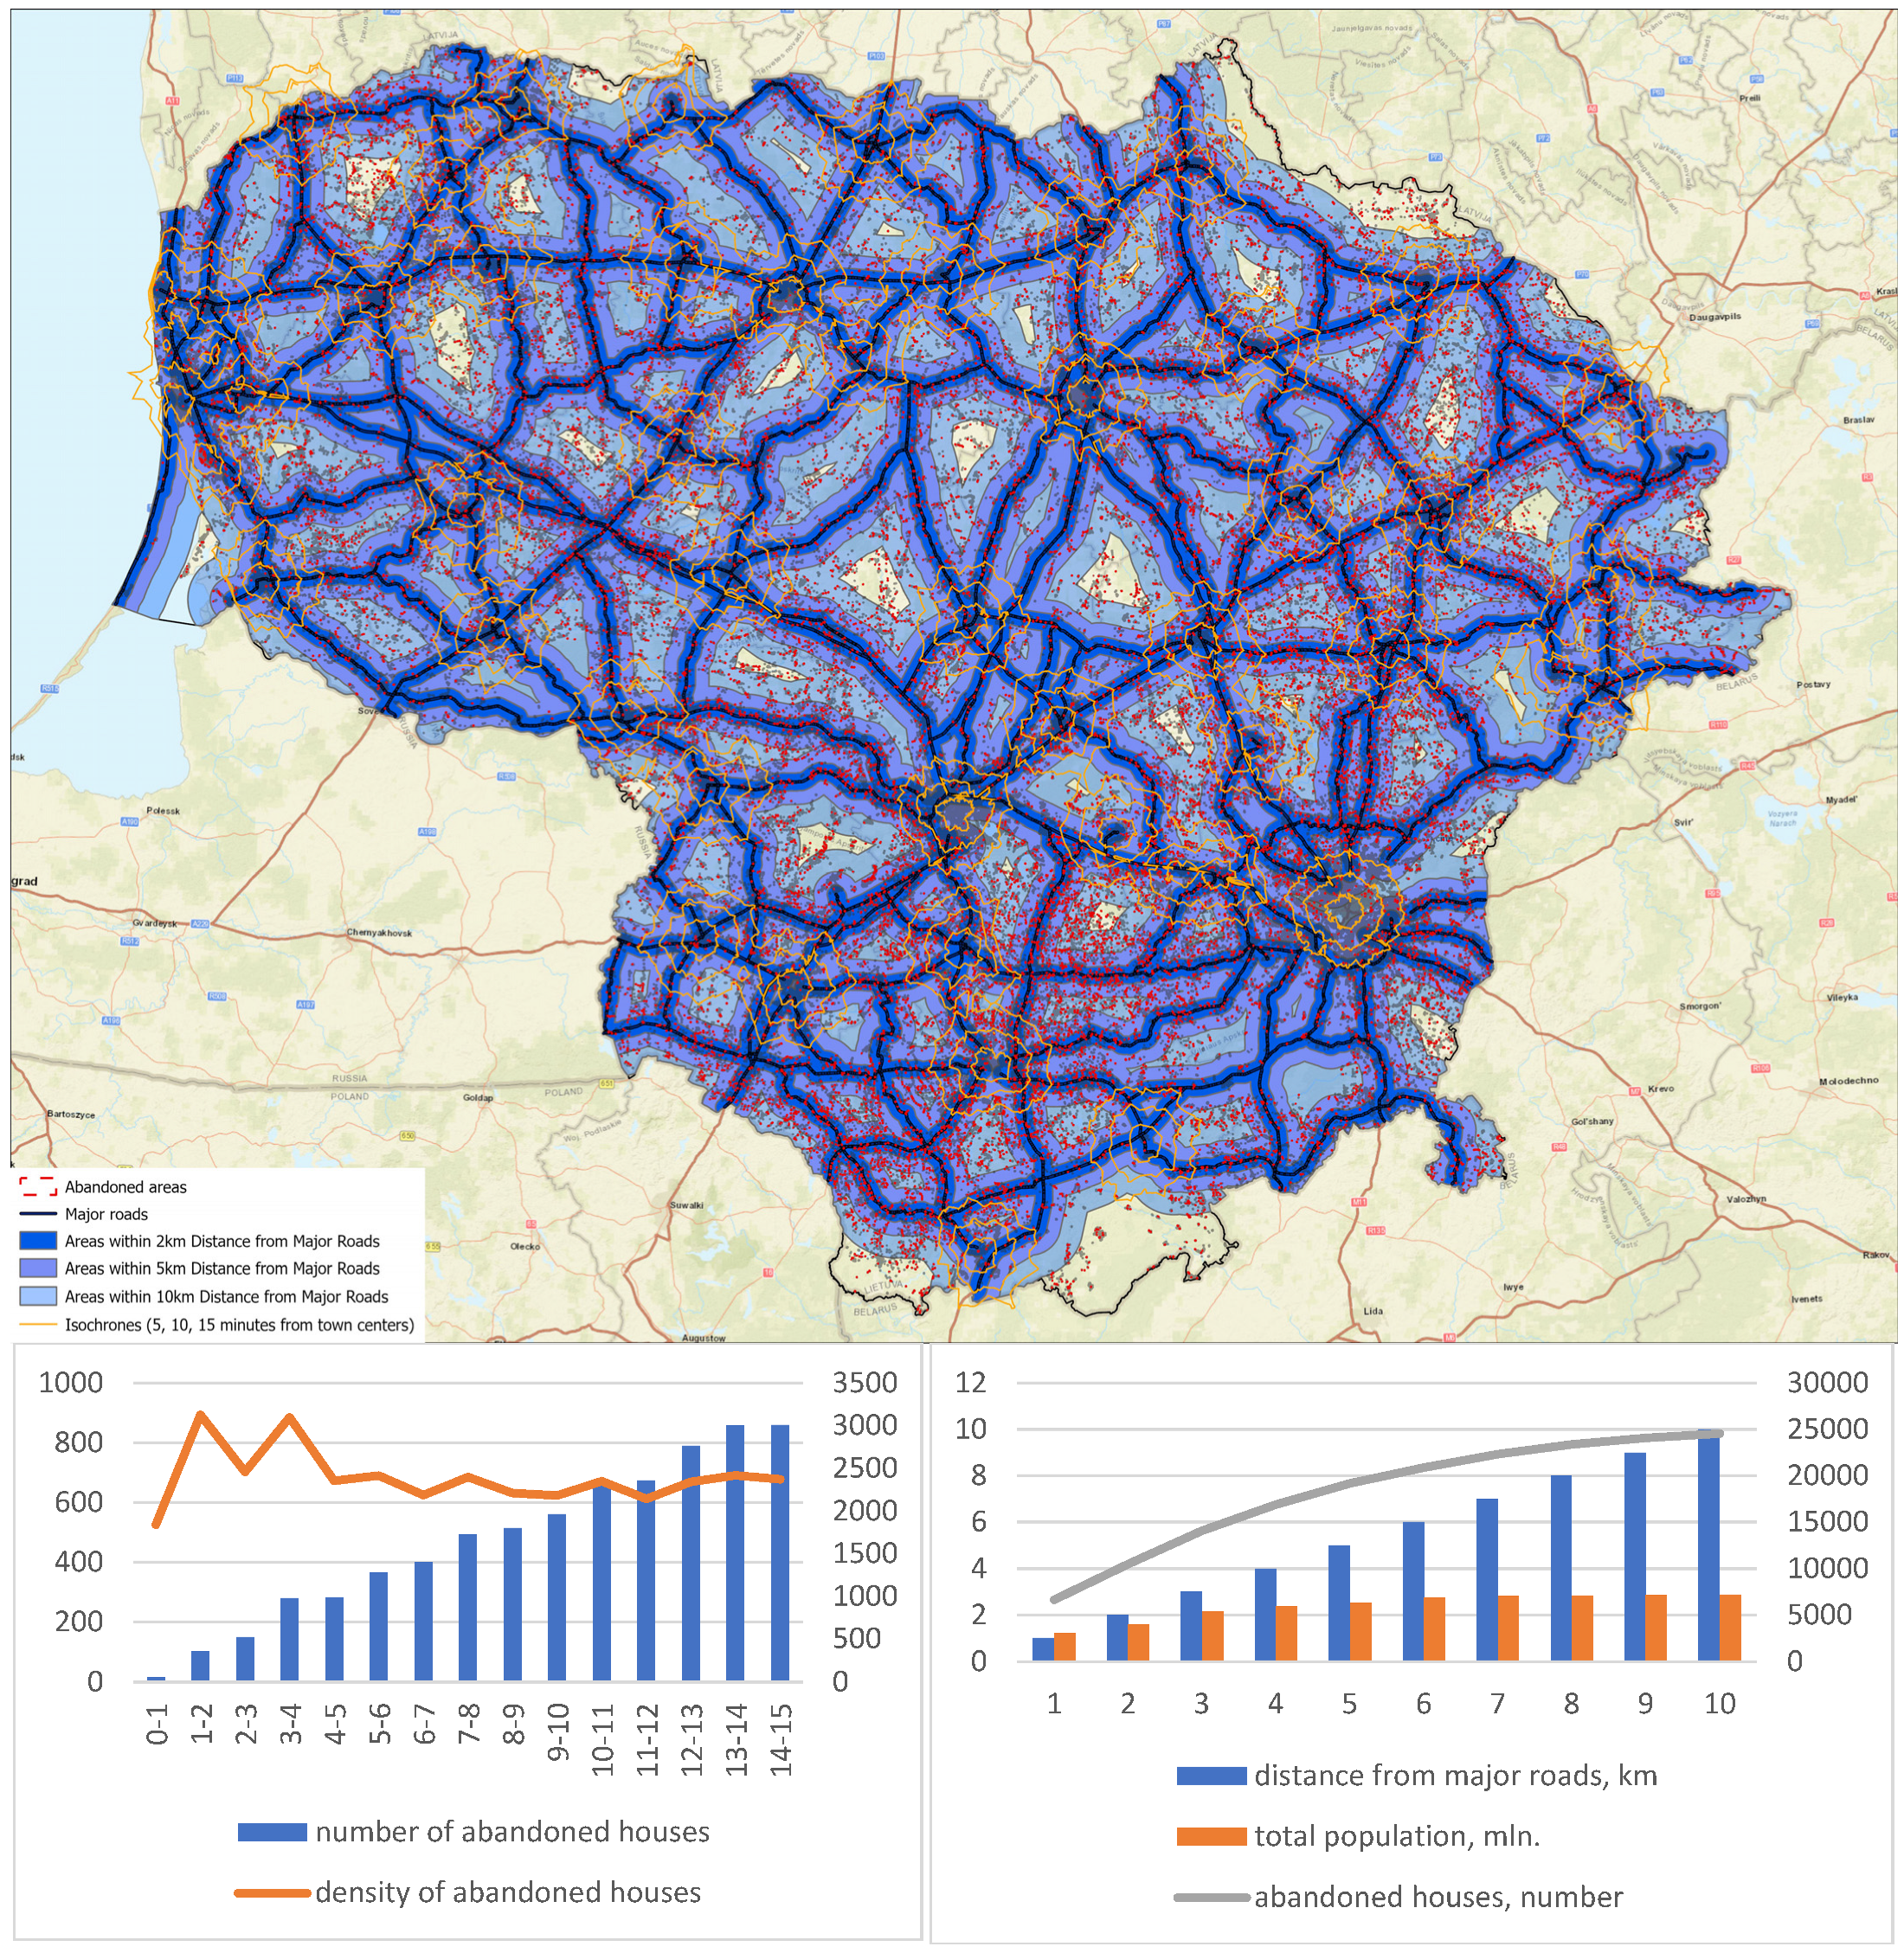
The performed analysis reveals a spatial relationship between abandoned houses, town centers, and transport accessibility. The number of abandoned houses generally increases with distance from town centers, reaching the highest values in the outer suburban and rural zones, while density values remain relatively stable, indicating that abandoned buildings are widely dispersed rather than concentrated in a single distance belt. This suggests that abandonment is not limited to remote peripheral areas but is present throughout the broader urban–rural transition zone.
Distance from major roads shows an even stronger pattern. Both population and the number of abandoned houses rise steadily within wider road-access buffers, confirming that most settlements remain closely linked to the national transport network. Areas located within 2 km of major roads already cover approximately 36% of Lithuania’s territory, while a 5 km buffer encompasses about 71%, representing the majority of the national land area. Extending the buffer to 10 km includes around 95% of the country, demonstrating that only a very small share of territory remains remote from major road infrastructure. Consequently, most abandoned houses are situated not in isolated locations but within relatively accessible areas connected to the road network (see Figure 3).
To complement the visual interpretation of spatial patterns, a point pattern analysis was performed using the Average Nearest Neighbor method. Abandoned houses were represented as point features derived from polygon centroids. The results indicate a statistically significant clustered spatial pattern, with an observed mean distance of 611.13 m compared to an expected mean distance of 982.85 m under a random distribution. The nearest neighbor ratio was 0.62, with a z-score of −115.43 and p < 0.001, confirming a highly significant deviation from spatial randomness.
These results demonstrate that abandoned houses are not randomly distributed across the territory but form strong spatial clusters, particularly in regions experiencing pronounced demographic decline. This quantitative evidence supports the patterns observed in the GIS-based visual analysis.
Global spatial autocorrelation (Moran’s I) was additionally tested but did not yield statistically significant results. This is primarily due to the binary and highly fragmented nature of the dataset, where abandoned houses are represented as small, irregular spatial units. In such cases, nearest neighbor analysis provides a more appropriate measure of spatial structure.
The GIS-based analysis of rural standalone houses in Lithuania reveals pronounced patterns of depopulation and demographic aging over the last decade. In 2011, Lithuania had 90,571 rural standalone houses accommodating 353,480 residents. By 2021, this population had declined to 206,848, representing a 41.5% reduction. Projections indicate that by 2026, the population will fall further to 148,198, a cumulative 58% decrease relative to 2011. Vacant houses, starting from 2011, totaled 28,848 by 2021 (31.8%) and reached 52,270 by 2026 (57.7%). Households inhabited solely by residents aged 65 or older totaled 31,530 in 2021. In total, 13,777 of them are expected to be vacant by 2026, reflecting the effect of rural aging. These trends highlight the accelerating disappearance of traditional dispersed settlements and the increasing prevalence of abandoned dwellings, particularly in farmsteads that historically defined the Lithuanian countryside.
To further support the interpretation of demographic drivers, a comparative analysis of population structure and labor characteristics was conducted across spatial units exhibiting growth and decline between 2011 and 2021. The results show that areas experiencing population decline have a substantially higher share of elderly population (65+), averaging 22.68%, compared to 15.32% in growing areas (a difference of 7.36 percentage points). At the same time, the share of the working-age population (15–64) is lower in declining areas (64.72%) than in growing areas (66.88%), indicating a reduced demographic base for economic activity.
Employment indicators further reinforce this structural contrast. The share of the employed population is slightly lower in declining areas (45.53%) compared to growing areas (46.50%). In contrast, unemployment rates are somewhat higher in growing areas (9.05%) than in declining areas (8.45%). This pattern reflects differences in population composition: growing areas tend to attract younger and more mobile populations, including job seekers and recent migrants, who are more likely to be temporarily unemployed, while declining areas are characterized by older populations with a higher proportion of economically inactive residents.
Population decline in rural areas is driven not only by migration to urban centers but also by socioeconomic factors, including high unemployment, reluctance of younger generations to engage in agriculture, reliance on social subsidies, and broader lifestyle changes. These dynamics accelerate the depopulation of smaller villages and contribute to the loss of social infrastructure and public services. Traditional dispersed settlements are disappearing, while areas with recreational or natural value, such as lakes, forests, or nature reserves, maintain seasonal activity through private villas or tourism enterprises.
Agricultural restructuring further reinforces rural decline. Small-scale farms are disappearing, while large farms exceeding 200 ha, often supported by EU subsidies, dominate the landscape. Limited access to credit for smaller farmers accelerates land consolidation, contributing to depopulation and rural abandonment.
High-resolution GIS analysis highlights the complex interplay of demographic, spatial, and socioeconomic processes shaping Lithuania’s human geography. Population decline, urban exodus, suburban expansion, and rural abandonment are deeply interconnected, with significant implications for regional planning, rural sustainability, and demographic policy in the Baltic context.
Figure 1 illustrates the distribution of abandoned settlements and rural detached houses, highlighting areas of population increase and decrease between 2011 and 2026. The inset provides a closer view of a representative rural area, demonstrating how high-resolution GIS analysis can reveal localized patterns of depopulation, housing vacancy, and aging, which are otherwise masked in aggregated national-level maps.
Rural life in Lithuania is rapidly disappearing in villages located more than 20–25 km from major urban centers. Small towns (fewer than 5000 residents) and villages (fewer than 1000) are particularly vulnerable, with school closures and deteriorating services accelerating depopulation. The majority of Lithuania’s population is concentrated in the area around the corridor connecting Vilnius and Kaunas (see Figure 2), where 1,128,761 people, or 39% of Lithuanian people, reside (taken from 2021 year census data for the Kaunas, Kaišiadorys district, Elektrėnai, Trakai, and Vilnius municipalities). This study focuses on this densely populated corridor while noting that rural depopulation is often more severe in peripheral regions across the Baltic States.
Recent land use changes include the establishment of solar farms on abandoned lands, expansion of large-scale agricultural operations, and natural afforestation of derelict fields, sometimes reclassified from agriculture to forestry. Land dedicated to defense purposes continues to grow, representing the highest proportion in Europe.
Urban population shifts exhibit distinct patterns. In larger towns, declines are concentrated in post-war and Soviet-era multifamily housing blocks, driven by aging populations, outdated infrastructure, and limited amenities. Conversely, suburban and peri-urban areas experience growth, driven by post-2005 housing development, rising living space per capita, and new private housing in the central districts of Vilnius and Kaunas. These trends reflect redistribution of populations within urban and peri-urban zones, with older, multi-family districts depopulating while newer housing areas attract residents seeking improved living standards.
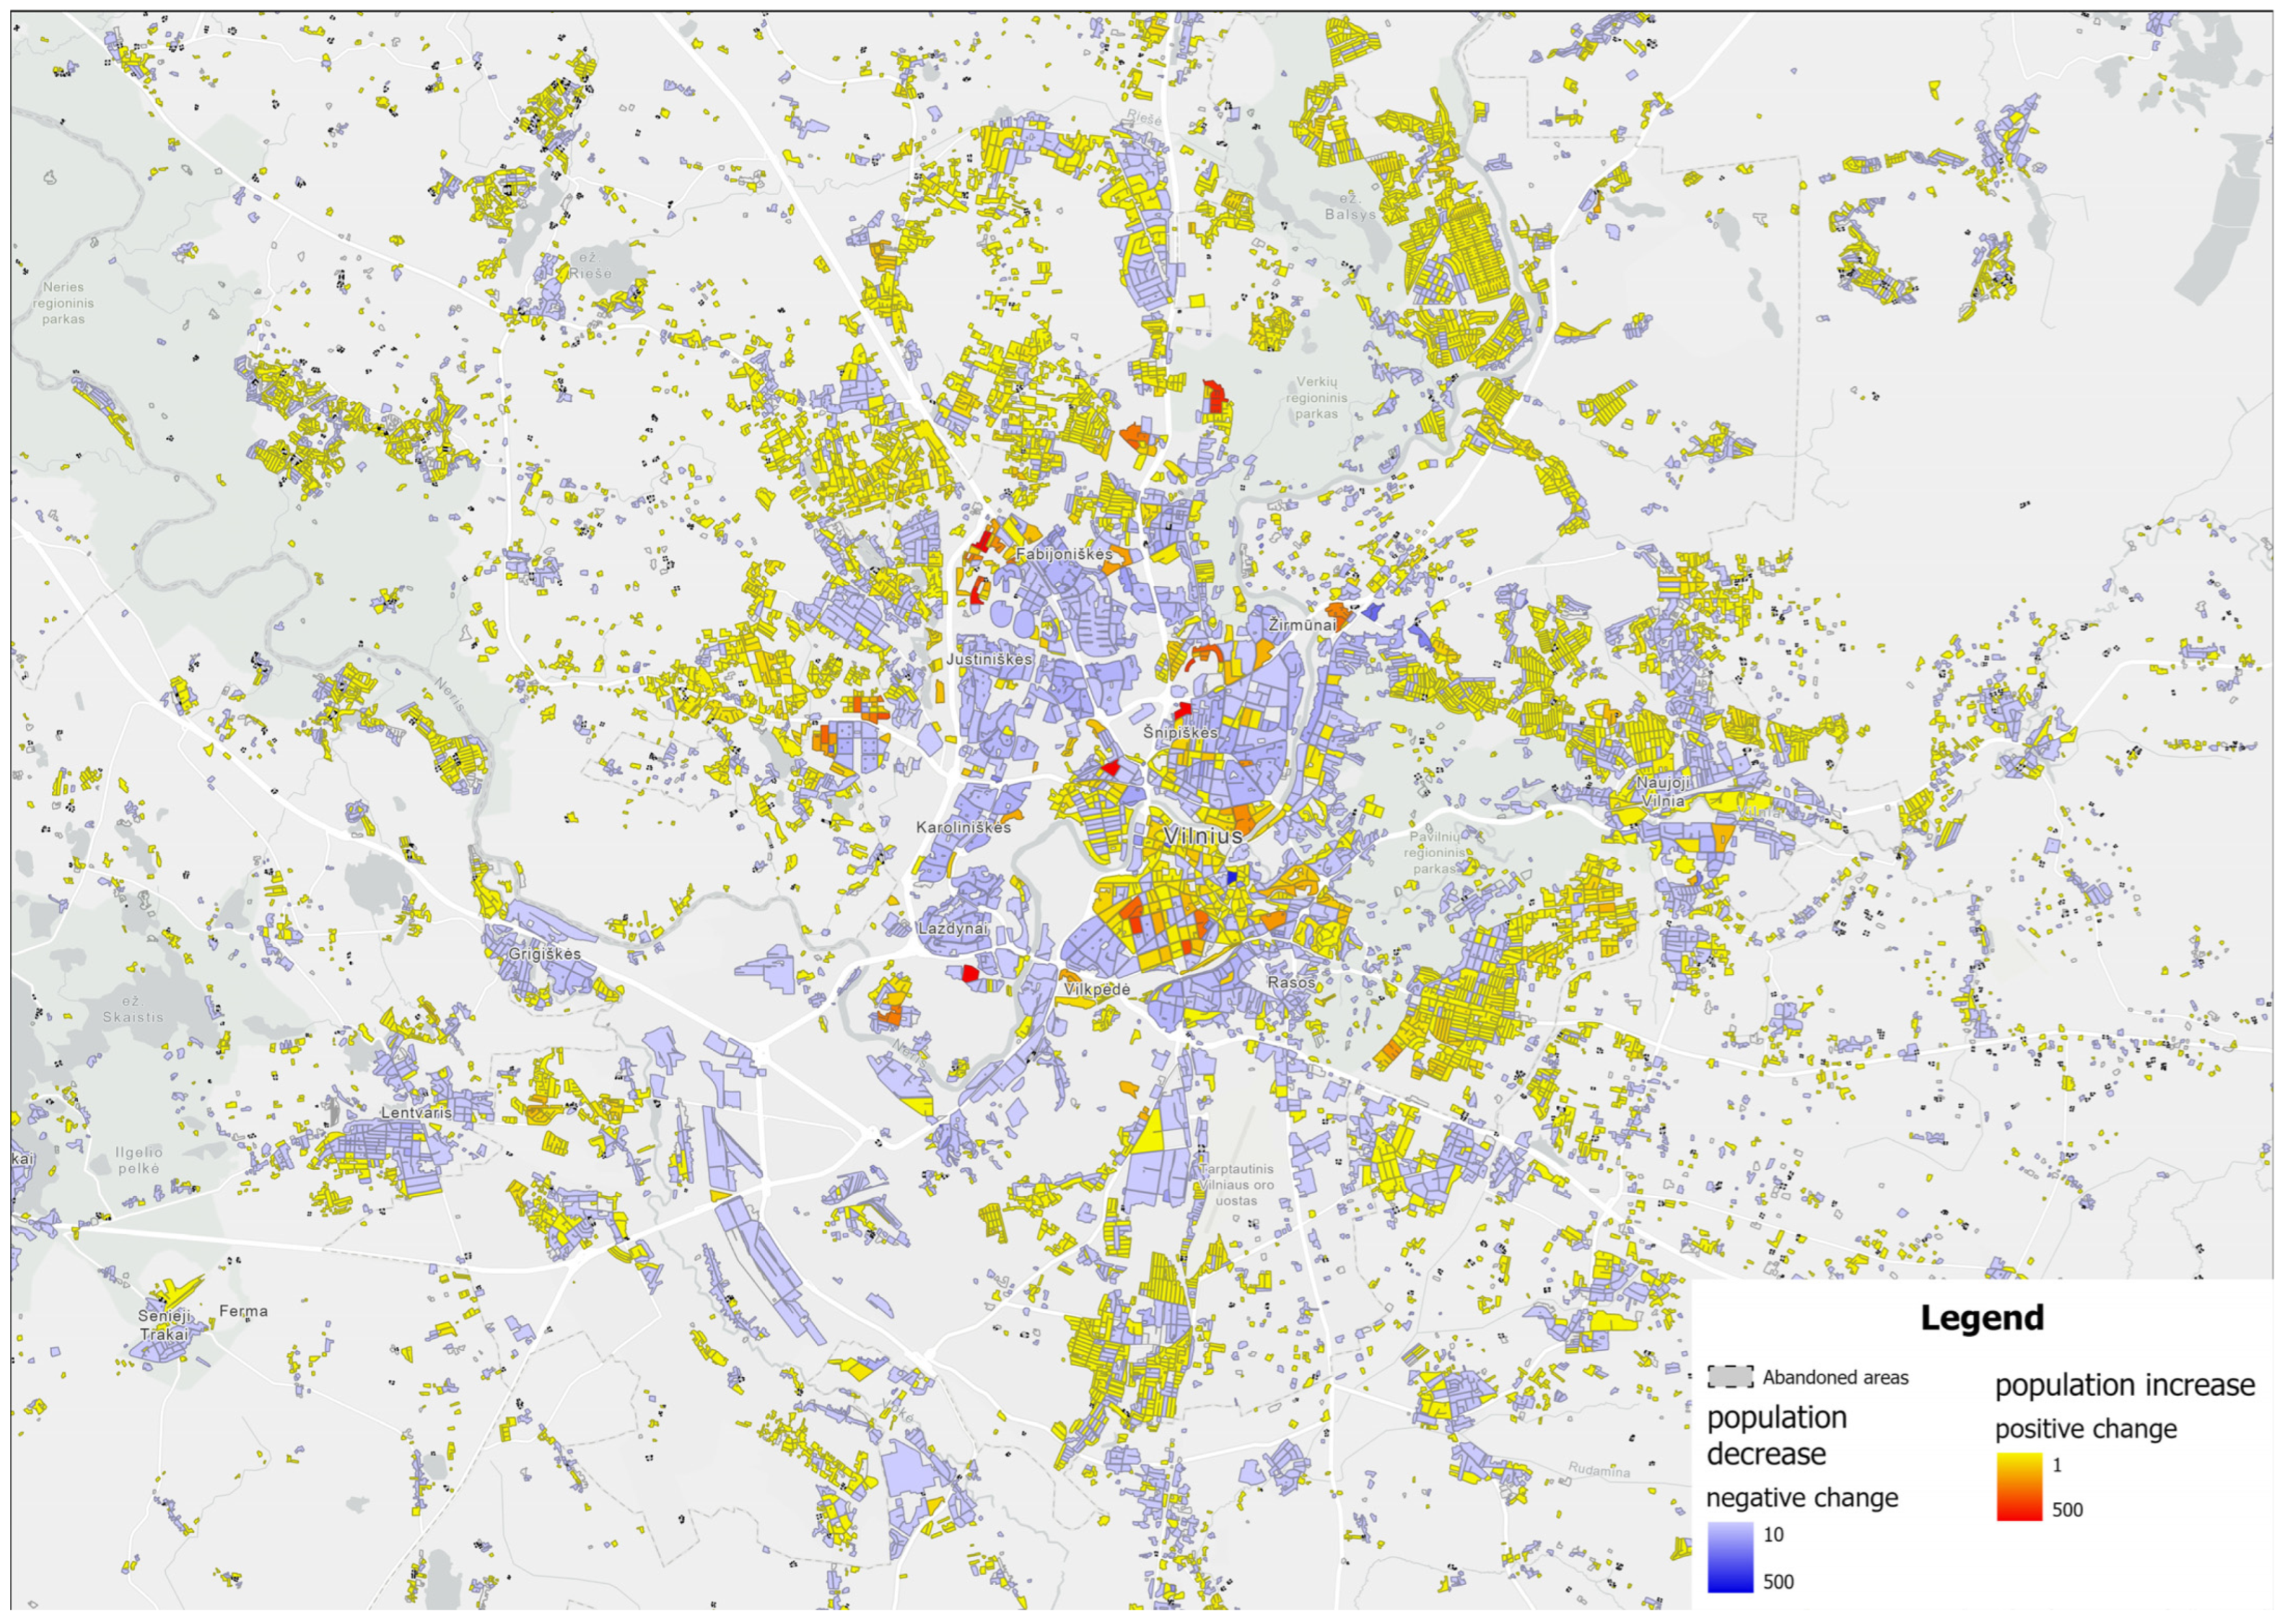
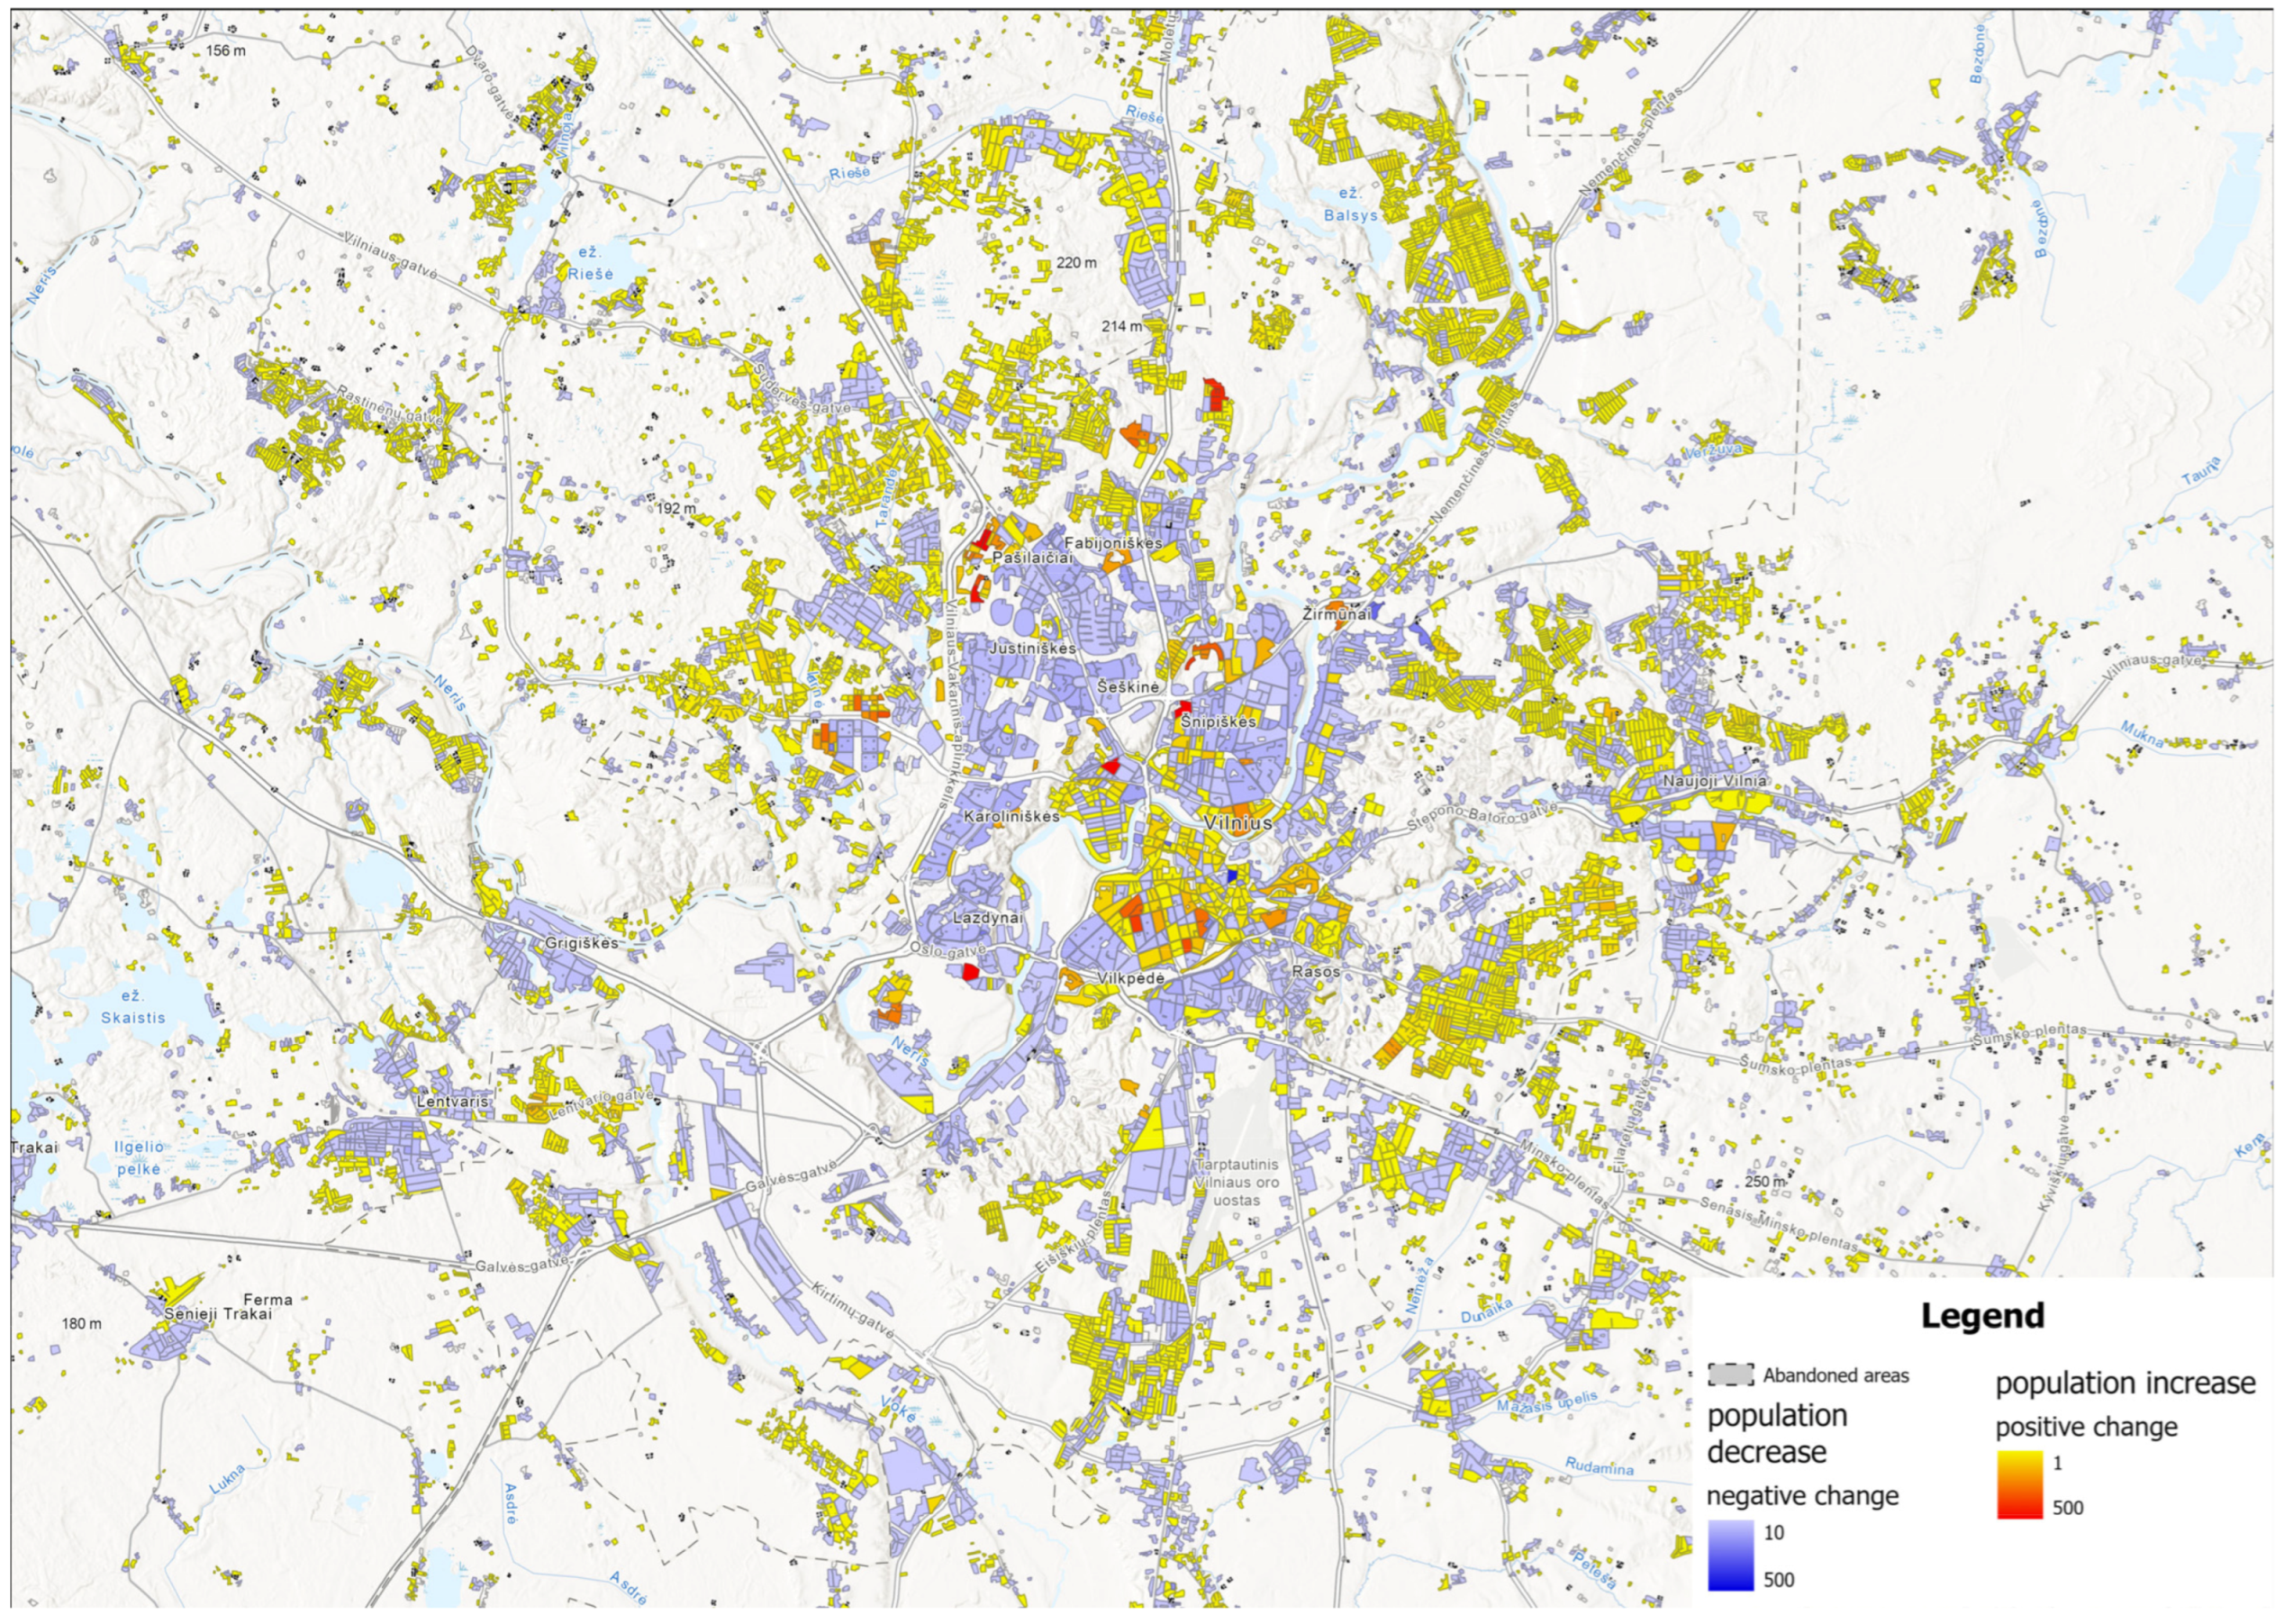
The greater Vilnius area exhibits a clear pattern of population movement from the central urban core toward the periphery, often beyond the administrative boundaries of the city. Areas in close proximity to the city remain relatively vibrant, whereas more distant and isolated zones show signs of depopulation (see the blue-violet areas in Figure 4).
Vilnius stands out compared to other Lithuanian cities due to continued growth in its historic central districts, including the Old Town, New Town, Užupis, and Pavilnys. Additionally, the city has experienced substantial development of modern, European-standard multi-family housing in districts such as Pašilaičiai, Fabijoniškės, and Šnipiškės, as well as within the central urban area. These trends suggest potential for the revitalization of the city center.
Surrounding suburban areas are increasingly occupied by newly constructed private houses, contributing to congestion on major access routes. This is exacerbated by a high automobile dependency in Lithuania, with a 65% car ownership rate—the highest in Europe—and limited availability of social infrastructure and public transport. These newly developed zones, highlighted in yellow on Figure 4, present concentrated challenges for urban planners, as their spatial footprint approaches the size of Vilnius prior to 2000.
Notably, there are very few abandoned areas in the immediate vicinity of Vilnius, indicating that urban vitality remains concentrated near the city and its expanding suburban zones.
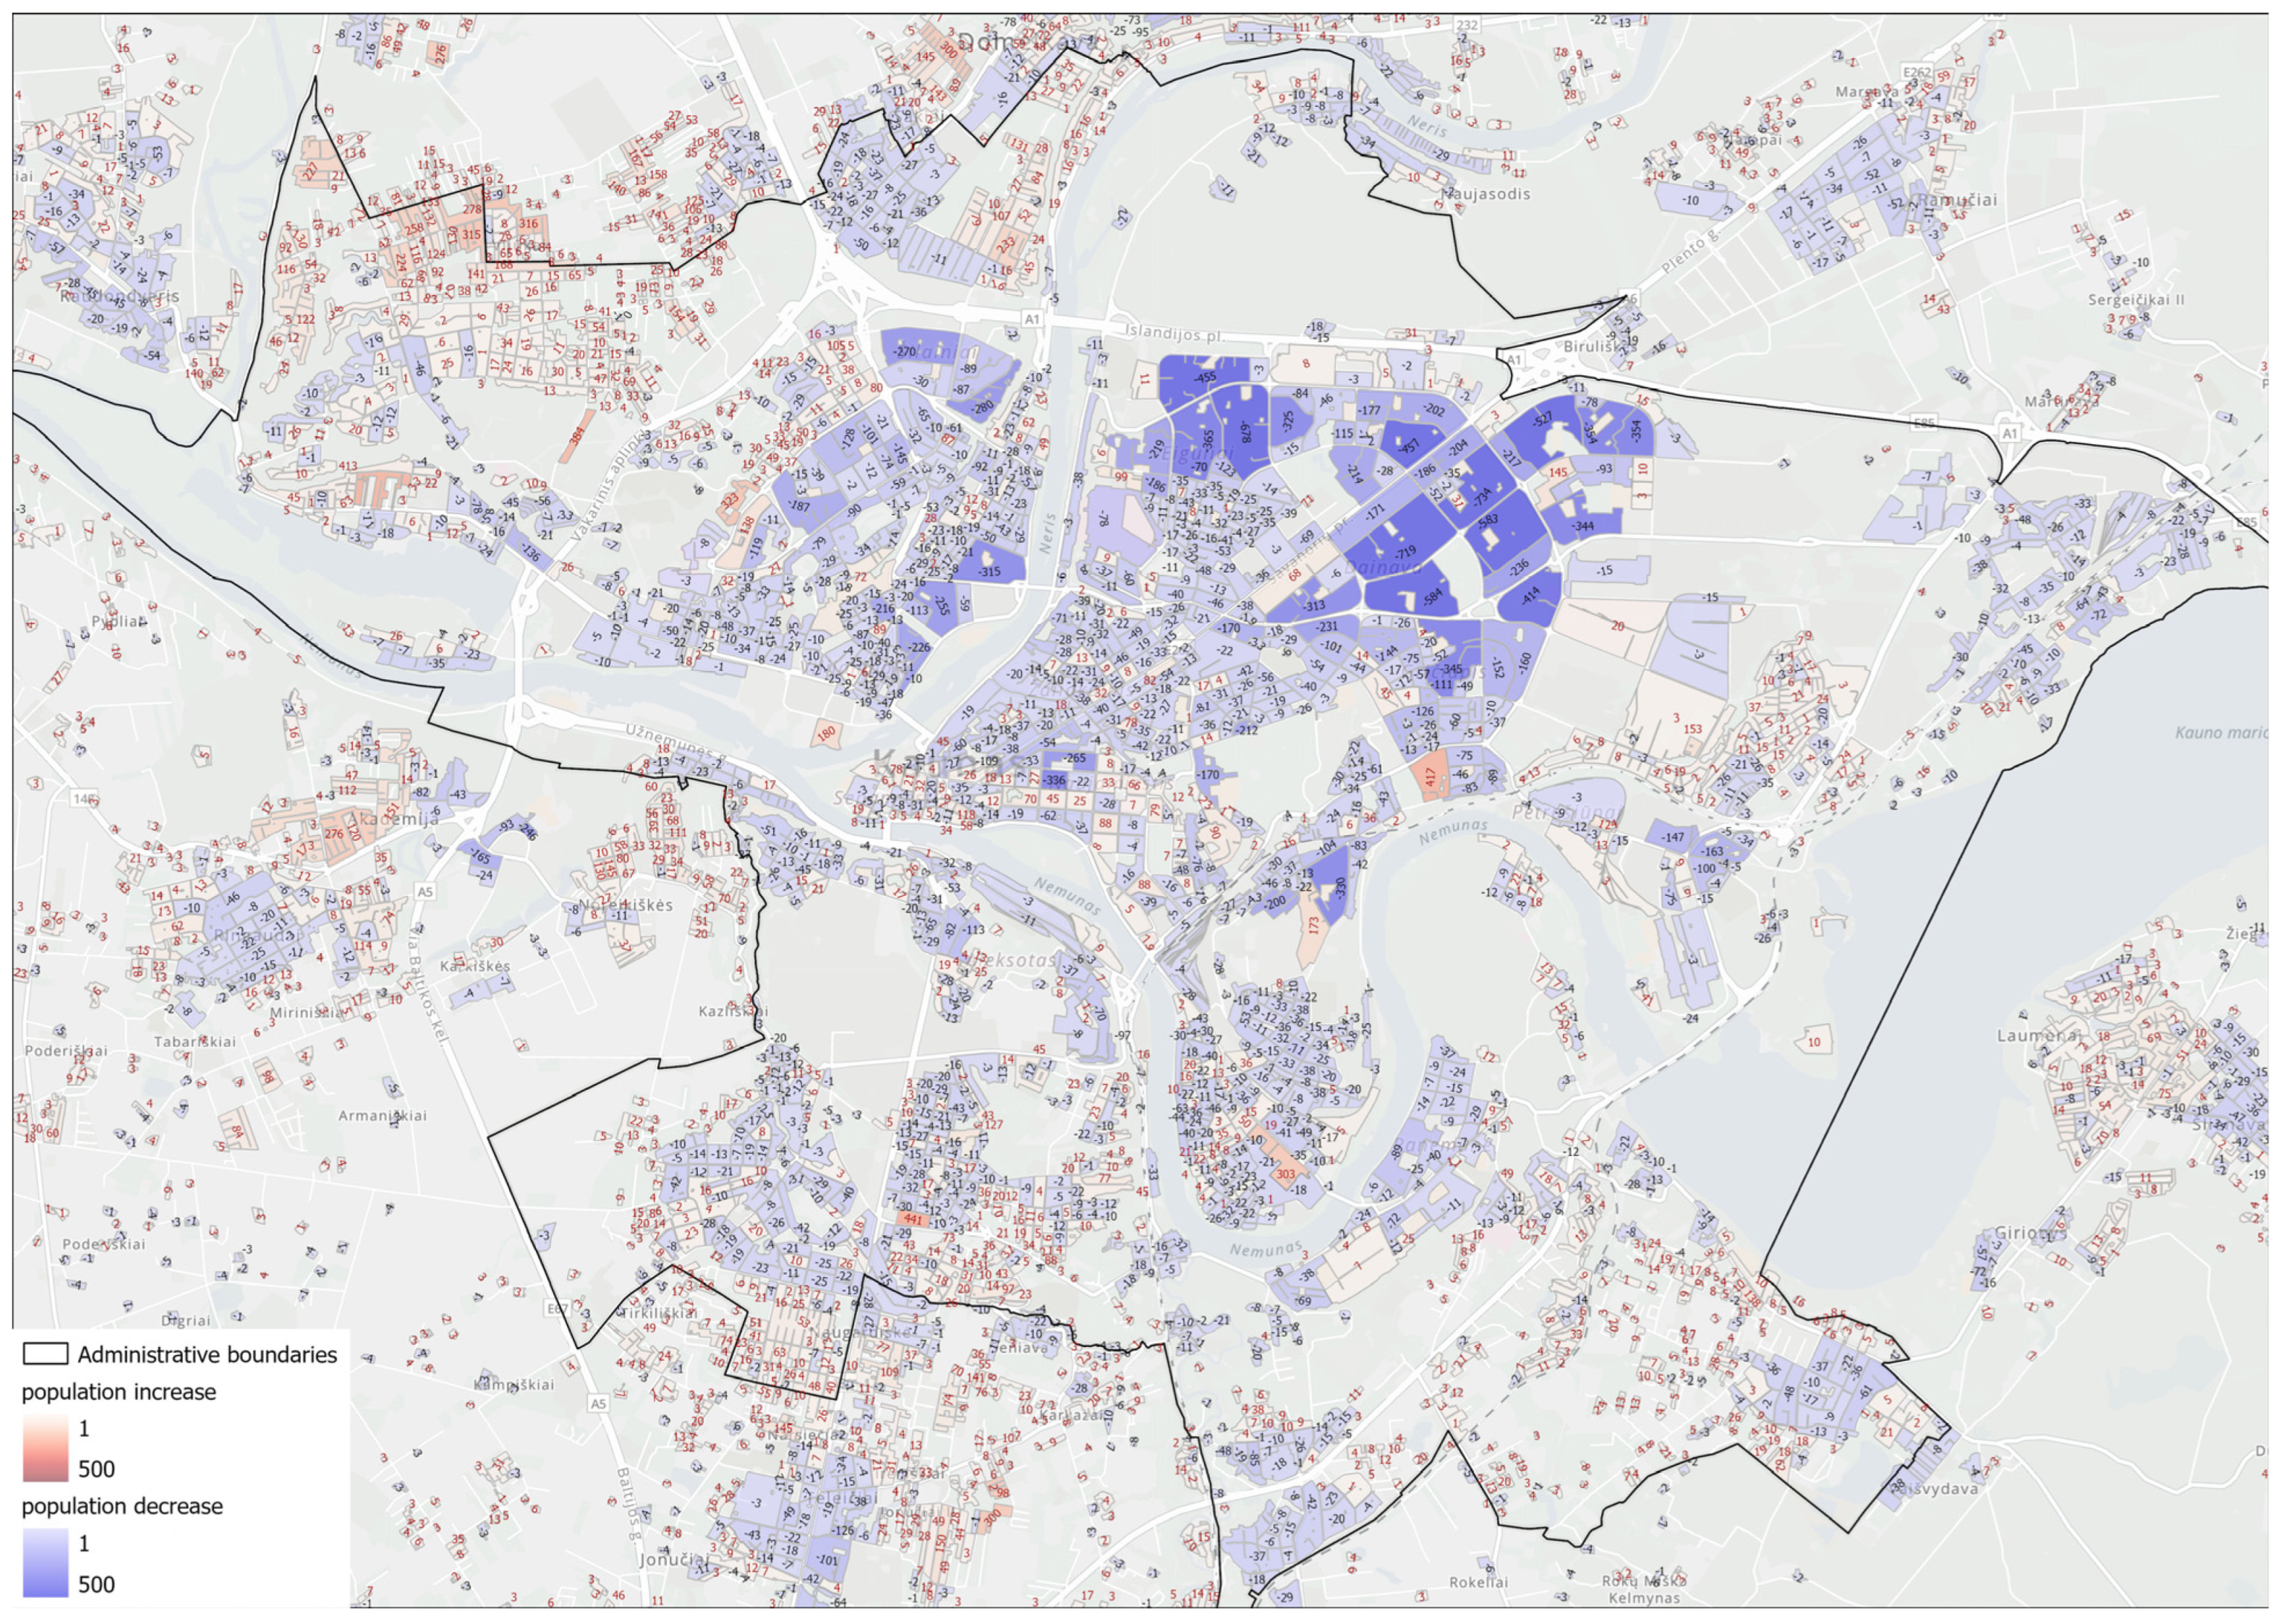
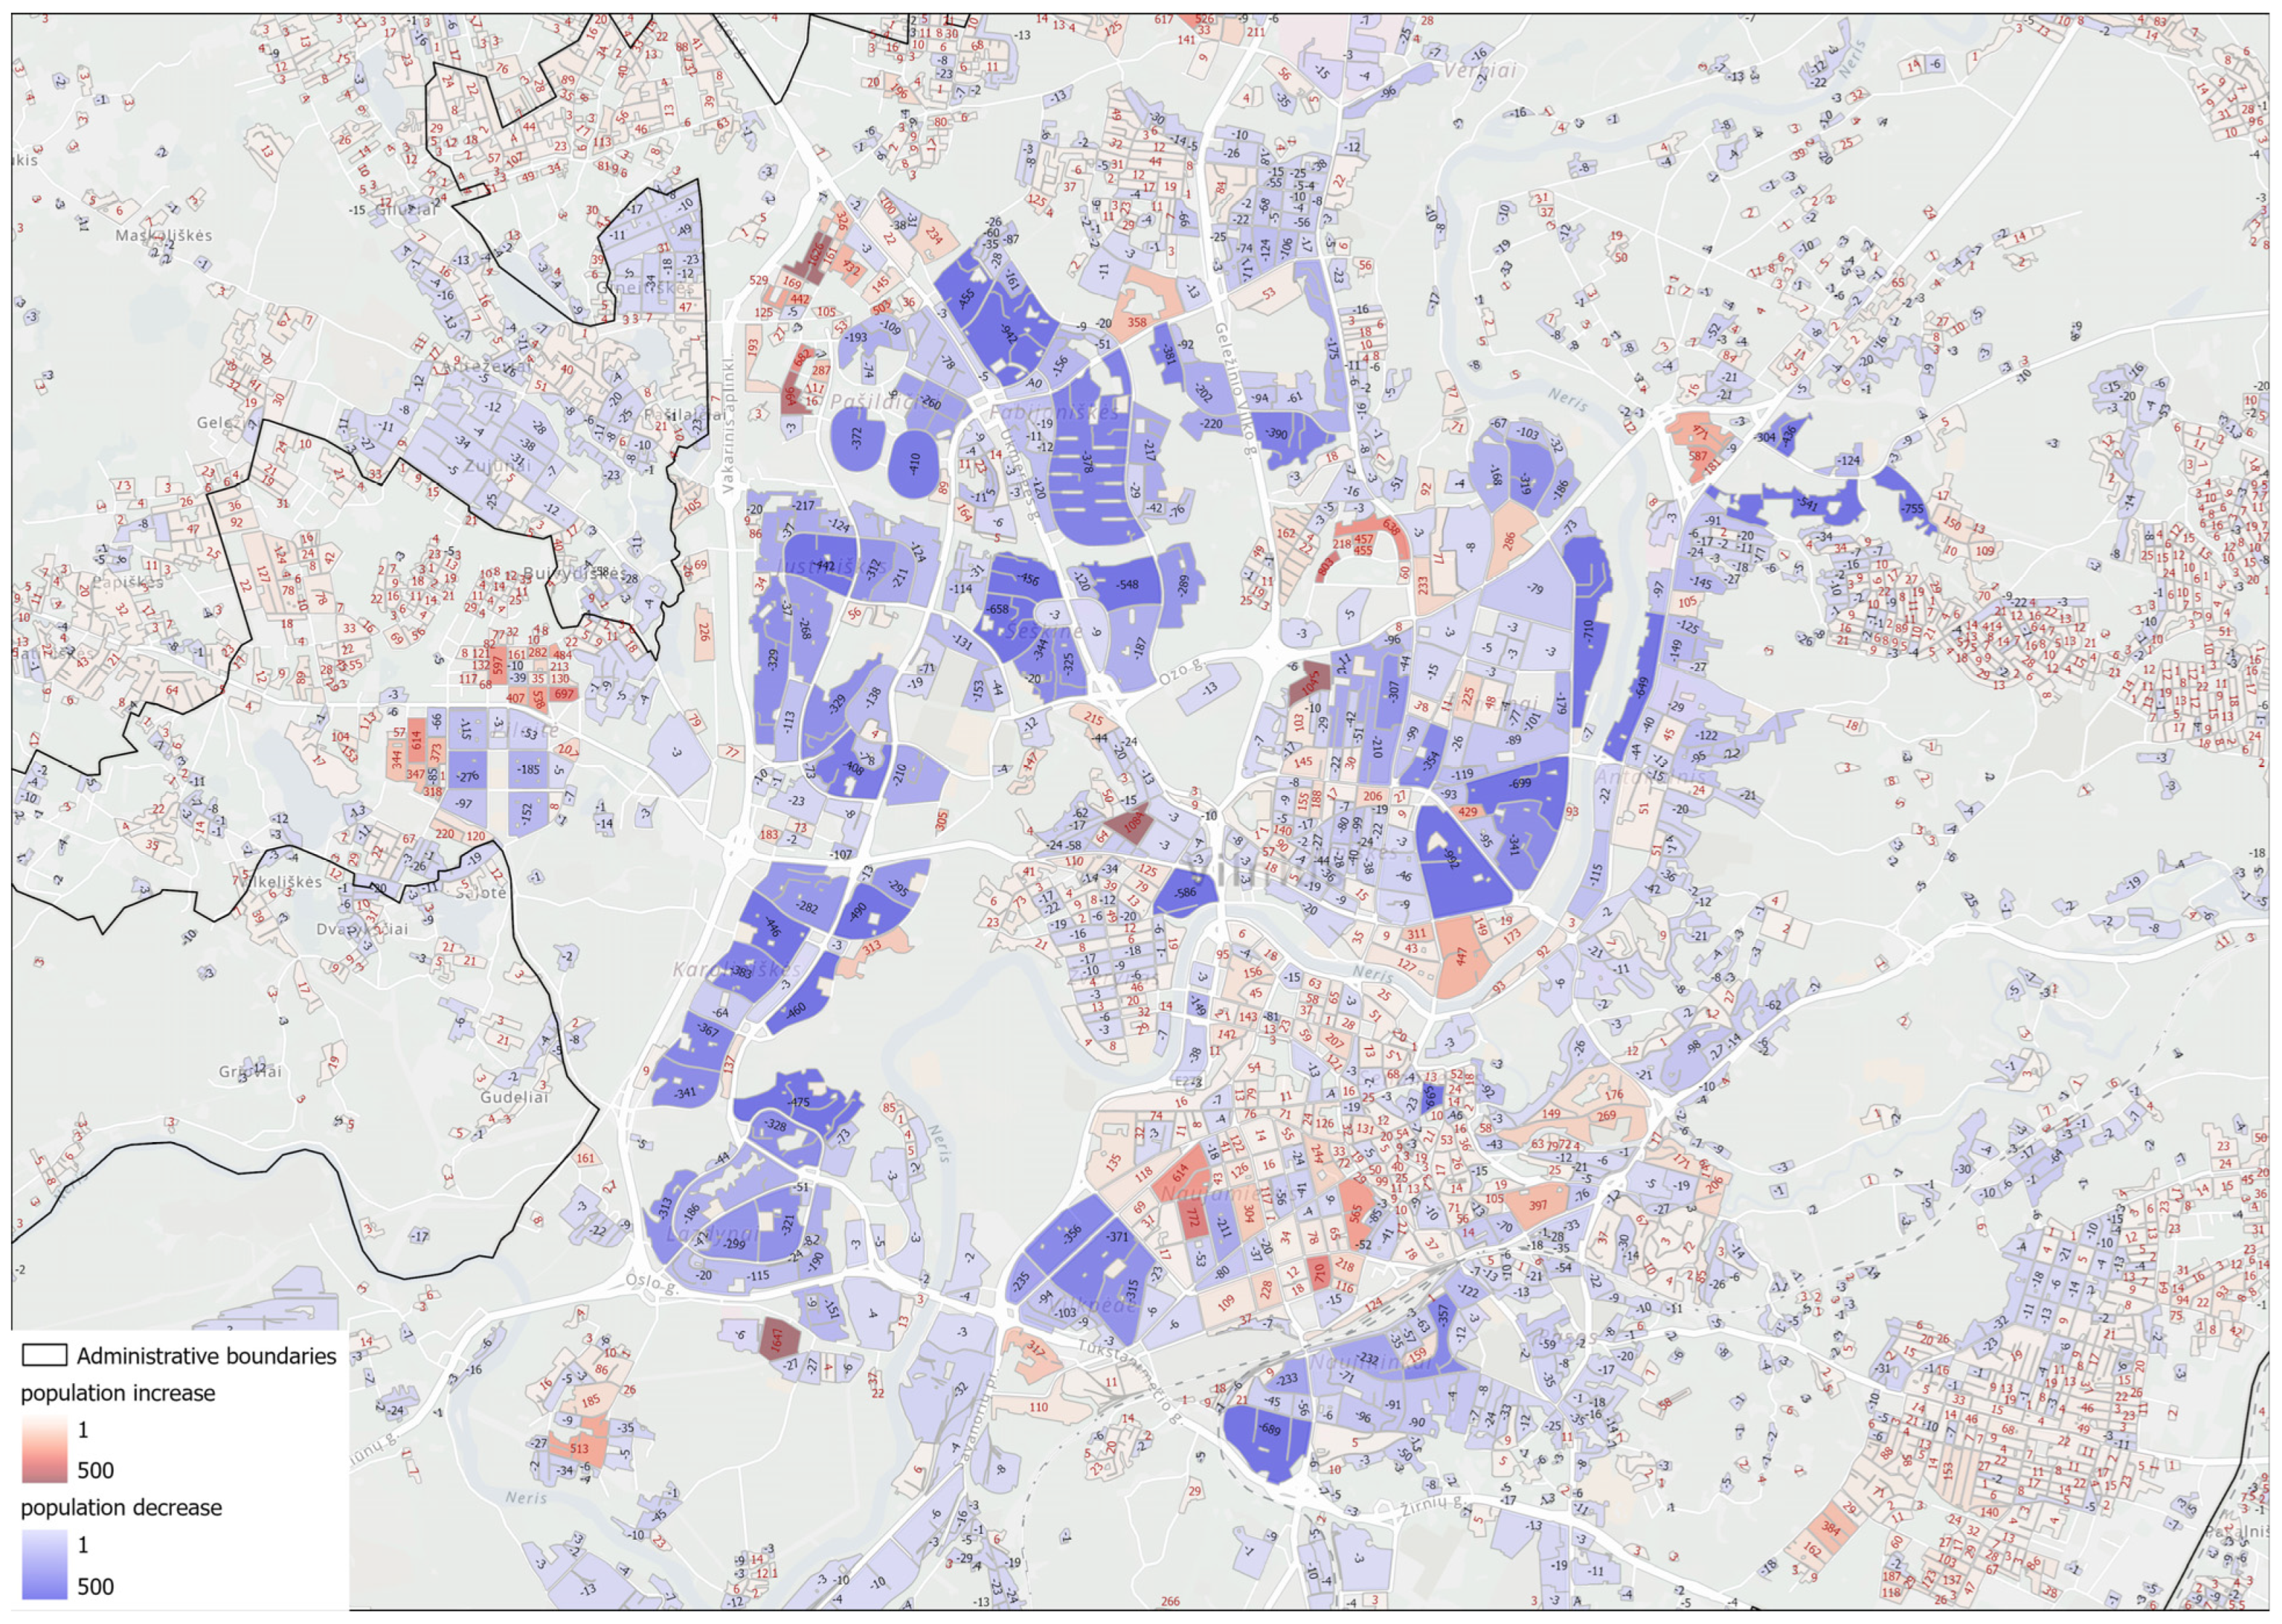
Within Vilnius (see Figure 5), the most pronounced population declines occur in multi-family residential districts constructed during the Soviet (or modernist town planning) periods, including Šeškinė, Fabijoniškės, Pašilaičiai, Karoliniškės, Lazdynai, Žirmūnai, and Naujininkai. Significant negative population change is also observed in other districts such as Antakalnis, the historic part of Šnipiškės, Paneriai, Vilkpėdė, and the Soviet-era section of Pilaitė.
Declines are also evident in older sections (pre 1990) of single-family housing areas, including Rasos, Zujūnai, Gineitiškės, and Buivydiškės. These patterns indicate a general trend of residents moving away from Soviet-era housing toward newly constructed housing developments on the town’s periphery, reflecting both changing housing preferences and suburban expansion.
The Greater Kaunas area exhibits a distinct pattern of population change (see Figure 6). Declines are concentrated in post-war and Soviet-era multi-family housing districts, as well as older, lower-quality residential areas closer to the city center, including Šančiai, Vilijampolė, Aleksotas, Panemunė, and Palemonas.
Adjacent satellite towns—such as Raudondvaris, Kačerginė, Užliedžiai, Garliava, Neveronys, Karmėlava, and Sargėnai—as well as suburban districts including Rokai, Vaišvydava, Žiegždriai, and Ramučiai, exhibit population losses in their central zones. Simultaneously, these areas show population growth on the outskirts, corresponding to the development of new private villas and single-family housing, highlighting ongoing suburban expansion and urban decentralization.
In Kaunas (see Figure 7), population declines are most pronounced in post-Soviet, modernist, multi-family districts, including Dainava, Eiguliai, Kalniečiai, Šilainiai, Vilijampolė, and Aukštieji Šančiai. Similar trends are observed in older, single-family housing areas within the city and its surroundings, such as Žaliakalnis, Žemieji Šančiai, Petrašiūnai, Vaišvydava, Rokai, Garliava, Aleksotas, Birutė, and Freda, as well as the historic parts of Ringaudai and Romainiai. Population loss is also evident in central areas, including the Old Town and Naujamiestis.
Migratory flows indicate that residents are relocating to suburban zones within the Kaunas district administration area, filling gaps between previously separate satellite towns. The largest expansions of new, single-family housing over the past two decades have occurred in Romainiai (new sections), Giraitė, Kazliškiai, Narsiečiai, Jonučiai, and the newly developed areas of Ringaudai. These shifts illustrate a broader pattern of suburbanization and urban decentralization in Kaunas, mirroring trends observed in other post-socialist cities in Lithuania.
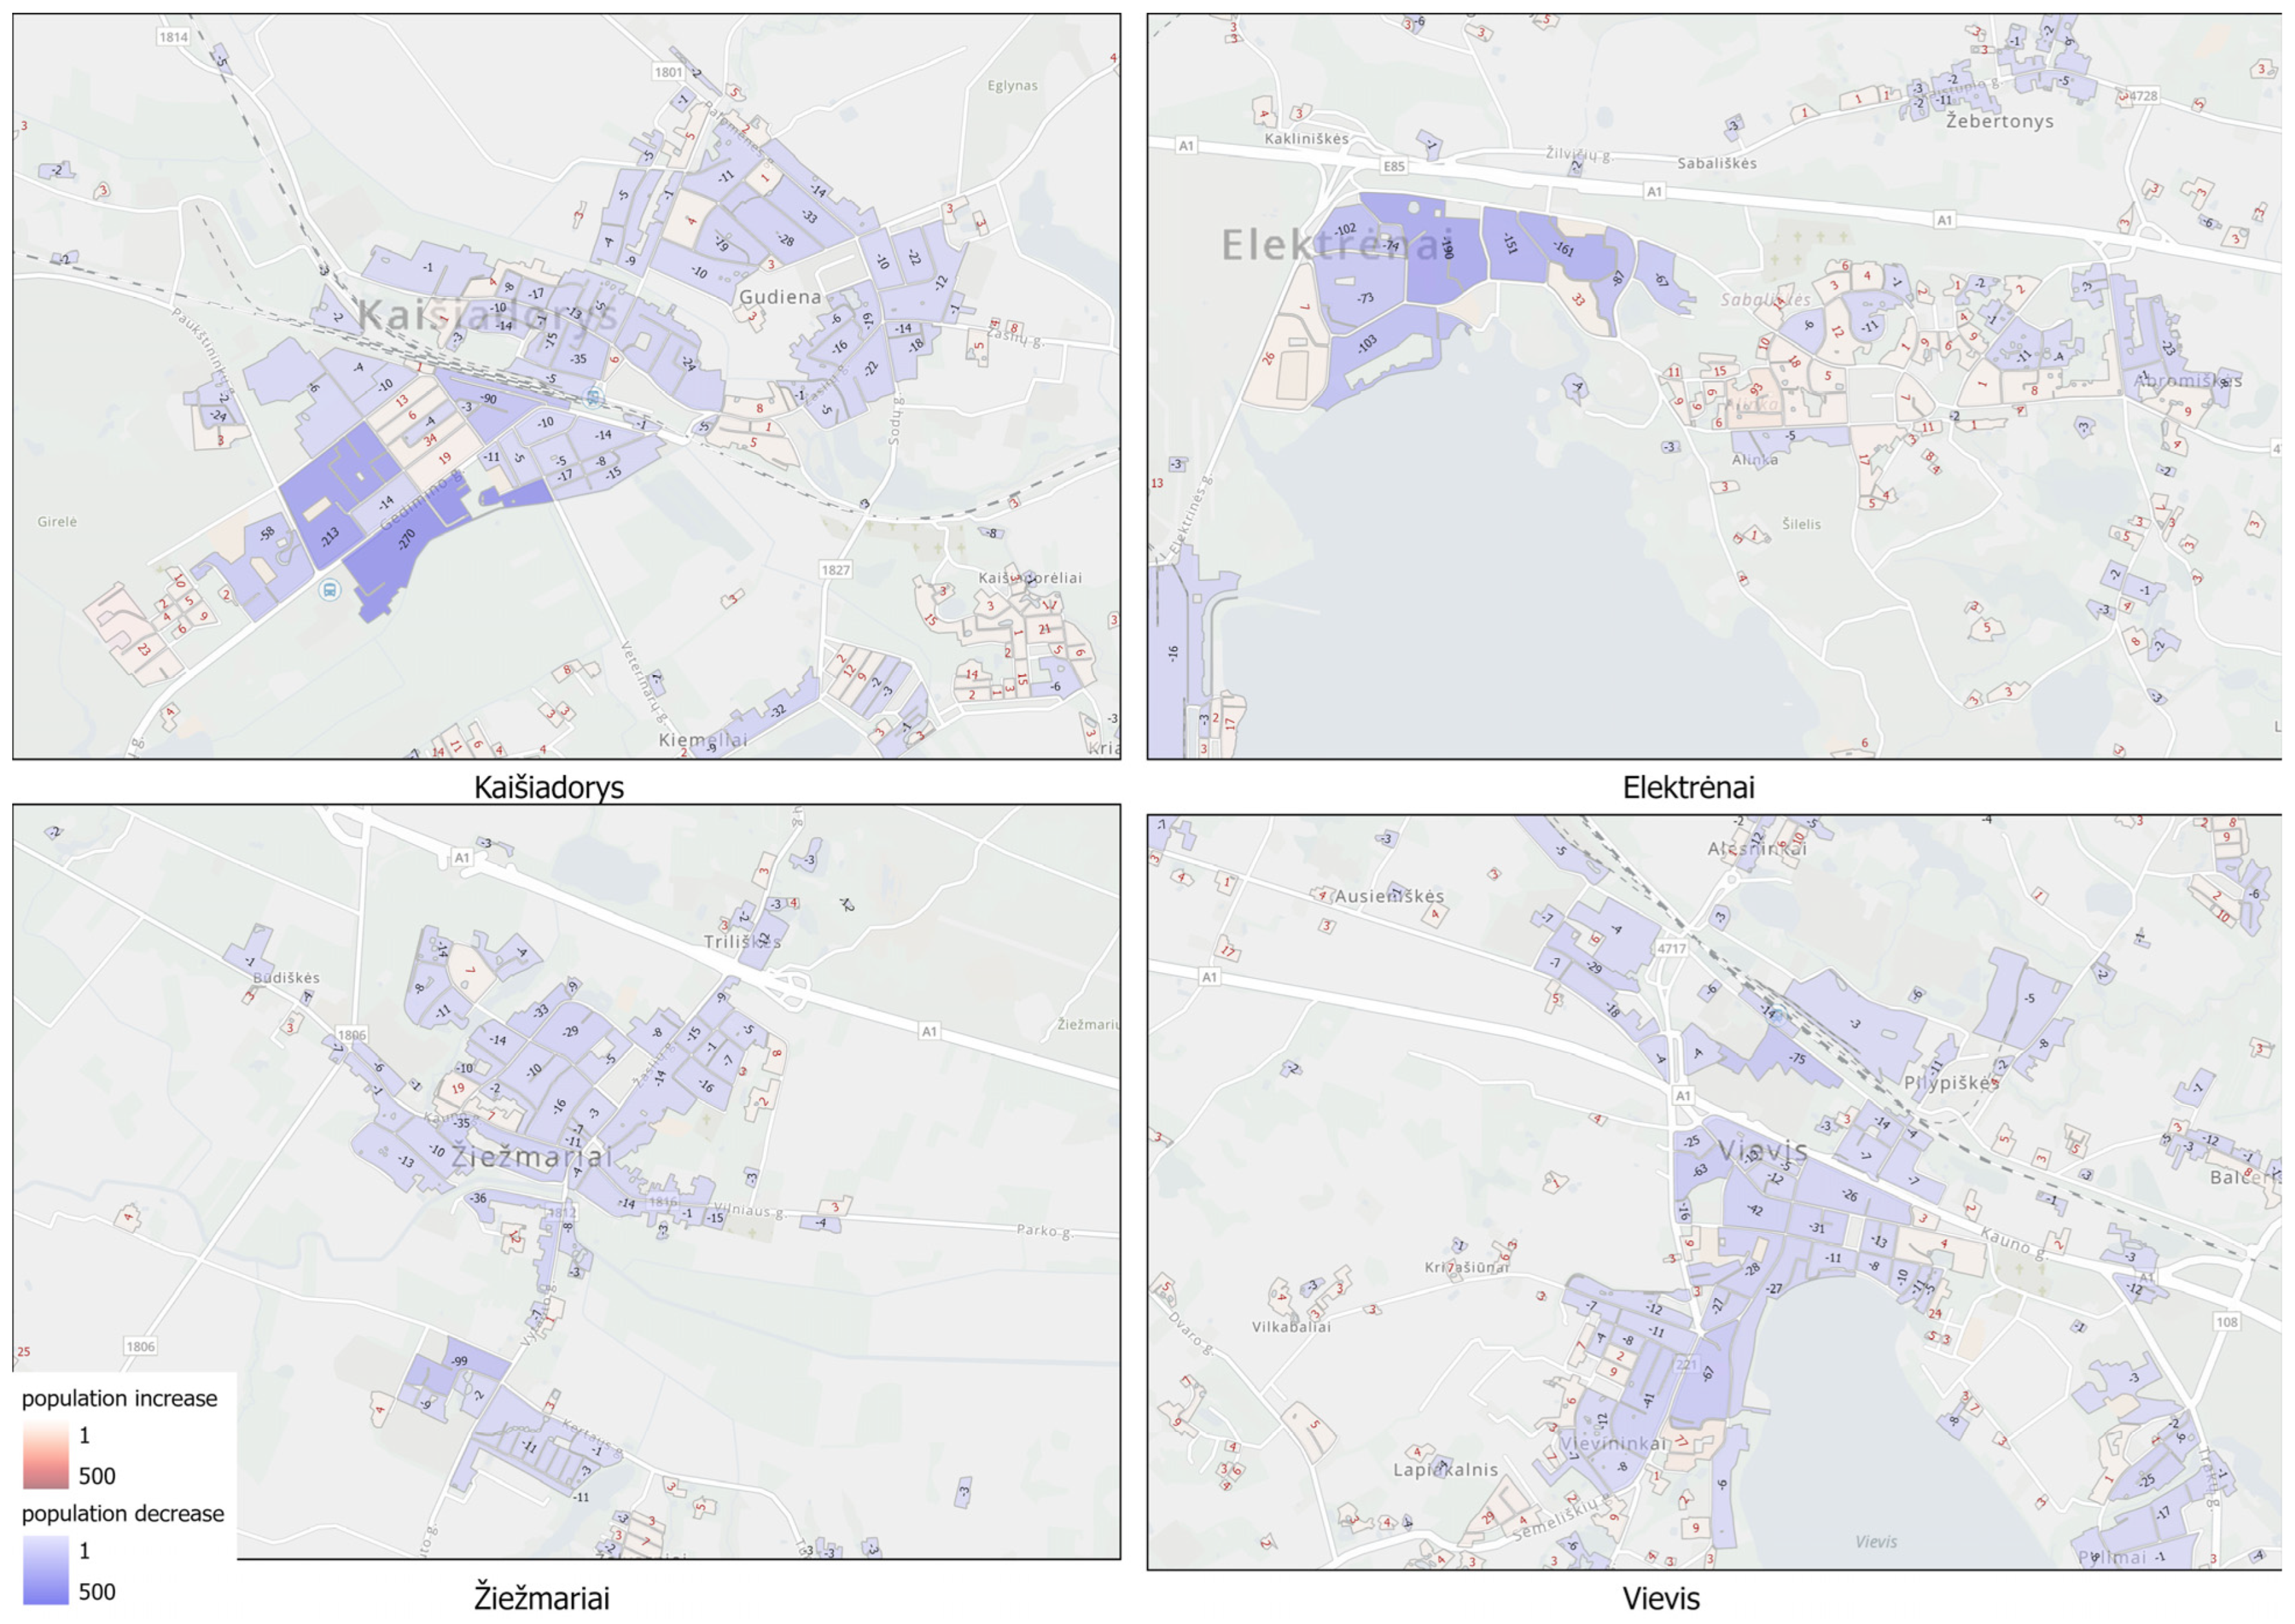
The four smaller towns situated between Vilnius and Kaunas—Kaišiadorys, Žiežmariai, Elektrėnai, and Vievis—illustrate the ongoing concentration of population in larger urban centers and the corresponding decline in intermediate settlements (see Figure 8). Population change between 2011 and 2026 was as follows:
  • Kaišiadorys: 8664 → 8380
  • Žiežmariai: 3607 → 3158
  • Elektrėnai: 12,012 → 11,255
  • Vievis: 4915 → 4311
In absolute terms, the largest population losses occurred in the larger towns of Kaišiadorys and Elektrėnai, while the smaller settlements of Vievis and Žiežmariai experienced the greatest relative declines. This pattern highlights the disproportionate demographic impact on smaller towns, which face accelerated depopulation due to limited economic opportunities, aging populations, and the out-migration of younger residents.
New residential development in these towns is confined to a few housing blocks, accommodating a relatively small number of newcomers and failing to compensate for losses in historically established areas. Among the four towns, Elektrėnai presents the most balanced situation: although multi-family buildings have seen a substantial decline, newly constructed private housing partially offsets outmigration. In contrast, Kaišiadorys and Žiežmariai exhibit the most pronounced declines. Connectivity plays a significant role: Kaišiadorys, located on a railway line, is accessible from Vilnius and Kaunas within 30 min by train, whereas Žiežmariai is approximately 30 min by car from both cities. Despite this accessibility, younger residents continue to migrate toward Vilnius, emphasizing the strong pull of larger urban centers.

4.3. Validation

To assess the consistency of the proposed projection approach, an aggregated validation was performed by comparing the sum of all polygon-level projections with official national population statistics for the period 2022–2026. The comparison includes both officially reported population figures and values adjusted by excluding registered temporary migrants, primarily associated with recent geopolitical events.
The results indicate a high level of agreement in the short term. For 2023, the projected population (2,856,859) closely matches the official statistic (2,857,000), demonstrating that the model reliably captures baseline demographic dynamics derived from the 2011–2021 period. However, deviations increase in subsequent years, with the model systematically underestimating the total population. By 2026, the projected population was approximately 110,000 lower than the official figure (see Table 3).
This divergence is primarily explained by external migration processes not captured in the model, particularly the temporary inflow of displaced persons from Ukraine following 2022. Official records indicate that a substantial share of these individuals are registered in the population system but do not represent stable, long-term demographic trends. When adjusted by excluding such temporary migrants, the gap between projected and observed values is reduced, although some differences remain.
These findings suggest that the proposed model performs well under stable demographic conditions but is sensitive to sudden exogenous shocks, particularly migration-related fluctuations. Importantly, such deviations do not materially affect the spatial patterns identified in this study, as the analysis focuses on relative changes and long-term structural trends rather than short-term national-level fluctuations.
This confirms that the model is more suitable for analyzing spatial redistribution processes than for predicting short-term national population totals.
To provide additional context for the interpretation of recent population dynamics, it is important to acknowledge the impact of temporary migration flows related to the war in Ukraine. According to official registry data, approximately 104,441 Ukrainian citizens were registered in Lithuania by April 2026. However, administrative records and secondary sources indicate that only around 53,000–54,000 individuals are likely to remain in the country on a permanent basis.
This discrepancy reflects the dynamic and partially temporary nature of recent migration flows, which are not fully captured in standard population projections based on pre-2021 trends. As a result, short-term population changes observed after 2021 may partly deviate from model-based estimates due to exogenous factors rather than underlying demographic processes. The projection model applied in this study should therefore be interpreted as reflecting structural demographic trends, while acknowledging that recent migration shocks introduce additional short-term variability.
Research study findings align with broader national trends: rural depopulation in Lithuania is particularly severe in detached housing and smaller villages, where aging, unemployment, declining public services, and limited local opportunities accelerate population loss. The GIS-based analysis demonstrates that population decreases are most pronounced in post-war and Soviet-era multifamily districts, while newly developed single-family suburban housing near major urban centers partially absorbs migration flows. Overall, the Vilnius–Kaunas corridor exemplifies the dual processes of urban concentration and rural decline, reflecting structural, economic, and social factors shaping contemporary population redistribution in Lithuania.
Preliminary evidence suggests that similar patterns of intermediate town decline and rural depopulation may exist in Latvia and Estonia; however, detailed GIS-based analyses of these trends in the Baltic region remain largely absent, highlighting a gap for future research.

5. Conclusions and Discussion

The analysis presented in this study operates at a spatial resolution that goes beyond standard aggregated data for municipality or regional levels, commonly used in European statistical reporting and policy evaluation. While NUTS-based data provide valuable insights into regional trends, they often mask substantial intra-regional variation. By contrast, the use of geolocated, high-resolution census data enables the identification of fine-scale spatial patterns of population change, capturing localized processes of depopulation, ageing, and housing vacancy that remain invisible at aggregated levels. This approach reveals that demographic decline is not uniformly distributed but concentrated in specific settlements and territories, where its effects are significantly more pronounced. As a result, the analysis provides a more accurate representation of spatial inequalities and supports the development of targeted, place-based policy responses.
To further illustrate the added value of high-resolution analysis, it is important to note that conventional municipality-level statistics in Lithuania typically indicate moderate population decline, often in the range of a few percentage points per decade. However, when examined at the level of individual residential polygons, substantially stronger local dynamics become visible. The present analysis reveals that while overall municipal decline may appear limited, many rural settlements experience population losses exceeding 40–60%, alongside rapidly increasing housing vacancies. At the same time, peri-urban zones within the same municipalities often record population growth. These contrasting dynamics remain largely concealed in aggregated statistics, where positive and negative changes are averaged. The high-resolution approach applied in this study therefore enables the identification of spatially heterogeneous processes—such as simultaneous rural depopulation and suburban expansion within a single administrative unit—that cannot be captured using conventional aggregated data. The analysis focuses on short-term projections, where scenario-based uncertainty representation is considered more appropriate than long-term probabilistic forecasting.
The GIS-based analysis confirms a marked decline in Lithuania’s rural housing and population since 2011. Detached rural houses—once a foundation of the country’s dispersed settlement structure and a key indicator of agricultural vitality—are rapidly disappearing. Between 2011 and 2021, the population living in such dwellings fell from 353,480 to 206,848, representing a 41% decrease. By 2025, this figure is projected to exceed 148,000, accounting for nearly half of all detached rural dwellings.
Although national population decline in Lithuania is projected to be approximately 1% annually, its spatial distribution is highly uneven. A substantial share of this decline is concentrated in rural areas due to internal migration toward urban centers. As a result, rural territories experience significantly higher effective rates of population loss.
Table 4 presents observed and projected trends of population decline, aging, and housing vacancy in rural standalone houses in Lithuania, demonstrating the disproportionate impact of demographic change in dispersed settlements.
The data in Table 4 show that even relatively small annual population losses of 1% at the national level translate into substantial depopulation in rural areas.
These patterns reveal a systemic transformation of rural life: population loss is driven not only by migration to larger cities and abroad but also by structural changes in employment and lifestyle. High rural unemployment, the decline of small-scale farming, limited access to services, and a shift away from physically demanding work have accelerated depopulation. Aging communities further reinforce the process, with more than 31,000 rural households in 2021 inhabited exclusively by elderly people (aged 65 and over).
The causal mechanisms of this process are very complex and multi-layered. The socio-economic climate for efforts to maintain and develop the regional network of urban settlements in Lithuania has changed radically since 1990. As this plan has yielded many positive impacts for the country’s social–economic and even political development [61], it deserves to be followed in free market conditions. Local governments make every effort to attract traditional or innovative businesses to regional centers, creating new employment and economic opportunities for residents. Economic opportunities remain the dominating criterion in the migration process for younger residents moving from smaller towns to big cities [36].
On the other hand, there is no clear public strategy for the older housing areas in big Lithuanian cities that are tolerated by elderly residents and avoided by young families, mainly because of poor technical conditions. This assessment is shifting as more and more older blocks and their surrounding areas are being renovated, increasing their attractiveness and complementing their attractive locations.
Beyond demographic indicators, the social consequences of depopulation are also substantial. Population loss weakens everyday community life, reduces the viability of local associations, and diminishes informal support networks that are especially important in ageing rural areas. As younger residents leave, remaining populations often face increasing social isolation, reduced intergenerational contact, and greater dependence on limited public or family care resources [62]. School closures and declining child populations may further reduce the attractiveness of settlements for young families, reinforcing a self-perpetuating cycle of decline. In labor-market terms, shrinking local demand and reduced workforce availability discourage private investment and small business continuity, thereby narrowing employment opportunities for remaining residents. Similar processes have been documented in other shrinking rural regions of Europe, where depopulation affects not only population numbers but also social cohesion, perceived wellbeing, and long-term community resilience.
At the same time, rural decline should not be interpreted as entirely linear or universal. Several countervailing trends may partially offset depopulation in selected locations. The spread of remote and hybrid work may increase the attractiveness of rural living for households that remain linked to urban labor markets. Return migration may also stabilize some settlements, particularly where family property, social ties, or lower living costs encourage resettlement [63]. In addition, amenity-led migration, tourism, and the conversion of seasonal or recreational dwellings into permanent residences may support demographic resilience in environmentally attractive rural areas. However, these processes are uneven and highly selective. They tend to benefit settlements with better accessibility, stronger digital connectivity, and natural or cultural amenities, while more remote and ageing settlements remain vulnerable to continued decline [64]. For this reason, such trends should be seen as partial modifiers rather than reversals of the broader structural trajectory identified in this study.
The results highlight that dispersed settlements are at risk of disappearing entirely within a generation. The challenge for planners and policymakers is to determine whether such settlements can be sustained or meaningfully repurposed.

Policy Recommendations for Depopulated and Suburban Territories

Policy approaches should focus on strategic management, consolidation, and adaptation rather than expansion. For depopulated rural areas, interventions should prioritize essential service provision, including healthcare, social care, and access to groceries, through service clustering, mobile units, or shared provision centers. Residents in rural detached housing are highly dependent on private vehicles, making transport planning, shared mobility solutions, and digital service provision critical to maintain accessibility, particularly for elderly populations. This is particularly critical in the remote rural areas identified in this study, where the population aged 65+ reaches approximately 22.7% and where employment levels are lower, indicating structurally limited demographic resilience. International experience, such as Ireland’s Rural Renewal Scheme [65,66] or the EU LEADER program [67], demonstrates the value of temporary subsidies, employment programs, and clustered service delivery in sustaining population and services in rural areas. Coordinated, adaptive policies are essential to maintain functional, accessible, and socially resilient rural and suburban settlements.
Policy recommendations should be differentiated according to settlement type and spatial context, as demographic processes vary significantly across territories. Based on the analysis, three main spatial categories can be distinguished: (i) remote and strongly depopulating rural areas, (ii) accessible rural and small-town territories experiencing moderate decline, and (iii) suburban and peri-urban growth zones surrounding major cities.
These spatial differences translate into distinct policy priorities. Remote rural areas, characterized by high ageing rates and limited accessibility, require strategies focused on service consolidation, mobile service provision, and managed decline, including selective demolition and ecological regeneration. In contrast, accessible rural areas and small towns may benefit from targeted economic support, improved connectivity, and adaptive reuse of existing infrastructure to stabilize populations and maintain local functions.
Suburban and peri-urban zones, particularly in the Vilnius–Kaunas corridor, face different challenges related to rapid population growth, including pressure on educational infrastructure, transport systems, and land use management. In these areas, policies should prioritize flexible infrastructure planning, transport integration, and controlled spatial expansion.
Suburban zones with recent residential expansion currently face high demand for schools and kindergartens, but this is expected to decline over the next decade or two [68]. These areas are characterized by relatively younger populations (approximately 15.3% aged 65+), reflecting recent in-migration of working-age households and creating temporary pressure on social infrastructure. Implementing modular, relocatable school buildings, as seen in some international practices [69,70,71], could provide flexible infrastructure that adapts to demographic shifts. Housing and land use policies should support residential stability in viable areas while allowing adaptive reuse or ecological conversion of abandoned territories.
Can such settlements be revitalized through new forms of rural economy or adapted to serve ecological, residential, or community purposes? Should national and regional planning policy aim to preserve these settlements as cultural heritage or focus on concentrating development in viable regional centers? These questions reflect both spatial planning priorities and national identity considerations, emphasizing the need for integrated, forward-looking strategies.
To strengthen the practical applicability of “smart shrinking” strategies, implementation should be based on clearly defined institutional responsibilities and evidence-based territorial planning. A key prerequisite is that high-resolution demographic and geospatial data should be made regularly available to municipal planning departments and other public authorities responsible for education, healthcare, transport, and infrastructure management. Without access to up-to-date small-area population data, local governments are often forced to rely on aggregated statistics that do not reflect actual settlement dynamics.
Such datasets can support municipalities in reorganizing public service networks according to real population distribution rather than outdated administrative norms. Kindergarten and school capacities should be regularly adjusted to the number and location of children, particularly in suburban growth zones, where demand may rise temporarily and later stabilize. Flexible solutions, including modular or relocatable educational buildings, may reduce long-term infrastructure costs.
In depopulating rural areas, primary healthcare accessibility should be reassessed using travel–time analysis and the spatial concentration of elderly residents. Municipalities, in cooperation with national health authorities, may support local family doctor offices, periodic mobile medical services, telemedicine solutions, and transport assistance for residents of remote settlements. Similar approaches may be applied to social care and daily needs provision, especially in territories where permanent retail services are no longer economically viable.
Local governments and sub-municipal administrations should also prepare inventories of abandoned or underused buildings and prioritize adaptive reuse, selective demolition, or landscape restoration according to local demand. In declining urban districts, particularly the Soviet-era multi-family housing areas identified in this study, such interventions should prioritize renovation, functional transformation, and selective densification, as these areas retain strong locational advantages despite ongoing population decline. Vacant structures may be converted into community facilities, cultural spaces, small business premises, or social housing where justified by demographic need. Where reuse is not viable, planned demolition and ecological conversion into parks, green corridors, memorial spaces, or renewable energy sites may improve environmental quality and reduce maintenance burdens.
To improve practical implementation, high-resolution demographic and housing data should be translated into concrete planning actions. Key applications include the following:
  • Education network optimization: adjustment of kindergarten and school catchment areas, consolidation of underused facilities, and planning of modular or relocatable buildings in growing suburban zones.
  • Healthcare and elderly care accessibility: prioritization of clinics, pharmacies, home-care services, and transport support in ageing rural territories.
  • Mobile and shared public services: identification of settlements where mobile healthcare, retail, postal, banking, or administrative services are more efficient than permanent facilities.
  • Housing and land management: adaptive reuse of structurally viable abandoned buildings for housing, tourism, community uses, or local business activity.
  • Demolition and environmental regeneration: removal of unsafe derelict structures and conversion of vacant land into green infrastructure, biodiversity areas, renewable energy sites, or cultural landscape assets.
  • Transport and digital accessibility: targeted investment in local roads, shared mobility systems, broadband coverage, and digital public services to reduce rural isolation.
Institutional responsibilities should be distributed across governance levels:
  • National government: legal framework, strategic priorities, fiscal incentives, and co-financing schemes.
  • Regional authorities: coordination of inter-municipal service networks and infrastructure planning.
  • Municipalities and sub-municipal administrations: local project delivery, community engagement, and prioritization of settlements requiring intervention.
Funding mechanisms should combine municipal budgets, national sectoral program, EU Cohesion Policy instruments, the Common Agricultural Policy, LEADER initiatives, and targeted regeneration grants. Public–private partnerships may also support selected projects such as service hubs, renewable energy cooperatives, or heritage tourism initiatives. Effective implementation requires coordination between ministries, municipalities, regional planning institutions, and local communities, with periodic review of demographic indicators to ensure that investments remain aligned with changing settlement realities.
The objective of smart shrinking should not be to preserve all settlements unchanged but to maintain acceptable living standards, efficient service access, and socially sustainable territorial structures under conditions of long-term demographic decline.

Author Contributions

Conceptualization, J.Z., D.M. and G.S.; methodology, J.Z. and D.M.; software, J.Z.; validation, J.Z., D.M. and D.D.; formal analysis, J.Z.; data curation, J.Z.; writing—original draft preparation, J.Z.; writing—review and editing, D.M., G.S. and D.D.; visualization, J.Z. All authors have read and agreed to the published version of the manuscript.

Funding

This research received no external funding.

Institutional Review Board Statement

Not applicable.

Informed Consent Statement

Not applicable.

Data Availability Statement

Restrictions apply to the availability of these data. The data were obtained from the Lithuanian Department of Statistics and were previously accessible through ESRI open data platforms. Due to changes in data accessibility, the datasets are not currently publicly available but may be obtained from the authors upon reasonable request and with permission of the data provider.

Acknowledgments

During the preparation of this manuscript, the authors used ChatGPT 5.5 for language editing and text refinement. The authors reviewed and edited the output and take full responsibility for the content of this publication.

Conflicts of Interest

The authors declare no conflicts of interest.

Abbreviations

The following abbreviations are used in this manuscript:
GISGeographic Information System
EUEuropean Union
TIATerritorial Impact Assessment
ESPON European Observation Network for Territorial Development; originally called European Spatial Planning Observation Network
NUTSNomenclature of Territorial Units for Statistics; used in EU datasets (including ESPON)
FUAFunctional Urban Area

Appendix A. Data Sources and Methodological Description

Appendix A.1. Data Source

The empirical analysis is based on a high-resolution geospatial demographic dataset prepared by the Lithuanian State Data Agency (Valstybės duomenų agentūra) and published in December 2024 through an online GIS platform as open data. The dataset combines official population registry information with the national address geolocation database.
The initial database used in this study consisted of 251,829 spatial entities.

Appendix A.2. Spatial Units and Resolution

Each entity was a polygon representing an inhabited or built-up territorial unit rather than an administrative boundary. These units ranged from individual rural homesteads and small village clusters to suburban residential zones, urban blocks, and neighborhood-scale, built-up areas. This spatial structure allowed substantially finer analysis than municipality- or region-level statistics.
The spatial framework was consistent across both census years (2011 and 2021), as both datasets were derived from the same national georeferenced population and address register system. The same urban-zone delineation logic was applied in both time periods, ensuring direct temporal comparability of spatial units without the need for areal interpolation or post-processing harmonization. This consistency was a key feature of the dataset and allowed reliable longitudinal analysis of population change at the disaggregated spatial level.
The dataset was polygon-based and did not use a fixed raster grid. Therefore, spatial resolution varied according to settlement morphology. In rural areas, polygons could correspond to single farmsteads or small groups of houses, while in urban areas, they usually represented residential blocks or compact, built-up zones.
This approach significantly reduced the loss of local detail typical of aggregated administrative data.

Appendix A.3. Coordinate Reference System

The coordinate reference system of the dataset is LKS-94 TM (EPSG:3346), which is the official projected coordinate system used in Lithuania for cadastral, planning, and GIS applications. Spatial units were measured in meters, allowing accurate distance and area calculations.

Appendix A.4. Temporal Coverage

The principal benchmark years used in this study were 2011 and 2021, representing the most recent comparable national population reference years. Population estimates for 2026 presented in the manuscript were produced by the authors using trend-based projections and are not part of the original source database.

Appendix A.5. Main Attributes

The attribute table includes territorial and demographic variables such as
  • polygon area;
  • total population;
  • male and female population;
  • detailed five-year age groups;
  • broader age categories (0–14, 15–64, 65+);
  • mean age;
  • nationality structure;
  • selected education indicators.
These variables enabled analysis of depopulation, ageing, and suburbanization processes.

Appendix A.6. Data Processing

Data processing by the authors consisted of importing the polygon layer into GIS software, checking attribute consistency, calculating absolute and percentage population change between 2011 and 2021, identifying shrinking and growing territories, mapping spatial clusters of decline and growth, and preparing projection scenarios.

Appendix A.7. Methodological Considerations

Compared with conventional municipality-scale datasets, the present database substantially reduces the Modifiable Areal Unit Problem because it contains highly disaggregated territorial units corresponding to actual settlement morphology. Nevertheless, some degree of spatial generalization remains unavoidable in all polygon-based statistical systems.
Minor positional inaccuracies may exist in geocoded address records, but these do not materially affect national-scale analytical results.

Appendix A.8. Strengths and Limitations

The main strengths of the dataset are its national coverage, official register-based reliability, exceptionally good spatial detail, and compatibility with GIS analysis.
The principal limitation of the dataset is that official population registration does not always fully reflect actual dwelling occupancy. In many cases, households may own or use two or more residential properties, while official registration is typically linked only to the primary residence. As a result, some houses recorded as unoccupied may in practice be seasonally used, second homes, or intermittently inhabited. This limits the ability to distinguish with complete certainty between permanently abandoned dwellings and properties used on a temporary basis. Additional limitations include the temporary public availability of the source data, access restricted to ESRI platform users during the publication period, and unavoidable uncertainty in forward projections.

Appendix A.9. Relevance for This Study

The dataset provides a rare opportunity to identify demographic processes hidden in aggregated statistics, including rapid shrinkage of dispersed rural settlements, ageing concentrations in peripheral areas, and strong suburban growth around major cities.

References

  1. Gu, C. Urbanization: Processes and driving forces. Sci. China Earth Sci. 2019, 62, 1351–1360. [Google Scholar] [CrossRef]
  2. Kim, D.C. Depopulation, aging, and rural restructuring in Japan. J. Depopul. Rural Dev. Stud. 2021, 33, 107–123. [Google Scholar] [CrossRef]
  3. Cuadrado-Roura, J.R. Population imbalances in Europe. Urban concentration versus rural depopulation. Reg. Sci. Policy Pract. 2023, 15, 713–716. [Google Scholar] [CrossRef]
  4. Slack, T.; Jensen, L. The changing demography of rural and small-town America. Popul. Res. Policy Rev. 2020, 39, 775–783. [Google Scholar] [CrossRef]
  5. Klien, S. Depopulation. In Sustainability, Diversity, and Equality: Key Challenges for Japan; Science Across Cultures: The History of Non-Western Science; Springer: Cham, Switzerland, 2023; pp. 155–169. [Google Scholar] [CrossRef]
  6. Liu, Y.; Zang, Y.; Yang, Y. China’s rural revitalization and development: Theory, technology and management. J. Geogr. Sci. 2020, 30, 1923–1942. [Google Scholar] [CrossRef]
  7. Fitchen, J.M. Endangered Spaces, Enduring Places: Change, Identity, and Survival in Rural America; Routledge: Abingdon, UK, 2019. [Google Scholar]
  8. Johnson, K.M.; Lichter, D.T. Rural depopulation: Growth and decline processes over the past century. Rural Sociol. 2019, 84, 3–27. [Google Scholar] [CrossRef]
  9. Esparcia, J. Rural Depopulation, Civil Society and Its Participation in the Political Arena in Spain: Rise and Fall of ‘Emptied Spain’ as a New Political Actor? In Win or Lose in Rural Development: Case Studies from Europe; Springer: Cham, Switzerland, 2024; pp. 39–63. [Google Scholar] [CrossRef]
  10. Gómez Valenzuela, V.; Holl, A. Growth and decline in rural Spain: An exploratory analysis. Eur. Plan. Stud. 2024, 32, 430–453. [Google Scholar] [CrossRef]
  11. Salvia, R.; Salvati, L.; Quaranta, G. Beyond the transition: Long-term population trends in a disadvantaged region of southern europe, 1861–2017. Sustainability 2021, 13, 6636. [Google Scholar] [CrossRef]
  12. Russo, F.; Marra, A.; Gerundo, R.; Nesticò, A. On the phenomenon of depopulation of inland areas. In Proceedings of the International Conference on Computational Science and Its Applications, Malaga, Spain, 4–7 July 2022; pp. 381–391. [Google Scholar]
  13. Fonseca, M.L. Population Change, Migration and Mobility Patterns in Portugal. In Urban Change in the Iberian Peninsula: A 2000–2030 Perspective; Springer: Cham, Switzerland, 2024; pp. 3–20. [Google Scholar] [CrossRef]
  14. Oliver-Esteban, A.; Romero-Calcerrada, R. Tourism in Depopulation Contexts: A Hybrid Bibliometric and Narrative Systematic Review. World 2026, 7, 40. [Google Scholar] [CrossRef]
  15. Martínez-Carrasco Pleite, F.; Colino Sueiras, J. Rural Depopulation in Spain: A Delphi Analysis on the Need for the Reorientation of Public Policies. Agriculture 2024, 14, 295. [Google Scholar] [CrossRef]
  16. Swianiewicz, P. Depopulation in Rural Areas of Central and Eastern Europe and its Consequences. Proposed Research Agenda. Geogr. Rev. 2024, 56, 23. [Google Scholar] [CrossRef]
  17. Kunc, J.; Cudny, W. Hallmark features of post-socialist urban development in Central Europe. In Growth and Change in Post-Socialist Cities of Central Europe; Routledge: Abingdon, UK, 2021; pp. 242–253. [Google Scholar]
  18. Sandu, A. The post-socialist cities from Central and Eastern Europe: Between spatial growth and demographic decline. Urban Stud. 2024, 61, 821–837. [Google Scholar] [CrossRef]
  19. Copus, A.; Kahila, P.; Fritsch, M.; Dax, T.; Kovács, K.; Tagai, G.; Weber, R.; Grunfelder, J.; Löfving, L.; Moodie, J. European Shrinking Rural Areas: Challenges, Actions and Perspectives for Territorial Governance (ESCAPE); Applied Research. Synthesis Report. Version 21/12/2020; ESPON EGTC: Luxembourg, 2020. [Google Scholar]
  20. Štreimikienė, D. Ageing society in Baltic States: A comparative study. J. Int. Stud. 2025, 18, 108–119. [Google Scholar] [CrossRef]
  21. Ambrosetti, E. Europe: Low fertility, aging, and migration policies. In International Handbook of Population Policies; Springer: Cham, Switzerland, 2022; pp. 313–335. [Google Scholar] [CrossRef]
  22. Bakhshaliyev, V.; Masharsky, A. Navigating Demographic Challenges for Sustainable Economic Growth in the Baltic States. Balt. J. Leg. Soc. Sci. 2025, 1, 125–149. [Google Scholar] [CrossRef]
  23. Deimantas, V.J.; Şanlıtürk, A.E.; Azzollini, L.; Köksal, S. Population dynamics and policies in Europe: Analysis of population resilience at the subnational and national levels. Popul. Res. Policy Rev. 2024, 43, 27. [Google Scholar] [CrossRef]
  24. Danielewicz, J. Governance beyond administrative borders: Sustainable urban development in Baltic metropolitan areas. Eur. Res. Stud. J. 2025, 28, 839–860. [Google Scholar] [CrossRef]
  25. Ubarevičienė, R.; Kalm, K.; van Ham, M.; Žinys, T.; Kliimask, J.; Tammaru, T. Residential mobility and new forms of spatial inequality in the settlement system: A comparative study of Estonia and Lithuania. Environ. Plan. B Urban Anal. City Sci. 2024, 51, 1666–1688. [Google Scholar] [CrossRef]
  26. Burneika, D.; Bērziņš, M.; Krišjāne, Z.; Ščerbinskaitė, S. Riga and Vilnius: The socio-spatial dimensions of rivalry between the largest Baltic cities. J. Balt. Stud. 2026, 57, 135–158. [Google Scholar] [CrossRef]
  27. Krumins, J.; Berzins, M.; Stafeckis, N.; Krisjane, Z. Mapping the patterns of internal migration in Latvia using spatial autocorrelation methods. Geogr. Tidsskr.-Dan. J. Geogr. 2026, 1–14. [Google Scholar] [CrossRef]
  28. Majdzińska, A. Depopulation and population ageing in Europe in the 2010s: A regional approach. Eur. Spat. Res. Policy 2024, 31, 67–93. [Google Scholar] [CrossRef]
  29. Goudenhooft, G. Massive Outflow of Population from Peripheral Countries of the European Union and Their Depopulation: Its Implications for the European Integration, Belgrad: European Center for Peace and Development (ECPD), 2023. J. Identity Migr. Stud. 2024, 18, 124–133. [Google Scholar]
  30. Curtale, R.; Stut, M.; Alessandrini, A.; Deuster, C.; Batista, E.; Natale, F.; Dijkstra, L. Outlook and demographic perspectives for EU’s rural regions. A modelling-based exercise. In JRC Working Papers on Territorial Modelling and Analysis No. 01/2025; European Commission: Brussels, Belgium, 2025. [Google Scholar]
  31. Diogo, E. Retaining non-EU immigrants in rural areas to sustain depopulated regions: Motives to remain. Societies 2024, 14, 25. [Google Scholar] [CrossRef]
  32. Pinkus, D.; Ruer, N. The Demographic Divide: Inequalities in Ageing Across the European Union; Bruegel: Brussels, Belgium, 2025. [Google Scholar]
  33. Zienkiewicz, T.; Zienkiewicz, E. Selected factors of depopulation in South-Eastern Europe. Wiadomości Stat. 2024, 69, 1–17. [Google Scholar] [CrossRef]
  34. Vyskočil, A.; Semotanová, E. Historical Geography in Czechia: Themes and Concepts; LIT Verlag: Münster, Germany, 2023; Volume 5, p. 67. [Google Scholar]
  35. Depraz, S. Urban/Rural Divisions in Europe. In Mapping the Spatial Divisions of Europe; John Wiley & Sons, Inc.: Hoboken, NJ, USA, 2025; p. 173. [Google Scholar] [CrossRef]
  36. Pociūtė-Sereikienė, G.; Kriaučiūnas, E. The development of rural peripheral areas in Lithuania: The challenges of socio-spatial transition. Eur. Countrys. 2018, 10, 498–515. [Google Scholar] [CrossRef]
  37. Stryjakiewicz, T. Shrinking cities in postsocialist countries of Central-Eastern and South-Eastern Europe: A general and comparative overview. In Postsocialist Shrinking Cities; Routledge: Abingdon, UK, 2022; pp. 235–255. [Google Scholar] [CrossRef]
  38. Jankava Anda, S.D. Rural Settlement Planning in Latvia: Criteria, Processes, Changes Over Time. Balt. Surv. 2024, 16, 16–24. [Google Scholar] [CrossRef]
  39. Cirtautas, M. Changing periphery of the Baltic cities: Lithuanian case. J. Archit. Urban. 2015, 39, 56–69. [Google Scholar] [CrossRef]
  40. Ubareviciene, R.; van Ham, M. Population Decline in Lithuania. Archit. Built Environ. 2016, 7, 127–158. [Google Scholar] [CrossRef]
  41. Pociūtė-Sereikienė, G. Urban shrinkage in the periphery of a post-communist country: The story of Šiauliai. J. Balt. Stud. 2021, 52, 103–125. [Google Scholar] [CrossRef]
  42. Ubarevičienė, R.; Žinys, T.; Kriaučiūnas, E. Migration’s Role in Shaping Socio-Demographic Structure in the Peripheral Rural Regions. Popul. Space Place 2025, 31, e70010. [Google Scholar] [CrossRef]
  43. Stanaitis, A. Lithuanian population after the socio-economic transition. Bull. Geogr. Socio-Econ. Ser. 2010, 13, 45–57. [Google Scholar] [CrossRef]
  44. Jaszczak, A.; Vaznoniene, G.; Kristianova, K.; Atkociuniene, V. Social and spatial relation between small towns and villages in peripheral regions: Evidence from Lithuania, Poland and Slovakia. Eur. Countrys. 2021, 13, 242–266. [Google Scholar] [CrossRef]
  45. Pociūtė-Sereikienė, G.; Kriaučiūnas, E.; Ubarevičienė, R. Peripheralisation trends in rural territories: The case of Lithuania. Stud. Agric. Econ. 2014, 116, 122–130. [Google Scholar] [CrossRef]
  46. Kriaučiūnas, E.; Burneika, D.; Ubarevičienė, R.; Baranauskienė, V. Lithuanian rural settlements: The legacy of Soviet rural planning and current challenges. Quaest. Geogr. 2025, 44, 5–17. [Google Scholar] [CrossRef]
  47. Jaszczak, A.; Kristianova, K.; Vaznonienė, G.; Žukovskis, J. Phenomenon of abandoned villages and its impact on transformation of rural landscapes. Manag. Theory Stud. Rural Bus. Infrastruct. Dev. 2018, 40, 467–480–467–480. [Google Scholar] [CrossRef]
  48. Daiva, V.-K.; Angelija, B.; Erika, Č. Depopulation of coastal rural Lithuania: Do regional parks stabilise the situation? Balt. Reg. 2021, 13, 90–111. [Google Scholar] [CrossRef]
  49. Blöchliger, H.; Tusz, R. Regional development in Lithuania: A tale of two economies. In OECD Economic Department Working Papers; OECD: Paris, France, 2020; pp. 1–34. [Google Scholar] [CrossRef]
  50. Kondratieva, N.B. Depopulation of the Baltic states in the context of European integration. Obŝestvennye Nauk. Sovrem. 2024, 6, 68–82. [Google Scholar]
  51. Chmielewski, B. Looking for a Way Out: Latvia’s Demographic Crisis. OSW Commentary, 16 July 2024.
  52. Raagmaa, G. Estonian population and regional development during the last 30 years—Back to the small town? Reg. Sci. Policy Pract. 2023, 15, 826–845. [Google Scholar] [CrossRef]
  53. Chmielewski, B. Far Behind Riga: Latvia’s Problems with Uneven Development. OSW Commentary, 15 March 2023.
  54. Pereira, P.; Valença Pinto, L.; Gomes, E.; Inácio, M. Land use changes in Klaipeda, Kaunas and Vilnius (Lithuania) functional urban areas. Geocarto Int. 2025, 40, 2511156. [Google Scholar] [CrossRef]
  55. Beconytė, G.; Gružas, K.; Spiriajevas, E. Areas of crime in cities: Case study of Lithuania. ISPRS Int. J. Geo-Inf. 2023, 13, 1. [Google Scholar] [CrossRef]
  56. Mirsanjari, M.M.; Sužiedelytė Visockienė, J.; Mohammadyari, F.; Zarandian, A. Modelling of expansion changes of Vilnius City area and impacts on landscape patterns using an artificial neural network. Soc. Ecol. Chem. Eng. 2021, 28, 429–447. [Google Scholar] [CrossRef]
  57. Dahs, A.; Krumins, J.; Berzins, A.; Lece, K. Demographic profile of statistical regions and new territorial units of Latvia in 2020–2021. In Proceedings of the 2022 International Conference “Economic Science for Rural Development”, Jelgava, Latvia, 11–13 May 2022; p. 287. [Google Scholar] [CrossRef]
  58. Voronov, V.V.; Arbidane, I.; Heimanis, B.M.; Komarova, V.F. Population replacement in Latvia: Current state and prospects. Balt. Reg. 2024, 16, 104–125. [Google Scholar] [CrossRef]
  59. Swanson, D.A.; Tayman, J. A new approach to probabilistic population forecasting with an application to Estonia. Popul. Res. Policy Rev. 2025, 44, 43. [Google Scholar] [CrossRef]
  60. Carson, D.A.; Carson, D.B.; Argent, N. Cities, hinterlands and disconnected urban-rural development: Perspectives from sparsely populated areas. J. Rural Stud. 2022, 93, 104–111. [Google Scholar] [CrossRef]
  61. Drėmaitė, M. Political planning and architecture: The sovnarkhoz system and the industrialization of Lithuania in the 1960s. In Industry and Modernism: Companies, Architecture, and Identity in the Nordic and Baltic Countries During the High-Industrial Period; Finnish Literature Society: Helsinki, Finland, 2007; pp. 239–255. [Google Scholar]
  62. Campbell, F.; Whear, R.; Rogers, M.; Sutton, A.; Robinson-Carter, E.; Barlow, J.; Sharpe, R.; Cohen, S.; Wolstenholme, L.; Thompson-Coon, J. Non-familial intergenerational interventions and their impact on social and mental wellbeing of both younger and older people—A mapping review and evidence and gap map. Campbell Syst. Rev. 2023, 19, e1306. [Google Scholar] [CrossRef]
  63. Bayona-i-Carrasco, J.; Recaño, J. Intra-urban mobility in Spain and its effects on dispersion patterns of the Spanish-born population and immigrants: The cases of Madrid and Barcelona. Eur. Urban Reg. Stud. 2026. [Google Scholar] [CrossRef]
  64. Hussain, B.; Mirza, M.; Baines, R.; Burns, L.; Stevens, S.; Asthana, S.; Chatterjee, A. Loneliness and social networks of older adults in rural communities: A narrative synthesis systematic review. Front. Public Health 2023, 11, 1113864. [Google Scholar] [CrossRef]
  65. Keane, M.J.; Garvey, E. Measuring the employment effects of the rural renewal tax scheme. Reg. Stud. 2006, 40, 359–374. [Google Scholar] [CrossRef]
  66. Murtagh, A.; Farrell, M.; Kuhmonen, T.; Weir, L.; Mahon, M. The future dreams of Ireland’s Youth: Possibilities for rural regeneration and generational renewal. Sustainability 2023, 15, 9528. [Google Scholar] [CrossRef]
  67. Tirado Ballesteros, J.G.; Hernández, M.H. Promoting tourism through the EU LEADER programme: Understanding Local Action Group governance. Eur. Plan. Stud. 2019, 27, 396–414. [Google Scholar] [CrossRef]
  68. Aidarkhanova, G.; Zhumagulov, C.; Nyussupova, G.; Kholina, V. Assessing the impact of demographic growth on the educational infrastructure for sustainable regional development: Forecasting demand for preschool and primary school enrollment in Kazakhstan. Sustainability 2025, 17, 4212. [Google Scholar] [CrossRef]
  69. Nguyen, T.D.H.N.; Jeong, J.; Ahn, Y.; Shin, H. An innovative approach to temporary educational facilities: A case study of relocatable modular school in South Korea. J. Build. Eng. 2023, 76, 107097. [Google Scholar] [CrossRef]
  70. Nguyen, T.D.H.N.; Park, S.; Jeong, J.; Ahn, Y. Post occupancy evaluation of the relocatable modular construction method for temporary educational facilities. Eng. Constr. Archit. Manag. 2026, 33, 785–809. [Google Scholar] [CrossRef]
  71. Chang, M.-S.; Lee, M.-S. The integrated design process of the green-smart relocatable modular school building. J. Archit. Inst. Korea 2022, 38, 55–63. [Google Scholar]
Figure 1. Average yearly population change by NUTS 3 territorial units. Source: European Commission, JRC elaboration (https://joint-research-centre.ec.europa.eu/jrc-news-and-updates/demography-2040-cities-keep-growing-while-population-shrinks-remote-rural-regions-2025-04-04_en, accessed on 15 March 2026).
Sustainability 18 05091 g001
Figure 2. Nationwide patterns of vacant detached rural housing in Lithuania (2011–2021). In blue, the municipality borders around the main Vilnius–Kaunas transportation corridor are shown, highlighting the territory where 39% of Lithuanian people reside.
Sustainability 18 05091 g002
Figure 3. Spatial pattern of abandoned houses in Lithuania in relation to urban centers and transport infrastructure. The upper panel presents GIS-based distance zones, with abandoned houses marked in red. The lower panels show the number and density of abandoned houses by distance from town centers (left) and cumulative abandoned houses and resident population by distance from major roads (right).
Sustainability 18 05091 g003
Figure 4. Suburban expansion and population redistribution in the Greater Vilnius region (2011–2026).
Sustainability 18 05091 g004
Figure 5. Urban restructuring through population change in Vilnius city (2011–2026).
Sustainability 18 05091 g005
Figure 6. Suburban expansion and population redistribution in the Kaunas region (2011–2026).
Sustainability 18 05091 g006
Figure 7. GIS-based mapping of urban restructuring in Kaunas (2011–2026).
Sustainability 18 05091 g007
Figure 8. Population change in selected towns between Vilnius and Kaunas, 2011–2026.
Sustainability 18 05091 g008
Table 1. Trends and scenario of population loss, ageing, and vacancy in rural standalone houses (Lithuania, 2011–2040).
IndicatorLithuaniaLatviaEstonia
Population c. 1990 (millions)3.702.671.57
Population 2025 (millions)2.891.831.31
Total population loss 1990–2025 (%)−22%−31%−17%
Population loss 2011–2021 (%)−6.3%−8.5%−3.5%
Projected annual population change to 2040 (%; based on EU/Eurostat forecasts)−1.0 to −1.5−1.0 to −1.5−0.5 to −1.0
Rural housing vacancy (latest available)57.7% (2025 proj.)n/a>15% increase in 360+ villages (7-year period)
Capital city share of national population≈21% (Vilnius)≈47% (Riga)≈32% (Tallinn)
Key post-1990 differentiating factorPolycentric settlement network; dispersed homestead traditionCapital primacy; 2008–2009 crisis-driven emigration surgeStronger economy; digital infrastructure; Scandinavian economic links
Table 2. Reconciliation of population change across aggregation levels (2011–2021).
CategoryPopulation ChangeNotes
Total Lithuania−241,827National total (all units) matches national statistics
Growth in Vilnius region11,262Internal migration from other regions
Decline in rural detached houses−146,632Total decline in country
Other rural + small towns−95,195Not separately shown
Table 3. Validation of short-term population projections against official statistics in Lithuania (2022–2026).
YearStatisticsCalculatedDifference
20222,806,0002,874,704+68k (overestimate)
20232,857,0002,856,859perfect match
20242,885,0002,834,795−50k
20252,890,0002,819,367−70k
20262,886,0002,775,969−110k
Table 4. Trends of population loss, ageing, and vacancy in rural standalone houses (Lithuania, 2011–2026).
Indicator201120212026 (Obtained from Linear Regression Model)
Total population in rural houses353,48206,848148,198
Vacant houses (%)11%31.8%57.7%
Total rural houses (active)90,57168,94949,399
Disclaimer/Publisher’s Note: The statements, opinions and data contained in all publications are solely those of the individual author(s) and contributor(s) and not of MDPI and/or the editor(s). MDPI and/or the editor(s) disclaim responsibility for any injury to people or property resulting from any ideas, methods, instructions or products referred to in the content.