Carbon Information Disclosure Quality in China’s Petroleum and Petrochemical Enterprises: An LLM Approach

Abstract
1. Introduction
2. Literature Review
2.1. Corporate Carbon Information Disclosure
2.2. Evaluation of CIDQ
2.3. Methods for Disclosure Evaluation
3. Research Design and Methodology
3.1. Sample and Data
3.2. Indicator System and Scoring Rules
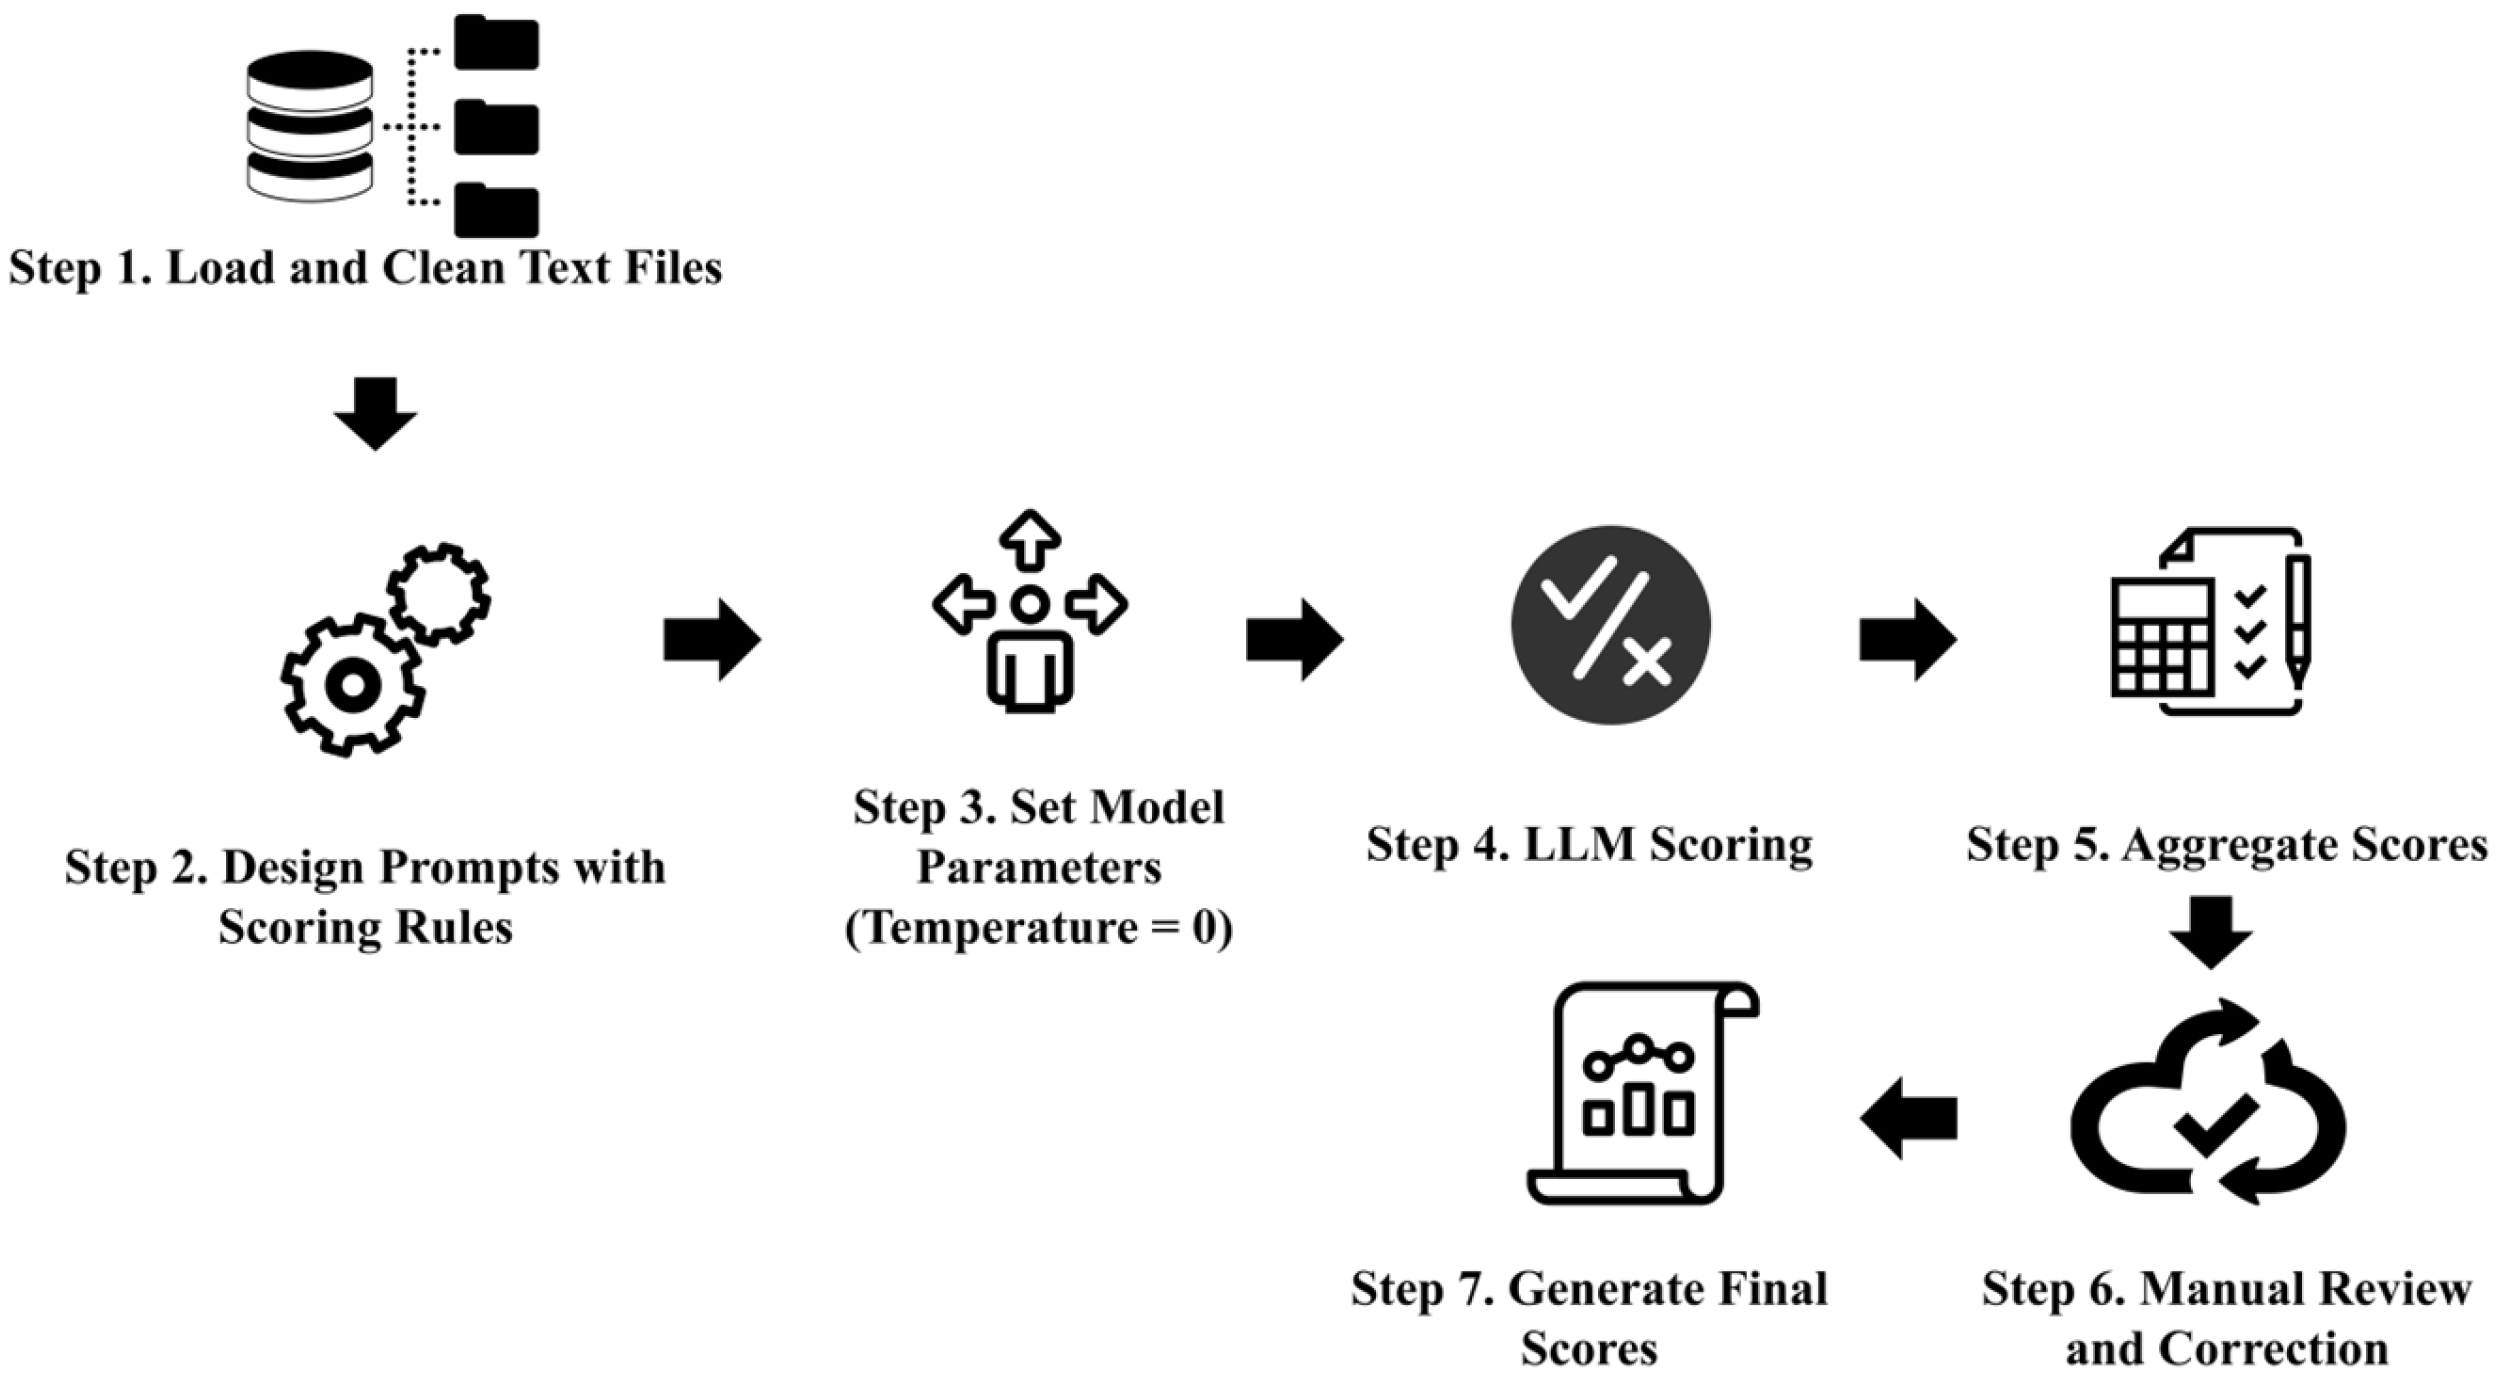
3.3. LLM-Based Evaluation Process
3.4. Reliability and Consistency Test
4. Results
4.1. Overall Analysis
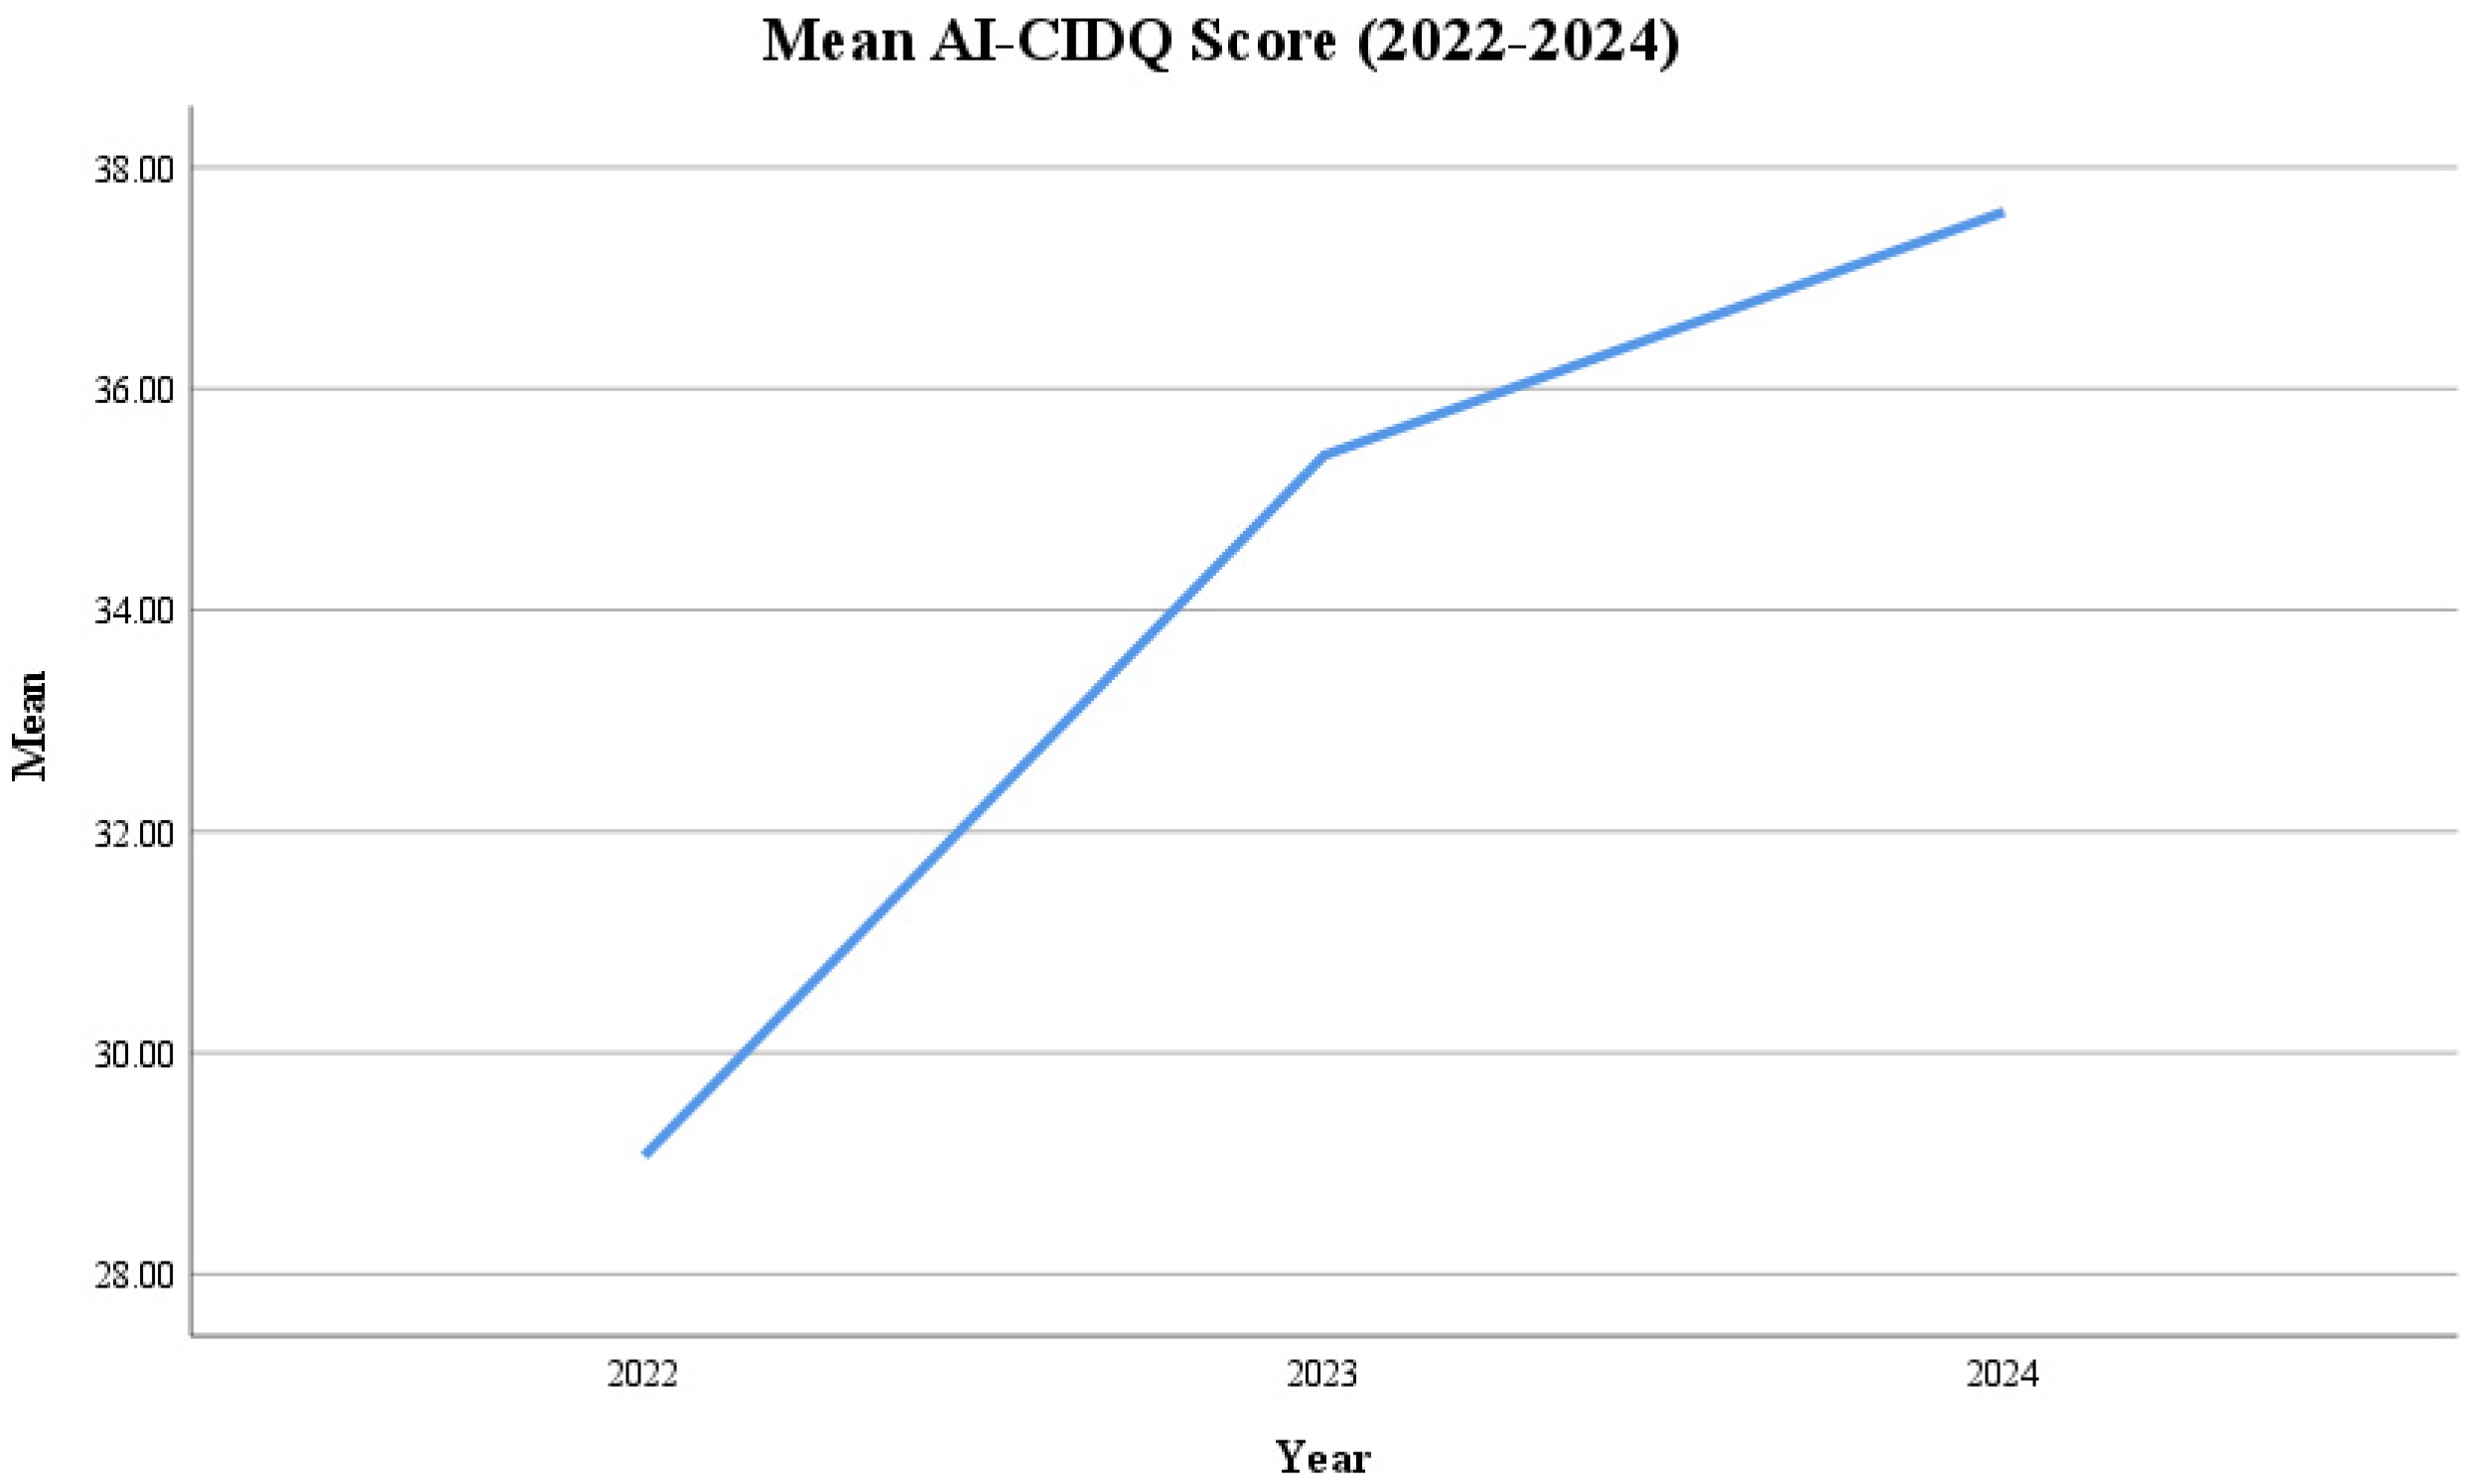
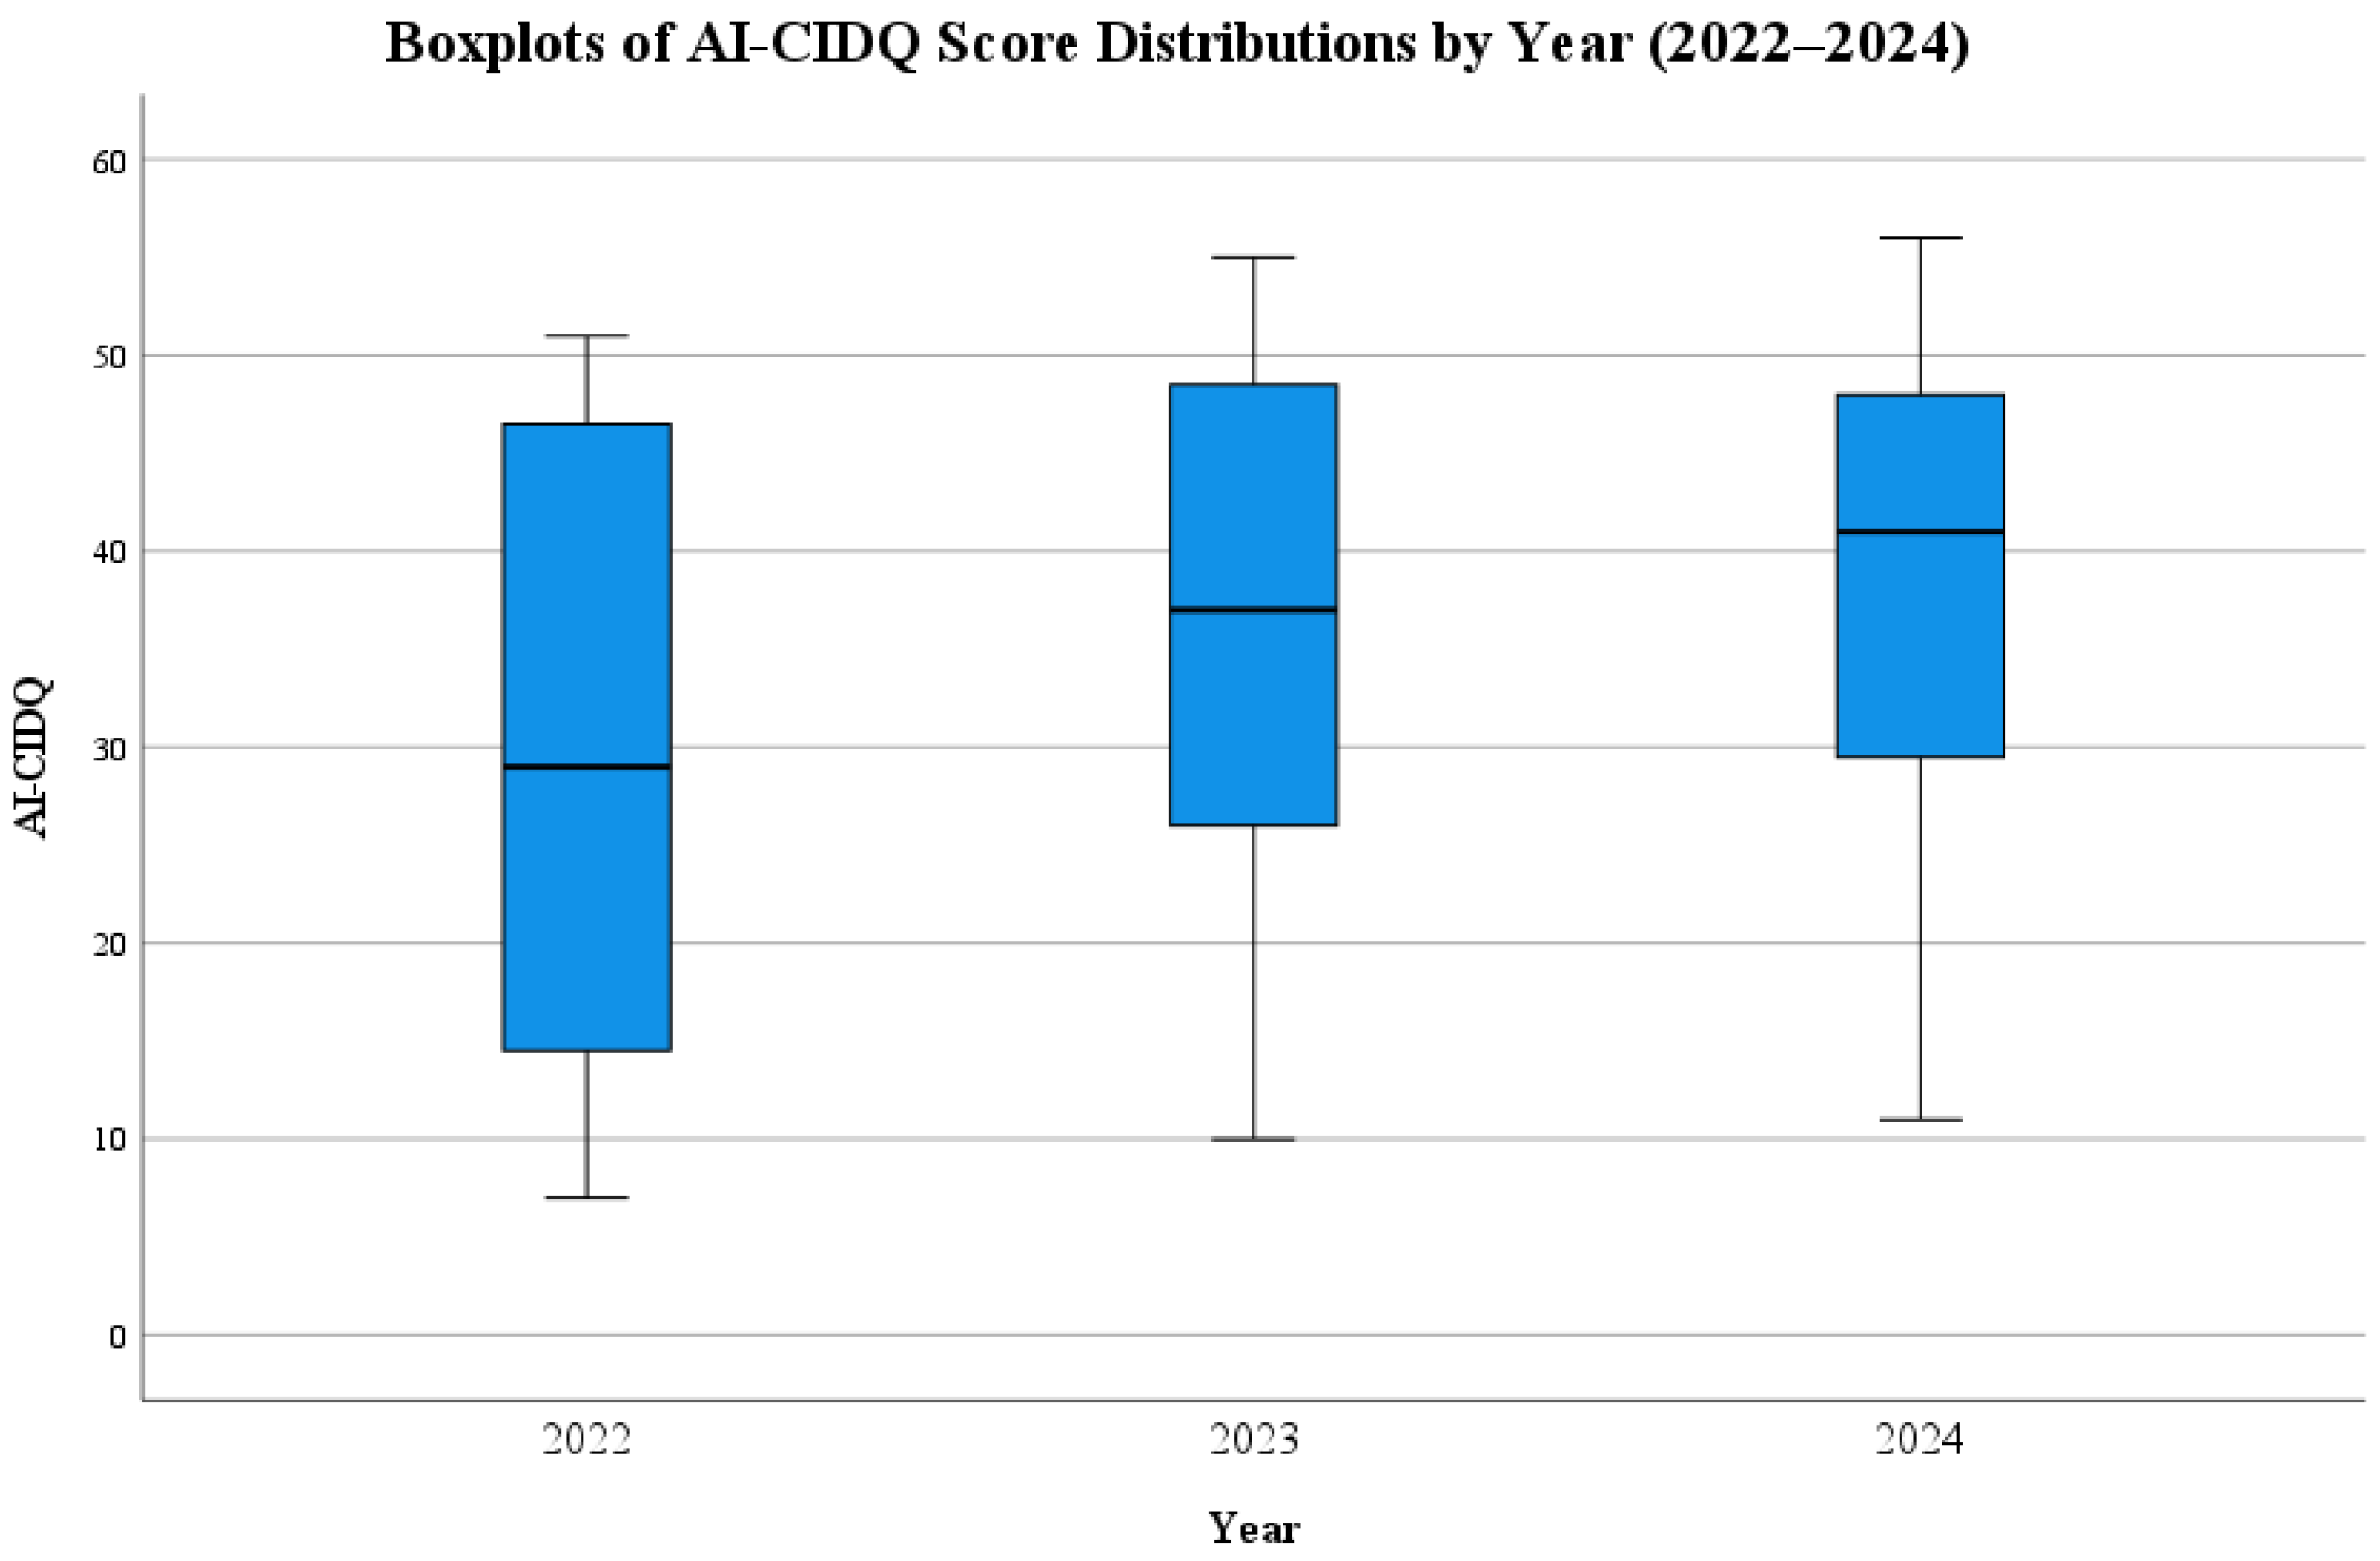
4.2. Annual Analysis
4.3. Firm-Level Heterogeneity in CIDQ
5. Discussion
6. Conclusions
Author Contributions
Funding
Institutional Review Board Statement
Informed Consent Statement
Data Availability Statement
Acknowledgments
Conflicts of Interest
Appendix A. Representative Prompt Structure Used for Indicator-Level Scoring

| Component | Content |
|---|---|
| Role/Task | Please act as an expert in evaluating carbon information disclosure quality and assess the corporate report strictly according to the predefined criteria. |
| Evaluation Indicator | {Level 1 Indicator}–{Level 2 Indicator}–{Level 3 Indicator} |
| Indicator Description | {Indicator description} |
| Special Note | For selected indicators, additional decision rules were included in the prompt in order to improve scoring consistency. |
| Example 1 | Explanation of Professional Terminology: Terms such as “Scope 1 emissions”, “direct emissions”, and “direct greenhouse gas emissions” were treated as equivalent expressions. Similar equivalence rules were applied to Scope 2 emissions, Scope 3 emissions, and carbon footprint terminology. |
| Example 2 | Emission Increases or Violation Incidents: Negative statements such as “no violations occurred” or “no environmental penalties were imposed” were treated as a form of relevant disclosure under this indicator. |
| Scoring Rule (0) | {Rule for 0} |
| Scoring Rule (1) | {Rule for 1} |
| Scoring Rule (2) | {Rule for 2} |
| Corporate Report Text | {Full machine-readable report text inserted here in the actual evaluation process} |
| Component | Content |
|---|---|
| Instruction 1 | The score must be supported by direct textual evidence from the report. |
| Instruction 2 | The model should pay attention to equivalent terminology and negative expressions where relevant. |
| Instruction 3 | A score of 0 should be assigned if no relevant information is disclosed. |
| Instruction 4 | A score of 1 should be assigned if the disclosure is only qualitative or general and lacks verifiable quantitative support. |
| Instruction 5 | A score of 2 should be assigned if the disclosure includes quantitative data, measurable targets, or other verifiable evidence directly relevant to the indicator. |
| Instruction 6 | The evidence must be quoted from the report text. |
| Output Field 1 | “score”: 0, 1, or 2 |
| Output Field 2 | “reason”: brief explanation of why the disclosure meets the scoring rule |
| Output Field 3 | “evidence”: direct quotation or extracted textual evidence from the report |
| Output Field 4 | “evidence_location”: location of the evidence in the report |
Appendix B. Operational Scoring Guide for the 33 Tertiary Indicators
| Code | Tertiary Indicator | Indicator Description | Score 0 | Score 1 | Score 2 | Boundary/ Operational Note |
|---|---|---|---|---|---|---|
| A11 | Combination of Data and Charts | Whether carbon information is presented in multiple forms such as data tables and charts so as to improve readability. | Only textual description is provided, with no data or charts. | Data are provided, but charts are absent or very limited in form. | Data are presented together with multiple charts or visual forms in a clear and intuitive way. | Pure narrative disclosure was not sufficient. Quantitative data without visual presentation was coded as 1 rather than 2. |
| A12 | Explanation of Professional Terminology | Whether the firm explains carbon-related professional terms such as Scope 1, Scope 2, and Scope 3 emissions. | Professional terms are used without explanation, or no carbon-related terms are mentioned. | Some major terms are explained, including equivalent expressions. | All professional terms used in the report, including equivalent expressions, are explained clearly and in detail. | Partial explanation of key terms was coded as 1; comprehensive and explicit explanation across terms was coded as 2. |
| A21 | Index/Table of Contents | Whether the report provides an index or table of contents to help locate carbon-related information. | No index or table of contents is provided. | A simple index or contents list is provided, but it is not detailed enough. | A detailed index or table of contents is provided, enabling rapid location of carbon-related information. | A general report contents page was coded as 1 unless it clearly facilitated location of relevant carbon information. |
| Code | Tertiary Indicator | Indicator Description | Score 0 | Score 1 | Score 2 | Boundary/ Operational Note |
|---|---|---|---|---|---|---|
| B11 | Disclosure of Calculation Methods | Whether the firm discloses carbon accounting methods and explains data sources. | No accounting method is disclosed. | A basic accounting framework is mentioned. | Specific accounting methods and data sources are disclosed in detail. | Mere mention of a framework or standard was coded as 1; method plus data-source detail was coded as 2. |
| B12 | Third-Party Verification | Whether carbon information is independently verified or assured by a third party. | No third-party verification is disclosed. | Third-party verification is mentioned only partially or without specifying scope. | Independent third-party assurance is fully disclosed, including the verifier and verification scope. | A general statement that some information was verified was coded as 1; named verifier plus scope was coded as 2. |
| B21 | Emission Increases or Violation Incidents | Whether the firm discloses negative information such as excessive emissions, penalties, or environmental incidents. | No relevant information on violations, pollution, penalties, or related matters is mentioned at all. | Negative information is only mentioned briefly or indirectly, including statements such as “no violations occurred”. | Specific incidents are disclosed in detail together with corrective or improvement measures. | Negative statements such as “no violations” were treated as relevant disclosure and coded as 1 rather than 0. |
| B22 | Risk Disclosure | Whether the firm discloses carbon-related risks, such as policy risk or climate risk, with reference to TCFD-type logic. | No relevant risk is disclosed. | Some risks are disclosed, but not comprehensively. | Multiple types of risk and corresponding response strategies are disclosed comprehensively. | General environmental uncertainty language was not sufficient; identifiable carbon- or climate-related risk content was required. |
| Code | Tertiary Indicator | Indicator Description | Score 0 | Score 1 | Score 2 | Boundary/ Operational Note |
|---|---|---|---|---|---|---|
| C11 | Cross-Period Consistency | Whether consistent accounting methods and base years are used to support intertemporal comparison. | Methods change frequently without explanation, or no consistency is discussed. | Methods are broadly consistent with only minor adjustment, or consistency is mentioned without detail. | Methods are fully consistent, or changes are reasonably explained, and comparative data are provided. | A simple claim of consistency without showing comparable data was coded as 1. |
| C12 | Alignment with Industry Standards | Whether the disclosure is aligned with international or industry standards such as IPCC- or SASB-type frameworks. | No standard is adopted. | Some standards are partially adopted. | The disclosure is fully aligned with relevant international or industry standards. | Partial reference to standards was coded as 1; systematic alignment was coded as 2. |
| C21 | Stability of Report Format | Whether the report format is stable and facilitates comparison across periods or firms. | The format is disorganized and lacks a stable structure. | The format is basically stable, with some adjustments. | The format is fully stable and clearly facilitates comparison. | Minor layout changes did not prevent a score of 1 if the basic structure remained comparable. |
| C22 | Data Standardization | Whether carbon data are disclosed using standardized units such as tCO2e. | Non-standard units are used. | Standardized units are used only for part of the data. | Standardized units are used consistently throughout the disclosure. | Partial standardization was coded as 1; complete and consistent standardization was coded as 2. |
| Code | Tertiary Indicator | Indicator Description | Score 0 | Score 1 | Score 2 | Boundary/ Operational Note |
|---|---|---|---|---|---|---|
| D11 | Emission Reduction Strategy | Whether the firm discloses a long-term emission-reduction strategy, such as a carbon neutrality pathway. | No emission-reduction strategy is disclosed. | A strategy is mentioned, but it is not specific. | A detailed long-term strategy and implementation pathway are disclosed. | Broad strategic rhetoric without pathway detail was coded as 1. |
| D12 | Emission Reduction Targets | Whether the firm sets quantified emission-reduction targets, such as absolute or intensity-based targets. | No quantified target is disclosed. | A target is mentioned, but it is vague or not measurable. | Clear quantified targets and timetable are disclosed. | A target without measurable quantity or time frame was coded as 1 rather than 2. |
| D13 | Climate-Related Governance | Whether the report describes board- or management-level responsibility for carbon governance. | No governance mechanism is disclosed. | Governance responsibility is mentioned only briefly, without board-level specificity. | Board-level climate governance structure and specific responsibilities are clearly disclosed. | Mention of management attention alone was coded as 1 unless concrete board-level oversight was specified. |
| D21 | Emission Reduction Measures | Whether specific emission-reduction measures are disclosed, such as energy efficiency improvement or process optimization. | No specific measures are disclosed. | Some measures are disclosed, but not systematically. | Various types of emission-reduction measures are disclosed systematically. | Isolated examples were coded as 1; a broader and more organized set of actions was coded as 2. |
| D22 | Operation of Emission Reduction Facilities | Whether the report describes the operation of emission-reduction facilities such as CCUS or renewable-energy equipment. | No operating condition of emission-reduction facilities is disclosed. | Operation is mentioned only briefly. | Operating data and effectiveness are disclosed in detail. | Mentioning that facilities existed was coded as 1; operational performance information was required for 2. |
| D23 | Carbon Trading and Offsetting | Whether the firm participates in carbon trading or uses offset projects. | No carbon-market participation is disclosed. | Participation is disclosed, but insufficiently. | Trading data and strategy are disclosed adequately and in detail. | Mere participation without transaction or strategy detail was coded as 1. |
| D31 | Scope 1 Emissions | Whether the firm discloses direct greenhouse gas emissions data. | Scope 1 emissions are not disclosed. | A total amount is disclosed, or Scope 1 is mentioned only qualitatively. | Emissions from specific sources are disclosed in detail with quantitative values. | General or aggregate mention was coded as 1; source-level quantified disclosure was coded as 2. |
| D32 | Scope 2 Emissions | Whether the firm discloses indirect emissions from purchased electricity or heat. | Scope 2 emissions are not disclosed. | Total Scope 2 data are disclosed, or Scope 2 is only described qualitatively. | Scope 2 emissions are disclosed in detail with quantitative values and explanation of electricity source. | Quantified totals without contextual detail were coded as 1; fuller explanation and quantified disclosure was coded as 2. |
| D33 | Scope 3 Emissions | Whether the firm discloses value-chain indirect emissions such as supply chain or product-use emissions. | Scope 3 emissions are not disclosed. | Only part of Scope 3 emissions is disclosed. | All major Scope 3 categories are disclosed comprehensively. | Partial disclosure of selected categories was coded as 1. |
| D34 | Product Carbon Footprint | Whether the firm discloses carbon-footprint data for major products. | No product carbon footprint is disclosed. | Carbon footprint is disclosed only for some products, or related actions are mentioned without complete data. | Complete carbon-footprint disclosure is provided for major products. | Action-oriented statements such as carrying out product carbon-footprint accounting were coded as 1 if full footprint disclosure was absent. |
| D35 | Carbon Intensity Indicators | Whether the firm discloses carbon-intensity indicators, such as emissions per unit of output or revenue. | No intensity indicator is disclosed. | Basic intensity indicators are disclosed, or the concept is mentioned without sufficient detail. | Multi-dimensional and standardized intensity indicators are disclosed. | A single simple intensity metric was usually coded as 1; broader standardized intensity disclosure was coded as 2. |
| Code | Tertiary Indicator | Indicator Description | Score 0 | Score 1 | Score 2 | Boundary/ Operational Note |
|---|---|---|---|---|---|---|
| E11 | Full Value Chain Coverage | Whether carbon information covers the whole value chain, including upstream and downstream stages. | Only own operations, or less, are covered. | Part of the value chain is covered, such as upstream and own operations, but downstream use is missing. | The full value chain is covered, including upstream, own operations, and downstream use stages. | Coverage beyond direct operations but without downstream use-stage disclosure was coded as 1. |
| E12 | All Emission Sources | Whether all major emission sources are disclosed. | Major emission sources are omitted. | Main sources are covered, but not all major sources. | All major emission sources are covered. | Coverage of only the most visible sources was coded as 1 if material sources were still missing. |
| E21 | Data by Department/Region | Whether carbon data are disclosed by department, region, or business unit. | Only company-level aggregate data are disclosed, or no such breakdown is mentioned. | Some departmental or regional breakdown is mentioned, but concrete data are incomplete. | Complete carbon data are disclosed by department, region, or business segment. | A conceptual mention of segment disclosure without actual segmented data was coded as 1. |
| E22 | Historical Data Comparison | Whether the report provides historical data for trend analysis. | No historical comparison is provided. | Historical comparison is mentioned, but no concrete data are given. | Comparative data for two years or more are provided. | Trend language without actual comparative figures was coded as 1 rather than 2. |
| Code | Tertiary Indicator | Indicator Description | Score 0 | Score 1 | Score 2 | Boundary/ Operational Note |
|---|---|---|---|---|---|---|
| F11 | Timeliness of Report Disclosure | Whether carbon information is disclosed within a reasonable period after the end of the fiscal year. | Disclosure is delayed by more than six months. | Disclosure is delayed by about three to six months. | Disclosure is timely or only slightly delayed. | This indicator was judged against the timing of release rather than content richness. |
| F12 | Regular Updates | Whether carbon information is updated regularly, for example on an annual basis. | Disclosure is irregular. | Disclosure is basically regular, but with interruption. | Disclosure is updated strictly and regularly. | Regular annual updating without interruption was required for 2. |
| Code | Tertiary Indicator | Indicator Description | Score 0 | Score 1 | Score 2 | Boundary/ Operational Note |
|---|---|---|---|---|---|---|
| G11 | Low-Carbon Technology R&D | Whether the firm discloses R&D investment in low-carbon technologies such as hydrogen, biofuels, or CCUS. | No relevant R&D is disclosed. | Basic R&D information is disclosed, but without specific content. | Specific R&D inputs, achievements, and applications are disclosed in detail. | A generic statement that low-carbon R&D existed was coded as 1. |
| G21 | Supplier Carbon Management | Whether the firm discloses carbon-management requirements or cooperation for suppliers. | No supplier carbon-management measure is disclosed. | Basic supplier-management requirements or concepts are mentioned. | Systematic supplier carbon-management requirements and measures are disclosed, with concrete data. | Mention of a green supply chain idea alone was coded as 1 unless concrete management content was provided. |
| G22 | Logistics Emission Optimization | Whether the firm discloses logistics-related emission-reduction measures such as transport optimization. | No logistics emission-reduction measure is disclosed. | Logistics emission-reduction measures are mentioned, but not in detail. | Detailed disclosure of logistics optimization outcomes or logistics-emission data is provided. | Simple mention of logistics optimization was coded as 1; quantified effect or performance detail was coded as 2. |
| G31 | Community Communication | Whether the firm discloses communication with communities regarding carbon-related projects and impacts. | No community communication is disclosed. | Basic communication is mentioned, but without record or mechanism. | Systematic communication with feedback mechanisms is disclosed. | General statements on community communication without a clear communication mechanism were coded as 1. |
| G32 | Just Transition | Whether the firm discloses a just-transition plan concerning the social impacts of energy transition on employees and communities. | No social-transition impact is considered. | Just transition is mentioned only briefly. | A detailed just-transition plan is disclosed. | General statements on employees or society were coded as 1 only when linked to transition-related impacts. |
References
- Borghei, Z. Carbon Disclosure: A Systematic Literature Review. Account. Financ. 2021, 61, 5255–5280. [Google Scholar] [CrossRef] [Scilit]
- Hahn, R.; Kühnen, M. Determinants of Sustainability Reporting: A Review of Results, Trends, Theory, and Opportunities in an Expanding Field of Research. J. Clean. Prod. 2013, 59, 5–21. [Google Scholar] [CrossRef] [Scilit]
- Mateo-Márquez, A.J.; González-González, J.M.; Zamora-Ramírez, C. Countries’ Regulatory Context and Voluntary Carbon Disclosures. Sustain. Account. Manag. Policy J. 2020, 11, 383–408. [Google Scholar] [CrossRef] [Scilit]
- Bazhair, A.H.; Khatib, S.F.A.; Al Amosh, H. Taking Stock of Carbon Disclosure Research While Looking to the Future: A Systematic Literature Review. Sustainability 2022, 14, 13475. [Google Scholar] [CrossRef] [Scilit]
- Pitrakkos, P.; Maroun, W. Evaluating the Quality of Carbon Disclosures. Sustain. Account. Manag. Policy J. 2020, 11, 553–589. [Google Scholar] [CrossRef] [Scilit]
- Liu, Y.S.; Zhou, X.; Yang, J.H.; Hoepner, A.G.F.; Kakabadse, N. Carbon Emissions, Carbon Disclosure and Organizational Performance. Int. Rev. Financ. Anal. 2023, 90, 102846. [Google Scholar] [CrossRef] [Scilit]
- Guidelines for Industry Classification of Listed Companies (2012 Revision). CSRC Announcement No. 31 [2012]; China Securities Regulatory Commission: Beijing, China, 2012.
- Cormier, D.; Beauchamp, C. Market Incidence of Carbon Information Disclosure in the Oil and Gas Industry: The Mediating Role of Financial Analysts and Governance. J. Financ. Report. Account. 2021, 19, 901–920. [Google Scholar] [CrossRef] [Scilit]
- Zhao, J.J.; Wang, X.; Yang, D.C. Climate Change Risk Disclosure and Accounting Choice: Evidence from U.S. Oil and Gas Companies. Int. J. Bus. Econ. 2023, 8, 89–106. [Google Scholar] [CrossRef] [Scilit]
- Zhang, S. Climate Change Disclosure and Carbon Performance of Chinese Listed Companies: Exploring the Moderating Effects of Climate Governance and Corporate Environmental Governance. Front. Clim. 2024, 6, 1469899. [Google Scholar] [CrossRef] [Scilit]
- Mousavian Anaraki, S.A.; Croce, D.; Basili, R. Large Language Models for Sustainability Reporting: A Systematic Review and Research Agenda. Sustain. Futures 2025, 10, 101494. [Google Scholar] [CrossRef] [Scilit]
- Wu, Y.; Hu, P.; Wang, D.D. The AI Annotator: Large Language Models’ Potential in Scoring Sustainability Reports. Systems 2025, 13, 899. [Google Scholar] [CrossRef] [Scilit]
- Kolk, A.; Pinkse, J. Business Responses to Climate Change: Identifying Emergent Strategies. Calif. Manag. Rev. 2005, 47, 6–20. [Google Scholar] [CrossRef] [Scilit]
- Kolk, A.; Levy, D.; Pinkse, J. Corporate Responses in an Emerging Climate Regime: The Institutionalization and Commensuration of Carbon Disclosure. Eur. Account. Rev. 2008, 17, 719–745. [Google Scholar] [CrossRef] [Scilit]
- Stanny, E. Voluntary Disclosures of Emissions by U.S. Firms. Bus. Strategy Environ. 2013, 22, 145–158. [Google Scholar] [CrossRef] [Scilit]
- Giannarakis, G.; Zafeiriou, E.; Sariannidis, N. The Impact of Carbon Performance on Climate Change Disclosure. Bus. Strategy Environ. 2017, 26, 1078–1094. [Google Scholar] [CrossRef] [Scilit]
- Liao, L.; Luo, L.; Tang, Q. Gender Diversity, Board Independence, Environmental Committee and Greenhouse Gas Disclosure. Br. Account. Rev. 2015, 47, 409–424. [Google Scholar] [CrossRef] [Scilit]
- Luo, L.; Tang, Q.; Lan, Y.-C. Comparison of Propensity for Carbon Disclosure between Developing and Developed Countries: A Resource Constraint Perspective. Account. Res. J. 2013, 26, 6–34. [Google Scholar] [CrossRef] [Scilit]
- Xu, W.; Sun, Z.; Ni, H. Transparency Pays: How Carbon Emission Disclosure Lowers Cost of Capital. Econ. Anal. Policy 2024, 83, 165–177. [Google Scholar] [CrossRef] [Scilit]
- Steindl, T.; Habermann, F.; Küster, S. Carbon Disclosures and Information Asymmetry: Empirical Evidence on the Importance of Text in Understanding Numerical Emission Allowance Disclosures. J. Ind. Ecol. 2024, 28, 1883–1899. [Google Scholar] [CrossRef] [Scilit]
- Shao, J.; He, Z. How Does Social Media Drive Corporate Carbon Disclosure? Evidence from China. Front. Ecol. Evol. 2022, 10, 971077. [Google Scholar] [CrossRef] [Scilit]
- Patten, D.M. The Relation between Environmental Performance and Environmental Disclosure: A Research Note. Account. Organ. Soc. 2002, 27, 763–773. [Google Scholar] [CrossRef] [Scilit]
- Clarkson, P.M.; Li, Y.; Richardson, G.D.; Vasvari, F.P. Revisiting the Relation between Environmental Performance and Environmental Disclosure: An Empirical Analysis. Account. Organ. Soc. 2008, 33, 303–327. [Google Scholar] [CrossRef] [Scilit]
- Lombard, M.; Snyder-Duch, J.; Bracken, C.C. Content Analysis in Mass Communication: Assessment and Reporting of Intercoder Reliability. Hum. Commun. Res. 2002, 28, 587–604. [Google Scholar] [CrossRef]
- Maibaum, F.; Kriebel, J.; Foege, J.N. Selecting Textual Analysis Tools to Classify Sustainability Information in Corporate Reporting. Decis. Support Syst. 2024, 183, 114269. [Google Scholar] [CrossRef] [Scilit]
- Li, Q.; Peng, H.; Li, J.; Xia, C.; Yang, R.; Sun, L.; Yu, P.S.; He, L. A Survey on Text Classification: From Traditional to Deep Learning. ACM Trans. Intell. Syst. Technol. 2022, 13, 31. [Google Scholar] [CrossRef] [Scilit]
- Palanivinayagam, A.; El-Bayeh, C.Z.; Damaševičius, R. Twenty Years of Machine-Learning-Based Text Classification: A Systematic Review. Algorithms 2023, 16, 236. [Google Scholar] [CrossRef] [Scilit]
- Giannarakis, G.; Andronikidis, A.; Sariannidis, N. Determinants of Environmental Disclosure: Investigating New and Conventional Corporate Governance Characteristics. Ann. Oper. Res. 2020, 294, 87–105. [Google Scholar] [CrossRef] [Scilit]
- Luo, L.; Tang, Q.; Fan, H.; Ayers, J. Corporate Carbon Assurance and the Quality of Carbon Disclosure. Account. Financ. 2023, 63, 657–690. [Google Scholar] [CrossRef] [Scilit]
- Kalu, J.U.; Aliagha, G.U.; Buang, A. A Review of Economic Factors Influencing Voluntary Carbon Disclosure in the Property Sector of Developing Economies. IOP Conf. Ser. Earth Environ. Sci. 2016, 30, 012010. [Google Scholar] [CrossRef] [Scilit]
- Faisal, F.; Andiningtyas, E.D.; Achmad, T.; Haryanto, H.; Meiranto, W. The Content and Determinants of Greenhouse Gas Emission Disclosure: Evidence from Indonesian Companies. Corp. Soc. Responsib. Environ. Manag. 2018, 25, 1397–1406. [Google Scholar] [CrossRef] [Scilit]
- Du, K.; Mao, R.; Xing, F.; Mengaldo, G.; Cambria, E. Language Models for Environmental, Social, and Governance Analysis: A Review. Inf. Process. Manag. 2026, 63, 104596. [Google Scholar] [CrossRef] [Scilit]
- Zou, Y.; Shi, M.; Chen, Z.; Deng, Z.; Lei, Z.; Zeng, Z.; Yang, S.; Tong, H.; Xiao, L.; Zhou, W. ESGReveal: An LLM-Based Approach for Extracting Structured Data from ESG Reports. J. Clean. Prod. 2025, 489, 144572. [Google Scholar] [CrossRef] [Scilit]
- Li, F. The Information Content of Forward-Looking Statements in Corporate Filings—A Naïve Bayesian Machine Learning Approach. J. Account. Res. 2010, 48, 1049–1102. [Google Scholar] [CrossRef] [Scilit]
- Loughran, T.; McDonald, B. Textual Analysis in Accounting and Finance: A Survey. J. Account. Res. 2016, 54, 1187–1230. [Google Scholar] [CrossRef] [Scilit]
- Kotsantonis, S.; Serafeim, G. Four Things No One Will Tell You About ESG Data. J. Appl. Corp. Finance 2019, 31, 50–58. [Google Scholar] [CrossRef] [Scilit]
- Berg, F.; Kölbel, J.F.; Rigobon, R. Aggregate Confusion: The Divergence of ESG Ratings. Rev. Financ. 2022, 26, 1315–1344. [Google Scholar] [CrossRef] [Scilit]
- Mashrur, A.; Luo, W.; Zaidi, N.A.; Robles-Kelly, A. Machine Learning for Financial Risk Management: A Survey. IEEE Access 2020, 8, 203203–203223. [Google Scholar] [CrossRef] [Scilit]
- Dilling, P.F.A.; Harris, P.; Caykoylu, S. The Impact of Corporate Characteristics on Climate Governance Disclosure. Sustainability 2024, 16, 1962. [Google Scholar] [CrossRef] [Scilit]
- Bingler, J.A.; Kraus, M.; Leippold, M.; Webersinke, N. Cheap Talk and Cherry-Picking: What ClimateBert Has to Say on Corporate Climate Risk Disclosures. Financ. Res. Lett. 2022, 47, 102776. [Google Scholar] [CrossRef] [Scilit]
- Gentzkow, M.; Kelly, B.; Taddy, M. Text as Data. J. Econ. Lit. 2019, 57, 535–574. [Google Scholar] [CrossRef] [Scilit]
- Blei, D.M. Probabilistic Topic Models. Commun. ACM 2012, 55, 77–84. [Google Scholar] [CrossRef] [Scilit]
- Devlin, J.; Chang, M.-W.; Lee, K.; Toutanova, K. BERT: Pre-training of Deep Bidirectional Transformers for Language Understanding. In Proceedings of the 2019 Conference of the North American Chapter of the Association for Computational Linguistics: Human Language Technologies (NAACL-HLT); Association for Computational Linguistics: Minneapolis, MN, USA, 2019; pp. 4171–4186. [Google Scholar] [CrossRef] [Scilit]
- Hassan, T.A.; Hollander, S.; van Lent, L.; Tahoun, A. Firm-Level Political Risk: Measurement and Effects. Q. J. Econ. 2019, 134, 2135–2202. [Google Scholar] [CrossRef] [Scilit]
- Loughran, T.; McDonald, B. When Is a Liability Not a Liability? Textual Analysis, Dictionaries, and 10-Ks. J. Financ. 2011, 66, 35–65. [Google Scholar] [CrossRef] [Scilit]
- Kelly, B.T.; Pruitt, S.; Su, Y. Characteristics Are Covariances: A Unified Model of Risk and Return. J. Financ. Econ. 2019, 134, 501–524. [Google Scholar] [CrossRef] [Scilit]
- Grimmer, J.; Stewart, B.M. Text as Data: The Promise and Pitfalls of Automatic Content Analysis Methods for Political Texts. Polit. Anal. 2013, 21, 267–297. [Google Scholar] [CrossRef] [Scilit]
- Huang, A.H.; Lehavy, R.; Zang, A.Y.; Zheng, R. Analyst Information Discovery and Interpretation Roles: A Topic Modeling Approach. Manag. Sci. 2018, 64, 2833–2855. [Google Scholar] [CrossRef] [Scilit]
- Papoutsi, A.; Sodhi, M.S. A Sustainability Disclosure Index Using Corporate Sustainability Reports. J. Sustain. Res. 2020, 2, e200020. [Google Scholar] [CrossRef] [Scilit]
- OECD. Joint Research Centre-European Commission. Handbook on Constructing Composite Indicators: Methodology and User Guide; OECD Publishing: Paris, France, 2008. [Google Scholar] [CrossRef] [Scilit]
- Greco, S.; Ishizaka, A.; Tasiou, M.; Torrisi, G. On the Methodological Framework of Composite Indices: A Review of the Issues of Weighting, Aggregation, and Robustness. Soc. Indic. Res. 2019, 141, 61–94. [Google Scholar] [CrossRef] [Scilit]
- Becker, W.; Saisana, M.; Paruolo, P.; Vandecasteele, I. Weights and Importance in Composite Indicators: Closing the Gap. Ecol. Indic. 2017, 80, 12–22. [Google Scholar] [CrossRef] [Scilit]
- Booysen, F. An Overview and Evaluation of Composite Indices of Development. Soc. Indic. Res. 2002, 59, 115–151. [Google Scholar] [CrossRef] [Scilit]
- Koo, T.K.; Li, M.Y. A Guideline of Selecting and Reporting Intraclass Correlation Coefficients for Reliability Research. J. Chiropr. Med. 2016, 15, 155–163. [Google Scholar] [CrossRef] [Scilit]
- Hyndman, R.J.; Koehler, A.B. Another Look at Measures of Forecast Accuracy. Int. J. Forecast. 2006, 22, 679–688. [Google Scholar] [CrossRef] [Scilit]


| Company Name (English) | Company Name (Chinese) | Stock Code | Industry Category | City | Country |
|---|---|---|---|---|---|
| North Huajin Chemical Industries Co., Ltd. | 北方华锦化学工业股份有限公司 | 000059 | Petroleum Processing, Coking and Nuclear Fuel Processing Industry | Panjin | China |
| Shenyang Chemical Co., Ltd. | 沈阳化工股份有限公司 | 000698 | Petroleum Processing, Coking and Nuclear Fuel Processing Industry | Shenyang | China |
| Shanxi Meijin Energy Co., Ltd. | 山西美锦能源股份有限公司 | 000723 | Petroleum Processing, Coking and Nuclear Fuel Processing Industry | Taiyuan | China |
| Yueyang Xingchang Petro-Chemical Co., Ltd. | 岳阳兴长石化股份有限公司 | 000819 | Petroleum Processing, Coking and Nuclear Fuel Processing Industry | Yueyang | China |
| Shanxi Blue Flame Holding Company Limited | 山西蓝焰控股股份有限公司 | 000968 | Oil and Gas Extraction Industry | Taiyuan | China |
| China Petroleum & Chemical Corporation | 中国石油化工股份有限公司 | 600028 | Oil and Gas Extraction Industry | Beijing | China |
| Guanghui Energy Co., Ltd. | 广汇能源股份有限公司 | 600256 | Oil and Gas Extraction Industry | Urumqi | China |
| Sinopec Shanghai Petrochemical Company Limited | 中国石化上海石油化工股份有限公司 | 600688 | Petroleum Processing, Coking and Nuclear Fuel Processing Industry | Shanghai | China |
| Yunnan Yunwei Co., Ltd. | 云南云维股份有限公司 | 600725 | Petroleum Processing, Coking and Nuclear Fuel Processing Industry | Kunming | China |
| Shanxi Coking Co., Ltd. | 山西焦化股份有限公司 | 600740 | Petroleum Processing, Coking and Nuclear Fuel Processing Industry | Hongtong (Linfen) | China |
| Geo-Jade Petroleum Corporation | 洲际油气股份有限公司 | 600759 | Oil and Gas Extraction Industry | Haikou | China |
| Yunnan Coal & Energy Co., Ltd. | 云南煤业能源股份有限公司 | 600792 | Petroleum Processing, Coking and Nuclear Fuel Processing Industry | Anning (Kunming) | China |
| CNOOC Limited | 中国海洋石油有限公司 | 600938 | Oil and Gas Extraction Industry | Hong Kong | China |
| Kailuan Energy Chemical Co., Ltd. | 开滦能源化工股份有限公司 | 600997 | Petroleum Processing, Coking and Nuclear Fuel Processing Industry | Tangshan | China |
| PetroChina Company Limited | 中国石油天然气股份有限公司 | 601857 | Oil and Gas Extraction Industry | Beijing | China |
| Basis/Reference Framework | Corresponding Indicator Content | Role in the Evaluation Framework |
|---|---|---|
| The Greenhouse Gas Protocol: A Corporate Accounting and Reporting Standard | Greenhouse gas emission boundaries, Scope 1 and Scope 2 emissions, accounting methods, and reporting boundaries (corresponding to D3 Data Disclosure) | Provides a standardized basis for the accounting and reporting of direct emissions and indirect emissions associated with purchased energy, and clarifies the disclosure scope and norms for basic emissions information. |
| Corporate Value Chain (Scope 3) Accounting and Reporting Standard | Scope 3 emissions, supply chain carbon management, and value chain coverage (corresponding to D3 Data Disclosure and G2 Supply Chain Management) | Provides a specific reference for the disclosure of indirect emissions across upstream and downstream value chains and related management information, and defines the scope and requirements for value-chain carbon disclosure. |
| TCFD recommendations and IFRS S2 Climate-related Disclosures | Governance, strategy, risk management, and metrics and targets (corresponding to D1 Strategy and Targets and B2 Disclosure of Negative Information) | Provides a systematic disclosure framework for corporate climate governance arrangements, strategic responses, risk identification, and performance targets, and standardizes the dimensions of climate-related management disclosure. |
| Characteristics of the petroleum and petrochemical industry | Low-carbon technology development, logistics emission optimization, supply chain emission reduction, and just transition (corresponding to G1 Technological Innovation, G2 Supply Chain Management, and G3 Social Impact) | Reflects the industry-specific characteristics of high emissions, long value chains, and strong transition pressure in the petroleum and petrochemical industry, enhances the industry applicability of the indicator system and its ability to capture differences in disclosure, and addresses the limitations of generic frameworks in industry adaptation. |
| Primary Indicators | Secondary Indicators | Tertiary Indicators |
|---|---|---|
| A. Understandability | A1. Diversity of Expression | A11. Combination of Data and Charts |
| A12. Explanation of Professional Terminology | ||
| A2. Structural Clarity | A21. Index/Table of Contents | |
| B. Reliability | B1. Data Accuracy | B11. Disclosure of Calculation Methods |
| B12. Third-Party Verification | ||
| B2. Disclosure of Negative Information | B21. Emission Increases or Violation Incidents | |
| B22. Risk Disclosure | ||
| C. Comparability | C1. Consistency in Calculation Methods | C11. Cross-Period Consistency |
| C12. Alignment with Industry Standards | ||
| C2. Format Standardization | C21. Stability of Report Format | |
| C22. Data Standardization | ||
| D. Relevance | D1. Strategy and Targets | D11. Emission Reduction Strategy |
| D12. Emission Reduction Targets | ||
| D13. Climate-Related Governance | ||
| D2. Actions and Performance | D21. Emission Reduction Measures | |
| D22. Operation of Emission Reduction Facilities | ||
| D23. Carbon Trading and Offsetting | ||
| D3. Data Disclosure | D31. Scope 1 Emissions | |
| D32. Scope 2 Emissions | ||
| D33. Scope 3 Emissions | ||
| D34. Product Carbon Footprint | ||
| D35. Carbon Intensity Indicators | ||
| E. Completeness | E1. Coverage Scope | E11. Full Value Chain Coverage |
| E12. All Emission Sources | ||
| E2. Level of Detail | E21. Data by Department/Region | |
| E22. Historical Data Comparison | ||
| F. Timeliness | F1. Disclosure Time | F11. Timeliness of Report Disclosure |
| F12. Regular Updates | ||
| G. Industry Specificity | G1. Technological Innovation | G11. Low-Carbon Technology R&D |
| G2. Supply Chain Management | G21. Supplier Carbon Management | |
| G22. Logistics Emission Optimization | ||
| G3. Social Impact | G31. Community Communication | |
| G32. Just Transition |
| Company Name (English) | Company Abbreviation | City | Country | 2022 | 2023 | 2024 |
|---|---|---|---|---|---|---|
| North Huajin Chemical Industries Co., Ltd. | North Huajin | Panjin | China | 31 | 40 | 32 |
| Shenyang Chemical Co., Ltd. | Shenyang Chemical | Shenyang | China | 32 | 38 | 41 |
| Shanxi Meijin Energy Co., Ltd. | Meijin Energy | Taiyuan | China | 48 | 49 | 47 |
| Yueyang Xingchang Petro-Chemical Co., Ltd. | Yueyang Xingchang | Yueyang | China | 9 | 23 | 39 |
| Shanxi Blue Flame Holding Company Limited | Blue Flame Holdings | Taiyuan | China | 7 | 11 | 24 |
| China Petroleum & Chemical Corporation | Sinopec | Beijing | China | 47 | 55 | 56 |
| Guanghui Energy Co., Ltd. | Guanghui Energy | Urumqi | China | 27 | 37 | 33 |
| Sinopec Shanghai Petrochemical Company Limited | Sinopec Shanghai Petrochemical | Shanghai | China | 51 | 51 | 52 |
| Yunnan Yunwei Co., Ltd. | Yunnan Yunwei | Kunming | China | 11 | 10 | 11 |
| Shanxi Coking Co., Ltd. | Shanxi Coking | Hongtong (Linfen) | China | 29 | 29 | 41 |
| Geo-Jade Petroleum Corporation | Geo-Jade Petroleum | Haikou | China | 12 | 26 | 27 |
| Yunnan Coal & Energy Co., Ltd. | Yunnan Coal & Energy | Anning (Kunming) | China | 17 | 26 | 15 |
| CNOOC Limited | CNOOC | Hong Kong | China | 46 | 48 | 49 |
| Kailuan Energy Chemical Co., Ltd. | Kailuan Energy Chemical | Tangshan | China | 18 | 35 | 44 |
| PetroChina Company Limited | PetroChina | Beijing | China | 51 | 53 | 53 |
| Company Name (English) | City | Country | Year | AI-CIDQ | Manual-CIDQ |
|---|---|---|---|---|---|
| China Petroleum & Chemical Corporation | Beijing | China | 2022 | 47 | 48 |
| Sinopec Shanghai Petrochemical Company Limited | Shanghai | China | 2023 | 51 | 52 |
| CNOOC Limited | Hong Kong | China | 2024 | 49 | 50 |
| Shanxi Meijin Energy Co., Ltd. | Taiyuan | China | 2022 | 48 | 49 |
| PetroChina Company Limited | Beijing | China | 2023 | 53 | 54 |
| North Huajin Chemical Industries Co., Ltd. | Panjin | China | 2024 | 32 | 33 |
| Shenyang Chemical Co., Ltd. | Shenyang | China | 2022 | 32 | 33 |
| Guanghui Energy Co., Ltd. | Urumqi | China | 2023 | 37 | 38 |
| Shanxi Coking Co., Ltd. | Hongtong (Linfen) | China | 2024 | 41 | 42 |
| Kailuan Energy Chemical Co., Ltd. | Tangshan | China | 2022 | 18 | 19 |
| Yueyang Xingchang Petro-Chemical Co., Ltd. | Yueyang | China | 2023 | 23 | 24 |
| Shanxi Blue Flame Holding Company Limited | Taiyuan | China | 2024 | 24 | 25 |
| Yunnan Yunwei Co., Ltd. | Kunming | China | 2022 | 11 | 11 |
| Geo-Jade Petroleum Corporation | Haikou | China | 2023 | 26 | 27 |
| Yunnan Coal & Energy Co., Ltd. | Anning (Kunming) | China | 2024 | 15 | 15 |
| Test Indicator | Test Method/Type | Statistical Value | p-Value | Criterion | Result Explanation |
|---|---|---|---|---|---|
| Overall Score Correlation | Pearson | 0.975 | p < 0.001 | r > 0.7 indicates high correlation | LLM-based scores are highly correlated with manual scores at the tertiary-indicator level |
| Overall Score Correlation | Spearman | 0.975 | p < 0.001 | ρ > 0.7 indicates high correlation | High consistency in ranking at the tertiary-indicator level |
| Systematic Bias | Paired t-test | t = −3.007 | 0.003 | p < 0.05 indicates significant difference | LLM-based tertiary-indicator scores are slightly lower than manual scores overall |
| Overall Consistency | ICC (Single Measurement, Absolute Agreement) | 0.974 | p < 0.001 | ICC > 0.75 indicates good consistency | LLM-based scoring consistency is good |
| Mean Absolute Error | MAE | 0.0384 | - | Smaller MAE indicates higher consistency | The average error between LLM-based and manual is approximately 0.0384 |
| Primary Indicator | Pearson | Spearman | p-Value | Correlation Criterion | Test Result |
|---|---|---|---|---|---|
| A. Understandability | 0.977 | 0.984 | <0.001 | Yes | Pass |
| B. Reliability | 1.000 | 1.000 | <0.001 | Yes | Pass |
| C. Comparability | 0.989 | 0.986 | <0.001 | Yes | Pass |
| D. Relevance | 0.998 | 0.992 | <0.001 | Yes | Pass |
| E. Completeness | 0.989 | 0.986 | <0.001 | Yes | Pass |
| F. Timeliness | 1.000 | 1.000 | <0.001 | Yes | Pass |
| G. Industry Specificity | 0.976 | 0.978 | <0.001 | Yes | Pass |
| Statistic | Value |
|---|---|
| Sample Size (N) | 45 |
| Mean | 34.02 |
| Median | 35.00 |
| Standard Deviation | 14.98 |
| Minimum | 7.00 |
| Maximum | 56.00 |
| 25th Percentile (P25) | 24.00 |
| 75th Percentile (P75) | 48.00 |
| Skewness | −0.301 |
| Kurtosis | −1.161 |
| Year | Sample Size (N) | Mean | Median | Standard Deviation | Minimum | Maximum |
|---|---|---|---|---|---|---|
| 2022 | 15 | 29.07 | 29.00 | 16.30 | 7.00 | 51.00 |
| 2023 | 15 | 35.40 | 37.00 | 14.45 | 10.00 | 55.00 |
| 2024 | 15 | 37.60 | 41.00 | 13.72 | 11.00 | 56.00 |
| Company Name (English) | City | Country | 2022 Score | 2023 Score | 2024 Score | Average Score |
|---|---|---|---|---|---|---|
| China Petroleum & Chemical Corporation | Beijing | China | 47 | 55 | 56 | 52.67 |
| PetroChina Company Limited | Beijing | China | 51 | 53 | 53 | 52.33 |
| Sinopec Shanghai Petrochemical Company Limited | Shanghai | China | 51 | 51 | 52 | 51.33 |
| Shanxi Meijin Energy Co., Ltd. | Taiyuan | China | 48 | 49 | 47 | 48.00 |
| CNOOC Limited | Hong Kong | China | 46 | 48 | 49 | 47.67 |
| Shenyang Chemical Co., Ltd. | Shenyang | China | 32 | 38 | 41 | 37.00 |
| North Huajin Chemical Industries Co., Ltd. | Panjin | China | 31 | 40 | 32 | 34.33 |
| Shanxi Coking Co., Ltd. | Hongtong (Linfen) | China | 29 | 29 | 41 | 33.00 |
| Guanghui Energy Co., Ltd. | Urumqi | China | 27 | 37 | 33 | 32.33 |
| Kailuan Energy Chemical Co., Ltd. | Tangshan | China | 18 | 35 | 44 | 32.33 |
| Yueyang Xingchang Petro-Chemical Co., Ltd. | Yueyang | China | 9 | 23 | 39 | 23.67 |
| Geo-Jade Petroleum Corporation | Haikou | China | 12 | 26 | 27 | 21.67 |
| Yunnan Coal & Energy Co., Ltd. | Anning (Kunming) | China | 17 | 26 | 15 | 19.33 |
| Shanxi Blue Flame Holding Company Limited | Taiyuan | China | 7 | 11 | 24 | 14.00 |
| Yunnan Yunwei Co., Ltd. | Kunming | China | 11 | 10 | 11 | 10.67 |
Disclaimer/Publisher’s Note: The statements, opinions and data contained in all publications are solely those of the individual author(s) and contributor(s) and not of MDPI and/or the editor(s). MDPI and/or the editor(s) disclaim responsibility for any injury to people or property resulting from any ideas, methods, instructions or products referred to in the content. |
© 2026 by the authors. Licensee MDPI, Basel, Switzerland. This article is an open access article distributed under the terms and conditions of the Creative Commons Attribution (CC BY) license.
Share and Cite
Yuan, M.; Zhong, M. Carbon Information Disclosure Quality in China’s Petroleum and Petrochemical Enterprises: An LLM Approach. Sustainability 2026, 18, 5089. https://doi.org/10.3390/su18105089
Yuan M, Zhong M. Carbon Information Disclosure Quality in China’s Petroleum and Petrochemical Enterprises: An LLM Approach. Sustainability. 2026; 18(10):5089. https://doi.org/10.3390/su18105089
Chicago/Turabian StyleYuan, Mengyi, and Ma Zhong. 2026. "Carbon Information Disclosure Quality in China’s Petroleum and Petrochemical Enterprises: An LLM Approach" Sustainability 18, no. 10: 5089. https://doi.org/10.3390/su18105089
APA StyleYuan, M., & Zhong, M. (2026). Carbon Information Disclosure Quality in China’s Petroleum and Petrochemical Enterprises: An LLM Approach. Sustainability, 18(10), 5089. https://doi.org/10.3390/su18105089