


Abstract
This manuscript addresses the challenge of designing low-carbon and climate-neutral landscapes. While gardens and green spaces are commonly perceived as environmentally beneficial, they may generate significant greenhouse gas emissions throughout their life cycle. Despite the widespread application of carbon footprint assessment in building design, its integration into landscape architecture remains limited. The aim of this study is to systematize the concept of the garden carbon footprint and to develop a coherent framework for its evaluation. The research adopts a conceptual synthesis approach based on an interdisciplinary literature review, supported by a simplified Life Cycle Assessment (LCA) methodology. A component-based model is proposed, integrating embodied carbon, operational emissions, and carbon sequestration. The results demonstrate that the carbon performance of designed landscapes varies significantly depending on design strategies and management approaches. Importantly, the findings confirm that climate neutrality may be possible under specific conditions, particularly at larger spatial scales. The proposed framework contributes to the integration of carbon footprint assessment into landscape design processes and supports the development of low-emission, climate-resilient solutions.
1. Introduction
The assessment of the environmental impact of architecture has been a subject of scientific research for several decades, encompassing issues of energy efficiency and greenhouse gas emissions throughout the life cycle of buildings [1,2,3,4,5,6]. The construction sector currently accounts for approximately 38% of global carbon emissions, making it one of the key areas for climate mitigation efforts [7,8,9]. In this context, expanding carbon assessment beyond buildings to include all components of the built environment is becoming increasingly necessary. Recent studies indicate that the application of Life Cycle Assessment (LCA) to urban green infrastructure remains methodologically fragmented and lacks standardized approaches, which limits comparability across studies [10].
At the same time, recent research increasingly extends carbon footprint and Life Cycle Assessment (LCA) methodologies to biologically based production systems relevant to landscape architecture, including turfgrass cultivation, nursery production, wetland ecosystems, and bio-based materials [11,12,13,14,15]. These studies demonstrate the importance of greenhouse gas accounting not only in agricultural systems but also in vegetation production and ecological infrastructure, highlighting the growing need for interdisciplinary approaches integrating biological and design-related processes.
Contemporary climate change, driven primarily by anthropogenic greenhouse gas emissions, is characterized by a rapid increase in global mean temperature, estimated at approximately 1.1 °C above pre-industrial levels [16]. Although the Earth’s climate has undergone multiple natural fluctuations over geological timescales, including glacial–interglacial cycles, current warming is distinguished by its unprecedented rate and anthropogenic origin [17,18]. Empirical studies, including satellite-based observations of the Earth’s radiative balance, confirm the role of greenhouse gases such as CO2 and CH4 in driving these processes [17].
In response to these challenges, a range of environmental assessment tools has been developed, including the carbon footprint indicator, which enables the quantification of climate impact across the life cycle of products and systems. To date, such analyses have been applied primarily to the construction sector, while the field of landscape architecture remains relatively underexplored in this context [10,19,20,21].
The carbon footprint is defined as the total greenhouse gas emissions expressed in carbon dioxide equivalent (CO2e), generated over the entire life cycle of a product, service, or system—from raw material extraction, through construction and use, to end-of-life processes. This indicator includes both direct and indirect emissions, enabling a comprehensive assessment of climate impact. The carbon footprint analysis was conducted using a simplified Life Cycle Assessment (LCA) approach in a bottom-up, component-based form, consisting of summing emissions for individual elements of the designed system. This approach, commonly applied in conceptual and design-stage analyses, enables the estimation of emissions in the absence of detailed product-specific data. Such an approach is consistent with recent efforts to adapt lifecycle-based assessment frameworks to urban green infrastructure systems [10,19,20,21].
Emissions of individual greenhouse gases, such as carbon dioxide (CO2), methane (CH4), and nitrous oxide (N2O), are converted into a common unit using Global Warming Potential (GWP) factors, allowing comparison of different emission sources and their combined impact on the climate system. The carbon footprint is typically related to a defined functional unit, such as a building, a product, or a unit of area (e.g., 1 m2), enabling comparative evaluation of design solutions.
The decarbonization of the construction sector is a central objective of contemporary climate policy, particularly in the European context, where it forms part of the European Green Deal strategy aiming to achieve climate neutrality by 2050 [8,9].
Despite the growing importance of carbon footprint assessment in architecture, its application to landscape architecture—particularly garden design—remains limited [10,19,20,21]. Gardens and green spaces are commonly perceived as environmentally beneficial elements; however, their construction and maintenance generate greenhouse gas emissions associated with material production, transport, earthworks, and operational practices [7].
At the same time, these systems demonstrate the capacity to sequester carbon through the accumulation of biomass and soil organic matter, which distinguishes them from many other components of the built environment and introduces additional complexity in assessing their overall climate impact [22,23]. This dual role—as both a source and a sink of emissions—requires the development of coherent analytical frameworks enabling comprehensive life-cycle evaluation.
The aim of this article is to systematize the concept of the garden carbon footprint and to identify the key factors influencing it. The study seeks to develop a structured framework for assessing the carbon performance of designed green spaces, integrating both emission sources and carbon sequestration processes.
By extending carbon footprint analysis beyond the building scale to include landscape architecture, this research contributes to a more comprehensive understanding of environmental impact in spatial design. The proposed approach supports the identification of low-emission design strategies and provides a basis for the development of climate-resilient and potentially climate-neutral landscape solutions.
2. Materials and Methods
A simplified quantitative analysis (screening-level assessment) was conducted for selected types of landscape developments, including a private garden, an urban park, street greenery, and a green roof. The analysis is exploratory in nature and aims to illustrate the proposed model rather than to provide a full empirical assessment.
The study is supported by a critical and interdisciplinary literature review covering architecture, construction, agriculture, urban planning, and environmental sciences. The literature review was conducted using major scientific databases (Scopus, Web of Science, Google Scholar), focusing on publications from the last 10 years, with emphasis on recent studies from the last five years. Sources were selected based on relevance to carbon footprint, LCA, and urban green infrastructure. Keywords included “carbon footprint”, “life cycle assessment”, “sustainable landscape”, “urban climate”, “soil emissions”, and “green infrastructure”. Publications were selected based on their relevance to greenhouse gas emissions, applicability to the built or natural environment, and usefulness for the development of the analytical framework [10,11,12,13,14,15,19,20,21,24,25,26,27,28].
Figure 1 presents the conceptual structure of the proposed methodological framework, including the analytical components, landscape typologies, and principal outputs of the study.
Figure 1.
Conceptual framework of the proposed screening-level LCA methodology applied to selected landscape typologies (by MDPI).
Methodology of Carbon Footprint Analysis in Landscape Architecture
The carbon footprint analysis was conducted using a simplified Life Cycle Assessment (LCA) approach in a bottom-up, component-based form, consisting of summing emissions for individual elements of the designed system [4,5]. This approach, commonly applied in conceptual and design-stage analyses, enables the estimation of emissions in the absence of detailed product-specific data.
A simplified system boundary was defined, consistent with screening-level LCA approaches, encompassing three main stages: construction (embodied carbon), operation (operational carbon), and carbon sequestration processes [4,5,19,20,21]. The construction stage includes emissions related to material production, plant production in nurseries, transport, and construction activities. The operational stage includes emissions associated with maintenance, such as mowing, irrigation, energy and fuel use, replacement of materials and vegetation, and biomass transport. The third component includes carbon sequestration through vegetation growth, soil organic carbon accumulation, and biomass retention [22,23,24].
The functional unit adopted in the analysis is 1 m2 of landscape development, enabling comparative evaluation of different design scenarios.
The carbon footprint was estimated using a simplified balance model:
where
- CF—total carbon footprint (kg or t CO2e),
- E0—initial emissions associated with construction,
- Er—annual operational emissions,
- Sr—annual carbon sequestration,
- n—time horizon (years).
This simplified formulation reflects approaches used in life cycle-based environmental assessments and allows for both short-term and long-term evaluation of landscape performance [19,20,21]. Emission factors were adopted based on scientific literature and recognized LCA databases, including the Inventory of Carbon and Energy (ICE) [29], the ecoinvent database [30], DEFRA guidelines [31], as well as Intergovernmental Panel on Climate Change IPCC [8]. These sources provide widely accepted reference values for material production, transport, and operational emissions. Where direct data for landscape architecture were unavailable, proxy values from the construction and agricultural sectors were used and adjusted to the scale of the analyzed system (Appendix A) [7,22,23,24,28].
The applied method is simplified and intended for order-of-magnitude estimates rather than full ISO 14040/14044-compliant LCA analysis. The main limitations include the use of averaged emission factors, simplified sequestration models, limited consideration of temporal and technological changes, and the absence of detailed product-specific environmental data such as Environmental Product Declarations (EPDs) [4,5,19,20,21]. The proposed framework adopts a component-based approach reflecting the current lack of dedicated carbon accounting tools for landscape architecture [18,19]. This approach enables comparative analysis of design scenarios and identification of the principal factors influencing greenhouse gas emissions. The model is based on a simplified linear representation of annual emissions and carbon sequestration. Although this assumption does not fully reflect real-world ecosystem dynamics, where sequestration and operational emissions change over time due to vegetation growth, maintenance intensity, and technological development, it remains consistent with screening-level LCA methodologies and supports comparative scenario evaluation.
Recent methodological literature emphasizes that simplified, scenario-based, and screening-level LCA approaches are commonly applied in early-stage environmental assessment, particularly in cases characterized by uncertainty, limited product-specific datasets, and conceptual design evaluation. Such approaches are widely used to support comparative analysis, identify dominant emission sources, and facilitate decision-making during preliminary design stages, where the greatest potential for reducing environmental impact exists. The use of generalized model scenarios and sensitivity analysis is also consistent with contemporary prospective and parametric LCA methodologies, which increasingly emphasize flexibility, uncertainty management, and scenario-based environmental evaluation in complex systems [19,20,21].
A basic sensitivity analysis was conducted to assess the influence of key parameters on the final results. Variations in construction emissions, operational emissions, and sequestration rates within a ±20% range indicate that, although absolute values vary, the relative relationships between the analyzed development types remain consistent. These findings confirm that the model is sufficiently robust for identifying general trends and comparing design scenarios, while detailed numerical values should be interpreted with caution. The analyzed cases represent generalized conceptual scenarios rather than real built projects. The calculations were developed as comparative model schemes intended to illustrate different landscape typologies and design strategies. Assumptions regarding materials, technologies, transport distances, maintenance intensity, and operational practices were based primarily on conditions typical for Central and Eastern Europe, particularly Poland. The calculation procedure is presented step by step in the Results section and appendices to ensure reproducibility. The study does not include spatially explicit mapping and is intended primarily as an analytical tool supporting early-stage design evaluation and comparative assessment in landscape architecture. Similar simplified and component-based approaches are commonly applied in preliminary carbon assessment studies where detailed product-specific environmental data are unavailable. During the preparation of this manuscript, the author used ChatGPT (GPT-5.5, OpenAI) for verification of calculations. The author reviewed and edited the output and takes full responsibility for the content of this publication. All numerical analyses were conducted manually using predefined formulas and independently verified by the author. To ensure transparency and reproducibility, all assumptions, emission factors, and calculation procedures are provided in the appendices.
3. Results and Conceptual Background
3.1. Construction Sector as a Reference Framework
The construction sector accounts for a significant share of global greenhouse gas emissions, estimated at approximately 37–39% of total CO2 emissions, of which around 10–12% is associated with embodied carbon, while the remaining share results from building operation (operational carbon) [7,8,9]. For comparison, the transport sector is responsible for approximately 20–25% of global emissions, which highlights the key role of construction in the process of economic decarbonization [8,9].
In the life cycle analysis of buildings, two main components of the carbon footprint are distinguished: operational and embodied. The operational footprint includes emissions associated with the use of a building, including heating, cooling, ventilation, and lighting, and has historically constituted the dominant share of total emissions. The embodied footprint includes emissions associated with raw material extraction, material production, transport, and the construction process [7].
With the progressive improvement of building energy efficiency and the implementation of renewable energy sources, the share of operational emissions is gradually decreasing, which leads to a relative increase in the importance of embodied carbon in the total emissions balance [6,8,32,33]. In the long term, operational emissions are expected to be significantly reduced, and even brought close to zero in net-zero energy buildings, which further increases the importance of emissions related to materials and the construction process.
Construction materials such as concrete, steel, and glass constitute a particularly significant source of embodied emissions. The production of cement, which is the primary component of concrete, accounts for approximately 7–8% of global CO2 emissions [34,35]. Therefore, the importance of tools enabling the assessment of material impacts on the environment is increasing, such as Environmental Product Declarations (EPD), which provide data on emission indicators, including Global Warming Potential (GWP) [33].
The reduction in the operational carbon footprint is primarily based on design decisions made at the early stages of an investment, including, among others, the selection of energy systems, improvement of thermal insulation, and integration of renewable energy sources. The implementation of such solutions at the design stage is significantly more efficient in both economic and environmental terms than their application in existing buildings. Managing the operational carbon footprint is a challenge for developers. It can be reduced to zero or even become negative if a building produces more energy than it consumes and feeds surplus energy back into the grid. The operational carbon footprint arises mainly from the production of energy required, for example, to heat rooms and water. Here again, the issue of building design becomes important—since decisions regarding the heat source or renewable energy production used during operation are made at this stage. The introduction of such solutions at the design stage is much less costly than adapting buildings to sustainable solutions at later stages [32,33].
Architects therefore make use of solutions that allow the reduction in the operational carbon footprint. Already at the design stage, they plan the installation of heat pumps, photovoltaic panels, or ventilation systems with heat recovery. The use of these solutions makes it possible to significantly reduce the consumption of energy from conventional sources, which directly reduces the operational carbon footprint of a building. The choice of windows is also important—architects select those with a low heat transfer coefficient. They also pay attention to wall insulation and use renewable energy, for example by installing PVT panels, which combine photovoltaic panels and solar collectors. These actions show that in order for a building to be low-energy, a wide range of solutions must be used and combined. Modern buildings are therefore able not only to meet the needs of their users, but even to supply energy back to the grid, becoming “energy-positive” [34,35,36,37].
When designing buildings or structures, it is worth paying attention to the materials used during construction. The focus should be on materials that provide the greatest optimization effect in the areas of steel and concrete. The use of materials with the same durability and structural parameters, but with significantly lower emissions due to the use of decarbonized raw materials and optimized compositions, results in a lower environmental burden. Another possible approach is structural optimization, i.e., assessing whether all structural elements are optimized in terms of their cross-sectional dimensions. Environmental impact can be reduced by decreasing the cross-sections of structural elements and using materials with higher strength. Focusing only on concrete, the use of low-carbon concrete can reduce the total embodied emissions of all construction materials by up to 30% [38,39,40].
Considering ongoing climate change, which is increasingly visible and affects all of us, it is advisable to choose construction materials with a lower carbon footprint that generate the least environmental impact. It is also worth relying on verified and approved data sources by using materials with Environmental Product Declarations (EPDs), in which the Global Warming Potential (GWP) value is confirmed, ensuring the reliability of the data verified by the certifying body. The emissions of construction materials most often originate from two sources. The first is the electricity used in the production process, which depends on the energy mix. In this area, producers of construction materials are dynamically working on shifting the proportion of energy from hydrocarbons to renewable sources, such as wind or solar energy. The second source is process emissions resulting from chemical reactions, most often exothermic, in which CO2 is generated as a by-product. In this case, the only way to significantly reduce environmental impact is through the use of carbon capture and storage/utilization technologies (CCS/CCUS) or hydrogen-based technologies. Investments in these technologies are unavoidable in the near future.
On 7 January 2025, the revised Construction Products Regulation (CPR) (EU) 2024/3110 entered into force in the European Union and became generally applicable from 8 January 2026. The regulation fundamentally changes the structure of declarations of performance and introduces the Digital Product Passport (DPP), requiring manufacturers to provide environmental performance data for construction products throughout their life cycle. The CPR aims to improve transparency and accessibility of product information for all participants in the construction process. In the coming years, manufacturers will also be required to declare additional environmental impacts, including effects on air, water, and climate-related indicators [41].
In this context, extending carbon footprint analyses beyond the building sector to the field of landscape architecture becomes particularly important. Although gardens and green spaces are commonly perceived as having a positive environmental impact, their implementation and maintenance are associated with greenhouse gas emissions which—analogously to buildings—can be divided into embodied and operational emissions [8].
The embodied carbon of a garden includes emissions associated with site preparation, the production and transport of materials (such as surfaces, small architectural elements, or substrates), as well as the production of plant material. An important factor is also soil disturbance and the removal of existing vegetation, which may lead to the release of previously stored organic carbon [21]. The operational carbon of a garden is associated with its maintenance and includes, among others, mowing, irrigation, fertilization, and other maintenance activities. Unlike buildings, where emission reduction is mainly based on technological solutions, in landscape systems design decisions that reduce maintenance intensity are of key importance [18].
At the same time, gardens, unlike most elements of the built environment, demonstrate the ability to sequester carbon through the accumulation of biomass and organic matter in the soil. This introduces an additional dimension of analysis, in which not only the level of emissions is important, but also the net carbon balance over the entire life cycle of the development [21].
In view of the above, it is justified to adopt a division of the carbon footprint analogous to that used in the construction sector also for gardens, while taking into account their specificity as biological systems. This approach forms the basis for further analyses and the development of design strategies aimed at reducing emissions and, in the long term, achieving carbon neutrality or a negative carbon balance.
3.1.1. Agriculture
The agricultural sector constitutes one of the key sources of greenhouse gas emissions, accounting for a significant share of global emissions, in particular methane (CH4) and nitrous oxide (N2O), associated with plant and animal production. Carbon footprint analysis in agriculture covers the entire life cycle of production, taking into account processes such as cultivation, fertilization, livestock breeding, processing, and transport of products [42,43].
At the same time, agriculture has significant potential for emission reduction through the implementation of sustainable practices, such as reducing mineral fertilization, optimizing water management, or developing regenerative agriculture aimed at increasing soil organic carbon content [22,23,24,43].
In this context, agriculture constitutes an important reference point for carbon footprint analyses in landscape architecture. Similarly to food production, biological processes related to soil, vegetation, and material cycles also occur in gardens and green spaces, directly affecting greenhouse gas emissions. Gardens, despite their smaller scale, use analogous practices such as fertilization, irrigation, and vegetation management. Each of these activities may generate emissions, for example through the release of nitrous oxide from soil, energy consumption associated with irrigation, or the use of chemical agents. At the same time, similarly to regenerative agriculture, appropriate management of soil and vegetation may lead to an increase in the system’s capacity for carbon sequestration [22,23,24].
The analogy to agriculture also indicates the key role of land-use practices. Intensively managed systems, requiring regular maintenance interventions, are characterized by higher emission levels, whereas extensive systems, based on natural processes, may significantly reduce the carbon footprint and even function as local carbon sinks. In this perspective, a garden may be interpreted as a specific type of biological–production system, in which energy and material flows, as well as interactions between human activity and ecological processes, are of key importance. For this reason, carbon footprint assessment methods developed in agriculture may constitute an important reference point for the development of analytical tools in landscape architecture.
3.1.2. City Scale
The carbon footprint of a city results from the interaction of multiple interdependent systems, including transport, energy consumption, waste management, infrastructure, consumption, and the structure of green spaces. Unlike individual objects, a city functions as a complex system in which individual components interact with each other, influencing the overall balance of greenhouse gas emissions [44,45,46].
An important role in shaping the carbon footprint of a city is played by residents’ lifestyles and the way space is organized. One of the concepts aimed at reducing emissions is the idea of the 15 min city, which assumes organizing the urban structure in such a way that the basic needs of residents can be met within a short walking distance. An important factor shaping the city’s carbon footprint is both the way space is developed and the lifestyle of its inhabitants. Planning concepts such as the 15 min city model assume a reduction in transport demand through the localization of functions within walking distance, preferably through green spaces. This solution allows for reducing transport and increasing the share of biologically active areas [39,47].
It is also worth mentioning the “3-30-300” principle, proposed by Konijnendijk [48], according to which every resident should have a view of at least three trees from their place of residence or work, 30% tree canopy cover in the immediate surroundings, and access to green spaces within a distance of no more than 300 m. This concept constitutes a practical tool integrating climate mitigation actions with the improvement of residents’ mental well-being. In particular, the importance of large trees is emphasized, as they have a disproportionately high impact on emotional comfort and quality of life in urban space [49]. Simulation studies indicate that increasing the share of street vegetation by 30% may lead to a reduction in cooling demand during the summer period by as much as 30–100%, as well as a reduction in building heating costs by 10–20% [50,51,52]. Additionally, it has been shown that the presence of urban trees may contribute to reducing household energy consumption for cooling by 5 to 20% [50,51,52,53].
One of the key phenomena affecting the urban microclimate is the urban heat island effect, resulting from the accumulation of energy by surfaces with high thermal capacity, such as concrete, asphalt, or stone, which heat up during the day and release heat at night, increasing air temperature. This phenomenon can be mitigated by increasing the share of greenery, using materials with high albedo (e.g., light-colored roof surfaces), or maintaining ventilation corridors [54,55,56,57].
Green spaces, including parks and gardens, perform a multidimensional environmental function in the city. Medium and tall vegetation contributes to temperature reduction through surface shading and transpiration and also improves air quality by capturing pollutants. Greenery also reduces surface runoff of rainwater, supporting local retention and reducing the risk of flooding. Contemporary approaches to urban planning increasingly incorporate nature-based solutions, such as rain gardens, retention systems, or permeable surfaces, which support climate change adaptation [58,59,60,61,62,63,64]. At the same time, a shift away from previous practices of excessive surface sealing, such as “concreted” urban squares, toward restoring greenery and natural processes is being observed.
The possibilities of dynamically managing urban lighting also constitute an important element of reducing the carbon footprint at the city scale. Modern lighting systems, based on LED technology, enable the adjustment of light intensity to the actual needs of space users throughout the day. Lighting can be programmed to reach its highest intensity during periods of peak activity—in the evening and morning hours—when pedestrian and vehicular traffic is highest. During nighttime hours, when traffic is lower, it is possible to automatically reduce lighting levels (so-called dimming), which allows for a significant reduction in energy consumption [65,66,67].
Additionally, these systems may be integrated with motion sensors that temporarily increase light intensity when a user is detected, ensuring safety while limiting energy use during periods of inactivity. Such solutions are part of the concept of smart city systems, enabling the optimization of energy consumption without reducing the quality of public space. The use of adaptive LED lighting contributes not only to the reduction in greenhouse gas emissions but also to limiting light pollution, which is important for the functioning of urban ecosystems and the comfort of residents. In the context of the city’s carbon footprint, these solutions constitute an example of actions in which proper management of technical infrastructure leads to real energy and environmental savings.
Individual decisions of residents are also significant, such as reducing consumption, reusing resources, or making conscious purchasing choices, which are consistent with the principles of the circular economy [68,69,70,71].
3.2. Carbon Footprint in Landscape Architecture: Analytical Models and Design Implications
3.2.1. Private Garden
The carbon footprint analysis in landscape architecture was carried out using the example of a typical private garden, treated as a computational model that can be adapted to real projects (Appendix B). In this study, a garden with an area of 500 m2 was assumed, including 200 m2 of lawn, 150 m2 of perennial and shrub beds, 100 m2 of mineral surface, 30 m2 of a wooden terrace, and 20 m2 of a path made of prefabricated concrete slabs. The plant structure includes the planting of 5 deciduous trees, 25 shrubs, and 200 perennials and ornamental grasses.
In terms of materials and construction, the model includes the execution of a mineral surface based on aggregates, the construction of a wooden terrace, the use of prefabricated concrete slabs, as well as the delivery of 10 m3 of topsoil, 8 m3 of aggregates, and 5 m3 of mulch, using light construction equipment. The assumed operation model includes mowing the lawn with a petrol mower, moderate irrigation, no use of mineral fertilizers, and partial on-site composting of biomass.
The calculation methodology is based on four components: initial emissions associated with construction, annual emissions resulting from use, CO2 sequestration potential by vegetation and soil, and the total balance analyzed both in the first year of operation and over a 20-year horizon. The adopted values are indicative but reflect realistic design and construction parameters.
The carbon footprint was calculated according to Equation (1).
Initial emissions associated with the construction of the garden result primarily from the materials used and the scope of construction works. Surfaces and structural elements have the largest share. In the case of a path made of prefabricated concrete slabs with an area of 20 m2, with an emission factor of approximately 35 kg CO2e/m2, the total emission amounts to 700 kg CO2e. A mineral surface with an area of 100 m2 generates approximately 1200 kg CO2e, assuming emissions of 12 kg CO2e/m2 for structural layers. The wooden terrace (30 m2), calculated conservatively without accounting for carbon storage in the material, accounts for approximately 450 kg CO2e.
Bulk materials also have a significant share: the transport and application of 10 m3 of topsoil generate approximately 250 kg CO2e, while 8 m3 of aggregates generate approximately 144 kg CO2e. Mulch (5 m3) accounts for relatively low emissions of approximately 50 kg CO2e. The production and transport of plants are also not emission-neutral—together, for the assumed planting structure (5 trees, 25 shrubs, 200 perennials), they amount to approximately 350 kg CO2e. Additionally, emissions related to the use of construction equipment and transport must be considered, which in this case were estimated at 250 kg CO2e. In total, initial emissions for the construction of the garden amount to approximately 3394 kg CO2e, i.e., about 3.4 t CO2e.
In the operational phase, emissions are significantly lower but recurring in nature. Mowing a 200 m2 lawn using a petrol mower (approx. 20 cycles per year) generates approximately 40 kg CO2e annually. Irrigation, including water and energy consumption, accounts for approximately 25 kg CO2e per year, while routine maintenance activities and the use of small equipment account for approximately 20 kg CO2e. Additional emissions associated with material replenishment and minor replanting amount to approximately 30 kg CO2e per year. At the same time, partial on-site composting of biomass reduces emissions by approximately 15 kg CO2e annually. As a result, total emissions associated with garden operation amount to approximately 100 kg CO2e per year.
At the same time, the garden functions as a carbon sink, although the scale of this phenomenon depends on the vegetation structure and the mode of use. In the analyzed case, 5 young deciduous trees absorb a total of approximately 90 kg CO2 per year. Perennial and shrub beds with an area of 150 m2, due to biomass accumulation and improved soil properties, bind approximately 53 kg CO2 annually. The lawn, despite intensive mowing, also stores small amounts of carbon in the soil—approximately 20 kg CO2 per year. The total sequestration potential is therefore approximately 163 kg CO2 annually.
A comparison of emissions and sequestration indicates that in the operational phase the garden begins to function as a small net carbon sink—the annual balance amounts to approximately +63 kg CO2. However, this implies the need to “offset” emissions generated during the construction phase. With initial emissions of 3394 kg CO2e and an annual positive balance of 63 kg CO2, the time required to balance the carbon footprint is approximately 54 years.
In the analyzed variant, the garden offsets emissions associated with the construction phase only after approximately 54 years.
The assessed garden is characterized by a moderately high initial footprint, resulting primarily from the use of concrete, the construction of structural layers of surfaces, and the transport of mineral materials and substrates. In the operational phase, it functions relatively efficiently; however, the rate of offsetting investment-related emissions remains low.
The balance of the same layout could be significantly improved by reducing the area of paths made of concrete slabs from 20 m2 to 8 m2, limiting the lawn from 200 m2 to 100 m2, increasing the area of beds and plantings from 150 m2 to 230 m2, introducing three additional trees, using permeable surfaces with lighter construction, and reducing operational emissions by replacing the petrol mower with an electric device or by mowing less frequently.
In such a variant, initial emissions could be reduced to approximately 2.5 t CO2e, while the annual net sequestration balance could increase to approximately 180–250 kg CO2, which would shorten the compensation time to approximately 10–15 years or, under more conservative assumptions, to several to twenty years.
For the analyzed variant, after 20 years the balance amounts to 2134 kg CO2e, which means that the garden has still not compensated approximately 2.13 t CO2e of the investment-related footprint.
A comparison of two variants of private garden development—a traditional (Figure 2) and a naturalistic one (Figure 3)—was also carried out (Table 1). In both cases, a garden of 500 m2 and similar functional use was analyzed, differing, however, in the share of surfaces, vegetation structure, and intensity of use.
Figure 2.
Traditional home garden with a high carbon footprint, Lublin region, Poland [photo M. Dudkiewicz-Pietrzyk, 2025].
Figure 3.
Naturalistic garden with a low carbon footprint, Lublin region, Poland [photo M. Dudkiewicz-Pietrzyk, 2025].
Table 1.
Garden carbon footprint—comparison. Source: author’s own calculations based on emission factors derived from ICE [25], ecoinvent [26], DEFRA [27], IPCC data, and literature sources [21,22,23,24].
The traditional variant, based on a larger share of lawn (200 m2) and surfaces, generates initial emissions at the level of approximately 3.39 t CO2e, with an annual positive balance of only 63 kg CO2, which translates into a compensation time of approximately 54 years and still a positive balance after 20 years (approx. 2.13 t CO2e).
In contrast, the naturalistic variant, assuming a reduction in lawn area (100 m2), a reduction in surfaces, an increase in bed area (230 m2), and a higher number of trees (8), achieves lower initial emissions (approx. 2.56 t CO2e), while at the same time demonstrating a significantly higher sequestration potential (approx. 277 kg CO2/year) and lower operational emissions (approx. 53 kg CO2e/year). As a result, the annual positive balance amounts to approximately 224 kg CO2, and the compensation time is reduced to approximately 11–12 years; moreover, within a 20-year horizon, the garden achieves a negative total balance (approx. −1.92 t CO2e), becoming a net carbon sink.
These results clearly indicate that the key factors in reducing the carbon footprint are: limiting high-emission materials (especially concrete and substructures), reducing the area of intensively managed lawn in favor of, for example, ground-cover vegetation, increasing the share of durable perennial vegetation, and minimizing operational inputs by designing gardens with lower maintenance requirements.
Detailed calculation data for both variants are presented in Appendix C.
3.2.2. Urban Park
The analysis of the carbon footprint at the scale of an urban park requires consideration of significantly greater complexity than in the case of private gardens, both in terms of the scope of works and the long-term functioning of the ecosystem (Figure 4 and Figure 5). In this study, a model of a neighborhood–district park with an area of 5 ha (50,000 m2) was adopted, including a diversified spatial structure: recreational lawns (20,000 m2), extensive meadows (12,000 m2), groups of trees and shrubs (10,000 m2), mineral pathways (4000 m2), hard surfaces (2000 m2), rain gardens (1000 m2), and entrance and infrastructural zones (1000 m2). The plant structure includes 250 trees, 2500 shrubs, and 12,000 perennials and grasses, while the scope of construction works includes, among others, the movement of 2500 m3 of soil, the use of 2000 m3 of aggregates, and the implementation of technical infrastructure and small architectural elements (Appendix D).
Figure 4.
Urban park with a high carbon footprint, Warsaw, Poland (photo M. Dudkiewicz-Pietrzyk, 2025).
Figure 5.
Naturalistic park with a low carbon footprint, Warsaw, Poland (photo M. Dudkiewicz-Pietrzyk, 2025).
The analysis was carried out using the model defined in Equation (1).
At the construction stage, total emissions were estimated at approximately 387 t CO2e, with the largest share attributed to hard surfaces (approx. 76,000 kg CO2e), mineral pathways (56,000 kg CO2e), earthworks and transport (60,000 kg CO2e), and accompanying infrastructure, including lighting and small architecture (45,000 kg CO2e). Bulk materials also have a significant share (over 90,000 kg CO2e in total), as well as plant production (approx. 29,000 kg CO2e).
In the operational phase, annual emissions amount to approximately 26.2 t CO2e, with the largest share attributed to lawn mowing (9 t CO2e/year), lighting (8 t CO2e/year), and vegetation maintenance and irrigation (approx. 7.5 t CO2e/year in total). At the same time, the park demonstrates the capacity to absorb carbon dioxide at a level of approximately 19.4 t CO2 annually, mainly due to the presence of trees, shrub biomass, and soil processes. As a result, the annual balance in the initial period of operation remains negative and amounts to approximately −6.8 t CO2e/year, which means that a young park constitutes a net emission source.
The analysis over a 20-year horizon, assuming constant parameters, indicates a persistent positive carbon footprint at the level of approximately 523 t CO2e. This result is due to high initial emissions and a relatively low level of sequestration in the first years of operation, when trees and soil systems have not yet reached full efficiency. However, the static model does not reflect the actual dynamics of the park ecosystem. As the system matures, an increase in CO2 sequestration capacity and a decrease in maintenance intensity are observed. Assuming a reduction in operational emissions to approximately 20 t CO2e/year and an increase in sequestration to approximately 38 t CO2/year, the park achieves a positive annual balance (+18 t CO2/year), which allows for the compensation of construction emissions within approximately 20–25 years. Detailed calculation data for both variants are presented in Appendix C.
3.2.3. Street Greenery
Street greenery constitutes a specific case in landscape architecture, functioning within a highly transformed technical environment, where habitat conditions are limited and the share of infrastructure is disproportionately high relative to biologically active surfaces. In this study, a model of a street section 500 m long and covering an area of approximately 9000 m2 was adopted, including the roadway, parking spaces, sidewalks, and green strips with a total area of 1500 m2.
The analysis considers a variant of typical street plantings, including 60 trees, 900 shrubs, and 2500 perennials and grasses, implemented under urban conditions requiring local soil replacement, the use of structural substrates, aeration and irrigation systems, and interference with existing infrastructure (Appendix E).
Emissions associated with the implementation of such a layout amount to approximately 66 t CO2e. The largest share is attributed to earthworks and soil preparation (approx. 10.5 t CO2e), technical and protective elements (approx. 20 t CO2ee in total), demolition and reconstruction of surfaces (approx. 15 t CO2e), and transport and the use of equipment (approx. 9 t CO2e). Emissions directly related to plant material are relatively lower and amount to approximately 9 t CO2e in total.
In the operational phase, annual emissions are estimated at approximately 7.0 t CO2e, with the main sources being irrigation (2.5 t CO2e/year), plant maintenance (approx. 2.7 t CO2e/year in total), cleaning and biomass removal (1.0 t CO2e/year), and replenishment of plantings (0.8 t CO2e/year). At the same time, the CO2 sequestration potential of the analyzed green system is relatively limited and amounts to approximately 1.66 t CO2 per year. This results from the difficult growth conditions of street trees, limited soil volume, and environmental pressures related to drought, salinity, and soil compaction.
As a consequence, in the initial period of operation, the annual balance remains clearly negative and amounts to approximately −5.34 t CO2e/year. An analysis over a 20-year horizon, assuming constant parameters, indicates a persistently positive total balance at the level of approximately 173 t CO2e.
Assuming a reduction in maintenance emissions to approximately 4.5 t CO2e/year and an increase in sequestration to approximately 5.5 t CO2/year, street greenery achieves a positive annual balance (+1.0 t CO2/year). Nevertheless, the time required to offset construction-related emissions remains long, amounting to approximately 66 years.
The carbon footprint for street greenery was calculated according to Equation (1). For the analyzed variant, the model takes the following numerical form:
which simplifies to
This indicates that, under the dynamic scenario, the system gradually offsets construction-related emissions over time.
For comparison, in the static scenario, the relationship can be expressed as
which simplifies to
This means that, in the static model, the carbon footprint remains positive and increases over time.
In the dynamic variant, taking into account the maturation of plantings, the relationship can be expressed as CF = 66 + (4.5 × n) − (5.5 × n), i.e., CF = 66 − 1.0n. In this approach, street greenery gradually begins to offset construction-related emissions, although the time required to achieve neutrality remains long.
3.2.4. Roof Garden
Roof gardens constitute a specific form of green space development in the urbanized environment, combining biological functions with the structural system of a building. Their assessment in terms of carbon footprint requires consideration not only of vegetation and ecological processes, but also of complex technical layers and increased construction and operational inputs (Figure 6 and Figure 7).
Figure 6.
Intensive rooftop garden with a high carbon footprint, Wrocław, Poland (photo M. Dudkiewicz-Pietrzyk, 2025).
Figure 7.
Extensive rooftop garden with a low carbon footprint, Lublin, Poland (photo M. Dudkiewicz-Pietrzyk, 2025).
Based on a model example of a roof garden with an area of 100 m2, it was found that the initial emissions associated with construction amount to approximately 3.7 t CO2e (Appendix F). The largest share is attributed to technical layers (waterproofing, drainage, substrates), structural elements (e.g., terrace systems and planters), and the transport of materials to the roof. Compared to ground-level gardens, the importance of highly processed materials and logistical processes increases significantly.
Annual emissions associated with operation were estimated at approximately 0.20 t CO2e/year and result mainly from irrigation, plant maintenance, replenishment of plantings, and maintenance of technical systems. At the same time, the CO2 sequestration potential of the vegetation and substrate is limited and amounts to approximately 0.04 t CO2/year, due to the small substrate volume and limited biomass development under roof conditions. As a consequence, the annual balance of the roof garden remains negative and amounts to approximately −0.16 t CO2e/year, which means that this development functions as a net source of emissions throughout the analyzed period. Over a 20-year horizon, the total carbon footprint reaches approximately 6.9 t CO2e, confirming that the roof garden does not offset the emissions associated with its construction in the adopted static model. Detailed calculation data and adopted model assumptions are presented in Appendix F.
3.2.5. Comparative Analysis of Development Types
In order to illustrate the proposed analytical framework, a simplified assessment of four model types of landscape developments was carried out: a private garden, an urban park, street greenery, and an extensive green roof (Table 2).
Table 2.
Assumptions of model cases. Source: author’s own elaboration based on literature and simplified LCA assumptions [20,21,22,23,24,25,26,27,28,50,51,52,53,54,58].
The calculations used simplified emission factors of a screening-level nature, based on LCA literature, current emission reporting factor datasets, and sequestration indicators for urban greenery. For emissions from fertilization, the default IPCC factor EF1 = 0.010 kg N2O–N/kg N was adopted, and a value of GWP100 = 273 was used to convert N2O to CO2e.
As a reference point for tree sequestration, an average net value of 0.205 kg C/m2 of tree cover/year was adopted, corresponding to approximately 0.75 kg CO2/m2 of tree cover/year. For the green roof, the adopted values were verified against the range of results from an LCA review, which for the “climate change” category amounts to 3.08–155.88 kg CO2eq/m2.
The lowest net result over a 20-year period was achieved by the urban park, which was the only case to reach a slightly negative emissions balance (Table 3). This results from a relatively high sequestration potential associated with a large share of tall vegetation and moderate maintenance intensity. This outcome confirms that at a larger spatial scale, while preserving existing natural resources and limiting the share of surfaces and earthworks, landscape developments can approach climate neutrality and even exceed it.
Table 3.
Carbon balance results. Source: author’s own elaboration based on literature and simplified LCA assumptions [20,21,22,23,24,25,26,27,28,50,51,52,53,54,58].
The private garden achieved a result of 10.6 t CO2e over 20 years, corresponding to 21.2 kg CO2e/m2 (Table 4). In this case, the operational phase was of the greatest importance, primarily related to mowing, irrigation, and fertilization. This result indicates that even relatively small developments may generate significant emissions if they are intensively maintained and the share of lawn and elements requiring regular care remains high.
Table 4.
Comparative summary of assumptions and carbon balance for analyzed landscape development types. Source: author’s own elaboration based on literature and simplified LCA assumptions [20,21,22,23,24,25,26,27,28,50,51,52,53,54,58].
Street greenery reached 11.0 t CO2e over a 20-year horizon; however, when recalculated per unit area, it achieved a significantly lower value than the private garden (3.7 kg CO2e/m2). This means that despite relatively high initial emissions associated with site preparation, transport, and technical infrastructure, the presence of trees and the limited area requiring intensive maintenance improve the overall balance. In practice, this indicates that linear greenery can perform an important climatic function, although its balance largely depends on the scale of earthworks and the degree of surface sealing in the surroundings.
The highest unit carbon footprint was recorded for the extensive roof garden: 6.88 t CO2e over 20 years, i.e., 68.8 kg CO2e/m2. In this case, embodied emissions associated with technical layers, substrate, drainage, and material transport were dominant, while the sequestration potential remained relatively low. Nevertheless, the obtained result falls within the broad range of values reported in the literature for green roofs, which strengthens the reliability of the adopted estimate.
The presented values should be interpreted as preliminary, screening-level estimates, intended to compare relative differences between types of landscape developments rather than as full, detailed LCA analyses for specific projects.
The comparison of the four types of developments indicates that the magnitude of the carbon footprint of a garden or green space is primarily determined by three factors:
- –
- the scale of initial emissions, related to materials, transport, and earthworks;
- –
- maintenance intensity, including mowing, irrigation, and fertilization;
- –
- carbon sequestration capacity, mainly dependent on the share of tall vegetation and soil quality.
To facilitate comparison between the analyzed development types, a summary of the main assumptions and results is presented in Table 4.
The results confirm that developments with a high share of trees, a limited number of technical elements, and an extensive maintenance model achieve a significantly more favorable climate balance than highly processed, intensively used systems or those with a high share of structural layers.
The presented values should be interpreted as illustrative scenario-based estimates rather than precise performance benchmarks. They are intended to support comparative analysis and design decision-making at the conceptual stage.
3.3. Sustainable Landscape Architecture: From Natural Conditions to Implementation
At the garden scale, the carbon footprint is shaped by the entire sequence of design decisions—from the recognition of existing conditions, through the selection of materials and plants, to the method of implementation and subsequent maintenance. A garden, similarly to a building, can be analyzed in terms of its life cycle; however, its specificity lies in its close relationship with natural processes such as plant growth, water retention, carbon sequestration, and soil transformations. Unlike many other elements of the built environment, a garden can therefore not only generate emissions but also partially offset them, functioning as a local carbon sink [20,21,22,23,24,28].
The starting point for designing a low-carbon garden should be the maximum use of the site’s natural conditions. Local environmental conditions—such as topography, existing vegetation, hydrological relations, solar exposure, shading, and wind directions—are among the most important factors influencing the future environmental balance of the development. The greater the degree of adaptation of the design to existing features, the lower the need for intensive land transformation, earthworks, and compensatory solutions. This means that already at the stage of site selection and analysis, the embodied carbon footprint of the investment can be significantly reduced [1,3,25,26,27,28,64].
The location of the garden is also important in both climatic and logistical terms. Local climatic conditions influence plant selection, water demand, and future maintenance needs. In turn, the distance from sources of construction materials and plant nurseries affects transport-related emissions. Although transport does not always constitute the largest share of the total carbon footprint, the selection of local materials and plants from nearby regions can noticeably reduce the emissions associated with implementation. This is particularly important in the case of heavy materials such as stone, aggregates, concrete prefabricates, or large tree specimens [6,7,29,30,31,35].
One of the fundamental actions for reducing a garden’s carbon footprint is the preservation of existing natural resources, especially mature trees, soils with high organic matter content, and natural depressions that support retention. For this reason, the design of a low-emission garden should be based more on adaptation and transformation than on complete “resetting” of the site and creating a layout from scratch. In particular, it is essential to preserve mature trees and soils rich in organic matter. Their removal or intensive disturbance of the soil profile leads to the release of stored carbon and the loss of the system’s sequestration capacity [22,23,24,53,72,73,74]. Therefore, the design of low-carbon gardens should primarily rely on adapting and transforming existing structures rather than on complete reconstruction of the site. The loss of functioning carbon sinks, such as soil and mature trees, is a process that is difficult to reverse and may require decades.
An important element is also the appropriate orientation of garden structures and vegetation in relation to cardinal directions. In the climatic conditions of Central Europe, it is beneficial to use deciduous vegetation on the southern and south-western sides, where it reduces overheating in summer and, after leaf fall, allows solar radiation to reach the building in winter. Evergreen vegetation and protective layouts on the side of prevailing winds can reduce heat loss and improve microclimatic conditions around buildings. In this sense, the garden becomes not only an aesthetic space but also an active tool for shaping environmental conditions in the immediate surroundings of the building [1,3,50,51,52,53].
The carbon footprint of a garden is strongly influenced by material selection. As in construction, key importance is attached to materials that are local, durable, minimally processed, and reusable. Low-carbon design should limit the use of highly processed and energy-intensive materials, especially where their function can be replaced by natural or secondary solutions. This applies in particular to surfaces, edging, walls, small architectural elements, and support structures. The use of recycled materials is also gaining importance, as—similarly to examples from Danish architecture—they can serve not only as a strategy for emission reduction but also as an impulse for more creative design [6,7,29,30,31,35,70,71,75].
In the context of gardens, a particularly important group of materials are biogenic materials, i.e., those derived from living organisms, such as wood, plant fibers, bark, wood chips, and other organic materials. Their importance lies not only in their relatively low carbon footprint during production but also in the fact that they contain carbon previously absorbed from the atmosphere through photosynthesis. However, it should be emphasized that their environmental assessment requires analysis of the entire life cycle, as the benefits of temporary carbon storage may be partially lost during decomposition, combustion, or improper end-of-life management. Therefore, the use of biogenic materials should be accompanied by design for durability, reuse potential, and appropriate end-of-life scenarios [6,7,28,35,75].
Another important factor is the carbon footprint associated with the production and transport of plants. Intensive nursery production, including fertilization, irrigation, and the use of plant protection products, generates greenhouse gas emissions. Additionally, the transport of plants—especially large trees and imported species—can significantly increase the total carbon footprint of an investment. In this context, the selection of plant material, including its origin, size, and growth rate, becomes particularly important, as these factors influence long-term carbon sequestration capacity [13,14,28].
Water-related solutions are also an essential component of a low-carbon garden. Reducing water consumption directly translates into lower operational carbon emissions, especially in gardens requiring intensive irrigation. The primary strategy should be the use of rainwater for irrigation and the support of bioretention through appropriate landform design, plant selection, and increasing the share of permeable surfaces. Decentralized actions at the plot scale that retain water at its source are of key importance. Solutions such as rain gardens, retention basins, infiltration swales, ponds, infiltration ditches, as well as green roofs and walls, help reduce stormwater runoff and increase resilience to drought periods. Designing with consideration of runoff, retention, and infiltration zones can significantly reduce the demand for external water while improving the local microclimate [60,61,62,63,64,72,76,77,78].
The construction phase also plays an important role in the carbon footprint of a garden. It includes earthworks, on-site material transport, the use of construction equipment, surface preparation, installation of small architectural elements, and all activities related to site organization. The greater the degree of land transformation and the more complex the spatial layout, the higher the emissions at the construction stage. Therefore, reducing unnecessary earthworks, simplifying construction solutions, and using existing topography can be among the simplest and most effective strategies for lowering embodied carbon [20,21,28,29,30,31,76].
To harmoniously co-create the landscape, each project should derive from its broader spatial context. Even if a site is enclosed by a fence, it remains part of a larger whole and should relate to its character. It is therefore justified to use local materials, such as limestone in areas of former quarries or sandstone where it naturally occurs. The use of locally available resources not only supports aesthetic coherence but also reduces costs and supply chain distances, eliminates the need for material storage, and contributes to lowering the carbon footprint of the investment.
As in the case of buildings, it is also justified to apply a life cycle assessment (LCA) approach to gardens [4,5,20,21,28,76]. This allows for consideration of the full range of emissions—from raw material extraction and material production, through transport, construction, and use, to the end-of-life phase of individual components. In the case of gardens, however, it is necessary to adapt the methodology to the specific nature of the object, taking into account biological variability, plant growth, temporal carbon sequestration, and the dynamic character of soil and water processes. The functional unit may, for example, be 1 m2 of garden used over a specified period or the entire garden development with a defined function and period of use.
Knowledge of the carbon footprint of different design variants enables better decision-making already at the early conceptual stages, when the potential for change is greatest. This applies both to the size and complexity of the development, as well as to the selection of materials, technologies, and water and planting strategies [13,28,76]. Just as in construction compactness and simplicity can reduce material and energy use, in gardens an analogous role is played by limiting excessive formalization of space, reducing the number of elements requiring maintenance, and striving for durable and adaptive layouts. The operational phase of a garden is often the largest source of emissions in its life cycle, especially in gardens with a high level of maintenance intensity.
The main sources of emissions include:
- –
- mowing lawns using fuel-powered or electric equipment;
- –
- application of synthetic fertilizers leading to nitrous oxide (N2O) emissions;
- –
- automatic irrigation systems requiring energy and water resources;
- –
- pruning of plants and removal of biomass.
The frequency and intensity of these activities have a direct impact on the total carbon footprint of the garden, making design decisions that determine future maintenance needs crucial from an emissions perspective.
Ultimately, a low-carbon garden is not the result of a single “ecological” solution but of a coherent design process in which every decision—from preserving an existing tree, through the choice of local materials, to the management of rainwater—affects the final emissions balance. The more the garden is based on existing conditions and natural processes, the greater the chance that it will become not only less emissive but also more resilient, durable, and genuinely supportive of climate balance.
The model adopts a simplified, linear representation of annual emissions and carbon sequestration. This assumption does not fully reflect real-world dynamics, in which both emissions and sequestration may vary over time due to factors such as vegetation growth, changes in maintenance intensity, and technological developments. In real-world systems, carbon sequestration typically increases with vegetation growth, while operational emissions may decrease over time, for example as a result of reduced maintenance intensity. Maintenance processes are represented in a simplified and partially static manner, although in reality they evolve over time.
However, the linear approach is consistent with screening-level LCA methodologies and is intended to provide order-of-magnitude estimates and enable comparison between different design scenarios [4,5,19,20,21,76].
The proposed model is based on simplified, screening-level assumptions and therefore has several limitations. The use of averaged emission factors, linear representation of emissions and sequestration, and the absence of detailed product-specific data introduce uncertainty into the results. Additionally, the lack of a full uncertainty analysis limits the precision of absolute values. Therefore, the results should be interpreted as order-of-magnitude estimates suitable for comparative analysis rather than exact predictions.
4. Discussion
The results indicate that the climate performance of landscape developments is not determined solely by the presence of vegetation, but rather by the relationship between high-emission infrastructural elements and biologically active components capable of long-term carbon sequestration. In particular, the analyses demonstrate that hard surfaces, structural layers, earthworks, and material-intensive solutions play a dominant role in shaping the initial carbon footprint, while vegetation structure and maintenance intensity determine long-term environmental performance. These findings suggest that low-carbon landscape design should be understood not as the simple introduction of greenery, but as the optimization of relationships between construction intensity, operational requirements, and biological capacity.
The obtained results are consistent with recent studies on urban green infrastructure and urban ecosystem carbon dynamics, which emphasize that maintenance intensity, surface sealing, and the proportion of tree canopy are among the principal determinants of environmental performance [26,27,54,73,76,79]. Similar conclusions have also been reported in studies applying Life Cycle Assessment (LCA) to urban green systems and biologically based production systems, where operational processes and material selection were identified as dominant contributors to greenhouse gas emissions [10,11,12,13,14,76].
The private garden model demonstrates that even relatively small-scale landscape developments may generate substantial emissions when characterized by extensive lawn areas, intensive maintenance, and a high proportion of hardscape elements. At the same time, the comparison between traditional and naturalistic variants confirms that reducing the share of sealed surfaces, limiting maintenance intensity, and increasing the proportion of durable multilayer vegetation may significantly improve long-term carbon performance. This finding supports the growing shift from intuitive “green” design approaches toward quantitatively informed and carbon-aware decision-making in landscape architecture. Similar conclusions were presented by Deng [76], who emphasized that low-carbon landscape design requires the integration of environmental protection principles, sustainable spatial organization, and long-term ecological management throughout the design process.
At the scale of an urban park, the results indicate that the dominant sources of emissions are associated not with vegetation itself, but with infrastructure, land transformation, lighting systems, and intensive maintenance practices. These findings are consistent with recent LCA studies of urban green spaces, which identify maintenance processes, technical infrastructure, and material choices as key factors shaping environmental performance [10,27,54,76,79]. The analyses further suggest that the most effective strategy for reducing the carbon footprint of urban parks is not necessarily the addition of more design elements, but rather the limitation of excessive technical intervention and high-emission construction components.
The results therefore highlight the importance of preserving existing natural resources, minimizing sealed surfaces, reducing pathway widths, limiting structural layers, and increasing the share of durable tree canopy and multilayer vegetation systems. In particular, trees constitute the principal long-term sequestration component within urban green systems due to their increasing carbon storage capacity over time. Previous studies similarly indicate that urban trees play a crucial role in carbon storage, pollutant removal, thermal regulation, and the provision of ecosystem services [49,53,58,73,74,75,80,81,82].
The analyses of street greenery indicate that under highly transformed urban conditions the dominant sources of emissions are preparatory and infrastructural works rather than the vegetation itself. Limited soil volume, the need for technical protection systems, and intensive maintenance requirements substantially reduce the carbon efficiency of street plantings. Nevertheless, evaluating street greenery solely through direct carbon accounting would be insufficient, as these systems also provide important environmental and social benefits, including mitigation of the urban heat island effect, rainwater retention, pollutant filtration, thermal comfort improvement, and enhancement of public space quality. These findings support the development of integrated green–blue infrastructure approaches, including sponge street concepts and soil-based retention systems [55,59,63,72,78].
The relatively high emissions associated with roof gardens are also consistent with recent LCA studies indicating that technical layers, substrates, and drainage systems often dominate the embodied carbon footprint of green roofs despite their ecological benefits [10,27,54,76]. Although roof gardens provide important adaptive functions, including thermal regulation, rainwater retention, biodiversity enhancement, and mitigation of urban heat island effects, their carbon performance remains strongly dependent on material intensity and structural complexity. The results therefore suggest that extensive roof systems characterized by lower substrate volumes and reduced maintenance intensity may achieve substantially more favorable carbon balances than intensive rooftop gardens.
The study also confirms that the carbon footprint should not be interpreted as the sole indicator of environmental performance. Other indicators, including ecological footprint [83], material footprint [84], and water footprint [85,86], provide complementary perspectives necessary for a broader assessment of sustainability. At the same time, many strategies developed within low-carbon architecture and construction, including the reduction in embodied and operational emissions [6,7,8,35,86,87,88,89], circular economy principles [68,69,70,71], the use of low-emission materials [37,38,90], and energy-efficiency-oriented environmental design approaches [91,92,93], can be adapted to landscape architecture. Similar conclusions regarding the importance of integrated low-carbon solutions in the built environment were presented by Rabczak et al. [94], who demonstrated that combining heat pumps with photovoltaic systems significantly improves the energy efficiency and carbon performance of eco-friendly housing.
However, unlike buildings, landscape systems are biologically dynamic and evolve over time through processes such as succession, biomass accumulation, soil development, and ecological stabilization. Consequently, the interpretation of lifecycle-based environmental assessment frameworks in landscape architecture requires consideration of long-term ecological processes and temporal variability.
The presented study contributes to the current state of knowledge by extending carbon footprint assessment beyond the building scale and adapting lifecycle-based environmental evaluation frameworks to landscape architecture. While previous research has primarily focused on urban green infrastructure, agricultural systems, or individual ecosystem components, this study integrates embodied emissions, operational emissions, and carbon sequestration within a unified conceptual framework applicable to multiple landscape typologies.
An important contribution of the proposed approach lies in translating simplified screening-level LCA methodologies into a form suitable for early-stage landscape design evaluation. The proposed framework should therefore be interpreted primarily as a comparative and decision-support tool rather than as a full ISO 14040/14044-compliant LCA methodology [4,5]. The novelty of the study lies in adapting lifecycle-based carbon accounting approaches, commonly used in architecture and construction, to biologically dynamic landscape systems characterized by long-term ecological processes and variable sequestration capacity.
The results also challenge the common assumption that all green spaces are inherently climate-positive. The analyses indicate that the carbon performance of landscape developments depends not only on the presence of vegetation, but primarily on the relationship between infrastructural intensity, maintenance requirements, and long-term sequestration potential. This finding highlights the importance of integrating carbon-aware decision-making into landscape design processes already at the conceptual stage, where the greatest potential for environmental optimization exists.
At the same time, the study has several limitations resulting from its exploratory and conceptual character. The analyses are based on generalized model scenarios rather than monitored real-world projects and should therefore be interpreted as comparative order-of-magnitude estimates rather than directly transferable performance benchmarks. The use of averaged emission factors, simplified sequestration models, and linear temporal assumptions introduces uncertainty into the results, particularly in relation to long-term ecosystem dynamics and soil carbon accumulation.
Recent studies additionally indicate that environmental assessment approaches in urban green infrastructure remain methodologically fragmented and lack standardized analytical frameworks, which limits comparability across studies [10,27,76]. In particular, the role of urban soils in carbon sequestration remains insufficiently understood despite evidence that urban soils may store substantial amounts of carbon while simultaneously exhibiting high spatial variability and complex accumulation dynamics [22,23,24,74].
These limitations suggest that future research should focus on improving the integration of landscape architecture with existing LCA methodologies, developing more precise and context-sensitive models of soil carbon dynamics, and conducting empirical long-term monitoring of real landscape projects. Further methodological development is also required to better integrate biological processes, temporal variability, maintenance dynamics, and ecosystem services into lifecycle-based environmental assessment frameworks for landscape architecture.
5. Conclusions
Gardens, despite being commonly perceived as inherently pro-environmental elements, are not automatically climate-neutral. Their implementation and maintenance are associated with greenhouse gas emissions which—similarly to buildings—can be analyzed from a life cycle perspective. Introducing the carbon footprint perspective into landscape architecture makes it possible to identify key emission sources and to consciously shape design decisions.
The conducted analysis showed that a garden constitutes a hybrid system, combining features of the built and natural environments. Unlike buildings, gardens not only generate emissions but also possess the capacity for carbon sequestration, which introduces an additional dimension of assessment—the net emissions balance over the entire life cycle. This implies the need to simultaneously consider both emission and compensatory processes.
Based on the literature review and conceptual analysis, a framework for assessing gardens from a life cycle perspective was proposed, encompassing four main areas: embodied emissions, operational emissions, water management, and carbon sequestration potential. These frameworks provide a basis for further operationalization and may be used in the design process as a decision-support tool.
The results indicate that the greatest impact on a garden’s carbon footprint comes from decisions made at the early design stages, particularly those concerning the scale of land intervention, the preservation of existing natural resources, the selection of materials, and water management strategies. Design based on natural processes and the reduction in use intensity can significantly reduce operational emissions and, in the long term, lead to a positive sequestration balance.
At the same time, it should be emphasized that the proposed framework is conceptual in nature and requires further empirical validation. Future research should focus on the quantitative evaluation of the proposed indicators, their testing across different garden typologies, and their integration with existing environmental assessment tools such as LCA. It is particularly important to account for the dynamic nature of biological processes and long-term changes occurring in landscape systems.
A garden may therefore be perceived not only as an aesthetic or recreational element but as an active environmental system capable of reducing emissions and supporting regenerative processes under changing climate conditions. As a starting point in park design, the concept of the “potential natural landscape” should be adopted, understood as the target vegetation structure that could develop in a given area without human intervention. This approach applies not only to classical natural landscapes or rural areas associated with agricultural use but also to transformed environments, including urban ones. In the design process, one should not be guided solely by the aesthetic attractiveness of the potential model but above all by its ecological stability. It is precisely the capacity for self-regulation, resilience to disturbances, and low maintenance requirements that make such a model particularly valuable from the perspective of the long-term functioning of green spaces. The proposed approach may provide a basis for the development of design tools and the integration of climate strategies into landscape architecture practice.
Funding
This research received no external funding.
Institutional Review Board Statement
Not applicable.
Informed Consent Statement
Not applicable.
Data Availability Statement
The original contributions presented in this study are included in the article. Further inquiries can be directed to the corresponding author.
Acknowledgments
During the preparation of this manuscript, the author used ChatGPT (GPT-5.5, OpenAI) for verification of calculations. The author reviewed and edited the output and takes full responsibility for the content of this publication.
Conflicts of Interest
The author declares no conflicts of interest.
Appendix A
Table of Emission and Sequestration Factors for Garden Carbon Footprint Analysis. Source: Author’s Own Compilation Based on ICE Database [25], Ecoinvent v3.8 [26], DEFRA Guidelines [27], IPCC Reports, and Referenced Literature. Note: The Presented Cases Represent Generalized Conceptual Scenarios Developed for Comparative Analysis and Do Not Correspond to Specific Built Projects.
| Element | Value | Unit | Source |
| Precast concrete | 30–40 | kg CO2e/m2 | Hammond & Jones 2011 (ICE Database) [29] |
| Mineral surface | 10–15 | kg CO2e/m2 | DEFRA 2022 [27] |
| Wooden terrace | 10–20 | kg CO2e/m2 | Ecoinvent v3.8 [30]/LCA literature |
| Transport of materials | 0.1–0.3 | kg CO2e/tkm | DEFRA 2022 [27] |
| Earthworks (machinery) | 20–50 | kg CO2e/m3 | Ecoinvent [30]/construction literature |
| Mowing (petrol mower) | 1.5–2.5 | kg CO2e/hour | DEFRA 2022 [27] |
| Irrigation | 0.3–0.6 | kg CO2e/m3 of water | [87]/literature |
| Deciduous trees | 15–25 | kg CO2/year/unit | Mazon 2015 [58] |
| Shrubs | 2–5 | kg CO2/year/unit | urban forestry literature |
| Soil (sequestration) | 0.5–2.0 | t CO2/ha/year | Lal 2004 [22] |
Appendix B
Carbon Footprint of a Private Garden—Summary. Source: Author’s Own Calculations Based on Simplified Screening-Level LCA Assumptions and Literature-Derived Emission Factors.
| The Garden Area is 500 m2 | |
| Functional and spatial arrangement | 200 m2 of lawn 150 m2 of perennial and shrub planting beds 100 m2 of mineral surface 30 m2 of wooden terrace 20 m2 of concrete slab pathway |
| Greenery | 5 deciduous trees 25 shrubs 200 perennials and ornamental grasses |
| Materials and construction | mineral surface: aggregate base layer wooden terrace pathway made of precast concrete slabs 10 m3 of topsoil delivered to the site 8 m3 of aggregate 5 m3 of mulch plants delivered from a local nursery small excavator and delivery vehicle used during construction |
| Annual maintenance | lawn mowing with a petrol mower moderate irrigation no mineral fertilizers green waste partially composted on site |
| Calculation method (values are approximate but realistic in design terms) | A. Initial emissions (construction) B. Annual operational emissions C. Annual CO2 sequestration D. Balance after 1 year and over a 20-year horizon |
| A. Initial emissions (construction) | 1. Pathway made of concrete slabs—20 m2 Assumption: 20 m2 of slabs emission factor for precast concrete elements: approx. 35 kg CO2e/m2 Calculation: 20 × 35 = 700 kg CO2e |
| 2. Mineral surface—100 m2 Assumption: 100 m2 base and wearing layers together generate emissions of approx. 12 kg CO2e/m2 Calculation: 100 × 12 = 1200 kg CO2e | |
| 3. Wooden terrace—30 m2 There are two approaches here: to calculate only the production of the material or to include partial carbon storage in the wood To avoid mixing methods, I will conservatively assume: net emissions from production and installation: 15 kg CO2e/m2 Calculation: 30 × 15 = 450 kg CO2e | |
| 4. Topsoil—10 m3 Assumption: sourcing + loading + local transport 25 kg CO2e/m3 Calculation: 10 × 25 = 250 kg CO2e | |
| 5. Aggregate—8 m3 Assumption: material + local transport 18 kg CO2e/m3 Calculation: 8 × 18 = 144 kg CO2e | |
| 6. Mulch—5 m3 Assuming local bark mulch: 10 kg CO2e/m3 Calculation: 5 × 10 = 50 kg CO2e | |
| 7. Plants Trees—5 pcs average 18 kg CO2e/pc for production + container + local transport 5 × 18 = 90 kg CO2e Shrubs—25 pcs average 4 kg CO2e/pc 25 × 4 = 100 kg CO2e Perennials and grasses—200 pcs average 0.8 kg CO2e/pc 200 × 0.8 = 160 kg CO2e Total plants: 90 + 100 + 160 = 350 kg CO2e | |
| 8. Construction using machinery Assumption: small excavator, transport, compactor, delivery vehicle total: 250 kg CO2e Total initial emissions Let us add: concrete: 700 mineral surface: 1200 terrace: 450 soil: 250 aggregate: 144 mulch: 50 plants: 350 machinery: 250 Total initial emissions: 3394 kg CO2e, i.e., approx. 3.4 t CO2e at the construction stage | |
| B. Annual operational emissions | 1. Lawn mowing 200 m2 of lawn, petrol mower. Assumption: 20 mowings per year Total emissions: 40 kg CO2e/year 2. Irrigation With moderate watering—energy + water 25 kg CO2e/year 3. Pruning and small equipment Shears, occasional blower, partial biomass removal: 20 kg CO2e/year 4. Mulch replenishment, replanting, consumables 30 kg CO2e/year 5. On-site composting This reduces emissions related to transport and fertilization. Conservative assumption: −15 kg CO2e/year Total annual operational emissions 40 + 25 + 20 + 30 − 15 = 100 kg CO2e/year Operation: approx. 0.10 t CO2e/year |
| C. Annual CO2 sequestration | 6. 5 pieces young deciduous trees. In the first years their sequestration is not very high, but it increases over time. Assumption (average): 18 kg CO2/tree/year Calculation: 5 × 18 = 90 kg CO2/year |
| 7. Shrubs and perennials + planting bed soil Planting beds: 150 m2; mulching, biomass growth, part stored in the soil. Assumption: 0.35 kg CO2/m2/year (soil + long-term biomass effect) 150 × 0.35 = 52.5 kg CO2/year Rounded: 53 kg CO2/year | |
| 8. Lawn A lawn can sequester some carbon in the soil, but with intensive mowing the net gain is low. Assumption: 0.10 kg CO2/m2/year 200 × 0.10 = 20 kg CO2/year Total annual sequestration 90 + 53 + 20 = 163 kg CO2/year approx. 0.16 t CO2/year | |
| D. Annual operational balance after garden establishment | Operational emissions: 100 kg CO2e/year Sequestration: 163 kg CO2/year |
| 163 − 100 = 63 kg CO2/year (net positive for the garden) After establishment, the garden begins to function as a small net carbon sink. However, the key point is offsetting the initial emissions: Construction emissions: 3394 kg CO2e Annual positive balance: 63 kg CO2/year Payback time: 3394/63 ≈ 54 years | |
| Balance after 20 years | CF = 3394 + (100 × 20) − (163 × 20) CF = 2134 kg CO2e i.e., after 20 years: approx. 2.13 t CO2e still not offset |
Appendix C
Comparison of Traditional and Naturalistic Garden Variants—Carbon Footprint Balance.
Variant 1—traditional garden and Variant 2—naturalistic garden.
Common assumption: both variants have an area of 500 m2, a similar residential function, a comparable aesthetic standard, and are used by a private owner. They differ in the proportion of hard surfaces, type of vegetation, maintenance intensity, number of trees, and the approach to biomass and water management. Variant 1 is described in Appendix B.
Variant 2—naturalistic garden.
| Garden Area: 500 m2 | |
| Functional and spatial arrangement | 100 m2 of usable lawn 230 m2 of naturalistic perennial and shrub planting beds 70 m2 of light mineral surface 30 m2 of wooden terrace 8 m2 of concrete slab pathway 62 m2 of semi-wild, mulched, infiltration area |
| Greenery | 8 trees 40 shrubs 350 perennials and ornamental grasses, with a particular focus on native species, perennial plants, and dense planting |
| Annual maintenance | less frequent mowing no intensive “cleaning” of planting beds increased mulching more biomass left on site irrigation mainly during establishment and drought periods |
| A. Initial emissions—naturalistic variant | 1. Pathway made of concrete slabs—8 m2 Using the same factor: 35 kg CO2e/m2 8 × 35 = 280 kg CO2e |
| 2. Light mineral surface—70 m2 Assuming a lighter construction: 10 kg CO2e/m2 70 × 10 = 700 kg CO2e | |
| 3. Wooden terrace—30 m2 As before: 15 kg CO2e/m2 30 × 15 = 450 kg CO2e | |
| 4. Topsoil—8 m3 Reduced soil intervention: 25 kg CO2e/m3 8 × 25 = 200 kg CO2e | |
| 5. Aggregate—5 m3 18 kg CO2e/m3 5 × 18 = 90 kg CO2e | |
| 6. Mulch—8 m3 Higher share of mulching: 10 kg CO2e/m3 8 × 10 = 80 kg CO2e | |
| 7. Plants Trees—8 pcs 18 kg CO2e/pc 8 × 18 = 144 kg CO2e Shrubs—40 pcs 4 kg CO2e/pc 40 × 4 = 160 kg CO2e Perennials and grasses—350 pcs 0.8 kg CO2e/pc 350 × 0.8 = 280 kg CO2e Total plants: 144 + 160 + 280 = 584 kg CO2e | |
| 8. Machinery and construction 180 kg CO2e | |
| Total initial emissions—naturalistic variant: 2564 kg CO2e, i.e., approx. 2.56 t CO2e | |
| B. Annual operational emissions—naturalistic variant | 1. Mowing Only 100 m2 of lawn and less intensively: 15 kg CO2e/year |
| 2. Irrigation Smaller irrigated area: 18 kg CO2e/year | |
| 3. Maintenance and small equipment More selective pruning, less routine maintenance: 18 kg CO2e/year | |
| 4. Replanting, mulch, consumables 22 kg CO2e/year | |
| 5. Composting and leaving biomass on site Greater benefit: −20 kg CO2e/year Total: 15 + 18 + 18 + 22 − 20 = 53 kg CO2e/year i.e., approx. 0.053 t CO2e/year | |
| C. CO2 sequestration—naturalistic variant | 1. Trees—8 pcs 18 kg CO2/tree/year 8 × 18 = 144 kg CO2/year |
| 2. Planting beds and shrubs—230 m2 Larger area and more stable biomass: 0.45 kg CO2/m2/year 230 × 0.45 = 103.5 kg CO2/year Rounded: 104 kg CO2/year | |
| 3. Lawn—100 m2 0.10 kg CO2/m2/year 100 × 0.10 = 10 kg CO2/year | |
| 4. Semi-wild/mulched/infiltration area—62 m2 Assuming moderate soil carbon accumulation: 0.30 kg CO2/m2/year 62 × 0.30 = 18.6 kg CO2/year Rounded: 19 kg CO2/year | |
| Total annual sequestration: 144 + 104 + 10 + 19 = 277 kg CO2/year | |
| D. Annual operational balance after garden establishment—naturalistic variant | style="border-bottom:solid thin"Operational emissions: 53 kg CO2e/year Sequestration: 277 kg CO2/year Balance: +224 kg CO2/year Naturalistic garden Initial emissions: 2564 kg CO2e Annual positive balance: 224 kg CO2/year Payback time: 2564/224 ≈ 11.4 years approx. 11–12 years |
| Balance after 20 years—naturalistic variant | CF = 2564 + (53 × 20) − (277 × 20) CF = 2564 + 1060 − 5540 = −1916 kg CO2e i.e., after 20 years: approx. −1.92 t CO2e” This means that the naturalistic variant: has not only offset the construction footprint, but has already become a net carbon sink over the 20-year period. |
Summary and comparison:
| Parameter | Traditional Garden | Naturalistic Garden |
| Construction emissions | 3.39 t CO2e | 2.56 t CO2e |
| Annual operational emissions | 0.10 t CO2e/year | 0.053 t CO2e/year |
| Annual sequestration | 0.163 t CO2/year | 0.277 t CO2/year |
| Net annual balance | +0.063 t CO2/year | +0.224 t CO2/year |
| Payback time | ok. 54 years | ok. 11–12 years |
| Balance after 20 years | +2.13 t CO2e | −1.92 t CO2e |
| Nature of the balance | very weak carbon sink | net carbon sink |
| Rate of improvement | very slow | fast |
Appendix D
Carbon Footprint of an Urban Park—Summary. Source: Author’s Own Calculations Based on Simplified Screening-Level LCA Assumptions and Literature-Derived Emission Factors.
| Park Area: 5 ha (50,000 m2) | |
| Functional-spatial structure | 20,000 m2 of recreational lawns 12,000 m2 of park meadows/extensive grasslands 10,000 m2 of tree and shrub groups 4000 m2 of mineral pathways 2000 m2 of pathways and plazas with concrete/resin-bound surfaces 1000 m2 of rain gardens and retention basins 1000 m2 of entrance plaza, street furniture, edging and functional zones |
| Greenery | 250 new trees 2500 shrubs 12,000 perennials, grasses and ground cover plants |
| Materials and works | 2500 m3 of topsoil/soil improvement 2000 m3 of aggregates for pathways and sub-base layers 1200 m2 of edging/curbs/linear elements benches, bins, lighting, small infrastructure construction using heavier machinery than for a garden2 500 m3 |
| Annual maintenance | mowing of intensively used areas less frequent mowing of meadows irrigation mainly during establishment and drought periods tree and shrub maintenance partial mulching and on-site composting of biomass |
| A. Initial emissions | 1. Mineral pathways—4000 m2 Assumption (average): light to medium construction 14 kg CO2e/m2 Calculation: 4000 × 14 = 56,000 kg CO2e 2. Harder plazas and pathways—2000 m2 Assumption: concrete/precast/stabilized surface with a higher footprint 38 kg CO2e/m2 Calculation: 2000 × 38 = 76,000 kg CO2e 3. Edging, curbs and linear elements—1200 m2 equivalent Let us simplify this as a material package: 18,000 kg CO2e 4. Topsoil and soil improvement—2500 m3 Assumption: sourcing, transport and spreading 22 kg CO2e/m3 Calculation: 2500 × 22 = 55,000 kg CO2e 5. Aggregates—2000 m3 Assumption: 18 kg CO2e/m3 Calculation: 2000 × 18 = 36,000 kg CO2e 6. Mulches, substrates and organic matter As a package: 12,000 kg CO2e 7. Plants Trees—250 pcs Assumption: nursery production, container/root ball, local transport, planting 28 kg CO2e/pc Calculation: 250 × 28 = 7000 kg CO2e Shrubs—2500 pcs Assumption: 4.5 kg CO2e/pc Calculation: 2500 × 4.5 = 11,250 kg CO2e Perennials and grasses—12,000 pcs Assumption: 0.9 kg CO2e/pc Calculation: 12,000 × 0.9 = 10,800 kg CO2e Total plants: 7000 + 11,250 + 10,800 = 29,050 kg CO2e 8. Street furniture and lighting Benches, bins, bicycle stands, point foundations, lighting columns, etc. Simplified package: 45,000 kg CO2e 9. Earthworks and machinery In a park this is already a significant item: excavators, loaders, transport, rollers, compactors 60,000 kg CO2e Total: 387,050 kg CO2e i.e., approx. 387 t CO2e at the construction stage |
| B. Annual operational emissions | 1. Mowing of intensively used lawns—20,000 m2 Assumption: regular mowing throughout the season petrol-powered/partially mechanical equipment 9000 kg CO2e/year 2. Extensive meadows—12,000 m2 1–2 mowings, lower input: 1200 kg CO2e/year 3. Tree and shrub maintenance Pruning, equipment, biomass removal, inspections: 4000 kg CO2e/year 4. Irrigation In urban parks, full-time irrigation is uncommon, but occurs during droughts and the establishment phase: 3500 kg CO2e/year 5. Infrastructure maintenance Repairs, cleaning, aggregate replenishment, replacement of small elements: 3000 kg CO2e/year 6. Lighting If the park includes lighting: 8000 kg CO2e/year 7. On-site composting and biomass management Emission benefit: −2500 kg CO2e/year Total annual operational emissions 9000 + 1200 + 4000 + 3500 + 3000 + 8000 − 2500 = 26,200 kg CO2e/year i.e., approx. 26.2 t CO2e/year |
| C. Annual CO2 sequestration | 1. Trees—250 pcs This depends on age, species and growth rate. For young to moderately young park trees, let us conservatively assume: 22 kg CO2/tree/year Calculation: 250 × 22 = 5500 kg CO2/year This is a conservative estimate; in later years it may be higher. 2. Tree and shrub groups + soil - 10,000 m2 This is the most biologically active component. Assumption for biomass + soil: 0.65 kg CO2/m2/year Calculation: 10,000 × 0.65 = 6500 kg CO2/year 3. Park meadows—12,000 m2 For extensive, less disturbed areas: 0.35 kg CO2/m2/year Calculation: 12,000 × 0.35 = 4200 kg CO2/year 4. Intensively used lawns—20,000 m2 Lawns can also store some carbon in the soil, but less efficiently: 0.12 kg CO2/m2/year Calculation: 20,000 × 0.12 = 2400 kg CO2/year 5. Rain gardens and wet zones—1000 m2 Assumption: 0.8 kg CO2/m2/year Calculation: 1000 × 0.8 = 800 kg CO2/year Total annual sequestration 5500 + 6500 + 4200 + 2400 + 800 = 19,400 kg CO2/year i.e., approx. 19.4 t CO2/year |
| D. Annual balance after implementation | Annual operational emissions: 26.2 t CO2e/year Annual sequestration: 19.4 t CO2/year Balance: 19.4 − 26.2 = –6.8 t CO2e/year This park, in its early years, still emits net approx. 6.8 t CO2e per year. This is important and very realistic: a young park does not always become carbon-positive immediately, especially if it involves intensive mowing, lighting and paved surfaces. |
| Balance after 20 years | Total footprint = construction emissions + 20 × annual emissions − 20 × annual sequestration i.e.,: 387.05 + (20 × 26.2) − (20 × 19.4) 387.05 + 524 − 388 = 523.05 t CO2e After 20 years, the park still has a balance of approx. 523 t CO2e |
Appendix E
Carbon Footprint of Street Greenery Plantings—Summary. Source: Author’s Own Calculations Based on Simplified Screening-Level LCA Assumptions and Literature-Derived Emission Factors.
| Street Length: 500 m, Area Approx. 9000 m2 | |
| Compositional layout | 60 street trees 900 shrubs 2500 perennials and grasses 1500 m2 of biologically active area/planting beds/tree pits |
| Technical solutions and measures | 1. Aeration and irrigation system for selected trees 2. Local soil replacement and use of structural soil mixes 3. Edging and plant protection measures 4. Partial removal and reconstruction of existing pavement |
| A. Construction emissions | Street trees—60 pcs A street tree usually has a higher footprint than a park tree because it also involves: a higher nursery standard, staking or anchoring, tree pits, protective measures, more difficult transport and installation. Assumption: 45 kg CO2e/pc for the plant material + basic planting Calculation: 60 × 45 = 2700 kg CO2e Shrubs—900 pcs Assumption: 4.5 kg CO2e/pc Calculation: 900 × 4.5 = 4050 kg CO2e Perennials and grasses—2500 pcs Assumption: 0.9 kg CO2e/pc Calculation: 2500 × 0.9 = 2250 kg CO2e Soil replacement and structural soils Assumption: 300 m3 of soil/structural substrate in urban conditions this carries a considerable emission cost: excavation, removal, delivery, spreading 35 kg CO2e/m3 Calculation: 300 × 35 = 10,500 kg CO2e Mulches, substrates, soil improvement As a package: 2500 kg CO2e Edging, tree pits, grilles, guards, staking, anchoring 12,000 kg CO2e Aeration and irrigation system and technical elements Assuming it is installed not for all trees, but for some of them: pipes, boxes, drainage, plastic components 8000 kg CO2e Demolition and reconstruction of parts of the pavement A very common urban cost: cutting out part of the sidewalk, curb adjustments, reconstruction of edge strips, repair of pavement after construction works. Assumption: 15,000 kg CO2e Transport and machinery Excavator, trucks, crane truck, compactors, deliveries: 9000 kg CO2e Total construction emissions amount to 66,000 kg CO2e, i.e., approx. 66 t CO2e at the construction stage |
| B. Annual operational emissions | 1. Irrigation In street greenery this is usually one of the key factors, especially in the first years. Assumption: 2500 kg CO2e/year 2. Tree maintenance Sanitary and formative pruning, inspection of supports, crew transport: 1200 kg CO2e/year 3. Shrub and planting bed maintenance Weeding, pruning, replanting, mulching: 1500 kg CO2e/year 4. Leaf and biomass removal In street conditions, biomass often cannot be left on site: collection, sweeping, municipal services 1000 kg CO2e/year 5. Replanting and replacement of losses In street conditions, some plant material fails: 800 kg CO2e/year 6. Total annual operational emissions 2500 + 1200 + 1500 + 1000 + 800 = 7000 kg CO2e/year i.e., approx. 7.0 t CO2e/year |
| C. Annual CO2 sequestration | Street trees grow under more difficult conditions than park trees, they have less soil volume, and are exposed to drought, salt and compaction. 7.1. Trees—60 pcs Assumption (average): 16 kg CO2/tree/year Calculation: 60 × 16 = 960 kg CO2/year 7.2. Shrubs and planting beds—1500 m2 Assumption: 0.30 kg CO2/m2/year Calculation: 1500 × 0.30 = 450 kg CO2/year 7.3. Soil and organic matter effect For improved soil, mulching and organic matter accumulation: 250 kg CO2/year 8. Total annual sequestration 960 + 450 + 250 = 1660 kg CO2/year i.e., approx. 1.66 t CO2/year |
| D. Annual balance after implementation | Operational emissions: 7.0 t CO2e/year Sequestration: 1.66 t CO2/year Balance: 1.66 − 7.0 = −5.34 t CO2e/year In the first years, such street plantings emit net approx. 5.3 t CO2e per year |
| Balance after 20 years | Formula: CF = E0 + (Er × n) − (Sr × n) Substitution: E0 = 66 t Er = 7.0 t/year Sr = 1.66 t/year After 20 years: CF = 66 + (7 × 20) − (1.66 × 20) CF = 66 + 140 − 33.2 = 172.8 t CO2e After 20 years, the balance is still approx. 173 t CO2e |
Appendix F
Carbon Footprint of a Roof Garden—Summary. Source: Author’s Own Calculations Based on Simplified Screening-Level LCA Assumptions and Literature-Derived Emission Factors.
| Total Area: 100 m2 | |
| Terrace composition layout | 35 m2 of extensive greenery 25 m2 of intensive planting beds 20 m2 of terrace/circulation on paving slabs 10 m2 of relaxation area 10 m2 of technical areas and access paths |
| Greenery | 2 large planters with shrubs or small trees 20 shrubs and larger perennials 250 perennials, ornamental grasses and ground cover plants 35 m2 of sedum mats |
| Layers and materials | waterproofing and protection layer drainage and filtration layer extensive and intensive substrate paving slabs on pedestals edging and drainage material transport to the roof |
| Annual maintenance and care | moderate to fairly intensive watering seasonal maintenance partial plant replacement no mowing |
| A. Initial emissions | 1. Waterproofing, protective and separation layers—100 m2 6 kg CO2e/m2 100 × 6 = 600 kg CO2e 2. Drainage and filter layer—100 m2 5 kg CO2e/m2 100 × 5 = 500 kg CO2e 3. Green roof substrate 35 m2 of extensive green roof × 0.08 m = 2,8 m3 25 m2 of intensive green roof × 0.25 m = 6.25 m3 Summary: 9.05 m3, rounded to 9 m3 Calculation: 60 kg CO2e/m3 9 × 60 = 540 kg CO2e 4. Terrace slabs on pedestals—20 m2 28 kg CO2e/m2 20 × 28 = 560 kg CO2e 5. Edging, drainage and technical details 300 kg CO2e 6. Plant containers—2pcs 120 kg CO2e/pcs 2 × 120 = 240 kg CO2e 7. Plants Small trees/larger shrubs in containers—2 pcs 30 kg CO2e/pcs 2 × 30 = 60 kg CO2e Shrubs and larger perennials—20 pcs 4 kg CO2e/szt. 20 × 4 = 80 kg CO2e Perennials, grasses and ground cover plants—250 pcs 0.8 kg CO2e/pcs 250 × 0.8 = 200 kg CO2e Sedum mats—35 m2 4 kg CO2e/m2 35 × 4 = 140 kg CO2e Total plants: 60 + 80 + 200 + 140 = 480 kg CO2e Transport and installation 500 kg CO2e |
| Total initial emissions: 3720 kg CO2e, i.e., approx. 3.72 t CO2e at the construction stage | |
| B. Annual operational emissions | 1. Irrigation 70 kg CO2e/year 2. Plant maintenance 40 kg CO2e/year 3. Fertilization and consumables 20 kg CO2e/year 4. Plant replacement and replenishment 45 kg CO2e/year 5. Maintenance of technical systems 25 kg CO2e/year Total annual operational emissions 70 + 40 + 20 + 45 + 25 = 200 kg CO2e/year approx. 0.20 t CO2e/year |
| C. Annual CO2 sequestration | 1. Small trees/larger shrubs in containers—2 pcs 10 kg CO2/pc/year 2 × 10 = 20 kg CO2/year 2. Intensive planting beds—25 m2 0.30 kg CO2/m2/year 25 × 0.30 = 7.5 kg CO2/year Rounded: 8 kg CO2/year 3. Extensive greenery—35 m2 0.12 kg CO2/m2/year 35 × 0.12 = 4.2 kg CO2/year Rounded: 4 kg CO2/year 4. Substrate and organic matter Assumption: 10 kg CO2/year Total annual sequestration 20 + 8 + 4 + 10 = 42 kg CO2/year approx. 0.042 t CO2/year |
| D. Bilans | Annual operational balance Operational emissions: 200 kg CO2e/year Sequestration: 42 kg CO2/year Balance: 42 − 200 = –158 kg CO2e/year |
| Balance after 20 years | CF = E0 + (Er × n) − (Sr × n) CF = 3720 + (200 × 20) − (42 × 20) CF = 3720 + 4000 − 840 CF = 6880 kg CO2e i.e., after 20 years approx. 6.88 t CO2e |
References
- Olgyay, V. Design with Climate; Princeton University Press: Princeton, NJ, USA, 1963. [Google Scholar]
- Soleri, P. Arcology: The City in the Image of Man; MIT Press: Cambridge, MA, USA, 1969. [Google Scholar]
- Szokolay, S.V. Introduction to Architectural Science: The Basis of Sustainable Design; Architectural Press: Oxford, UK, 2004. [Google Scholar]
- ISO 14040; Environmental Management—Life Cycle Assessment—Principles and Framework. ISO: Geneva, Switzerland, 2006. Available online: https://www.iso.org/standard/37456.html (accessed on 12 April 2026).
- ISO 14044; Environmental Management—Life Cycle Assessment—Requirements and Guidelines. ISO: Geneva, Switzerland, 2006. Available online: https://www.iso.org/standard/38498.html (accessed on 12 April 2026).
- Pomponi, F.; Moncaster, A. Embodied carbon mitigation and reduction in the built environment—What does the evidence say? J. Environ. Manag. 2016, 181, 687–700. [Google Scholar] [CrossRef] [Scilit]
- World Green Building Council. Bringing Embodied Carbon Upfront. 2019. Available online: https://worldgbc.org/climate-action/embodied-carbon/ (accessed on 12 April 2026).
- Cabeza, L.F.; Bai, Q.; Bertoldi, P.; Kihila, J.M.; Lucena, A.F.P.; Mata, É.; Mirasgedis, S.; Novikova, A.; Saheb, Y. Buildings. In IPCC, 2022: Climate Change 2022: Mitigation of Climate Change. Contribution of Working Group III to the Sixth Assessment Report of the Intergovernmental Panel on Climate Change; Shukla, P.R., Skea, J., Slade, R., Al Khourdajie, A., van Diemen, R., McCollum, D., Pathak, M., Some, S., Vyas, P., Fradera, R., et al., Eds.; Cambridge University Press: Cambridge, UK; New York, NY, USA, 2022. [Google Scholar] [CrossRef] [Scilit]
- International Energy Agency. Global Status Report for Buildings and Construction 2019. 2023. Available online: https://www.iea.org/reports/global-status-report-for-buildings-and-construction-2019 (accessed on 12 April 2026).
- Bani Khalifi, N.; Avgoustaki, D.D.; Bartzanas, T. Integrating life cycle assessment into green infrastructure: A systematic review and meta-analysis of urban sustainability strategies. Front. Sustain. Cities 2025, 7, 1601091. [Google Scholar] [CrossRef] [Scilit]
- Pang, B.; Deal, B. Wetland Carbon Dynamics in Illinois: Implications for Landscape Architectural Practice. Sustainability 2024, 16, 11184. [Google Scholar] [CrossRef] [Scilit]
- Hu, Y.; Huang, H.; Chen, M.; Pan, C.; Alamerew, A.N.; Zhang, J.; He, M. Life Cycle Carbon Footprint Assessment of a Typical Bamboo-Based Fiber Composite Material. Fibers 2025, 13, 134. [Google Scholar] [CrossRef] [Scilit]
- Kuronuma, T.; Watanabe, H.; Masuda, S.; Mito, T. Greenhouse Gas Budget Assessment of Production of Kentucky Bluegrass (Poa pratensis) Sod and Three Herbaceous Landscape Plants. Horticulturae 2025, 11, 1132. [Google Scholar] [CrossRef] [Scilit]
- Lu, F.; Zhao, M.; Liu, Q.; Sun, M.; Kang, P.; Zeng, C.; Tan, Y.; Huang, X.; Xiao, K.; Zhu, X.; et al. Carbon Footprint of Masson Pine (Pinus massoniana) Seedlings in Southern China: A Life Cycle Inventory and Sensitivities. Forests 2025, 16, 140. [Google Scholar] [CrossRef] [Scilit]
- Adam, E.; Mavrommati, A.; Patakas, A. Sustainable Rice: Carbon Footprint and Eco-Efficiency Analysis in Thessaloniki Plain. Proceedings 2026, 134, 12. [Google Scholar] [CrossRef] [Scilit]
- National Aeronautics and Space Administration. Global Climate Change: Vital Signs of the Planet—Global Temperature; NASA: Washington, DC, USA, 2021. Available online: https://climate.nasa.gov/vital-signs/global-temperature/ (accessed on 12 April 2026).
- Intergovernmental Panel on Climate Change. Climate Change 2021: The Physical Science Basis. Summary for Policymakers; IPCC: Geneva, Switzerland, 2021; Available online: https://www.ipcc.ch/report/ar6/wg1/downloads/report/IPCC_AR6_WGI_SPM.pdf (accessed on 12 April 2026).
- Popkiewicz, M.; Kardaś, A.; Malinowski, S. Nauka o Klimacie; Sonia Draga: Katowice, Poland, 2018. [Google Scholar]
- Cucurachi, S.; Steubing, B.; Siebler, F.; Navarre, N.; Caldeira, C.; Sala, S. Prospective LCA Methodology for Novel and Emerging Technologies for BIO-Based Products—The PLANET BIO Project; Publications Office of the European Union: Luxembourg, 2022; ISBN 978-92-76-56793-6. JRC129632. [Google Scholar] [CrossRef]
- Arias, A.; Moreira, M.T.; Heijungs, R.; Cucurachi, S. Advancing parametric life cycle assessment (pa-LCA): A systematic review and methodological roadmap for enhanced sustainability assessments. Sustain. Prod. Consum. 2025, 61, 231–246. [Google Scholar] [CrossRef] [Scilit]
- Kumar, D.; Maurya, K.K.; Mandal, S.K.; Mir, B.A.; Nurdiawati, A.; Al-Ghamdi, S.G. Life Cycle Assessment in the Early Design Phase of Buildings: Strategies, Tools, and Future Directions. Buildings 2025, 15, 1612. [Google Scholar] [CrossRef] [Scilit]
- Lal, R. Soil carbon sequestration impacts on global climate change and food security. Science 2004, 304, 1623–1627. [Google Scholar] [CrossRef] [Scilit]
- Lal, R. Carbon sequestration. Philos. Trans. R. Soc. B Biol. Sci. 2008, 363, 815–830. [Google Scholar] [CrossRef] [Scilit]
- Lal, R. Digging deeper: A holistic perspective of factors affecting soil organic carbon sequestration in agroecosystems. Glob. Change Biol. 2018, 24, 3285–3301. [Google Scholar] [CrossRef] [Scilit] [PubMed]
- Elmqvist, T. (Ed.) Urbanization, Biodiversity and Ecosystem Services: Challenges and Opportunities; Springer: Dordrecht, The Netherlands, 2015. [Google Scholar] [CrossRef] [Scilit]
- Yang, J.; Ye, M. The role of urban green spaces in mitigating climate change: A review. Urban For. Urban Green. 2022, 74, 127635. [Google Scholar] [CrossRef] [Scilit]
- Xue, F.; Luan, B.; Fan, Y.; Xie, S.; Yang, X.; Luo, J.; Zheng, R. Assessing the Lifecycle Environmental Resilience of Urban Green Infrastructures Coping with Acute Disturbances and Chronic Stresses. Water 2024, 16, 1162. [Google Scholar] [CrossRef] [Scilit]
- Ingram, D.L.; Hall, C.R.; Knight, J. Understanding Carbon Footprint in Production and Use of Landscape Plants. HortTechnology 2019, 29, 6–10. [Google Scholar] [CrossRef] [Scilit]
- Hammond, G.; Jones, C. Inventory of Carbon and Energy (ICE), Version 2.0; University of Bath: Bath, UK, 2011. Available online: https://www.circularecology.com/embodied-energy-and-carbon-footprint-database.html (accessed on 12 April 2026).
- Ecoinvent Association. Ecoinvent Database Version 3.8; Ecoinvent Association: Zürich, Switzerland, 2021; Available online: https://www.ecoinvent.org (accessed on 12 April 2026).
- Department for Environment, Food & Rural Affairs. UK Government GHG Conversion Factors for Company Reporting 2022; DEFRA: London, UK, 2022. Available online: https://www.gov.uk/government/publications/greenhouse-gas-reporting-conversion-factors-2022 (accessed on 12 April 2026).
- Pomponi, F.; De Wolf, C.; Moncaster, A. Embodied Carbon in Buildings: Measurement, Management, and Mitigation; Springer: Cham, Switzerland, 2018. [Google Scholar] [CrossRef] [Scilit]
- ISO 14025; Environmental Labels and Declarations—Type III Environmental Declarations—Principles and Procedures. ISO: Geneva, Switzerland, 2017. Available online: https://www.iso.org/standard/38131.html (accessed on 12 April 2026).
- Cook, J.; Oreskes, N.; Doran, P.T.; Anderegg, W.R.L.; Verheggen, B.; Maibach, E.W.; Carlton, J.S.; Lewandowsky, S.; Skuce, A.G.; Green, S.A.; et al. Consensus on consensus: A synthesis of consensus estimates on human-caused global warming. Environ. Res. Lett. 2016, 11, 048002. [Google Scholar] [CrossRef] [Scilit]
- Harries, J.E.; Brindley, H.E.; Sagoo, P.J.; Bantges, R.J. Increases in greenhouse forcing inferred from the outgoing longwave radiation spectra of the Earth in 1970 and 1997. Nature 2001, 410, 355–357. [Google Scholar] [CrossRef] [Scilit]
- Nassar, R.; Logan, J.A.; Worden, H.M.; Megretskaia, I.A.; Bowman, K.W.; Osterman, G.B.; Thompson, A.M.; Tarasick, D.W.; Austin, S.; Claude, H.; et al. Validation of Tropospheric Emission Spectrometer (TES) nadir ozone profiles using ozonesonde measurements. J. Geophys. Res. Atmos. 2008, 113, D15S17. [Google Scholar] [CrossRef] [Scilit]
- Chen, C.; Habert, G.; Bouzidi, Y.; Jullien, A. Environmental impact of cement production: Detail of the different processes and cement plant variability evaluation. J. Clean. Prod. 2010, 18, 478–485. [Google Scholar] [CrossRef] [Scilit]
- Scrivener, K.L.; John, V.M.; Gartner, E.M. Eco-efficient cements: Potential economically viable solutions for a low-CO2 cement-based materials industry. Cem. Concr. Res. 2018, 114, 2–26. [Google Scholar] [CrossRef] [Scilit]
- Ivanova, D.; Barrett, J.; Wiedenhofer, D.; Macura, B.; Callaghan, M.; Creutzig, F. Quantifying the potential for climate change mitigation of consumption options. Environ. Res. Lett. 2020, 15, 093001. [Google Scholar] [CrossRef] [Scilit]
- United Nations Environment Programme. Environmental Effects and Interactions of Stratospheric Ozone Depletion: 2018 Assessment; UNEP: Nairobi, Kenya, 2019; Available online: https://www.unep.org/resources/report/environmental-effects-and-interactions-scientific-assessment-ozone-depletion-2018 (accessed on 12 April 2026).
- Official Journal of the European Union. Regulation (EU) 2024/3110 of the European Parliament and of the Council of 27 November 2024 Laying Down Harmonised Rules for the Marketing of Construction Products and Repealing Regulation (EU) No 305/2011. 2024. Available online: https://eur-lex.europa.eu/eli/reg/2024/3110/oj/eng (accessed on 12 April 2026).
- Food and Agriculture Organization. Tackling Climate Change Through Livestock: A Global Assessment of Emissions and Mitigation Opportunities; FAO: Rome, Italy, 2013; Available online: https://www.fao.org/3/i3437e.pdf (accessed on 12 April 2026).
- Smith, P.; Martino, D.; Cai, Z.; Gwary, D.; Janzen, H.; Kumar, P.; McCarl, B.; Ogle, S.; O’Mara, F.; Rice, C.; et al. Greenhouse gas mitigation in agriculture. Philos. Trans. R. Soc. B Biol. Sci. 2008, 363, 789–813. [Google Scholar] [CrossRef] [Scilit]
- Batty, M. The size, scale, and shape of cities. Science 2008, 319, 769–771. [Google Scholar] [CrossRef] [Scilit]
- Kennedy, C.; Pincetl, S.; Bunje, P. The study of urban metabolism and its applications to urban planning and design. Environ. Pollut. 2011, 159, 1965–1973. [Google Scholar] [CrossRef] [Scilit]
- Allam, Z.; Newman, P. Redefining the smart city: Culture, metabolism and governance. Smart Cities 2018, 1, 4–25. [Google Scholar] [CrossRef] [Scilit]
- Moreno, C.; Allam, Z.; Chabaud, D.; Gall, C.; Pratlong, F. Introducing the “15-Minute City”: Sustainability, Resilience and Place Identity in Future Post-Pandemic Cities. Smart Cities 2021, 4, 93–111. [Google Scholar] [CrossRef] [Scilit]
- Konijnendijk, C.C. Evidence-based guidelines for greener, healthier, more resilient neighborhoods: Introducing the 3–30–300 rule. J. For. Res. 2023, 34, 821–830. [Google Scholar] [CrossRef] [Scilit] [PubMed]
- Pataki, D.E.; Alberti, M.; Cadenasso, M.L.; Felson, A.J.; McDonnell, M.J.; Pincetl, S.; Pouyat, R.V.; Setälä, H.; Whitlow, T.H. The benefits and limits of urban tree planting for environmental and human health. Front. Ecol. Evol. 2021, 9, 603757. [Google Scholar] [CrossRef] [Scilit]
- Rahman, M.A.; Moser, A.; Rötzer, T.; Pauleit, S. Comparing the transpirational and shading effects of two contrasting urban tree species. Urban Ecosyst. 2019, 22, 683–697. [Google Scholar] [CrossRef] [Scilit]
- Li, X.; Zhou, Y.; Yu, S.; Jia, G.; Li, H.; Li, W. Urban heat island impacts on building energy consumption: A review of approaches and findings. Energy 2019, 174, 407–419. [Google Scholar] [CrossRef] [Scilit]
- Shashua-Bar, L.; Hoffman, M.E. Vegetation as a climatic component in the design of an urban street. Energy Build. 2000, 31, 221–235. [Google Scholar] [CrossRef] [Scilit]
- McPherson, E.G.; Simpson, J.R.; Peper, P.J.; Maco, S.E.; Xiao, Q. Municipal forest benefits and costs in five US cities. J. For. 2005, 103, 411–416. [Google Scholar] [CrossRef] [Scilit]
- Hautamäki, R.; Kulmala, L.; Ariluoma, M.; Järvi, L. How Urban Green Infrastructure Contributes to Carbon Neutrality. Build. Cities 2025, 6, 272–280. [Google Scholar] [CrossRef] [Scilit]
- Zhao, L.; Oppenheimer, M.; Zhu, Q.; Baldwin, J.; Ebi, K.L.; Bou-Zeid, E.; Guan, K.; Liu, X. Interactions between urban heat islands and heat waves. Environ. Res. Lett. 2018, 13, 034003. [Google Scholar] [CrossRef] [Scilit]
- Akbari, H.; Levinson, R. Evolution of cool-roof standards in the US. Adv. Build. Energy Res. 2008, 2, 1–32. [Google Scholar] [CrossRef]
- Oke, T.R.; Crowther, J.M.; McNaughton, K.G.; Monteith, J.L.; Gardiner, B. The micrometeorology of the urban forest. Philos. Trans. R. Soc. B Biol. Sci. 1989, 324, 335–349. [Google Scholar] [CrossRef] [Scilit]
- Mazon, J. Integrating Urban Tree Carbon Sequestration into Metropolitan Ecosystem Services for Climate-Neutral Cities: A Citizen Science-Based Methodology. Urban Sci. 2025, 9, 463. [Google Scholar] [CrossRef] [Scilit]
- Hewitt, C.N.; Ashworth, K.; MacKenzie, A.R. Using green infrastructure to improve urban air quality (GI4AQ). Ambio 2019, 49, 62–73. [Google Scholar] [CrossRef] [Scilit]
- International Union for Conservation of Nature. Global Standard for Nature-Based Solutions; IUCN: Gland, Switzerland, 2020. [Google Scholar] [CrossRef] [Scilit]
- Faivre, N.; Fritz, M.; Freitas, T.; de Boissezon, B.; Vandewoestijne, S. Nature-based solutions in the EU: Innovating with nature to address social, economic and environmental challenges. Environ. Res. 2017, 159, 509–518. [Google Scholar] [CrossRef] [Scilit]
- Seddon, N.; Chausson, A.; Berry, P.; Girardin, C.A.J.; Smith, A.; Turner, B. Understanding the value and limits of nature-based solutions to climate change and other global challenges. Philos. Trans. R. Soc. B Biol. Sci. 2020, 375, 20190120. [Google Scholar] [CrossRef] [Scilit]
- Salata, K.; Yiannakou, A. Green infrastructure and climate change adaptation. TeMA-J. Land Use Mobil. Environ. 2016, 9, 7–24. [Google Scholar] [CrossRef] [Scilit]
- Gill, S.E.; Handley, J.F.; Ennos, A.R.; Pauleit, S. Adapting cities for climate change: The role of the green infrastructure. Built Environ. 2007, 33, 115–133. [Google Scholar] [CrossRef] [Scilit]
- Boyce, P.R.; Fotios, S.; Richards, M. Road lighting and energy saving. Light. Res. Technol. 2009, 41, 245–260. [Google Scholar] [CrossRef] [Scilit]
- International Energy Agency. Lighting (Energy Technology Perspectives/Tracking Report). 2022. Available online: https://www.iea.org/reports/lighting (accessed on 12 April 2026).
- Kyba, C.C.M.; Kuester, T.; de Miguel, A.S.; Baugh, K.; Jechow, A.; Hölker, F.; Bennie, J.; Elvidge, C.D.; Gaston, K.J.; Guanter, L.; et al. Artificially lit surface of Earth at night increasing in radiance and extent. Sci. Adv. 2017, 3, e1701528. [Google Scholar] [CrossRef] [Scilit]
- Camacho-Otero, J.; Boks, C.; Pettersen, I.N. Consumption in the Circular Economy: A Literature Review. Sustainability 2018, 10, 2758. [Google Scholar] [CrossRef] [Scilit]
- Vidal-Ayuso, F.; Akhmedova, A.; Jaca, C. The circular economy and consumer behaviour: Literature review and research directions. J. Clean. Prod. 2023, 418, 137824. [Google Scholar] [CrossRef] [Scilit]
- Ghisellini, P.; Cialani, C.; Ulgiati, S. A review on circular economy: The expected transition to a balanced interplay of environmental and economic systems. J. Clean. Prod. 2016, 114, 11–32. [Google Scholar] [CrossRef] [Scilit]
- Petit-Boix, A.; Leipold, S. Circular Economy in Cities: Reviewing How Environmental Research Aligns with Local Practices. J. Clean. Prod. 2018, 195, 1270–1281. [Google Scholar] [CrossRef] [Scilit]
- Woznicki, S.A.; Hondula, K.L.; Jarnagin, S.T. Effectiveness of landscape-based green infrastructure for stormwater management in suburban catchments. Hydrol. Process. 2018, 32, 2346–2361. [Google Scholar] [CrossRef] [Scilit]
- Pimpalkhute, P.U.; Rao, S.; Ramachandra, T.V. Carbon Sequestration Potential of Urban Trees. 2010. Available online: https://www.researchgate.net/publication/318471008_Carbon_Sequestration_Potential_of_Urban_Trees (accessed on 12 April 2026).
- Brack, C.L. Pollution mitigation and carbon sequestration by an urban forest. Environ. Pollut. 2002, 116, S195–S200. [Google Scholar] [CrossRef] [Scilit]
- Vasenev, V.; Kuzyakov, Y. Urban Soils as Hotspots of Anthropogenic Carbon Accumulation: Review of Stocks, Mechanisms and Uncertainties. Land Degrad. Dev. 2018, 29, 1607–1622. [Google Scholar] [CrossRef] [Scilit]
- Deng, G. Research on Low-Carbon Living Landscape Garden Environment Design under the Concept of Green Environmental Protection. IOP Conf. Ser. Earth Environ. Sci. 2021, 692, 032008. [Google Scholar] [CrossRef] [Scilit]
- Stoneham, M. Materials and the environment: Eco-informed material choice. Mater. Today 2009, 12, 47. [Google Scholar] [CrossRef] [Scilit]
- Wackernagel, M.; Rees, W.E. Perceptual and structural barriers to investing in natural capital: Economics from an ecological footprint perspective. Ecol. Econ. 1997, 20, 3–24. [Google Scholar] [CrossRef] [Scilit]
- Krexner, T.; Obriejetan, M.; Bauer, A.; Kral, I. Comparative Environmental Life Cycle Assessment of Urban Green Spaces and Design Elements—A Case Study in Vienna. Landsc. Urban Plan. 2025, 259, 105363. [Google Scholar] [CrossRef] [Scilit]
- Nowak, D.J.; Crane, D.E. Carbon storage and sequestration by urban trees in the USA. Environ. Pollut. 2002, 116, 381–389. [Google Scholar] [CrossRef] [Scilit]
- Nowak, D.J.; Crane, D.E.; Stevens, J.C. Air pollution removal by urban trees and shrubs in the United States. Urban For. Urban Green. 2006, 4, 115–123. [Google Scholar] [CrossRef] [Scilit]
- Yang, J.; McBride, J.; Zhou, J.; Sun, Z. The urban forest in Beijing and its role in air pollution reduction. Urban For. Urban Green. 2005, 3, 65–78. [Google Scholar] [CrossRef] [Scilit]
- Fletcher, T.D.; Vietz, G.; Walsh, C.J. Protection of stream ecosystems from urban stormwater runoff: The multiple benefits of an ecohydrological approach. Prog. Phys. Geogr. 2014, 38, 543–555. [Google Scholar] [CrossRef] [Scilit]
- Lettenmeier, M.; Liedtke, C.; Rohn, H. Resource Productivity in 7 Steps: How to Develop Eco-Innovative Products and Services and Improve Their Material Footprint; Wuppertal Institute for Climate, Environment and Energy: Wuppertal, Germany, 2009. [Google Scholar]
- Hoekstra, A.Y.; Wiedmann, T.O. Humanity’s unsustainable environmental footprint. Science 2014, 344, 1114–1117. [Google Scholar] [CrossRef] [Scilit]
- Hoekstra, A.Y.; Chapagain, A.K.; Aldaya, M.M.; Mekonnen, M.M. The Water Footprint Assessment Manual: Setting the Global Standard; Earthscan: London, UK, 2011. [Google Scholar]
- Miller, S.A.; John, V.M.; Pacca, S.A.; Horvath, A. Carbon dioxide reduction potential in the global cement industry by 2050. Cem. Concr. Res. 2017, 114, 115–124. [Google Scholar] [CrossRef] [Scilit]
- Sartori, I.; Hestnes, A.G. Energy use in the life cycle of conventional and low-energy buildings: A review article. Energy Build. 2007, 39, 249–257. [Google Scholar] [CrossRef] [Scilit]
- Azari, R. Life Cycle Energy Consumption of Buildings: Embodied + Operational. In Sustainable Construction Technologies; Elsevier: Amsterdam, The Netherlands, 2019; pp. 51–73. [Google Scholar] [CrossRef] [Scilit]
- Ahern, J. Urban landscape sustainability and resilience: The promise and challenges of integrating ecology with urban planning and design. Landsc. Ecol. 2012, 28, 1203–1212. [Google Scholar] [CrossRef] [Scilit]
- Busu, M.; Nedelcu, A.C. Analyzing the renewable energy and CO2 emission levels nexus at an EU level: A panel data regression approach. Processes 2021, 9, 130. [Google Scholar] [CrossRef] [Scilit]
- Garcia-Fernandez, B.; Omar, O. Sustainable performance in public buildings supported by daylighting technology. Sol. Energy 2023, 264, 112068. [Google Scholar] [CrossRef] [Scilit]
- Energy Performance of Buildings Directive (EU/2024/1275, EPBD) Entered into Force on 28 May 2024 and Will Need to Be Transposed into National Laws by 29 May 2026. Available online: https://eur-lex.europa.eu/legal-content/EN/TXT/?uri=OJ:L_202401275&pk_keyword=Energy&pk_content=Directive (accessed on 12 April 2026).
- Rabczak, S.; Mateichyk, V.; Smieszek, M.; Nowak, K.; Kolomiiets, S. Evaluating the Energy Efficiency of Combining Heat Pumps and Photovoltaic Panels in Eco-Friendly Housing. Appl. Sci. 2024, 14, 5575. [Google Scholar] [CrossRef] [Scilit]
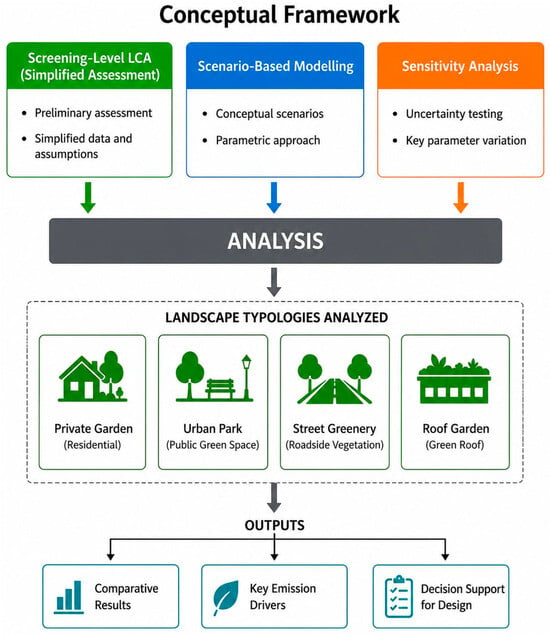
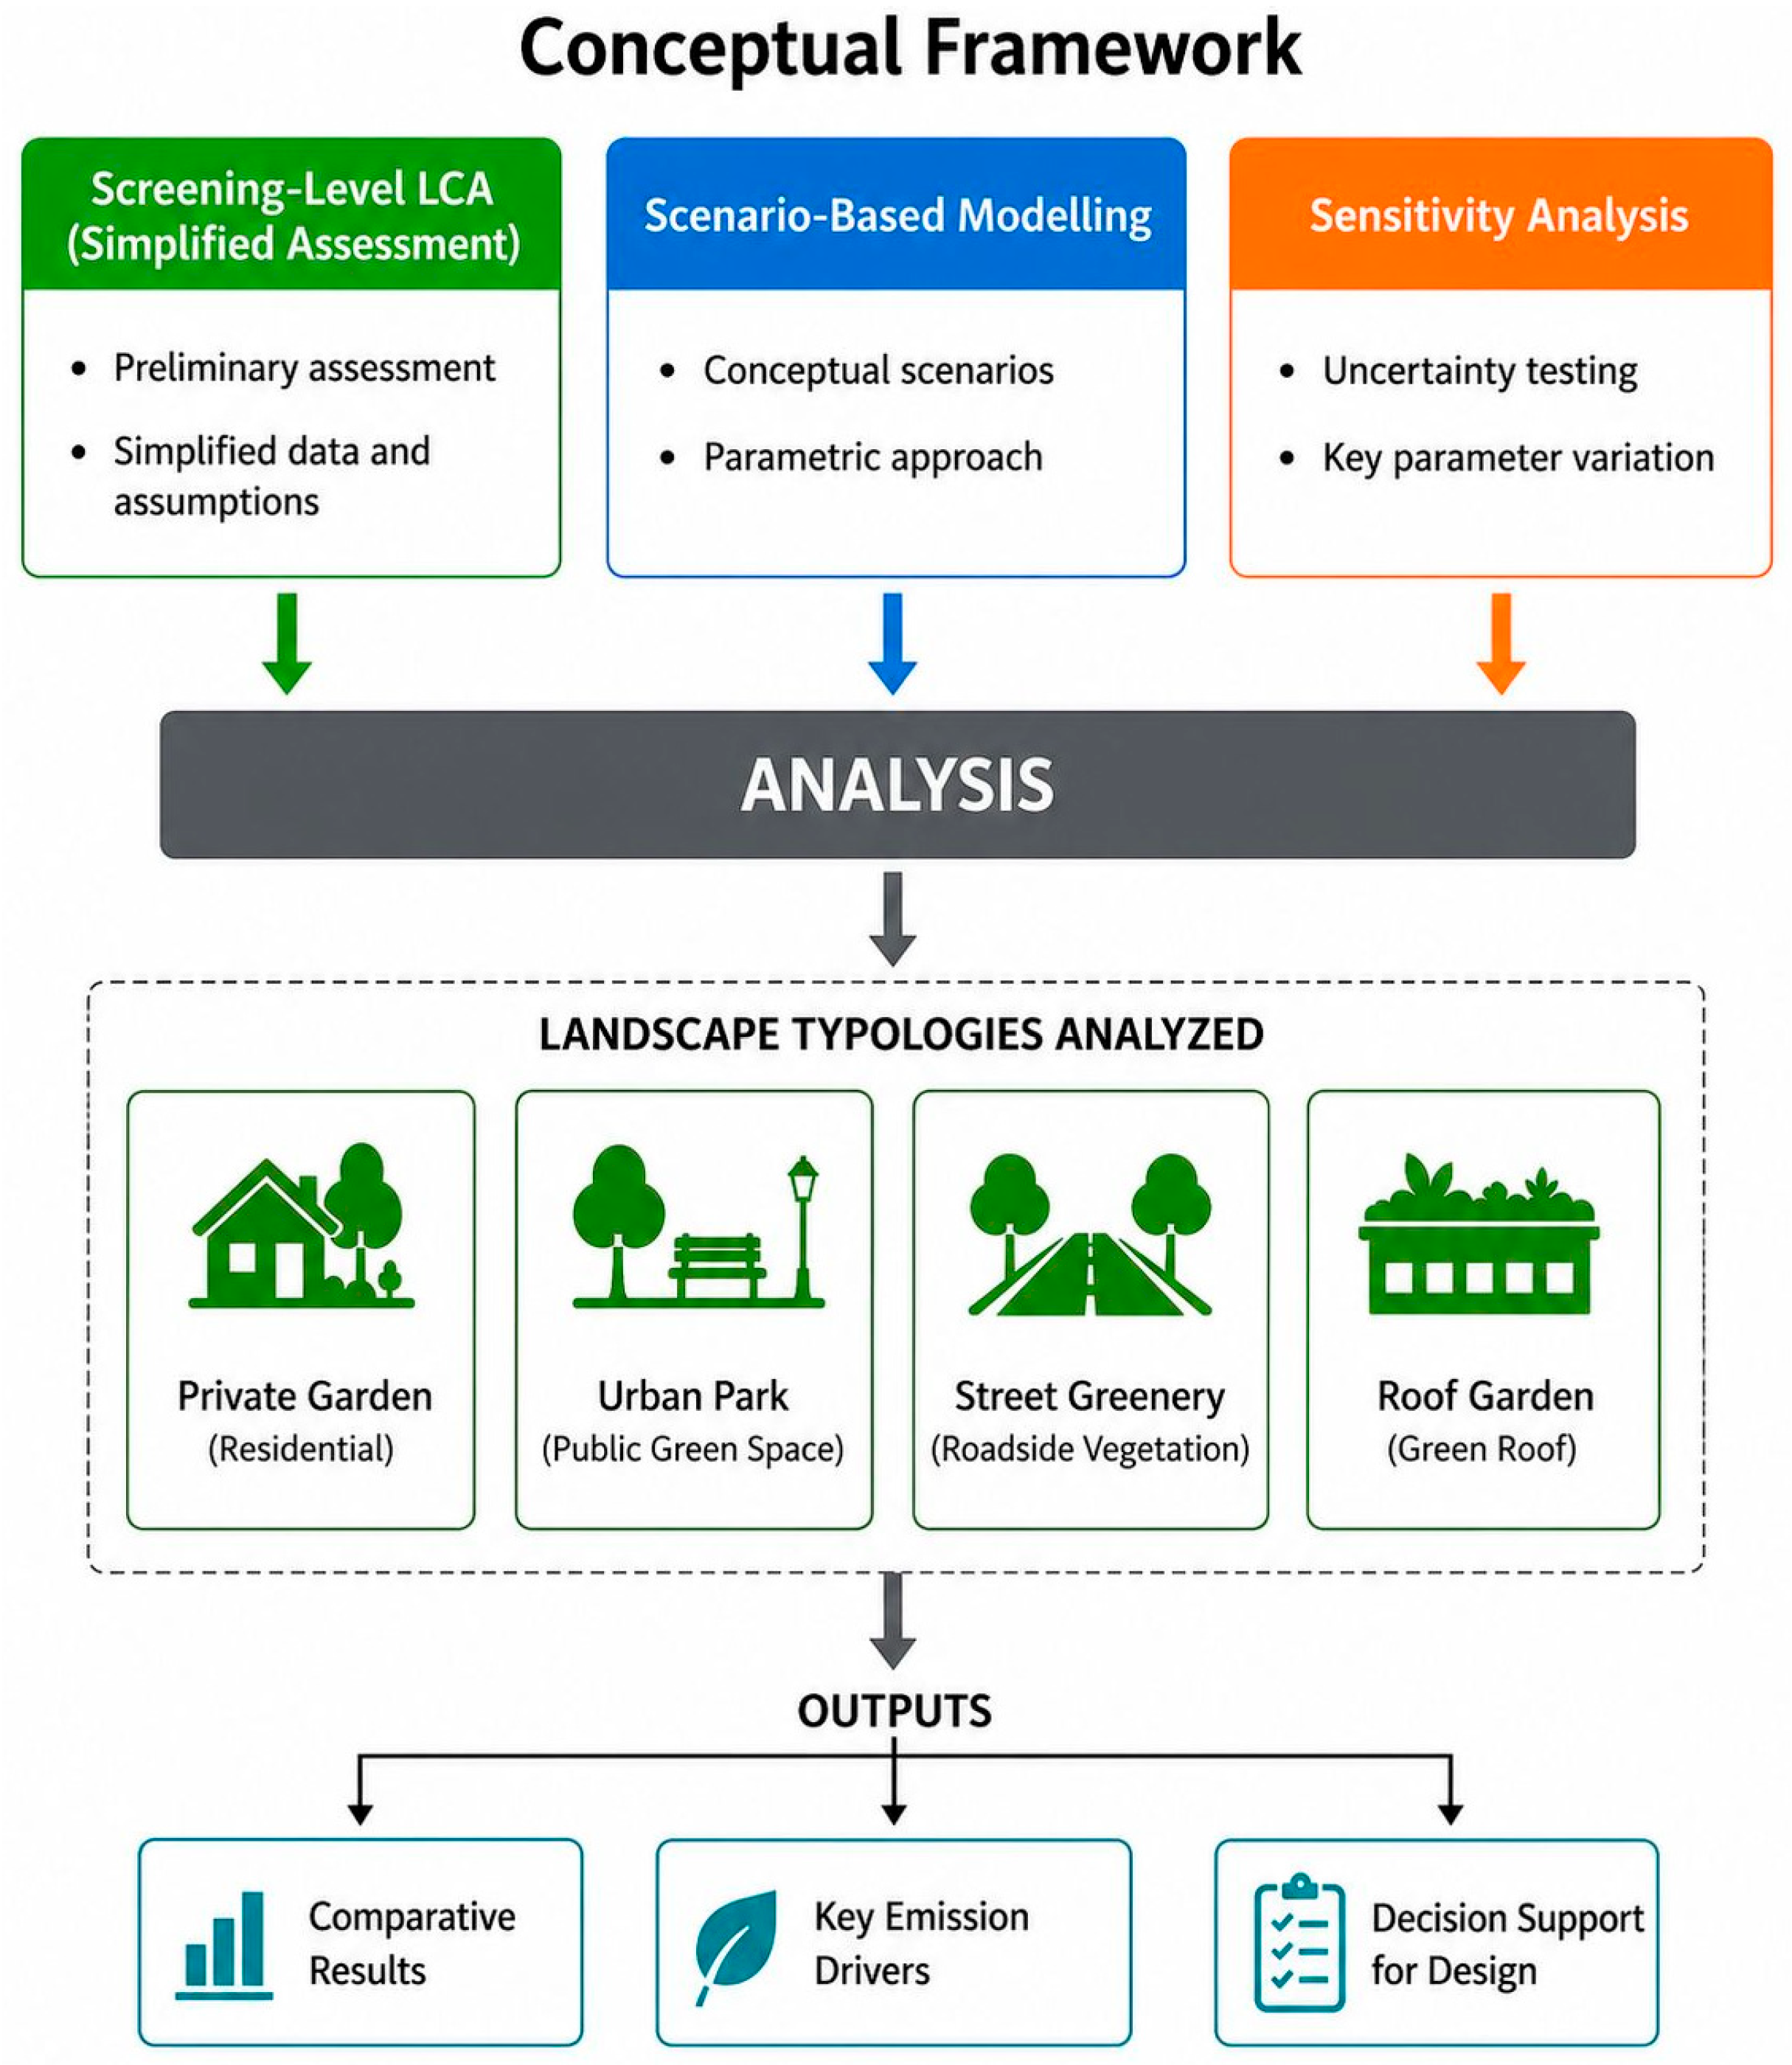
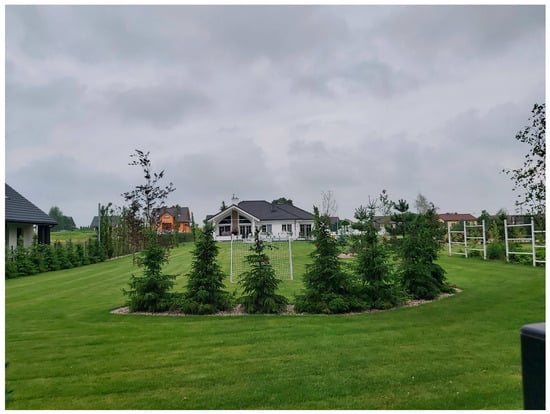
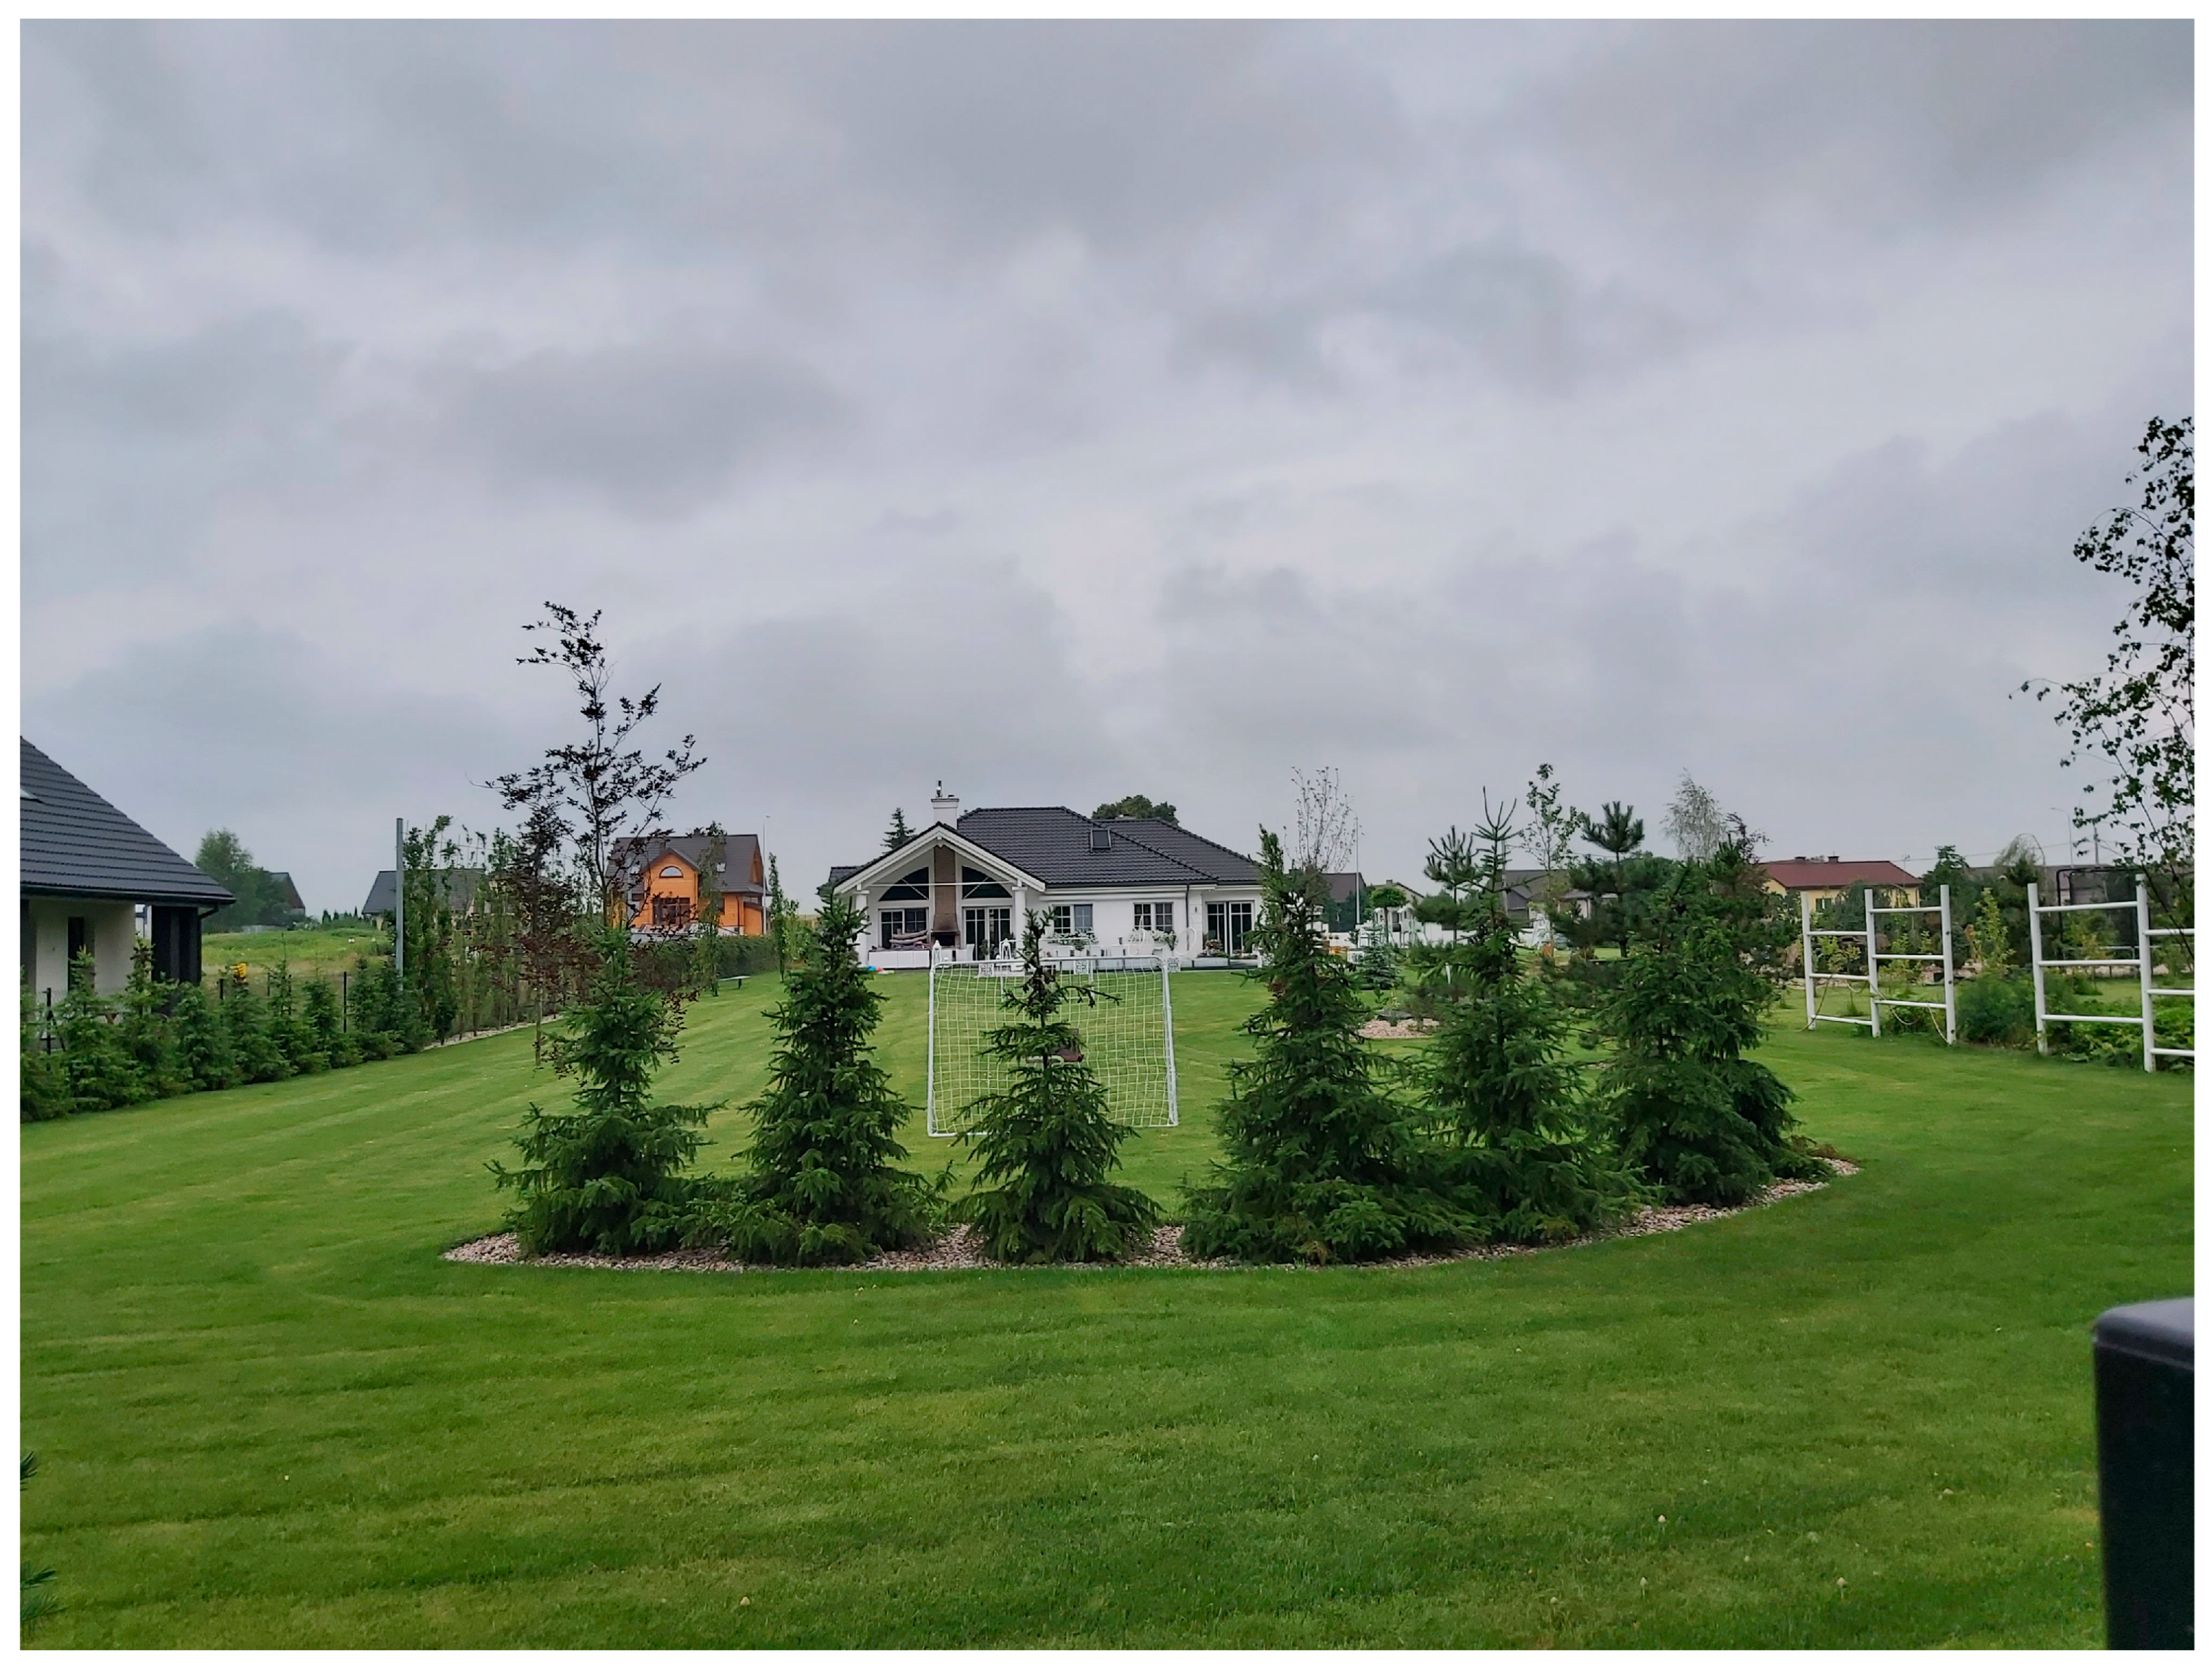
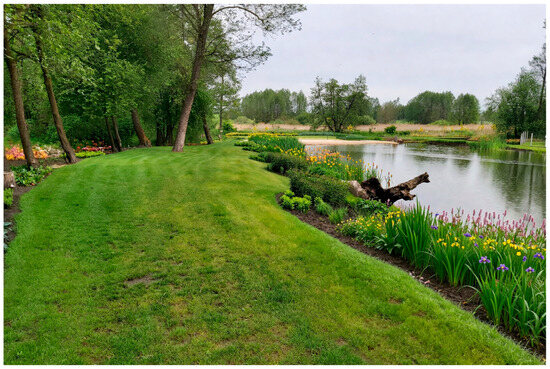
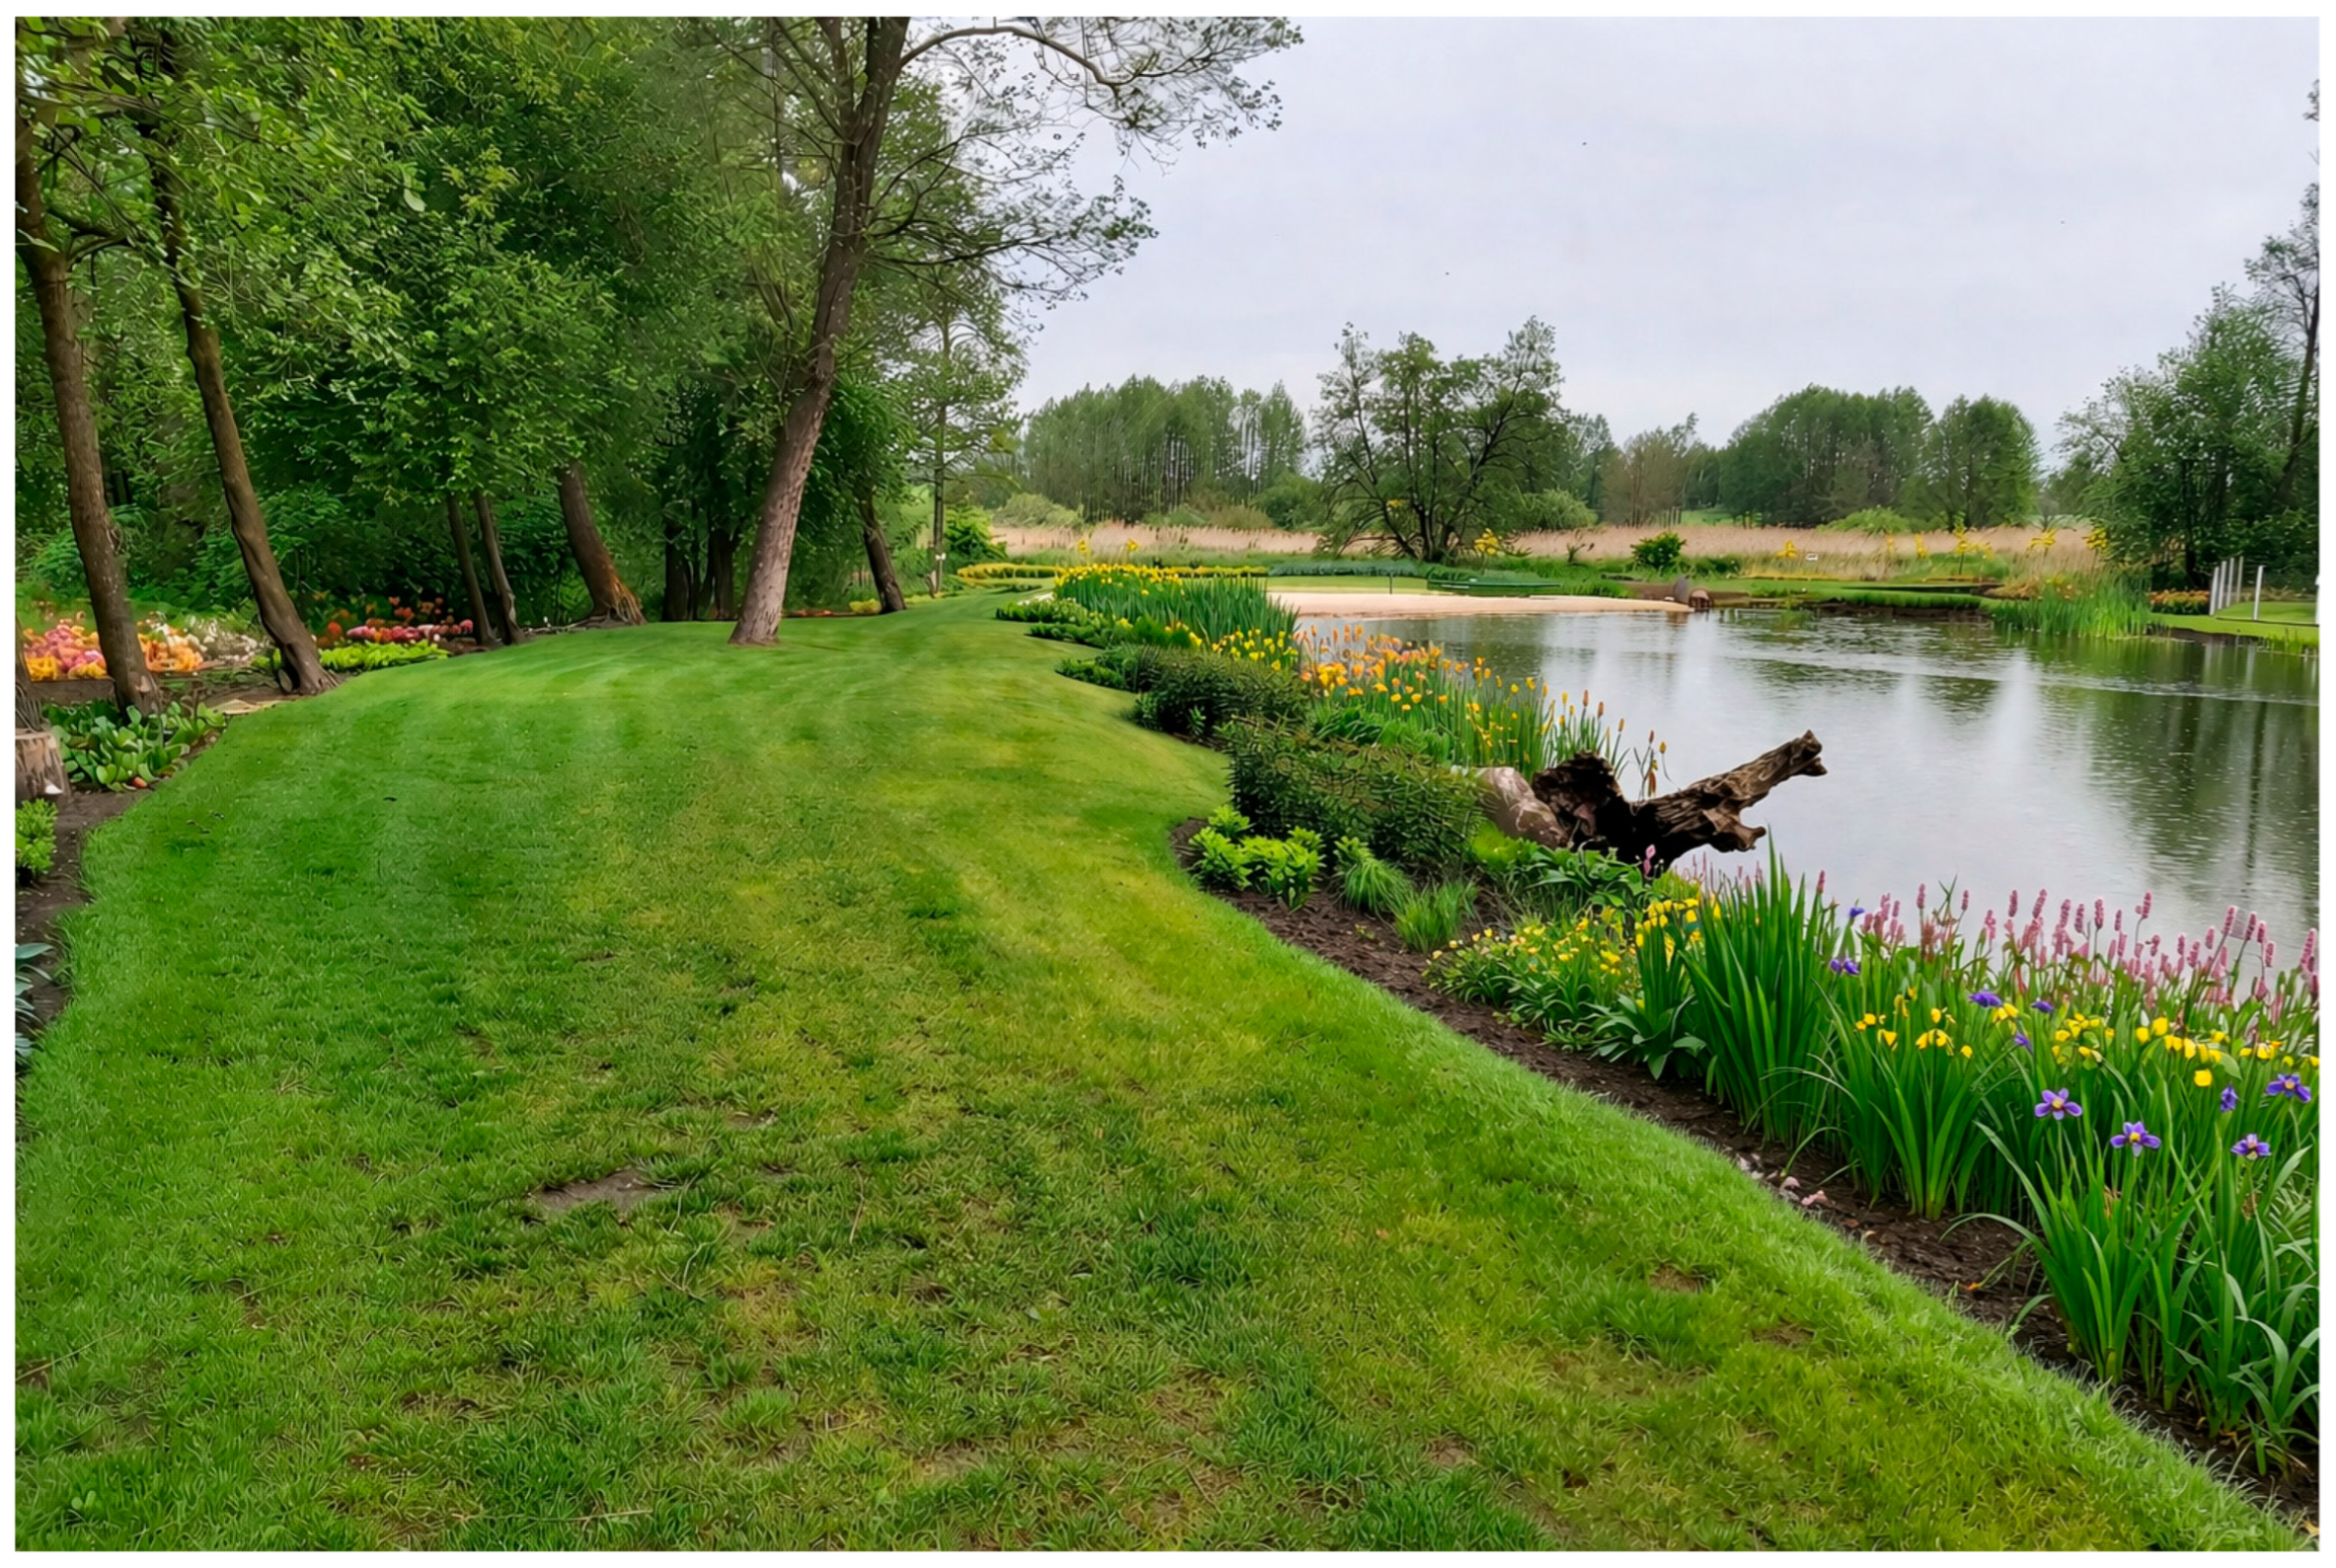
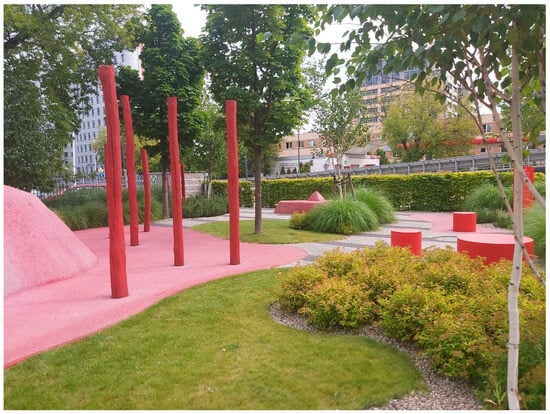
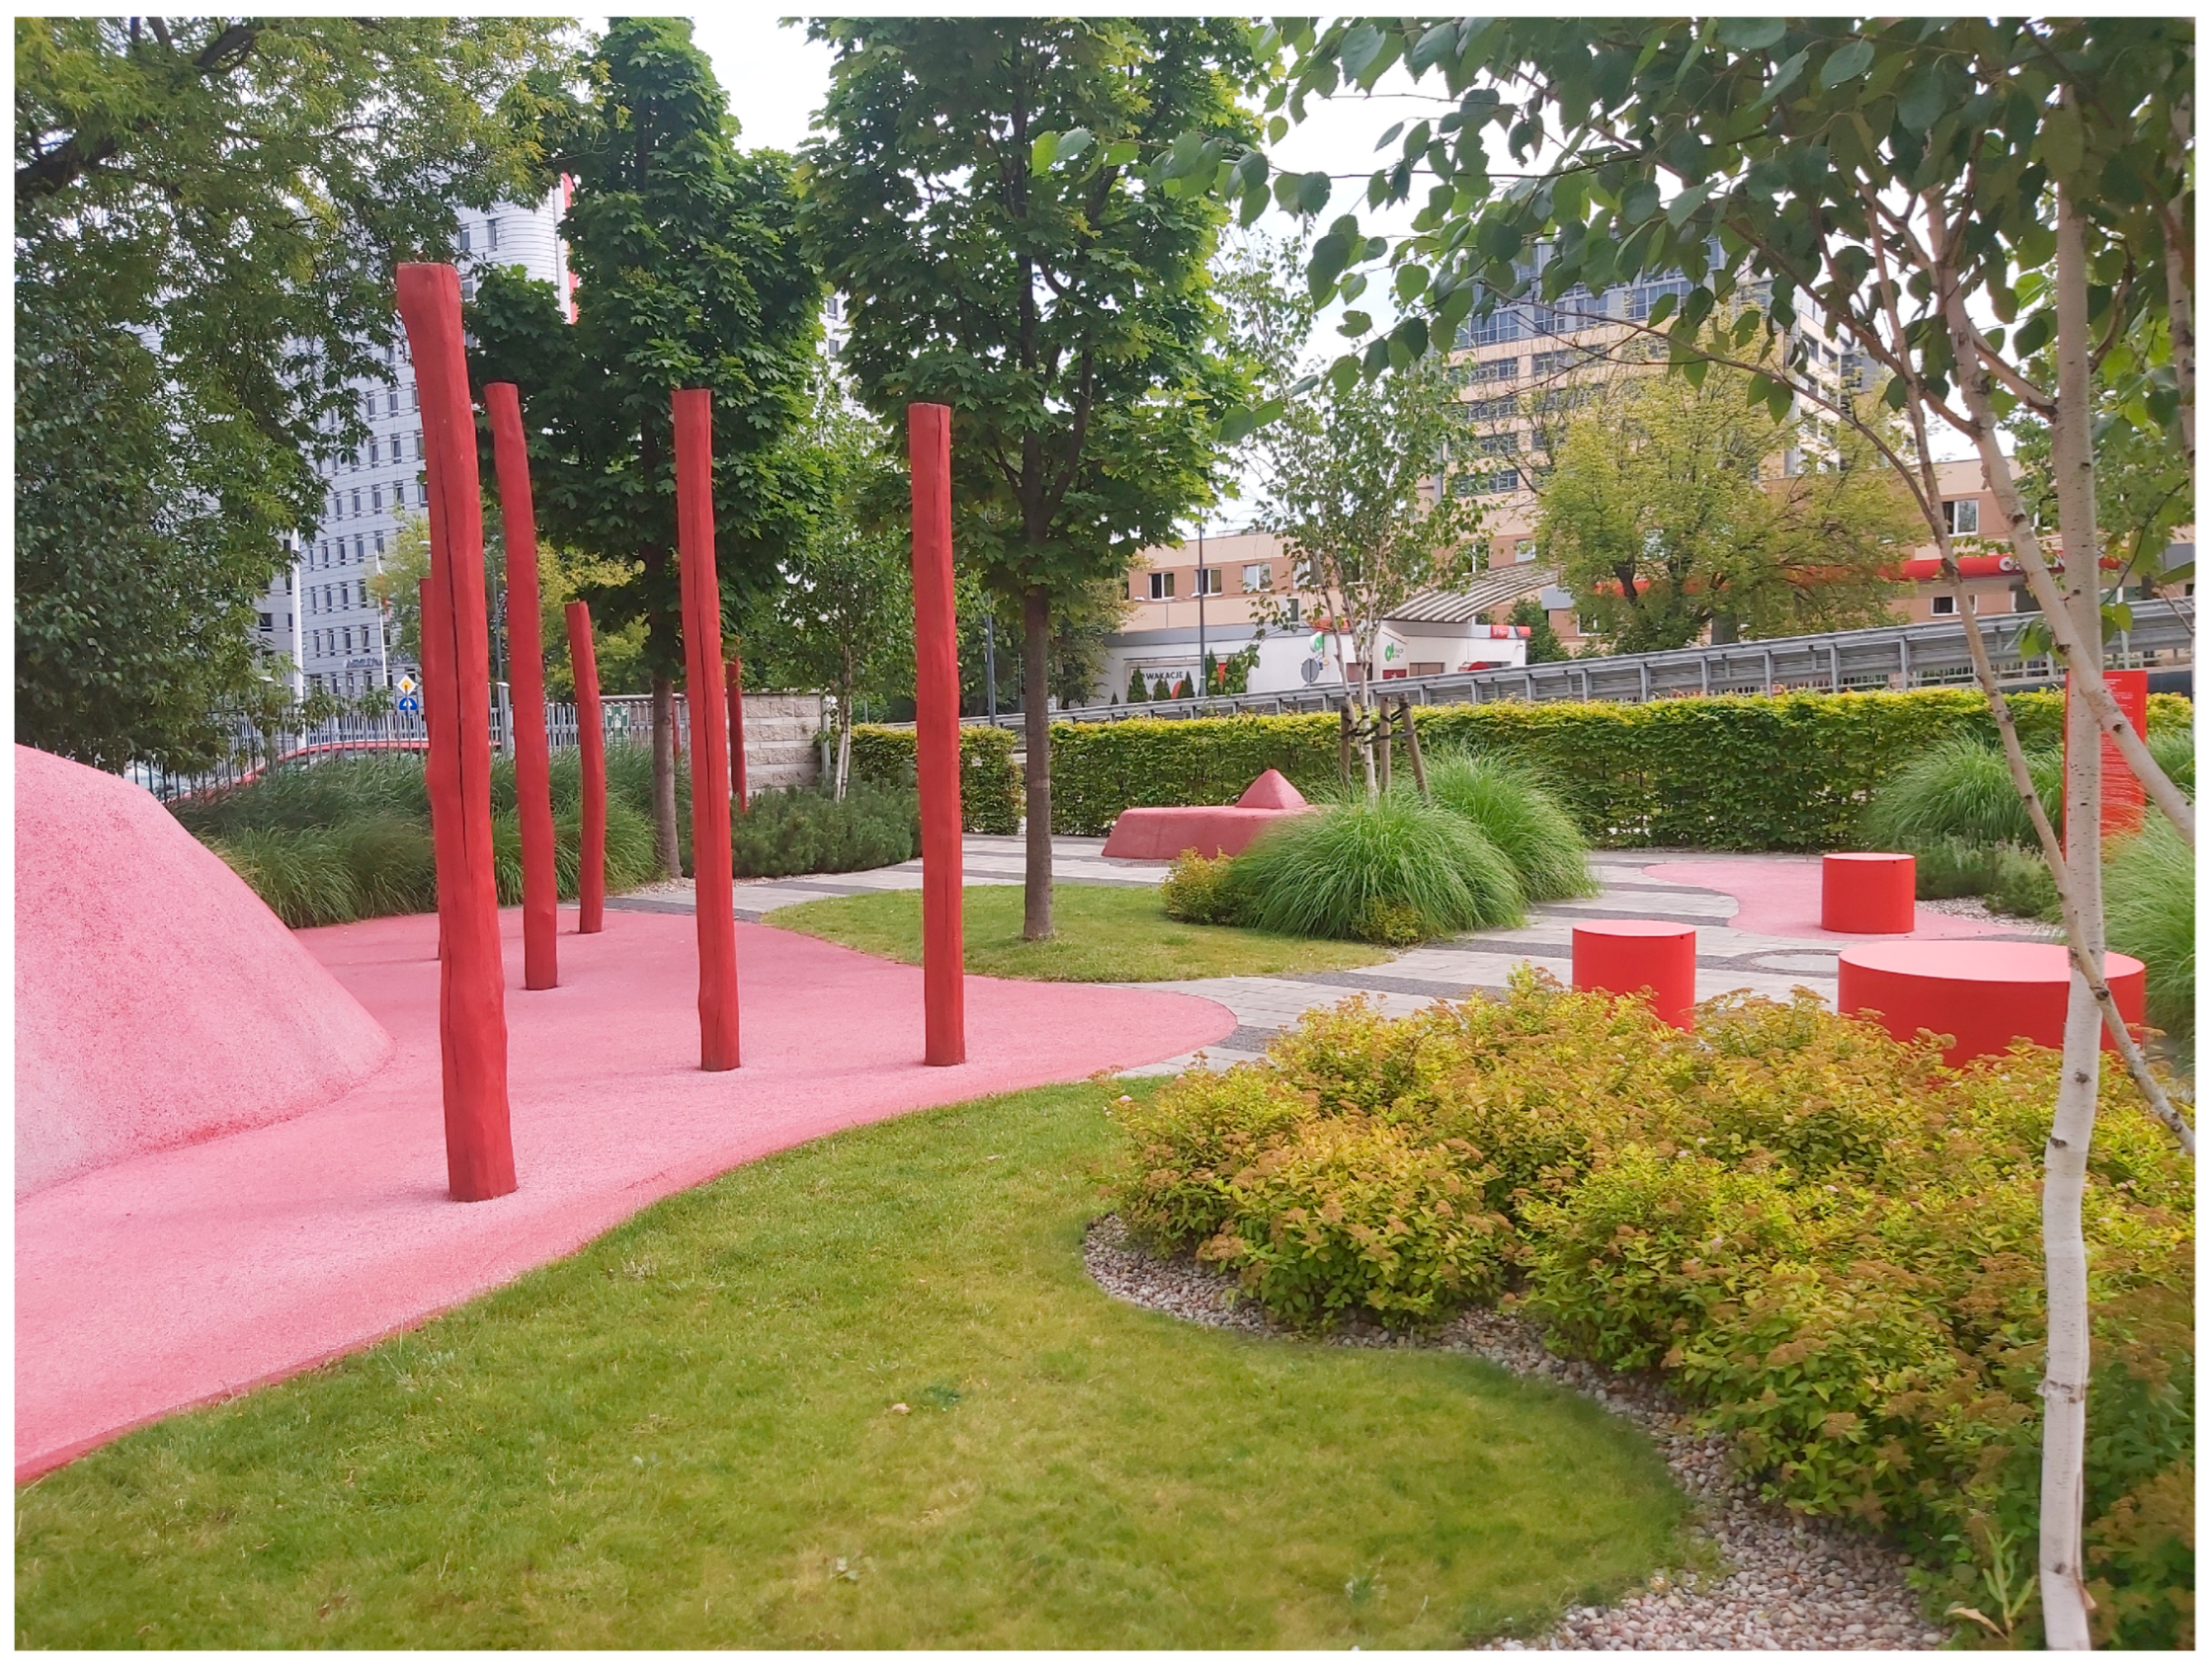
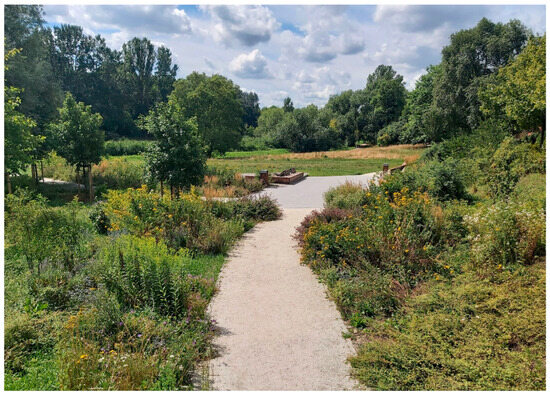
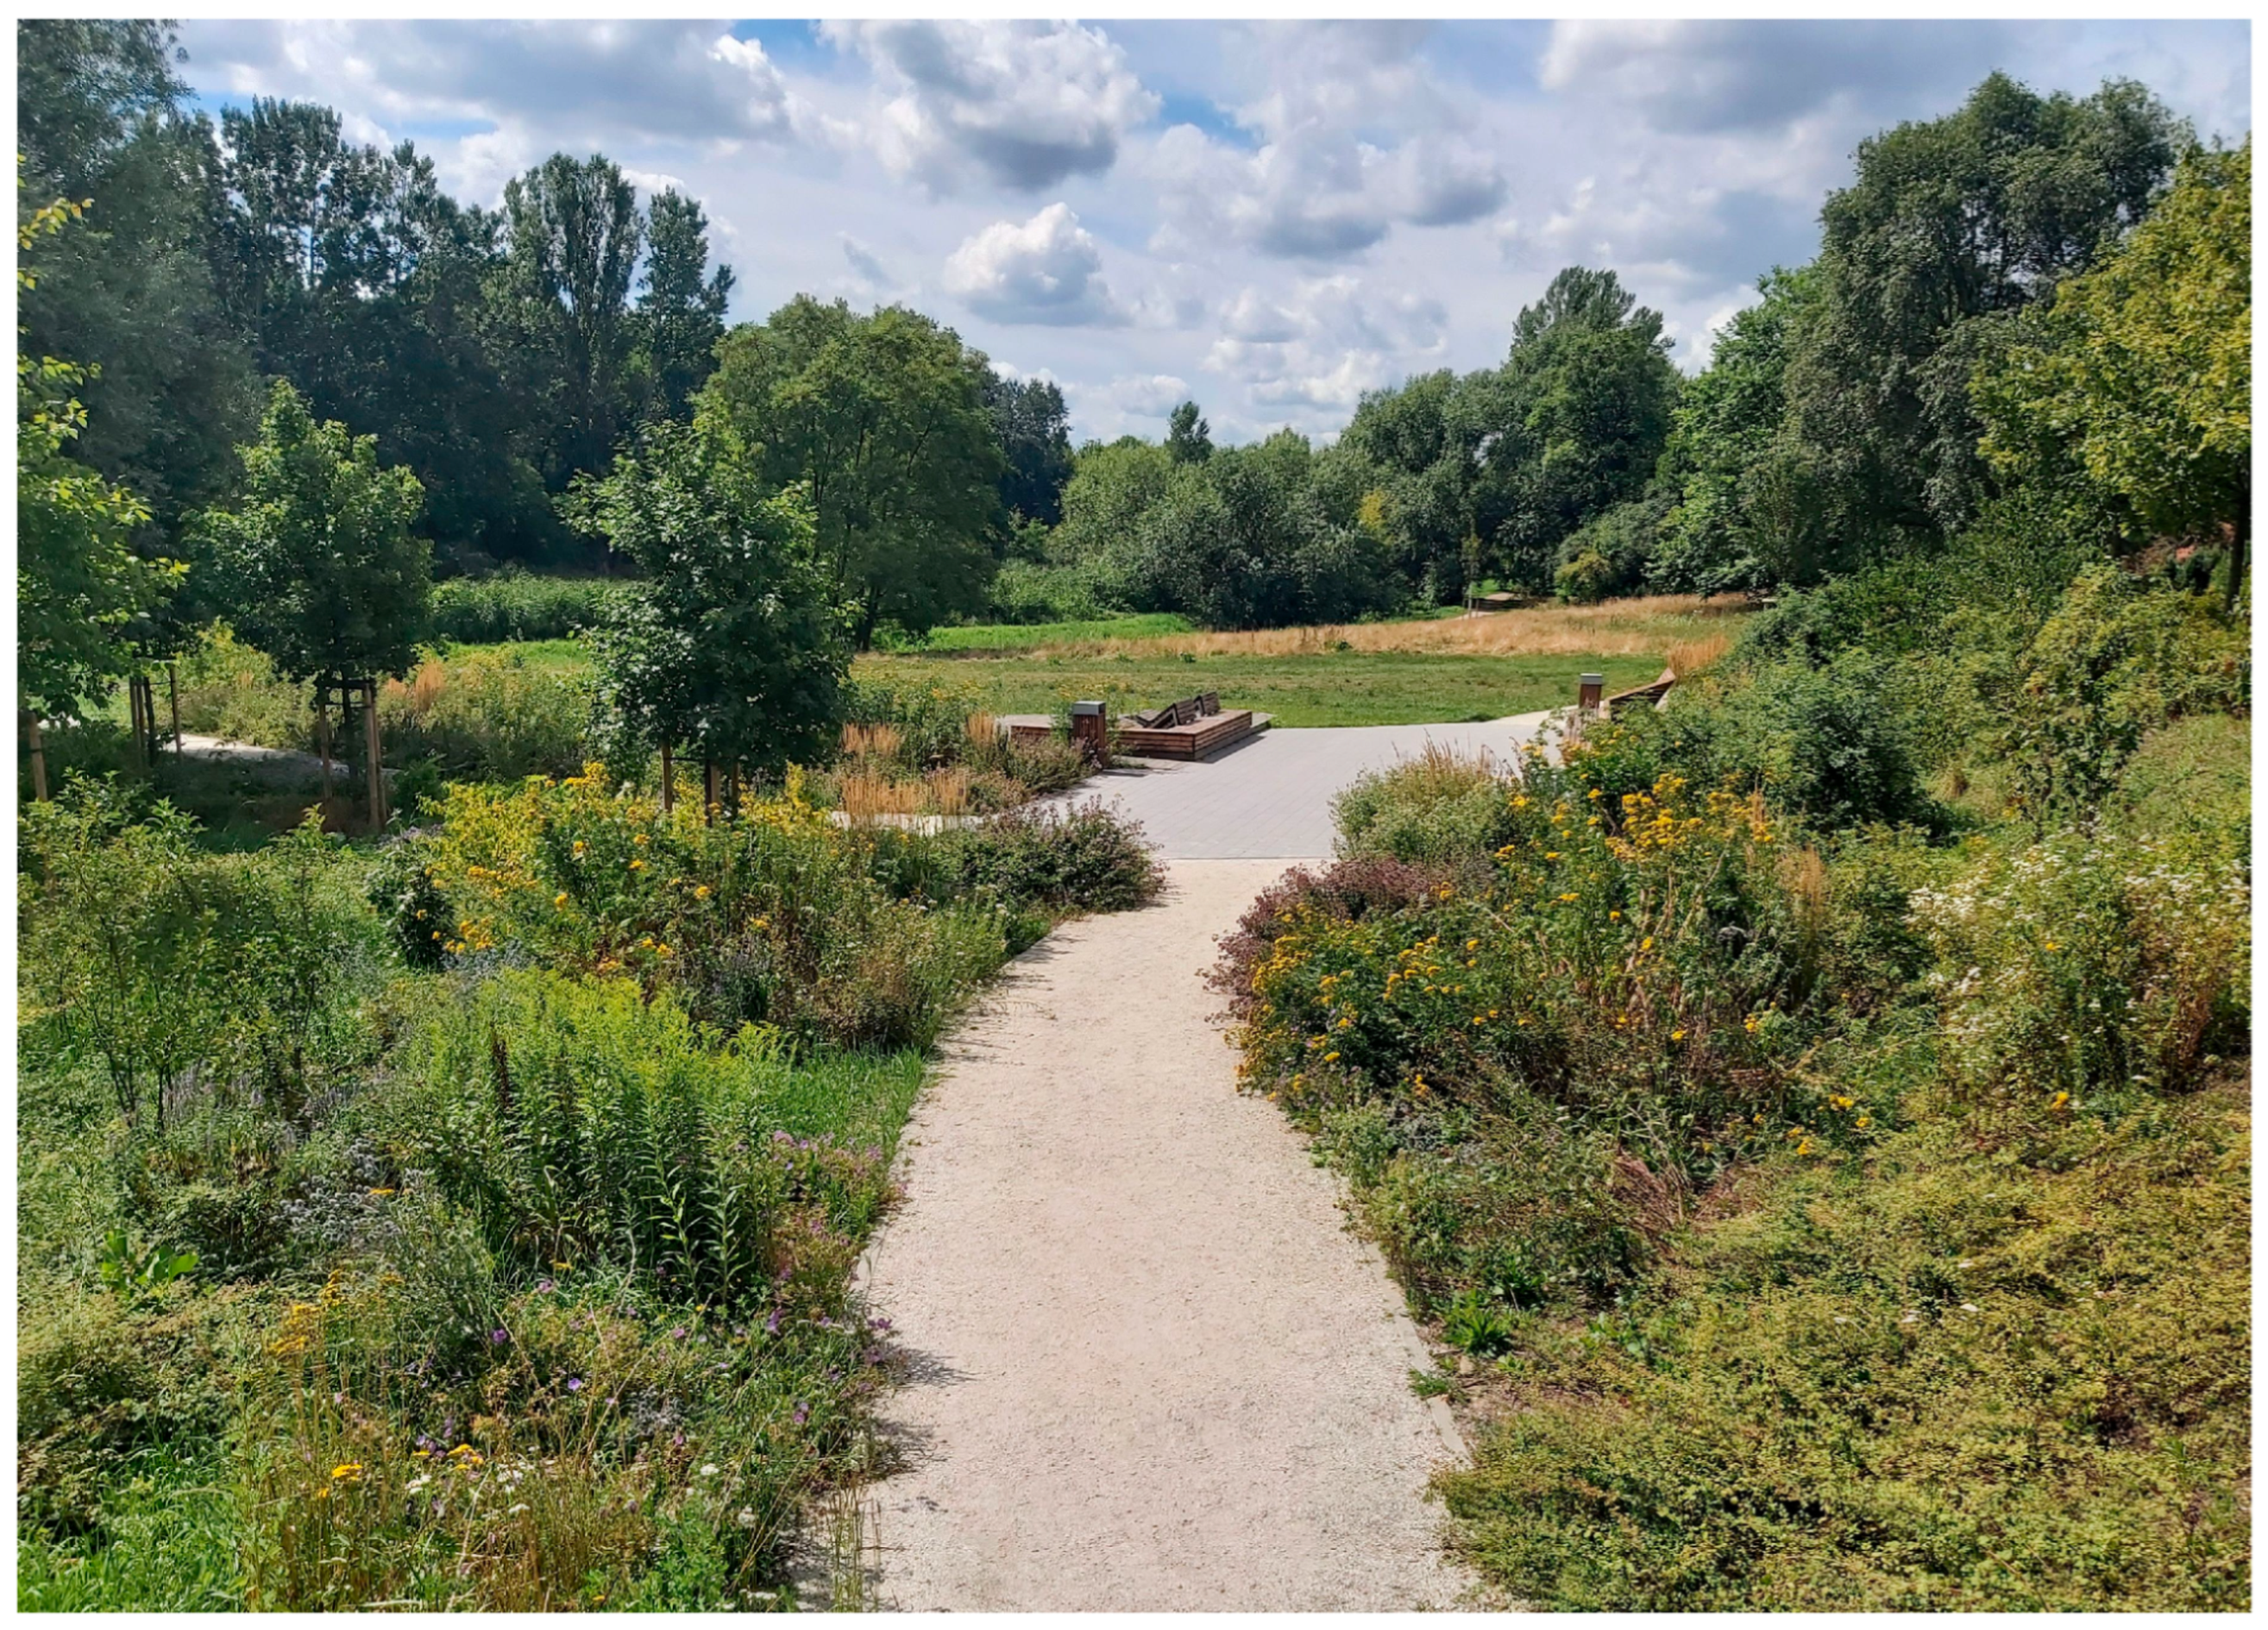
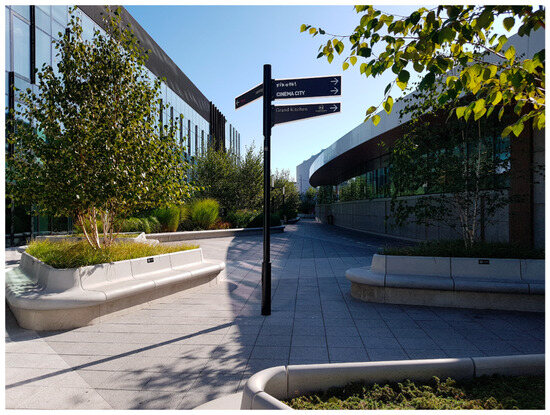
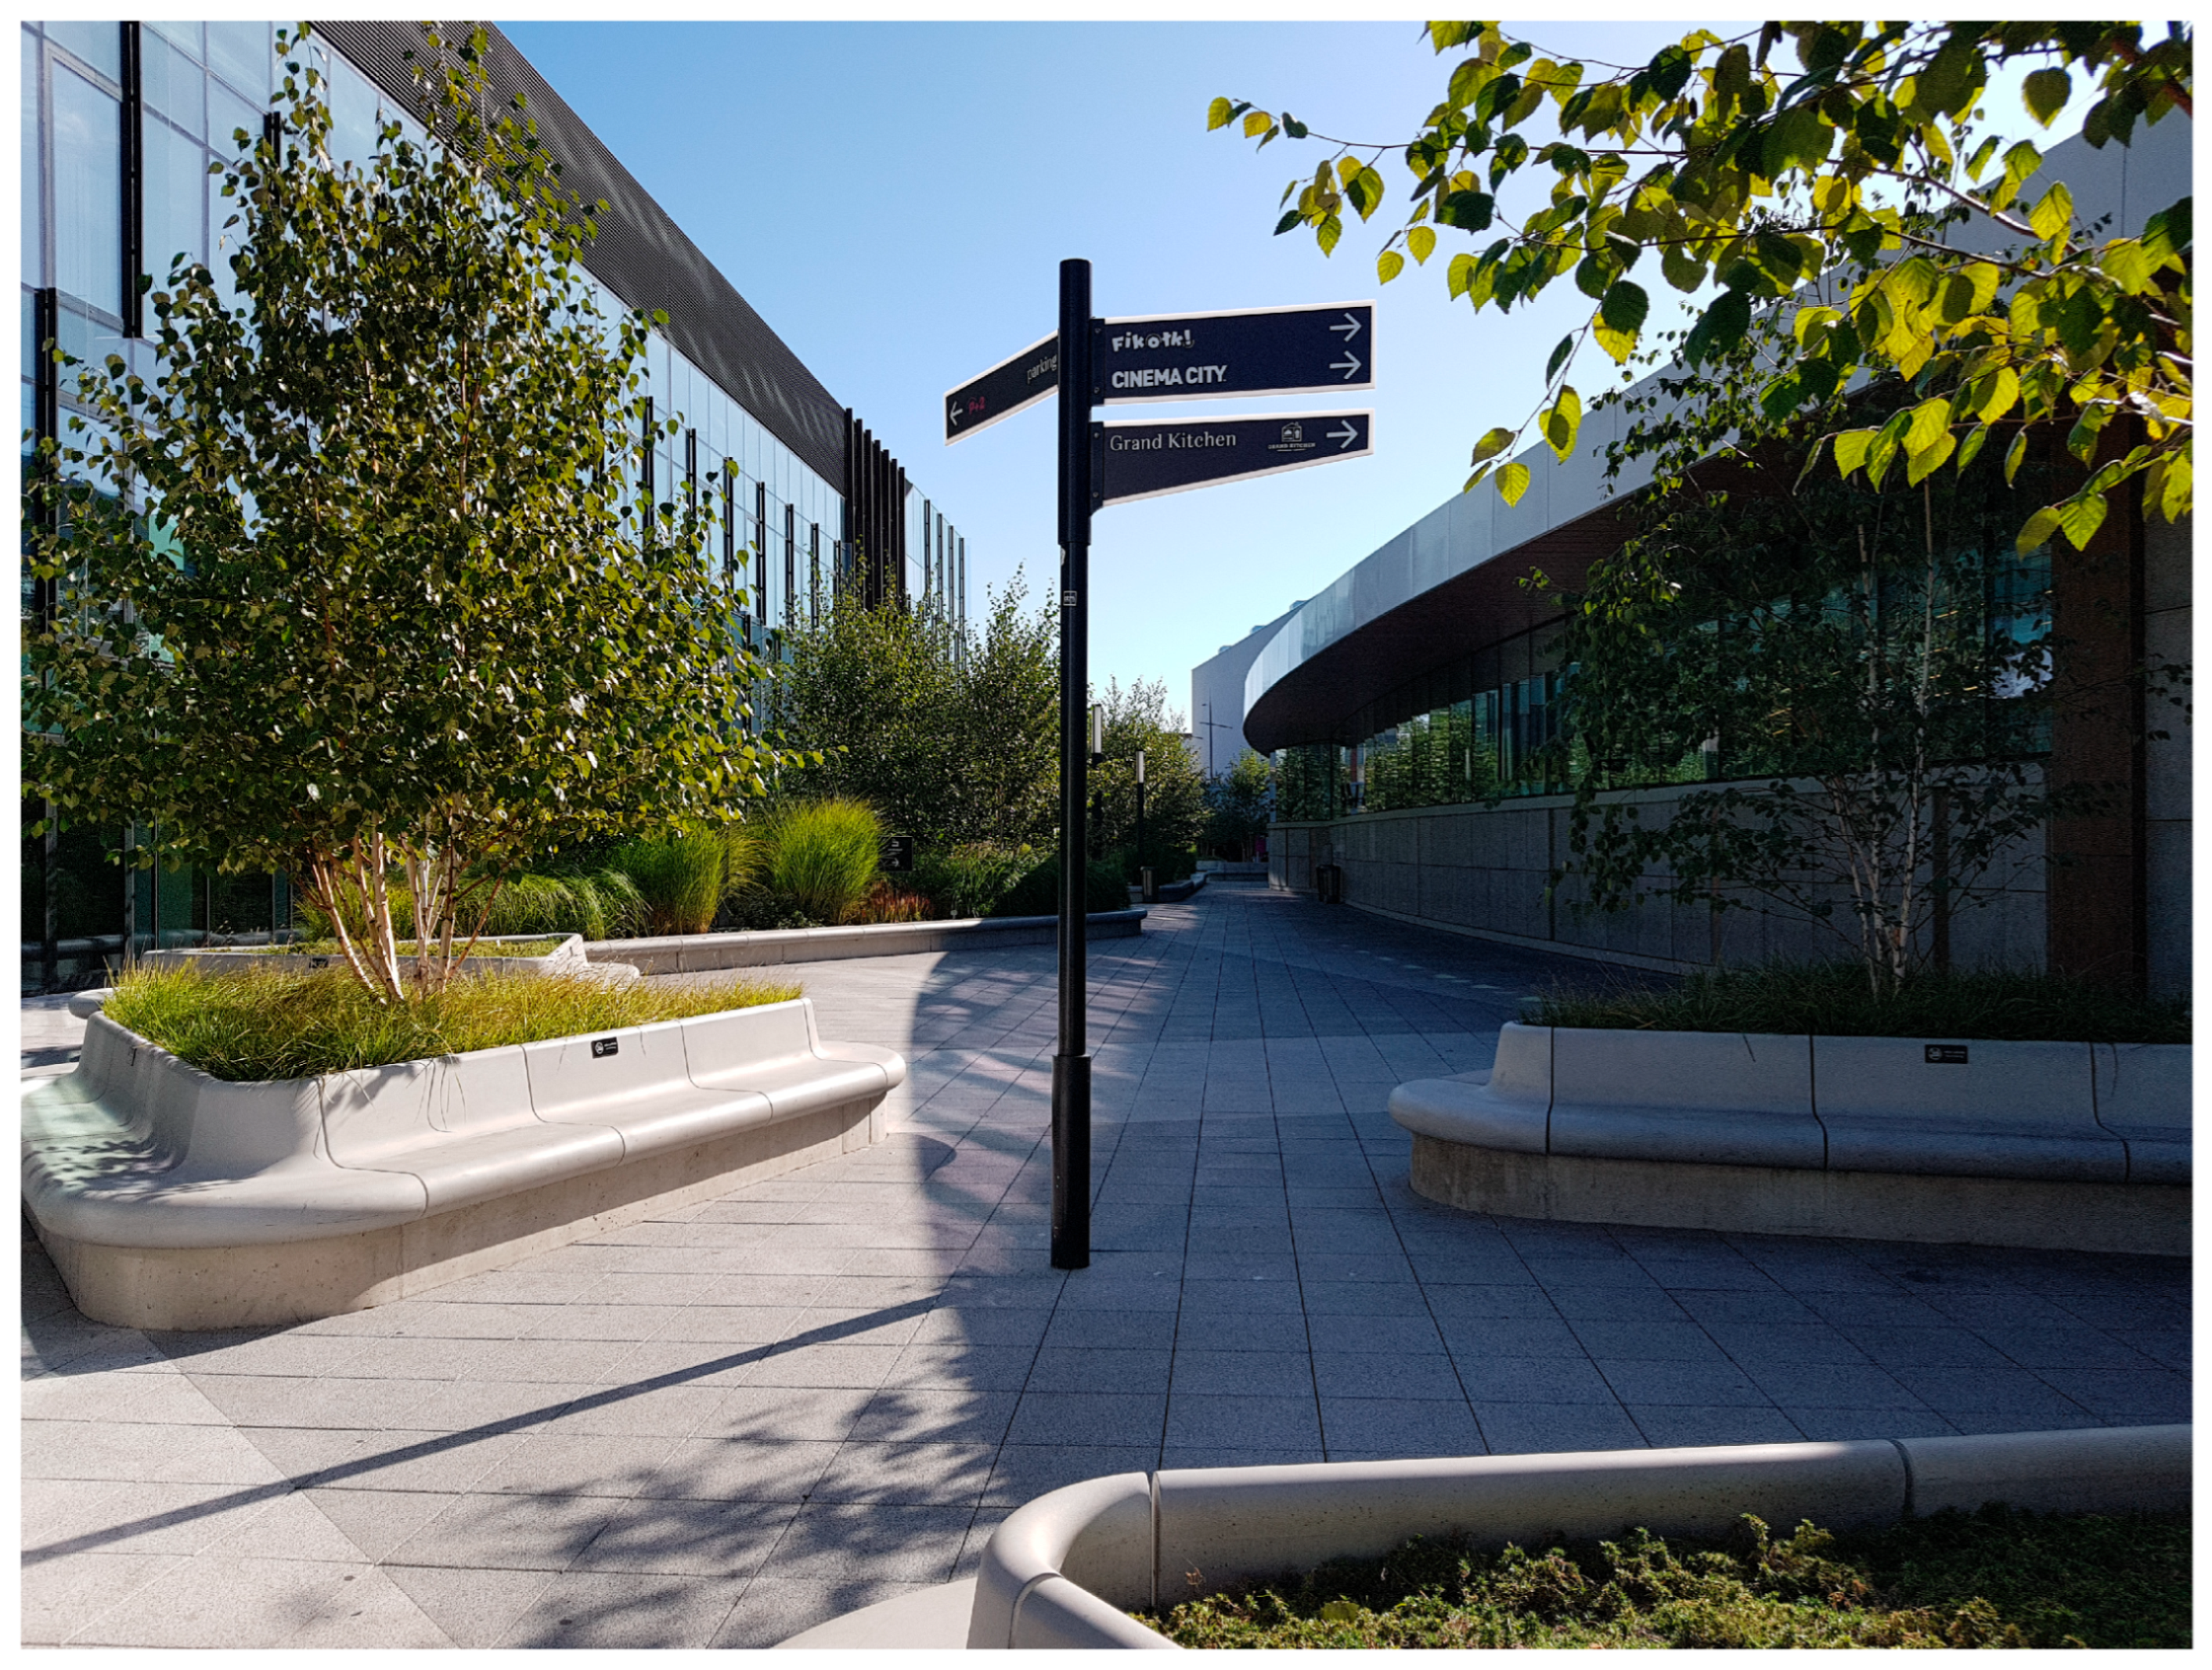
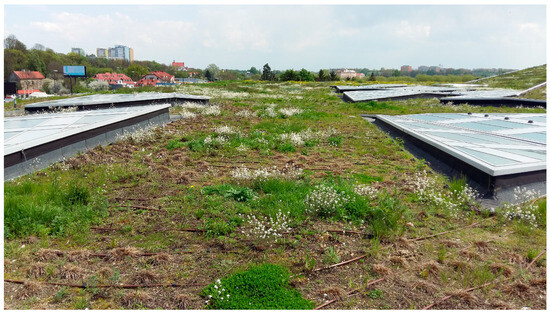
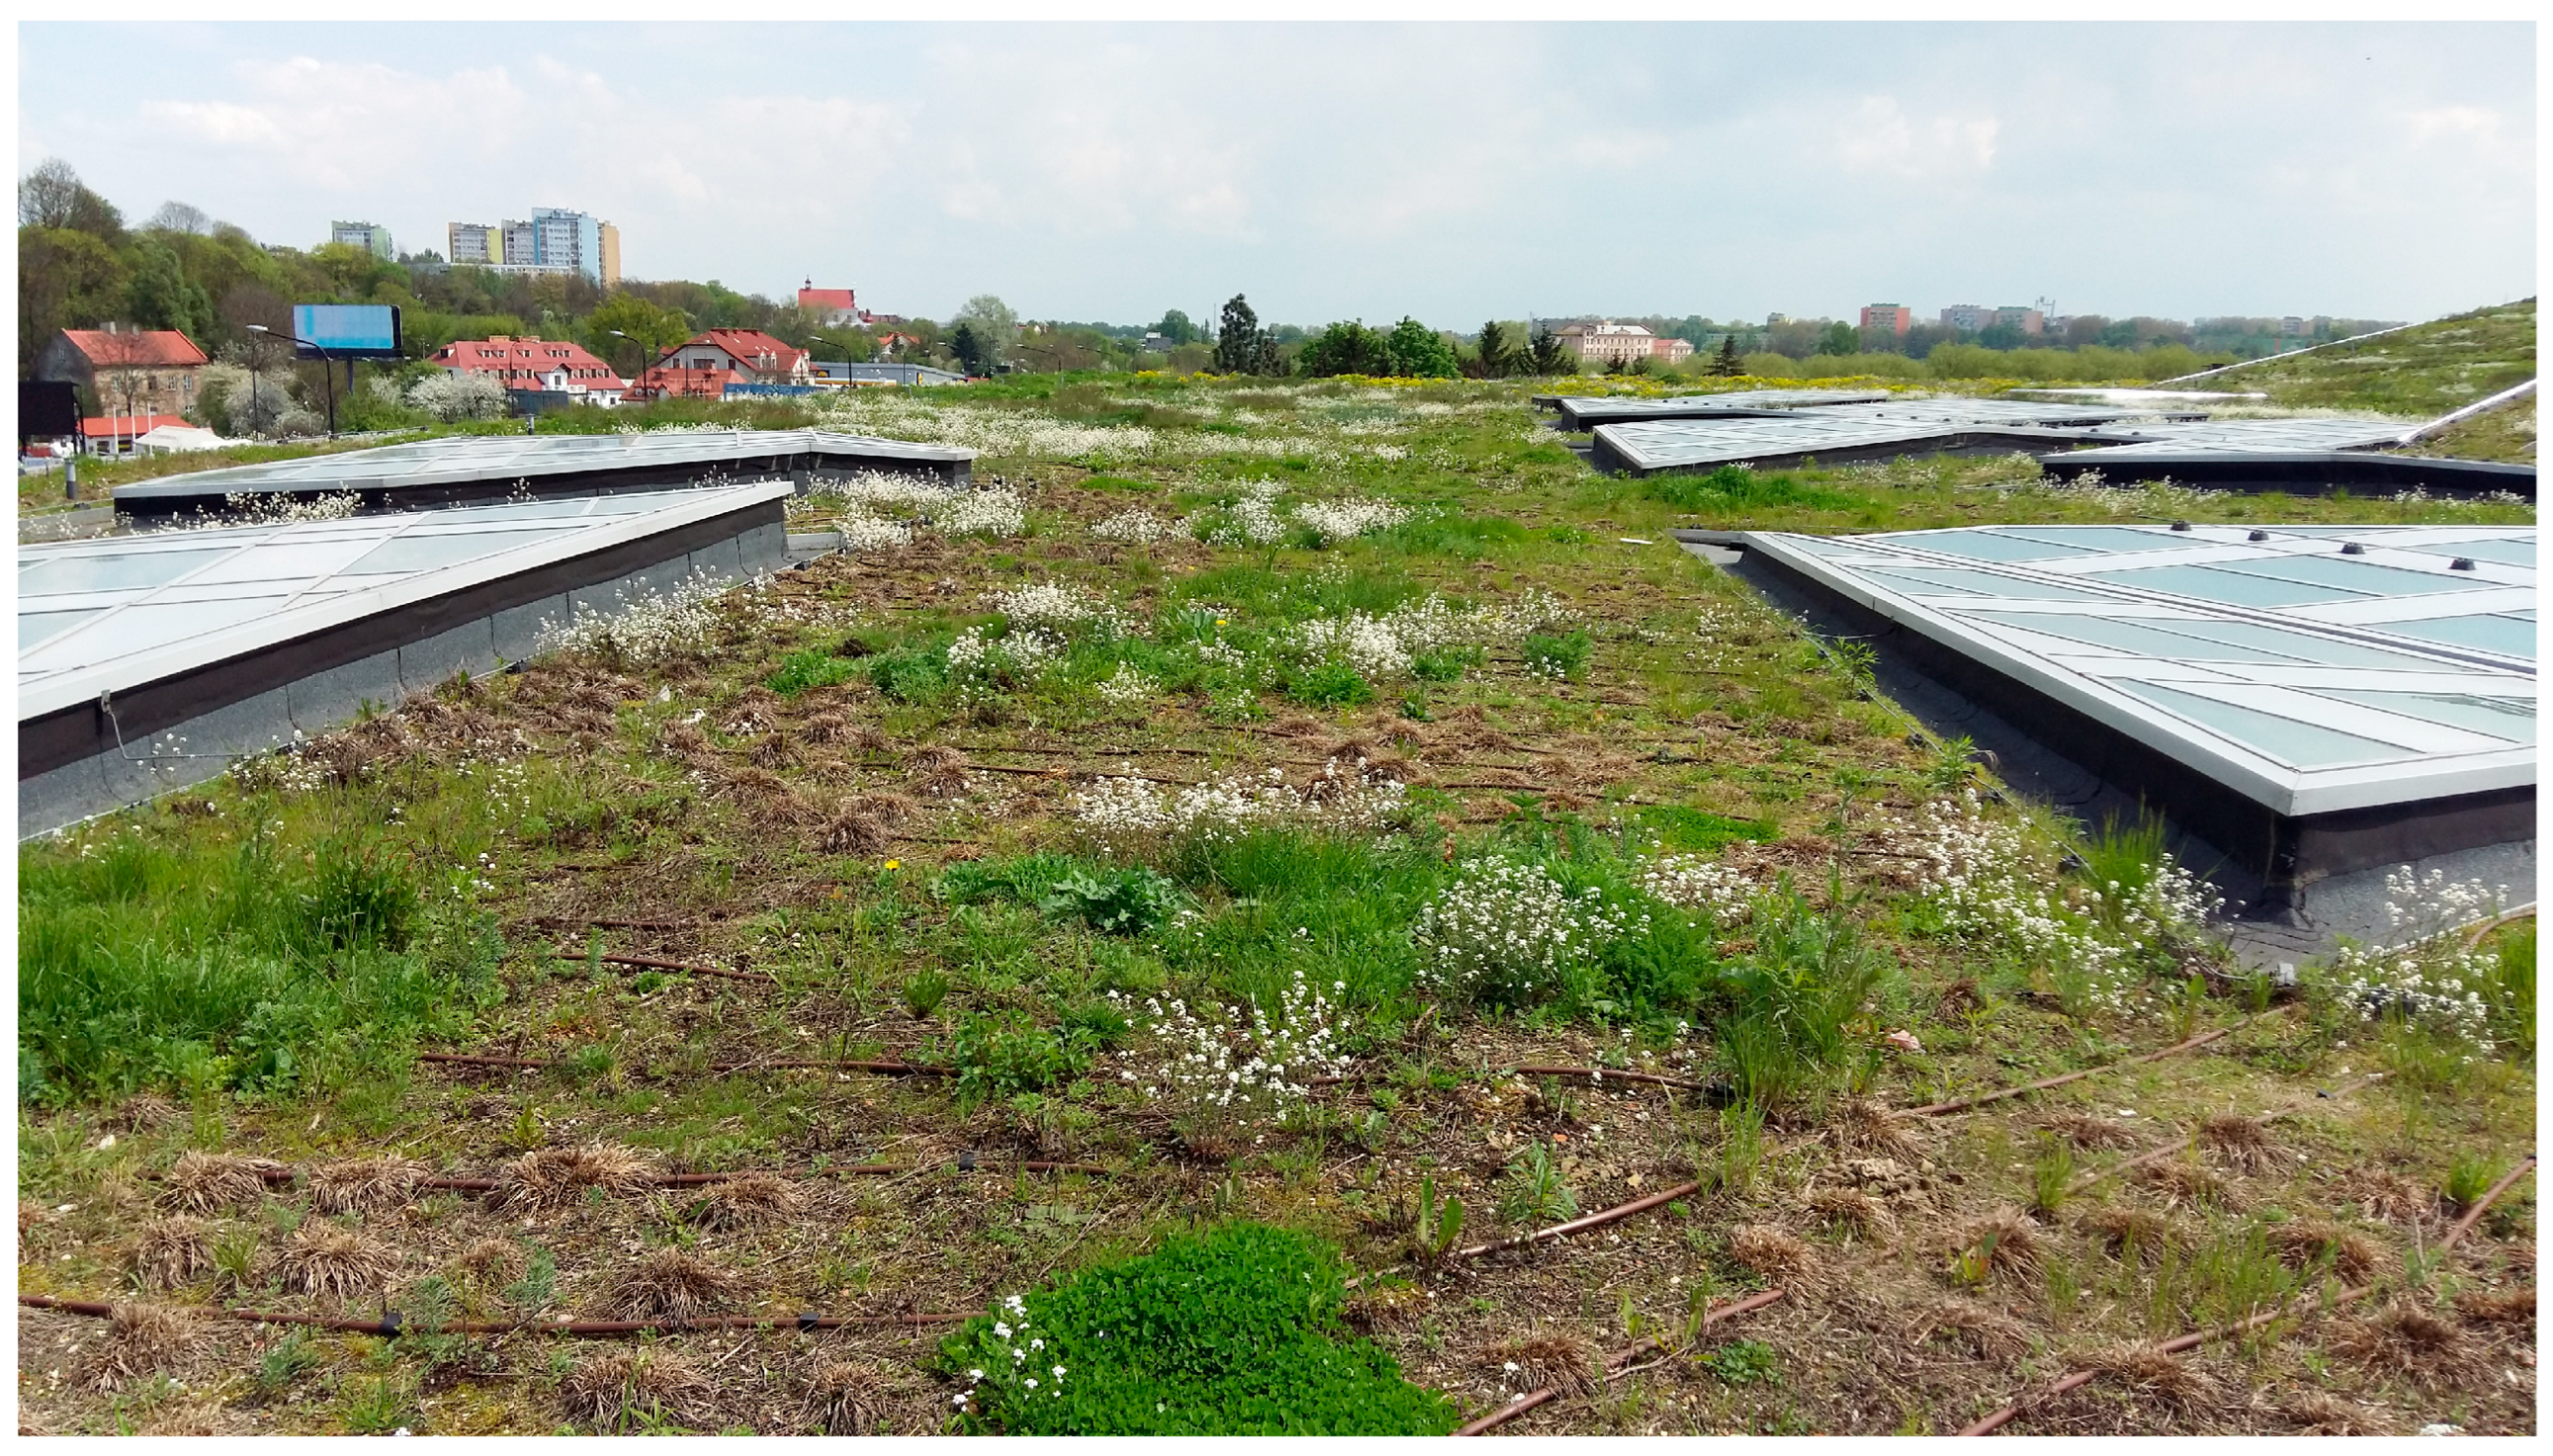

Disclaimer/Publisher’s Note: The statements, opinions and data contained in all publications are solely those of the individual author(s) and contributor(s) and not of MDPI and/or the editor(s). MDPI and/or the editor(s) disclaim responsibility for any injury to people or property resulting from any ideas, methods, instructions or products referred to in the content. |
© 2026 by the author. Licensee MDPI, Basel, Switzerland. This article is an open access article distributed under the terms and conditions of the Creative Commons Attribution (CC BY) license.