Article

Optimizing Investment Programs for Residential Buildings Through CO2e Footprint Assessment Under Seismic Risk

Faculty of Civil Engineering, Technical University of Civil Engineering of Bucharest, 020396 Bucharest, Romania
Sustainability 2026, 18(10), 5041; https://doi.org/10.3390/su18105041
Submission received: 14 April 2026 / Revised: 4 May 2026 / Accepted: 14 May 2026 / Published: 16 May 2026
(This article belongs to the Topic Advances in Urban Resilience for Sustainable Futures)

Abstract

Programs aimed at reducing the CO2e footprint associated with the residential building stock should be informed by several key elements, including the expected evolution of the occupied housing stock, projected population dynamics driven by socio-economic and cultural factors, available implementation budgets, and the specific costs of intervention measures. However, in regions characterized by high seismic hazard, the occurrence of a major earthquake may substantially alter the projected outcomes of emission-reduction programs, as seismically vulnerable buildings may experience severe structural damage. This paper presents the results obtained by applying an integrated methodology for assessing the CO2e footprint associated with residential buildings. The methodology accounts for emissions related to building operation (space heating), energy-renovation interventions, and seismic retrofitting works. While the proposed approach is applicable to other seismically exposed regions, the results presented herein refer specifically to the residential building stock in Romania and its local seismic conditions. The methodology integrates information on the existing building stock, the projected evolution of population and the built environment, energy consumption associated with building operation, changes in the energy fuel mix, construction practices across different historical periods with respect to energy efficiency and seismic protection, and the CO2e footprint associated with energy renovation and seismic retrofitting. In addition, the analysis explicitly considers the potentially negative effects of a major earthquake, particularly the disruption of greenhouse-gas emission-reduction programs. The assessment is conducted at the building stock level and is based on combining building stock evolution with average, representative CO2e intensity values for heating, energy renovation, and seismic retrofitting. The results demonstrate that when the sole objective is to reduce the CO2e footprint associated with space heating, renovation of the energy fuel mix represents the most effective measure. At the same time, the analysis shows that the CO2e footprint generated by construction works for energy renovation and/or seismic retrofitting represents only a small fraction of the emissions associated with building operation. The occurrence of a major earthquake is likely to jeopardize overall environmental objectives by increasing emissions related to building operation, energy renovation, reactive seismic retrofitting, and replacement of severely damaged buildings. Conversely, systematic preventive seismic retrofitting of the building stock does not lead to an increase in cumulative CO2e emissions over the program implementation period.

1. Introduction

In current practice, interventions on existing buildings rarely address the fundamental requirements of structural stability and energy efficiency simultaneously. These requirements are generally treated separately and implemented by different entities and professional groups. Over time, the scientific and engineering communities have consequently developed distinct intervention techniques for seismic retrofitting and for energy renovation. This separation extends across the entire intervention framework, encompassing legal requirements, research programs, technical regulations, professional training and expertise, funding schemes, and implemented technical solutions.
A deeper analysis suggests that addressing these fundamental quality requirements separately when designing intervention programs does not maximize the cost–benefit ratio, particularly in terms of environmental impact and reduction of the CO2e (Carbon dioxide equivalent footprint) [1]. Ignoring seismic risk may lead to inaccurate predictions regarding the benefits of reducing CO2e emissions through energy renovation of the existing building stock, since the benefits of such interventions may be partially or entirely lost in the event of a major earthquake. This issue is particularly relevant in Romania, where more than 65% of the national territory—no less than 157,000 km2—is exposed to earthquakes generated by a single seismic source—Vrancea.
The energy performance strategies of the EU (European Union) aim to reduce greenhouse gas emissions associated with the construction, operation, and demolition of buildings. The general framework is established by Directive 2010/31/EU of the European Parliament and of the Council on the energy performance of buildings [2]. Directive 2018/844 of the European Parliament and of the Council of 30 May 2018 [3] specifies that long-term renovation strategies should also consider “risks related to intense seismic activity that may affect energy-efficiency renovations and the lifetime of buildings.” Consequently, in regions with high seismicity, energy renovation of existing buildings should be accompanied by measures to increase seismic safety, ensuring a service life that allows the benefits of energy renovation to be fully realized.
In developing public policies within the European Union and its Member States aimed at reducing greenhouse gas emissions associated with the construction, operation, and demolition of buildings [4], there is a clear need for quantitative evidence demonstrating the benefits of integrated interventions on the building stock.
At the European level, new research directions are emerging toward the development of technical solutions for integrated energy renovation and seismic retrofitting, as well as methods for assessing the impact of integrated interventions on the building stock. These efforts aim to develop intervention techniques capable of simultaneously addressing fundamental quality requirements, structural stability under seismic loads, and energy efficiency [5,6,7,8]. Others have conducted comprehensive studies on the CO2e footprint of the existing building stock with particular emphasis on the embodiment carbon [9,10]. A broad review of the existing studies with respect to CO2e emissions in buildings is presented in [11].
In Romania, public funding programs for energy renovation have introduced eligibility criteria related to the structural safety of buildings under seismic actions, excluding buildings with very high susceptibility to seismic damage. Nevertheless, approximately 4,000,000 buildings in Romania—about 70% of the total building stock—were constructed before 1980 and present moderate to high susceptibility to damage during strong earthquakes [12].
The objective of this research is to develop and test a calculation tool for evaluating the relative benefits of seismic retrofitting and energy renovation interventions in terms of reducing the CO2e footprint associated with seismic and/or energy-vulnerable residential buildings in Romania.
At the time of this research, no standardized tool was identified in the scientific literature for assessing this benefit at the building stock level. The novelty of the proposed approach should be considered in the context of innovative European policies aimed at reducing the CO2e footprint associated with the construction sector, which set new global standards for environmental protection. In Romania, public policies aimed at reducing the CO2e footprint of the building sector by 2050 are currently under development. To ensure the efficient use of public funds, the availability of analytical tools capable of identifying the most effective investment strategies is essential. At present, tools, particularly those addressing integrated interventions on buildings, are not yet available to public authorities.
This research aimed to assess the CO2e footprint associated with residential buildings in Romania for the period 2025–2050, considering the CO2e footprint related to seismic strengthening works, energy renovation works, and building operation in terms of heating consumption.
The existing literature provides extensive research on the impacts of energy retrofit measures on operational carbon emissions, as well as on the assessment of embodied carbon associated with construction materials and renovation activities. In parallel, a substantial body of work addresses seismic risk assessment and structural strengthening strategies for existing building stocks, particularly in seismically active regions. In addition, several studies have explored integrated seismic and energy retrofit approaches from a technical and performance-based perspective. However, most of these studies address the above aspects in a separated manner, focusing either on energy performance, structural safety, or combined retrofit strategies at building level, without explicitly integrating whole-life carbon assessment at building stock scale. Moreover, limited research exists that simultaneously links seismic risk mitigation, energy-efficiency improvements, and embodied carbon implications within a unified policy-oriented framework. This gap is particularly relevant in the context of large-scale residential building stocks located in seismic regions, where retrofit decisions must balance safety requirements, energy performance targets, and carbon reduction objectives under constrained public budgets. Therefore, the present study contributes by developing a scenario-based building stock model that integrates seismic and energy retrofit interventions and evaluates their combined impact on whole-life carbon emissions, supporting more informed policy and investment strategies.

2. Methodology

The study conducted considers, in a simplified manner, the impact of a major earthquake on the residential building stock by assuming aggregated building stock characteristics and average intervention requirements, rather than detailed building-level modeling. It assesses the impact of the intervention works required to ensure building safety, while also accounting for the loss of benefits gained through energy renovation in buildings that are severely damaged by seismic events.
To determine these values, information was collected from public sources regarding the Romanian residential building stock and its likely evolution over the next 25 years, the number of occupants, the seismicity of the national territory, and the CO2e footprint associated with building heating, energy retrofit, preventive or reactive—post-earthquake—seismic strengthening.
In Romania, there is no centralized database containing complete and systematic information on the entire building stock. In this research, the identification of the residential building stock was based on data collected during the population and housing censuses conducted in 2011 [13] and 2022 [14]. Therefore, the baseline values considered in the study correspond to data collected in 2022.
The study was further refined by classifying residential buildings into two main categories:
-
Category I: single-family buildings with one or two stories;
-
Category II: multi-family buildings, typically with more than two stories and comprising multiple dwelling units within the same structure.
For the purposes of the analyses conducted in this research, buildings were further classified according to their year of construction into three groups: buildings constructed before 1980, buildings constructed between 1981 and 2010, and buildings constructed after 2011.
From the perspective of the evolution of technical regulations, applicable standards, and the legal framework for quality assurance in construction, and for the purposes of the research presented in this paper, these three construction periods can be characterized as follows with respect to the implementation of seismic protection and energy performance measures:
-
buildings constructed before 1980 correspond to design and construction practices that do not ensure acceptable performance according to current requirements for seismic protection and energy efficiency;
-
buildings constructed between 1981 and 2010 correspond to design and construction practices that provide acceptable performance under seismic actions relative to current requirements, but whose energy efficiency remains low compared with present-day standards;
-
buildings constructed after 2011 are based on design and construction practices capable of ensuring acceptable performance in terms of both seismic behavior and energy efficiency.
The reasoning of this conventional classification is explained in the following. On 4 March 1977, most of Romania’s territory was affected by an intermediate-depth earthquake with a moment magnitude of 7.6, which caused over 1500 fatalities and led to the collapse and severe damage of a large number of buildings, especially in the capital city of Bucharest [15,16]. Following this earthquake, seismic structural design practice and structural execution were significantly improved based on the new seismic design code P100/81 [17], aligned with international practice at that time. As a result, the seismic protection level of newly constructed buildings increased considerably.
The year 2011 corresponds to the effective practical implementation of the provisions of methodology MC 001/2006 [18] regarding the calculation of the energy performance of buildings, along with the large-scale implementation of European requirements concerning the energy performance of the building stock.
These construction periods are used to determine, at the building stock level, which buildings require seismic strengthening and/or energy renovation. Accordingly, for the purposes of this study, the following priority assumptions are conventionally adopted:
-
buildings constructed before 1980 require both seismic strengthening and energy renovation;
-
buildings constructed between 1981 and 2011 require energy renovation only;
-
buildings constructed after 2011 do not require intervention measures to improve either seismic performance or energy efficiency.

2.1. Residential Building Stock in Romania

Considering the categorization specified above, the building stock analyzed in this research is presented in Table 1. The total number of single-family buildings (Category I) is 5,536,365, and the total number of multi-family buildings (Category II) is 170,681.
The average building floor area was established based on census data for each building category, according to the construction period. The values used are presented in Table 2.
Within this study, it was assumed that for the period 2022–2025, the average floor area per building remains constant, equal to that recorded in 2022. This assumption is justified by the small increase in the average floor area per building reported in the 2022 census [14] compared to the 2011 census [13], of approximately 1%.
The evolution of the total building floor area, by category, was determined based on accepted forecasts regarding the development of Romania’s population over the next 25 years, considering a projected population of 17,350,000 in 2050 [19].
To determine the evolution of the built floor area of residential buildings, it was assumed that the annual addition rate in the building stock is 1% for single-family buildings and 1.5% for multi-family buildings. These values are supported by the trend observed in the 2022 census [14] compared with 2011 [13].
For the same purpose, this study assumed an annual abandonment rate of 0.8% for existing single-family buildings and 0.2% for multi-family buildings. Consideration was given to the pronounced population shift from rural areas [20], dominated by single-family dwellings, to urban areas, dominated by multi-family dwellings. In Romania, there is currently a trend of abandonment of houses in rural areas, caused by migration and population aging, while multi-family buildings in urban areas continue to be used without interruption, despite their age.
The average building occupancy rate was established based on data collected during the 2022 census [14]. The building occupancy forecast for the period 2022–2050 highlights a decrease in the number of inhabitants per building, mainly driven by the expected demographic evolution mentioned above.
This is further influenced by the housing ownership structure in Romania, where over 94% of the population owns the house or apartment in which they live [21,22], as well as by the relatively low property tax levels [22], which result in a relatively slow turnover of unoccupied houses and apartments.
The values used in this study for the average number of occupants in single-family and multi-family buildings, depending on their construction period, are presented in Table 3.
These data were used in the study to enable a forecast of the evolution of the total building stock area at national level over the period 2025–2050, considering new buildings to be constructed and excluding buildings that will be abandoned.
The total floor area of buildings constructed in different periods was used to assess the CO2e footprint associated with seismic strengthening and/or energy renovation interventions, as well as with building operation over the period 2025–2050, as presented in the following.

2.2. Seismic Impact on the Residential Building Stock

Romania is a country with moderate seismic hazard. A particular feature of Romania’s seismicity is that more than 60% of the national territory is exposed to seismic hazard originating from a single source. This assessment considers that Romania is a medium-sized country, with a total area of approximately 238,000 km2 [23].
In this study, information regarding the impact of earthquakes on the building stock in Romania was drawn from the project National Disaster Risk Assessment—RoRisk, coordinated by the State Inspectorate for Emergency Situations [12]. To determine the floor areas of buildings damaged in the event of a strong earthquake, the impact of three conventionally defined earthquakes was considered, differing in magnitude and having mean recurrence intervals of absolute horizontal ground accelerations of 10 years, 100 years, and 1000 years, respectively. According to the results of the RoRisk project, the expected number of damaged buildings following the three conventional earthquakes is 500, 210,000, and 930,000, respectively. Within this study, considering the characteristics of the residential building stock, different replacement rates for damaged buildings were considered, according to the information provided in Table 4.
The target of the seismic retrofitting considered in this research was calibrated according to the Romanian regulation system and reported by the author in [24]. Two alternative seismic strengthening approaches were analyzed:
  • preventive (proactive) seismic retrofitting, implemented in advance, prior to the occurrence of a major earthquake that could severely impact the structural system of the building.
  • post-event (reactive) seismic retrofitting, undertaken after a major earthquake has caused significant structural damage to a vulnerable building.
In the case of proactive retrofitting, the lateral load-bearing capacity of the upgraded structure was considered to correspond to the contribution of the existing structure multiplied by a factor of 0.75, reflecting the assumption that an undamaged structure can still significantly contribute to the overall lateral resistance of the retrofitted system. Conversely, for reactive retrofitting, it was assumed that a structure severely damaged by an earthquake can retain only 15% of its initial capacity to contribute to the global lateral resistance of the strengthened structure. For proactive retrofitting, the target lateral resistance of the upgraded structure was established at 65% of the value required for equivalent newly constructed buildings. This assumption reflects the provisions of Romanian technical regulation [25] as well as common engineering practice in other countries [26], acknowledging that it is generally impractical to achieve the full performance parameters of new buildings when upgrading existing vulnerable stock, in order to limit the extent of interventions and maintain feasibility at scale. For reactive retrofitting, the lateral resistance of the rehabilitated structure was assumed to reach 85% of the requirement for new buildings; given that such interventions are extensive and highly disruptive, the original structure can only be relied upon to a limited extent, and, in practice, a new lateral force-resisting system must largely be constructed.
These assumptions were used to determine the average CO2e footprint of seismic proactive or reactive retrofitting, considering a weighted average value of 0.27 g in terms of design ground acceleration at national level in Romania. This average value was determined by weighing the design ground acceleration specified for each locality by the local population [24]. The specific CO2e footprint for proactive retrofitting and reactive retrofitting for a weighted average design acceleration, as reported in [24], is presented in Table 5 for convenience. The CO2e footprint associated with the production of construction materials, their transport, and their installation was considered corresponding to the A1–A5 cycles provided by ISO 14040 [27].
Regarding the CO2e footprint for the construction of new residential concrete buildings, studies conducted by various authors [28,29] yield CO2e emissions values of approximately 410 kg CO2e/sqm. These values were used in this research to determine the CO2e footprint of new building construction, generated by the market or by the need to replace heavily damaged buildings after the earthquake.
The costs associated with implementing seismic strengthening used in this research were reported in [30]. In that paper, the costs of seismic strengthening works were analyzed for a sample of 30 buildings retrofitted in Romania during the period 2022–2025 within integrated intervention programs. In that research, buildings of various types belonging to Romania’s educational infrastructure were analyzed. Based on contracted prices and bills of quantities, the costs associated with seismic strengthening, energy renovation, and other related interventions were identified. It was observed that, of the total intervention cost for old buildings that are seismically vulnerable and have low energy performance, approximately 30% is attributable to seismic strengthening, 32% to energy renovation, and 38% to other types of interventions. The study also resulted in an average cost of EUR 1357 per square meter of building area for the integrated intervention and an average cost of EUR 2115 per square meter for the construction of a new building, fully compliant with existing national standards with respect to seismic protection and energy efficiency. In the same study, it is reported that cost of rebuilding new ranges between 1800 and 2100 Euro/sqm, depending on the building. The cost values used in this research for proactive seismic retrofit, reactive seismic retrofit and replacement of seismic heavily damaged buildings are presented in Table 6.

2.3. Information on the Energy Performance of the Residential Building Stock

For this research, information regarding the average energy consumption associated with building operation in terms of heating was collected from the literature. Most of the data was published by national authorities and the European Commission, but there are also authors who have specifically synthesized the available information for residential buildings [31]. In the assessment of medium-term consumption, up to 2050, an annual consumption growth rate of approximately 1.30% was assumed according to [32,33].
At the level of 2019, the heating specific consumption of the households in Romania was 15 koe/sqm [34]. Considering a total residential building stock area of 452 million sqm, out of which 78% are not energy-efficient, this results in an average annual energy consumption in old buildings of 194 kWh/sqm/year. It should be noted that 61.8% of the total energy consumption in residential sector in Romania was attributed to space heating and only 0.3% to space cooling [35]. The evolution of energy consumption in the residential sector over the period 2015–2023, relative to 2015, indicates a quasi-constant situation, with a 12% increase in 2021 and a return to 98% in 2023 [36]. Therefore, this study assumes that the specific annual energy consumption per square meter of built area remains quasi-constant over the period 2025–2050. This assumption applies to buildings whose condition does not change during this period. For buildings undergoing energy renovation, the analysis accounts for the reduction in energy consumption resulting from the implementation of such measures.
The magnitude of energy consumption reduction following the implementation of energy renovation works varies depending on the scope of the interventions. In [37], the effect of energy renovation on energy consumption in multi-family buildings in Finland is reported. Other authors [38] show that façade renovation, improved ventilation, and heating system upgrades can achieve reductions in heating energy consumption of approximately 50%.
In regular residential buildings in Romania, most of the works for energy renovation consist of comprehensive rehabilitation of the building envelope, combined with minor upgrades to building systems and finishes. Key measures include thermal insulation of walls, plinths, and outer floors and replacement of windows and doors with energy-efficient joinery [24]. Installation of LED lighting systems, upgrading heating systems with condensing boilers, heat pumps, or hybrid solutions, implementation of ventilation systems with heat recovery or integration of renewable energy sources, such as photovoltaic or solar thermal panels, are not currently included in the projects financed by national programs.
This practice is driven by the ownership structure of multi-family dwellings, where each residential unit has a different owner. Consequently, to prevent program failures due to opposition from some owners or their refusal to grant access to work teams, intervention measures are designed to be implemented from the exterior or from common areas of the building, without necessarily requiring entry into individual units. Approval for the implementation of energy renovation projects is granted by the homeowners’ association through a majority vote, without the need for consent from all owners. Therefore, the measures implemented through nationwide projects are customized to facilitate interventions from the building exterior. Energy renovation interventions for multi-family residential buildings are carried out through a combination of envelope upgrades, thermal insulation measures, and system improvements. These practices are documented by the author in [24], following the analysis of 11 publicly funded energy renovation projects designed based on [18]. The main measures implemented included comprehensive thermal insulation of exterior walls using 10 cm thick AEU (expanded polystyrene) or mineral wool, followed by the restoration of protective and finishing layers. Existing wooden double-glass windows are replaced with thermally insulated PVC (polyvinyl chloride) double- or triple-glass units, and balconies are enclosed with insulated windows and PVC panels. Roof terraces are insulated with 15–20 cm of XPS (extruded polystyrene), overlaid with a mortar or cement-based concrete protective layer, and waterproofing is refurbished using double-layer bituminous membranes. Attics are insulated with 10 cm of extruded polystyrene, also combined with waterproofing restoration. Additional envelope measures included the replacement of windowsills and ledges with steel sheets, insulation of floors above basements using 10 cm mineral wool protected by a cement-based mortar layer reinforced with fiberglass mesh and a finishing coat, and insulation of stairwell walls and ceilings with 10 cm thick expanded polystyrene. Entrance doors and windows are also replaced. For buildings connected to centralized heating networks, internal heat supply pipes are replaced from the building connection to the separation points of the vertical risers. Finally, perimeter sidewalks are reconstructed using in situ unreinforced or lightly reinforced concrete. The limitations regarding the applied solutions are influenced by legal constraints related to condominium ownership regimes, where interventions are carried out from the exterior, as well as by the budgets allocated by public authorities supporting these interventions through funding programs.
Considering the specific issues in Romania presented above, this research assumes that through moderate energy renovation, the specific energy consumption of energy-renovated residential buildings can be reduced by 30%.
For the determination of the CO2e footprint associated with building operation, a fuel mix comprising electricity, fossil fuels, bioenergy, and derived heat was considered. The values established according to [34] are provided in Table 7.
To determine the CO2e footprint for energy production, the values presented in Table 8 were considered. These values were derived from information available in the literature [39].
As for the fuel mix for electricity production, the data reported in [40] used in this study are presented in Table 9. The corresponding CO2e footprint for electricity production based on energy source are presented in Table 10. The CO2e footprint associated with electricity generation in Romania was determined in accordance with the data available for the year 2023 and the calculated value is 0.267 MtCO2e/TWh.
The CO2e emission for import electricity was determined based on the data published by International Energy Agency for electricity production in Europe, considering the reported sources and shares of energy generation and the CO2e emissions from power generation in 2023.
The CO2e footprint associated with energy renovation was determined by the author and reported in [24]. The values were calculated based on the material quantities specified in the bills of quantities from 11 energy renovation projects involving multi-family buildings with different numbers of stories. Within the study, the CO2e footprint associated with the production of construction materials, their transport, and their installation was considered (A1–A5 cycles according to ISO 14040 [27]). Table 11 presents the specific CO2e footprint values for the energy renovation of Category 1 buildings—single-family buildings—and Category 2 buildings—multi-family buildings.
From the analysis of ten energy renovation projects for multi-family residential buildings in Romania, carried out within the study reported in [30], unit costs for energy renovation were found to range between 91.2 and 151.2 EUR per m2 of gross floor area. The average unit cost is 120.6 EUR/m2.
This cost corresponds to an average 30% reduction in energy consumption for heating achieved through moderate energy renovation. Assuming an average annual energy consumption of 194 kWh/m2/year, this results in an average cost of approximately 2.07 EUR per kWh saved per m2 per year.

2.4. Scenarios

To determine the CO2e footprint associated with energy renovation, seismic retrofitting, and building operation, a series of scenarios were considered, grouped in four scenario groups. Each scenario included assumptions on:
  • Proactive seismic retrofitting program, described by the year of program initiation and the annual budget allocated to the program for each building category.
  • The occurrence of an earthquake, described by the mean recurrence interval of horizontal accelerations, MRI = 1000, and the year in which the earthquake occurs.
  • Reactive seismic retrofitting program, described by the annual budget for each building category; the starting year was considered to be the year following the earthquake defined in the scenario.
  • Replacement of damaged buildings program, described by the annual budget for each building category; the program starting year was considered to be the third year after the earthquake defined in the scenario.
  • Energy renovation of buildings program, described by the year of program initiation and the annual budget allocated for each building category.
  • Renovation of the fuel mix for energy production used in building operation, described by the implementation period starting in 2025 and the target shares pursued for each source category in the energy mix (electricity, fossil fuels, and derived heat). In this study, the renovation of the energy mix for building heating is assumed to involve a transition to full electrification by the end of the renovation period, applied to the entire building stock.
  • Renovation of the fuel mix for electricity generation, described by the implementation period starting in 2025 and the target shares pursued for each source category in the energy mix (coal, natural gas, hydro, solar, and wind). In all scenarios, the renovation of the electricity generation mix assumes a transition to hydro (25%), solar (20%), wind (15%), and nuclear (40%) sources. It is reiterated that these are scenario-based assumptions, which may be redefined when alternative scenarios are considered, while maintaining the same methodological framework.
The simulations were performed for the period 2025–2050, based on the following assumptions:
-
Buildings requiring proactive seismic strengthening are those constructed before and including 1980. For these buildings, the CO2e footprint associated with proactive strengthening interventions is calculated using the values indicated in Table 5, in relation to their total floor area. The annual floor area subjected to preventive strengthening is determined according to the allocated annual budget and the average proactive strengthening cost indicated in Table 6.
-
Buildings requiring reactive seismic strengthening are those constructed before and including 1980 that are damaged by the scenario earthquake. The floor area of damaged buildings requiring repair and the floor area of damaged buildings requiring replacement after the scenario earthquake are determined based on the percentages presented in Table 4. These are applied to the total floor area of buildings constructed before 1980 that are in use at the time of the earthquake. The floor area subjected to reactive strengthening or replacement is determined according to the total budget allocated for these activities in the scenario and the specific costs indicated in Table 6. The CO2e footprint associated with reactive strengthening and replacement is determined based on the building floor area and the specific CO2e footprint values for reactive seismic strengthening and replacement of severely damaged buildings, given in Table 5.
-
Buildings requiring energy renovation are those constructed before 2011. For these buildings, the CO2e footprint associated with energy renovation interventions is calculated using the values indicated in Table 11, in relation to their total floor area. The annual floor area subjected to energy renovation is determined according to the allocated annual budget and the average renovation cost of 2.07 EUR/(kWh/sqm/year).
-
Benefits of energy retrofit are completely lost in the case of seismic damage. Buildings built before 1980 that are damaged by the scenario earthquake are no longer energy-efficient.
-
A single major event can affect any building during the analyzed period 2025–2050.
-
A 10-year pause of the energy renovation programs is likely to be caused by the occurrence of a strong earthquake, corresponding to a mean return interval of 1000 years.

2.5. Modeling Framework

In this research, for each building category, building stock corresponding to each year, y i , situated between 2023 and 2050, is estimated as:
n e b s , y i = n e b s , y i 1 + n n b s , y i 1 n a b s , y i 1 ,
where
n e b s , y i 1 existing building stock in the previous year, y i 1 ;
n n b s , y i 1 annual additions to the building stock in the previous year y i 1 ;
n a b s , y i 1 building stock annual abandonment in the previous year y i 1 ;
The existing building stock in 2022, n e b s , 2022 , for each building category, is calculated as the sum of products between the number of buildings and average building floor area, presented in Table 1 and Table 2, for each construction period considered in the analysis.
The annual additions to the building stock each year y i are calculated as follows:
n n b s , y i = 1   +   r n b s y i     y 0   +   1   1 n e b s , 0     i = y 0 y i 1 n n b s , i ,
where
r n b s building stock addition annual rate, as presented in Section 2.1;
y 0 initial year, considered 2022 in this evaluation;
n n b s , y i annual additions to the building stock each year;
n e b s , 0 existing building stock in the initial year, y 0 .
The annual building stock area becoming abandoned is calculated as follows:
n a b s , y i = 1   +   r a b s y i     y 0   +   1   1 n e b s , 0     i = y 0 y i 1 n a b s , i ,
where
r a b s annual building abandonment rate, as presented in Section 2.1;
y 0 initial year, considered 2022 in this evaluation;
n a b s , y i building stock annual abandonment in the current year;
n e b s , 0 existing building stock in the initial year y 0 .
Building stock in each year, y i , for each building category and each construction period is determined as follows:
-
for period pre–1980:
n e b s , y i = n e b s , y i 1 n a b s , y i 1 ,
-
for period 1981–2010:
n e b s , y i = n e b s , 2022 ,
-
for period 2011–2022:
n e b s , y i = n e b s , 2022 ,
-
for period 2023–2050:
n e b s , y i = n e b s , 2022 + i = 2023 y i n n b s , y i
The total population in each year, y i   , for each building category, is calculated as:
p y i = k = 1 6 n e b s , k , y i A ¯ b f , k P ¯ b , k
where
k designates the six distinct construction periods considered in the analysis, as presented in Table 1 and Table 2, as follows: k = 1 for pre–1980, k = 2 for 1981–2010, k = 3 for 2011–2022, k = 4 for 2023–2030, k = 5 for 2031–2040 and k = 6 for 2041–2050;
n e b s , k , y i building stock (in sqm) built in each construction period, k , for each year, y i ;
P ¯ b , k average number of occupants per building, for each construction period, k , as presented in Section 2.1;
A ¯ b f , k average area per building (sqm), for each construction period, k , as presented in Section 2.1.
The total population was calculated to track its evolution with the aim of verifying convergence with the population projections presented in Section 2.1. This convergence check provides an overall validation of the selected values that characterize the expected evolution of the building stock.
Seismic vulnerable building stock in each year, y i , considering the implementation of the proactive seismic retrofitting program, in the absence of any severe earthquake, is calculated as:
n e b s , y i s v , a r = m a x ( n e b s , y i s v r s r i = y s r , 0 y i 1 i > y p s r , 0 , 0 )
where
n e b s , y i s v , a r seismic vulnerable building stock in the current year, considering the implementation of a proactive seismic retrofitting program;
n e b s , y i s v seismic vulnerable building stock in the absence of a seismic retrofitting program equal to n e b s , k , y i with k = 1 ;
r s r annual rate of proactive seismic retrofitting of the building stock (in sqm) calculated as the ratio between the annual allocated budget and the specific cost for proactive retrofitting;
y p s r , 0 starting year of the proactive seismic retrofitting program.
This yields to the value of seismic code compliant building stock in the current year, y i , considering the implementation of the seismic retrofitting program in the absence of any severe earthquake:
n e b s , y i s c c , a r = n e b s , y i n e b s , y i s v , a r
where
n e b s , y i s c c , a r seismic code compliant building stock in the current year (in sqm);
n e b s , y i total building stock in the current year (in sqm);
n e b s , y i s v , a r seismic vulnerable building stock in the current year, considering the implementation of the seismic retrofitting program (in sqm).
If the occurrence of a severe earthquake is considered in the analysis, the following components of the building stock are estimated for each year, y i , between the initial year of the assessment (2022) and the final year (2050):
-
annual proactively retrofitted building stock;
-
annual reactively retrofitted building stock;
-
annual reconstructed building stock.
This yields the following equation to estimate the seismic vulnerable building stock:
n e b s , y i s v , a r = m a x n e b s , y i s v i = 2022 y i r p s r i y p s r , 0 i < y e q + i = 2022 y n i r r s r ( i ( y e q + 1 ) ) + i = 2022 y i r b r ( i ( y e q + 3 ) ) , 0
where
n e b s , y i s v , a r seismic vulnerable building stock in the current year, considering the implementation of seismic retrofitting and reconstruction programs (in sqm)
n e b s , y i s v seismic vulnerable building stock in the absence of a seismic retrofitting program (in sqm);
r p s r annual rate of proactive seismic retrofitting of the building (in sqm);
r r s r annual rate of reactive seismic retrofitting of the building (in sqm);
r b r annual rate of building reconstruction (in sqm);
y i current year;
y p s r , 0 starting year of the proactive seismic retrofitting program;
y e q strong earthquake occurrence year.
The annual rates of retrofitting or reconstruction are estimated as the ratio between the allocated budget and the specific cost for each activity.
The CO2e footprint for seismic vulnerable building retrofit or replacement in each year, y i , is calculated as:
E e m b ,   y i   s r = n e b s , y i p s r e e m b p s r + n e b s , y i r s r e e m b r s r + n e b s , y i b r e e m b b r
where
n e b s , y i p s r existing seismic vulnerable building stock proactively retrofitted;
n e b s , y i r s r existing seismic vulnerable building stock reactively retrofitted;
n e b s , y i b r seismic vulnerable building stock replaced;
e e m b p s r specific CO2e emissions for proactive retrofitting;
e e m b r s r specific CO2e emissions for reactive retrofitting;
e e m b r s r specific CO2e emissions for buildings replacement.
The energy-vulnerable building stock (in sqm) in each year, y i , considering the implementation of the energy retrofitting program and the occurrence of a strong earthquake, with a given mean return interval, is calculated as:
n e b s ,   y i e v ,   a r = m a x n e b s ,   y i e v r e r i = 2022 y i 1 i > y e r , 0 · ( 1 i < y e q + 1 ( i ( y e q + δ y ) ) , 0 + ( y e q                           2050 ) · r e r i = 2022 y i 1 i > y e r , 0 · 1 i < y e q · n d b s , M R I n e b s ,   y i e v · ( y i > y e q )
where
y i each year in the interval of interest [2022, 2050];
y e q strong earthquake occurrence year;
y e r , 0 starting year of the energy retrofitting program;
δ y delay in energy retrofitting programs caused by the occurrence of a strong earthquake (in years);
r e r annual rate of energy retrofitting (in sqm);
n d b s , M R I damaged building stock (in sqm) for the selected mean return interval of the ground motion;
n e b s , y i e v energy-vulnerable building stock (in sqm) each year;
n e b s , y i e v , a r energy-vulnerable building stock (in sqm) each year, after the implementation of an energy retrofitting program.
The energy code-compliant or retrofitted building stock (in sqm) in the current year, considering the implementation of an energy retrofitting program and the occurrence of a strong earthquake, n e b s , y i e c c , a r , is calculated as:
n e b s , y i e c c , a r = n e b s , y i n e b s , y i e v , a r
where n e b s , y i is the total building stock in the current year.
The CO2e footprint for energy retrofitting in each year y i is calculated as:
E e m b ,   y i   e r = r e r e e m b e r y i < y e q + i ( y e q + δ y ( y i > y e r , 0 )
where e e m b e r is the specific emission (kgCO2e/sqm) for energy retrofitting.
The energy used for building operation (heating) in each year, y i , for existing energy-vulnerable buildings, E o p , y i e v , is calculated as follows:
E o p , y i e v   =   n e b s ,   y i e v   e o p 1 +   r e o p y i     y 0 ,
where
r e o p annual energy consumption growth rate, as specified in Section 2.2;
e o p specific energy consumption for energy-vulnerable buildings, as specified in Section 2.2.
The annual energy used for building operation for energy code compliant buildings, E o p , y i e c c , in each year, is calculated as follows:
E o p , y i   e c c   =   n e b s ,   y i e c c   ( 1 η e r ) e o p 1 +   r e o p y i     y 0 ,
where η e r is the saving factor due to energy renovation explained in Section 2.2.
For each building category defined in this research, for each year, y i , the total annual energy consumption for building operation, E o p , y i , is calculated as:
E o p , y i =   E o p , y i   e c c + E o p , y i     e v .
The share of the energy type j in the total fuel mix is calculated with the following equation:
s j , y i = s j , y 0 + [ y i y 0 y 0 y n s j , y 0 s j , y n ] ( y 0 y i y n ) + ( s j , y n s j , y 0 )   ( y i > y n )
where
y i each year;
s j , y i share of energy type j corresponding to year y j ;
y 0 starting year of the fuel-mix renovation program, according to each scenario;
y n ending year of the fuel-mix renovation program, according to each scenario;
s j , y 0 initial share of energy type j , at the starting of the fuel-mix renovation program, as given in Table 7;
s j , n final share of energy type j , at the end of the fuel-mix renovation program, according to each scenario.
This study refers to the specific situation described in Section 2.1 and Section 2.2 and the scenarios presented in Section 2.3. The calculated values depend on the input parameters considered in the analysis, which are derived from aggregated building stock data and representative average assumptions.
Given the number of parameters involved, the model may appear sensitive to variations in input data; however, the results are intended to support comparative analysis of scenarios rather than to provide precise absolute forecasts. The focus is therefore placed on identifying trends and relative differences between intervention strategies, rather than on exact numerical outcomes.
The analysis is based on a deterministic modeling framework and therefore does not explicitly quantify uncertainty ranges or probabilistic distributions of input parameters. This limitation is acknowledged, as variability in real-world conditions (e.g., building heterogeneity, implementation constraints, and economic factors) may influence absolute outcomes.
Nevertheless, the comparative nature of the scenarios ensures that the main conclusions regarding the relative effectiveness of different intervention strategies remain consistent under reasonable variations in input assumptions. The results should therefore be interpreted in a policy-support context rather than as precise predictive values, and future work is encouraged to incorporate sensitivity and uncertainty quantification approaches.


3. Results

3.1. Scenario Group 1

Scenario Group 1 includes four extreme or reference scenarios that do not consider the occurrence of a major earthquake with disastrous effects:
  • Scenario 1 represents the ideal reference scenario in this group. A sufficient annual budget is allocated so that all seismically vulnerable buildings can be strengthened through proactive retrofitting by 2050, and all energy-inefficient buildings can be renovated by 2050. The renovation of the fuel mix is completed by 2050 as well.
  • Scenario 2 assumes that the fuel mix is fully renovated by 2050, while no interventions are carried out on the existing building stock in terms of either energy renovation or seismic retrofitting.
  • Scenario 3 assumes that the fuel mix remains unchanged until 2050, while interventions are carried out on the existing building stock to achieve energy renovation of all energy-vulnerable buildings and preventive seismic retrofitting of all seismically vulnerable buildings.
  • Scenario 4 represents the do-nothing scenario. No budget is allocated for seismic retrofitting or energy renovation, and the fuel mix is not renovated by 2050.
These scenarios are parameterized as presented in Table 12.
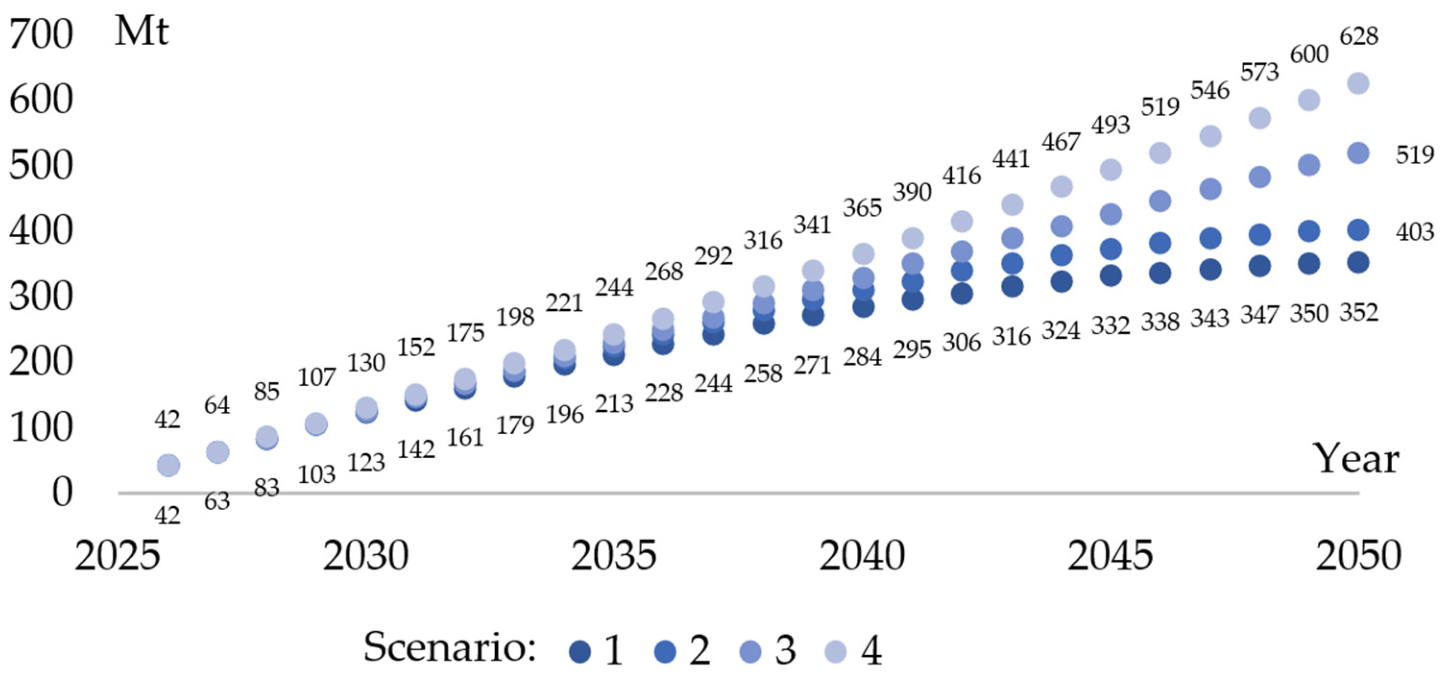
The performed analysis makes it possible to determine the cumulative CO2e footprint associated with building operation and with seismic retrofitting or energy renovation works, as applicable, for the period 2025–2050. A graphical representation of the variation in the CO2e footprint associated with building heating and construction works, as resulted from the analysis of Scenario Group 1, is shown in Figure 1 and Figure 2.
Scenario 4 represents the most pessimistic case, in which, in the absence of any intervention, the total CO2e footprint associated with building operation amounts to 628 Mt CO2e for the period 2025–2050. The most optimistic case is Scenario 1 of this scenario group, for which a total CO2e footprint of 352 Mt was obtained, corresponding to 56% of the value determined for Scenario 4.
For the intermediate Scenarios 2 and 3, cumulative CO2e footprints of 403 Mt and 520 Mt, respectively, were obtained. These correspond to 64% and 85%, respectively, of the value determined for Scenario 4.
The cumulative CO2e footprint associated with construction works amounts to 15.5 Mt, of which 3 Mt is attributable to seismic retrofitting and 12.5 Mt to energy renovation, at the budget levels defined in the scenarios.
The results of Scenario Group 1 indicate that significant reductions in cumulative CO2e emissions can only be achieved when seismic retrofitting and energy renovation are complemented by deep decarbonization of the energy supply. While building-level interventions contribute to reducing both vulnerability and energy demand, their overall impact remains limited if the carbon footprint of the energy mix is not addressed. In this context, fuel-mix renovation emerges as the most influential factor in reducing heating emissions, given that building operation dominates the total life-cycle CO2e footprint.

3.2. Scenario Group 2

Scenario Group 2 includes four scenarios whose parameterization is designed to capture the effects of a major earthquake on the effectiveness of energy renovation measures. It is assumed that the fuel-mix renovation is implemented systematically throughout the analyzed period and, due to delays in program implementation, is completed in 2060. This represents a moderately optimistic assumption compared with national and European policy targets.
Within this group of scenarios, no funds are allocated for preventive seismic retrofitting, or the initiated programs are not successfully implemented on scale. Scenario Group 3 includes the following simplified scenarios:
  • Scenario 1—this is the reference scenario within this group. No funds are allocated for seismic retrofitting or energy renovation of vulnerable buildings; the entire effort is directed toward fuel-mix renovation. During the analyzed period, no major earthquake occurs that could cause significant damage to seismically vulnerable buildings.
  • Scenario 2—this is an optimistic scenario, which neglects the possibility of a major nationwide earthquake. Efforts to reduce the CO2e footprint are implemented through energy-renovation programs, sized so that all energy-vulnerable buildings in operation are renovated by 2050, together with fuel-mix renovation programs. No major earthquake occurs during the analyzed period.
  • Scenario 3—this scenario assumes the implementation of energy-efficiency improvement programs for energy-vulnerable buildings, sized to allow renovation of the entire building stock by 2050. In 2030, an earthquake with a mean recurrence interval of 1000 years occurs. The earthquake causes severe damage to part of the seismically vulnerable buildings in use. Some of the damaged buildings require replacement, while the remainder require reactive seismic retrofitting. Buildings that had previously undergone energy renovation and were severely damaged lose the energy-efficiency benefits previously achieved. Funds are allocated for reactive seismic retrofitting and replacement of major damaged buildings.
  • Scenario 4—This scenario is like Scenario 3, with the difference that the major earthquake occurs in 2040.
These scenarios are synthesized in Table 13.
The results obtained for the scenarios in this group are synthesized in Figure 3, Figure 4 and Figure 5.

3.3. Scenario Group 3

The third group of scenarios is designed to capture the effect of the occurrence of a major earthquake on the residential building stock during the post-event evolution period, assuming that a systematic national energy-renovation program is implemented with the objective of renovating all energy-vulnerable buildings by 2050. In this context, the annual budget allocated for energy renovation during the period 2025–2050 is calibrated to result in zero square meters of non-renovated buildings by 2050.
In this group of scenarios, it is also assumed that the fuel mix is undergoing a gradual transition, with completion expected by 2060. No funding is allocated for proactive seismic retrofitting within this scenario group. However, the funds initially allocated for energy renovation are reallocated to reactive seismic retrofitting following the occurrence of a major earthquake.
Scenarios 1, 2, 3, and 4—scenarios in which the renovation process is interrupted by the occurrence of an earthquake with a mean return period of 1000 years, occurring in 2030, 2035, 2040, and 2045, respectively. Following the earthquake, the funds initially allocated to energy renovation are redirected to reactive seismic retrofitting. According to the seismic-scenario assumptions, 70% of these funds are allocated to the retrofitting of damaged buildings, while the remaining 30% are allocated to the replacement of severely damaged buildings.
Specific details for each scenario in scenario group 3 are given in Table 14.
The results obtained for the scenarios in this group are synthesized in Figure 6, Figure 7 and Figure 8.

3.4. Scenario Group 4

Scenario Group 4 analyzes the environmental impact generated by seismic retrofitting works and the expected outcomes of seismic and energy-renovation programs in the event of a major earthquake.
The following assumptions are considered:
  • In all scenarios within this group, the energy fuel-mix transition is completed by 2060.
  • In all scenarios within this group, an earthquake with a mean recurrence interval (MRI) of 1000 years occurs in 2040.
  • In all scenarios within this group, the budget allocated for energy renovation is equal to the amount required to renovate all buildings considered energy-vulnerable, with completion by 2050. The energy-renovation program is implemented continuously from 2026 to 2050.
  • In all scenarios within this group, the budget allocated for proactive seismic retrofitting is equal to the amount required to retrofit all buildings considered seismically vulnerable, with completion in 25 years. The seismic retrofitting program is implemented at a constant annual rate starting in 2026, 2030, 2035, and 2040 for Scenarios 1, 2, 3, and 4, respectively.
  • In all scenarios, after the occurrence of the earthquake, the budget allocated for proactive seismic retrofitting is redirected to reactive interventions, with 70% allocated to the retrofitting of damaged buildings and 30% allocated to the replacement of severely damaged buildings, for each building category.
Specific details for each scenario in scenario group 4 are given in Table 15.
The results obtained for the scenarios in this group are synthesized in Figure 9, Figure 10 and Figure 11.

4. Discussion

4.1. Scenario Group 1

The analysis of Scenario 1 from Scenario Group 1 shows that, in the absence of a strong earthquake, the seismic and energy retrofitting of all vulnerable buildings by 2050—while accounting for the natural replacement rate of older buildings—requires an average annual investment of approximately 4.44 billion EUR. Out of a total building stock of 457.5 million m2, the energy-vulnerable building stock reaches 352 million m2 in 2025 and is reduced to zero by 2050. Similarly, the seismically vulnerable building stock decreases from 249 million m2 to zero over the same period. The total building stock is projected to reach 535 million m2 by 2050.
Under these assumptions, total energy use for space heating is expected to decrease from 82 TWh in 2025 to 71 TWh in 2050, based on a 30% reduction in energy consumption achieved through moderate energy renovation. This represents a best-case scenario, assuming a consistent multiannual budgetary policy and the absence of major seismic events that could divert resources from the planned intervention strategy.
By contrast, if no targeted investments are made in either seismic retrofitting or energy renovation, the natural replacement of buildings would reduce the total floor area of seismically vulnerable buildings to 172 million m2 and that of energy-vulnerable buildings to 283 million m2 by 2050. The largest decrease would result from the gradual abandonment of Category I dwellings (single-family houses) in rural areas, combined with population migration toward newly constructed multi-family residential buildings in urban areas. Therefore, 32% of the building stock would remain seismically vulnerable and 53% energy-vulnerable by 2050, while total energy use for building operation would increase to approximately 108 TWh.
The reported energy-consumption values clearly demonstrate that improving the energy efficiency of existing buildings through moderate energy renovation alone is insufficient to achieve the decarbonization targets of the residential building sector. In parallel, decarbonization of the energy mix—particularly through increased use of electricity generated from low-carbon sources—is essential.
A comparative analysis of Scenarios 1 and 3 in Scenario Group 1 shows that, considering the expected evolution of the building stock, the CO2e footprint associated with building operation, estimated at 21 Mt CO2e in 2025, is reduced to 18 Mt CO2e if only moderate energy renovation is implemented without fuel-mix renovation, and to approximately 3 Mt CO2e if both measures are implemented simultaneously. The value of 18 Mt CO2e corresponds to a best-case situation in which all energy-vulnerable buildings are retrofitted and no major earthquake occurs in the interim. It should be emphasized that fuel-mix renovation affects the CO2e footprint of the entire building stock, including both energy-vulnerable buildings and newly constructed buildings. The results indicate that an effective reduction in emissions can only be achieved through a combination of building-level energy renovation and decarbonization of the energy supply.
The value of 3 Mt CO2e associated with residential building operation in 2050, therefore, represents an ideal reference case, in which the entire stock of energy-vulnerable buildings is renovated, the energy mix is fully decarbonized, and no major earthquake occurs by 2050. This value should be interpreted as a benchmark rather than a guaranteed outcome.
Scenario 4 from Scenario Group 1 illustrates that, in the absence of both seismic and energy retrofitting measures, the CO2e footprint associated with building operation for space heating is likely to increase to approximately 28 Mt, representing an increase of about 33% relative to the current situation.
Overall, the results of Scenario Group 1 indicate that the total CO2e footprint of the residential building stock is dominated by operational emissions associated with space heating, which are substantially higher than emissions from construction activities. This explains why decarbonization of the energy mix has a stronger impact on total emissions than either energy renovation or seismic retrofitting alone, as it directly reduces the carbon intensity of the entire energy demand. In the absence of disruptive events, supply-side interventions therefore prove more effective than demand-side measures when operational emissions prevail.

4.2. Scenario Group 2

Scenario Group 2 is designed to capture the effects of a major earthquake on the effectiveness of energy-renovation programs, assuming that full renovation of the energy fuel mix is achieved by 2060.
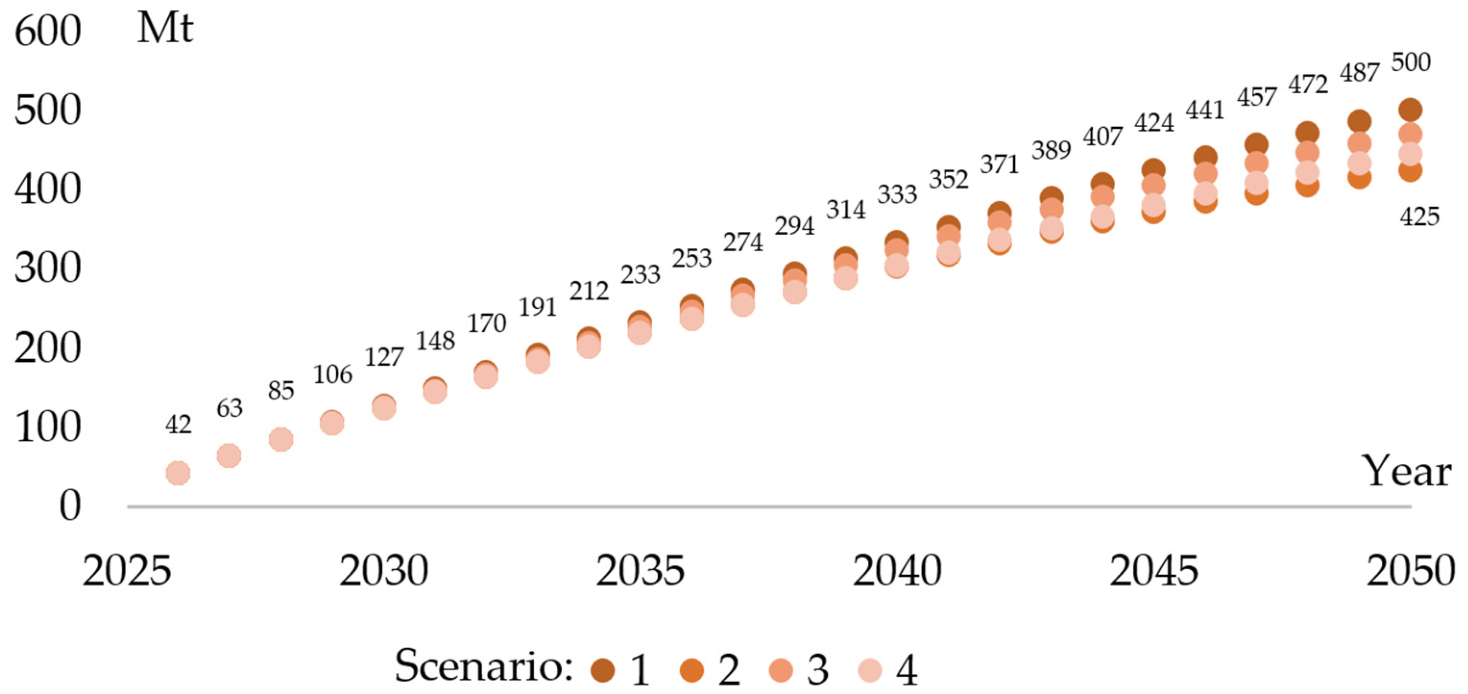
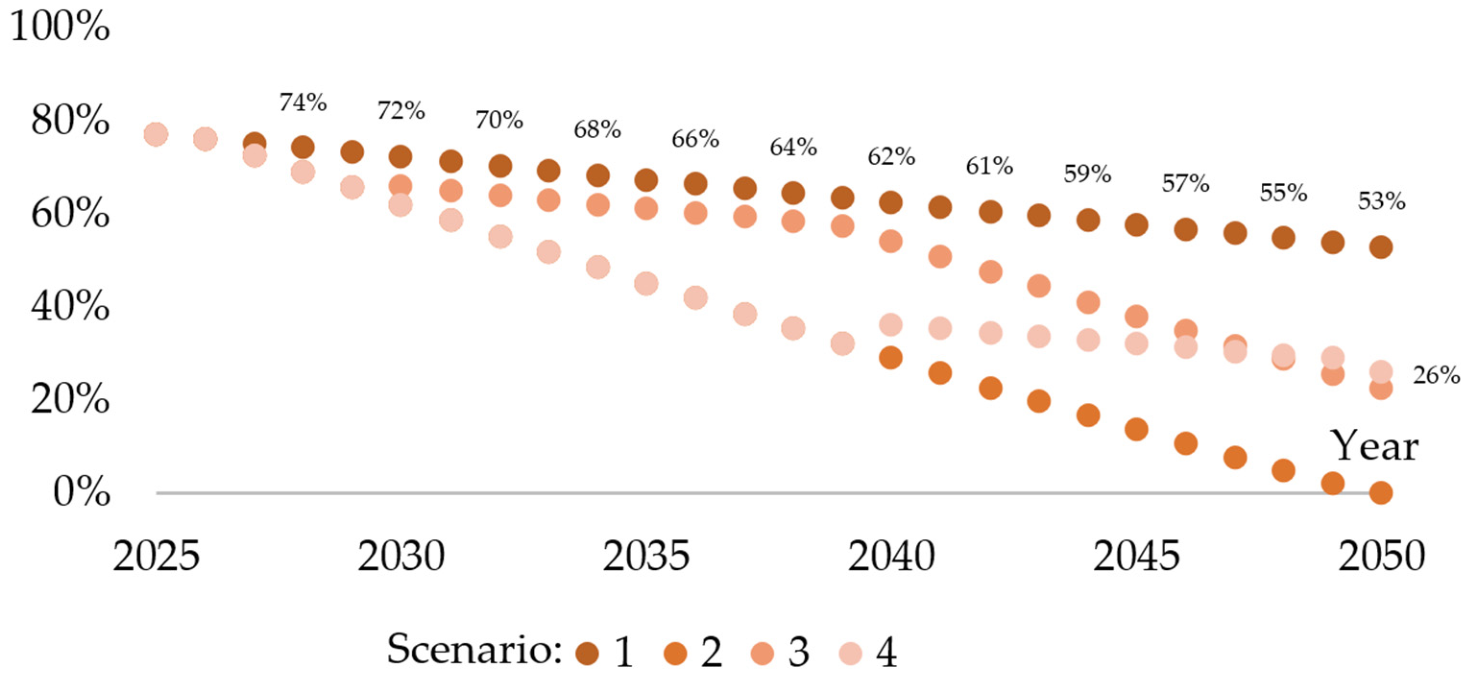
When only the fuel-mix renovation program is implemented, the stock of energy-vulnerable buildings decreases exclusively through the natural evolution of the building stock. Under this assumption, the cumulative CO2e footprint associated with the operation of the entire residential building stock over the period 2025–2050 reaches 500 Mt. Of this total, 404 Mt are generated by the operation of energy-vulnerable residential buildings. The operation of Category I buildings (single-family houses) accounts for approximately 62% of the total CO2e footprint. Total energy consumption associated with space heating in residential buildings during the period 2025–2050 amounts to 2453 TWh. These values are derived from the analysis of Scenario 1.
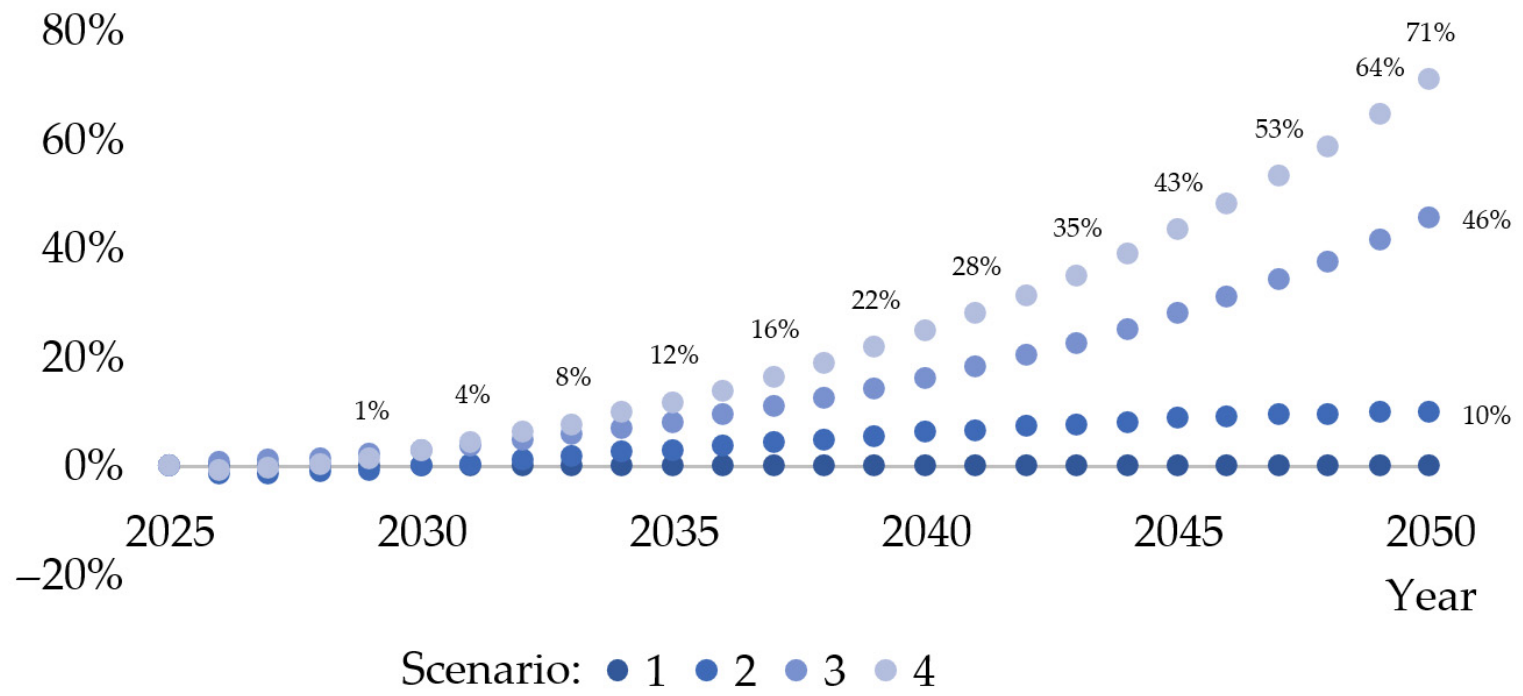
The implementation of a systematic energy-renovation program aimed at achieving moderate energy renovation of all energy-vulnerable buildings by 2050 leads to a reduction in total energy consumption for building operation to 2030 TWh over the period 2025–2050. Assuming that the energy mix is fully renovated by 2060, the CO2e footprint associated with building operation decreases from 21 Mt CO2e in 2025 to 9 Mt CO2e in 2050. An additional annual emission of approximately 0.50 Mt CO2e associated with construction works for energy renovation must be considered. Consequently, the cumulative CO2e footprint over the entire analyzed period reaches approximately 437 Mt. This represents a reduction of 63 Mt compared with the case in which no energy-renovation measures are implemented, corresponding to approximately 13% of the maximum value. The analysis indicates that implementing a systematic renovation program with an allocated budget of 1.45 billion EUR would lead to a building stock with low energy vulnerability by 2050 (see Figure 5, Scenario 2).
However, the occurrence of a major earthquake in 2030 significantly disrupts this positive trajectory. For approximately ten years following the event, the rate of reduction of the energy-vulnerable building stock decreases markedly, depending on the natural evolution of the building stock. As a result, 23% of buildings remain energy-vulnerable in 2050 (see Figure 5, Scenario 3). Energy consumption associated with space heating decreases to approximately 11 Mt CO2e per year by 2050, while the cumulative CO2e footprint over the period 2025–2050 reaches 477 Mt. Thus, the occurrence of a major earthquake in 2030 results in an increase of approximately 10% in the cumulative CO2e footprint associated with building operation, energy-renovation works, seismic retrofitting, and replacement of damaged buildings, compared with the scenario in which no major earthquake occurs.
A similar trend is observed for Scenario 4. In this case, the occurrence of a major earthquake in 2040 reduces the expected benefits of energy renovation and fuel-mix decarbonization. The resulting cumulative CO2e footprint is 452 Mt, which is 3.5% higher than the value obtained in the scenario without an earthquake. These values should also be interpreted in the context of developments beyond 2050, when fuel-mix renovation is fully completed.
In summary, the comparative analysis of Scenario Group 2 demonstrates that although reductions in the CO2e footprint associated with building heating and construction works can be achieved through systematic multi-annual intervention programs and energy-mix renovation, the occurrence of a major earthquake can substantially alter both the objectives and outcomes of such programs.
The results further show that, even under full implementation of energy-renovation measures, the absence of preventive seismic retrofitting significantly limits long-term system effectiveness. Although the entire stock of energy-vulnerable buildings is assumed to be renovated by 2050, the occurrence of a major earthquake leads to a substantial reversal of achieved benefits, with approximately 26% of the building stock remaining energy-vulnerable. This corresponds to roughly half the vulnerability observed in the no-intervention scenario, indicating that energy renovation alone can partially mitigate long-term vulnerability but cannot fully compensate for the disruptive effects of seismic events. These findings emphasize the critical role of structural resilience in preserving the benefits of energy-efficiency investments over time.

4.3. Scenario Group 3

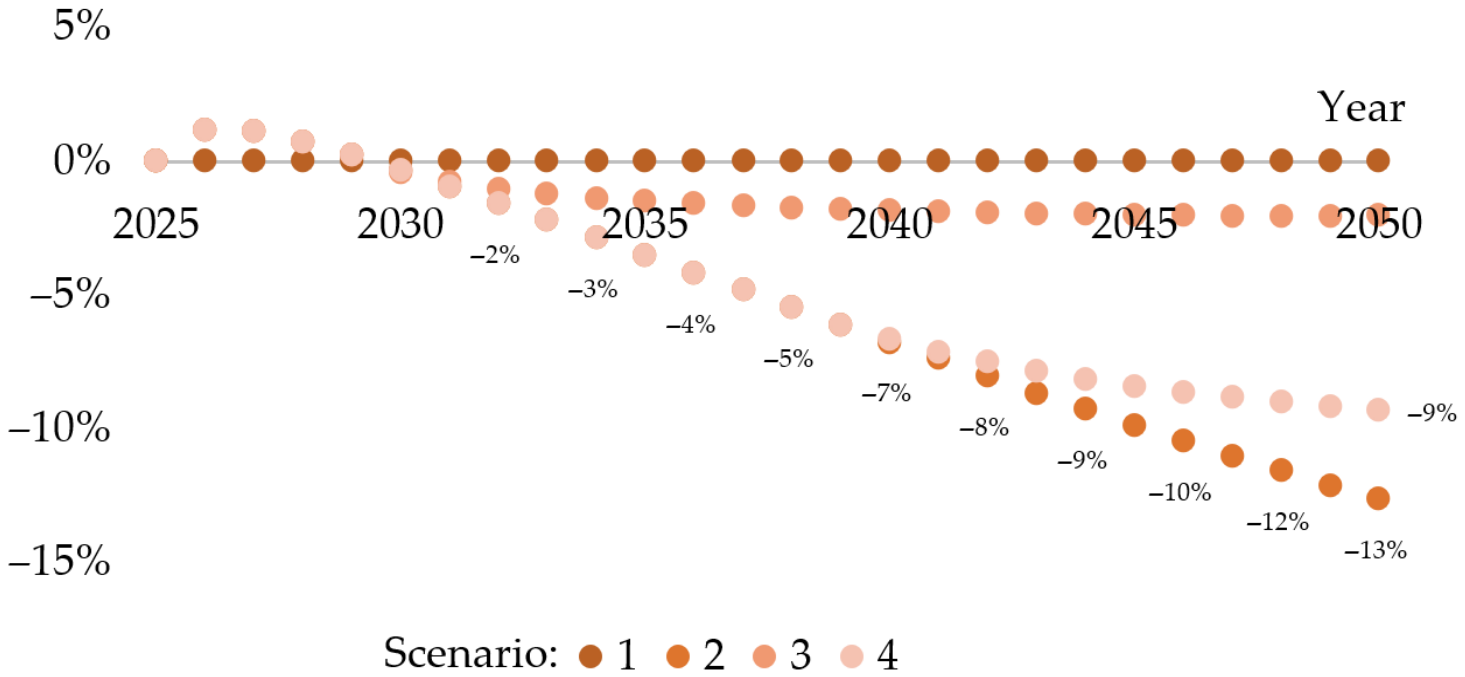
The analysis of the scenarios in Scenario Group 3 shows that the occurrence of a major earthquake has a measurable impact on the total CO2e footprint associated with the residential building stock over the analyzed period (2025–2050). The cumulative CO2e footprint varies between 433 Mt for Scenario 4 and 470 Mt for Scenario 1 (see Figure 6). Intermediate values are obtained for Scenarios 2 and 3, namely 458 Mt and 445 Mt, respectively. It can be observed that when the earthquake occurs later, its impact within the analyzed period is reduced. However, if the observed trends are extrapolated beyond 2050, the overall impact of a major earthquake remains comparable.
Due to the natural evolution of the building stock, the share of seismically vulnerable buildings decreases gradually from 53% in 2025 to 32% in 2050. It should be noted that the analysis assumes that the occurrence of a major earthquake causes damage only to buildings that are already seismically vulnerable at the time of the event and does not increase the total number of seismically vulnerable buildings. In other words, buildings with an adequate level of seismic protection are assumed not to suffer structural damage.
Figure 7 presents the cumulative CO2e emissions associated with construction activities, including energy-renovation works and the seismic retrofitting or replacement of buildings severely damaged by the earthquake. Depending on the year of earthquake occurrence in each scenario, cumulative emissions increase over time at different rates. Nevertheless, throughout the period analyzed, the resulting values for the four scenarios remain relatively close, ranging from 9.12 Mt for Scenario 3 to 10.94 Mt for Scenario 1. These emissions are initially associated with construction works for energy renovation prior to the earthquake, as well as with seismic retrofitting and the replacement of heavily damaged buildings.
The share of buildings that remain energy-vulnerable at the end of the analyzed period varies between 19% for Scenario 4 and 26% for Scenario 3, with intermediate values for the other two scenarios. This indicates that the year of earthquake occurrence does not significantly influence the proportion of energy-vulnerable buildings remaining in operation by the end of the analyzed period. However, analysis of the temporal evolution of the energy-vulnerable building stock shows that an earthquake occurring earlier has a greater impact on the overall CO2e footprint.
Regarding total energy consumption for space heating in the residential building stock, the results indicate that if the earthquake occurs in 2030, cumulative energy consumption over the analyzed period increases from 81 TWh to 87 TWh. By contrast, if the earthquake occurs in 2045, total energy consumption increases from 81 TWh to 84 TWh.
The results of Scenario Group 3 highlight the limitations of energy renovation in the absence of preventive seismic retrofitting. Although energy-efficiency measures reduce operational emissions under normal conditions, their benefits are partially or entirely lost when buildings are affected by earthquake-induced damage. This leads to additional emissions associated with reactive retrofitting and reconstruction, as well as to the reintroduction of energy-inefficient building stock. These findings underscore that, without structural risk mitigation, the long-term effectiveness of energy-renovation strategies is inherently fragile.

4.4. Scenario Group 4

The results of this scenario group can be summarized as follows.
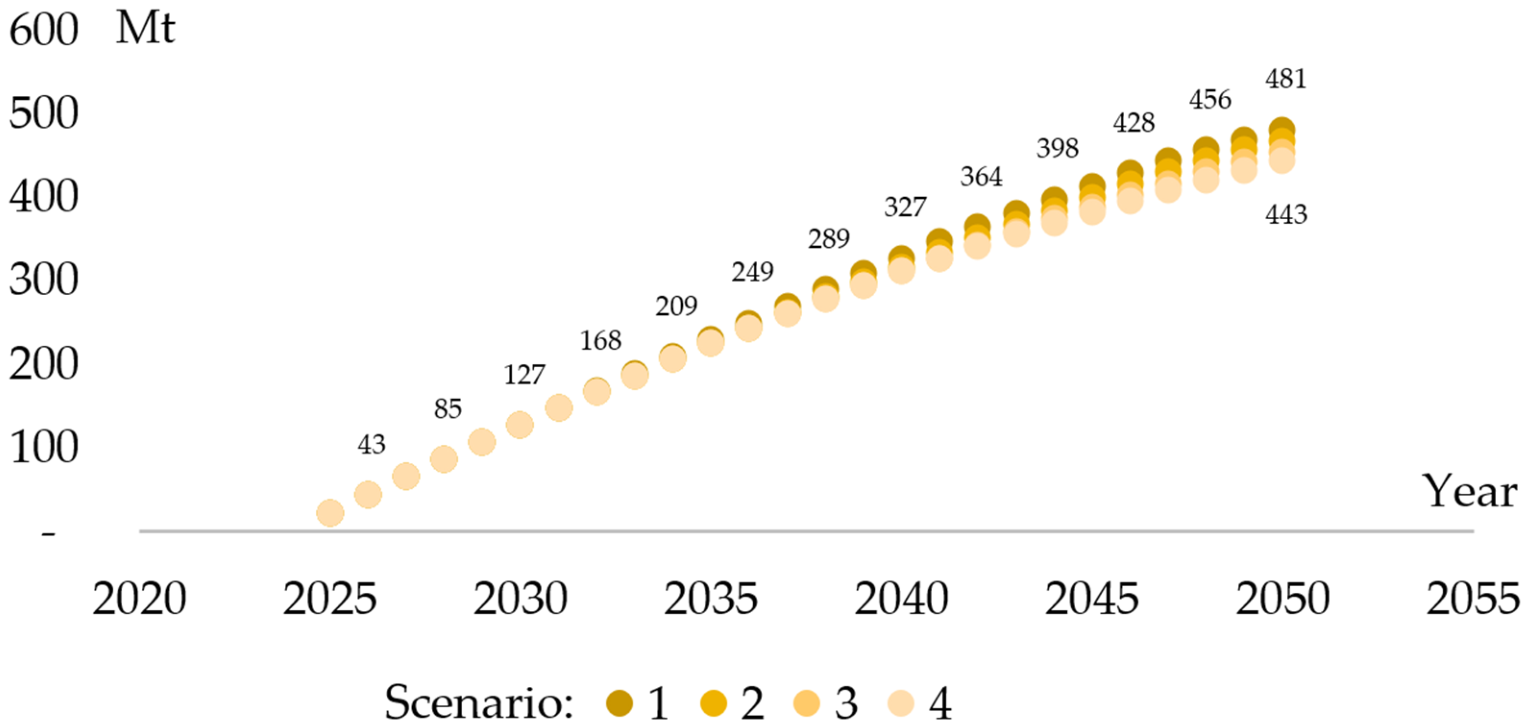
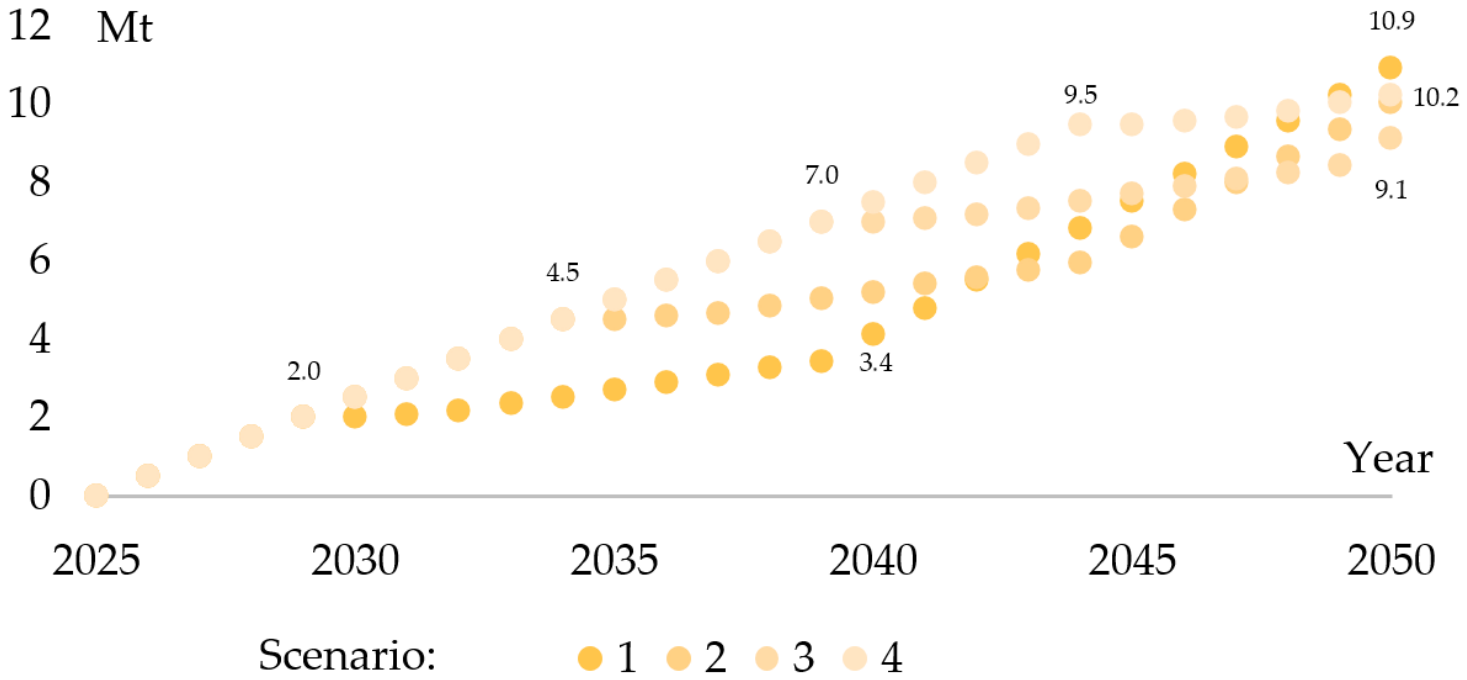
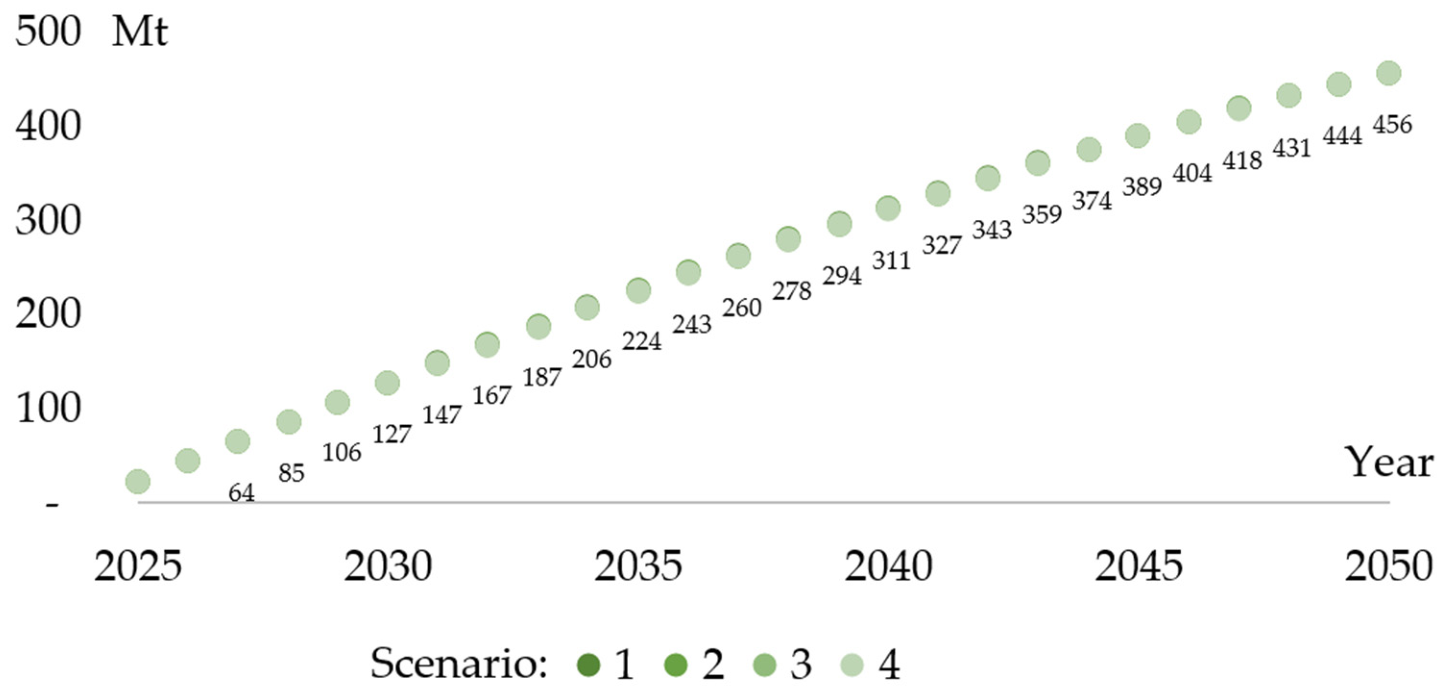
The cumulative CO2e emissions associated with building operation (heating) and with seismic retrofitting and energy-renovation works remain practically unchanged across all scenarios in this group, with values of approximately 456 Mt. For this parameter, the annual evolution is almost identical, as illustrated in Figure 9. The cumulative CO2e emissions associated with construction works are slightly higher in Scenario 1 than in Scenario 4, although the differences are relatively small (approximately 15%). By 2050, cumulative values of about 13 Mt are obtained for Scenario 1, compared with approximately 11 Mt for Scenario 4, while Scenarios 2 and 3 yield intermediate values.
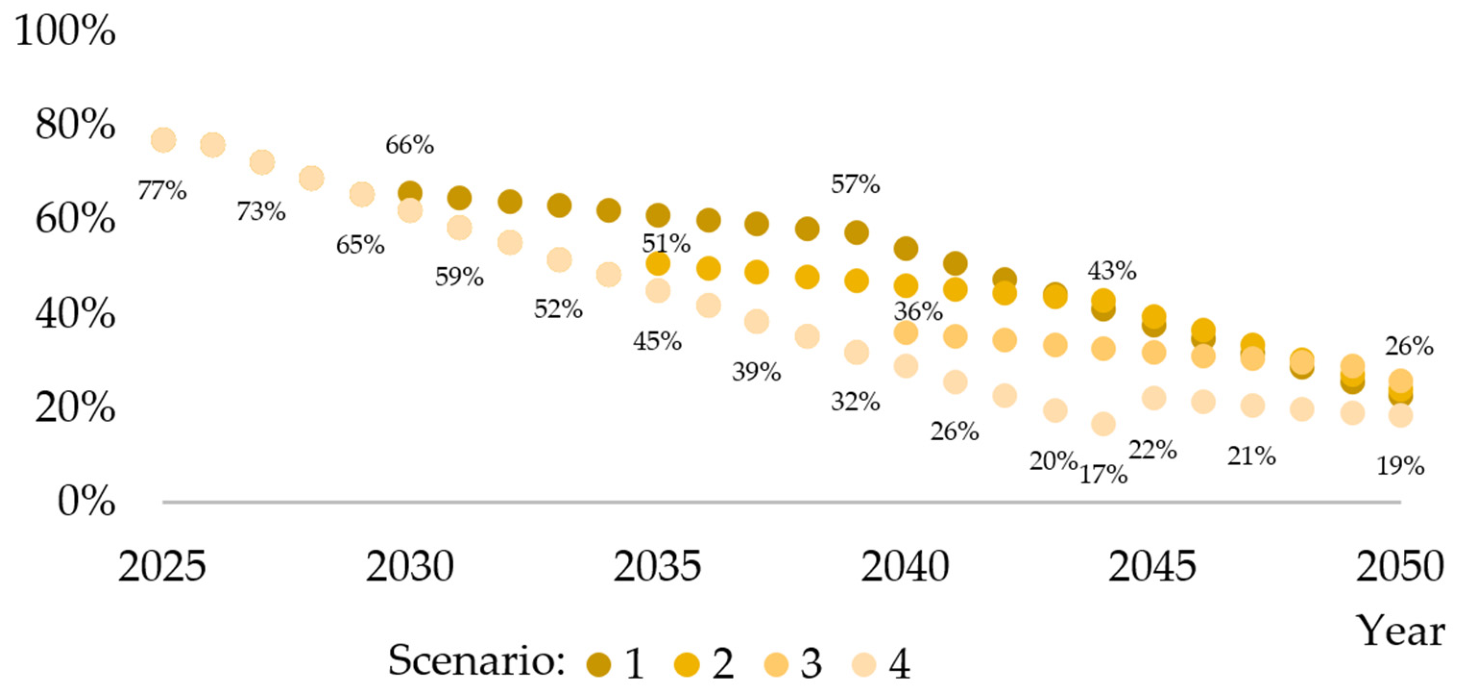
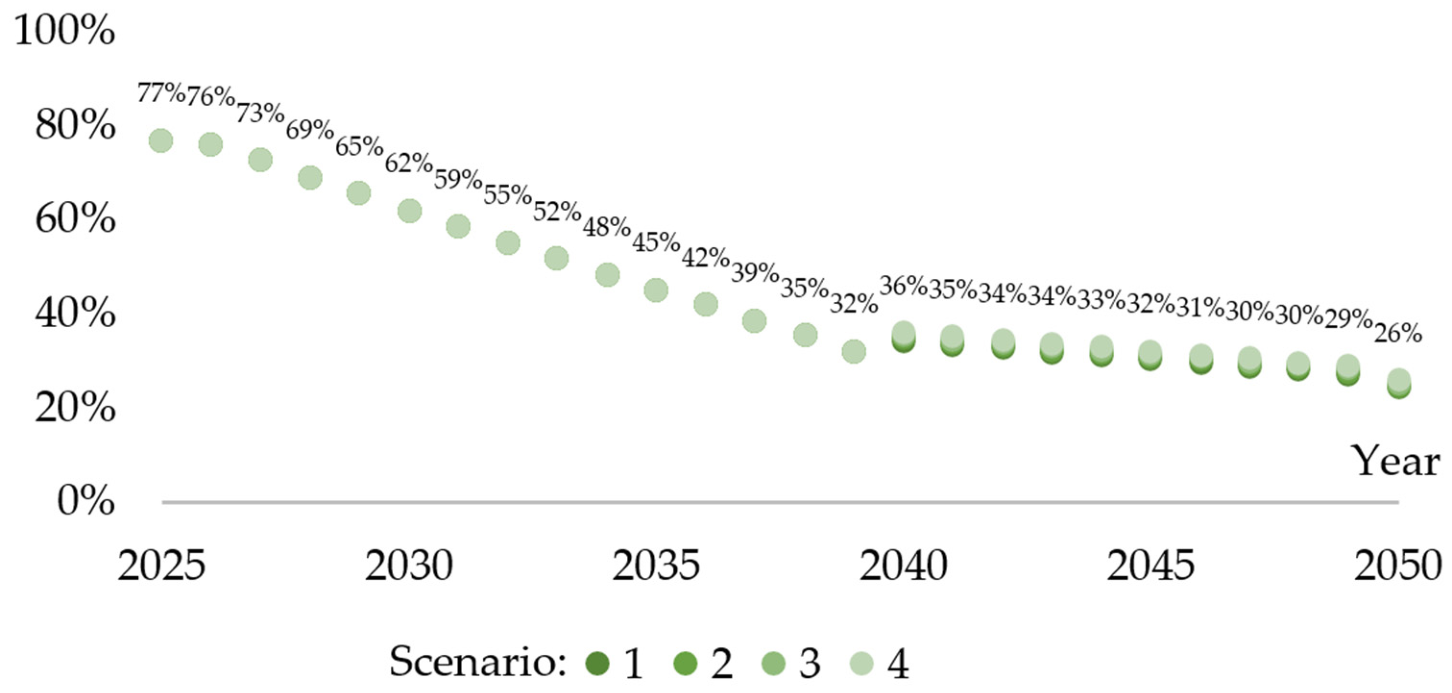
The number of energy-vulnerable buildings decreases annually, with a steeper decline until 2040, the year in which the earthquake occurs. In 2040, this number temporarily increases due to the seismic damage inflicted on some buildings that had previously undergone energy renovation. Subsequently, the number gradually decreases again until 2050, following the natural replacement trend of the existing stock of older buildings. Since the funds allocated to energy renovation are identical across all four scenarios, the evolution of this parameter is nearly identical in all cases, as shown in Figure 10.
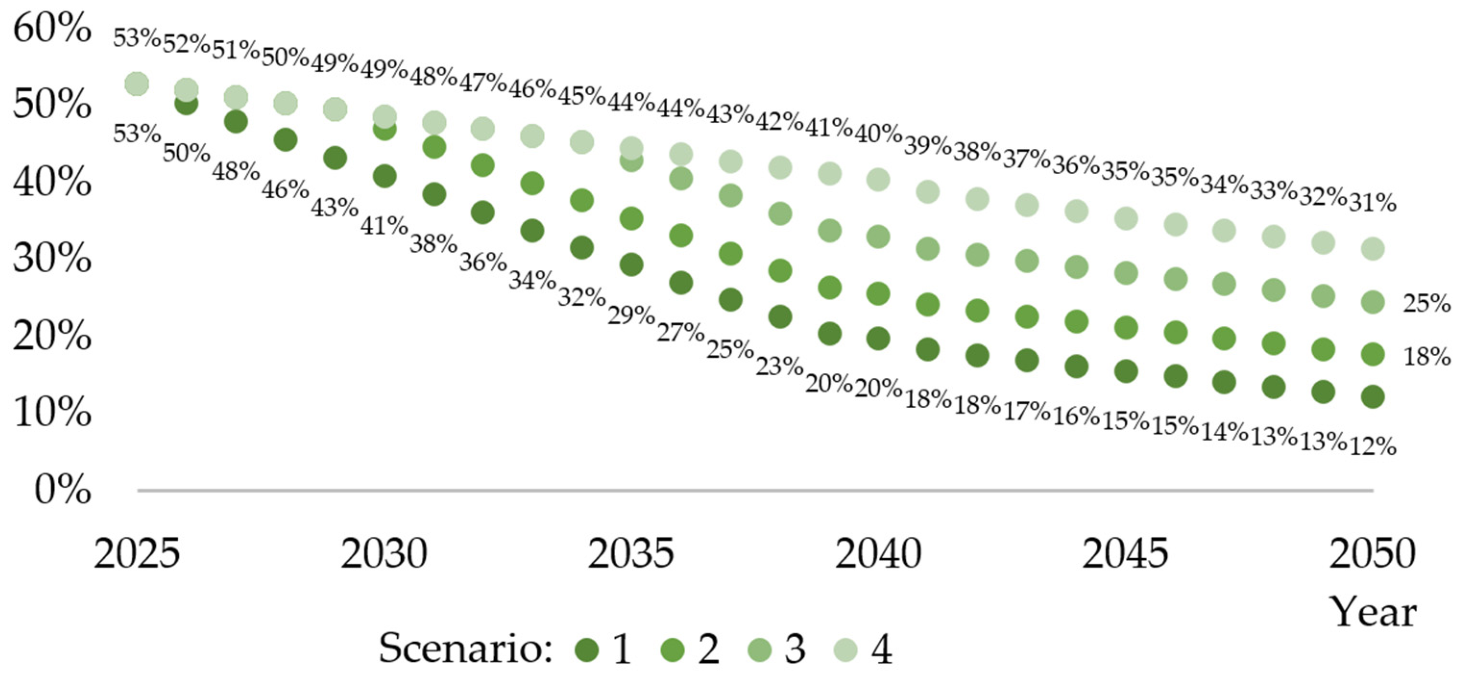
The number of seismically vulnerable buildings also decreases annually, but at different rates depending on the year in which seismic retrofitting programs are initiated. After 2040, the reduction rate decreases as funds are reallocated to reactive seismic retrofitting of damaged buildings, which requires higher investment per unit of floor area. As a result, the rate of reduction of the seismically vulnerable building stock slows. In Scenario 1, where the proactive seismic retrofitting program begins in 2026, the share of buildings remaining seismically vulnerable in 2050 is 12% (see Figure 11). This percentage increases to 18% in Scenario 2, 25% in Scenario 3, and 31% in Scenario 4. These values should be interpreted considering the design of this scenario group, in which the funds allocated for proactive seismic retrofitting would be sufficient to retrofit the entire building stock within 25 years, provided that no major earthquake occurs before completion.
An important outcome is that preventive seismic retrofitting can be implemented without a significant increase in the cumulative CO2e footprint over the analyzed period. This indicates that the additional emissions associated with strengthening works are effectively offset by the reduction of earthquake-induced damage and by the preservation of the benefits achieved through energy renovation. An additional advantage is the substantial reduction in the seismically vulnerable building stock achieved through preventive retrofitting. This leads to significant long-term sustainability benefits by increasing system resilience and reducing future exposure to disruptive events, while maintaining a comparable cumulative CO2e footprint.

5. Conclusions

If the primary objective is to reduce the CO2e footprint associated with the heating of existing residential buildings, energy-mix renovation represents the most effective strategy. Energy-mix renovation is implemented at the macro level, without requiring micro-level interventions at the property or local administrative level, which allows it to be managed more efficiently through government programs. Moderate energy renovation of buildings can nevertheless contribute to emission reduction, such that the cumulative CO2e footprint over the next 25 years can be reduced by approximately 10% if sufficient funding is allocated to renovate the entire stock of residential buildings vulnerable to energy inefficiency during this period.
Compared with the CO2e footprint associated with heating the residential building stock, emissions generated by construction works for energy renovation and/or seismic retrofitting are relatively small. For example, even in the scenario in which all seismically and energetically vulnerable buildings are retrofitted over the next 25 years, the cumulative CO2e emissions from construction activities amount to approximately 15 Mt, compared with 403 Mt from building heating, representing only 3.7% of the total. This operational value is calculated under the optimistic assumption of full energy-mix renovation by 2050. If the energy mix is not renovated, the relative contribution of construction-related emissions decreases further, to approximately 2.8%.
At the building stock level, construction works associated with energy renovation generally generate a higher CO2e footprint than those associated with seismic retrofitting. This observation is qualitative in nature, as the specific values depend on the scale of intervention and the level of investment allocated to rehabilitation programs.
In the case of a systematic energy-renovation program applied to the existing building stock, the occurrence of a major earthquake jeopardizes overall environmental objectives by increasing CO2e emissions associated with building heating, energy renovation, reactive seismic retrofitting, and replacement of severely damaged buildings. In the specific situation analyzed, the study identified an increase of approximately 10% in cumulative CO2e emissions caused by a major earthquake occurring five years after the start of the energy-renovation program. This increase is largely attributable to delays in energy-renovation activities resulting from the reallocation of investment toward seismic strengthening and reconstruction, as well as to the loss of energy-efficiency benefits in buildings that were renovated prior to the earthquake. The contribution of post-earthquake construction works themselves plays a secondary role. Consequently, the number of energy-vulnerable buildings remaining at the end of the renovation program depends more on whether a major earthquake occurs than on the exact timing of the event.
In contrast, systematic seismic retrofitting of the building stock does not lead to an increase in cumulative CO2e emissions over the program implementation period. Although strengthening works generate additional emissions in the short term, these are effectively offset in the event of a major earthquake by reducing the extent of structural damage, limiting the need for extensive reactive interventions or building replacement, and preserving the benefits of prior energy renovations. As a result, seismic retrofitting can be considered environmentally neutral over time when evaluated in terms of its anticipated long-term benefits.
The present study refers specifically to the conditions and assumptions described in Section 2 and to the scenarios analyzed in Section 3. The calculated values inevitably depend on the input parameters adopted in the analysis, and a relatively large number of parameters were considered. While this may suggest a degree of sensitivity, the results are intended primarily to highlight trends rather than absolute values, which remain robust under reasonable variations in the input data. The conclusions should therefore be interpreted in this context.
Further research should extend the present work by exploring additional scenarios relevant for public-policy design, including variations in allocated budgets for proactive seismic retrofitting and energy renovation, as well as the inclusion of the public building sector.
Based on the findings, a predictable reduction in the CO2e footprint of the residential building stock requires the following actions:
-
renovation of the energy mix used for building heating through macro-level public policies;
-
implementation of moderate energy renovation measures in buildings vulnerable to energy inefficiency, carried out at the micro level by individual property owners;
-
seismic retrofitting of buildings vulnerable to earthquakes, to ensure that the benefits of energy renovation are preserved and that severe structural damage requiring replacement is avoided.
When budget constraints are considered, intervention prioritization should account for both emission-reduction efficiency and system resilience. Fuel-mix decarbonization emerges as the most effective measure for reducing cumulative CO2e emissions due to the dominant contribution of operational energy use. However, energy renovation alone is insufficient to guarantee long-term effectiveness, as its benefits may be substantially reduced by earthquake-induced damage. Preventive seismic retrofitting, although associated with additional upfront emissions, functions as a low-carbon resilience measure, since these emissions are effectively offset by avoided reconstruction and the preservation of energy-efficiency gains. Within the analyzed time frame and assumptions, seismic retrofitting is therefore not environmentally prohibitive, even at large scale. An optimal strategy under limited resources should thus prioritize fuel-mix decarbonization while ensuring an adequate level of seismic retrofitting to protect the long-term benefits of energy renovation.

Funding

The work presented was funded by a National Research Grant of the Technical University of Civil Engineering of Bucharest, project number 1387/2025. This support is gratefully acknowledged.

Institutional Review Board Statement

Not applicable.

Informed Consent Statement

Not applicable.

Data Availability Statement

The datasets generated and analyzed during the current study are available from the corresponding author upon reasonable request.

Acknowledgments

The author would like to acknowledge the support of the Technical University of Civil Engineering of Bucharest in conducting this research.

Conflicts of Interest

The author has no relevant financial or non-financial interests to disclose.

Abbreviations

The following abbreviations are used in this manuscript:
CO2eCarbon dioxide equivalent
EUEuropean Union
EPSExpanded polystyrene
XPSExtruded polystyrene
PVCPolyvinyl chloride

References

  1. Pohoryles, D.A.; Bournas, D.A.; Da Porto, F.; Caprino, A.; Santarsiero, G.; Triantafillou, T. Integrated seismic and energy retrofitting of existing buildings: A state-of-the-art review. J. Build. Eng. 2022, 61, 105274. [Google Scholar] [CrossRef] [Scilit]
  2. European Parliament; Council of the European Union. Directive 2010/31/EU of the European Parliament and of the Council of 19 May 2010 on the energy performance of buildings. Off. J. Eur. Union 2010, L153, 13–35. [Google Scholar]
  3. European Parliament; Council of the European Union. Directive (EU) 2018/844 of the European Parliament and of the Council of 30 May 2018 amending Directive 2010/31/EU on the energy performance of buildings and Directive 2012/27/EU on energy efficiency. Off. J. Eur. Union 2018, L156, 75–91. [Google Scholar]
  4. European Commission. The European Green Deal; COM(2019) 640 Final; European Commission: Brussels, Belgium, 2019.
  5. Menna, C.; Del Vecchio, C.; Di Ludovico, M.; Mauro, G.M.; Ascione, F.; Prota, A. Conceptual design of integrated seismic and energy retrofit interventions. J. Build. Eng. 2021, 38, 102190. [Google Scholar] [CrossRef] [Scilit]
  6. Karaki, G.; Hawileh, R.A. Integrated Building Retrofit for Seismic Resilience and Environmental Sustainability: A Critical Review. Buildings 2025, 15, 3800. [Google Scholar] [CrossRef] [Scilit]
  7. Basili, M.; Busato, F.; Parente, R. An Exploratory Study on Vertical Extension with Inter-Story Isolation as a Sustainable Integrated Seismic and Energy Retrofit Strategy. Sustainability 2025, 17, 9713. [Google Scholar] [CrossRef] [Scilit]
  8. Cassol, D.; Danovska, M.; Prada, A.; Giongo, I. Timber-Based Strategies for Seismic Collapse Prevention and Energy Performance Improvement in Masonry Buildings. Sustainability 2024, 16, 392. [Google Scholar] [CrossRef] [Scilit]
  9. Alotaibi, B.S.; Khan, S.A.; Abuhussain, M.A.; Al-Tamimi, N.; Elnaklah, R.; Kamal, M.A. Life Cycle Assessment of Embodied Carbon and Strategies for Decarbonization of a High-Rise Residential Building. Buildings 2022, 12, 1203. [Google Scholar] [CrossRef] [Scilit]
  10. Hunt, J.; Osorio-Sandoval, C.A. Assessing Embodied Carbon in Structural Models: A Building Information Modelling-Based Approach. Buildings 2023, 13, 1679. [Google Scholar] [CrossRef] [Scilit]
  11. Zarco-Periñán, P.J.; Zarco-Soto, F.J.; Zarco-Soto, I.M.; Martínez-Ramos, J.L.; Sánchez-Durán, R. CO2 Emissions in Buildings: A Synopsis of Current Studies. Energies 2022, 15, 6635. [Google Scholar] [CrossRef] [Scilit]
  12. Inspectoratul General Pentru Situații de Urgență (IGSU). Raport Privind Evaluarea Riscurilor la Nivel Național (National Risk Assessment Report). 2018. Available online: https://igsu.ro/resources/54a96f57-787f-4374-9ca4-b7deed1c1995.pdf (accessed on 14 March 2025).
  13. National Institute of Statistics (INS). Population and Housing Census 2011 (Romania); National Institute of Statistics: Bucharest, Romania, 2013. Available online: https://www.recensamantromania.ro/rpl-2011/ (accessed on 14 March 2025).
  14. National Institute of Statistics (INS). Population and Housing Census 2022 (Romania); National Institute of Statistics: Bucharest, Romania, 2023. Available online: https://insse.ro/cms/en/content/permanent-resident-population-romania-1st-july-2022 (accessed on 14 March 2025).
  15. The World Bank. Report and Recommendation of the President of the International Bank for Reconstruction and Development to the Executive Directors on a Proposed Loan to the Investment Bank with the Guarantee of the Socialist Republic of Romania for’, Report No. P-2240-RO; World Bank: Washington, DC, USA, 1978. [Google Scholar]
  16. Simiu, E. The March 4, 1977 Romania Earthquake: Engineering Aspects and Lessons Learned; National Bureau of Standards (NBS): Washington, DC, USA, 1978.
  17. Institutul Central de Cercetare, Proiectare și Directivare în Construcții. Normativ Pentru Proiectarea Antiseismică a Construcțiilor de Locuințe, Social-Culturale, Agrozootehnice și Industriale, Indicativ P100-81; Institutul Central de Cercetare, Proiectare și Directivare în Construcții: București, România, 1981. (In Romanian) [Google Scholar]
  18. Ministerul Dezvoltării Regionale și Administrației Publice. Metodologie de Calcul al Performanței Energetice a Clădirilor, Indicativ MC 001-2006; Ministerul Dezvoltării Regionale și Administrației Publice: București, România, 2006. (In Romanian)
  19. United Nations Department of Economic and Social Affairs. World Population Prospects 2024, File WPP2024_GEN_F01_DEMOGRAPHIC_INDICATORS_FULL.xlsx; United Nations: New York, NY, USA, 2024; Available online: https://population.un.org/wpp/Download/Files/1_Indicator%20(Standard)/EXCEL_FILES/1_General/WPP2024_GEN_F01_DEMOGRAPHIC_INDICATORS_FULL.xlsx (accessed on 1 September 2025).
  20. Eurostat. Population Projections at Regional Level—Statistics Explained; European Commission: Luxembourg, 2025. Available online: https://ec.europa.eu/eurostat/statistics-explained/index.php?title=Population_projections_at_regional_level_-_EUROPOP2019 (accessed on 1 September 2025).
  21. Eurostat. Housing in Europe—2025 Edition; European Commission: Luxembourg, 2025. Available online: https://ec.europa.eu/eurostat/web/interactive-publications/housing-2025 (accessed on 1 September 2025).
  22. Organisation for Economic Co-operation and Development (OECD). OECD Economic Surveys: Romania 2024; OECD Publishing: Paris, France, 2024. [Google Scholar] [CrossRef] [Scilit]
  23. World Bank. Surface Area (sq. km)—Romania; World Bank Open Data: Washington, DC, USA, 2026; Available online: https://data.worldbank.org/indicator/AG.SRF.TOTL.K2?locations=RO (accessed on 2 March 2026).
  24. Popa, V.; Gheorghe, B. Sustainability of Building Stock Rehabilitation: CO2e Footprint of Energy Renovation and Seismic Strengthening, a Case Study. Sustainability 2026, 18, 3735. [Google Scholar] [CrossRef] [Scilit]
  25. Ministry of Development, Public Works and Administration (Romania). Seismic Design Code—Part III: Provisions for Seismic Assessment of Existing Buildings (P100-3/2019). No. 2834/09.10.2019. Monitorul Oficial al României, 13 December 2019. (In Romanian)
  26. Ministero delle Infrastrutture e dei Trasporti. Norme Tecniche per le Costruzioni (NTC 2018). In Decreto Ministeriale 17 Gennaio 2018; Gazzetta Ufficiale Della Repubblica Italiana: Roma, Italy, 2018. (In Italian) [Google Scholar]
  27. ISO 14040:2006; Environmental Management—Life Cycle Assessment—Principles and Framework. International Organization for Standardization (ISO): Geneva, Switzerland, 2006.
  28. Jang, H.; Ahn, Y.; Roh, S. Comparison of the Embodied Carbon Emissions and Direct Construction Costs for Modular and Conventional Residential Buildings in South Korea. Buildings 2022, 12, 51. [Google Scholar] [CrossRef] [Scilit]
  29. Yan, H.; Shen, Q.; Fan, L.C.H.; Wang, Y.; Zhang, L. Greenhouse gas emissions in building construction: A case study of One Peking in Hong Kong. Build. Environ. 2010, 45, 949–955. [Google Scholar] [CrossRef] [Scilit]
  30. Popa, V.; Bazavan, C. Assessing the Costs of Integrated Interventions for Seismic and Energy Retrofit for Educational Buildings. Transilvania University of Brașov, Braşov, Romania. 2025; accepted for publication.
  31. Karda, S.; Nagy-György, T.; Boros, I. Evolution of the Payback Period for Energy-Efficient Residential Buildings in Romania in the Last Decade. Sustainability 2023, 15, 8986. [Google Scholar] [CrossRef] [Scilit]
  32. Tsemekidi Tzeiranaki, S.; Bertoldi, P.; Diluiso, F.; Castellazzi, L.; Economidou, M.; Labanca, N.; Ribeiro Serrenho, T.; Zangheri, P. Analysis of the EU Residential Energy Consumption: Trends and Determinants. Energies 2019, 12, 1065. [Google Scholar] [CrossRef] [Scilit]
  33. International Energy Agency (IEA). Energy Statistics Data Browser: Total Final Consumption Share by Sector—Romania; IEA: Paris, France, 2025; Available online: https://www.iea.org/data-and-statistics/data-tools/energy-statistics-data-browser?country=ROU&fuel=Energy%20consumption&indicator=TFCShareBySector (accessed on 22 July 2025).
  34. Odyssee-Mure. Heating Consumption per m2. Available online: https://www.odyssee-mure.eu/publications/efficiency-by-sector/households/heating-consumption-per-m2.html (accessed on 1 September 2025).
  35. Eurostat. Energy Consumption in Households. Statistics Explained. Available online: https://ec.europa.eu/eurostat/statistics-explained/index.php?title=Energy_consumption_in_households (accessed on 1 September 2025).
  36. European Environment Agency (EEA). Final Energy Consumption—Romania; Europe’s Environment—State and Outlook 2025; EEA: Copenhagen, Denmark, 2025. Available online: https://www.eea.europa.eu/en/europe-environment-2025/countries/romania/final-energy-consumption (accessed on 24 January 2025).
  37. Schroderus, S.; Kuurola, P.; Kempe, M.; Fedorik, F.; Leivo, V.; Haverinen-Shaughnessy, U. Impacts of building energy retrofits on energy consumption, indoor environment, and hygrothermal performance in future climate scenarios. Energy Build. 2025, 347, 116413. [Google Scholar] [CrossRef] [Scilit]
  38. Prozuments, A.; Borodinecs, A.; Zaharovs, S.; Banionis, K.; Monstvilas, E.; Norvaišienė, R. Evaluating Reduction in Thermal Energy Consumption across Renovated Buildings in Latvia and Lithuania. Buildings 2023, 13, 1916. [Google Scholar] [CrossRef] [Scilit]
  39. Edenhofer, O.; Pichs-Madruga, R.; Sokona, Y.; Farahani, E.; Kadner, S.; Seyboth, K.; Adler, A.; Baum, I.; Brunner, S.; Eickemeier, P.; et al. Climate Change 2014: Mitigation of Climate Change. Contribution of Working Group III to the Fifth Assessment Report of the Intergovernmental Panel on Climate Change; IPCC: Cambridge, UK; New York, NY, USA, 2014; Available online: https://www.ipcc.ch/report/ar5/wg3/ (accessed on 1 September 2025).
  40. Low-Carbon Power Data. Romania Electricity Generation Mix 2025. Available online: https://lowcarbonpower.org/region/Romania (accessed on 15 September 2025).
Figure 1. Scenario Group 1: cumulative CO2e emission (Mt) for building operation (heating).
Sustainability 18 05041 g001
Figure 2. Scenario Group 1: cumulated CO2e footprint variation with respect to the reference scenario.
Sustainability 18 05041 g002
Figure 3. Scenario group 2: cumulative CO2e emission (Mt) for building operation (heating).
Sustainability 18 05041 g003
Figure 4. Scenario group 2: cumulative CO2e footprint variation with respect to the reference scenario.
Sustainability 18 05041 g004
Figure 5. Scenario group 2: ratio of energy un-retrofitted buildings from the total building stock for each scenario.
Sustainability 18 05041 g005
Figure 6. Scenario Group 3: cumulative CO2e emission (Mt) for heating and construction works.
Sustainability 18 05041 g006
Figure 7. Scenario Group 3: cumulative CO2e emission (Mt) construction works for energy renovation and damaged buildings’ seismic retrofit or replacement.
Sustainability 18 05041 g007
Figure 8. Scenario Group 3: ratio of energy un-retrofitted buildings for each scenario.
Sustainability 18 05041 g008
Figure 9. Scenario Group 4: cumulated CO2e emission (Mt) for building heating and construction works.
Sustainability 18 05041 g009
Figure 10. Scenario Group 4: ratio of seismic un-retrofitted building stock.
Sustainability 18 05041 g010
Figure 11. Scenario Group 4: ratio of energy un-retrofitted buildings for each scenario.
Sustainability 18 05041 g011
Table 1. Residential building stock—number of buildings [13,14].
Number of Buildings
Category 1, pre–19803,868,134
Category 1, 1981–20101,251,713
Category 1, 2011–2022416,518
Category 2, pre–1980119,633
Category 2, 1981–201032,856
Category 2, 2011–202218,192
Table 2. Average building floor area [13,14].
Average Area per Building (sqm)
Category 1, pre–1980 (sqm)41
Category 1, 1981–2010 (sqm)60
Category 1, 2011–2022 (sqm)138
Category 2, pre–1980 (sqm)756
Category 2, 1981–2010 (sqm)1092
Category 2, 2011–2022 (sqm)1819
Table 3. Average number of occupants per building [13,14].
Average Number of Occupants per Building
Category 1
pre–19802.6
1981–20101.8
2011–20221.6
2023–20302
2031–20401.7
2041–20501.4
Category 2
pre–198044
1981–201038
2011–202222
2023–203026.4
2031–204022.6
2041–205019.2
Table 4. Reparable and replaceable buildings for different national scenarios [12].
Seismic Damaged Building
National scenario with 1:10 year probability
MRI10
Damaged buildings500
Reparable100%
Replaceable0%
National scenario with 1:100 year probability
MRI100
Damaged buildings211,000
Reparable90%
Replaceable10%
National scenario with 1:1000 year probability
MRI1.000
Damaged buildings930,000
Reparable70%
Replaceable30%
Table 5. Specific CO2e emission values for proactive and reactive retrofitting [24].
Building TypeSpecific Emissions (kgCO2e/sqm)
Proactive RetrofittingReactive Retrofitting
Single family1142
Multifamily2362
Table 6. Cost of seismic retrofit and replacement considered in this study [30].
Proactive RetrofitReactive Retrofit of Damaged BuildingsReplacement of Heavily Damaged Buildings
Euro/sqm
Category I4075291800
Category II4896352100
Table 7. Fuel mix for residential buildings in 2023 [34].
Fuel Mix for Residential Buildings
Category I—single family buildings
Electricity14.9%
Fossil fuels & bioenergy77.7%
Derived heat7.4%
Category II—multi-family buildings
Electricity25.0%
Fossil fuels & bioenergy70.0%
Derived heat5.0%
Table 8. CO2e footprint for energy production [39].
CO2e for Energy Production (2025)
FuelMtCO2e/tWh
Coal and similar (5.25% of total)0.900
Gas and petroleum (42.56% of total)0.500
Wood, biomass (48.62% of total)0.125
Others (3.57% of total)0.500
Weighted average0.339
Table 9. Fuel mix for electricity production in 2023 [40].
Fuel Mix Shares for Electricity Production in Romania (2023)
FuelShare
Coal0.140
Natural Gas0.190
Hydropower0.230
Solar0.050
Wind0.120
Nuclear0.210
Import0.060
Table 10. CO2e emissions for electricity production depending on energy source.
CO2e Emissions for Electricity Production Depending on Energy SourceMtCO2e/TWh
Coal1.001
Natural Gas0.486
Hydropower0.021
Solar0.037
Wind0.012
Nuclear0.013
Import0.400
Table 11. CO2e footprint associated with the energy renovation of buildings [24].
CO2e for Energy RenovationkgCO2e/sqm
Category 150.0
Category 230.0
Table 12. Parameters of scenario group 1.
ScenarioPreventive Seismic RetrofittingEnergy RetrofittingEarthquakeReactive Seismic
Retrofitting
ReplacementFuel Mix Renovation
Start YearAnnual Budget (M€) Start YearAnnual Budget (M€) Annual Budget (M€) Annual Budget (M€)
Cat. ICat. IICat. ICat. IIYearMRICat. ICat. IICat. ICat. IIStartEnd
1202616001390202685060020601000000020252050
220260020260020601000000020252050
32026160013902026850600206010000000202510,000
4202600202600206010000000202510,000
Table 13. Parameters of scenario group 2.
ScenarioPreventive Seismic RetrofittingEnergy RetrofittingEarthquakeReactive Seismic
Retrofitting
ReplacementFuel Mix Renovation
Start YearAnnual Budget (M€) Start YearAnnual Budget (M€) Annual Budget (M€) Annual Budget (M€)
Cat. ICat. IICat. ICat. IIYearMRICat. ICat. IICat. ICat. IIStartEnd
120260020260020601000000020252060
2202600202685060020601000000020252060
320260020268506002030100059542025518020252060
420260020268506002040100059542025518020252060
Table 14. Parameters of scenario group 3.
ScenarioPreventive Seismic RetrofittingEnergy RetrofittingEarthquakeReactive Seismic
Retrofitting
ReplacementFuel Mix Renovation
Start YearAnnual Budget (M€) Start YearAnnual Budget (M€) Annual Budget (M€) Annual Budget (M€)
Cat. ICat. IICat. ICat. IIYearMRICat. ICat. IICat. ICat. IIStartEnd
120260020268506002030100059542025518020252060
220260020268506002035100059542025518020252060
320260020268506002040100059542025518020252060
420260020268506002045100059542025518020252060
Table 15. Parameters of scenario group 4.
ScenarioPreventive Seismic RetrofittingEnergy RetrofittingEarthquakeReactive Seismic
Retrofitting
ReplacementFuel Mix Renovation
Start YearAnnual Budget (M€) Start YearAnnual Budget (M€) Annual Budget (M€) Annual Budget (M€)
Cat. ICat. IICat. ICat. IIYearMRICat. ICat. IICat. ICat. IIStartEnd
1202616001390202685060020401000112097348041720252060
2203016001390202685060020401000112097348041720252060
3203516001390202685060020401000112097348041720252060
4204016001390202685060020401000112097348041720252060
Disclaimer/Publisher’s Note: The statements, opinions and data contained in all publications are solely those of the individual author(s) and contributor(s) and not of MDPI and/or the editor(s). MDPI and/or the editor(s) disclaim responsibility for any injury to people or property resulting from any ideas, methods, instructions or products referred to in the content.