Article

Intergenerational Interaction and Walking: Toward Social Sustainability in Communities for Older Adults


1
Department of Landscape Architecture and Urban Planning, College of Architecture, Texas A&M University, College Station, TX 77843, USA
2
College of Environment and Design, University of Georgia, Athens, GA 30602, USA
3
Department of Architecture, College of Architecture, Texas A&M University, College Station, TX 77843, USA
*
Author to whom correspondence should be addressed.
Sustainability 2026, 18(10), 4997; https://doi.org/10.3390/su18104997
Submission received: 2 April 2026 / Revised: 3 May 2026 / Accepted: 4 May 2026 / Published: 15 May 2026
(This article belongs to the Section Health, Well-Being and Sustainability)

Abstract

Loneliness and social isolation among older adults pose significant challenges for social sustainability. Intergenerational interaction is a key to promoting social well-being and fostering inclusive communities. Using binary logistic regression and structural equation modeling, this study investigates how neighborhood environments, transportation and recreational walking, and intergenerational interactions, defined as social engagement with children, differ among 871 older adults in intergenerational (n = 436) vs. age-targeted (n = 435) communities in central Texas. Results highlight that accessible “third places”, including streets and sidewalks, churches, and restaurants, were important for supporting intergenerational interactions, with substantially higher levels of such interactions in these places among older adults from intergenerational communities. Employment status moderated the relationship between community types and intergenerational interactions. Across both community types, recreational walking emerged as a significant, positive predictor for intergenerational interactions. Modifiable neighborhood features, particularly the presence of benches along sidewalks, were positively associated with recreational walking, which in turn predicted intergenerational interactions. While age-targeted communities may offer high neighborhood satisfaction and livability, they provide fewer opportunities for routine contact with younger generations. Findings underscore the importance of walkable, inclusive communities and intentional intergenerational programming in promoting intergenerational interaction among older adults, contributing to social sustainability and healthy aging in place.

1. Introduction

The U.S. is undergoing a major demographic shift. The population is aging at an unprecedented rate as the Baby Boomer generation, born between 1946 and 1964, reaches retirement age and life expectancy increases [1]. According to the U.S. Census Bureau, the population aged 65 and over will increase from 61.25 million (18% of the total population) in 2024 to 82 million (23% of the total population) by 2050 [2]. This shift implies that by 2050, nearly one in four Americans will be aged 65 or older.
Loneliness and social isolation have emerged as critical public health concerns for older adults [3,4]. Loneliness is a subjective, emotionally distressing sense of social disconnection arising from perceived inadequacy in social relationships, even in the absence of physical isolation [5]. Social isolation, by contrast, is an objective condition marked by limited social ties or reduced social participation [5]. According to a National Academies report, nearly 25% of adults aged 65 and older experienced social isolation, while over 40% of individuals aged 60 and above reported feelings of loneliness [4]. The literature indicates that several factors contribute to loneliness and social isolation among older adults, including declining social networks (e.g., the loss of family members or friends), physical limitations (e.g., chronic illnesses and limited walkability), and lifestyle factors (e.g., living alone and decreased activity levels) [3,4]. Both loneliness and social isolation have been consistently associated with a wide range of adverse health outcomes among older adults, such as increased risks of chronic disease, cognitive decline, dementia, depression, anxiety, and premature death [6,7,8].
Intergenerational interaction refers to meaningful and reciprocal connection, communication, and engagement between older adults and younger generations, including children [9,10]. It is a promising approach to addressing loneliness and social isolation in aging societies, which helps bridge the generational divide and promote active participation [11,12,13]. Research indicates that intergenerational interaction improves physical and mental health and well-being among older adults, while supporting independence, mobility, and social development among younger generations [14,15,16,17]. Beyond individual health outcomes, intergenerational interaction can enhance social inclusion, reduce age-based stereotypes (i.e., ageism), and foster intergenerational solidarity and social capital, contributing to more cohesive, inclusive, and healthy communities [10,18,19,20].
Walking is an accessible and everyday form of physical activity for older adults that plays a crucial role in facilitating intergenerational interaction [10,21,22]. Many empirical studies have shown that regular walking reduces the risk and severity of multiple health conditions, including cardiovascular and cerebrovascular diseases, type 2 diabetes, and cognitive decline, while also improving mental well-being, sleep quality, and longevity [23,24]. Furthermore, outdoor walking can mitigate social isolation for older adults and improve their social well-being [25,26,27]. The two distinct types of walking are transportation (i.e., walking to travel from one location to another) and recreational (i.e., walking for exercise, sport, leisure, or recreation) walking [28,29].
This study draws on three complementary theoretical frameworks from environmental gerontology and social gerontology to understand how neighborhood environments shape older adults’ walking and intergenerational interaction. First, the Ecological Model of Aging, often described within the person–environment fit tradition, posits that individual behavior and well-being result from the dynamic interplay between personal competence and environmental press [30]. According to this framework, environments that are too demanding or insufficiently stimulating relative to an individual’s capabilities can lead to maladaptive outcomes, whereas optimal fit promotes positive behaviors and well-being. For older adults with declining physical or cognitive capacities, supportive neighborhood features—such as walkable streets, accessible destinations, and well-designed public spaces—can lower environmental press, thereby facilitating outdoor mobility and social engagement [30]. Second, the neighborhood effects framework extends this ecological perspective by identifying specific environmental domains, including the physical, social, and service environments, that can either support or constrain healthy aging. This framework suggests that neighborhoods shape older adults’ access to resources necessary for health and social connectedness, with walking functioning as a behavioral pathway through which older adults engage with neighborhood environments and encounter opportunities for social interaction [31]. Third, the age integration framework provides a lens for comparing age-segregated versus age-integrated community structures [32]. Age-segregated settings may limit opportunities for cross-generational contact, whereas age-integrated environments can facilitate routine interactions between older adults and younger generations, potentially enhancing social cohesion [32]. Together, these theoretical perspectives suggest that environmental features can serve as critical levers for promoting walking and, by extension, opportunities for intergenerational contact among older adults.
Empirical evidence also highlights the importance of the neighborhood environment in promoting walking [33,34,35,36] and intergenerational interaction [37,38], while addressing each outcome separately. Specific environmental features that support walking are different from those that facilitate social interaction [10,39]. Despite these different predictors, walking and social interaction are functionally linked. Walking is a key behavioral pathway that physically places older adults in social settings, creating opportunities for spontaneous encounters. Research suggests that older adults’ engagement in walking enhances neighborhood social cohesion [40]. Similarly, walking to “third places” has been shown to improve a sense of community belonging, indicating that the built environment indirectly affects social well-being through increased pedestrian activity [41]. These findings suggest the need to test the indirect pathways from the built environment to social interaction outcomes through the mediating role of walking. However, research on these complex relationships among the built environment, walking, and intergenerational interactions remains limited.
Significant gaps also remain in whether intergenerational communities (i.e., settings without specific age restrictions) and age-targeted communities (i.e., those planned for a certain age group) have different impacts on older adults’ physical and social activities. One expert survey in the U.S. suggests that, compared to age-targeted communities, intergenerational communities can support more diverse physical and social activities, better mental health, higher quality of life, better social networks and relationships, and a higher sense of community [9]. However, to our knowledge, no existing studies have investigated physical and social activity patterns and corresponding predictors among older adults living in intergenerational vs. age-targeted communities.
To address the knowledge gaps mentioned above, we have collected and analyzed survey data to investigate walking, intergenerational interaction, and neighborhood environments among older adults living in intergenerational vs. age-targeted communities in central Texas. Intergenerational interactions in this study are defined as older adults’ social interactions with children, considering that environmental facilitators of physical and social activities among older adults and children can be important for supporting healthy and active living across all age groups [42]. The significance of this study lies in its empirical contribution to environmental gerontology and public health. As global population aging intensifies, identifying modifiable environmental features that promote social integration is a priority. While prior research has largely focused on structured, program-based interventions, this study emphasizes the role of the built environment as a “social stage” that can facilitate naturally occurring interactions. Furthermore, by comparing intergenerational and age-targeted communities, this research provides evidence-based guidelines for urban designers, planners, and policymakers. Understanding these dynamics is essential for creating or retrofitting neighborhood environments that support healthy aging in place; reduce ageism, loneliness, and social isolation; and foster more cohesive, inclusive, and socially sustainable communities for residents of all generations.

2. Materials and Methods

2.1. Conceptual Framework

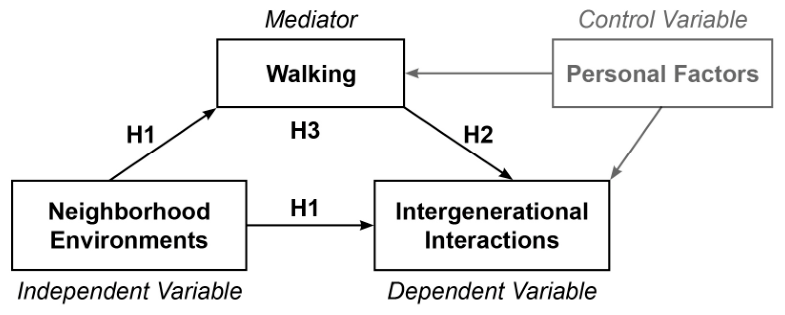
Based on relevant theories and literature, we developed the conceptual framework (Figure 1) showing the hypothesized relationships among neighborhood environments, walking, intergenerational interactions, and personal factors. This framework, with the following hypotheses, guided the data collection and analysis process:
  • Hypothesis 1: Neighborhood environments are significantly associated with walking and intergenerational interactions.
  • Hypothesis 2: Walking positively predicts intergenerational interactions.
  • Hypothesis 3: Walking significantly mediates the relationships between neighborhood environments and intergenerational interactions.
Figure 1. Conceptual Framework.
Sustainability 18 04997 g001

2.2. Design and Procedure

This cross-sectional study used survey data from participants living in two different residential areas in Texas: intergenerational communities in Austin, Texas, and an age-targeted community named Sun City Texas in Georgetown, Texas. Austin has seen a significant increase in its older population aged 65+ over the past decades, with growth rates being much higher than the state and national averages [43]. Sun City Texas is a 5000-acre master-planned community in Georgetown, located about 30 miles north of downtown Austin; designed for adults aged 55+, it is the largest age-targeted community in Texas [44,45]. As part of the greater Austin area, residents of Sun City Texas are greatly influenced by Austin’s economic, social, cultural, and environmental characteristics [44,46].
Data were collected through a survey that took about 30 min to complete. Most survey questions were extracted or adapted from validated instruments, such as the International Physical Activity Questionnaire (IPAQ) [47] and the Neighborhood Environment Walkability Scale (NEWS) [48,49]. To ensure the reliability of the collected data, the survey was evaluated and improved through a focus group with 10 older adults, 10 one-on-one interviews, pilot survey tests with six older adults, and a test–retest reliability assessment with 38 older adults. More details about the survey development and test can be found elsewhere [50].
Eligibility criteria required participants to be 65 years or older, community-dwelling (not living in long-term care facilities), and proficient in English. We allowed up to two participants from each household to complete the survey. Austin participants who reported living in an age-targeted community were excluded. We received a total of 436 complete surveys, including 264 online and 172 paper surveys, from older residents of Austin between October 2018 and June 2019, and 435 online surveys from the Sun City Texas residents between April 2019 and July 2019. A small portion of participants (i.e., 35 pairs in Austin and 52 pairs in Georgetown) were from the same household. Participants were recruited using convenience samples, primarily through senior centers, neighborhood or homeowners’ associations, and social media. A $10 gift card was provided as compensation for completing the survey. The study protocols were approved by the Institutional Review Board at Texas A&M University.

2.3. Measures

2.3.1. Intergenerational Interactions

Intergenerational interaction frequency was measured by four survey items, asking participants how many days in a typical week they spent at least 10 min interacting with children (i.e., direct intergenerational interactions) and watching children doing activities (i.e., indirect intergenerational interactions) within and outside their neighborhoods, respectively [50]. As most participants reported no intergenerational interactions, two binary outcome variables were created: direct (1+ vs. 0 times/week) and indirect (1+ vs. 0 times/week) intergenerational interactions.
Two additional variables related to intergenerational interactions included attitude towards time spent in intergenerational interactions and places supporting intergenerational interactions. For the intergenerational interaction attitude, we asked participants to rate whether they felt they spent enough time interacting with children, with single-choice responses of “too much”, “about enough”, and “not enough”. Intergenerational interaction places were measured by asking participants to indicate where they interacted with children at least once a week, with multiple-choice responses of 19 different locations covering routine destinations related to retail/services, recreational, institutional, and transportation.

2.3.2. Transportation and Recreational Walking

Transportation and recreational walking were captured by four survey questions adapted from the IPAQ, asking participants about their walking frequency (i.e., number of days in a typical week) and duration (i.e., walking time per day) [47]. Due to the skewed distribution of the walking data, we recoded transportation and recreational walking as two binary variables (1+ times/week vs. no transportation/recreational walking).

2.3.3. Neighborhood- and Neighbor-Related Variables

Neighborhood- and neighbor-related measures included social interactions with neighbors, residential self-selection on social support and cohesion, neighborhood livability, and benches on neighborhood sidewalks. The neighborhood in this study was defined as the area within a 10–15-min walk from each participant’s home [49]. The “social interactions with neighbors” factor score included four survey items capturing the frequency of interacting with neighbors in a typical month on a seven-point frequency scale from “more than once a day” to “seldom/never”: saying hello to, stopping to talk with, socializing with, and seeking help from or exchanging favors with neighbors [51,52]. The “residential self-selection on social support and cohesion” factor score contained three survey items measuring the importance of choosing the current home on a four-point Likert scale ranging from “not at all important” to “very important”: close to family members, close to friends, and access to supportive programs [53]. The Cronbach’s alpha values of the survey items capturing social interactions with neighbors and residential self-selection were over 0.8, indicating good reliability [54,55].
Neighborhood livability was measured using a survey item extracted from NEWS, asking participants to evaluate their four levels of satisfaction from “strongly dissatisfied” to “strongly satisfied” with their neighborhoods being good places to live [48,49]. As the majority rated their strong satisfaction with neighborhood livability, we recorded it as a binary variable (strongly satisfied vs. others). Benches on neighborhood sidewalks were captured by asking participants to rate the presence of benches on most of the sidewalks in their neighborhood on a four-point Likert scale ranging from “strongly disagree” to “strongly agree”. More environmental variables were also tested but excluded from this study because they were non-significant (p ≥ 0.05).

2.3.4. Demographics and Health-Related Variables

Demographics and health-related variables were captured by validated survey questions, mostly extracted or adapted from the Behavioral Risk Factor Surveillance System [56] and the American Community Survey [57]. Specific measures included age, sex, race and ethnicity, marital status, education, households with dogs, employment status, volunteer work, income, general health conditions, heart attack or other heart disease, serious personal illness during the past three years, and difficulty in walking (Table 1).

2.4. Data Analyses

Stata 18 (StataCorp LLC, College Station, TX, USA), a statistical software package, was used to conduct all descriptive and inferential statistical analyses. Descriptive statistics summarized participant characteristics and intergenerational interaction locations (e.g., churches, parks, and streets). Factor analysis with the principal component factor extraction and Promax rotation was conducted to extract two factor scores: “social interactions with neighbors” and “residential self-selection on social support and cohesion”. Bivariate (e.g., Chi-square and t-test) tests examined the association between variables (e.g., intergenerational interactions and walking). Multivariable binary logistic regression was used to identify predictors of direct intergenerational interactions for the full sample and two community-specific sub-sample models. For the full sample model, the margins command was used to generate the probability of direct intergenerational interactions by community type and employment status, and pairwise comparisons were conducted to estimate differences in direct intergenerational interactions across community type and employment status interaction groups. Finally, a Structural Equation Model (SEM) tested the complex pathways among benches on neighborhood sidewalks, recreational walking, and intergenerational interactions. Model fit was assessed using the Root Mean Square Error of Approximation (RMSEA), Comparative Fit Index (CFI), Tucker–Lewis Index (TLI), Standardized Root Mean Square Residual (SRMR), and Coefficient of Determination (CD).

3. Results

3.1. Participant Characteristics

As shown in Table 1, the mean age was 73 years for older adults living in intergenerational and age-targeted communities. Most were females (73% vs. 64% for intergenerational vs. age-targeted community participants, respectively) and non-Hispanic White (73% vs. 92%). Less than half were members of married or unmarried couples in intergenerational communities (47%), compared to 80% in the age-targeted community. The majority held a Bachelor’s degree or above (67% vs. 73%), had no dogs (74% vs. 71%), were not employed (82% vs. 92%), and engaged in volunteer work (62% vs. 63%).
Compared to intergenerational community participants, those living in the age-targeted community had a higher income and better health conditions, experienced less serious personal illness during the past three years, and reported less difficulty in walking. Transportation and recreational walking were similar among older adults from both types of communities: 44% engaged in transportation walking in both, and 73% engaged in recreational walking among intergenerational community participants, compared to 78% among age-targeted community participants. Regarding their neighbors and neighborhoods, older adults in age-targeted communities were more likely to interact with their neighbors, consider social support and cohesion as important factors in choosing their homes, perceive their neighborhoods as livable, and report having benches on most neighborhood sidewalks, compared to those in intergenerational communities.
In terms of intergenerational interactions, older adults in intergenerational communities engaged in significantly more direct (42%) and indirect (46%) intergenerational interactions than those in the age-targeted community (i.e., 22% direct and 21% indirect intergenerational interactions). Approximately half of the survey participants (42% vs. 49%) indicated that they did not spend enough time interacting with children.

3.2. Places Supporting Intergenerational Interactions

Places supporting intergenerational interactions were largely similar among older adults living in both types of communities (Figure 2). Popular places used by older adults living in intergenerational communities included streets or sidewalks (17%), churches (15%), restaurants (10%), and supermarkets (10%), while restaurants (12%), churches (10%), and supermarkets (8%) were commonly used by those living in the age-targeted community.

3.3. Intergenerational Interactions and Walking

We found that both direct (Table A1) and indirect (Table A2) intergenerational interactions were significantly correlated with transportation and recreational walking, based on the Chi-square test results. Specifically, direct intergenerational interactions were significantly positively correlated with transportation walking among older adults living in intergenerational communities (p = 0.034), while they were marginally significant among those living in the age-targeted community (p = 0.089). Direct intergenerational interactions and recreational walking were significantly positively correlated, regardless of the community type (p = 0.003 and p = 0.016 for intergenerational and age-targeted community participants, respectively).
Indirect intergenerational interactions were significantly positively associated with transportation walking among age-targeted community older adults (p = 0.005), while they were marginally significant among intergenerational community older adults (p = 0.054). The positive relationship between indirect intergenerational interactions and recreational walking was significant among intergenerational community participants only (p = 0.038).

3.4. Predictors of Direct Intergenerational Interactions

Significant predictors covered the domains of demographics, health, walking, neighborhoods or neighbors, and community types (Table 2). As for demographics, employed, compared to non-employed, older adults living in the age-targeted community (p = 0.002) had about four times the odds of interacting with children. Those in both types of communities who engaged in volunteer work, compared to their counterparts, had approximately twice the odds of interacting with children (p = 0.005 and p = 0.023 for the intergenerational and age-targeted community models, respectively). The positive association between households with dogs and intergenerational interactions was marginally significant among intergenerational community older adults (p = 0.061).
Regarding health, general health conditions and heart attack or heart disease had no significant associations with intergenerational interactions. Older adults who had serious personal illness in the past three years were less likely to interact with children than their counterparts (OR = 0.574; p = 0.028), as shown in the intergenerational community model.
Walking was a significant predictor of intergenerational interactions. Older adults from both types of communities who walked for recreation in a typical week had about twice the odds of interacting with children (p = 0.046 for the intergenerational community model and p = 0.022 for the age-targeted community model). Transportation walking was marginally significantly correlated with social interactions with children among older adults living in intergenerational communities (p = 0.057).
Social interactions with neighbors (OR = 1.364; p = 0.016) and perceived neighborhood livability (OR = 2.160; p = 0.004) were positively correlated with intergenerational interactions in the full sample model and the intergenerational community model. Older adults in both communities who took social support and cohesion into account when choosing their homes were significantly more likely to interact with children than their counterparts (p = 0.042 for the intergenerational community model and p < 0.001 for the age-targeted community model).
Results from the full sample model suggested that older adults living in intergenerational communities, compared to those in the age-targeted community, had more than five times the odds of interacting with children (p < 0.001). The community type and employment status interaction term was also a significant predictor, suggesting a smaller increase in intergenerational interactions from non-employed to employed older adults in intergenerational communities compared to those in the age-targeted community. Specifically, the probabilities of interacting with children in a typical week were 17.5% among non-employed older adults living in the age-targeted community, 41.0% among employed older adults living in the age-targeted community, 46.4% among non-employed older adults living in intergenerational communities, and 48.8% among employed older adults living in intergenerational communities (Table A3). Compared to non-employed older adults living in the age-targeted community, the odds of interacting with children were about four to six times higher among employed older adults in the age-targeted community (OR = 3.977; p = 0.001) and non-employed (OR = 5.186; p < 0.001) and employed (OR = 5.824; p < 0.001) older adults in intergenerational communities (Table A4).

3.5. Benches, Recreational Walking, and Direct Intergenerational Interactions

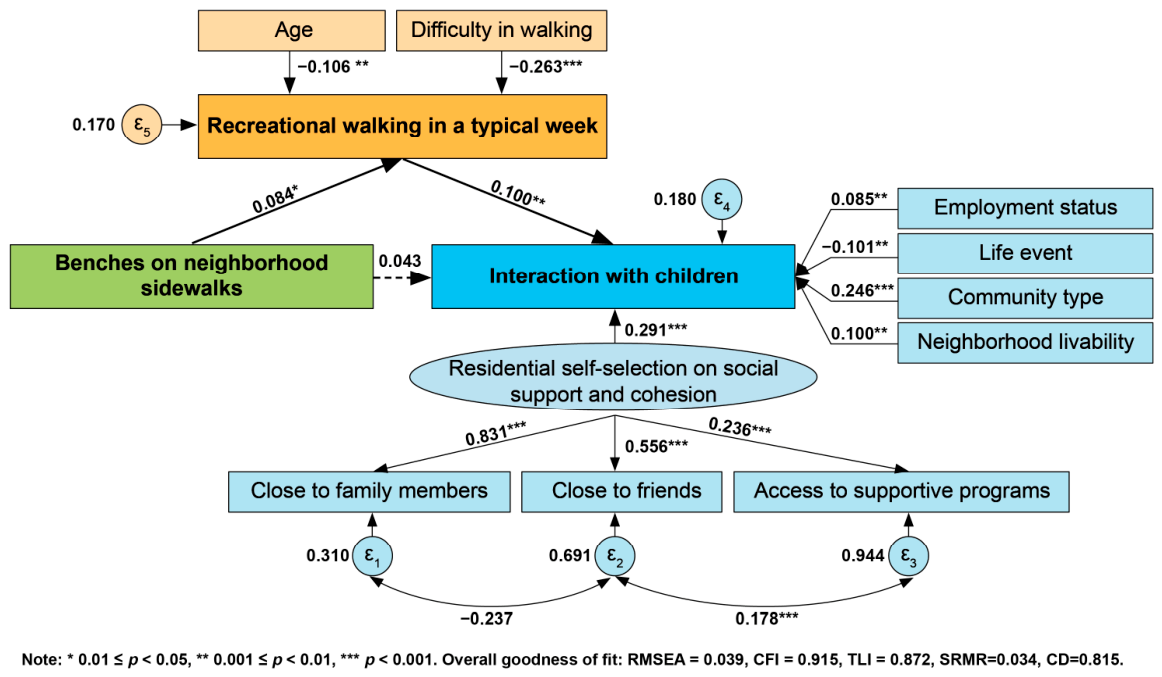
The full SEM specification (N = 850) is presented in Figure 3, showing the relationships among benches, recreational walking, and direct intergenerational interactions among older adults. Residential self-selection related to social support and cohesion, along with key personal and contextual characteristics, including employment status, major illness history, community type, and perceived neighborhood livability, were also included. Standardized coefficients, p-values, and 95% confidence intervals of all structural paths are reported in Table A5.
Model fit statistics indicated an overall acceptable to good fit. The RMSEA was 0.039, below the recommended 0.06 threshold, suggesting a strong fit between the hypothesized model and the observed data [58]. The SRMR was 0.034, well below the 0.08 threshold, also suggesting a good model fit [58]. The CD was 0.815, suggesting that the model explained a substantial proportion of variance in the endogenous constructs. CFI (0.915) indicated an acceptable fit, and TLI (0.872) suggested a marginal model fit [58].
Older age and difficulty in walking were both significant negative predictors of recreational walking during a typical week (β = −0.106 and β = −0.263, respectively). Recreational walking was positively associated with interaction with children (β = 0.100; p = 0.002), indicating that older adults who walked regularly for recreational purposes were more likely to maintain intergenerational engagement. The presence of benches on neighborhood sidewalks was positively associated with recreational walking (β = 0.084; p = 0.010). The direct effect of benches on intergenerational interaction was non-significant (β = 0.043; p = 0.223), while the indirect effect via recreational walking was statistically significant (β = 0.008; p = 0.047).
The latent construct of residential self-selection on social support and cohesion was measured using three indicators: close to family members, close to friends, and access to supportive programs. All three indicators loaded significantly on the latent construct (loadings = 0.831, 0.556, and 0.236, respectively), supporting construct validity. Consistent with the regression model, residential self-selection significantly and positively predicted interactions with children (β = 0.291; p < 0.001). Additional significant positive exogenous predictors of interaction with children included employment status (β = 0.085; p = 0.007), community type (β = 0.246; p < 0.001), and neighborhood livability (β = 0.100; p = 0.003), indicating that older adults who were employed, living in intergenerational communities, and perceiving their neighborhoods as livable were more likely to engage with children. Conversely, experiencing a major illness in the past three years was associated with reduced interactions (β = −0.101; p = 0.001).

4. Discussion

This is one of the first studies comparing older adults living in intergenerational communities with those living in an age-targeted community with respect to their physical and social activities, personal characteristics, and neighborhood environments, among others. Study results indicate that transportation and recreational walking are similar between these two groups. Intergenerational interactions are more frequent among intergenerational community participants; a higher percentage of older adults living in the age-targeted community (49% vs. 42%) reported that they spent too little time in intergenerational interactions. This highlights the need for more policy, program, and environmental interventions towards promoting intergenerational interactions, which are significant determinants of health and well-being among older adults [17].
The significantly positive relationship between walking and intergenerational interactions is shown in both groups, which is consistent with previous research demonstrating that walking is associated with increased social interactions and relationships [25]. Reflecting this, streets and sidewalks emerged as a prominent intergenerational contact space in intergenerational but not age-targeted communities, suggesting that walkable street environments facilitate naturally occurring cross-generational encounters in mixed-age neighborhoods.
Compared to the intergenerational community group, older residents of the age-targeted community have better neighborhood social and physical environments (e.g., more social interactions with neighbors and higher neighborhood livability). Both groups report that third places (beyond home and work), like restaurants and churches, are popular places supporting intergenerational interactions, which is in line with previous studies highlighting the significant role of third places in promoting intergenerational and other social interactions [10,11].
Regression model results show that participating in volunteer activities, recreational walking, and residential self-selection on social support and cohesion are correlated with a greater likelihood of interacting with children in both intergenerational and age-targeted community groups. Volunteer work likely provides regular access to age-diverse settings such as schools and youth programs, enabling intergenerational contact regardless of residential environments. Being employed predicts increased intergenerational interaction only within the age-targeted community group, likely because of limited opportunities to engage in such interactions within their neighborhoods. Concerning significant predictors of interactions with children only within the intergenerational community group, having a serious personal illness in the past three years is a negative predictor, while social interactions with neighbors and neighborhood livability are positive factors. This suggests that neighborhood environments are less likely to predict intergenerational interactions among older adults living in the age-targeted community, given the special attribute of excluding younger residents, including children. Future efforts on promoting intergenerational interactions within age-targeted communities could consider incorporating routine intergenerational programs and events (e.g., intergenerational playing, learning, and tutoring) through building strong partnerships with local schools and youth organizations [14,15,59].
Results regarding the interaction term between community type and employment status show that the probability of engaging in intergenerational interactions is the highest among employed older adults living in intergenerational communities, while it is the lowest among non-employed older adults living in the age-targeted community. This is in line with previous studies that suggest the importance of intergenerational communities and employment opportunities in reducing ageism, loneliness, and social isolation, promoting social networks and interactions, and supporting healthy aging in place [4,7,11,17].
SEM results indicate that benches on neighborhood sidewalks directly predict older adults’ recreational walking and indirectly predict intergenerational interactions through the mediating role of recreational walking. This could be attributed to more opportunities to interact with younger generations, including children, for those who spend more time outdoors (e.g., parks with playgrounds) during their recreational walking [10,22,25]. The importance of places to rest in supporting older adults’ physical and social activities has been widely recognized in the current body of literature [11,22,25], while studies addressing intergenerational interactions are limited. The pathway from neighborhood environments to walking is well-supported in the literature, with accessible and supportive built features shown to reduce barriers to outdoor activity among older adults [22,36,37]. The subsequent link from recreational walking to intergenerational interaction aligns with evidence that outdoor activity places older adults in shared community spaces, creating conditions for spontaneous social encounters across generations [10,12,26].
Taken together, these findings suggest that intergenerational interactions among older adults are shaped by a confluence of personal, behavioral, and environmental factors. While community type and residential self-selection play dominant roles, modifiable factors including recreational walking, volunteer participation, and walkable street infrastructure offer actionable leverage points for promoting intergenerational contact across both community types.

4.1. Limitations

Four major limitations of this study should be noted. First, the cross-sectional study design using convenience sampling could limit the generalizability of the study results. Convenience sampling was utilized due to the practical constraints of recruiting hard-to-reach participants, such as limited resources and time, which enabled us to generate preliminary insights on this new research area.
Second, participants from the two different community groups were markedly different in certain demographic and socioeconomic characteristics (e.g., marital status, income, race and ethnicity, and general health conditions). Future investigations with matching groups using advanced statistical methods, such as propensity score matching or inverse probability weighting [60], could help better identify how external environmental factors may impact walking and intergenerational interactions differently among older adults living in intergenerational vs. age-targeted communities. The possibility of missing important sociodemographic covariates also suggested the need for caution when attributing physical and social activities to community types and environments. The intra-household correlation among paired participants from the same household could impact the significance of environmental predictors, despite only a very small portion of participants from the same household.
Third, survey recall bias could undermine the accuracy and reliability of the study data. For example, the subjective measures of walking and intergenerational interaction could under- or over-estimate older adults’ activity levels. Additionally, dichotomizing walking and intergenerational interaction might reduce variance and statistical power. As indicated in Section 2. Materials and Methods, we conducted a focus group, one-on-one interviews, pilot survey tests, and a test–retest reliability assessment to test and improve the survey instrument. The test–retest reliability assessment results showed acceptable to high reliability scores for most survey items [50].
Fourth, the differences in intergenerational interactions between these two community groups might be attributed to residential self-selection rather than neighborhood environments. For example, older adults who valued intergenerational interactions chose to live in intergenerational communities. To partially address this potential bias, we controlled the residential self-selection on social support and cohesion in our models. We also tested more relevant factors (e.g., diversity of age groups and the presence of other older residents) in choosing their homes and excluded these factors in our final models due to their lack of statistical significance.

4.2. Implications for Future Research and Practice

This study provides empirical evidence supporting future research and practice towards promoting intergenerational and age-targeted communities that serve older adults of various demographic and socioeconomic backgrounds. Walkable, inclusive communities with supportive social spaces and programming play a vital role in supporting older adults’ physical and social activities. Given that older adults spend most of their time in their neighborhoods, future policy, program, and environmental interventions to promote walkability and social sustainability can contribute to sustained health and well-being benefits.
Considering the heterogeneity of older populations, more efforts are needed to identify similarities and differences in their preferences for intergenerational vs. age-targeted communities, which can guide the development of tailored environmental interventions addressing their unique needs by subgroup. Given significant gaps remaining in comparing older adults living in intergenerational communities with those living in age-targeted communities, there is a need for future studies in additional locations or communities that utilize a more solid research design (e.g., longitudinal studies) and include both subjective and objective measures of the neighborhood environment, walking, and social interactions. These studies can help identify feasible and innovative programs and environmental solutions for supporting intergenerational interactions and healthy aging in place among diverse aging populations.
Furthermore, future investigations should consider the built environment, walking, and social interaction in a more comprehensive way. For example, more research is needed to investigate the direct and indirect impacts of various benches, in terms of their locations (e.g., along a street vs. in a park), comfort levels (e.g., with vs. without shelters), materials, and pleasantness of surroundings, among others, on various types of physical and social activities. Such research will contribute to supporting the development of the neighborhood environment that can bring long-term, population-level health benefits.

5. Conclusions

In conclusion, findings from this study suggest that popular places supporting intergenerational interactions are similar among older adults living in these two different types of communities, despite their significant differences in personal factors (e.g., health and income). Nearly half of older adults in both community groups express a preference for increased intergenerational interactions, highlighting the need to develop programs and environmental interventions that promote intergenerational interactions within diverse aging communities. This research provides preliminary evidence on personal and environmental predictors of intergenerational interactions among older adults living in intergenerational vs. age-targeted communities, as well as the complex associations among benches on neighborhood sidewalks, recreational walking, and intergenerational interactions.

Author Contributions

Conceptualization, S.Z., D.R. and X.Z.; methodology, S.Z.; validation, S.Z.; formal analysis, S.Z., K.P., N.W. and J.B.; investigation, S.Z.; data curation, S.Z.; writing—original draft preparation, S.Z., K.P., N.W. and J.B.; writing—review and editing, S.Z., K.P., J.B., D.R. and X.Z.; visualization, S.Z. and N.W.; supervision, S.Z.; project administration, S.Z.; funding acquisition, S.Z. All authors have read and agreed to the published version of the manuscript.

Funding

This research was funded by the ‘American Institute of Architects’ Design for Aging Knowledge Community and Texas A&M University.

Institutional Review Board Statement

The study was conducted in accordance with the Declaration of Helsinki and approved by the Institutional Review Board of Texas A&M University (protocol code IRB2018-0578M; date of approval: 16 October 2018).

Informed Consent Statement

Informed consent was obtained from all subjects involved in the study.

Data Availability Statement

Dataset is available upon request from the authors.

Conflicts of Interest

The authors declare no conflicts of interest.

Appendix A

Table A1. Direct Intergenerational Interactions and Walking.
Intergenerational Community Older Residents in AustinAge-Targeted Community Older Residents in Georgetown
Direct Intergenerational InteractionsNo Direct Intergenerational InteractionsChi-Square
p-Value
Direct Intergenerational InteractionsNo Direct Intergenerational InteractionsChi-Square
p-Value
Transportation Walking 0.034 0.089
Yes88 (48.09%)95 (51.91%) 48 (25.40%)141 (74.60%)
No90 (37.82%)148 (62.18%) 45 (18.60%)197 (81.40%)
Recreational Walking 0.003 0.016
Yes142 (46.25%)165 (53.75%) 82 (24.19%)257 (75.81%)
No35 (30.43%)80 (69.57%) 12 (12.63%)83 (87.37%)
Table A2. Indirect Intergenerational Interactions and Walking.
Intergenerational Community Older Residents in AustinAge-Targeted Community Older Residents in Georgetown
Indirect Intergenerational InteractionsNo indirect Intergenerational InteractionsChi-Square
p-Value
Indirect Intergenerational InteractionsNo Indirect Intergenerational InteractionsChi-Square
p-Value
Transportation Walking 0.054 0.005
Yes93 (51.10%)89 (48.90%) 51 (27.42%)135 (72.58%)
No100 (41.67%)140 (58.33%) 39 (16.32%)200 (83.68%)
Recreational Walking 0.038 0.255
Yes150 (48.70%)158 (51.30%) 75 (22.46%)259 (77.54%)
No43 (37.39%)72 (62.61%) 16 (17.02%)78 (82.98%)

Appendix B

Table A3. Probability of Direct Intergenerational Interactions: Postestimation Using Margin.
Community Type and Employment StatusMarginp-Value95% Conf. Interval
Age-targeted and non-employed0.175<0.001[0.139, 0.212]
Age-targeted and employed0.410<0.001[0.249, 0.571]
Intergenerational and non-employed0.464<0.001[0.407, 0.522]
Intergenerational and employed0.488<0.001[0.381, 0.596]
Table A4. Interaction Group Comparisons: Postestimation Using Pairwise Comparisons.
Community Type and Employment StatusORp-Value95% Conf. Interval
Age-targeted and employed vs. age-targeted and non-employed3.977 **0.001[1.706, 9.273]
Intergenerational and non-employed vs. age-targeted and non-employed5.186 ***<0.001[3.289, 8.178]
Intergenerational and employed vs. age-targeted and non-employed5.824 ***<0.001[3.137, 10.812]
Intergenerational and non-employed vs. age-targeted and employed 1.3040.545[0.552, 3.079]
Intergenerational and employed vs. age-targeted and employed1.4640.433[0.564, 3.799]
Intergenerational and employed vs. intergenerational and non-employed1.1230.697[0.627, 2.012]
Note: ** 0.001 ≤ p < 0.01, *** p < 0.001. OR: Odds Ratio.

Appendix C

Table A5. Benches, Recreational Walking, and Direct Intergenerational Interactions.
Standardized Coef.p-Value95% Conf. Interval
Intergenerational interactions
Recreational walking in a typical week (yes vs. no)0.100 **0.002[0.037, 0.162]
Benches on neighborhood sidewalks (somewhat/strongly agree vs. somewhat/strongly disagree)0.0430.223[−0.026, 0.112]
Employment status (employed vs. not employed)0.085 **0.007[0.023, 0.148]
[Life event] Personal illness during the past three years (yes vs. no)−0.101 **0.001[−0.163, −0.039]
Community type (intergenerational vs. age-targeted communities)0.246 ***<0.001[0.196, 0.332]
Neighborhood livability (strongly satisfied vs. others)0.100 **0.003[0.035, 0.165]
Residential self-selection on social support and cohesion (factor scores)0.291 ***<0.001[0.148, 0.434]
Recreational walking
Age (years)−0.106 **0.001[−0.170, −0.043]
Difficulty in walking (Yes/don’t know/prefer not to answer vs. no)−0.263 ***<0.001[−0.325, −0.202]
Benches on neighborhood sidewalks (somewhat/strongly agree vs. somewhat/strongly disagree)0.084 *0.010[0.020, 0.148]
Residential self-selection on social support and cohesion (factor scores)
Close to family members0.831 ***<0.001[0.458, 1.203]
Close to friends0.556 ***<0.001[0.265, 0.847]
Access to supportive programs0.236 ***<0.001[0.113, 0.360]
Note: * 0.01 ≤ p < 0.05, ** 0.001 ≤ p < 0.01, *** p < 0.001. Overall goodness of fit: RMSEA = 0.039, CFI = 0.915, TLI = 0.872, SRMR = 0.034, CD = 0.815.

References

  1. U.S. Census Bureau. Older Population and Aging. Available online: https://www.census.gov/library/stories/2023/05/2020-census-united-states-older-population-grew.html (accessed on 2 May 2026).
  2. U.S. Census Bureau. Table S0101. Age and Sex [Data Set]. American Community Survey 1-Year Estimates. Available online: https://data.census.gov/table/ACSST1Y2024.S0101?g=010XX00US&y=2024 (accessed on 2 May 2026).
  3. Fakoya, O.A.; McCorry, N.K.; Donnelly, M. Loneliness and social isolation interventions for older adults: A scoping review of reviews. BMC Public Health 2020, 20, 129. [Google Scholar] [CrossRef]
  4. National Academies of Sciences, Engineering, and Medicine; Division of Behavioral and Social Sciences and Education; Health and Medicine Division; Board on Behavioral, Cognitive, and Sensory Sciences; Board on Health Sciences Policy; Committee on the Health and Medical Dimensions of Social Isolation and Loneliness in Older Adults. Social Isolation and Loneliness in Older Adults: Opportunities for the Health Care System; National Academies Press: Washington, DC, USA, 2020. [Google Scholar] [CrossRef]
  5. Valtorta, N.; Hanratty, B. Loneliness, isolation and the health of older adults: Do we need a new research agenda? J. R. Soc. Med. 2012, 105, 518–522. [Google Scholar] [CrossRef] [PubMed]
  6. Luo, M. Social isolation, loneliness, and depressive symptoms: A twelve-year population study of temporal dynamics. J. Gerontol. Ser. B 2023, 78, 280–290. [Google Scholar] [CrossRef]
  7. Holt-Lunstad, J.; Smith, T.B.; Baker, M.; Harris, T.; Stephenson, D. Loneliness and social isolation as risk factors for mortality: A meta-analytic review. Perspect. Psychol. Sci. 2015, 10, 227–237. [Google Scholar] [CrossRef] [PubMed]
  8. Valtorta, N.K.; Kanaan, M.; Gilbody, S.; Ronzi, S.; Hanratty, B. Loneliness and social isolation as risk factors for coronary heart disease and stroke: Systematic review and meta-analysis of longitudinal observational studies. Heart 2016, 102, 1009–1016. [Google Scholar] [CrossRef]
  9. Zhong, S.; Hahm, Y.; Chen, X. Environmental factors influencing intergenerational interactions in residential communities: A US nationwide survey of built environment experts. Habitat Int. 2025, 156, 103296. [Google Scholar] [CrossRef]
  10. Zhong, S.; Lee, C.; Lee, H. Community environments that promote intergenerational interactions vs. walking among older adults. Front. Public Health 2020, 8, 587363. [Google Scholar] [CrossRef]
  11. Nelischer, C.; Loukaitou-Sideris, A. Intergenerational public space design and policy: A review of the literature. J. Plan. Lit. 2023, 38, 19–32. [Google Scholar] [CrossRef]
  12. Ueangchokchai, C.; Limsangouan, N.; Merakate, J. The Results of the Intergenerational Relationship Program and Creation of New Meaning in the Thai Community Context: A Case Study of Ban Na, Nakhon Nayok Province. High. Educ. Stud. 2024, 14, 76–88. [Google Scholar] [CrossRef]
  13. Wu, B. Social isolation and loneliness among older adults in the context of COVID-19: A global challenge. Glob. Health Res. Policy 2020, 5, 27. [Google Scholar] [CrossRef]
  14. Femia, E.E.; Zarit, S.H.; Blair, C.; Jarrott, S.E.; Bruno, K. Intergenerational preschool experiences and the young child: Potential benefits to development. Early Child. Res. Q. 2008, 23, 272–287. [Google Scholar] [CrossRef]
  15. Gualano, M.R.; Voglino, G.; Bert, F.; Thomas, R.; Camussi, E.; Siliquini, R. The impact of intergenerational programs on children and older adults: A review. Int. Psychogeriatr. 2018, 30, 451–468. [Google Scholar] [CrossRef]
  16. Machielse, A.; Duyndam, J. Strategies of socially isolated older adults: Mechanisms of emergence and persistence. J. Aging Stud. 2020, 53, 100852. [Google Scholar] [CrossRef] [PubMed]
  17. Zhong, S.; Lee, C.; Foster, M.J.; Bian, J. Intergenerational communities: A systematic literature review of intergenerational interactions and older adults’ health-related outcomes. Soc. Sci. Med. 2020, 264, 113374. [Google Scholar] [CrossRef]
  18. Cortellesi, G.; Kernan, M. Together old and young: How informal contact between young children and older people can lead to intergenerational solidarity. Stud. Paedagog. 2016, 21, 101–116. [Google Scholar] [CrossRef]
  19. Fu, B.; Meng, X.; Zhang, Y. An Intergenerational Solidarity Approach to Community Public Space in China. In Practice and Progress in Social Design and Sustainability; IGI Global: Hershey, PA, USA, 2019; pp. 70–93. [Google Scholar]
  20. O’Connor, J.P.; Alfrey, L.; Hall, C.; Burke, G. Intergenerational understandings of personal, social and community assets for health. Health Place 2019, 57, 218–227. [Google Scholar] [CrossRef]
  21. Mobily, K.E.; Rubenstein, L.M.; Lemke, J.H.; O’Hara, M.W.; Wallace, R.B. Walking and depression in a cohort of older adults: The Iowa 65+ Rural Health Study. J. Aging Phys. Act. 1996, 4, 119–135. [Google Scholar] [CrossRef]
  22. Ory, M.G.; Towne, S.D., Jr.; Won, J.; Forjuoh, S.N.; Lee, C. Social and environmental predictors of walking among older adults. BMC Geriatr. 2016, 16, 155. [Google Scholar] [CrossRef] [PubMed]
  23. Hakim, A.A.; Petrovitch, H.; Burchfiel, C.M.; Ross, G.W.; Rodriguez, B.L.; White, L.R.; Yano, K.; Curb, J.D.; Abbott, R.D. Effects of walking on mortality among nonsmoking retired men. N. Engl. J. Med. 1998, 338, 94–99. [Google Scholar] [CrossRef]
  24. Ungvari, Z.; Fazekas-Pongor, V.; Csiszar, A.; Kunutsor, S.K. The multifaceted benefits of walking for healthy aging: From Blue Zones to molecular mechanisms. Geroscience 2023, 45, 3211–3239. [Google Scholar] [CrossRef]
  25. Glover, T.D.; Todd, J.; Moyer, L. Neighborhood walking and social connectedness. Front. Sports Act. Living 2022, 4, 825224. [Google Scholar] [CrossRef] [PubMed]
  26. Irvine, K.N.; Fisher, D.; Marselle, M.R.; Currie, M.; Colley, K.; Warber, S.L. Social isolation in older adults: A qualitative study on the social dimensions of group outdoor health walks. Int. J. Environ. Res. Public Health 2022, 19, 5353. [Google Scholar] [CrossRef]
  27. Kuang, K.; Huisingh-Scheetz, M.; Miller, M.J.; Waite, L.; Kotwal, A.A. The association of gait speed and self-reported difficulty walking with social isolation: A nationally-representative study. J. Am. Geriatr. Soc. 2023, 71, 2549–2556. [Google Scholar] [CrossRef] [PubMed]
  28. Saelens, B.E.; Handy, S.L. Built Environment Correlates of Walking: A Review. Med. Sci. Sports Exerc. 2008, 40, S550–S566. [Google Scholar] [CrossRef] [PubMed]
  29. Sallis, J.F.; Floyd, M.F.; Rodriguez, D.A.; Saelens, B.E. Role of Built Environments in Physical Activity, Obesity, and Cardiovascular Disease. Circulation 2012, 125, 729–737. [Google Scholar] [CrossRef]
  30. Wahl, H.-W.; Iwarsson, S.; Oswald, F. Aging well and the environment: Toward an integrative model and research agenda for the future. Gerontologist 2012, 52, 306–316. [Google Scholar] [CrossRef]
  31. Glass, T.A.; Balfour, J.L. Neighborhoods, Aging, and Functional Limitations. In Neighborhoods and Health, 1st ed.; Kawachi, I., Berkman, L.F., Eds.; Oxford University Press: New York, NY, USA, 2003. [Google Scholar]
  32. Riley, M.W.; Riley, J.W., Jr. Age integration: Conceptual and historical background. Gerontologist 2000, 40, 266–270. [Google Scholar] [CrossRef]
  33. Park, K.; Lee, J.; Shin, Y. Park Morphology and Urban Structure for Active Living: A Suburban Case from Seongnam City. Front. Public Health 2026, 14, 1744227. [Google Scholar] [CrossRef]
  34. Gao, C.; Yu, J.; Zhao, X.; Wang, H.; Liu, Z.; Gu, Y. The effect of built environment on older people leisure-time walking and physical activity in different sex groups in the City of Ningbo, China. Sustainability 2022, 14, 6562. [Google Scholar] [CrossRef]
  35. Calise, T.V.; Dumith, S.C.; DeJong, W.; Kohl, H.W. The effect of a neighborhood built environment on physical activity behaviors. J. Phys. Act. Health 2012, 9, 1089–1097. [Google Scholar] [CrossRef]
  36. Panter, J.; Guell, C.; Humphreys, D.; Ogilvie, D. Title: Can changing the physical environment promote walking and cycling? A systematic review of what works and how. Health Place 2019, 58, 102161. [Google Scholar] [CrossRef]
  37. Washington, T.L.; Flanders Cushing, D.; Mackenzie, J.; Buys, L.; Trost, S. Fostering social sustainability through intergenerational engagement in Australian neighborhood parks. Sustainability 2019, 11, 4435. [Google Scholar] [CrossRef]
  38. Li, Z.; Li, Z.; Ma, J. Exploring Design Interventions to Enhance Intergenerational Sharing: An Importance–Performance Analysis of Public Spaces in Changsha, China. Sustainability 2024, 16, 11228. [Google Scholar] [CrossRef]
  39. Schmidt, T.; Kerr, J.; Schipperijn, J. Associations between neighborhood open space features and walking and social interaction in older adults—A mixed methods study. Geriatrics 2019, 4, 41. [Google Scholar] [CrossRef] [PubMed]
  40. Lee, S. Perceived neighborhood environment associated with older adults’ walking and positive affect: Results from the Health and Retirement Study. J. Aging Phys. Act. 2020, 29, 536–543. [Google Scholar] [CrossRef]
  41. Yu, C.-Y.; Wang, B. Influence of neighborhood walkability on older adults’ walking behavior, health, and social connections in third places. Findings 2024. [Google Scholar] [CrossRef]
  42. Zhong, S.; Curran, L.; Yang, H.; Hahm, Y.; Lee, C. Understanding Intergenerational Interactions Between Older Adults and Children: Expert Opinions About the Roles of Community Environments. J. Appl. Gerontol. 2026, 45, 686–697. [Google Scholar] [CrossRef]
  43. Caplan, Z.; Rabe, M. The Older Population: 2020; C2020BR-07; U.S. Census Bureau: Washington, DC, USA, 2023.
  44. Sun City Texas Community, A. Clubs & Groups. Available online: https://www.sctexas.org/club/scripts/public/public.asp?GRP=25637&NS=PUBLIC (accessed on 2 May 2026).
  45. 55 Places. Exploring Del Webb Communities in Texas. Available online: https://www.55places.com/blog/exploring-del-webb-communities-in-texas (accessed on 2 May 2026).
  46. Austin Area Sustainability Indicators. Austin Area. Available online: https://a2si.lbj.utexas.edu/austin-area/ (accessed on 2 May 2026).
  47. Craig, C.L.; Marshall, A.L.; Sjöström, M.; Bauman, A.E.; Booth, M.L.; Ainsworth, B.E.; Pratt, M.; Ekelund, U.; Yngve, A.; Sallis, J.F. International physical activity questionnaire: 12-country reliability and validity. Med. Sci. Sports Exerc. 2003, 35, 1381–1395. [Google Scholar] [CrossRef]
  48. Cerin, E.; Saelens, B.E.; Sallis, J.F.; Frank, L.D. Neighborhood Environment Walkability Scale: Validity and development of a short form. Med. Sci. Sports Exerc. 2006, 38, 1682. [Google Scholar] [CrossRef] [PubMed]
  49. Saelens, B.E.; Sallis, J.F. Neighborhood Environment Walkability Survey (NEWS) & Neighborhood Environment Walkability Survey–Abbreviated (NEWS-A); Active Living Research: San Diego, CA, USA, 2002; Available online: https://activelivingresearch.org/neighborhood-environment-walkability-survey-news-neighborhood-environment-walkability-survey-%E2%80%93 (accessed on 2 May 2026).
  50. Zhong, S.; Lee, C. Developing the Intergenerational Community Survey for older adults: Assessing neighborhood environments, social and physical activities, and health. Health Place 2022, 77, 102901. [Google Scholar] [CrossRef]
  51. Forsyth, A.; Schmitz, K.; Oakes, M. Twin Cities Walking Survey; Active Living Research: San Diego, CA, USA, 2003; Available online: https://activelivingresearch.org/twin-cities-walking-survey (accessed on 2 May 2026).
  52. Forsyth, A.; Oakes, J.M.; Schmitz, K.H. Test–retest reliability of the twin cities walking survey. J. Phys. Act. Health 2009, 6, 119–131. [Google Scholar] [CrossRef]
  53. Frank, L.D.; Saelens, B.E.; Powell, K.E.; Chapman, J.E. Stepping towards causation: Do built environments or neighborhood and travel preferences explain physical activity, driving, and obesity? Soc. Sci. Med. 2007, 65, 1898–1914. [Google Scholar] [CrossRef]
  54. Cronbach, L.J. Coefficient Alpha and the Internal Structure of Tests. Psychometrika 1951, 16, 297–334. [Google Scholar] [CrossRef]
  55. George, D.; Mallery, P. SPSS for Windows Step by Step: A Simple Guide and Reference, 11.0 Update, 4th ed.; Allyn & Bacon: Boston, MA, USA, 2003. [Google Scholar]
  56. Behavioral Risk Factor Surveillance System. Behavioral Risk Factor Surveillance System Questionnaire. Available online: https://www.cdc.gov/brfss/questionnaires/ (accessed on 2 May 2026).
  57. U.S. Census Bureau. American Community Survey Questionnaire. Available online: https://www.census.gov/programs-surveys/acs/methodology/questionnaire-archive.2017.html (accessed on 2 May 2026).
  58. Hu, L.t.; Bentler, P.M. Cutoff criteria for fit indexes in covariance structure analysis: Conventional criteria versus new alternatives. Struct. Equ. Model. A Multidiscip. J. 1999, 6, 1–55. [Google Scholar] [CrossRef]
  59. Kaplan, M.; Sanchez, M.; Hoffman, J. Intergenerational Pathways to a Sustainable Society; Springer International Publishing AG: Cham, Switzerland, 2017. [Google Scholar] [CrossRef]
  60. Austin, P.C. An Introduction to Propensity Score Methods for Reducing the Effects of Confounding in Observational Studies. Multivar. Behav. Res. 2011, 46, 399–424. [Google Scholar] [CrossRef]
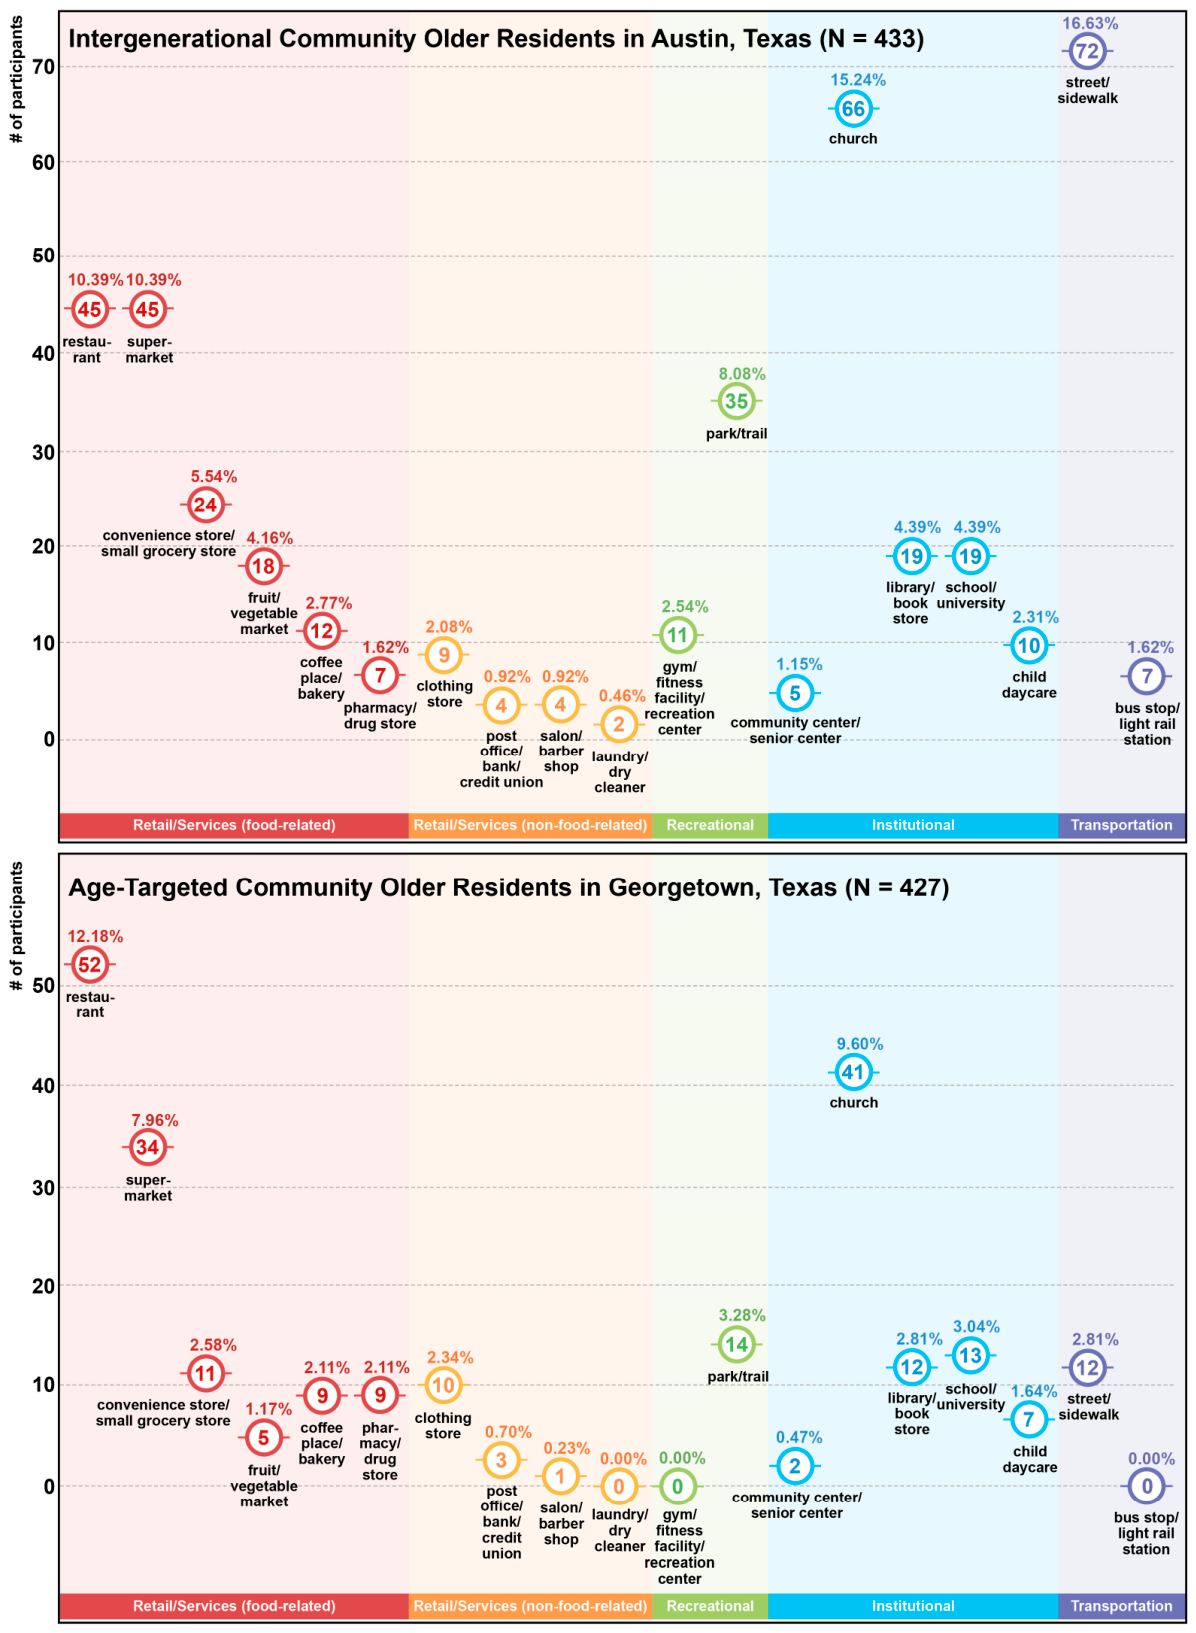
Figure 2. Places Supporting Intergenerational Interactions among Older Adults Living in Intergenerational vs. Age-Targeted Communities.
Sustainability 18 04997 g002
Figure 3. Benches, Recreational Walking, and Direct Intergenerational Interactions.
Sustainability 18 04997 g003
Table 1. Participant Characteristics.
Study VariablesIntergenerational Community Older Residents in Austin
(n = 436)
Age-Targeted Community Older Residents in Georgetown
(n = 435)
p-Value
Mean/Frequency (SD/%)
Min-Max
Mean/Frequency (SD/%)
Min-Max
Age73.02 (6.22)
65–95
73.49 (5.19)
65–91
0.225 1
Sex 0.006 2
Male119 (27.36%)156 (35.94%)
Female316 (72.64%)278 (64.06%)
Race and ethnicity <0.001 2
Non-Hispanic White317 (73.38%)397 (92.33%)
Others115 (26.62%)33 (7.67%)
Marital status <0.001 2
Married or unmarried couple203 (46.77%)346 (79.72%)
Others231 (53.23%)88 (20.28%)
Education 0.072 2
Bachelor’s degree or above292 (66.97%)315 (72.58%)
No bachelor’s degree144 (33.03%)119 (27.42%)
Households with dogs 0.276 2
Yes111 (25.64%)125 (28.94%)
No322 (74.36%)307 (71.06%)
Employment status <0.001 2
Employed80 (18.35%)33 (7.59%)
Not employed356 (81.65%)402 (92.41%)
Volunteer work 0.636 2
Yes267 (61.66%)275 (63.22%)
No166 (38.34%)160 (36.78%)
Income <0.001 2
Low income (below $20,000)57 (13.07%)7 (1.61%)
Lower-middle income ($20,000–$39,999)84 (19.27%)28 (6.44%)
Upper-middle income ($40,000–$79,999)120 (27.52%)123 (28.28%)
High income ($80,000 or more)97 (22.25%)165 (37.93%)
Don’t know/prefer not to answer/missing78 (17.89%)112 (25.75%)
General health conditions <0.001 2
Poor7 (1.62%)2 (0.46%)
Fair51 (11.83%)24 (5.53%)
Good149 (34.57%)108 (24.88%)
Very Good157 (36.43%)201 (46.31%)
Excellent67 (15.55%)99 (22.81%)
Heart attack or other heart disease 0.791 2
Yes49 (11.50%)47 (10.93%)
No377 (88.50%)383 (89.07%)
[Life event] Personal illness during the past three years 0.004 2
Yes181 (42.00%)139 (32.40%)
No250 (58.00%)290 (67.60%)
Difficulty in walking <0.001 2
Yes/don’t know/prefer not to answer99 (22.71%)43 (9.89%)
No337 (77.29%)392 (90.11%)
Transportation walking in a typical week 0.980 2
Yes187 (43.90%)190 (43.98%)
No239 (56.10%)242 (56.02%)
Recreational walking in a typical week 0.085 2
Yes313 (73.13%)340 (78.16%)
No115 (26.87%)95 (21.84%)
Social interactions with neighbors (factor scores)−0.36 (0.98)
−2.47–2.15
0.36 (0.88)
−2.47–2.15
<0.001 1
Residential self-selection on social support and cohesion (factor scores)−0.14 (1.09)
−2.31–2.72
0.14 (0.88)
−2.00–2.45
<0.001 1
Neighborhood livability <0.001 2
Strongly satisfied268 (61.47%)360 (82.76%)
Others168 (38.53%)75 (17.24%)
Benches on neighborhood sidewalks <0.001 2
Somewhat/strongly agree55 (12.61%)221 (50.80%)
Somewhat/strongly disagree381 (87.39%)214 (49.20%)
Attitude towards time spent in intergenerational interactions 0.163 2
Too much3 (0.72%)3 (0.72%)
About enough240 (57.28%)210 (50.72%)
Not enough176 (42.00%)201 (48.55%)
Direct intergenerational interactions in a typical week <0.001 2
Yes184 (42.40%)94 (21.66%)
No250 (57.60%)340 (78.34%)
Indirect intergenerational interactions in a typical week <0.001 2
Yes199 (46.06%)91 (21.26%)
No233 (53.94%)337 (78.74%)
Note: 1 t-test p-value; 2 Chi-square test p-value; SD = Standard Deviation. Some variables have smaller sample sizes due to their missing values. The names of the study variables are highlighted in bold.
Table 2. Predictors of Direct Intergenerational Interactions.
Study VariablesFull Sample Model
(N = 806)
Intergenerational Community
Subsample Model
(n = 395)
Age-Targeted Community
Subsample Model
(n = 411)
ORp-ValueORp-ValueORp-Value
Demographics
Age (65–95 years)1.0000.9911.0160.4260.9630.176
Gender (female vs. male)1.470 0.0581.4080.2161.3310.378
Race and ethnicity (non-Hispanic White vs. others)0.8300.4640.6480.1671.3030.612
Marital status (married or unmarried couple vs. others)0.9880.9530.7910.4021.3990.363
Education (Bachelor’s degree or above vs. no Bachelor’s degree)1.2610.2791.2860.4051.3250.399
Households with dogs (yes vs. no)1.427 0.0651.653 0.0611.3100.355
Employment status (employed vs. not employed)3.977 **0.0011.1330.6844.183 **0.002
Volunteer work (yes vs. no)1.852 **0.0012.081 **0.0051.999 *0.023
Income: Lower-middle income vs. low income0.440 *0.0360.427 0.0570.8570.886
Upper-middle income vs. low income0.506 0.0700.6310.3030.3380.258
High income vs. low income0.6100.2100.6170.3330.5630.542
Don’t know/prefer not to answer/missing vs. low income0.435 *0.0320.298 *0.0110.5260.500
Health
General health condition (5-point Likert scale: 1 = poor, 2 = fair, 3 = good, 4 = very good, 5 = excellent)1.0400.7250.9470.7061.2780.184
Heart attack or other heart disease (yes vs. no)0.6230.1250.6180.2170.5300.257
[Life event] Personal illness during the past three years (yes vs. no)0.651 *0.0260.574 *0.0280.6570.193
Walking
Transportation walking in a typical week (yes vs. no)1.377 0.0691.587 0.0571.2790.382
Recreational walking in a typical week (yes vs. no)1.867 **0.0061.812 *0.0462.501 *0.022
Neighborhood- and neighbor-related variables
Social interactions with neighbors (factor scores)1.301 **0.0081.364 *0.0161.2100.258
Residential self-selection on social support and cohesion (factor scores)1.560 ***<0.0011.270 *0.0422.346 ***<0.001
Neighborhood livability (strongly satisfied vs. others)1.718 *0.0132.160 **0.0040.9730.945
Community-type-related variables
Community type (intergenerational vs. age-targeted communities)5.186 ***<0.001
Community type and employment status interaction term (intergenerational community x employed)0.282 *0.016
McFadden’s Pseudo R20.167 0.150 0.170
Cragg-Uhler/Nagelkerke R20.263 0.248 0.252
Note: 0.05 ≤ p < 0.1, * 0.01 ≤ p < 0.05, ** 0.001 ≤ p < 0.01, *** p < 0.001. OR: Odds Ratio. Significant correlations (p < 0.05) are highlighted in bold. Marginally significant correlations (0.05 ≤ p < 0.1) are highlighted in italics. The domains of the study variables are underlined. Low income = below $20,000, lower-middle income = $20,000–$39,999, upper-middle income = $40,000–$79,999, and high income = $80,000 or more.
Disclaimer/Publisher’s Note: The statements, opinions and data contained in all publications are solely those of the individual author(s) and contributor(s) and not of MDPI and/or the editor(s). MDPI and/or the editor(s) disclaim responsibility for any injury to people or property resulting from any ideas, methods, instructions or products referred to in the content.