4.2. Heat Pump Operation in Hybrid System
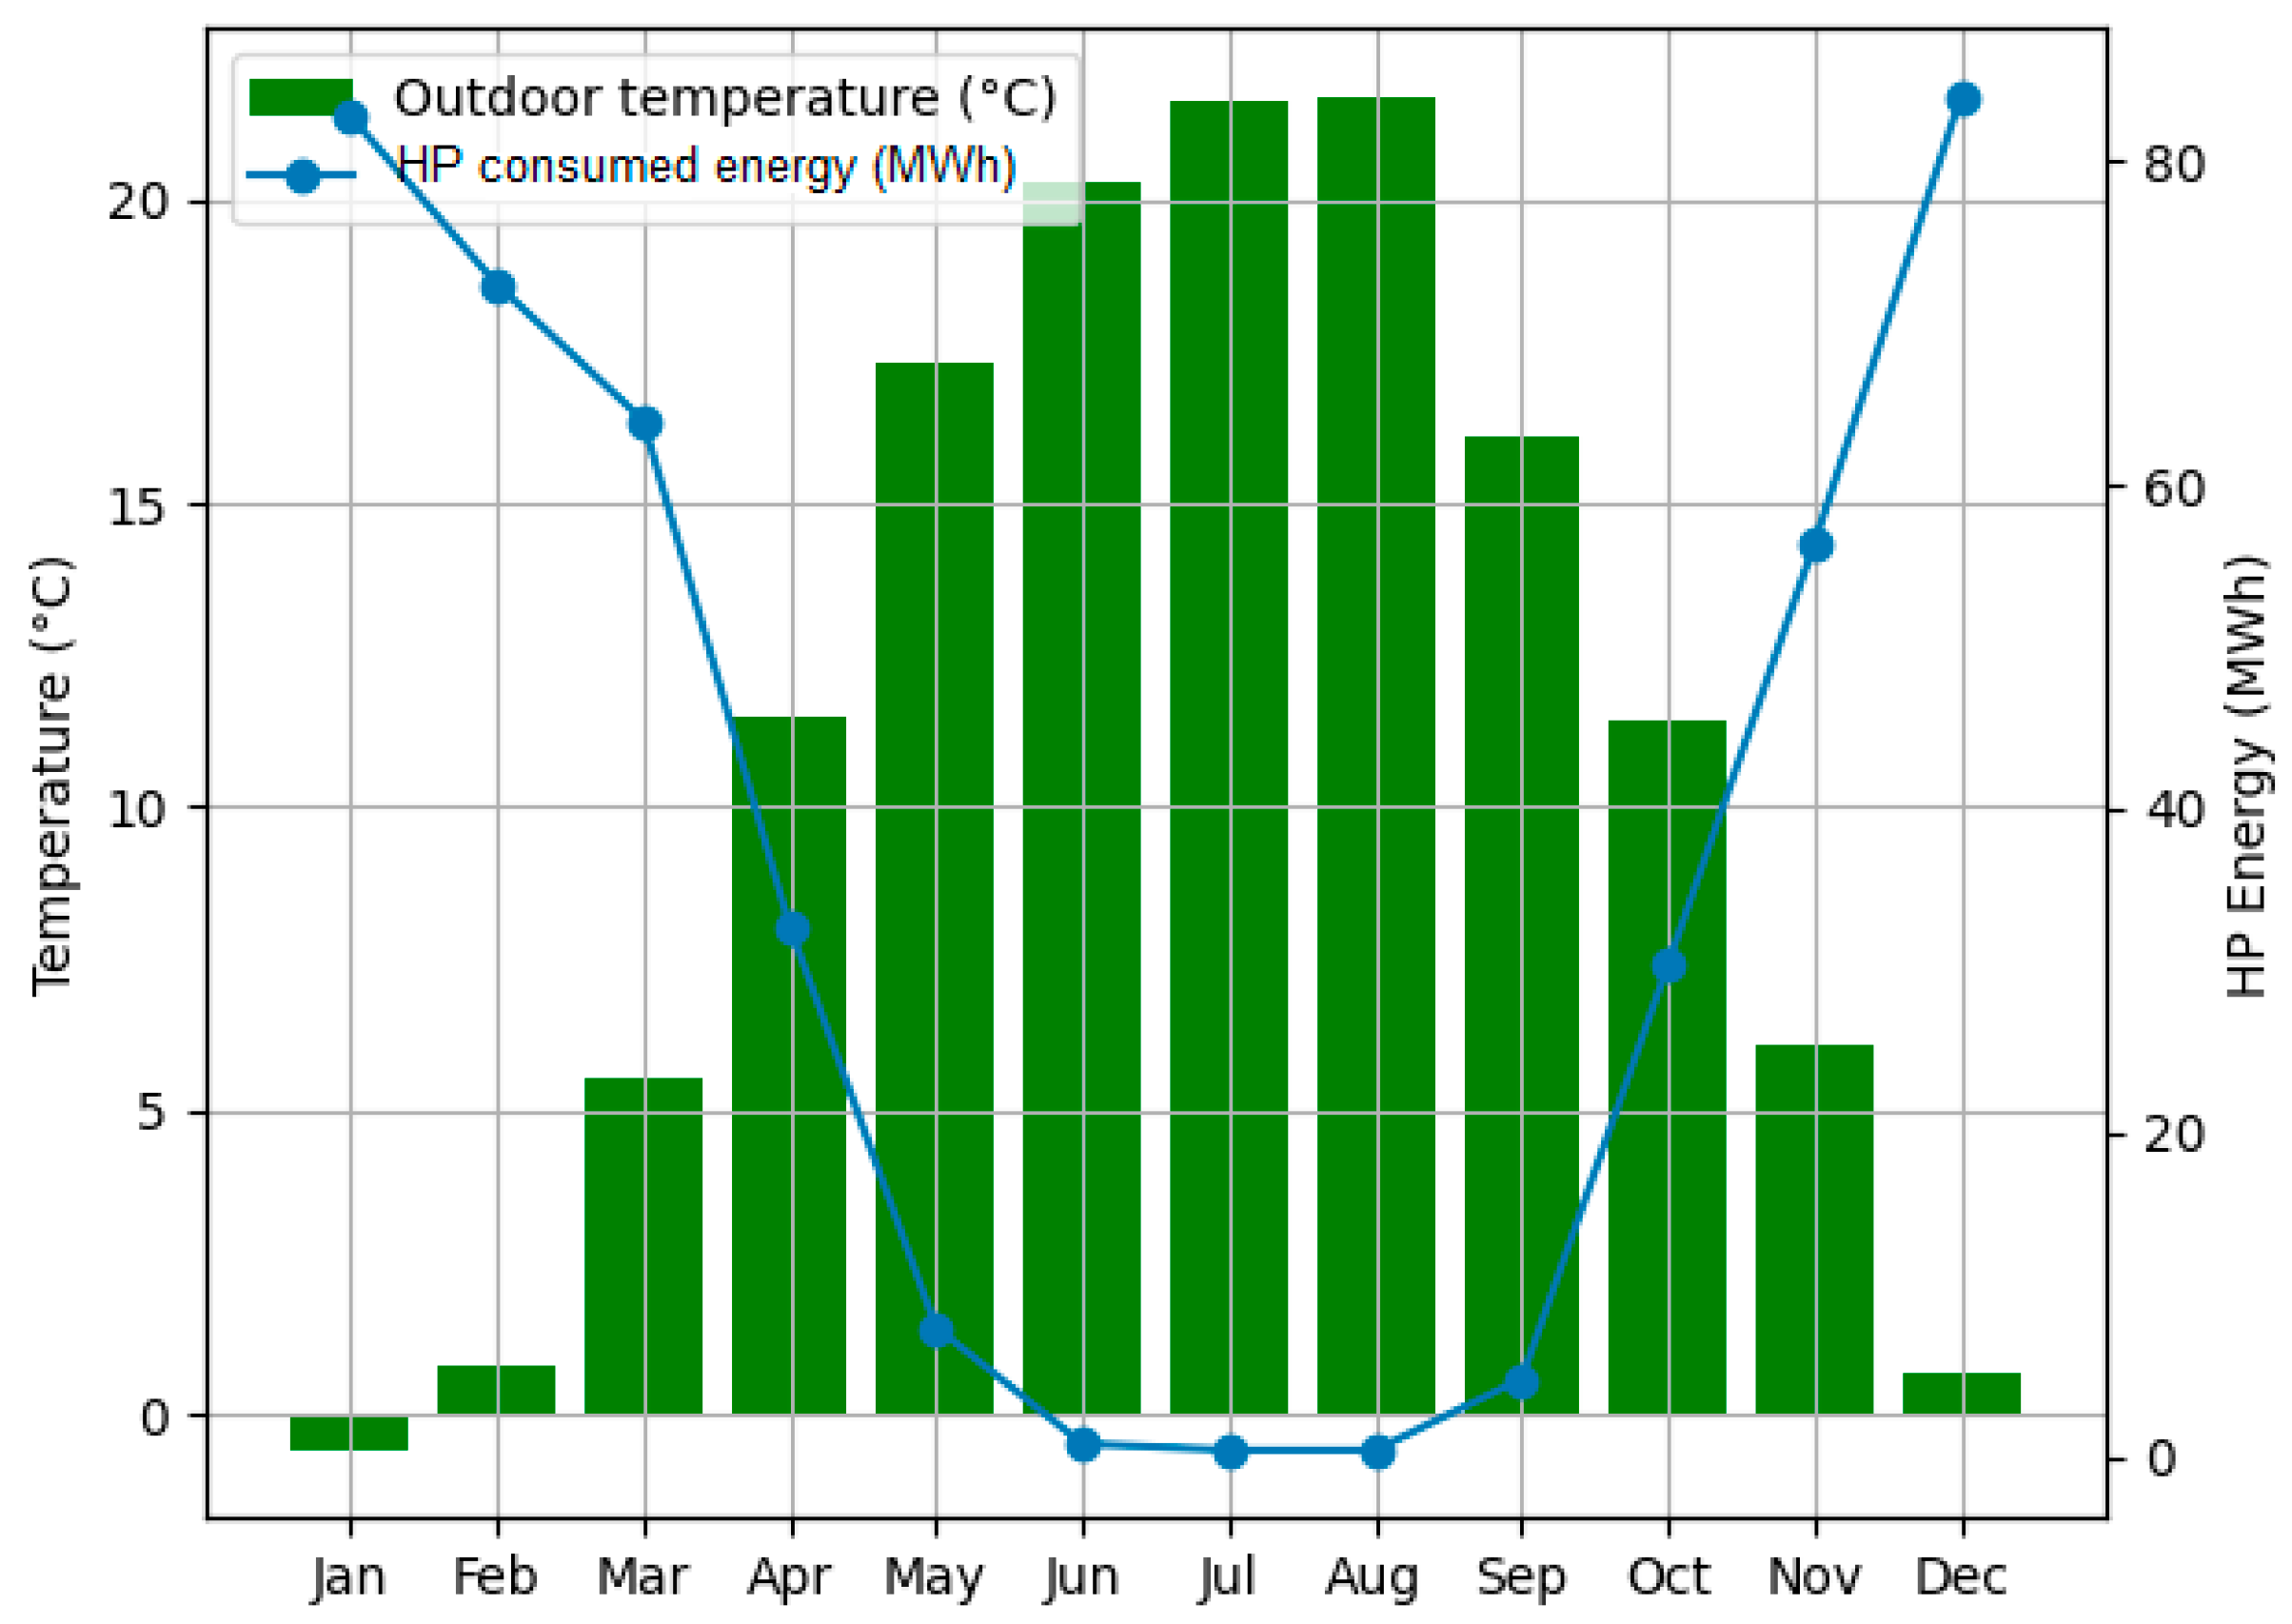
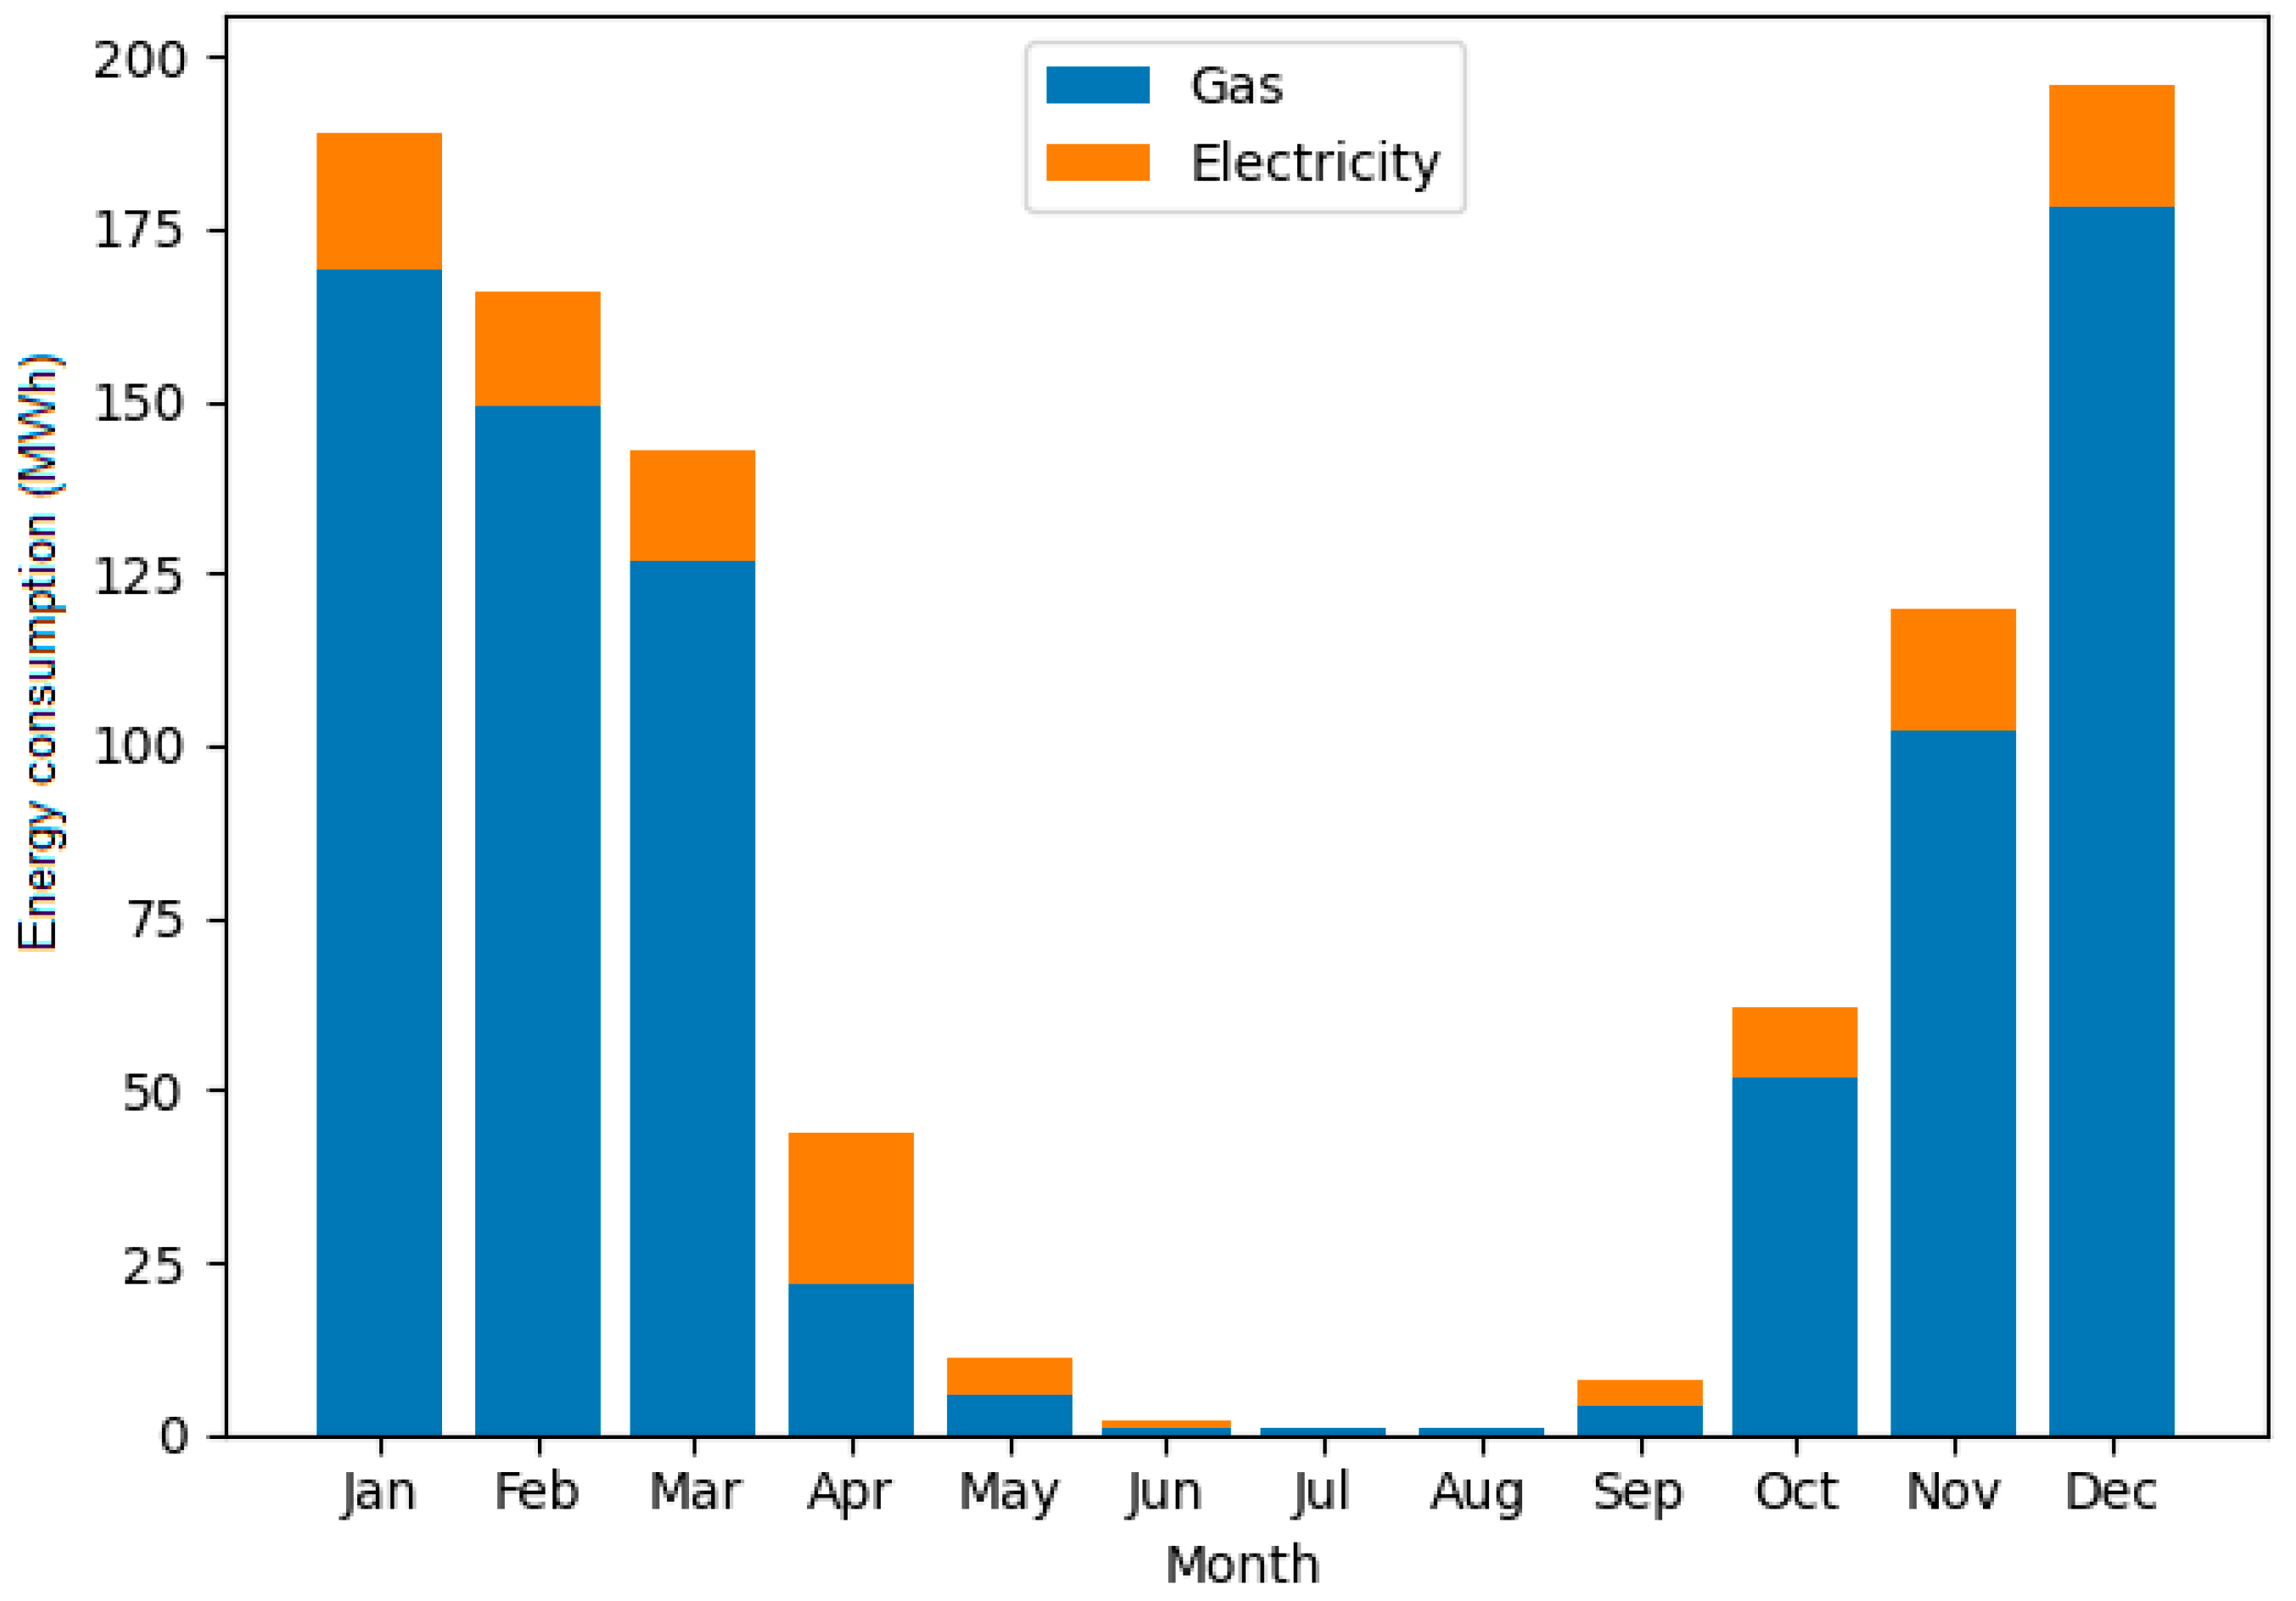
Figure 8 illustrates the relationship between the HP operation and the outdoor temperature. The green bars represent the monthly average outdoor temperature, while the blue line indicates the thermal energy provided by the HP.
The HP operates more intensively during periods with moderate outdoor temperatures, when its efficiency is higher. As outdoor temperature decreases, the HP’s contribution decreases, confirming its temperature-dependent performance.
This behaviour highlights the HP’s role as a complementary source within the hybrid system, operating preferentially under favourable climatic conditions.
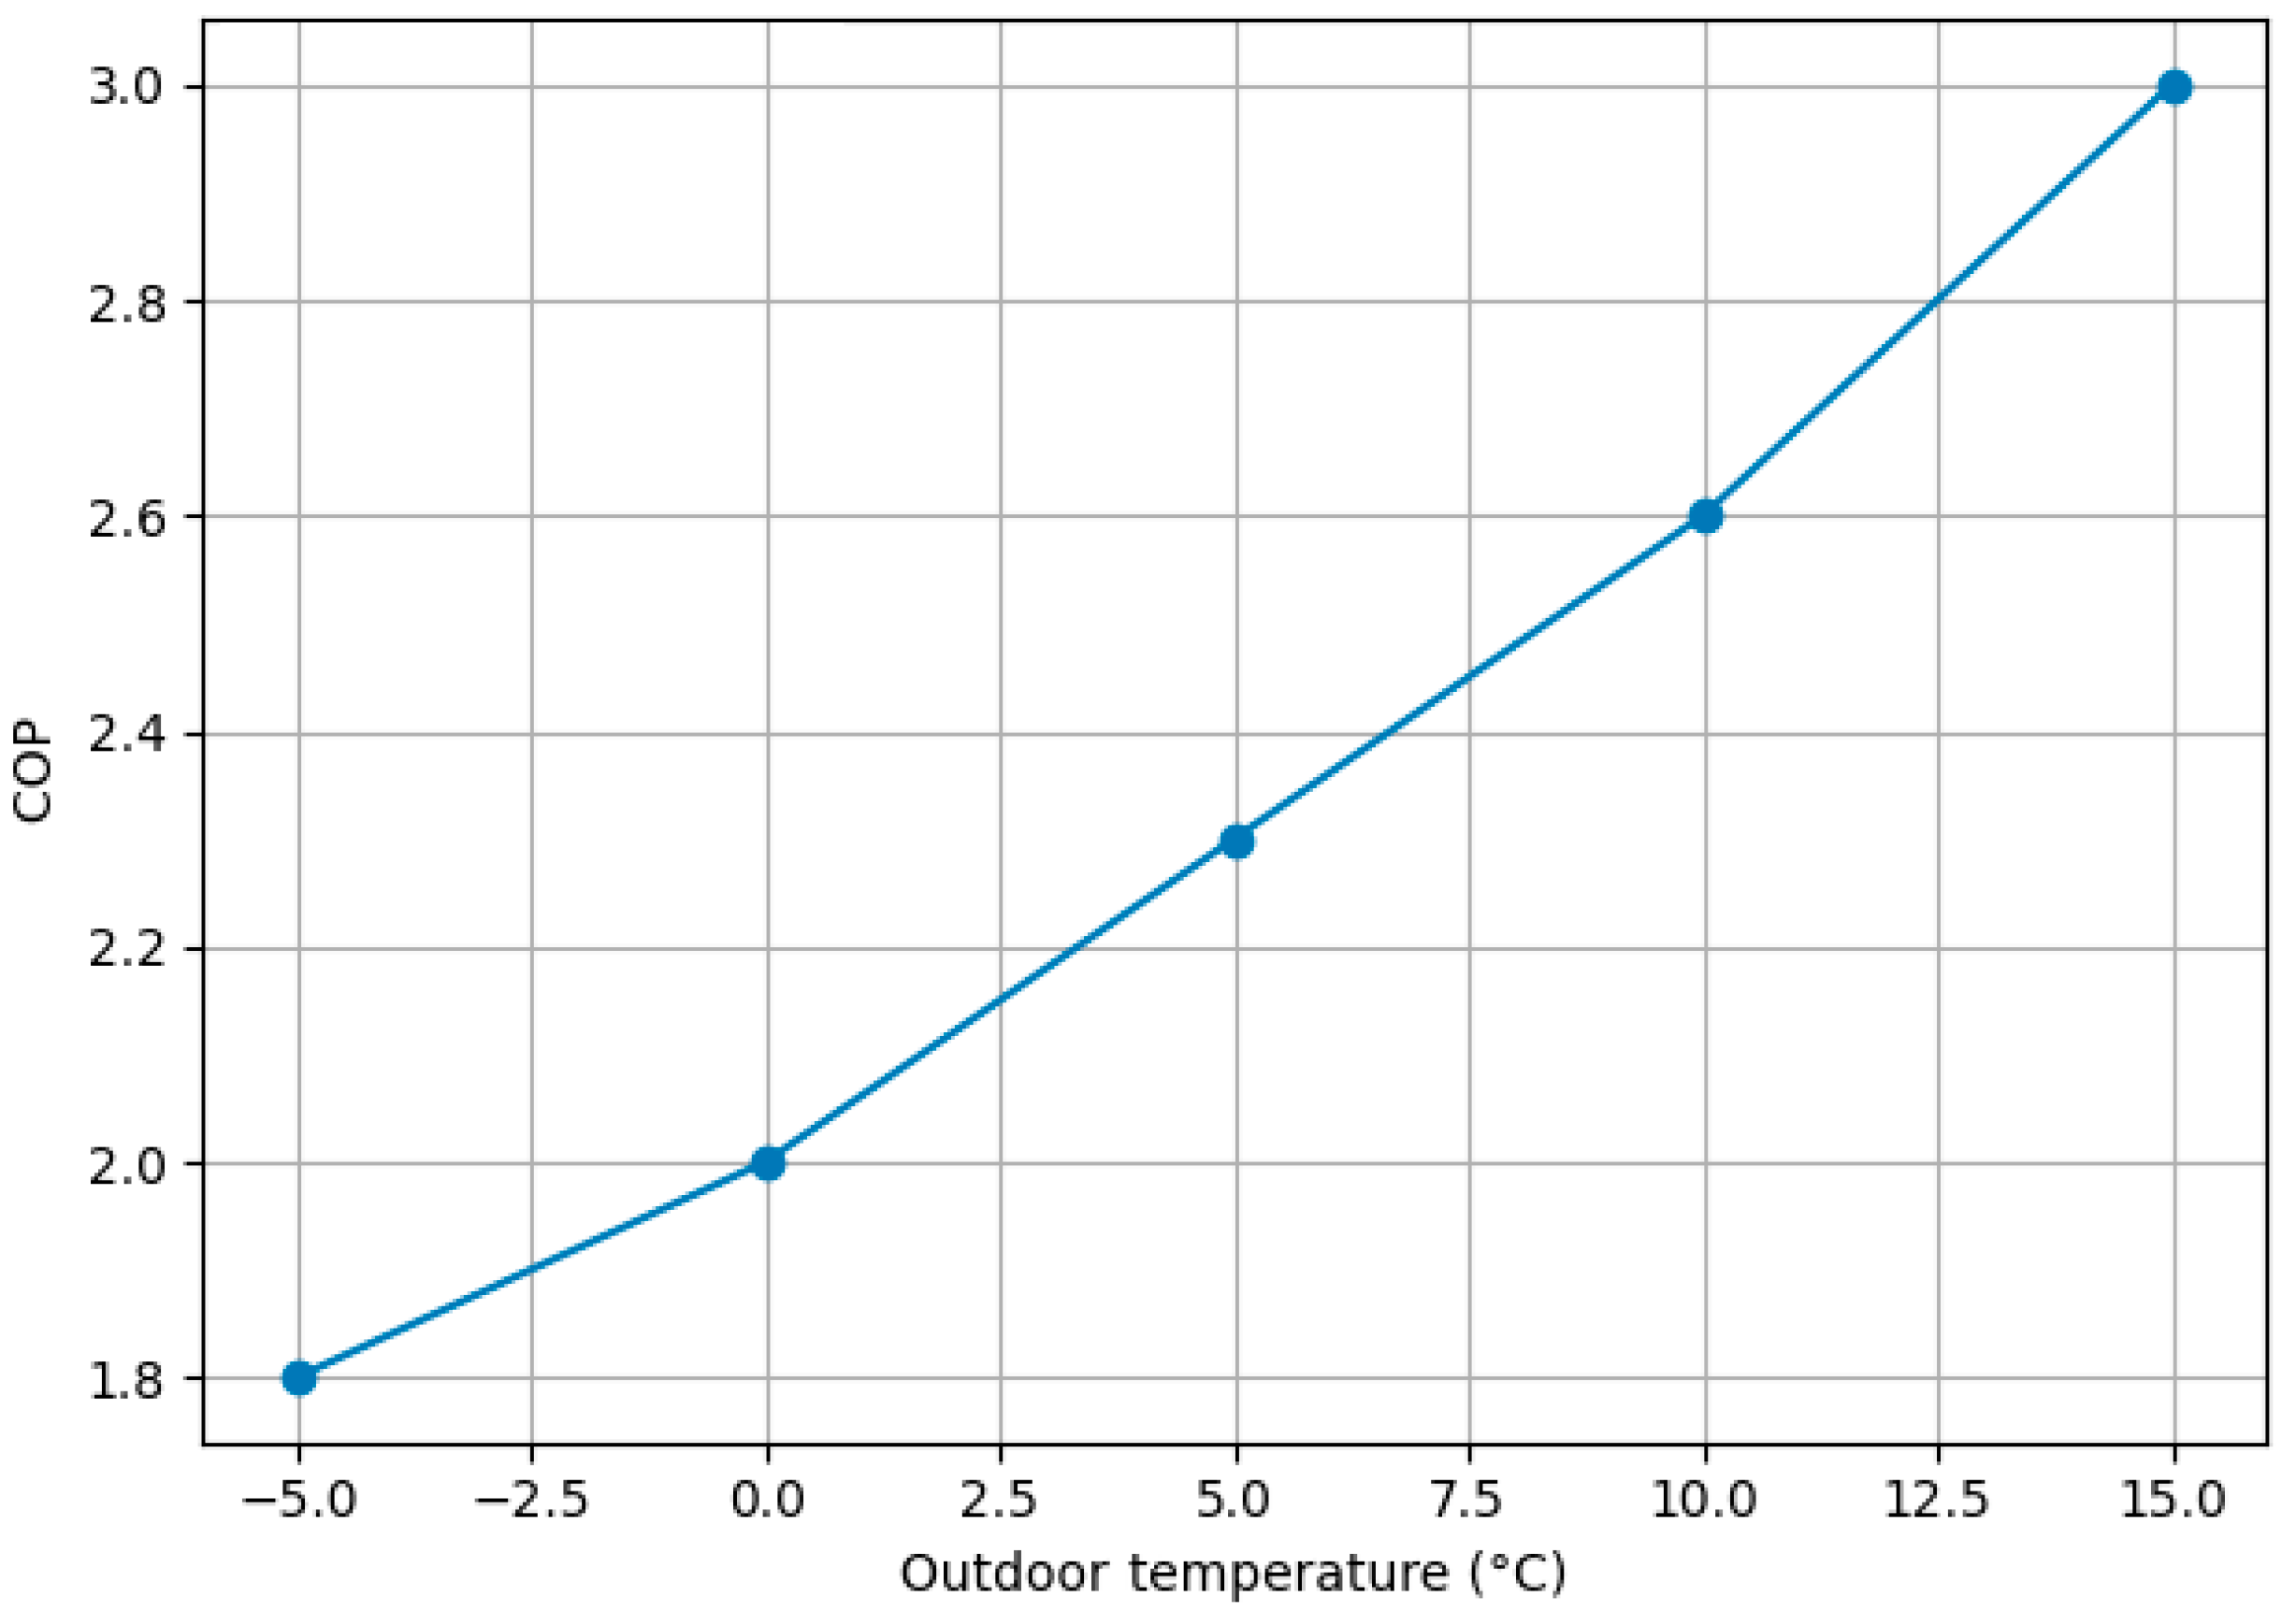
Figure 9 illustrates the variation in the HP’COP as a function of the outdoor temperature. The results show a clear increasing trend, with COP values rising from approximately 1.8 at low outdoor temperatures (−5 °C) to about 3.0 at higher temperatures (15 °C).
The temperatures of −5 °C and 15 °C were selected as representative boundary operating conditions corresponding to peak winter load and moderate seasonal conditions, respectively.
Table 6 summarises COP variation under representative operating conditions.
This behaviour reflects the thermodynamic characteristics of air-to-water HPs, which operate more efficiently under milder climatic conditions. As outdoor temperatures increase, the temperature lift required by the HP decreases, improving performance.
These results are consistent with the operational behaviour observed in the hybrid system, where the HP contributes more significantly during transitional periods.
The seasonal COP (SCOP) of the HP reaches approximately 3.6. This value represents the average seasonal performance obtained from annual dynamic simulation. It should be distinguished from the instantaneous COP values shown in
Figure 9, which correspond only to selected representative operating points between −5 °C and 15 °C.
The higher SCOP value is explained by weighted seasonal operation, including part-load conditions and additional operating periods outside the analysed temperature points, where the HP may operate at higher efficiency. Therefore, SCOP should not be directly compared with the maximum point COP, since they represent different performance indicators.
4.5. CO2 Emissions
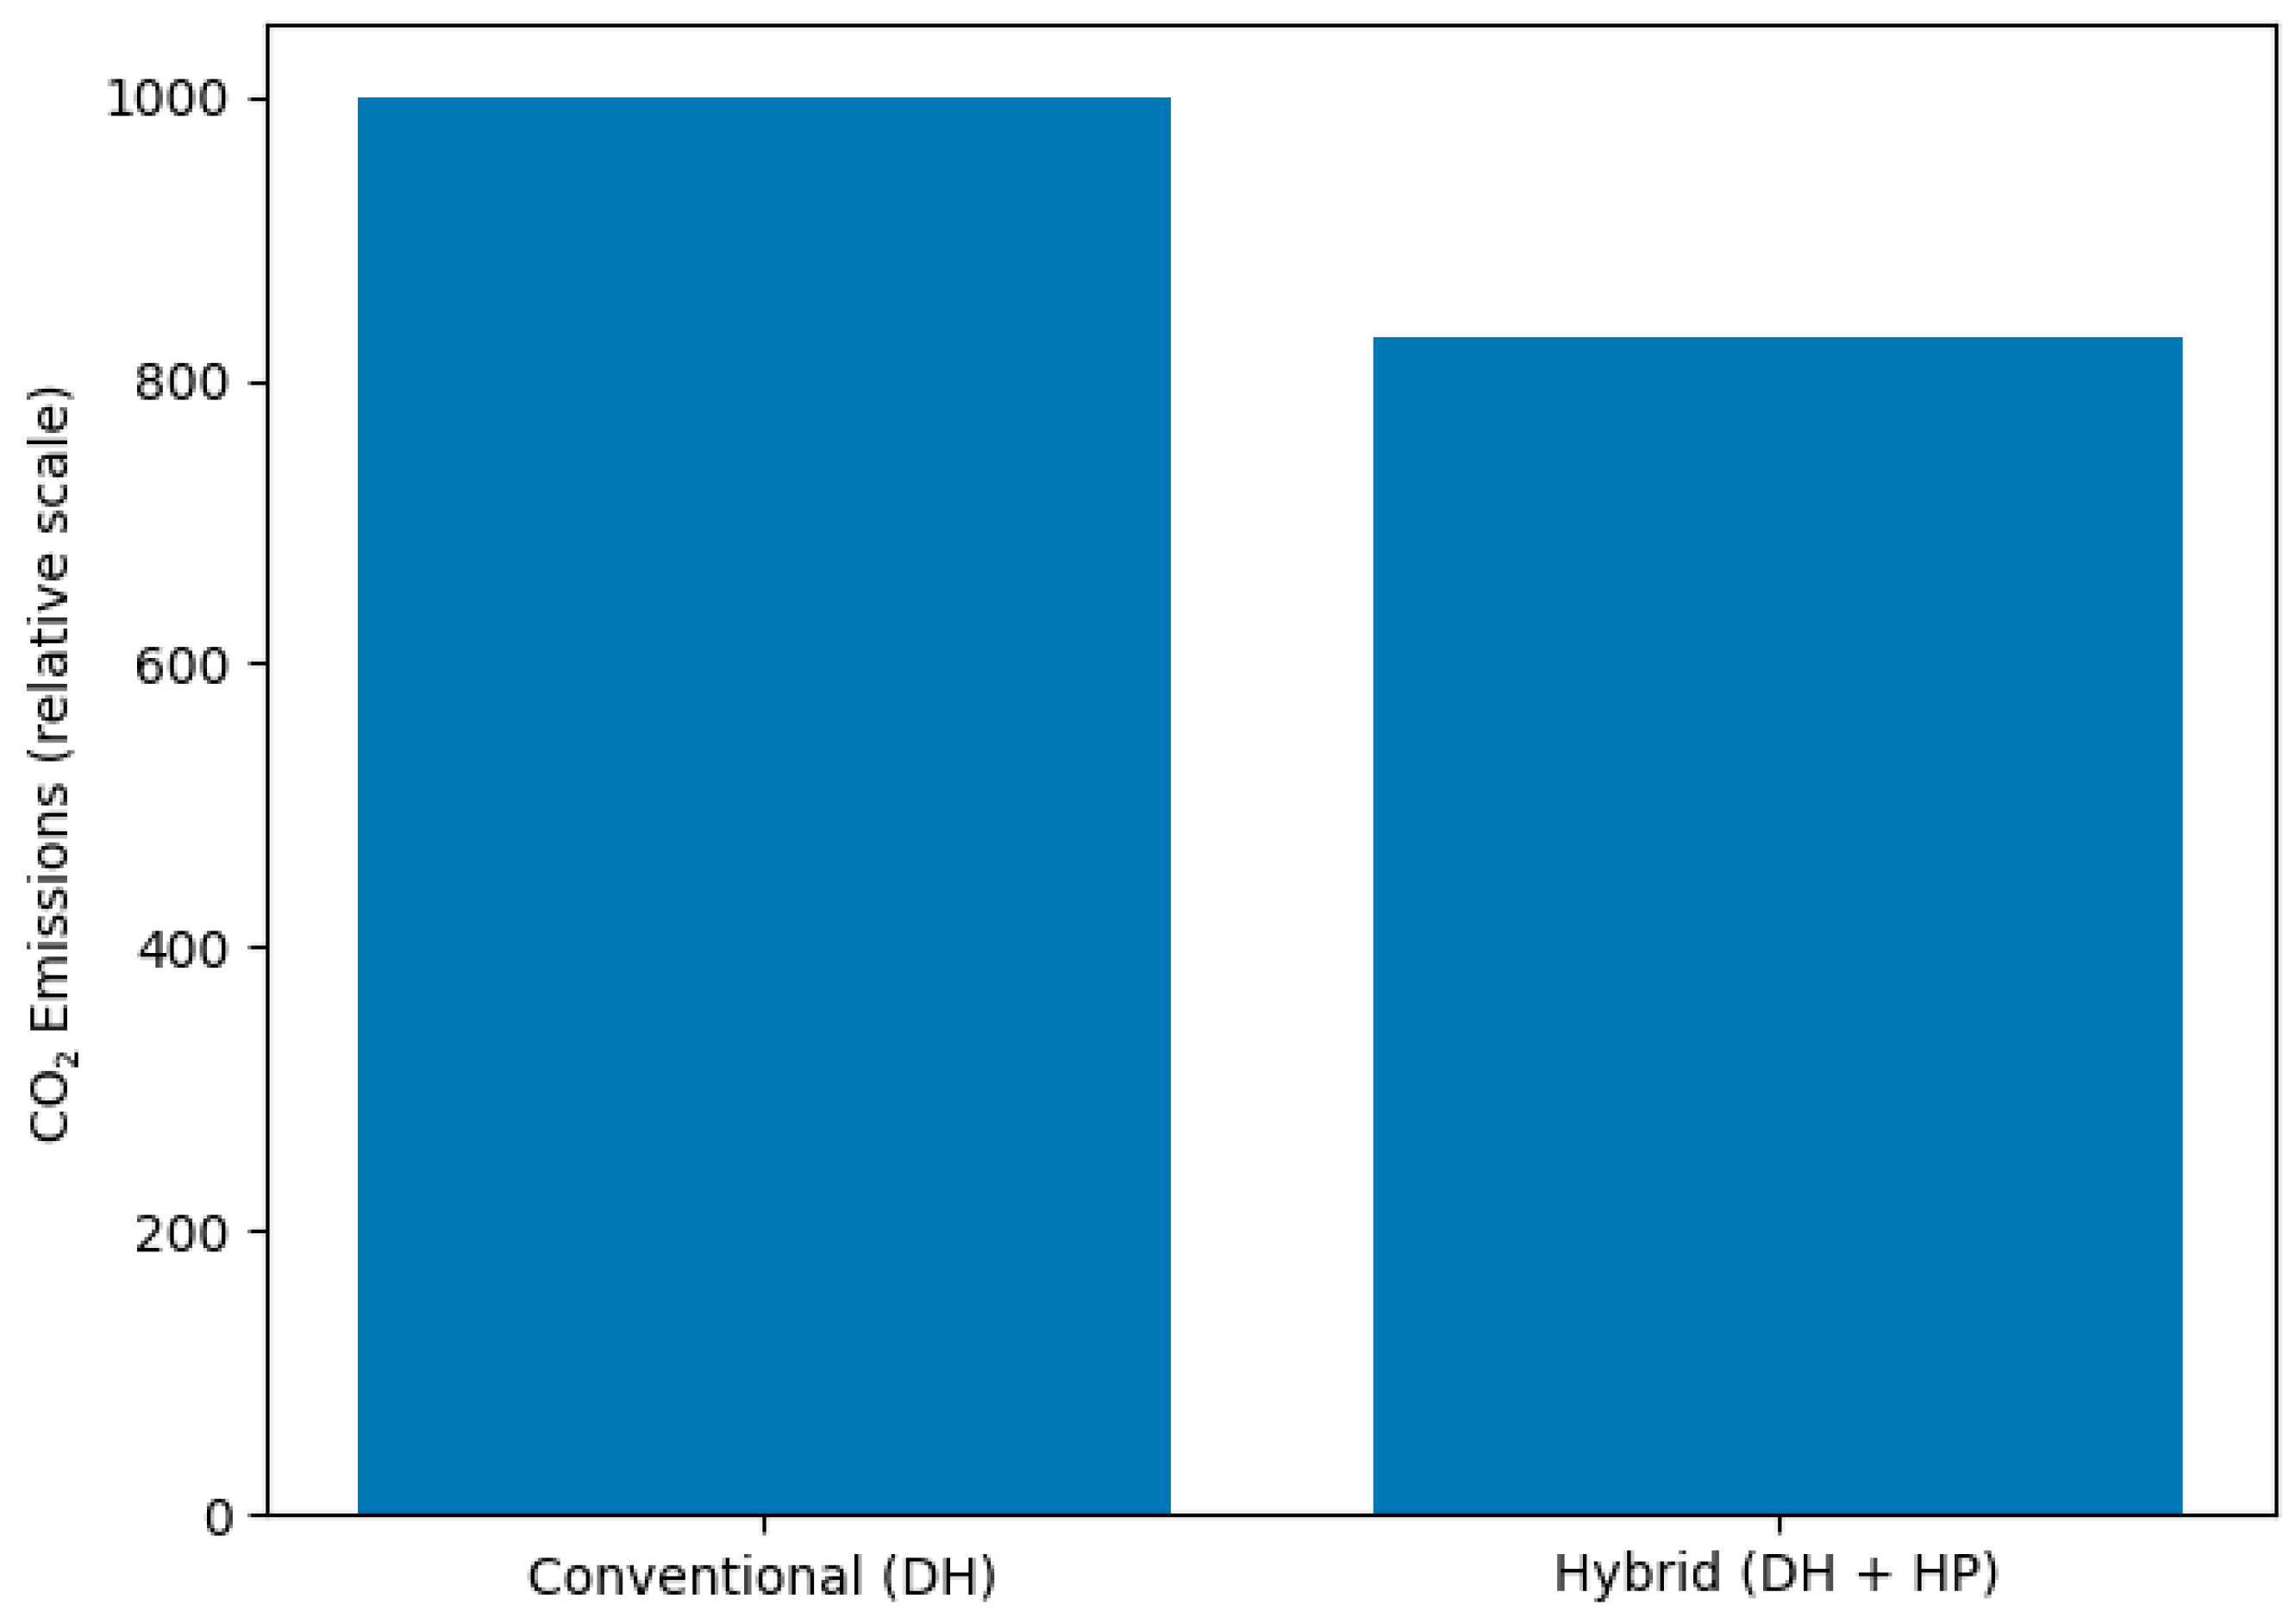
Figure 12 compares CO
2 emissions between the conventional DH system and the hybrid configuration.
CO
2 emissions were calculated separately for natural gas and electricity consumption using the corresponding emission factors presented in
Table 2. For the conventional scenario, emissions were determined based on natural gas consumption according to:
where
Egas is the annual natural gas consumption, and
ggas is the corresponding emission factor.
For the hybrid scenario, total emissions were calculated as the sum of emissions associated with natural gas and electricity use:
where
Eel represents the electricity consumption of the HP, and
gel is the electricity emission factor.
The comparison was performed consistently for both scenarios using the same system boundaries.
Using the adopted factors (ggas = 0.202 kg/kWh and gel = 0.400 kg/kWh), emissions decrease from approximately 220 t CO2/year in the conventional case to 191 t CO2/year in the hybrid configuration.
The results clearly indicate a significant reduction in emissions when the HP is integrated into the system. This reduction is primarily due to decreased natural gas consumption, partially replaced by electricity used to operate the HP. Despite increased electricity consumption, the overall carbon footprint is lower due to HP’s higher efficiency and the lower electricity emission factor.
These findings confirm that hybrid systems represent an effective solution for reducing GHG emissions while maintaining reliable system performance.
4.8. Energy and Environmental Performance Analysis
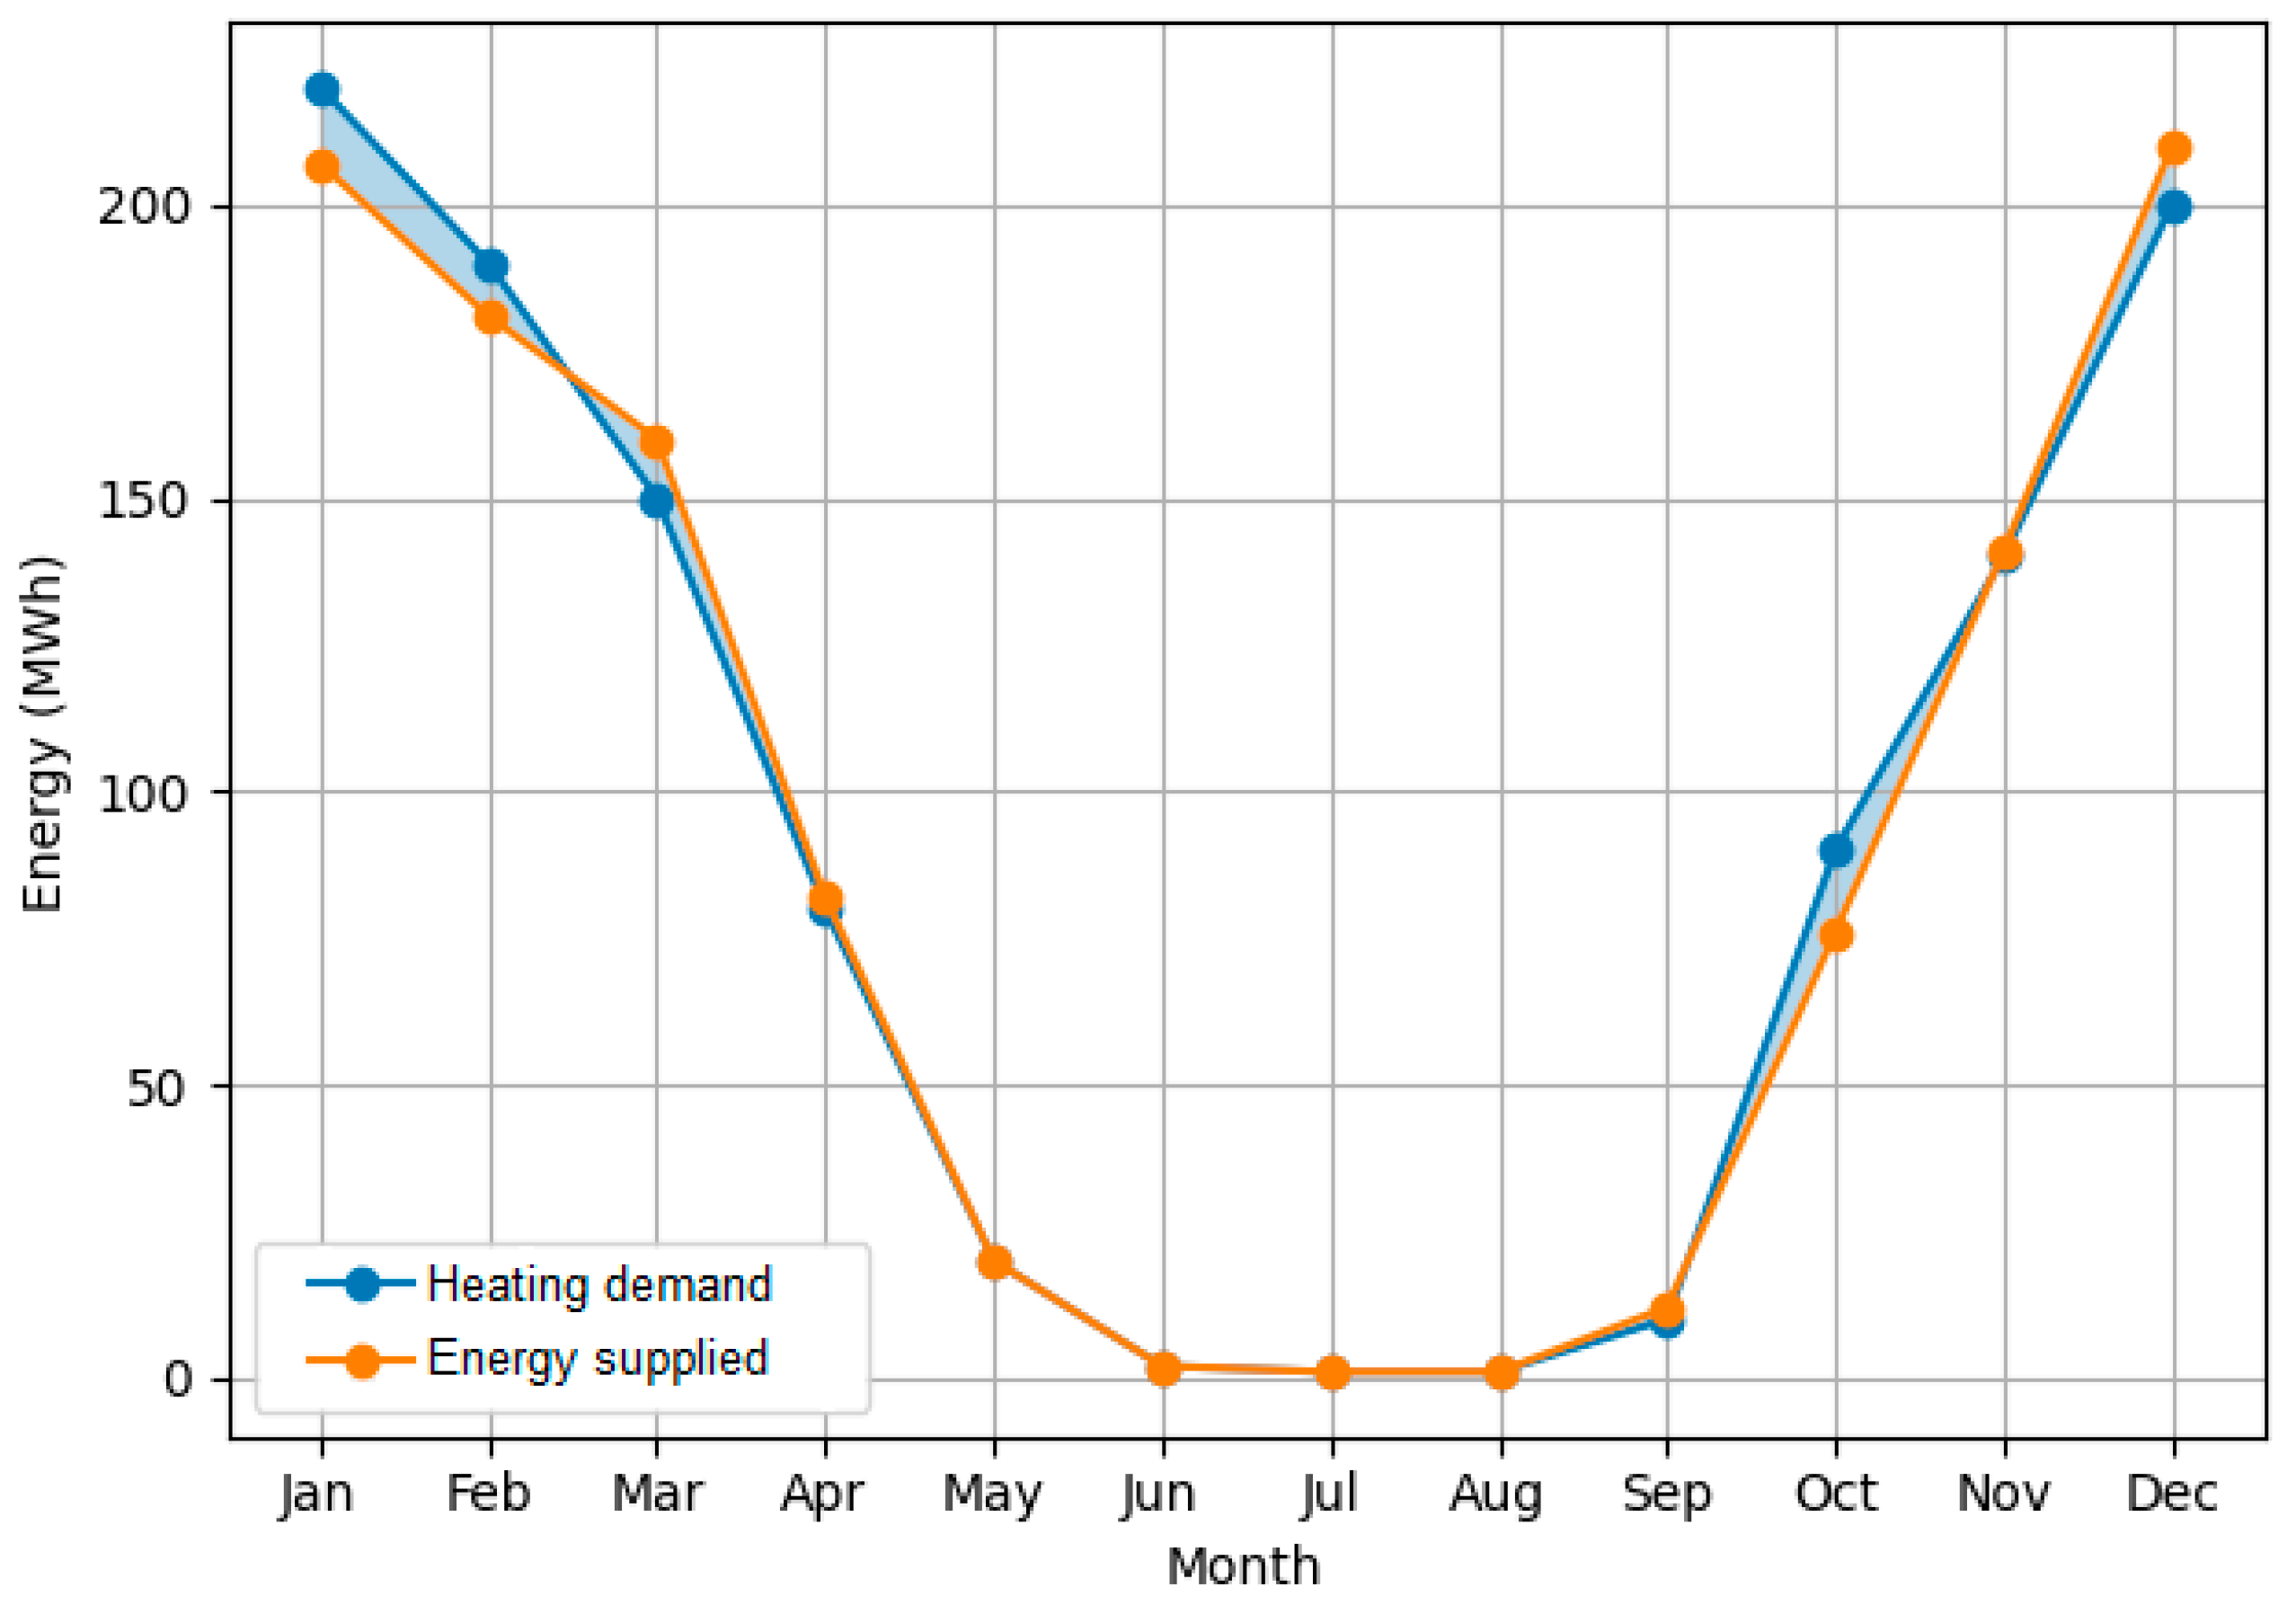
The simulation results demonstrate the operation of both the conventional DH system and the hybrid configuration under realistic climatic conditions, allowing a direct comparison of their energy and environmental performance.
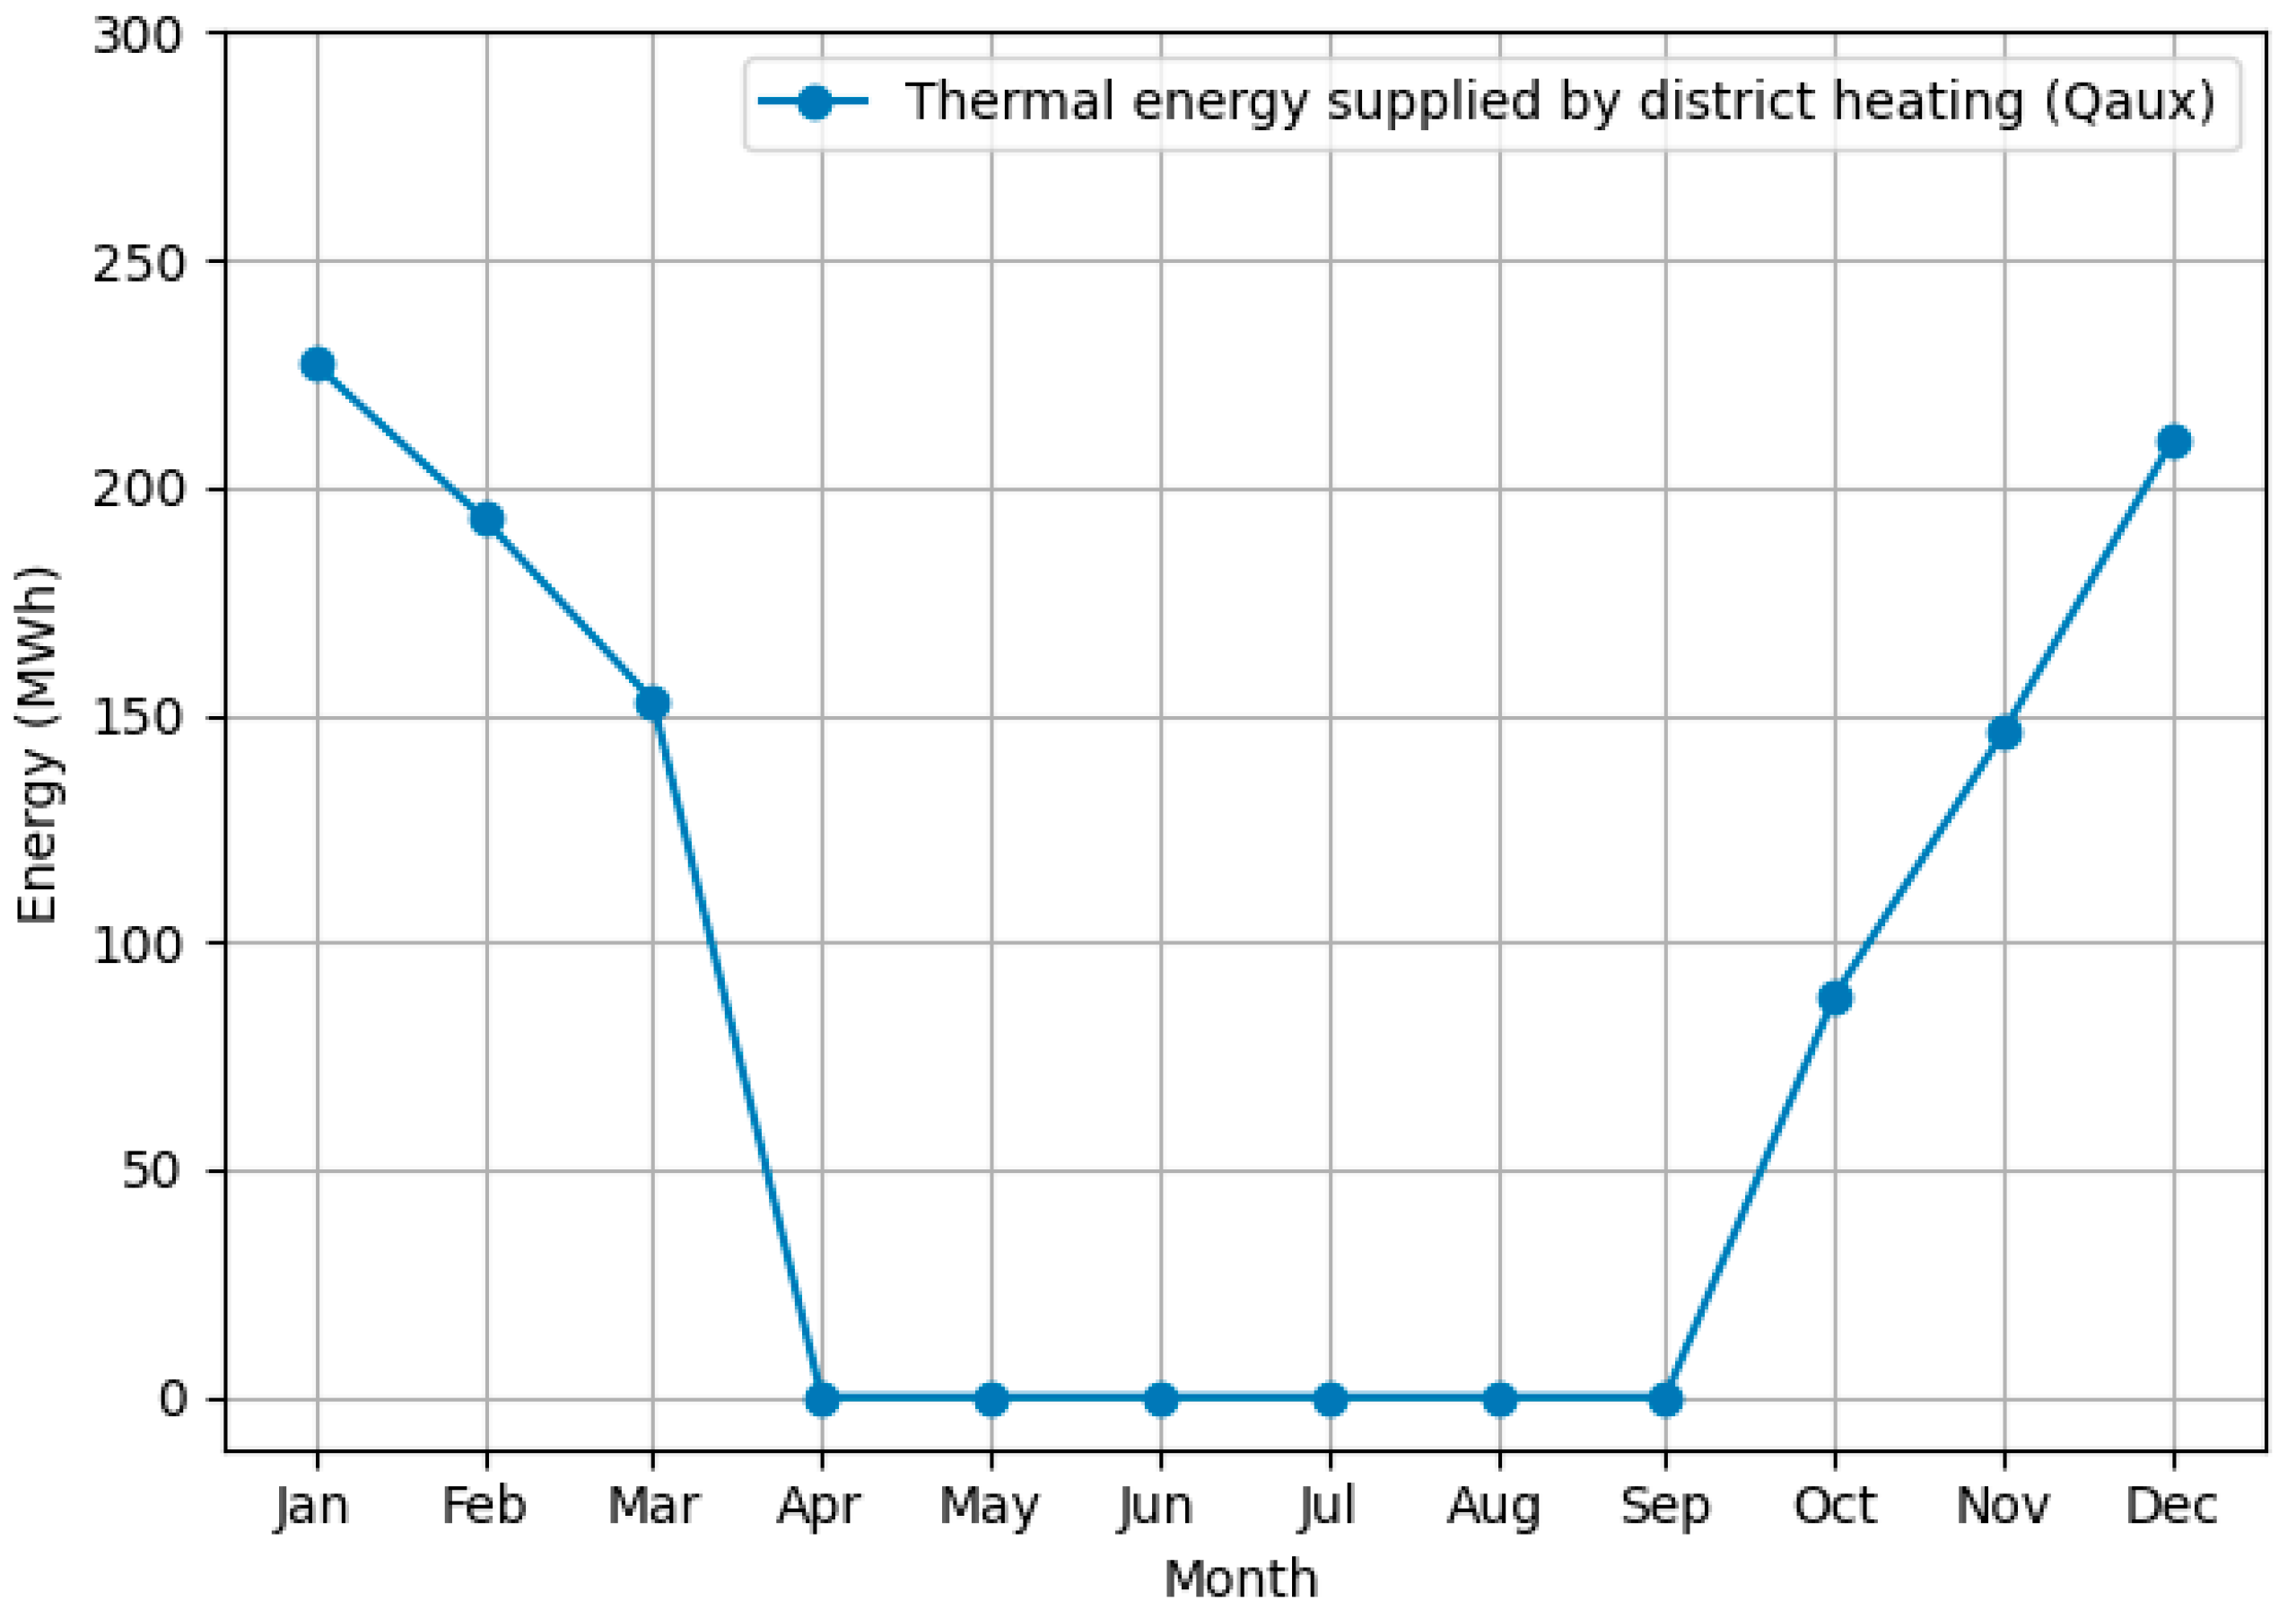
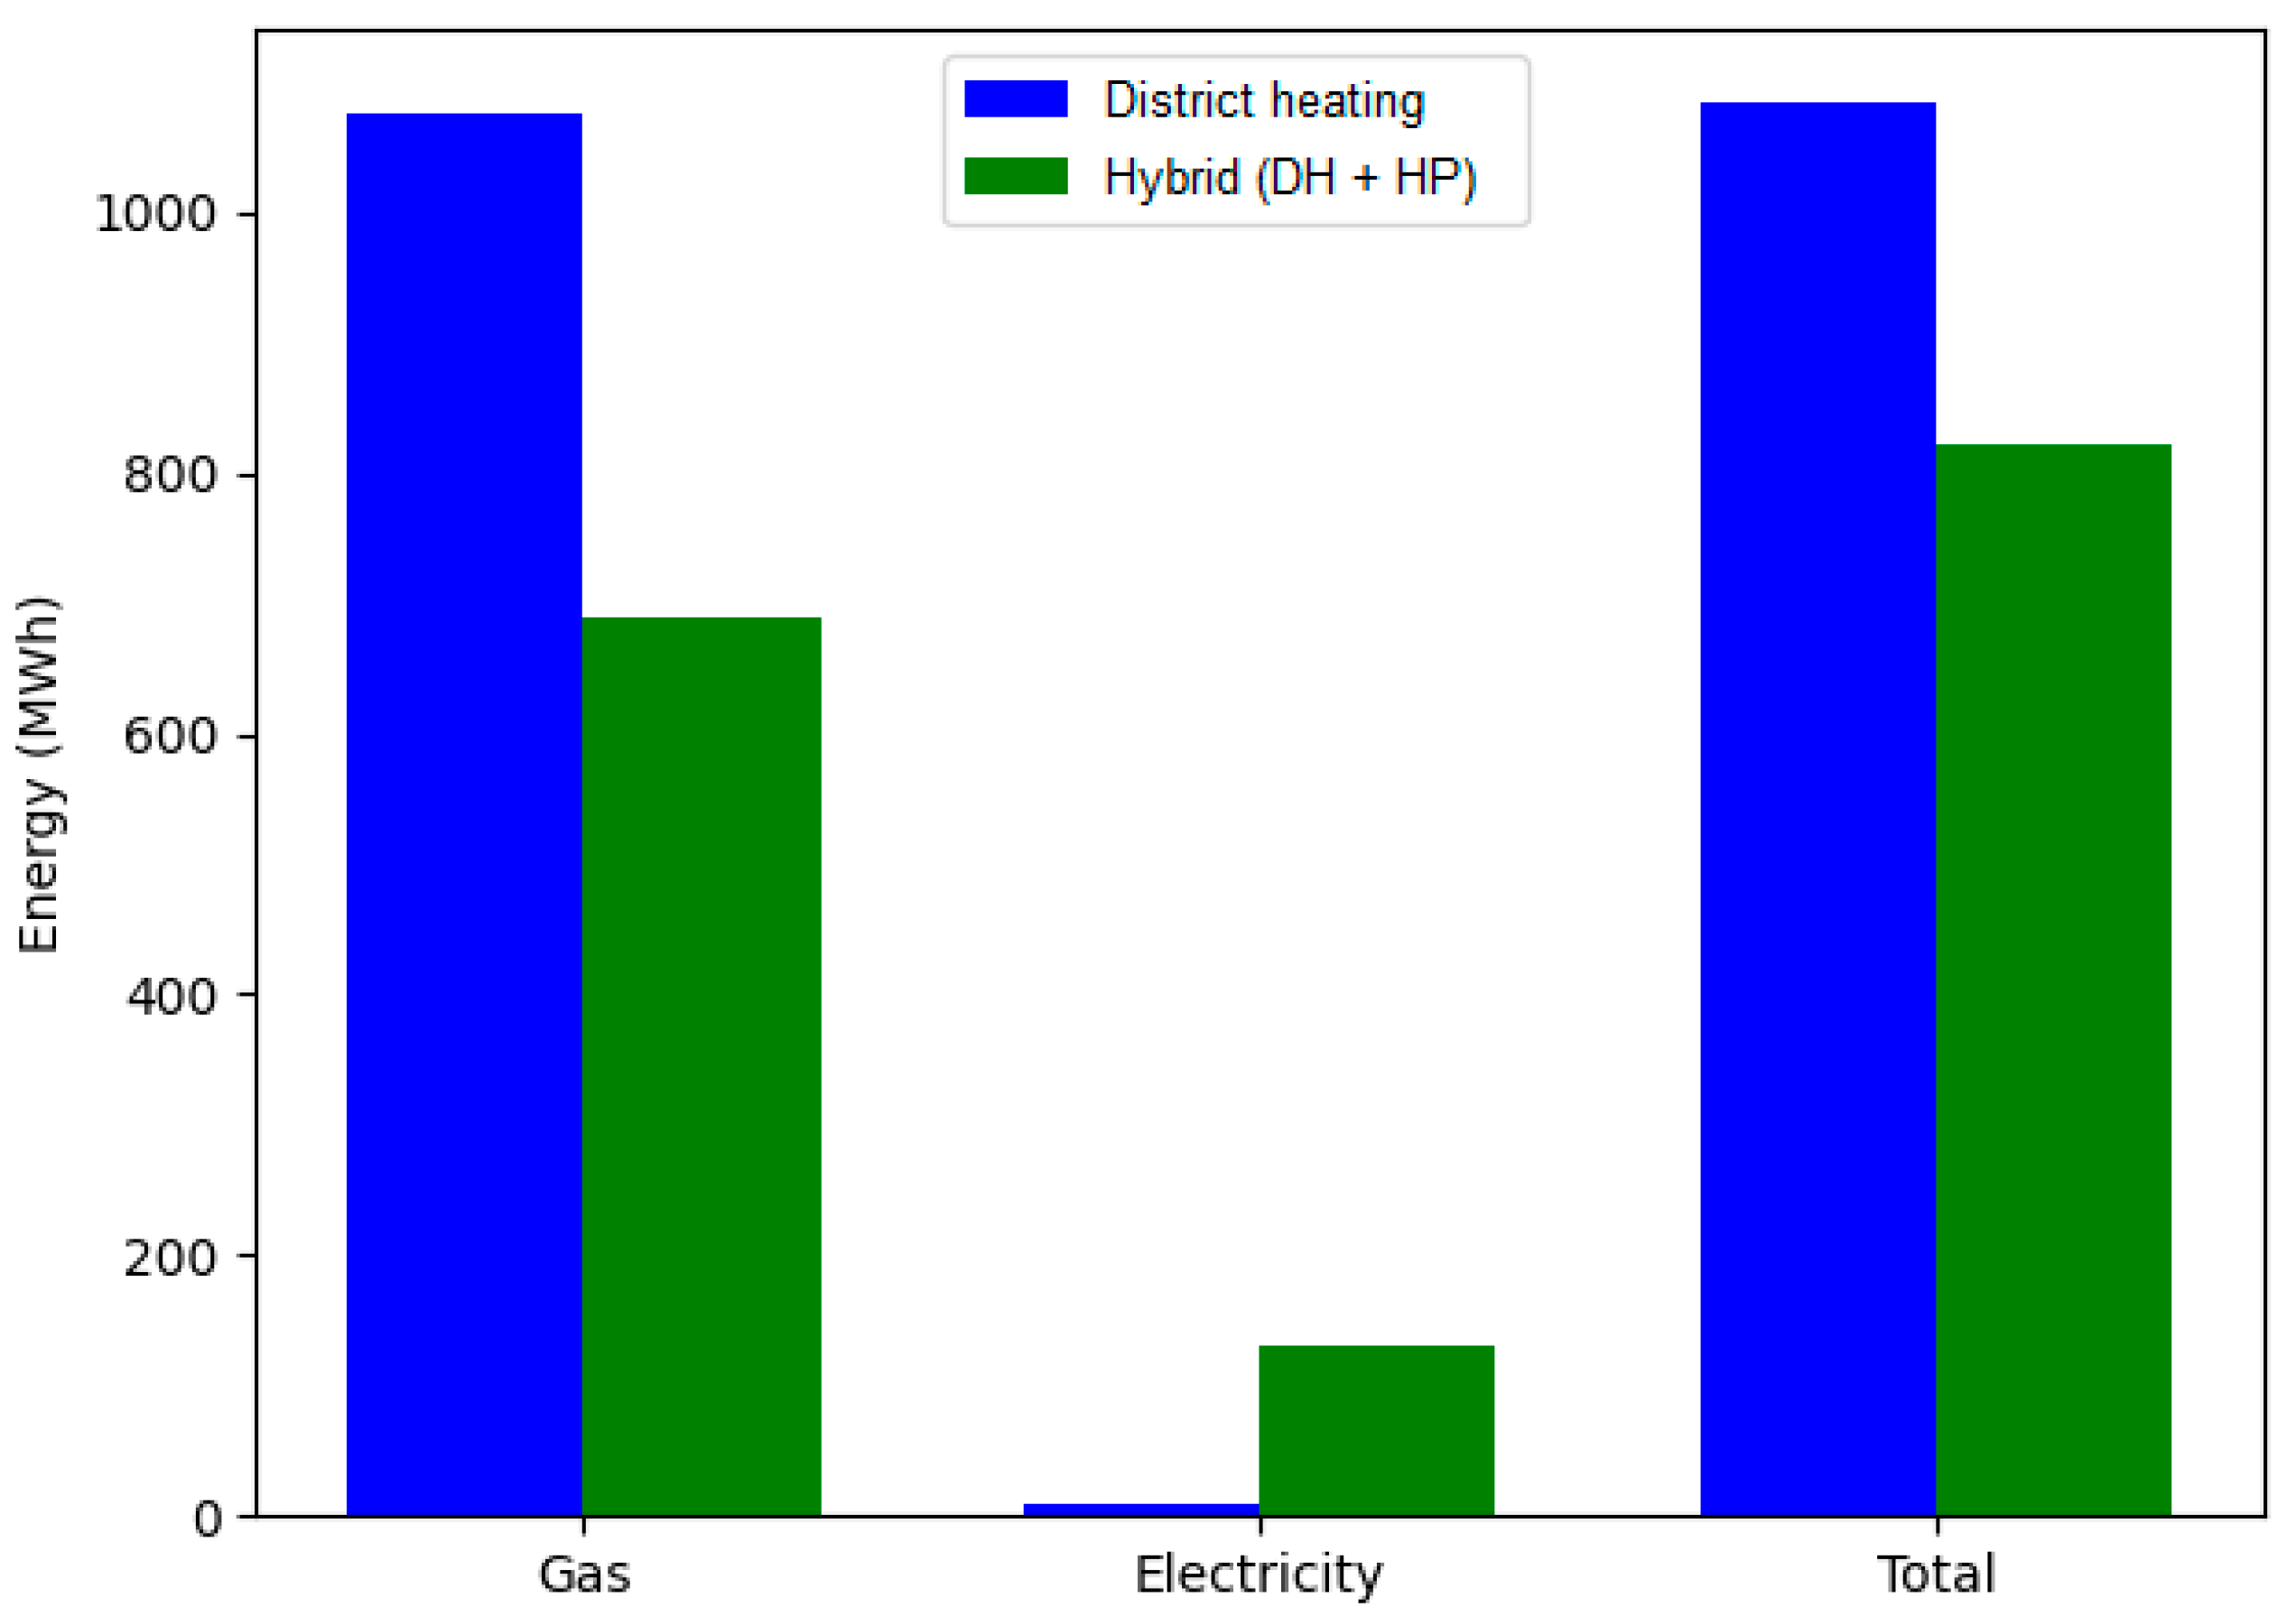
In the conventional scenario (DH only), the total useful thermal energy delivered to the building (Quse) was approximately 1017 MWh. In comparison, the total thermal energy supplied by the system (Qaux) reached about 1019 MWh.
This result indicates that the system can fully meet the building’s thermal demand, with a slight surplus of supplied energy. The difference between supplied and utilised energy is due to distribution losses and the system’s control dynamics.
The total system energy consumption (Etot) was approximately 1085 MWh, with natural gas representing the dominant energy source (Egas ≈ 1076 MWh), while electricity consumption remains negligible (Eel ≈ 9 MWh).
The system energy performance ratio calculated with Equation (1) remains below unity (ηsys ≈ 0.9), which is typical for conventional fossil-fuel-based heating systems.
In contrast, the hybrid scenario (DH + HP) shows a significant improvement in overall performance. The Quse increased to approximately 1090 MWh, closely matching the system output, confirming proper system sizing and reliable operation without an energy deficit. The Etot decreased to about 821 MWh, consisting of Egas ≈ 690 MWh and Eel ≈ 131 MWh.
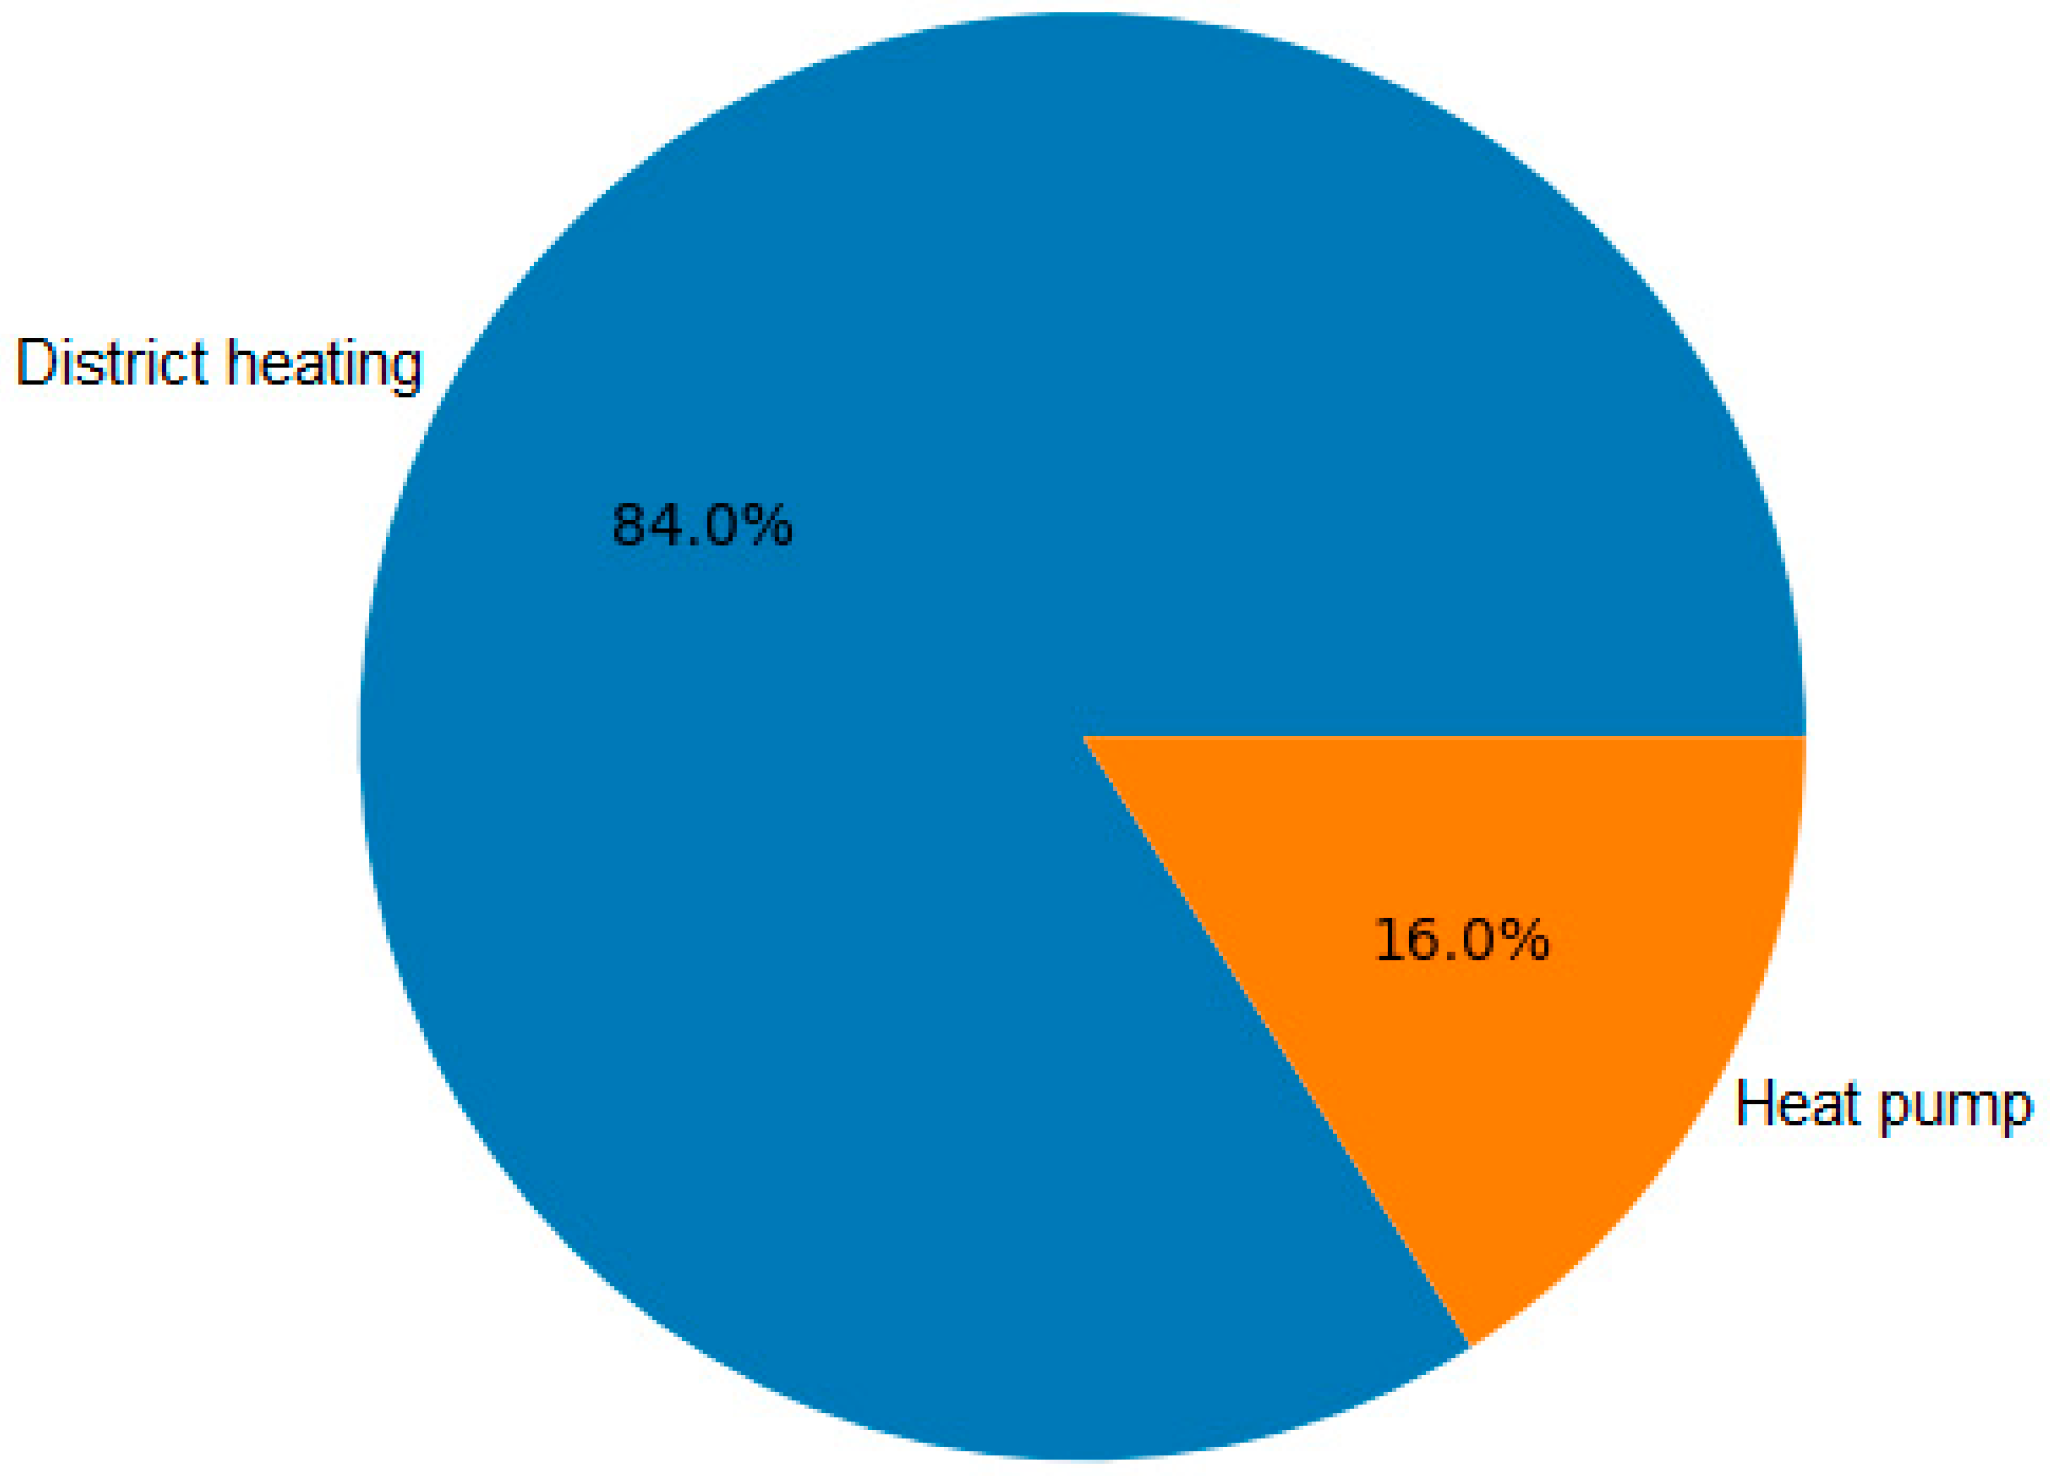
The HP contributes approximately 440 MWh (57%) of thermal energy, with a SCOP of about 3.6, confirming its high efficiency under favourable outdoor conditions.
As a result, the system energy performance ratio exceeds unity (ηsys ≈ 1.3) due to the integration of renewable energy from the ambient environment. In this study, ηsys represents a system-level energy performance indicator rather than a conventional thermal conversion efficiency. For the conventional DH case, ηsys remains below unity due to distribution losses and conversion inefficiencies. In the hybrid case, ηsys may exceed unity because the HP utilises ambient renewable energy in addition to electrical input, thereby increasing useful delivered thermal energy beyond directly supplied purchased energy. This interpretation is consistent with the thermodynamic behaviour of HP-based systems and should not be confused with the COP or SCOP indicators.
Table 7 summarises the main energy performance indicators of the analysed systems, highlighting reductions in total energy consumption, shifts in the energy mix, and the HP’s contribution in the hybrid configuration.
Table 8 presents the comparison of CO
2 emissions between the conventional and hybrid systems. The results show a significant reduction in emissions associated with natural gas consumption, partially offset by an increase in electricity-related emissions from HP operation. Overall, the hybrid system achieves a net reduction in total CO
2 emissions.
From an environmental perspective, the hybrid system achieves a significant reduction in CO2 emissions. The results indicate a total emission reduction of approximately 29,000 kg/year, mainly due to the partial replacement of natural gas with electricity-driven HP operation.
Although electricity consumption increases, its lower carbon intensity reduces overall emissions.
The comparisons performed highlight the clear advantages of the hybrid system. While the conventional DH system relies almost entirely on fossil fuels, the hybrid configuration ensures full load coverage, reduces primary energy consumption, and significantly improves operational flexibility and environmental performance. These findings confirm the potential of hybrid systems as an effective transitional solution toward low-carbon heating.
A sensitivity assessment was performed considering moderate variations in key input parameters, including HP control threshold and performance assumptions. The results indicate that while absolute energy savings vary within a limited range, the hybrid configuration’s comparative advantage remains consistent. In addition, climatic variability is inherently captured through the hourly simulation over a typical meteorological year, which captures seasonal fluctuations that affect system performance.
The energy savings and HP performance achieved are also consistent with trends reported in previous studies on hybrid DH systems, which have observed reductions in primary energy use and improved operational flexibility. This comparison supports the plausibility and broader relevance of the results.
The sensitivity analysis of key input parameters is presented in
Table 9.
Energy savings remained in the range of approximately 21–26%, confirming the robustness of the observed 24% baseline result.