1. Introduction
Sustainable management of transportation infrastructure requires accurate, rapid, and cost-effective assessment of pavement condition, as inefficient maintenance strategies may lead to excessive resource consumption, increased environmental impact, and higher life-cycle costs. In pavements designed to meet high structural and functional performance targets, distress caused by repeated traffic loads and environmental effects [
1,
2], leads to a decline in service level and an increase in life-cycle costs if effective pavement management strategies are not implemented [
3,
4]. Within Pavement Management Systems (PMS), developed to systematically manage this deterioration process [
5], pavement condition assessment forms the basis of maintenance and rehabilitation planning [
6], enabling road agencies to accurately identify deteriorated sections and allocate resources efficiently [
7,
8].
While the structural condition of pavement is evaluated using experimental methods such as the Falling Weight Deflectometer (FWD), which reflects load-carrying capacity [
8,
9], or through structural observations [
10], the functional condition (associated with user comfort and safety) s determined by indicators such as roughness (IRI) [
11], skid resistance [
12], surface distress, and ride quality [
13]. Among these indicators, surface distress, being one of the most visible and operationally significant parameters of pavement performance [
8,
14], is commonly represented through distress-based indices such as the Pavement Condition Index (PCI) and Pavement Condition Rating (PCR). These indices provide interpretable measures derived from observed surface defects and support decision-making processes [
15,
16,
17]. Therefore, the widespread use of these indices has made distress evaluation a fundamental component of pavement management systems, particularly at the project and network levels where rapid condition assessment is required [
6,
15,
18].
The transition from manual methods to automated systems in pavement evaluation is not limited only to computer vision models developed in recent years. This process began earlier with sensor-based and image-based systems designed to reduce subjective assessments in field studies and to lower labor requirements [
19]. Literature reviews on automated infrastructure inspection indicate that these systems are capable of producing objective and repeatable distress data [
20]. However, the implementation of such systems often involves significant practical constraints, as they require specialized measurement equipment, advanced sensors, trained operators, and extensive post-processing procedures [
14,
21,
22,
23,
24]. Similarly, institution-focused studies have shown that automated condition rating and distress quantification approaches can effectively support decision-making processes at the network level. Nevertheless, it is emphasized that quality control mechanisms and partial human validation are still necessary to ensure reliable and consistent application [
19,
20]. Developments in this field highlight the importance of technology-assisted pavement evaluation approaches [
25,
26,
27,
28]. On the other hand, there remains a need for more accessible and operationally practical methods that reduce dependence on costly and specialized data collection systems.
An important distinction in the literature relates to the methods used to acquire road images for pavement evaluation. Many studies have employed specialized image acquisition approaches, such as measurement devices, controlled field photography, or purpose-built data collection systems that provide data suitable for distress analysis [
20,
29]. Although these approaches achieve high accuracy in image-based assessments, they still retain some of the cost and logistical burden associated with traditional inspection practices. Therefore, in recent years, publicly available street-level imagery has emerged as an important alternative. Studies utilizing platforms such as Google Street View and Mapillary have demonstrated that georeferenced public images can support automated road damage detection and related road assessment tasks, while significantly reducing the need for direct field data collection [
30,
31,
32]. This shift is particularly important for low-cost and preliminary pavement analysis applications, where broad coverage and operational accessibility may be more critical than fully controlled image acquisition conditions.
Computer vision methods developed for the analysis of pavement distress are generally addressed in the literature under four main task categories. These tasks include distress classification, object detection, localization, and pixel-level segmentation. Early approaches were typically based on traditional image processing techniques and hand-crafted visual features; however, the robustness of these methods under uncontrolled road conditions remained limited [
29]. In recent years, the use of deep learning models for detecting visible distress such as cracks and potholes has become widespread, and these approaches have provided higher performance in multi-class road damage detection while offering greater flexibility across different image datasets [
21,
30,
31]. Detection- and segmentation-based approaches are particularly important for pavement applications, as they not only identify the presence of damage but also provide spatial information regarding the location of the distress within the image [
21,
32,
33,
34]. In this context, computer vision methods offer a strong and promising foundation for transforming road images into structured distress data that can support pavement evaluation processes [
22,
23,
24,
35].
A commonly encountered limitation in the literature is that strong experimental performance does not always correspond to the same level of effectiveness in real-world field applications. In recent years, many pavement distress studies have been developed and validated using benchmark datasets, such as the Road Damage Dataset (RDD) series, which provide annotated images for standardized training and testing [
30,
32]. Although these datasets have significantly accelerated progress in automated road damage detection, they may also lead research to focus more on dataset-level accuracy rather than operational robustness. In practice, however, image-based pavement evaluation must contend with various factors such as varying viewpoints, occlusions, shadows, variability in pavement surface characteristics, temporal inconsistencies, and differences related to image sources. These factors can limit the transferability of developed methods beyond benchmark conditions [
21,
31]. This gap between experimental success and practical implementation remains one of the fundamental challenges in applying computer vision methods to pavement evaluation.
Computer vision studies have made significant progress in detecting cracks, potholes, and road damage. However, the main issue is no longer whether such distress can be detected from images, but rather how these detections can be integrated into pavement evaluation processes. A large portion of the literature still focuses on model performance, comparisons with benchmark datasets, or image-level distress recognition. In contrast, practical pavement evaluation requires route-based image organization, control of representativeness, reduction of repeated observations, and outputs that can support engineering assessment rather than isolated detections [
21,
30,
32]. This need becomes even more pronounced when publicly available street-level imagery is used, as such data introduce additional challenges such as viewpoint variability, outdated images, and scene occlusion. Therefore, there is a clear research need for a semi-automated and low-cost framework that integrates public imagery, distress detection, and segment-based interpretation, suitable for preliminary maintenance prioritization.
The deep learning-based detection approach used in this study is known to have certain limitations. In particular, when working with publicly available image data, factors such as variability in image quality, differing lighting conditions, and the diversity of deterioration characteristics may affect model performance. However, the primary objective of this study is not to develop a fully optimized model, but rather to demonstrate the applicability and potential of state-of-the-art object detection models in road deterioration detection tasks using publicly available datasets. In this context, the robustness of the proposed approach under real-world conditions and its potential contribution to engineering applications were evaluated through comparisons with field data. In this respect, the study aims to reveal both the capabilities and limitations of current technologies and to provide a foundation for future research in this field.
Motivation of the Study
Despite the growing body of research on computer vision-based pavement distress detection, a significant gap still exists between experimental detection performance and practical pavement evaluation in this field. Existing studies have demonstrated that visible road distress can be identified from images with increasing success; however, many of these approaches still rely on dedicated data collection systems, dataset-centered validation, or image-level outputs that cannot be readily translated into route-based engineering assessment. This limitation becomes particularly critical in applications where low-cost and operationally accessible solutions are required. In such contexts, publicly available street-level imagery presents an important opportunity; however, its effective use for pavement screening requires not only distress detection capability but also a practical framework that supports image acquisition, representative interpretation at the segment level, and maintenance-oriented decision-making processes.
Accordingly, this study has been developed in response to the need for a semi-automated and low-cost pavement screening approach that enables the practical use of publicly available street-level imagery. To address this need, the study proposes a route-based evaluation framework that integrates image acquisition, representative image selection for fixed road segments, computer vision-based distress detection, and a Python-based graphical user interface that enables the transfer of these observations into a segment-based road distress strip. The proposed framework is not intended to replace detailed engineering inspections or to directly estimate comprehensive condition indices such as PCI or PCR. Instead, it aims to support preliminary pavement evaluation by providing a simplified distress-based indicator that can assist in identifying candidate road segments for maintenance prioritization and further conventional inspection.
In this context, cracks and potholes are among the most common surface deteriorations and play a decisive role in pavement performance and traffic safety. Moreover, the ability of image-based analysis methods to detect such clearly visible surface distress with higher accuracy further supports this focus from a methodological perspective. The consistency between field observations and image-based detection results strengthens the validity of the approach in both theoretical and practical terms. Nevertheless, the extension of the approach to other types of pavement deterioration, depending on road class and dominant distress characteristics, may be considered in future studies.
3. Semi-Automated Pavement Distress Evaluation Framework
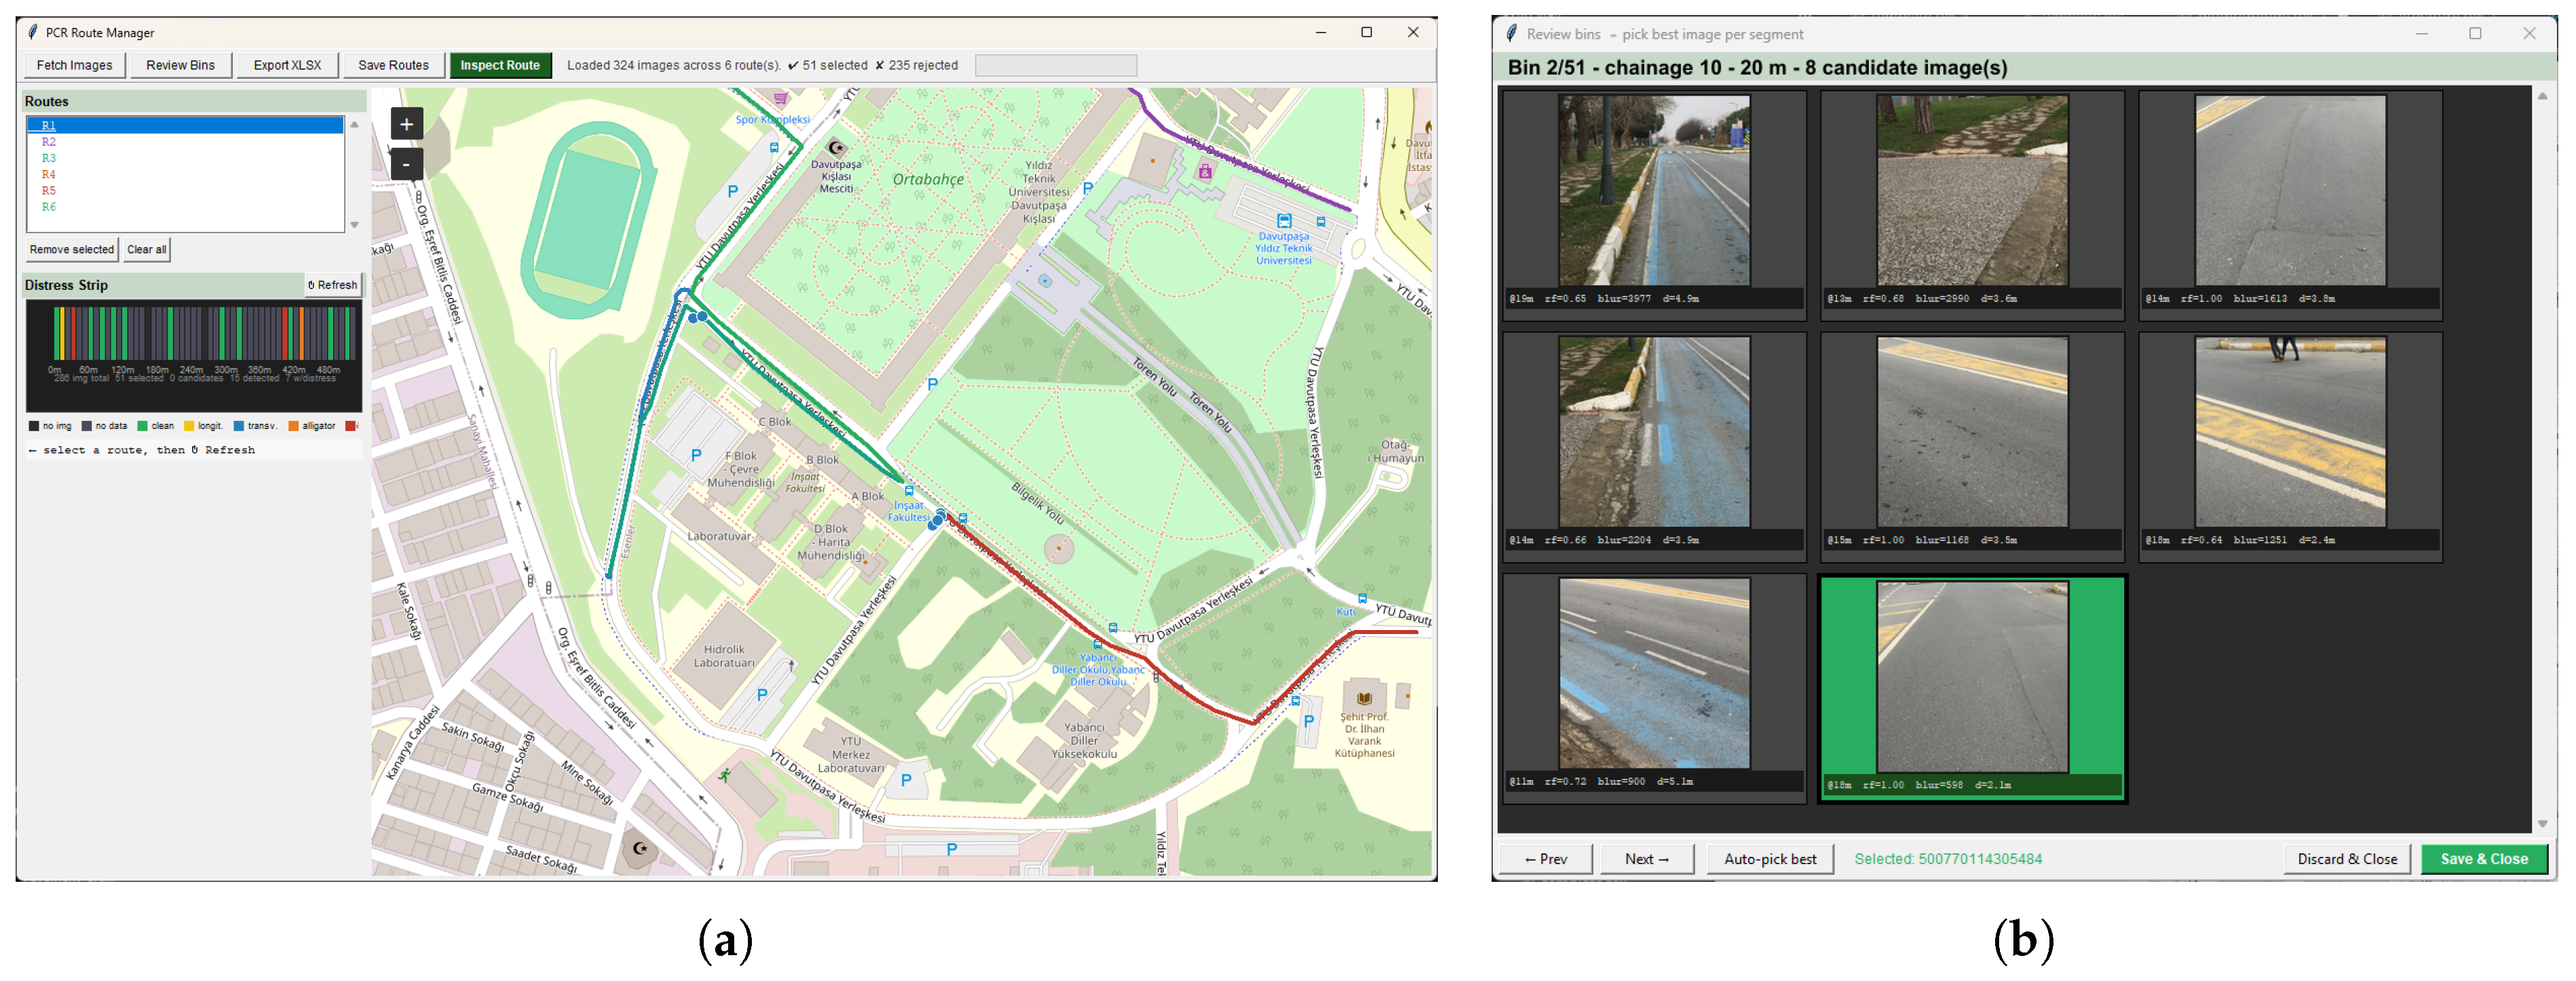
In the proposed framework, pavement sections to be evaluated were first defined within a Python-based graphical user interface developed for route-oriented image acquisition and inspection (
Figure 11a). Predefined routes were automatically loaded onto an interactive map, enabling the user to select the road section of interest and establishing the spatial basis for subsequent image retrieval and distress mapping.
Street-level images along the selected route were retrieved from the Mapillary platform via its public API. images are geotagged dashcam-style captures from vehicle-mounted or handlebar-mounted cameras at approximate heights of 1–1.5 m, consistent with the capture geometry of the RDD2022 training dataset. Across the six routes, approximately 300 representative images were used as detection inputs (one per 10 m bin, 6 routes × 10 sections × 5 bins per section); the total number of candidate images retrieved from the Mapillary API prior to manual selection was approximately 3–5 times larger per bin, depending on image density along the route. Each image carries GPS coordinates recorded at capture time by the contributing device and made available through the Mapillary API metadata. The along-route chainage of each image was computed by projecting its GPS position perpendicularly onto the predefined route polyline; images were then assigned to the 10 m bin containing their projected position. The positional accuracy of consumer-grade GPS, typically ±3–10 m under open-sky conditions, is sufficient for 10 m bin assignment and does not constitute a limitation for the section-level scoring applied in this study. This approach eliminates the need for dedicated field image acquisition, instead leveraging publicly available georeferenced imagery for preliminary pavement assessment. Because consecutive Mapillary images along a route may share overlapping fields of view, the one-image-per-bin constraint ensures that each road surface area contributes exactly once to the detection dataset, preventing any section from being counted more than once in the segment-level aggregation.
To enable segment-based evaluation, the route was divided into consecutive 10 m intervals and retrieved images were grouped by their spatial correspondence with each segment. Because multiple candidate images may cover the same road portion, a representative image selection stage was introduced to ensure that each segment was characterized by a single, most informative visual record. The representative image for each road segment was chosen manually through the interface (
Figure 11b). To ensure the consistency and reproducibility of the selection process, specific criteria were considered, including: (1) sufficient image resolution, (2) clear and explicit visibility of the relevant distress type (e.g., cracks or potholes), (3) absence of heavy occlusion, (4) preservation of up-to-date surface characteristics, and (5) avoidance of repetitive distress patterns. As these criteria are based on observable characteristics, the selection process does not require advanced technical expertise and is expected to yield largely consistent results across different users.
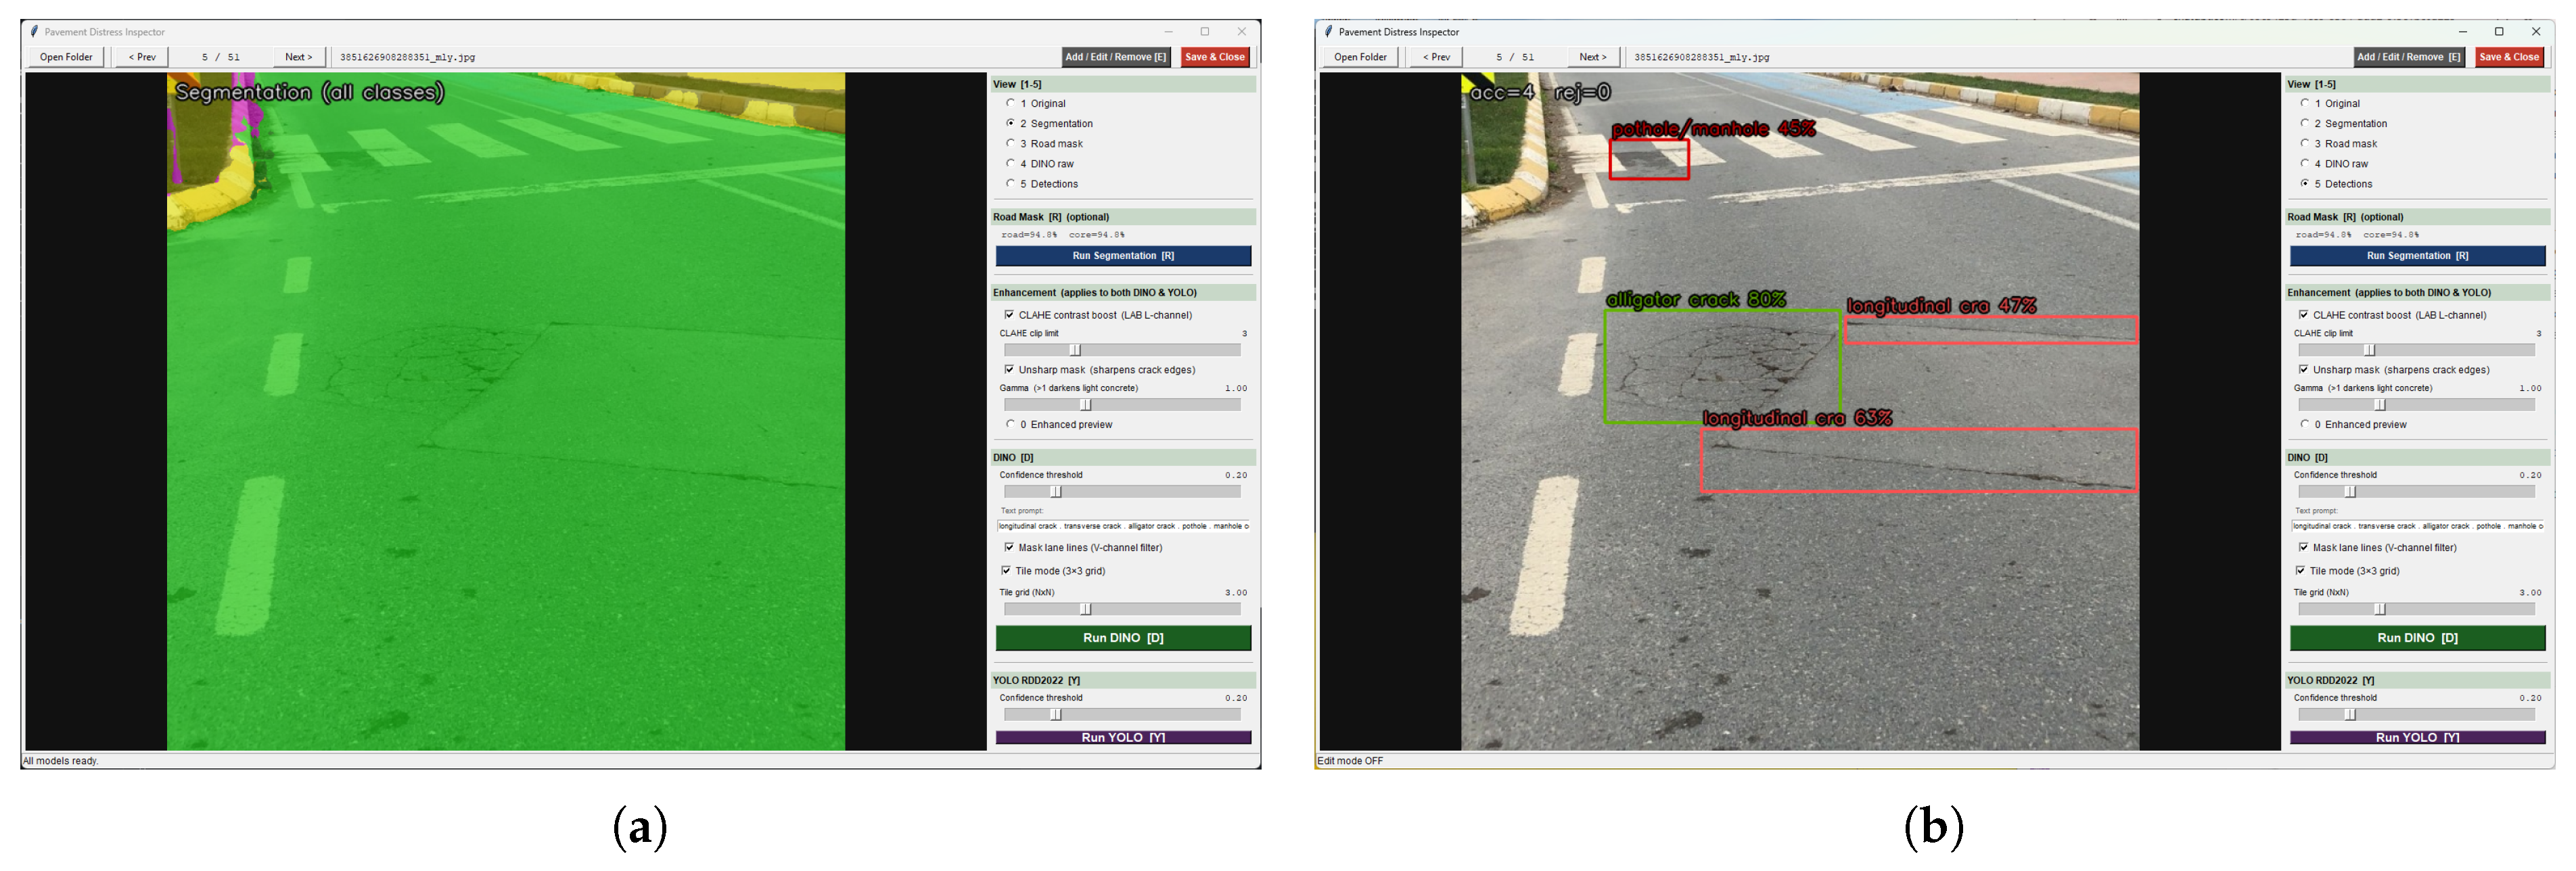
Prior to detection, selected images underwent a preprocessing pipeline consisting of contrast enhancement via Contrast Limited Adaptive Histogram Equalization (CLAHE), edge sharpening through unsharp masking, and gamma correction for brightness adjustment. These operations improved the visibility of surface distress under the variable lighting and contrast conditions typical of publicly sourced street-level imagery. Optionally, a SegFormer-based road-area segmentation model was applied to generate a pavement mask (
Figure 12a). Where a road mask was available, it was applied directly to the image prior to detection, restricting the model’s receptive field to the pavement surface and suppressing false detections from vehicles, road markings, and background elements.
Following image preparation, distress detection was performed using a YOLOv8 model applied directly with its publicly released pre-trained weights from the RDD2022 dataset [
32], without any retraining or fine-tuning, as the primary detection tool. The model was applied exclusively in inference mode using its publicly released RDD2022 pre-trained weights. No model training, fine-tuning, or image-level annotation was conducted as part of this study. Although Grounding DINO was also integrated into the interface as a zero-shot, text-prompted alternative and was initially evaluated during the development of the workflow, it was found to produce a high volume of false positives in practice: rain residues, wet surface reflections, and road markings were frequently misclassified as cracks or potholes, substantially increasing the manual correction burden. The RDD2022-trained YOLOv8 model, by contrast, produced more targeted and consistent detections under the same imaging conditions and was therefore adopted as the primary tool for all route evaluations reported in this study.
The inference-time parameters (resolution, TTA, and NMS IoU threshold) are exposed as user-adjustable settings within the framework, allowing practitioners to fine-tune detection behaviour for specific road surface types and imaging conditions. The default values adopted in this study were selected based on established practice for pavement crack detection in high-resolution street-level imagery [
47]. The inference resolution was set to 1280 px rather than the YOLOv8 default of 640 px, as aggressive downsampling is known to suppress thin, elongated crack features that occupy only a small fraction of a full frame. Test-time augmentation (TTA) was enabled, processing each image alongside its horizontally flipped and multi-scale variants with predictions merged internally; to reduce the likelihood of missed detections for low-contrast or partially occluded distresses, consistent with its demonstrated benefit in road damage detection [
47]. The NMS IoU threshold was set to 0.35 (versus the standard 0.45) to avoid collapsing adjacent crack detections in densely cracked areas into a single bounding box, which would systematically undercount distress severity. As no image-level bounding-box annotations were produced in this study, a quantitative ablation study isolating the contribution of each setting is not feasible within the current evaluation framework; generating such annotations and conducting a formal ablation is identified as a direction for future work. In a post-processing step, overlapping detections belonging to the same distress class were merged into a single bounding box whose extent was defined as the union of all constituent boxes, with confidence assigned from the highest-scoring member. This class-aware merging step, implemented using a union-find connected-component algorithm, eliminated duplicate counts arising from tiled inference or from the model issuing multiple partially overlapping detections for a single physical crack. An example detection output following these steps is shown in
Figure 12b.
Detection results were presented as bounding boxes on each image and could be reviewed and corrected through a user-assisted refinement stage integrated into the interface. Boxes could be added, deleted, resized, repositioned, or reclassified, with all modifications saved directly to the working dataset. This refinement step reflects the semi-automated nature of the framework: rather than treating model outputs as final, the workflow combines automated detection with human judgment to maintain engineering relevance, a particularly important safeguard when working with publicly available imagery subject to viewpoint variation, partial occlusion, and inconsistent surface conditions.
Once finalized, detection outputs were transferred into a segment-based structure linked to the route geometry. Each representative image was associated with its corresponding 10 m segment, converting image-level detections into a linear road distress representation. A route distress strip was then generated to visualize pavement condition at the segment level, with the number of detected distress instances per segment recorded as the primary quantitative output for subsequent analysis.
It is important to note at the outset that this section describes a validation framework, not a model development effort. No road damage detection model is trained, fine-tuned, or annotated as part of this work. All detection capability is derived from the publicly released pre-trained weights of a YOLOv8 model trained on the RDD2022 dataset [
32]; full dataset statistics, class-wise image counts, train/test split ratios, and training documentation are reported in that reference and are not reproduced here. The contribution of the present study lies in structuring the application of this off-the-shelf detector within a route-oriented, segment-based evaluation workflow, and in validating whether its outputs agree with pavement condition scores obtained through conventional field inspection.
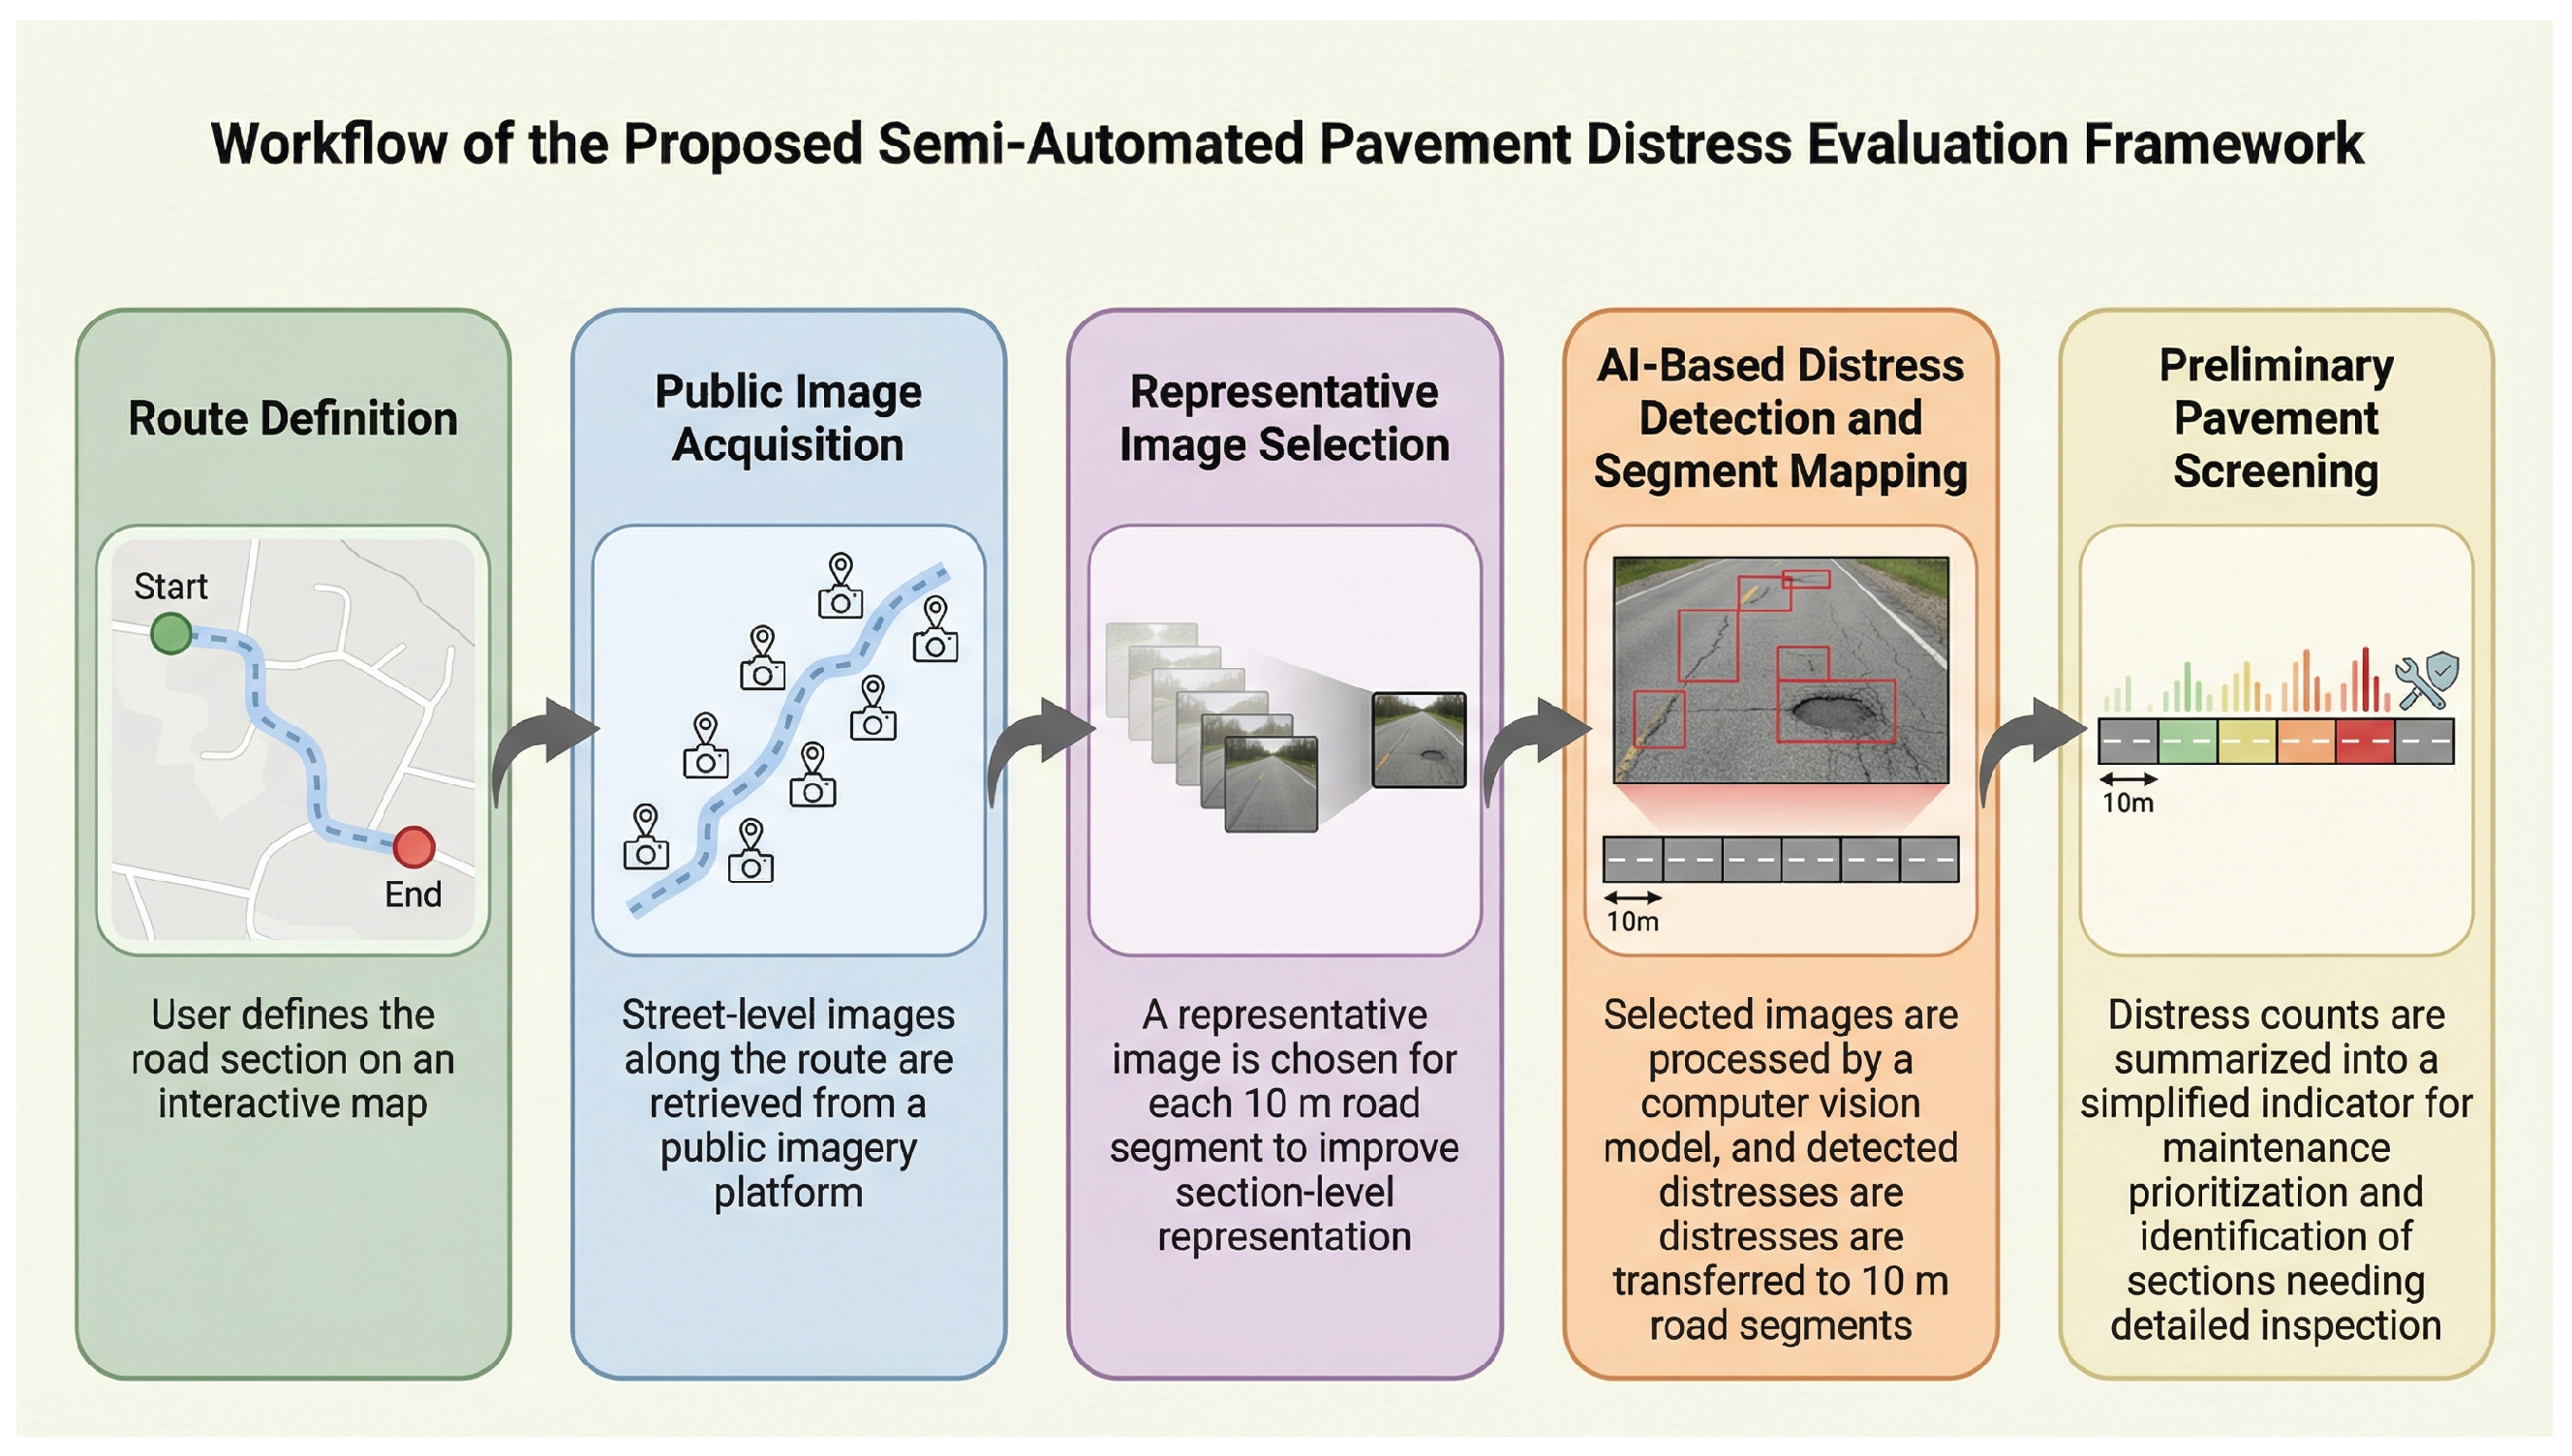
The segment-level detection results were compared against field-based pavement assessment data using Spearman’s rank correlation to evaluate agreement. The complete workflow of the proposed framework, illustrated in
Figure 13, can be summarized as the following sequence of steps:
- Step 1.
Route definition. Target road sections are defined within the GUI on an interactive map. Predefined routes are loaded automatically and serve as the spatial reference for all subsequent operations.
- Step 2.
Image retrieval. Street-level images are fetched from the Mapillary API for the selected route. Each image is georeferenced and linked to the route by chainage, forming a route-ordered image dataset.
- Step 3.
Segment partitioning and image grouping. The route is divided into consecutive 10 m segments. Retrieved images are assigned to segments based on their geographic position, yielding one pool of candidate images per segment.
- Step 4.
Representative image selection. For each segment, the single most informative image is selected manually through the GUI review panel, prioritizing clear pavement visibility and excluding occluded or outdated views.
- Step 5.
Image preprocessing. Selected images are enhanced via CLAHE contrast adjustment, unsharp masking, and gamma correction. Optionally, a SegFormer road mask is applied and used to restrict the model’s input to the pavement surface, suppressing non-road regions prior to detection.
- Step 6.
Distress detection. A YOLOv8 model pre-trained on the RDD2022 dataset is applied to each preprocessed image at an inference resolution of 1280 px with test-time augmentation and a reduced NMS IoU threshold of 0.35. Post-processing merges same-class overlapping detections into single bounding boxes. Grounding DINO is available as an alternative zero-shot detector within the same interface.
- Step 7.
User-assisted refinement. Detected bounding boxes are reviewed within the GUI. The user may add, delete, resize, reposition, or reclassify boxes to correct false positives and missed detections before results are committed.
- Step 8.
Segment-level aggregation. Finalized detections are aggregated per 10 m segment. A distress strip is generated along the route to provide a spatial overview of pavement condition, and detection counts per segment are exported as the primary quantitative output.
- Step 9.
Statistical comparison. Segment-level CV outputs are compared with field-based PCR assessment data using Spearman rank correlation to quantify the agreement between the two methods.
4. Results
In this section, engineering-based pavement distress evaluations obtained from field studies and computer vision-based detection results are comparatively analyzed at the section level. Because this study does not produce image-level bounding-box annotations, standard object detection metrics such as F1-score, precision, and recall cannot be computed. Instead, the appropriate evaluation metric is the Spearman rank correlation coefficient, which quantifies the degree to which the ranking of distress severity across sections—as derived from CV detection counts—agrees with the ranking established by field-based PCR scores. This rank-based agreement directly reflects the study’s engineering objective: determining whether automated detection outputs are sufficiently consistent with expert field assessment to support section-level maintenance prioritisation decisions.
The analyses show that the image-based detections of the proposed semi-automated framework are highly consistent with engineering-based field observations and largely preserve the ranking of distress severity across sections. In this context, rather than directly comparing numerical values, the extent to which the distress ranking among sections is preserved was evaluated. Thus, the applicability of computer vision outputs for engineering practices such as maintenance prioritization has been demonstrated.
This approach addresses the “engineering relevance” problem, which is often overlooked in computer vision-based distress detection studies, by transforming image-level outputs into decision-support information at the road section level. Furthermore, the ability of the proposed method to operate using publicly available imagery presents a low-cost and scalable pavement condition assessment approach, offering significant potential for sustainable infrastructure management and the development of data-driven maintenance strategies.
4.1. Detection Behavior and Observed Limitations
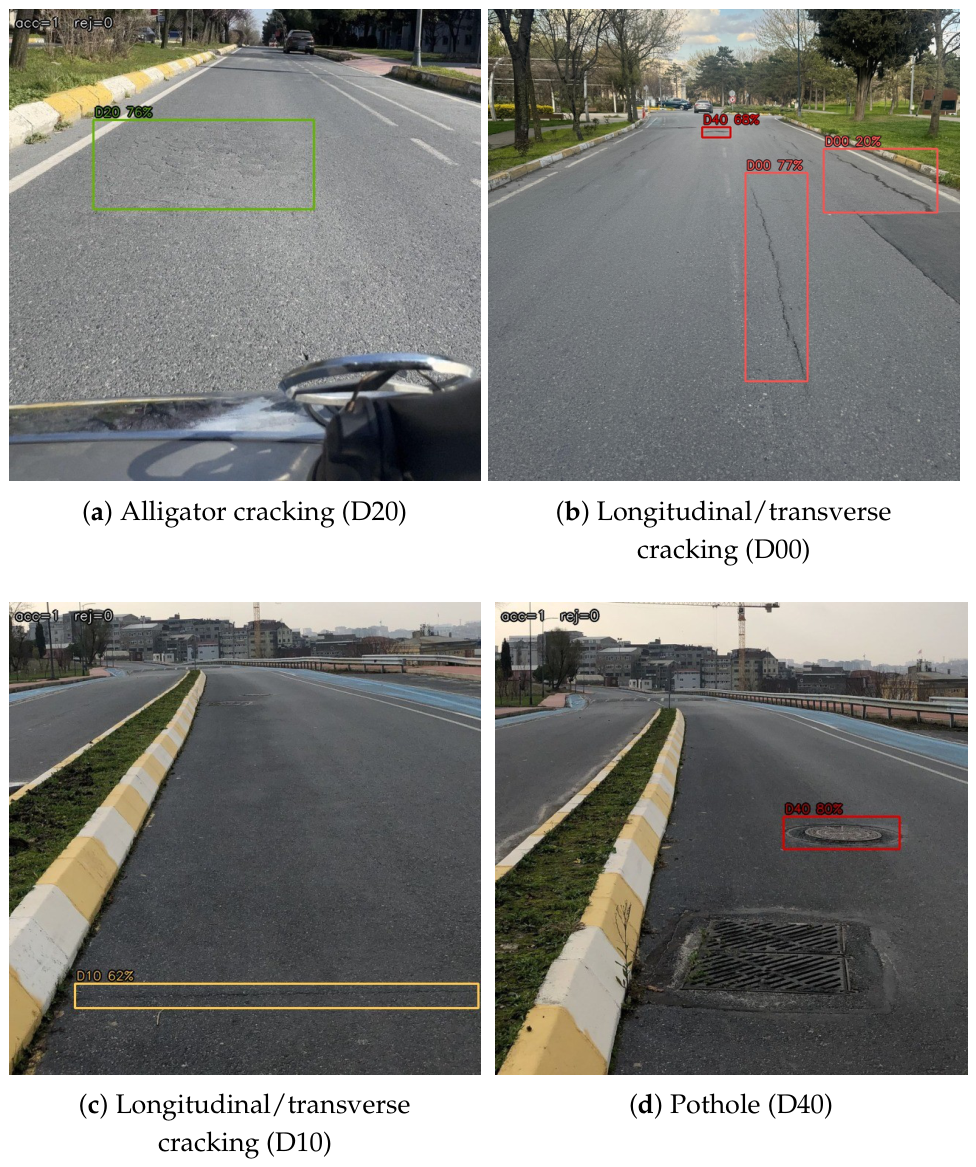
The YOLOv8 model pre-trained on the RDD2022 dataset was applied to all selected representative images across the six routes. The model detects four distress classes: longitudinal cracks (D00), transverse cracks (D10), alligator cracks (D20), and potholes (D40). Representative detection examples for each class are shown in
Figure 14, illustrating the model’s ability to localize and classify surface distresses under real-world dashcam imaging conditions.
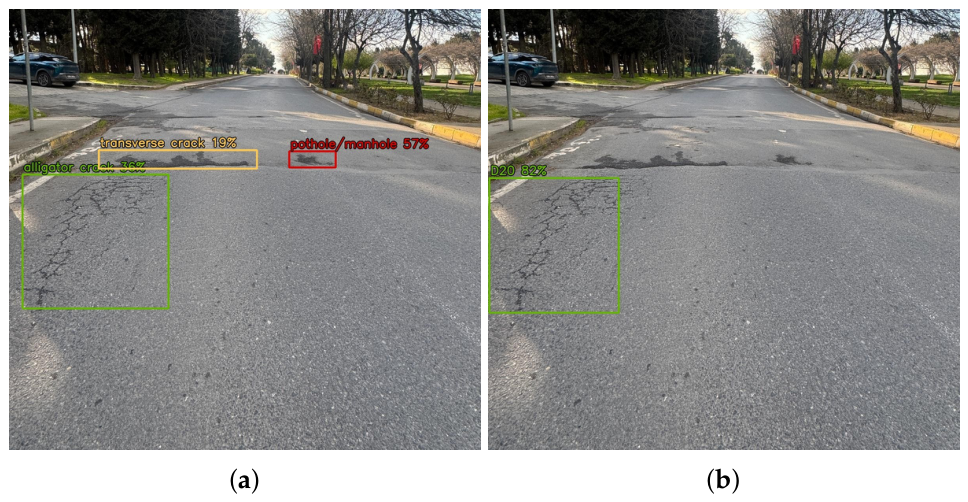
During the development of the framework, Grounding DINO was also evaluated as a zero-shot, text-prompted alternative. A notable advantage of this approach is its ability to detect custom or site-specific distress categories through natural-language prompts, without requiring any retraining. In principle, this flexibility could allow practitioners to extend the detection vocabulary to include locally relevant damage types not covered by existing training datasets. However, under the imaging conditions encountered in this study, DINO produced a substantially higher rate of false positives. Rain residues on the pavement surface, wet surface reflections, road markings, and shadow boundaries were frequently misclassified as crack or pothole instances, generating a large number of spurious detections that required manual removal in the refinement stage (
Figure 15). This overhead effectively negated the efficiency gain sought from automated detection, making DINO impractical as a primary tool for the scale of the present study. The RDD2022-trained YOLOv8 model, by contrast, produced considerably more targeted outputs with a lower false-positive burden, and was therefore adopted exclusively for all route evaluations reported below.
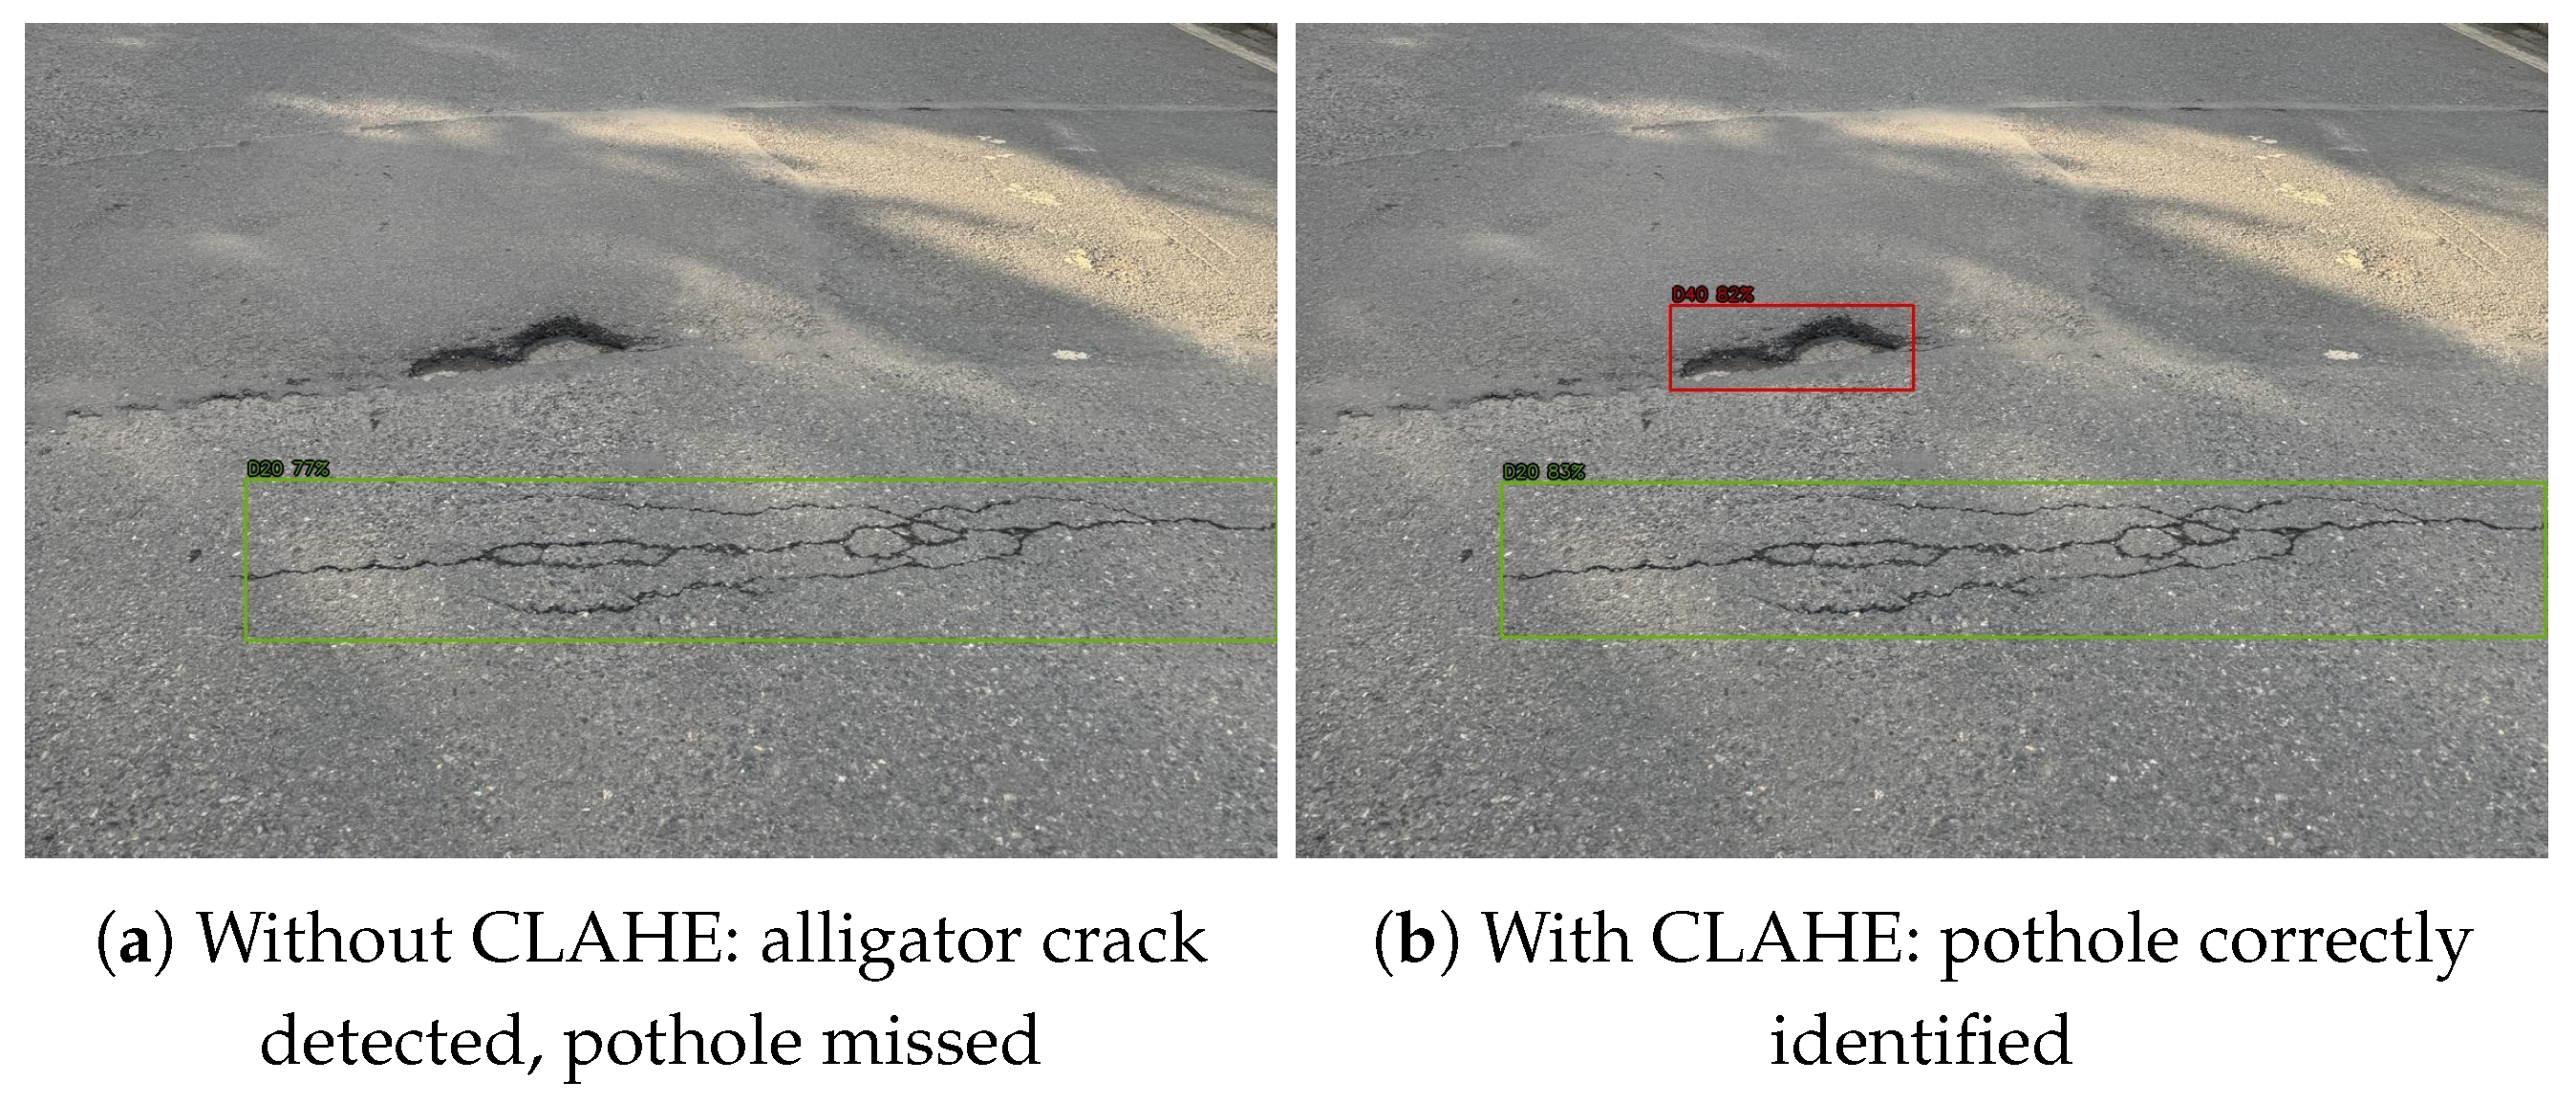
Detection performance was observed to be sensitive to the CLAHE clip limit parameter applied during preprocessing. At low clip limit values, local contrast enhancement was modest and crack detection benefited from the improved edge visibility; as the clip limit was progressively increased, the enhanced brightness and exaggerated local contrast led to a redistribution of detection confidence. Specifically, pothole detection confidence increased as the brighter, more uniform appearance of the enhanced surface became more consistent with the model’s learned pothole representations. Conversely, crack detection became less reliable under high clip limit settings, as over-enhancement suppressed the fine intensity gradients along crack edges that the model relies upon for class discrimination. This effect is illustrated in
Figure 16: without contrast enhancement, the model classifies the surface distress as alligator cracking while failing to recognize the associated pothole; following CLAHE application, the same region is correctly identified as a pothole with higher detection confidence. These observations suggest that an intermediate clip limit—sufficient to improve crack visibility without inducing the contrast artifacts that trigger pothole false positives—is preferable, and that a single globally fixed preprocessing parameter may not be optimal across all pavement surface types and ambient lighting conditions.
Subdividing the input image into overlapping tiles prior to inference (hereafter referred to as tiled inference) consistently improved the detection of fine cracks that were missed when processing the full image at its native resolution. This improvement is attributable to the resolution mismatch between the RDD2022 training images ( px road patches) and the larger Mapillary frames used in this study: by dividing the image into subregions of comparable spatial scale, each tile presents crack features at a resolution closer to what the model was exposed to during training.
A further complication arises from the heterogeneous resolution of Mapillary imagery. Because images along a given route are sourced from different contributors using different devices, consecutive segments may be represented by images with substantially different pixel dimensions and camera heights. As a result, a fixed tile grid that is well-calibrated for one image may over-segment or under-segment another, producing inconsistent effective resolutions across sections. An adaptive tiling strategy—in which the grid dimensions are derived from the image resolution, camera height metadata, and target ground sampling distance—would yield more uniform feature scales across sections and reduce the variability in detection counts that currently necessitates human review. This is identified as a priority direction for future development.
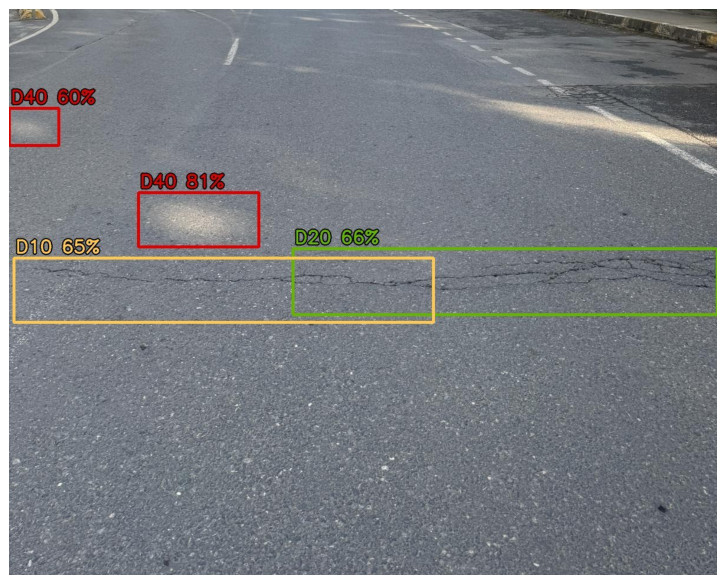
A category of false positives that proved resistant to all preprocessing measures consisted of strong shadow boundaries, specular bright spots, and surface staining (e.g., oil marks, dried water stains). These features share geometric and photometric properties with genuine crack and pothole instances—sharp intensity edges, localized dark or bright regions, and elongated shapes—and were not reliably suppressed by CLAHE adjustment, unsharp masking, gamma correction, or road masking. A representative example is shown in
Figure 17, where a specular bright spot on the pavement surface is erroneously classified as a pothole. The application of DINO yielded no improvement in this regard; shadow and reflection artifacts were, if anything, more frequently captured by the text-prompted model. In the current framework, correct handling of these cases requires human review in the refinement stage. Addressing this limitation algorithmically would require either training data that includes shadow and stain examples as explicit negative classes, or a post-processing filter based on temporal or multi-image consistency that is beyond the scope of single-image inference.
The RDD2022 training dataset, compiled primarily from roadway imagery in Japan, India, and the Czech Republic, contains manhole cover instances that are predominantly circular in geometry. In the study area, however, the large majority of manhole covers are rectangular or square-framed, a characteristic common to urban road infrastructure in Türkiye (see
Figure 14d). As a consequence, the model reliably detected circular manholes but consistently failed to recognize rectangular variants, which were either missed entirely or misclassified as potholes when surface degradation around the frame was present. This limitation is a direct reflection of the training distribution and cannot be resolved through inference-time parameter tuning. Extending the model to cover rectangular manholes would require labelling representative examples and incorporating them into the training dataset, either through fine-tuning the existing RDD2022 weights or through a targeted data augmentation scheme. This is noted as a relevant gap for studies conducted in regions where rectangular manhole infrastructure predominates.
It should also be noted that the RDD2022 training dataset exhibits an uneven distribution of labelled instances across its four damage classes and across contributing countries, a challenge documented by Arya et al. [
32]. In this study, the effect of such imbalance is partially mitigated by the aggregation of all crack classes into a single category for section-level scoring; however, it remains a relevant consideration for future applications requiring per-class detection accuracy.
However, the use of publicly available street-level imagery may involve certain limitations in terms of temporal consistency. To mitigate this effect, the metadata of each retrieved image, particularly timestamps, were examined, and the most recent images available were preferred. In cases where inconsistencies or data gaps were identified, the dataset was supplemented with additional images. Furthermore, in order to improve data quality and ensure a certain level of standardization, images collected by the authors during the study period were also included in the dataset. In addition, since the primary objective of the study is maintenance prioritization, the analyses are based on relative comparisons rather than absolute evaluations. In this context, it is considered that limited temporal differences do not significantly affect the relative ranking among road sections. Nevertheless, this issue is acknowledged as a potential limitation of the study.
In addition, the continuity and timeliness of publicly available image data constitute another aspect that should be considered in terms of practical application. The dataset used in this study was collected within a specific time frame and therefore has a static structure. However, since the primary objective of the study is to provide a rapid preliminary assessment tool for maintenance prioritization, the lack of continuous data updates is not considered a limiting factor for the main scope of the study. Furthermore, the proposed system has a flexible structure that allows the integration of periodically collected images, and the incorporation of continuously updated data streams is considered a direction for future work.
4.2. Section-Level Detection Results by Route
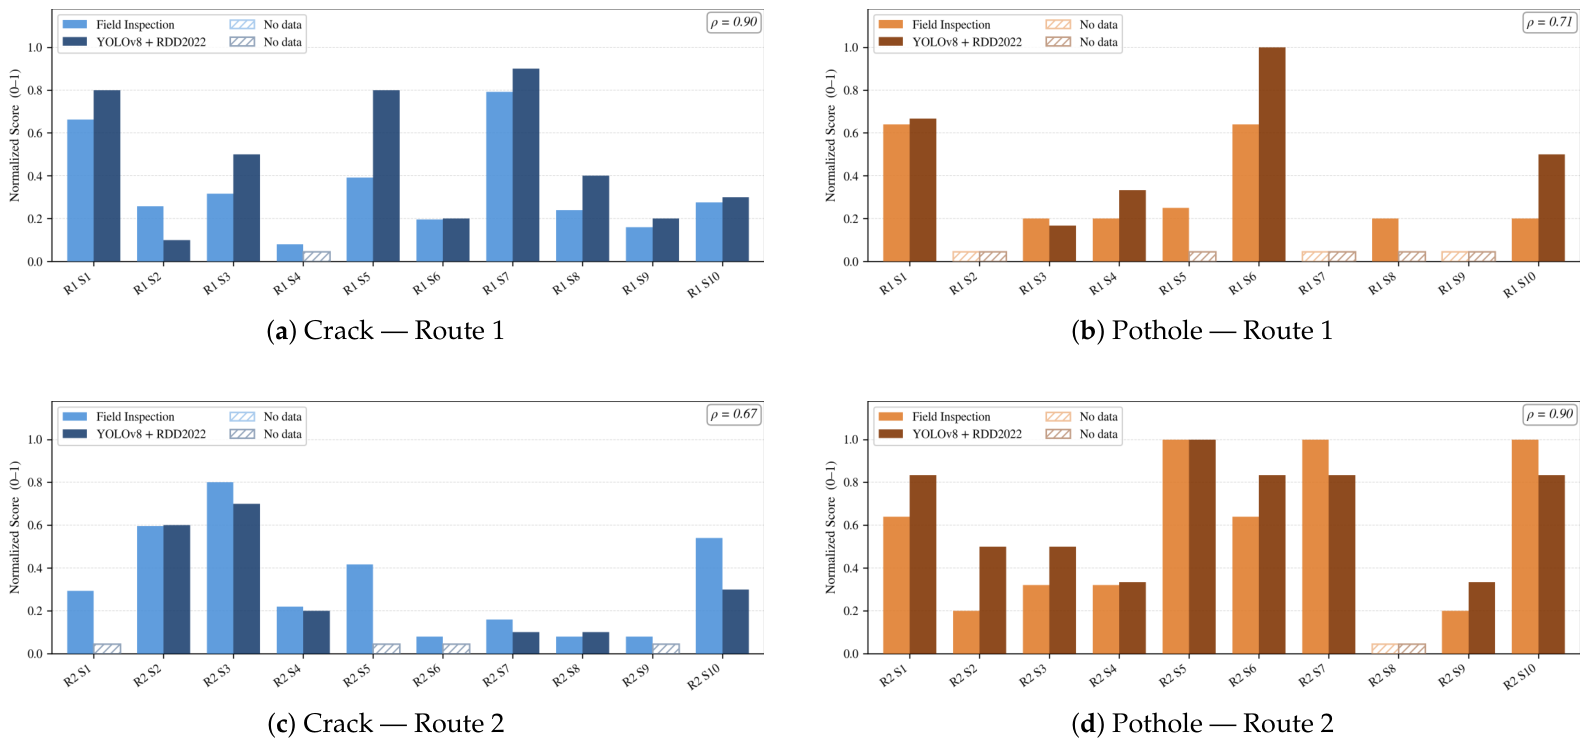
On Route 2, a different performance pattern is observed depending on distress type (
Figure 18). The moderate correlation obtained for crack detection (
) indicates that the model captures the general trend but fails to detect certain sections where measurable distress is present in the field data. These omissions are considered to be primarily related to insufficient or suboptimal image availability rather than a fundamental limitation of the model. In contrast, the high correlation obtained for pothole distress on Route 2 (
) indicates that the model accurately identifies sections with high distress severity, particularly S5 and S10. The strong agreement between field observations and model outputs in these sections suggests that visually prominent pothole features can be reliably detected under favorable imaging conditions.
Overall, the results presented in
Figure 18 demonstrate that the proposed approach is capable of representing section-level distress ranking with high reliability, particularly for visually distinctive and two-dimensional distress characteristics. However, for distress types such as potholes, where three-dimensional geometric properties play a critical role, detection performance appears to be more sensitive to factors such as image quality, masking accuracy, and data coverage.
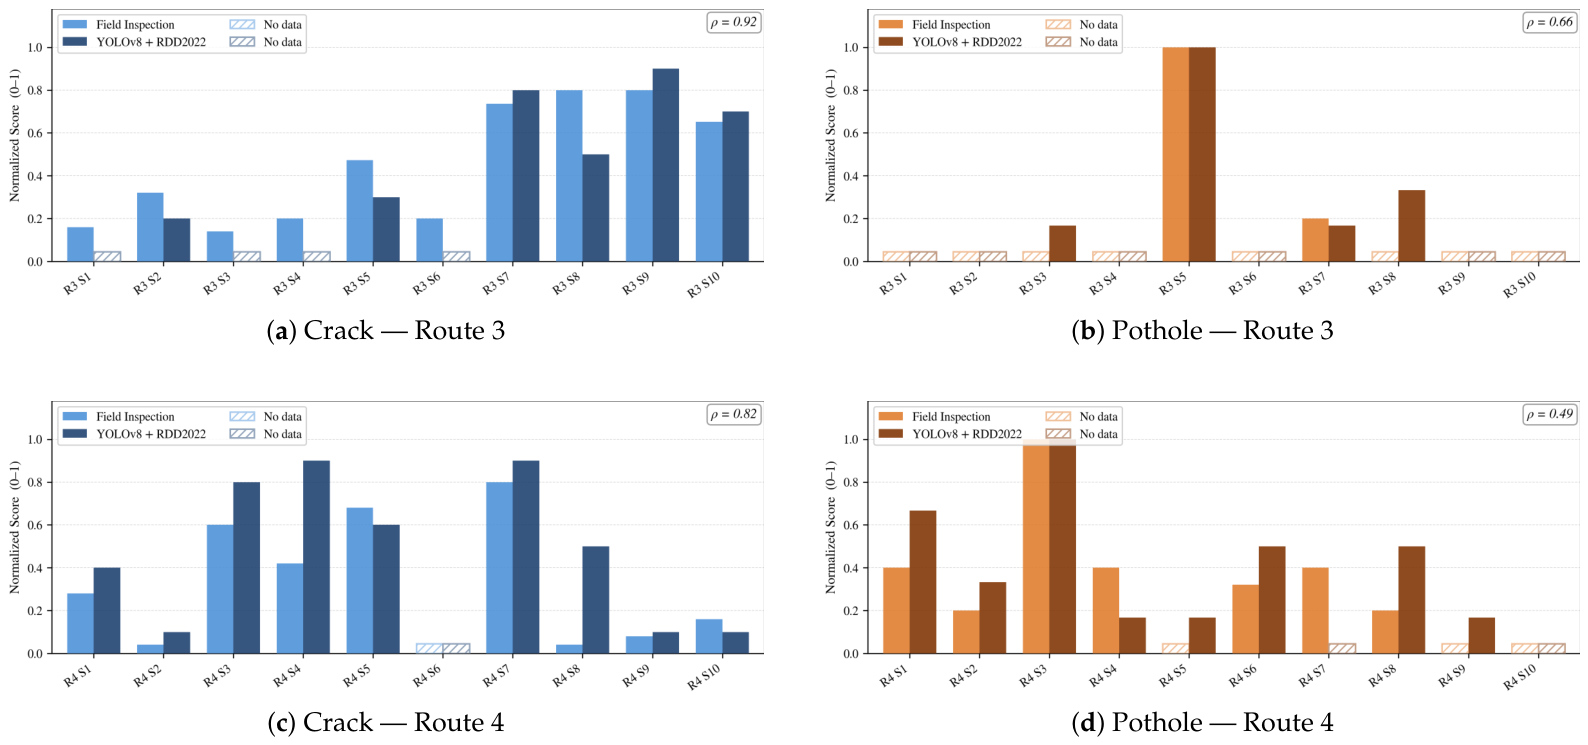
The results obtained for Routes 3 and 4 (
Figure 19) indicate a high level of agreement between the model and field observations for crack-related distress. The correlation values obtained for Route 3 (
) and Route 4 (
) demonstrate that the model reliably represents the relative ranking of distress across sections. In particular, the accurate detection of deterioration concentrated in Sections S7–S10 on Route 3 suggests that the continuous and two-dimensional characteristics of cracks contribute positively to detection performance.
In contrast, the results for pothole distress exhibit a more variable pattern. While a moderate correlation is observed for Route 3 (), it is evident that deterioration is captured clearly only in certain sections (particularly S5). For Route 4, a lower correlation value () is obtained, which is associated with both overdetection in some sections and insufficient representation of existing distress in others. The overdetections may be attributed to visual elements not directly related to pavement condition (e.g., stains, shadows, reflections) or to effects introduced by the masking process.
Overall, the results presented in
Figure 19 indicate that the proposed approach performs more successfully for visually distinct and two-dimensional distress types such as cracks, whereas detection performance becomes more sensitive to image quality and data coverage in cases where three-dimensional characteristics, such as potholes, are dominant.
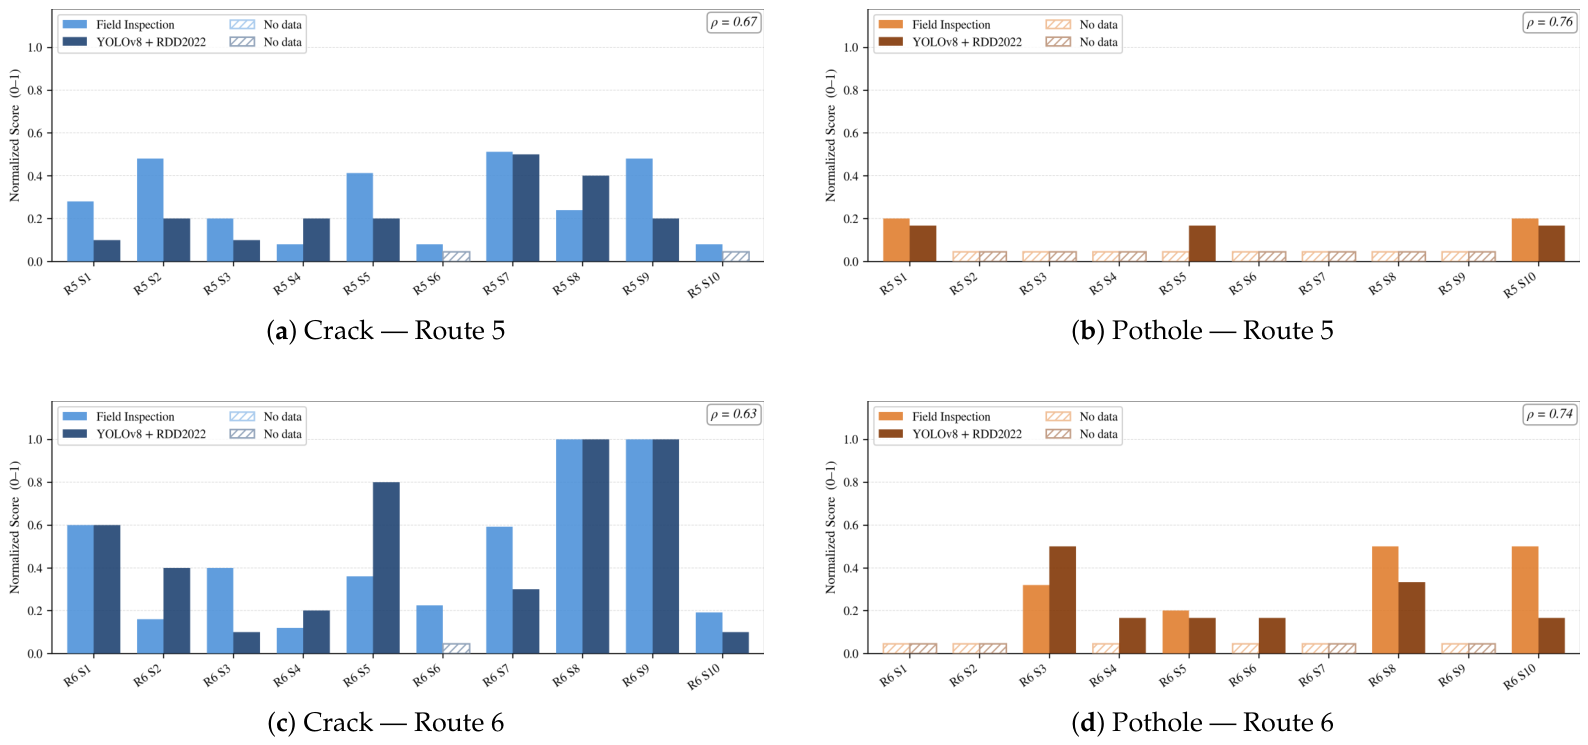
The results obtained for Routes 5 and 6 (
Figure 20) indicate a more homogeneous distribution of distress compared to the other routes. For crack-related distress on Route 5, the moderate correlation (
) shows that although the model is able to reflect the general trend, the differentiation between sections remains limited. This can be explained by the fact that distress levels are generally low and similar to each other, making ranking differences less pronounced. Similarly, a moderate correlation (
) is obtained for crack distress on Route 6. While the model is able to accurately capture sections with high levels of distress (S8 and S9), discrepancies are observed in some sections (e.g., S5 and S7) between field observations and model outputs. These differences are considered to be related to variations in image coverage and pavement surface visibility. For pothole distress, a more consistent performance is observed across both routes. The correlation values obtained for Route 5 (
) and Route 6 (
) indicate that the model is capable of accurately representing sections with clearly visible distress. However, in sections with low levels of deterioration, the limited presence of both field and model data reduces the discriminative contribution to the correlation, making its interpretation less pronounced.
Overall, the results obtained across all routes indicate that the proposed semi-automated approach is capable of reliably representing section-level distress ranking. While a high level of agreement is achieved for distress types such as cracks, which exhibit continuity on the pavement surface and can be represented through two-dimensional visual features, detection performance is observed to be more variable for distress types such as potholes, where three-dimensional geometric characteristics are more dominant. Furthermore, the findings reveal that model performance is not solely dependent on the algorithm used, but is also directly influenced by factors such as image quality, data coverage, and the visual representability of the distress type. This highlights the critical role of data quality and accessibility in computer vision-based infrastructure monitoring systems.
Nevertheless, the results demonstrate that the proposed approach can be implemented as a low-cost and scalable pavement condition assessment tool using publicly available imagery. In this respect, the system offers significant potential for supporting rapid preliminary assessment over large road networks, facilitating maintenance prioritization processes, and enabling more efficient use of limited resources, thereby contributing to sustainable infrastructure management and the development of data-driven maintenance strategies.
5. Discussion
The findings of this study provide important insights into the integration of computer vision-based distress detection methods with engineering-based pavement evaluation processes. Section-level comparisons demonstrate that the proposed semi-automated approach is capable of preserving distress ranking with a high degree of consistency, making it a useful indicator for applications such as maintenance prioritization. This contributes to addressing the commonly recognized challenge of ensuring engineering relevance in image-based pavement assessment.
The results also indicate that model performance varies depending on distress type. Distresses such as cracks, which exhibit continuity on the pavement surface and can be represented through two-dimensional features, are detected with higher accuracy. In contrast, performance becomes more variable for distresses such as potholes, where three-dimensional geometric characteristics are dominant. This can be explained by the limited availability of depth information in single images and the strong dependence of visual perception on lighting, shadows, and surface contrast. Furthermore, the findings reveal that model performance is not solely dependent on the algorithm used, but is also directly influenced by factors such as data quality and availability. In particular, when using publicly available street-level imagery, image coverage and pavement visibility play a critical role in detection performance. Therefore, data quality should be considered a fundamental component in computer vision-based infrastructure monitoring systems.
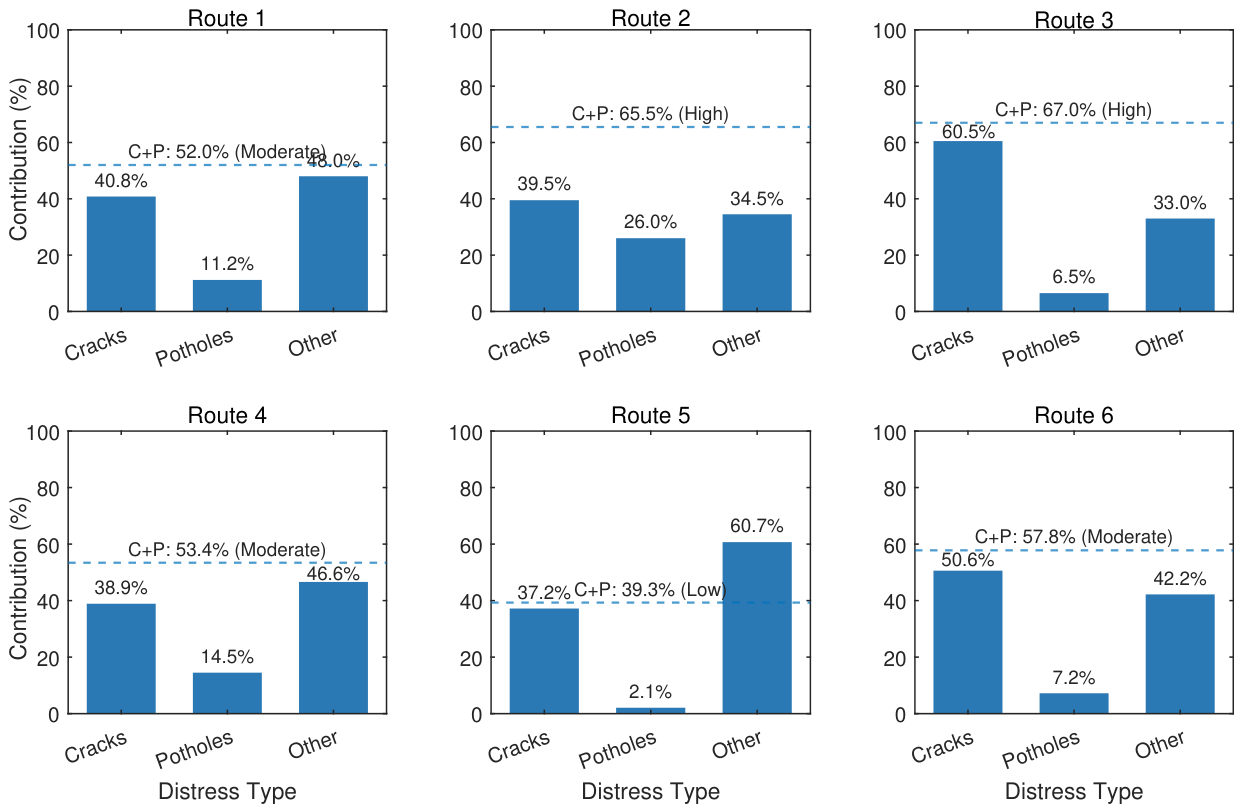
A key contribution of the proposed framework is the transformation of image-level detections into section-level engineering indicators. This approach enables a direct linkage between computer vision outputs and engineering applications, providing a significant advantage for integration into decision-support processes. In this context, the CP-PCR approach offers a practical simplification by focusing on dominant distress types, reducing data dimensionality while enabling more consistent comparison with field observations. However, several limitations should be acknowledged. The use of publicly available imagery introduces uncertainties in data quality and coverage, and the semi-automated structure requires user intervention at certain stages. In addition, the CP-PCR approach does not encompass all distress types and should be complemented with conventional methods for detailed engineering analysis.
The detection process revealed several recurring challenges that currently limit the degree of automation achievable within the framework. Preprocessing sensitivity—particularly the dependence of crack and pothole detection confidence on the CLAHE clip limit—means that no single parameter configuration performs consistently across all surface types and lighting conditions. Specular reflections, shadow boundaries, and surface staining generate false positives that resist suppression by image enhancement or road masking, and invariably require manual correction. The heterogeneous resolution and camera geometry of crowdsourced Mapillary imagery further complicates inference-time configuration: a tile grid or inference resolution suited to one image may be suboptimal for the next segment if contributed by a different device or from a different mounting height. Finally, the training distribution of the RDD2022 dataset does not cover certain locally prevalent infrastructure features—most notably rectangular manhole covers—leading to systematic gaps in detection coverage. Collectively, these factors explain the residual human intervention requirement in the current workflow and define the envelope within which the framework can realistically replace conventional inspection without quality loss.
Looking ahead, the most impactful avenue for reducing human review effort lies not in further tuning of the detection model itself, but in standardising the input imagery. A dedicated image metadata preprocessing stage—one that estimates camera mounting height, image resolution, and approximate ground sampling distance from available EXIF or platform metadata—would allow the inference pipeline to set resolution, tiling configuration, and contrast enhancement parameters adaptively for each image rather than globally. Platforms such as Mapillary already expose partial camera and capture metadata through their APIs, making this a tractable near-term extension. Beyond preprocessing, the selective addition of locally representative training examples—including rectangular manholes and common surface staining patterns—to the detector’s fine-tuning dataset would close specific recognition gaps identified in this study. Taken together, these improvements would move the framework closer to a fully automated, network-scale screening tool capable of providing actionable condition estimates at a fraction of the cost and time of conventional field survey, while retaining the option to flag sections for targeted manual inspection where detection confidence is low. In this sense, the proposed approach is best understood not as a replacement for engineering judgement, but as a cost-effective first-pass instrument that concentrates inspection effort where it is most needed.
Overall, the findings confirm that the proposed framework offers a practical and scalable basis for preliminary pavement condition assessment using publicly available imagery, with clear directions for reducing the remaining human intervention through improvements to preprocessing, training data coverage, and inference configuration, as discussed in the following conclusions.
6. Conclusions
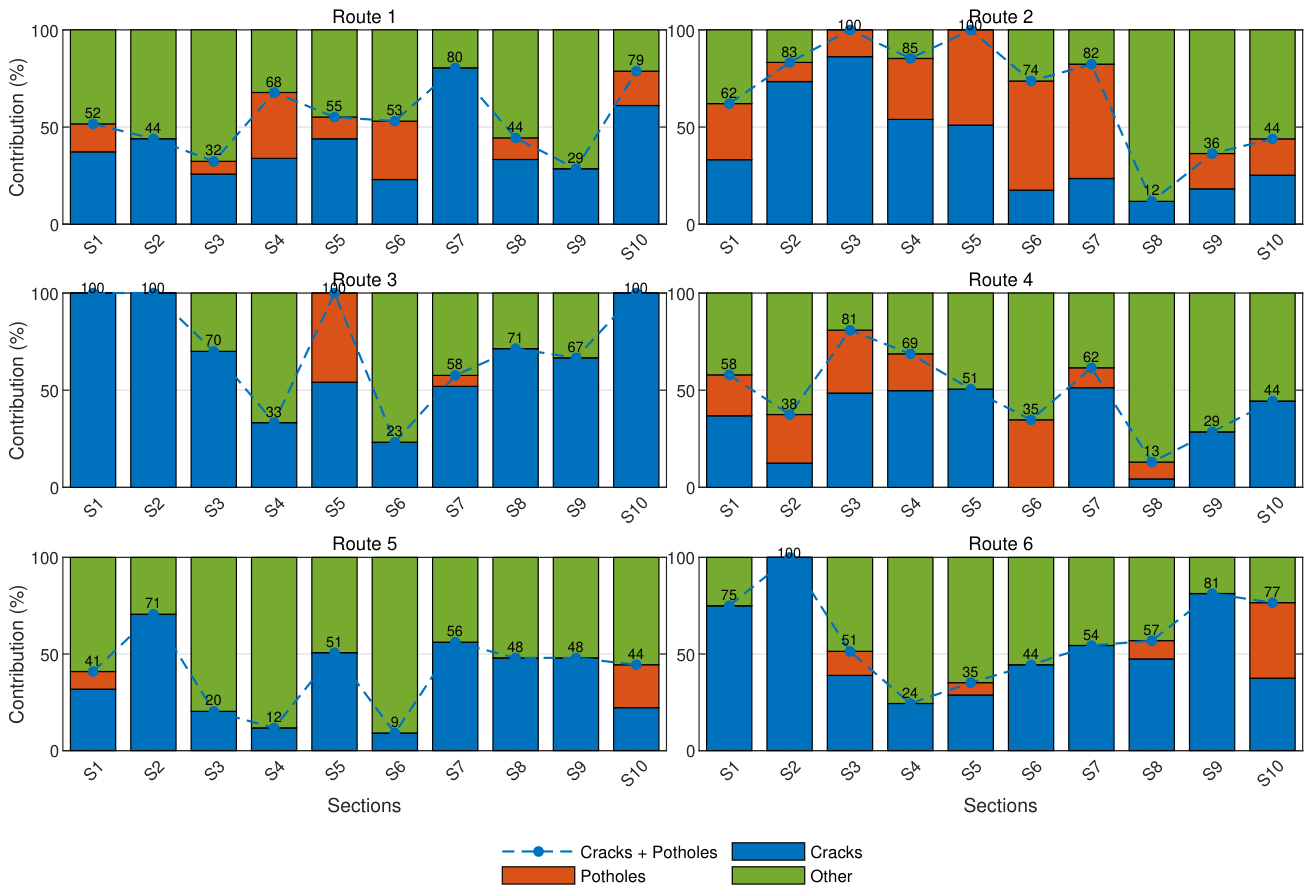
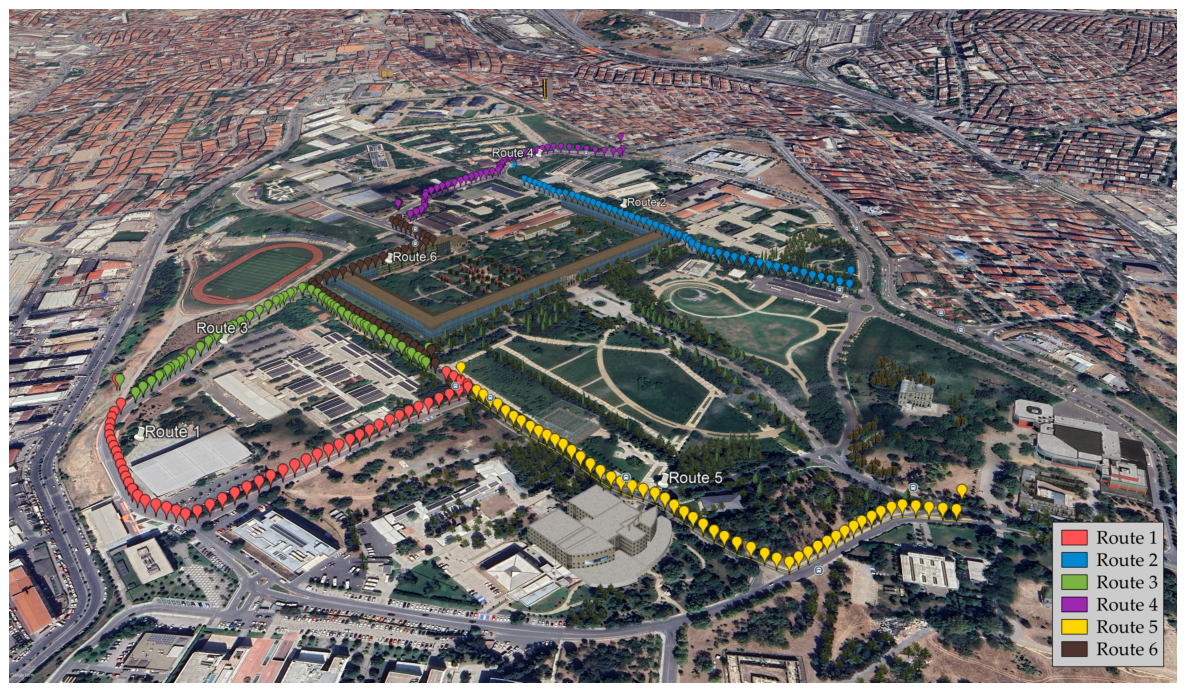
This study proposed and validated a semi-automated pavement distress evaluation framework that integrates publicly available street-level imagery with a pre-trained deep learning detector to produce section-level distress signals comparable to conventional field-based assessment. The framework was applied to approximately 3 km of campus roads at Yıldız Technical University, covering six routes subdivided into 60 sections of approximately 50 m each.
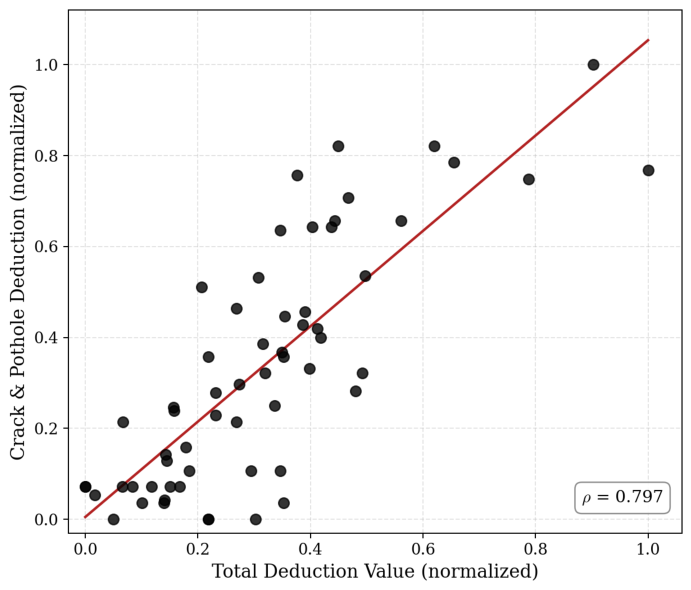
The field-based assessment, conducted in accordance with the ODOT Pavement Condition Rating (PCR) protocol, identified cracks and potholes as the dominant contributors to total pavement deduction across all routes, with a Spearman rank correlation of = 0.797 (p < 0.001) between the crack-and-pothole deduction and overall PCR deduction across 60 sections. This result justified the use of a simplified CP-PCR representation as the field-side reference for comparison with CV outputs.
Section-level comparisons between YOLOv8+RDD2022 detection counts and field CP-PCR scores demonstrated strong rank agreement for crack distress, with Spearman correlations reaching = 0.92 on Route 3 and = 0.82 on Route 4. Pothole detection showed more variable performance across routes ( ranging from 0.49 to 0.90), reflecting the greater sensitivity of three-dimensional distress features to single-image viewpoint, lighting, and masking conditions. These results demonstrate that the proposed framework is capable of preserving section-level distress ranking with engineering-relevant accuracy, making it suitable for applications such as preliminary network screening and maintenance prioritisation.
The framework’s key contributions are: (i) transformation of image-level detections into section-level engineering indicators directly comparable to PCR-based field scores; (ii) integration of a user-assisted refinement stage that corrects model outputs before aggregation, maintaining result quality despite the heterogeneity of crowdsourced imagery; and (iii) a fully operational, open workflow built on publicly available data sources and pre-trained models, requiring no dedicated image collection or model training.
Several limitations were identified that bound the current degree of automation: preprocessing parameter sensitivity, false positives from shadows and surface reflections, heterogeneous Mapillary image resolution, and training distribution gaps for locally prevalent infrastructure features such as rectangular manhole covers. Future work should focus on adaptive per-image inference configuration, targeted fine-tuning of the detector on locally representative examples, and image-level annotation to enable formal metric-based evaluation of detection performance.