1. Introduction
Shelter is a basic human need and a central pillar of sustainable development [
1]. At the same time, rapid population growth, urban expansion, and the need to replace aging structures are increasing demand for housing and infrastructure worldwide [
2,
3]. This growth is unfolding amid intensifying climate pressures. Global warming has raised global temperatures by about 1.5 °C, and much higher temperatures remain possible under high-emission pathways [
4,
5]. The housing sector must therefore expand while reducing its carbon footprint.
Buildings are a major source of global carbon emissions. The building sector accounts for about 37% of global energy-related emissions, including both operational emissions from energy use and embodied emissions from materials and construction [
6,
7,
8]. Residential buildings account for a large share of this total because they require substantial material inputs during construction and substantial energy inputs during operation. Operational carbon is mainly associated with heating, cooling, lighting, and appliance use, while embodied carbon is associated with raw material extraction, manufacturing, transport, and construction [
9].
Cement and steel are especially important in this context because they account for a large share of global greenhouse gas emissions [
10,
11]. Concrete remains the most widely used construction material [
12,
13]. As urbanization continues, demand for cement-based construction will remain high [
14,
15]. Research has proposed decarbonization pathways, including supplementary cementitious materials, timber systems, reduced-cement concrete mixes, and advanced optimization methods [
16,
17]. However, these strategies are not equally practical across all developing-country contexts. Supplementary cementitious materials may be scarce or unavailable in certain regions. Timber may be costly, limited in supply, or difficult to use under local codes and market conditions. Reducing cement in concrete is constrained by strength, durability, and code requirements [
18,
19,
20,
21]. Advanced optimization methods also remain difficult to apply in routine design because they are computationally demanding, weakly integrated with standard engineering workflows, and rarely used in everyday practice [
22,
23].
Residential energy code adoption remains limited because compliance remains weak and largely voluntary in many projects [
24,
25]. At the same time, Egyptian housing construction depends heavily on reinforced concrete frames, fired-clay brick, and cement-based finishes. This creates a need for decarbonization pathways that are technically feasible, code-compatible, materially available, and cost-effective. Existing studies have often examined embodied or operational carbon separately, while studies that assess both within a single integrated residential building framework remain limited [
26,
27].
BIM-based studies quantify embodied carbon using quantity take-offs and material inventories [
28], while operational energy is often assessed in separate simulation workflows [
29]. Some studies integrate both domains, but structural response is often treated only partially or excluded entirely [
30]. As a result, the downstream structural effects of substituting envelope or wall systems on concrete quantities, reinforcement demand, and foundation reactions are often not tracked within the same assessment framework. This limits the ability to evaluate whether a low-carbon wall alternative remains effective when embodied, operational, and structural carbon are considered together.
For this purpose, two case studies are examined: one affordable housing project and one middle-class housing project derived from typical Egyptian residential practice and national housing delivery programs [
31,
32]. The study applies an integrated BIM-based digital twin, finite element, and energy simulation framework to trace how wall density and thermal performance influence material demand, structural response, cooling energy use, and carbon emissions under local code, material, and cost constraints. The study not only assesses embodied and operational carbon together but also links wall substitution to both structural-material consequences and cooling-related operational effects within a single traceable workflow.
For embodied carbon, the primary assessment boundary is limited to Modules A1-A3. This boundary was selected because the study focuses on design-stage comparison of alternative wall systems using consistent material production data across both case studies. Transport and construction stages, including A4 and A5, were excluded because reliable, project-specific logistics and construction-stage data were not consistently available across all scenarios. Their exclusion may affect absolute embodied-carbon totals, especially where transport distances are large, but is less likely to change the comparative ranking of wall alternatives with substantially different material masses and thermal properties. This boundary choice is therefore treated as a comparative design-stage scope rather than a full whole-life embodied-carbon inventory.
Three questions guide the study. The first is which building components dominate embodied carbon in Egyptian multi-unit housing. The second is the extent to which wall-system substitution influences structural-material demand and cooling-related operational carbon emissions. The third is whether lightweight, energy-efficient wall systems can reduce whole-life carbon emissions without increasing project costs. By addressing these questions, this study develops a practical scenario-based pathway for residential building decarbonization in Egypt.
2. Methods
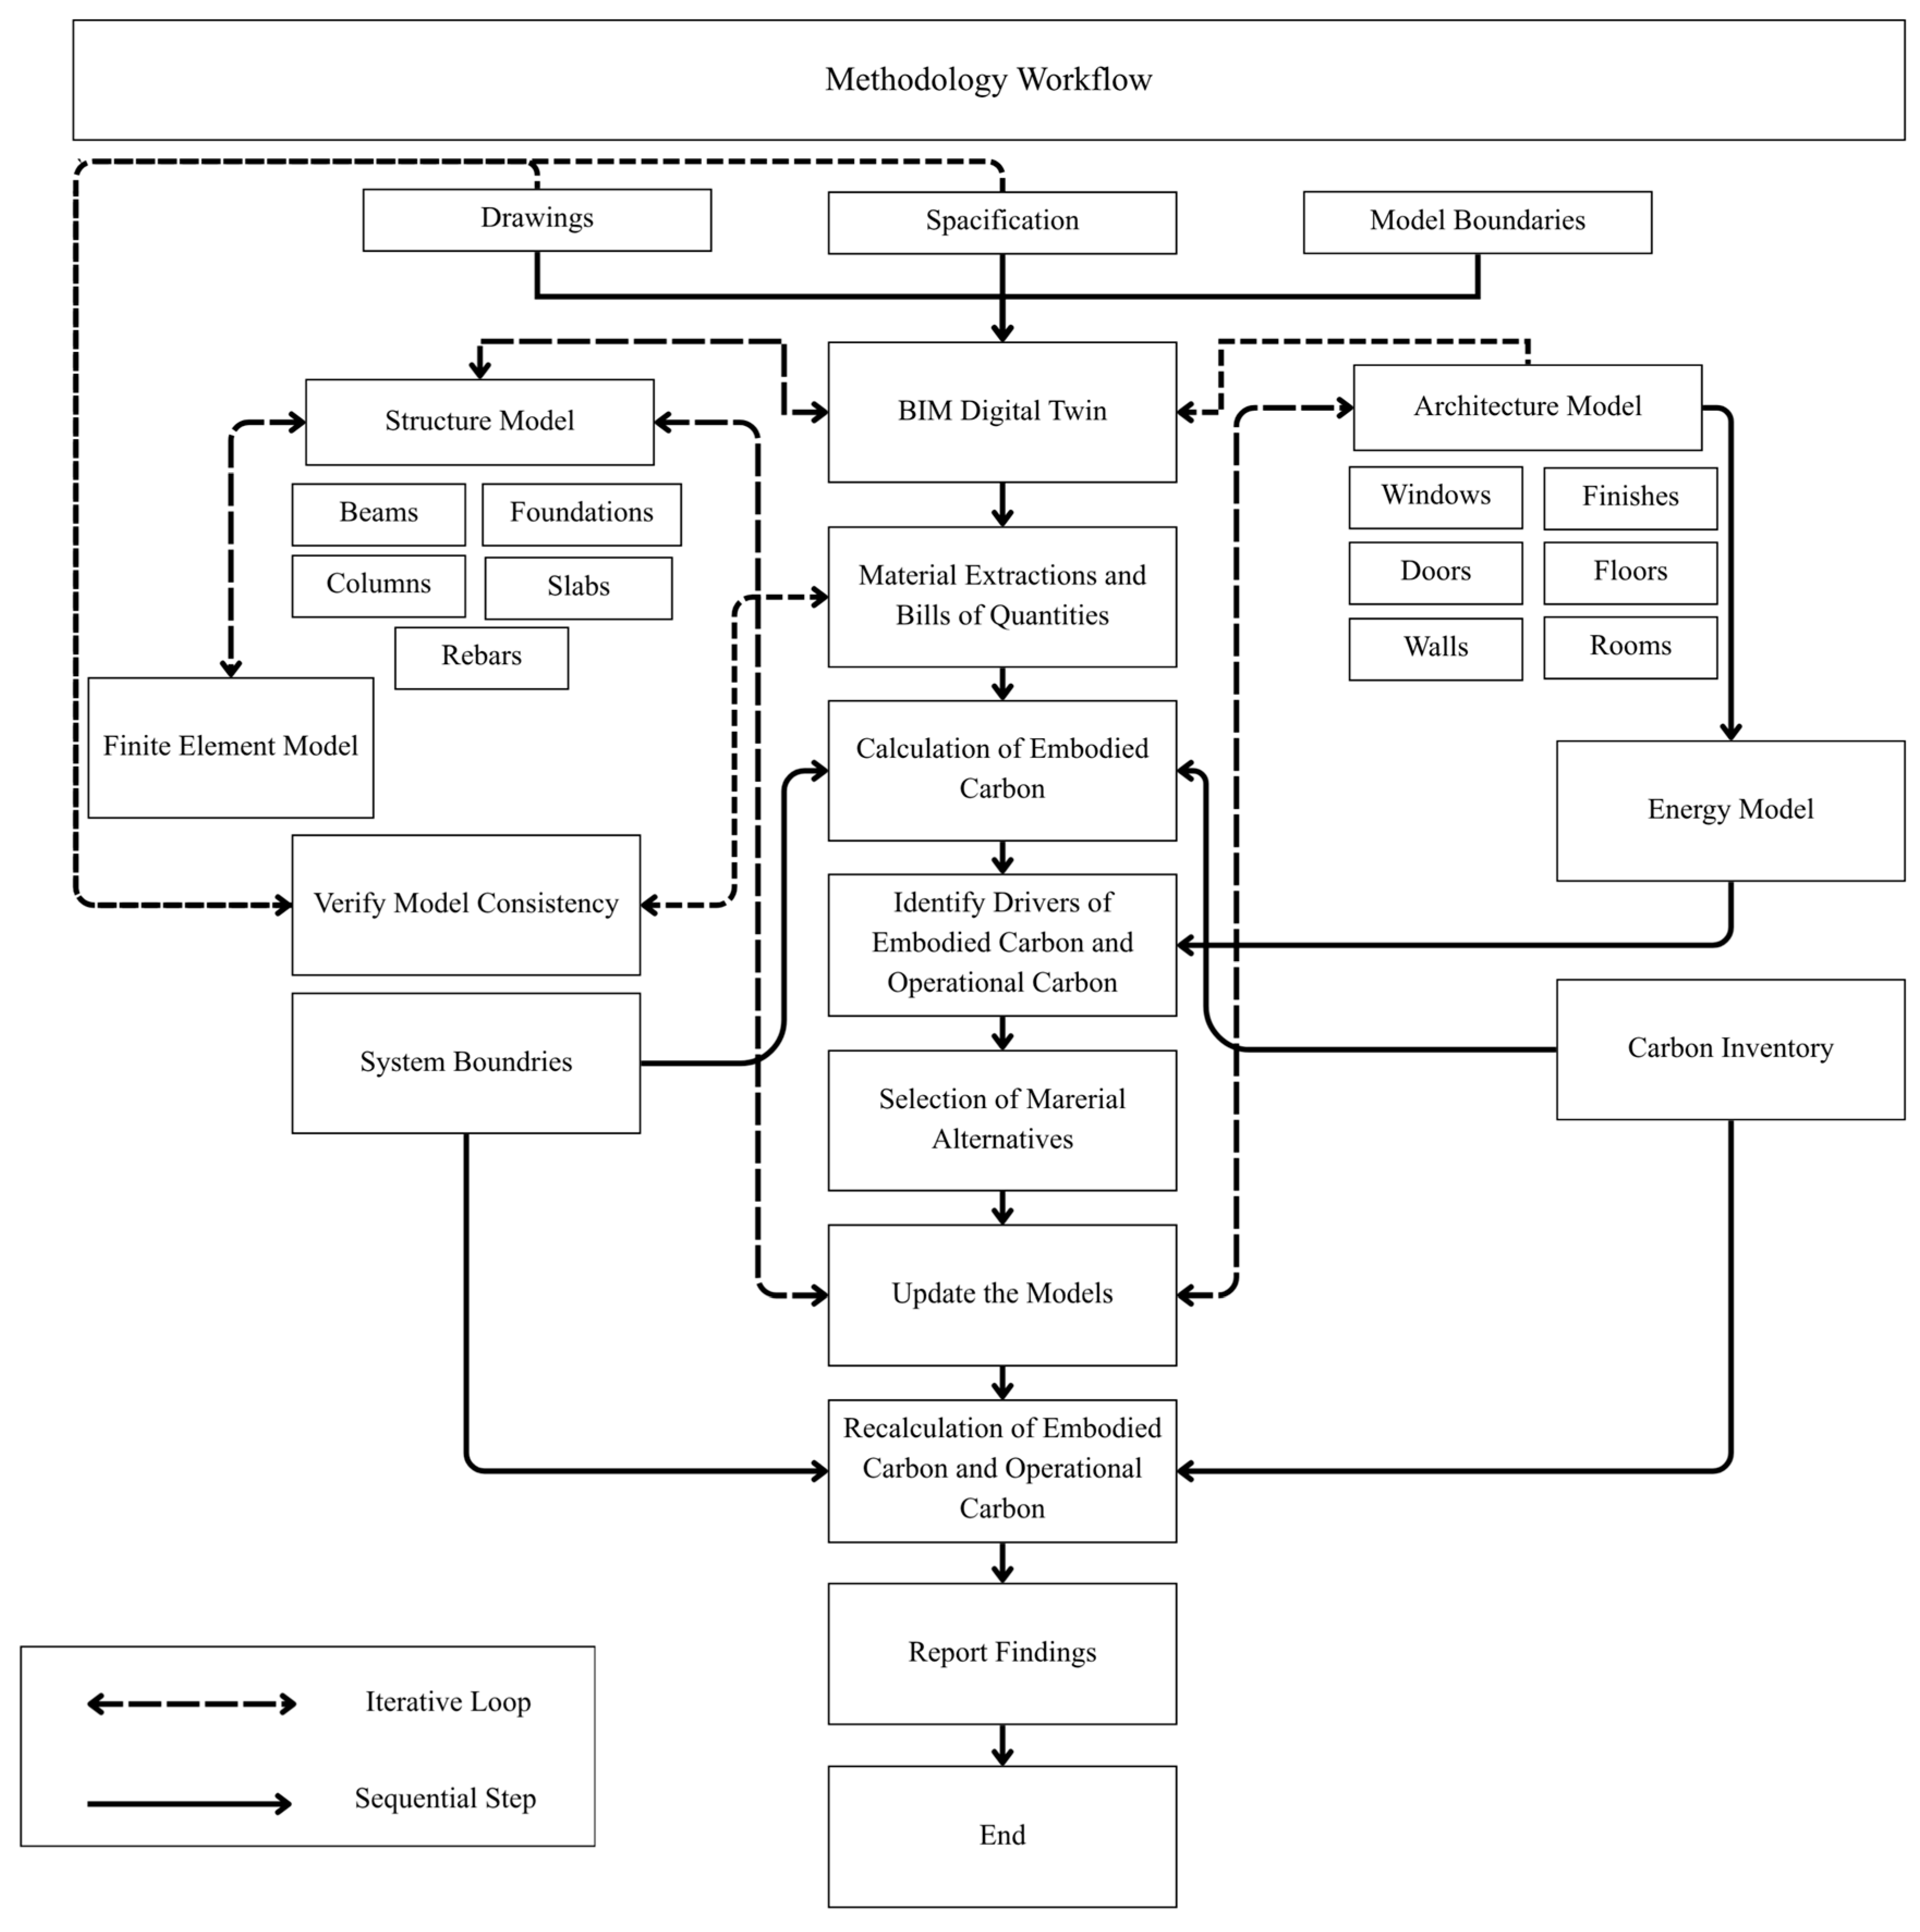
Figure 1 summarizes the workflow for converting project drawings and specifications into a verified building representation and quantifying embodied and operational carbon. The workflow integrates BIM-based quantity take-off, product-stage embodied-carbon assessment, finite-element structural assessment, and whole-building energy simulation. Architectural and structural models were coordinated to support consistent material definition, quantity extraction, and performance evaluation. Contribution analysis was then used to identify the dominant carbon drivers and to define the scope of scenario testing. The integrated workflow was structured to support a sustainability-oriented assessment of wall-system alternatives by linking material demand, structural response, operational energy use, and carbon outcomes within a single framework. The BIM-based digital twin was developed using Autodesk Revit 2025 (Autodesk, Inc., San Francisco, CA, USA). Structural analysis and design checks were carried out using ETABS v22.7.0 and SAFE v22.7.0 (Computers and Structures, Inc., Walnut Creek, CA, USA).
A BIM-based digital twin was developed to support material quantification and cradle-to-gate embodied-carbon assessment, consistent with ISO 14040 and ISO 14044 [
33,
34,
35]. Each modeled element was linked to a material specification and an associated inventory dataset through a consistent classification and mapping structure. This reduced ambiguity in material attribution and supported the extraction of repeatable quantities in the BIM-LCA workflow [
36].
The structural model represented the load-resisting system and the associated concrete and steel quantities defined by the design documents. Reinforcement was explicitly modeled to avoid reliance on assumed reinforcement ratios and to improve the resolution of steel quantities. A structural assessment was conducted to verify code compliance with respect to strength and serviceability. Load actions and combinations followed ECP 201:2012 [
37], while member design and reinforcement provisions followed ECP 203:2018, fourth edition [
38]. Verification was performed by comparing analytical demand and required reinforcement with the reinforcement detailing shown in the structural drawings.
Quantity take-off was used to compile the material inventory for carbon and cost assessment. BIM-derived quantities were verified against an independent manual BOQ take-off from tender drawings and tracked material consumption during construction. Deviations across the principal material groups were generally within 3% to 5%, supporting the model’s reliability for design-stage assessment.
Operational performance was assessed using whole-building energy simulation with a heat-balance approach to estimate the annual cooling energy intensity (kWh/m
2·y) from envelope properties, internal gains, and climate. The simulation framework followed ISO 52000–series principles, with ASHRAE Standard 140 used as the reference validation framework [
39]. Envelope alternatives were compared against an ASHRAE Standard 90.1 baseline under controlled assumptions [
40]. The principal simulation inputs, including occupancy schedules, cooling setpoints, internal gains, operating hours, climate data, and thermal property inputs, are reported in the
Supplementary Materials to support transparency and reproducibility.
Operational carbon was calculated by converting modeled annual electricity use to CO
2e using location-specific emission factors, consistent with EN 15978 and ISO 14067 [
41,
42]. Embodied carbon was assessed for the product stage only (Modules A1 to A3) by linking verified material quantities to emission factors with the same boundary. EN 15804 and A2 GWP total values were used where available. System boundaries, including modules, exclusions, reporting units, and calculation steps, are summarized in
Table 1 and
Table 2.
Quantities were matched to emission factors using unit-consistent rules within the BOQ classification structure. Volume-based quantities were converted to mass using material densities when emission factors were reported in kgCO
2e/kg. Area-based factors were used only where the source data were defined per unit area, such as paint in kgCO
2e/m
2. EN 15804–aligned environmental product declarations were preferred when available, while established databases and peer-reviewed A1 to A3 sources were used as secondary references [
43,
44]. A consistent Egypt-specific embodied-carbon dataset was not available for all assessed materials. Secondary international sources were therefore used as proxy references within a unified A1–A3 boundary. These factors supported a comparative evaluation of wall system alternatives rather than an exact national representation of embodied-carbon values for Egypt. Differences in electricity mix, fuel use, and manufacturing efficiency between Egypt and the source regions may affect absolute results and should be considered when interpreting results.
Key embodied-carbon drivers were identified through A1–A3 contribution analysis during the interpretation stage, consistent with ISO 14044. Each material or BOQ-aligned group was assigned an embodied-carbon value (
ECi) ranked in descending order and expressed as a share of total embodied carbon using Equation (1):
where
pi is the contribution share of material or group
i, and
Pk is the cumulative contribution of the top
k-ranked contributors. Scenario testing was then focused on the smallest subset whose cumulative share exceeded 80% of the total embodied carbon. Materials outside this dominant-contributor subset were not treated as primary scenario variables.
Operational carbon was grouped into cooling, lighting, and equipment end uses and assessed by contribution. Because cooling was the dominant operational carbon driver, scenario testing focused on wall system thermal performance while keeping building orientation and opening geometry fixed.
Alternative wall systems were then evaluated through scenario-based material substitution. Each material alternative was applied to the BIM-based digital twin to generate a revised case. The structural model was updated for changes in wall dead load and material properties, then reassessed to confirm code compliance and quantify changes in internal forces, reinforcement demand, and concrete quantities [
45]. The structural reassessment also considered seismic response indicators associated with wall density variation, and the detailed comparative results are provided in the
Supplementary Materials. This step was intended to trace the structural-material consequences of wall substitution within the defined structural workflow. Where member geometry was kept fixed, this was done to isolate the effect of wall system substitution on structural demand and material quantities with a controlled comparison basis. Member resizing was not introduced as an additional scenario variable because it may reduce concrete volume while increasing reinforcement demand. In the Egyptian context, this trade-off is especially important because reinforcement quantity is highly cost-sensitive and strongly depends on the supply of imported steel, thereby increasing exposure to foreign-exchange pressure. The architectural and energy models were updated for revised wall thickness and thermal conductivity. For each scenario, A1 to A3 embodied carbon was recalculated from the revised quantity take-off, operational energy was recomputed and converted to operational carbon, and cost and construction time were updated from scenario-specific quantities and material selections. This enabled consistent comparison of embodied carbon, operational carbon, cost, and execution time across the tested wall systems [
46,
47,
48].
3. Case Study Description, Model Definition, and Scenario Results
Two Egyptian multi-unit residential case studies were selected to represent affordable and middle-class housing. The affordable housing project consists of a ground floor, five typical floors, and a roof, with four apartments on each floor, giving a total of 24 units. Each apartment has a built-up area of about 74 m
2 and includes three bedrooms, a living room, a kitchen, and a toilet, reflecting a typical Egyptian family layout [
49]. The total built-up area is 2006 m
2, the typical floor height is 3.0 m, and the overall building height is 20.7 m.
The middle-class housing project also consists of a ground floor, five typical floors, and a roof, with four apartments on each floor, again totaling 24 units. Apartment sizes range from 68 m
2 to 113 m
2. The total built-up area is 3067 m
2, the typical floor height is 3.0 m, and the overall building height is 22.0 m. Both buildings use reinforced concrete moment-resisting frame systems for vertical and lateral load resistance. Their main characteristics are summarized in
Table 3.
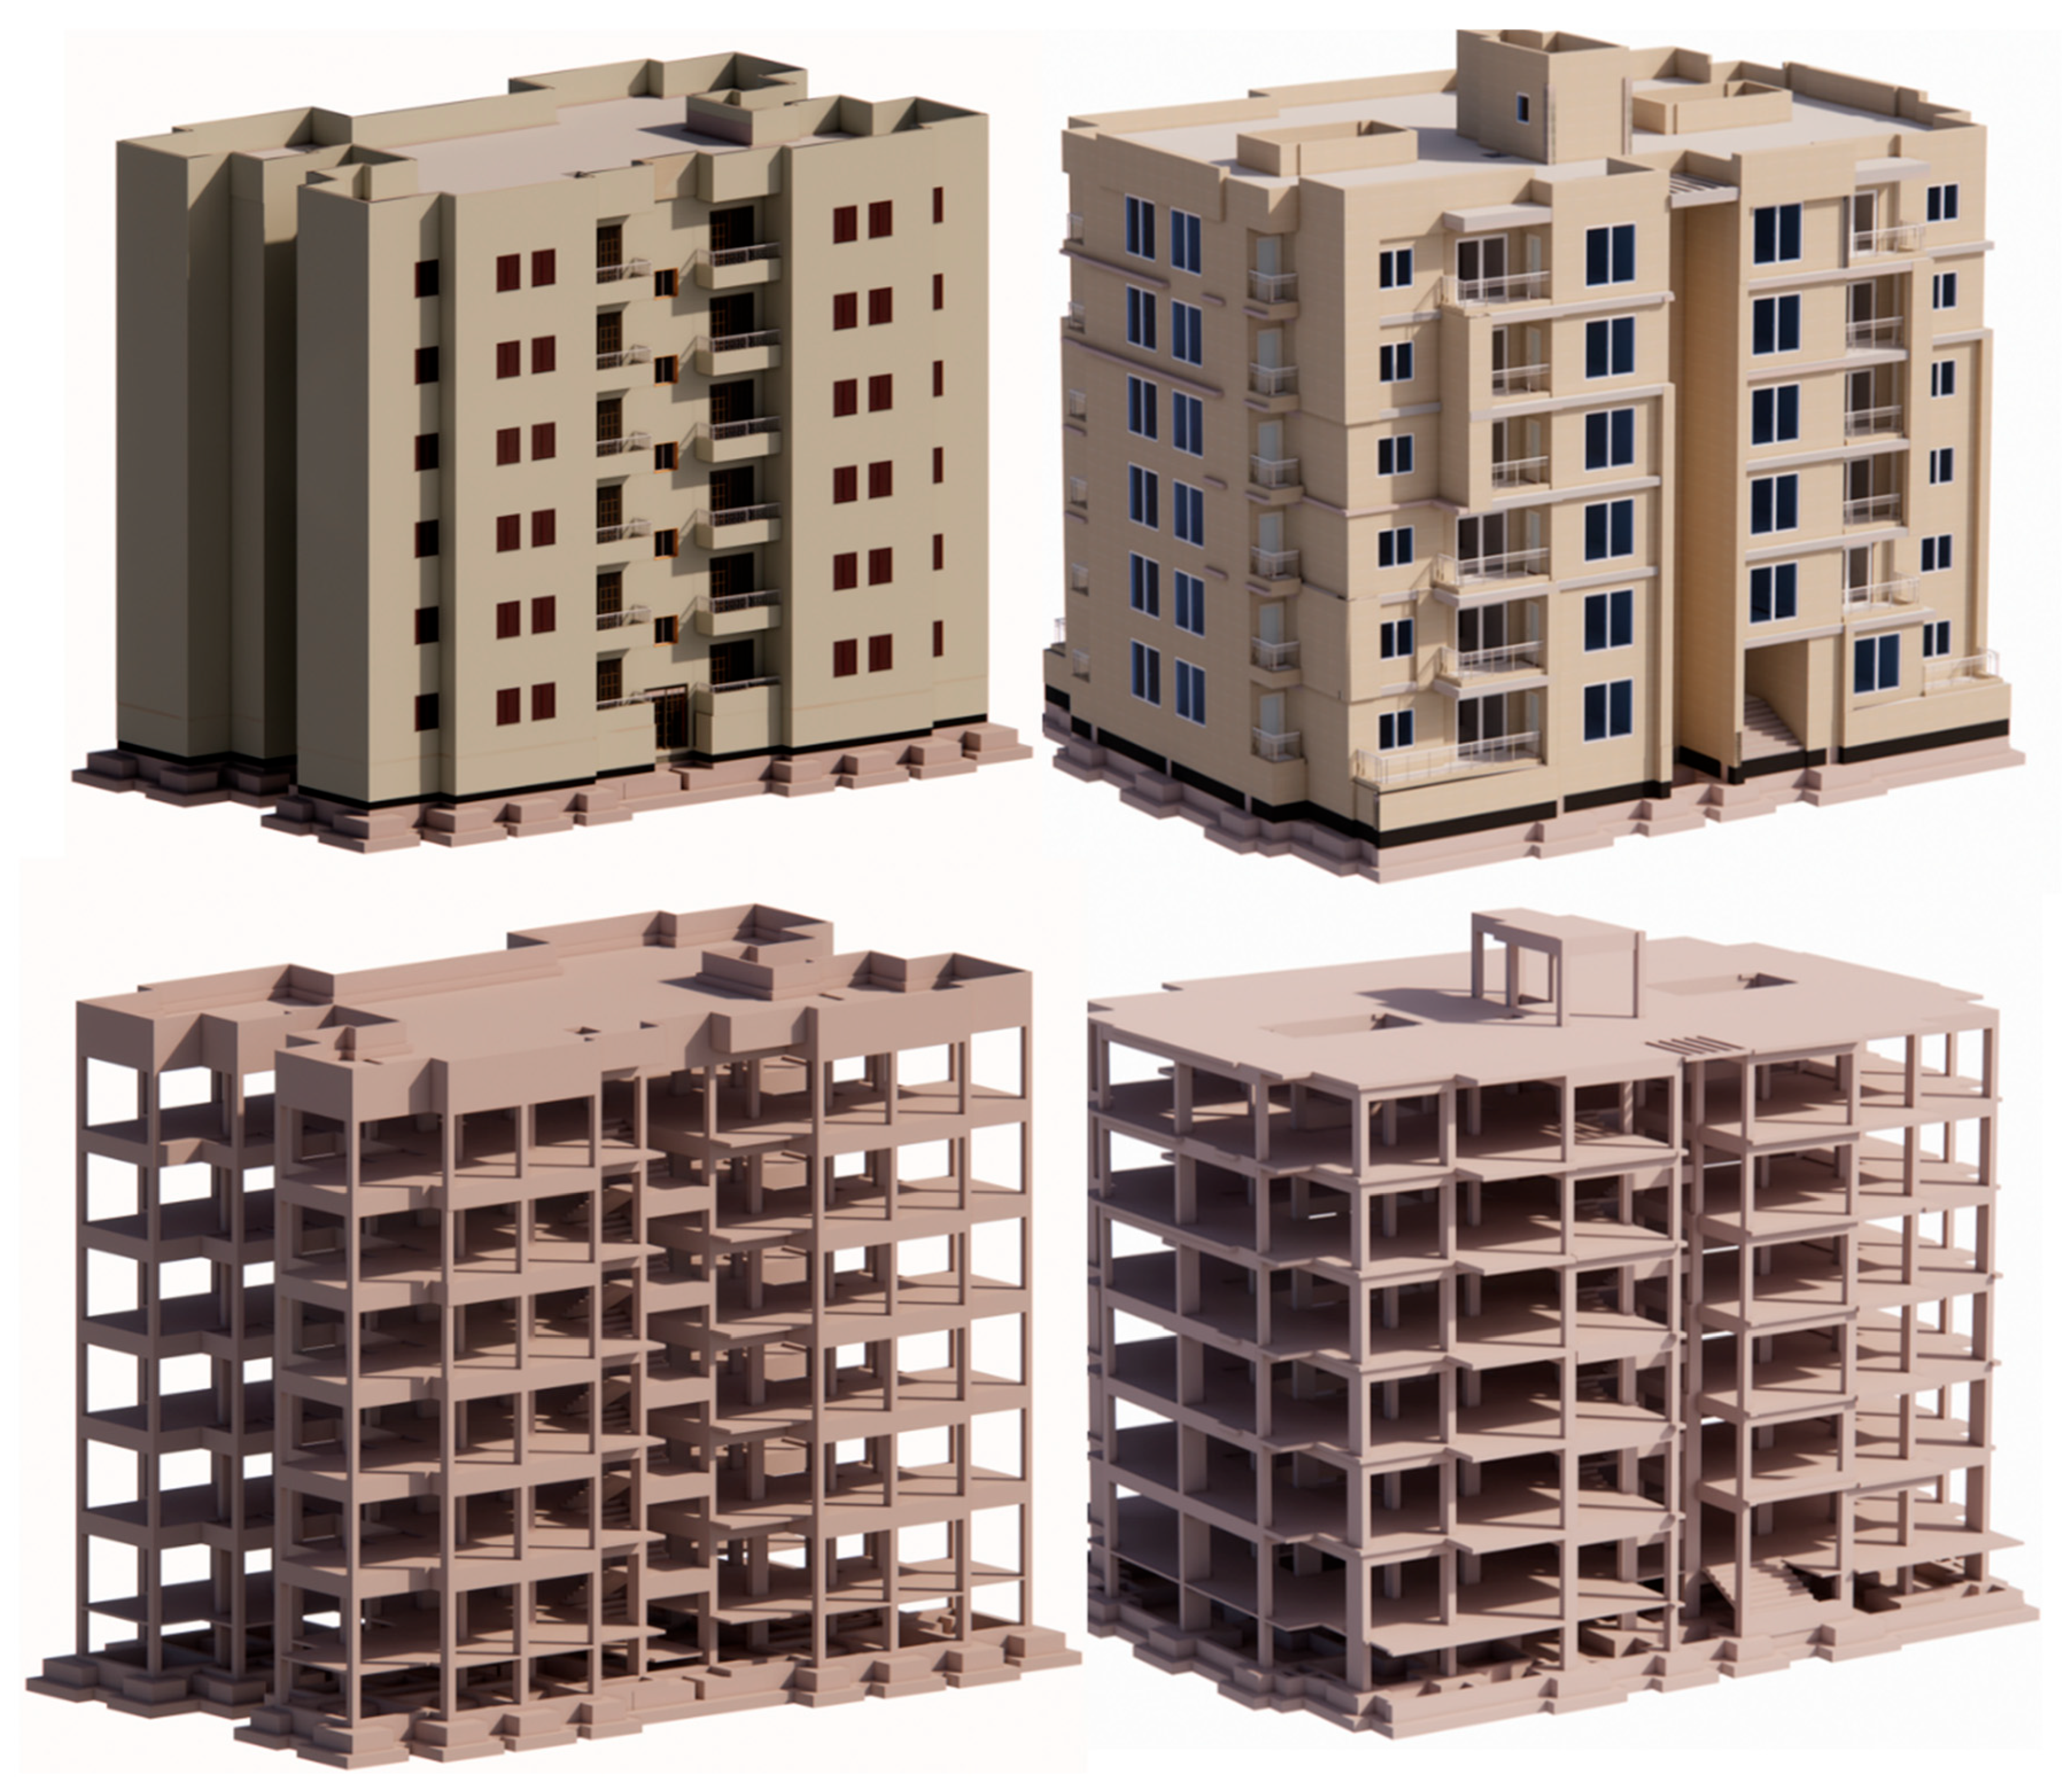
The drawings for both case studies were converted into coordinated BIM models. Separate architectural and structural models were developed from the original drawings and specifications, then combined into an integrated BIM-based digital twin for quantity take-off, embodied-carbon assessment, and energy simulation [
50] to evaluate and optimize both embodied and operational carbon.
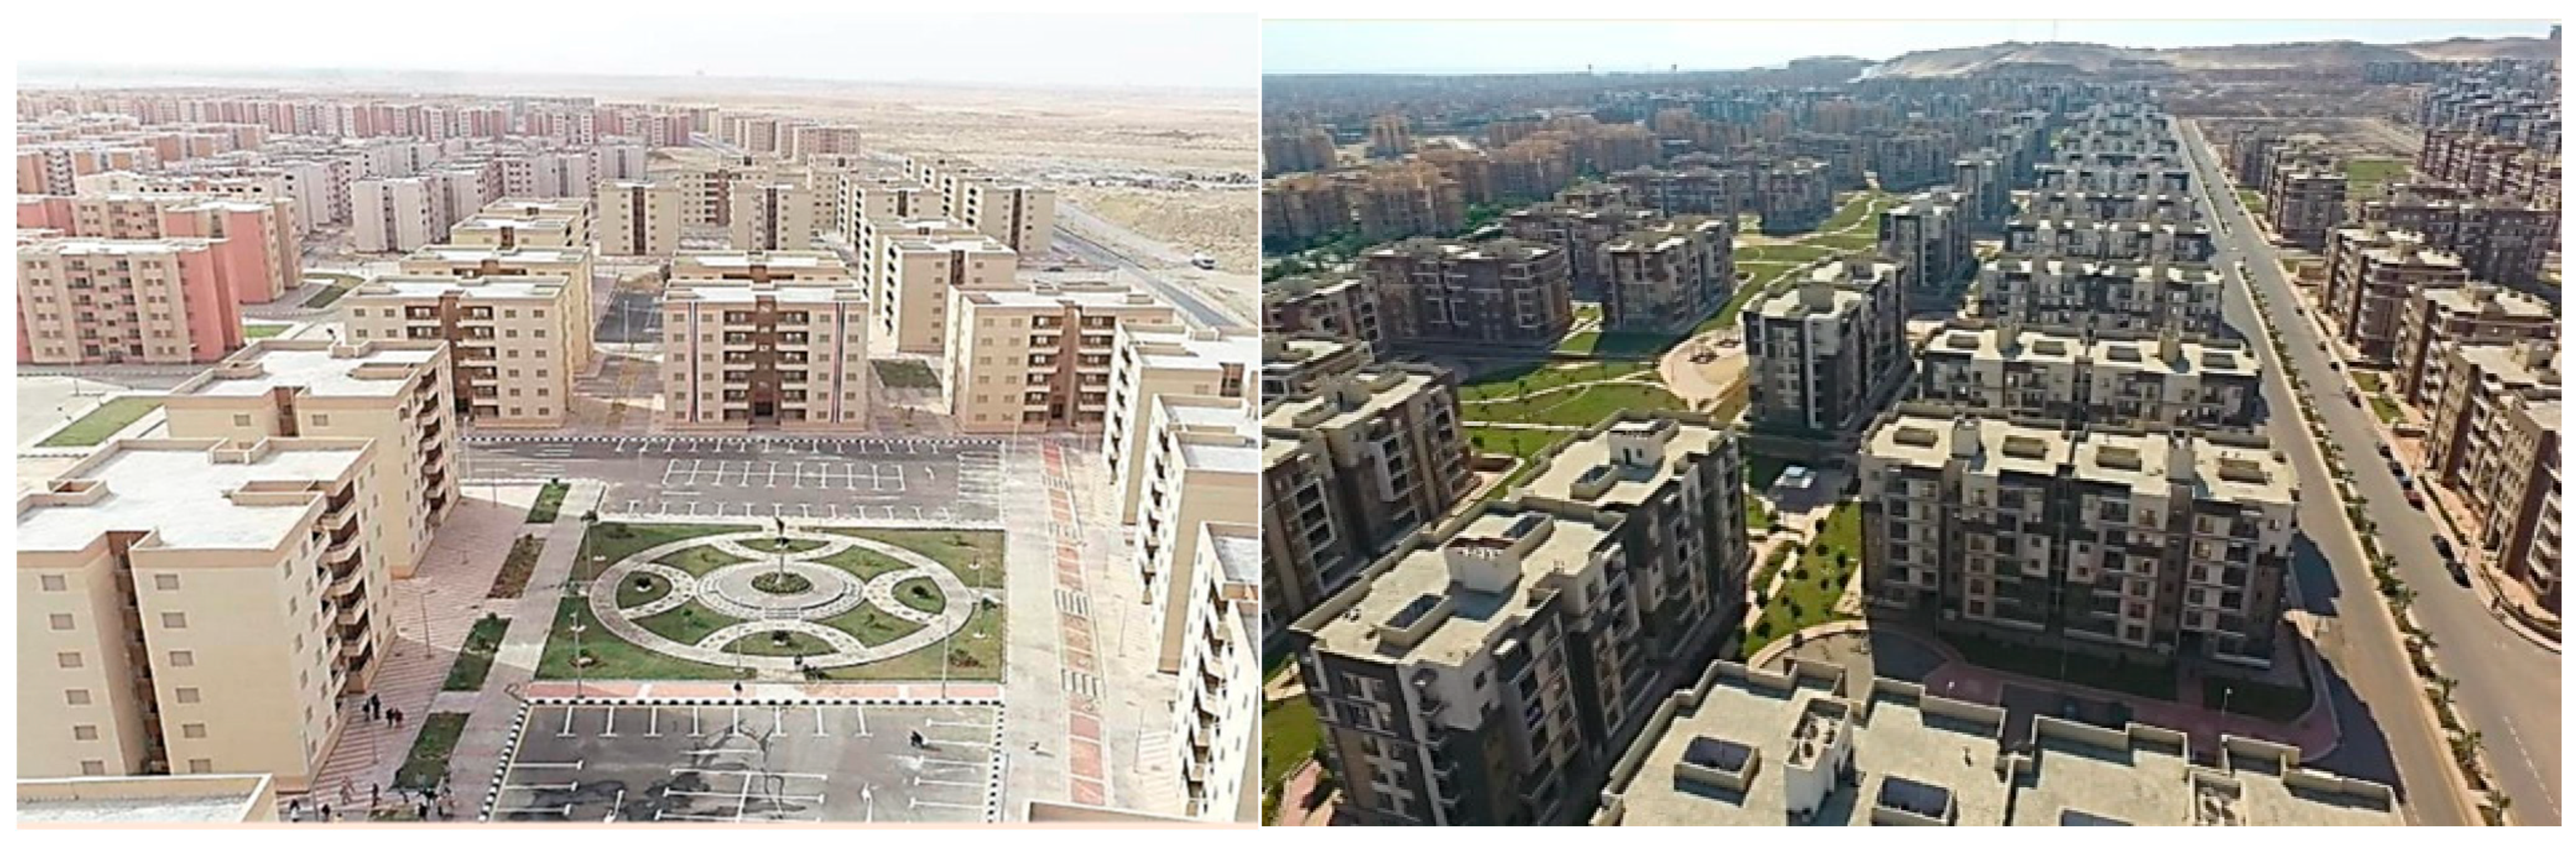
Figure 2 shows the built projects, and
Figure 3 illustrates the corresponding BIM models.
Manual quantity take-off from 2D drawings can introduce significant error, especially in repetitive layouts and reinforcement-dense structures [
51]. BIM-based take-off reduces this uncertainty by extracting quantities from a coordinated parametric model, with much smaller reported deviations [
52]. The same model also provides consistent geometry and material inputs for operational energy analysis.
Architectural and structural CAD drawings were rebuilt into a coordinated BIM model, including levels, grids, slabs, beams, columns, walls, openings, and the main material assignments for concrete, reinforcement, masonry, finishes, and insulation. The structural model was aligned with the architectural model, and the integrated model was then used to extract concrete and reinforcement quantities and to define the wall system scenarios for life-cycle carbon assessment [
53].
Embodied-carbon factors were assigned using the Inventory of Carbon and Energy as the primary source for product-stage material data [
43,
44]. Each BIM-modeled material was matched to the closest inventory category based on density, composition, and production route. Because these data are cradle-to-gate, material quantities were evaluated within the A1-A3 boundary used in this study.
Material quantities extracted from the BIM model were adjusted using material-specific waste factors to account for typical site losses during cutting, handling, and installation. This step was necessary to avoid underestimating actual material demand in the carbon and cost calculations.
3.1. Baseline Embodied-Carbon Profile: Affordable Housing Case
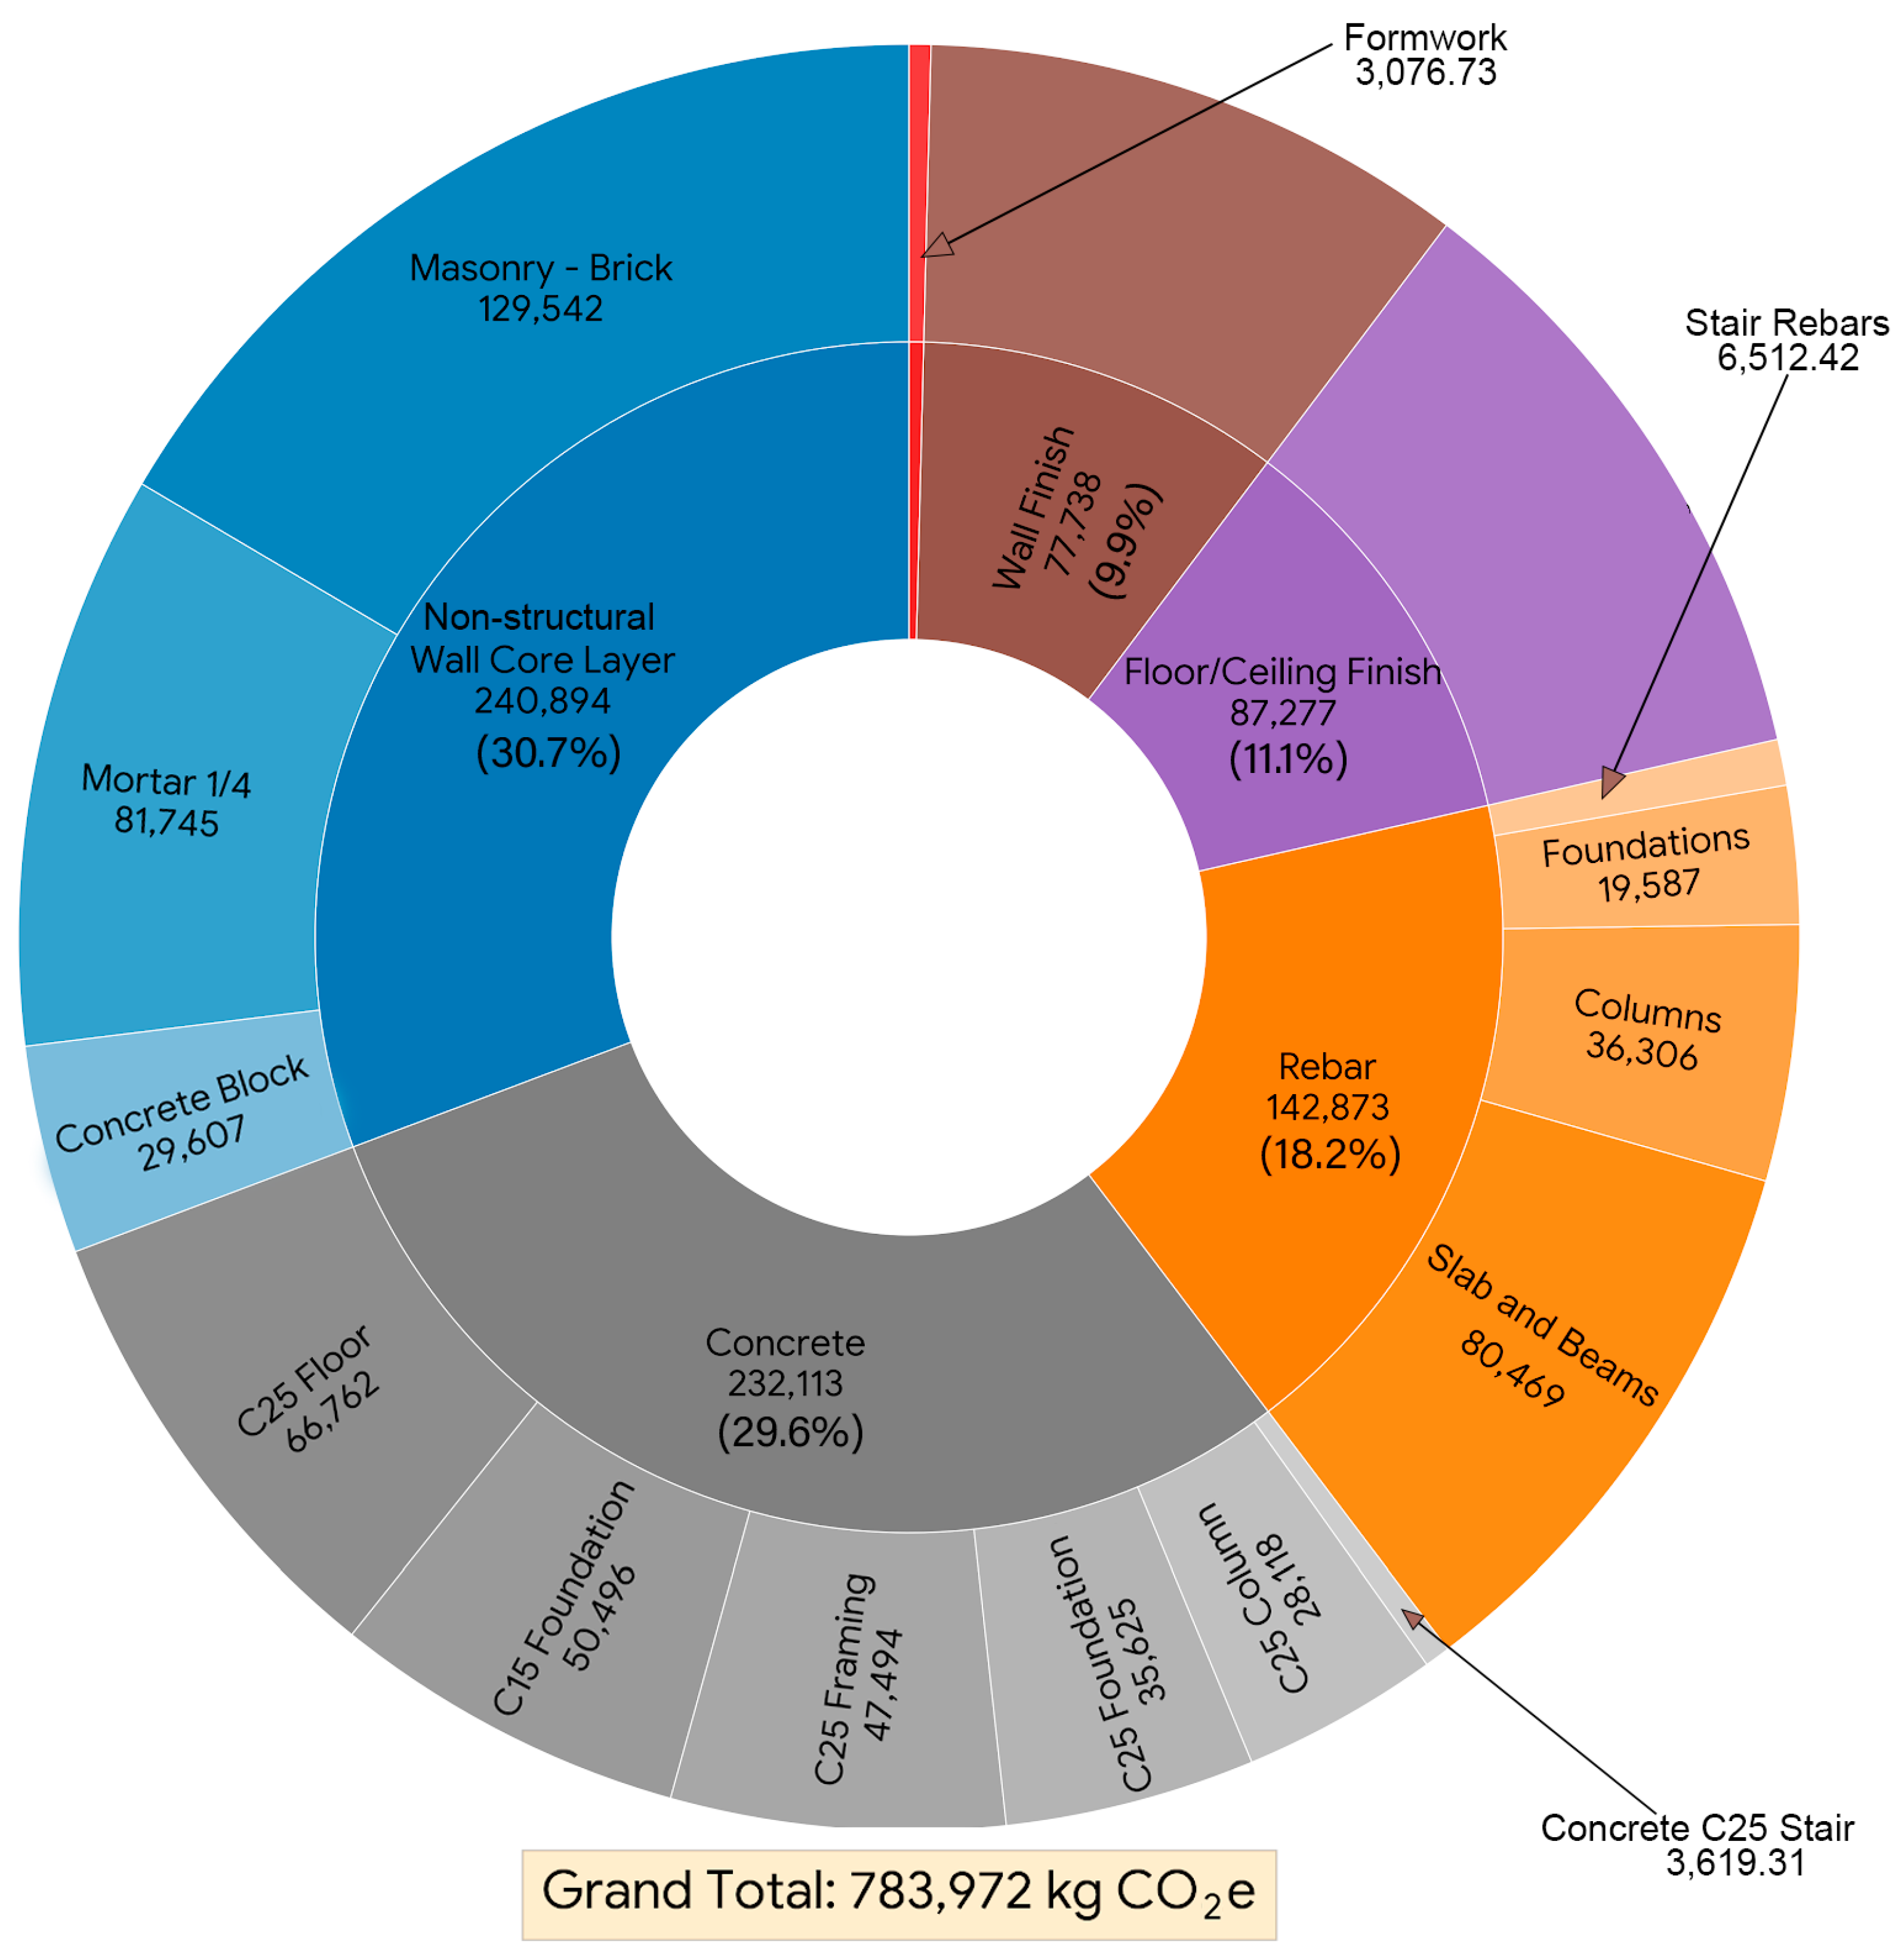
The affordable housing case has a total embodied carbon of 783,972 kgCO
2e within the assessed scope.
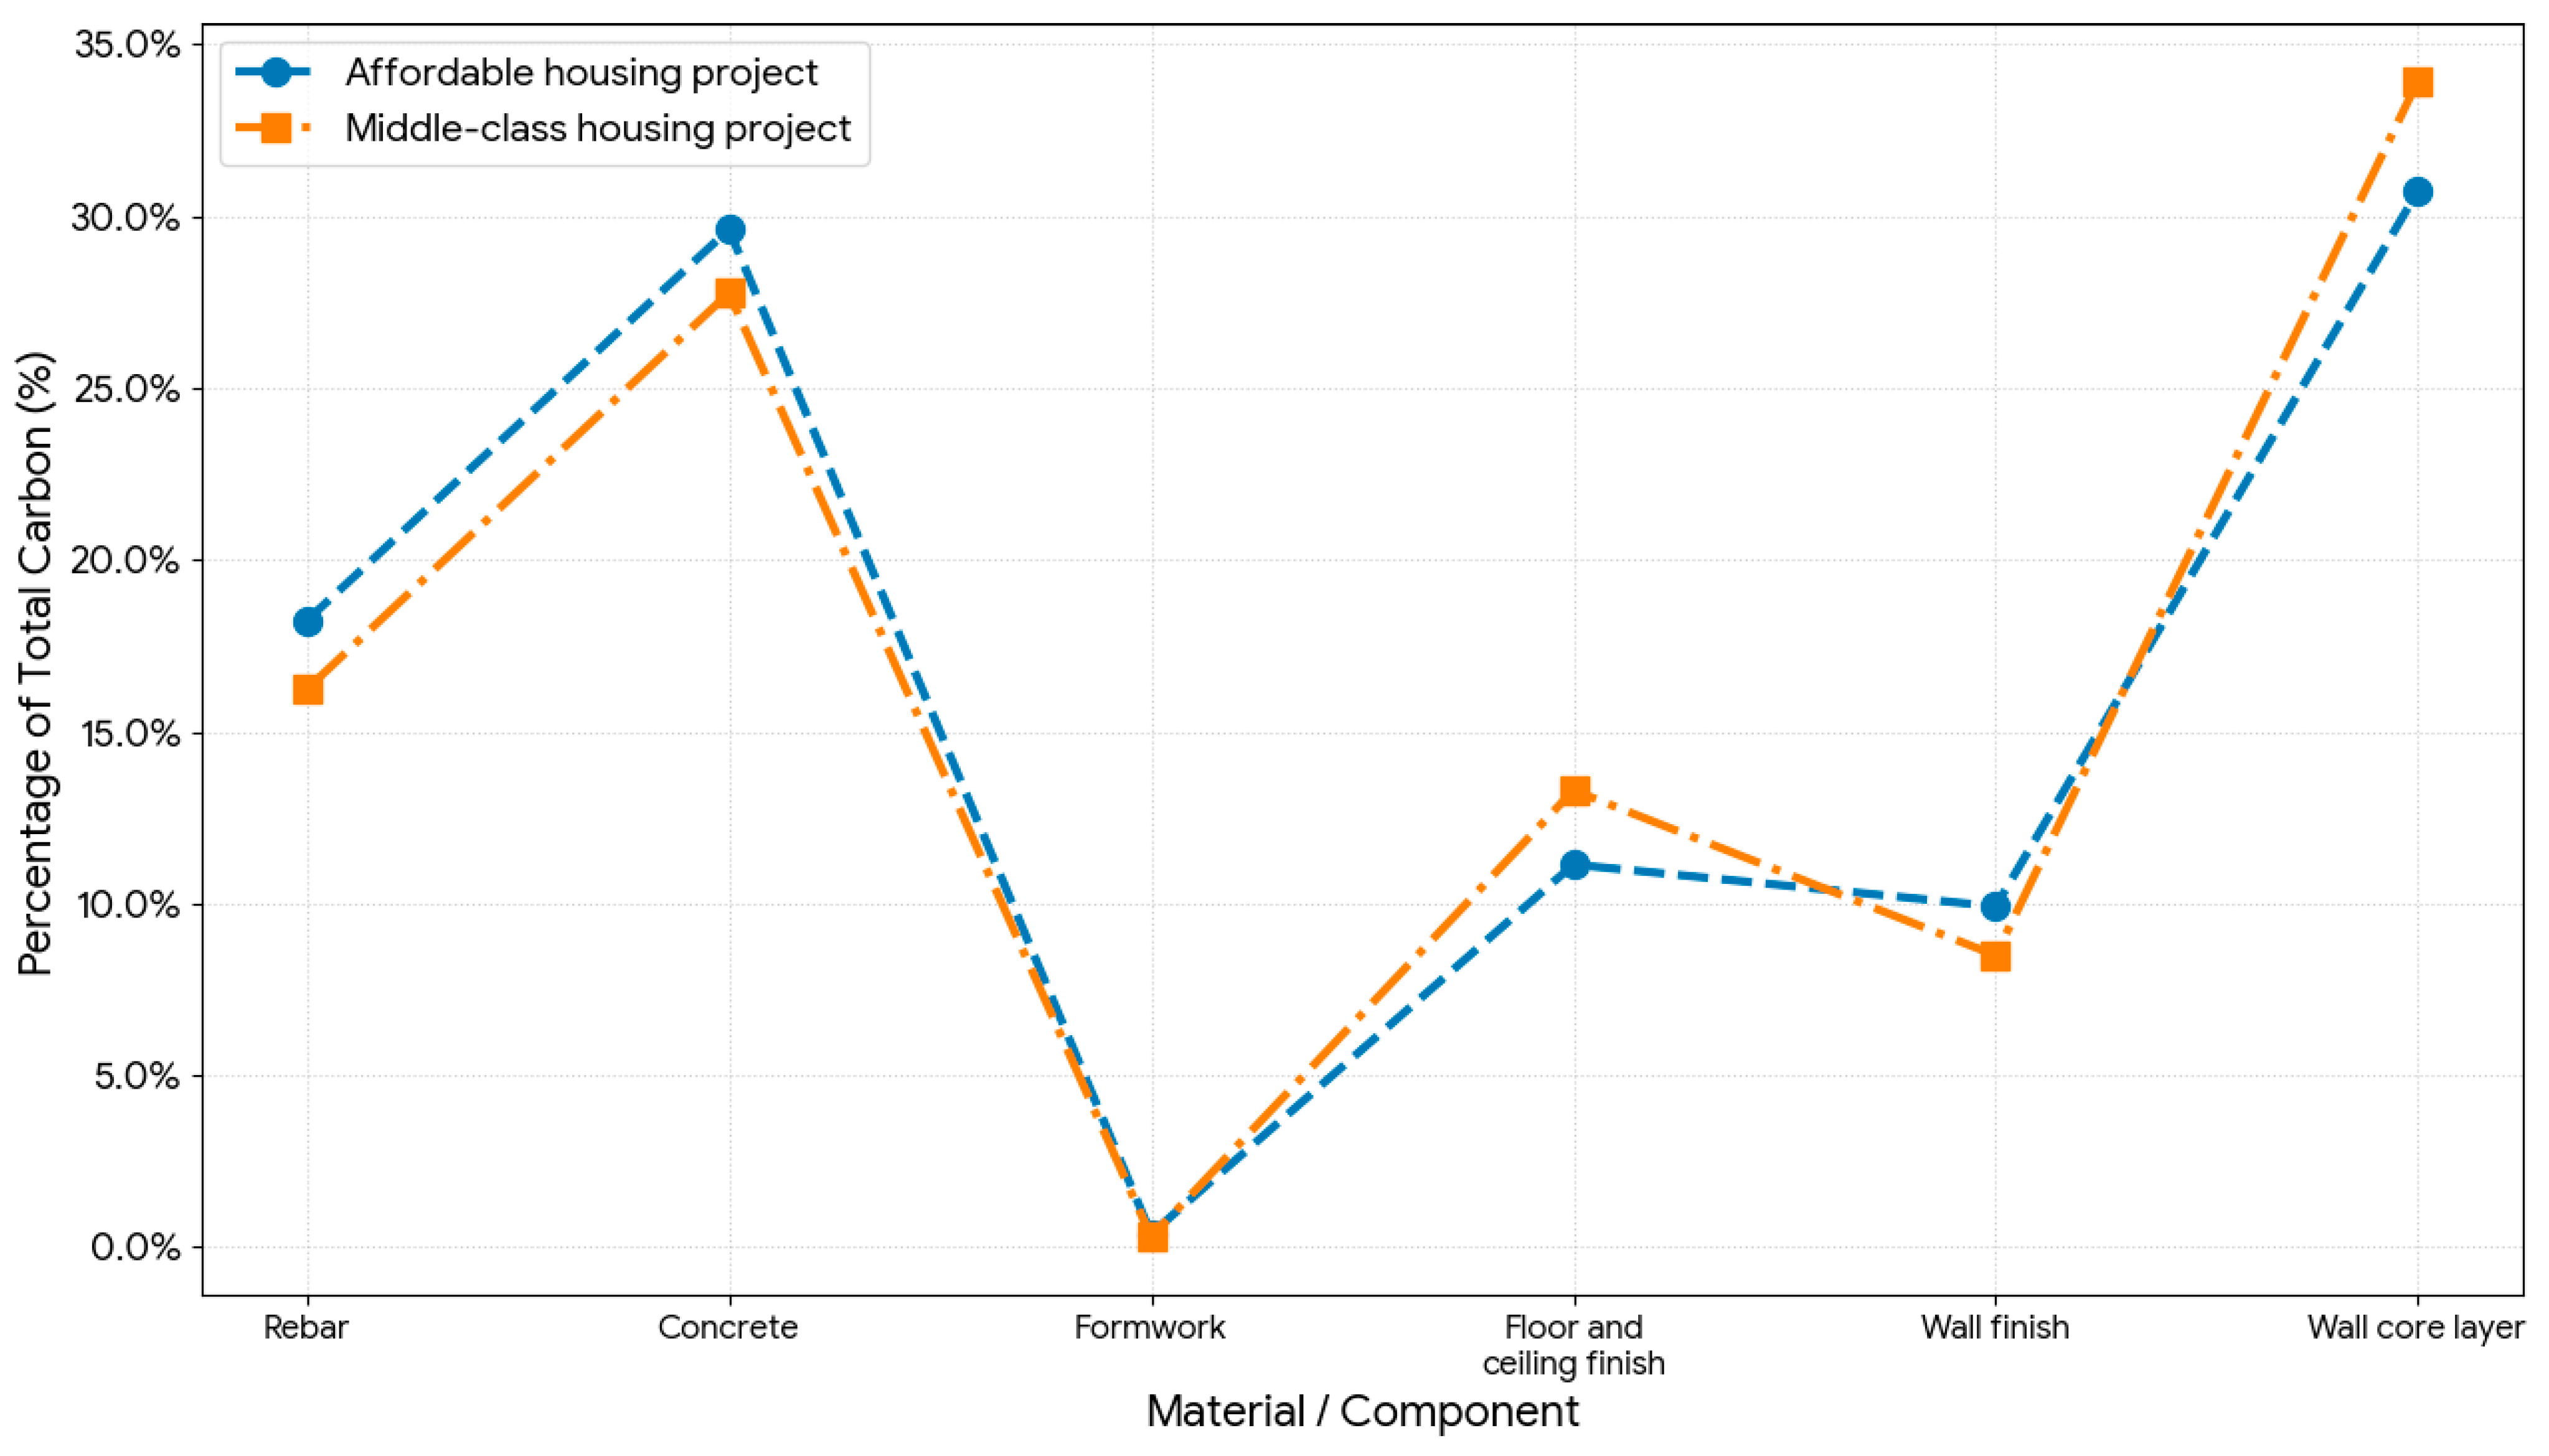
Figure 4 shows that wall core materials and concrete are the two dominant contributors, accounting for 30.7% and 29.6% of the total, respectively. Reinforcement contributes 18.2%, while floor and ceiling finishes account for 11.1%, wall finishes 9.9%, and formwork only 0.4%. Taken together, non-structural components, including wall core materials, finishes, and formwork, account for about 52% of total embodied carbon, while the structural frame, concrete, and reinforcement account for about 48%.
Within the wall core category, fired brick is the largest contributor at 129,542 kgCO2e, equal to 53.8% of wall core embodied carbon and about 16.5% of the total building footprint. Mortar contributes 81,745 kgCO2e, or 33.9% of the wall core embodied carbon and 10.4% of the total. Concrete block contributes 29,607 kgCO2e, or 12.3% of the wall core total. These results show that traditional masonry, especially brick and mortar together, is a major source of embodied carbon in the affordable housing prototype.
Concrete embodied carbon is distributed across several structural elements rather than being dominated by a single element. The C25 floor slab is the single largest concrete contributor, at 68,762 kgCO2e, accounting for 29.6% of concrete embodied carbon and 8.8% of the total building footprint. Foundations in C15 and C25 together contribute more than 86,000 kgCO2e, while structural framing contributes about 41,494 kgCO2e and columns about 25,118 kgCO2e. This indicates that concrete reduction cannot be achieved through one element alone, because floors, foundations, framing, and columns all contribute materially to the total.
The distribution of reinforcement differs from that of concrete. About 61% of reinforcement embodied carbon is concentrated in slabs and beams, while about 39% is associated with columns and foundations. Slab and beams reinforcement alone contribute about 80,469 kgCO2e, or 10.3% of total embodied carbon. By comparison, column and foundation reinforcement together contribute about 55,893 kgCO2e, or 7.1% of the total.
Finishes also contribute substantially. Floor and wall finishes together account for about 165,015 kgCO2e, or about 21% of total embodied carbon, which is higher than the full reinforcement category. This result shows that finishes, although often treated as secondary materials, have a building-scale carbon impact in the affordable housing case.
3.2. Baseline Embodied-Carbon Profile: Middle-Class Housing Case
The middle-class housing case has a total embodied carbon of 1,232,123 kgCO
2e within the assessed scope.
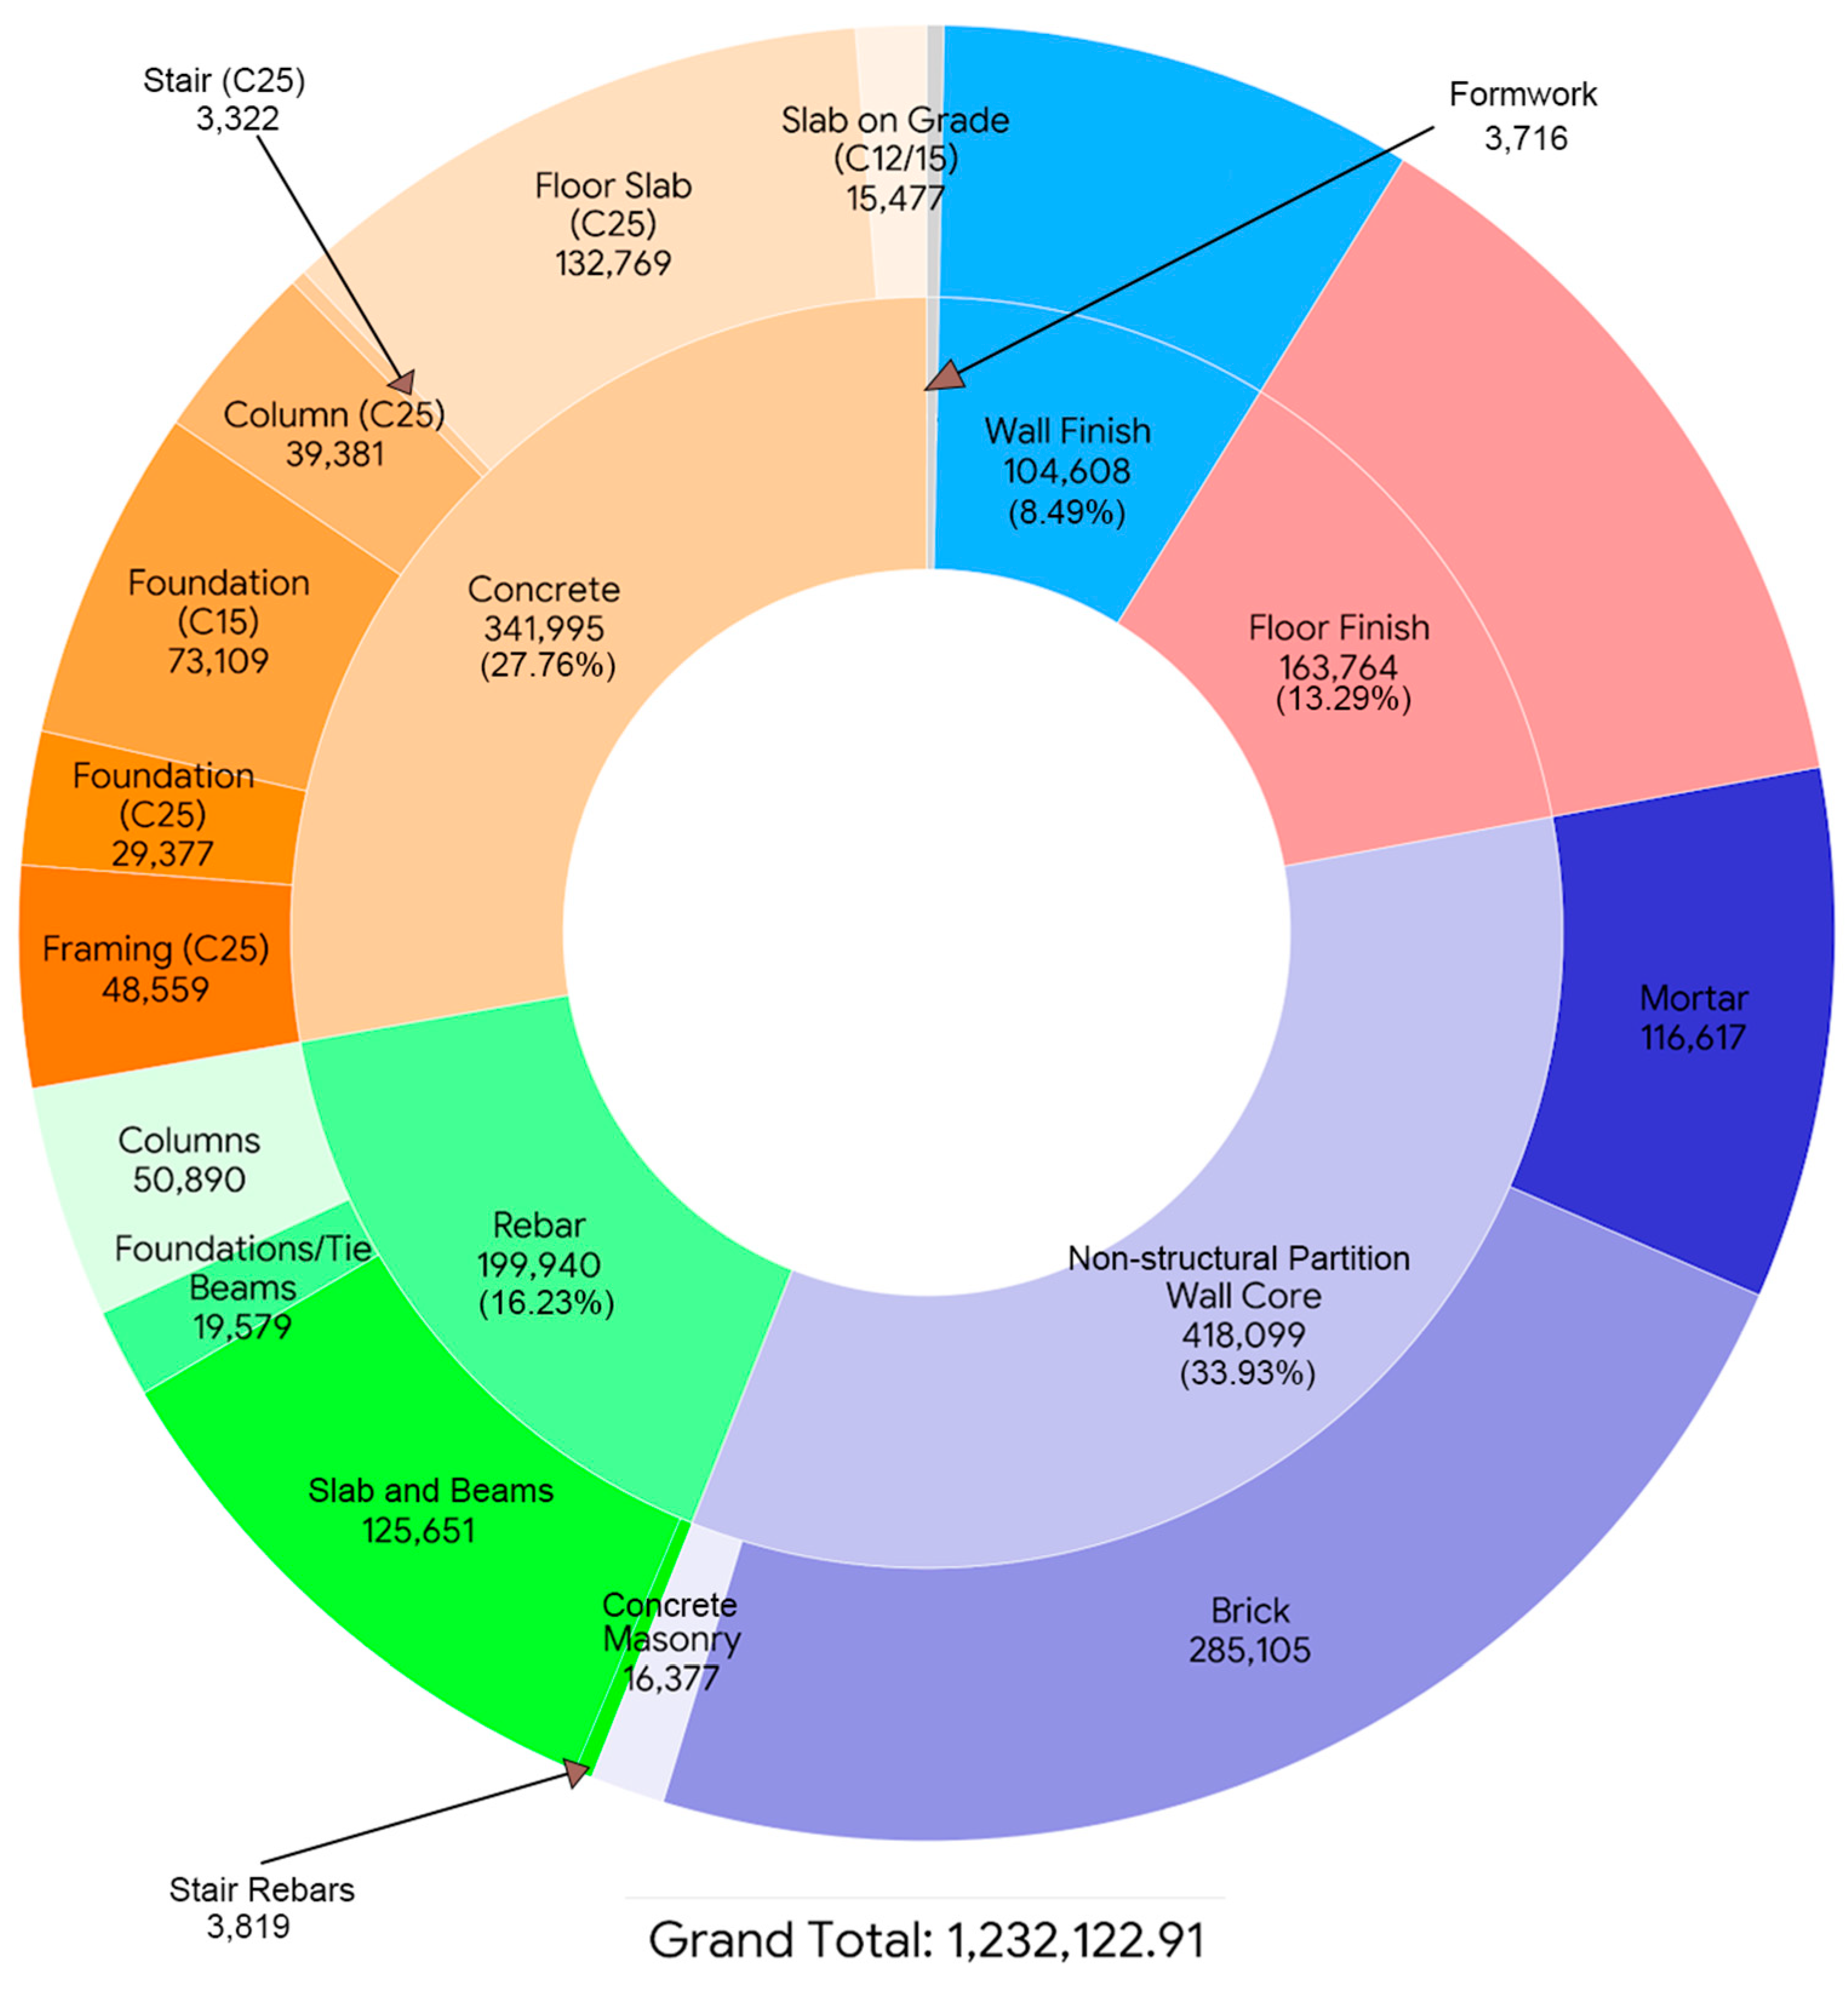
Figure 5 shows that the wall core layer is the largest contributor, at 418,099 kgCO
2e, accounting for 33.93% of the total. Concrete contributes 341,995 kgCO
2e, or 27.76%, and reinforcement contributes 199,940 kgCO
2e, or 16.23%. Wall finishes and floor, ceiling, and roofing finishes contribute 104,608 kgCO
2e and 163,764 kgCO
2e, respectively, while formwork contributes only 3717 kgCO
2e.
Taken together, the building envelope, including wall core materials and finishes, accounts for more than 55% of the total embodied carbon. This exceeds the contribution of the structural frame, concrete plus reinforcement, which accounts for about 44%. The result shows that, in the middle-class housing case, embodied carbon is controlled more strongly by envelope materials than by the reinforced concrete frame.
3.3. Cross-Case Comparison of Baseline Embodied-Carbon Drivers
Both housing types exhibit similar key contributors to embodied carbon: wall core materials, concrete, and reinforcement. Wall core materials and concrete are the primary sources in both cases. In middle-class housing, wall core materials account for 33.93% of the total embodied carbon, with concrete at 27.76%. For affordable housing, wall core materials account for 30.7%, and concrete for 29.6%. Reinforcement is the third major contributor, accounting for 16.23% in the middle-class case and 18.2% in the affordable case. Floor and wall finishes together account for roughly 22% of total embodied carbon in both scenarios, while formwork’s impact remains minimal.
Wall systems are the most consistent primary drivers across both projects. In the middle-class housing example, the wall core layer is the largest single category, representing 33.93% of the total embodied carbon. Within this category, brick makes up 68.2%, and mortar accounts for 27.9%. In the affordable housing example, brick contributes 53.8% of the wall core embodied carbon, while mortar accounts for 33.9%. These two masonry materials together produce more embodied carbon than any other individual material group and, together, near or surpass the total embodied carbon from reinforcement.
The structural frame is a key factor influencing embodied carbon. Concrete accounts for roughly 28% to 30%, and reinforcement makes up about 16% to 18% of the total. In both building types, the bulk of the concrete used comes from floor slabs. Concrete is fairly evenly distributed between horizontal and vertical structural parts, but reinforcement is predominantly found in slabs and beams. Approximately two-thirds of the reinforcement’s embodied carbon is attributable to slabs and beams, while roughly one-third is attributable to columns and foundations. This indicates that, rather than vertical supports, mainly spanning elements are responsible for most of the steel-related embodied carbon.
Finishes represent the third most consistent factor in both cases. Together, floor and wall finishes contribute roughly 21% to 22% of the total embodied carbon, surpassing the contribution of reinforcement in each building. Specifically, floor finishes alone account for about 13% of total embodied carbon in the middle-class housing case and around 11% in the affordable housing case. These findings highlight that finish materials, often considered secondary, significantly impact the building-scale carbon footprint in both housing types, as illustrated in
Figure 6.
3.4. Structural Response to Wall Density Reduction
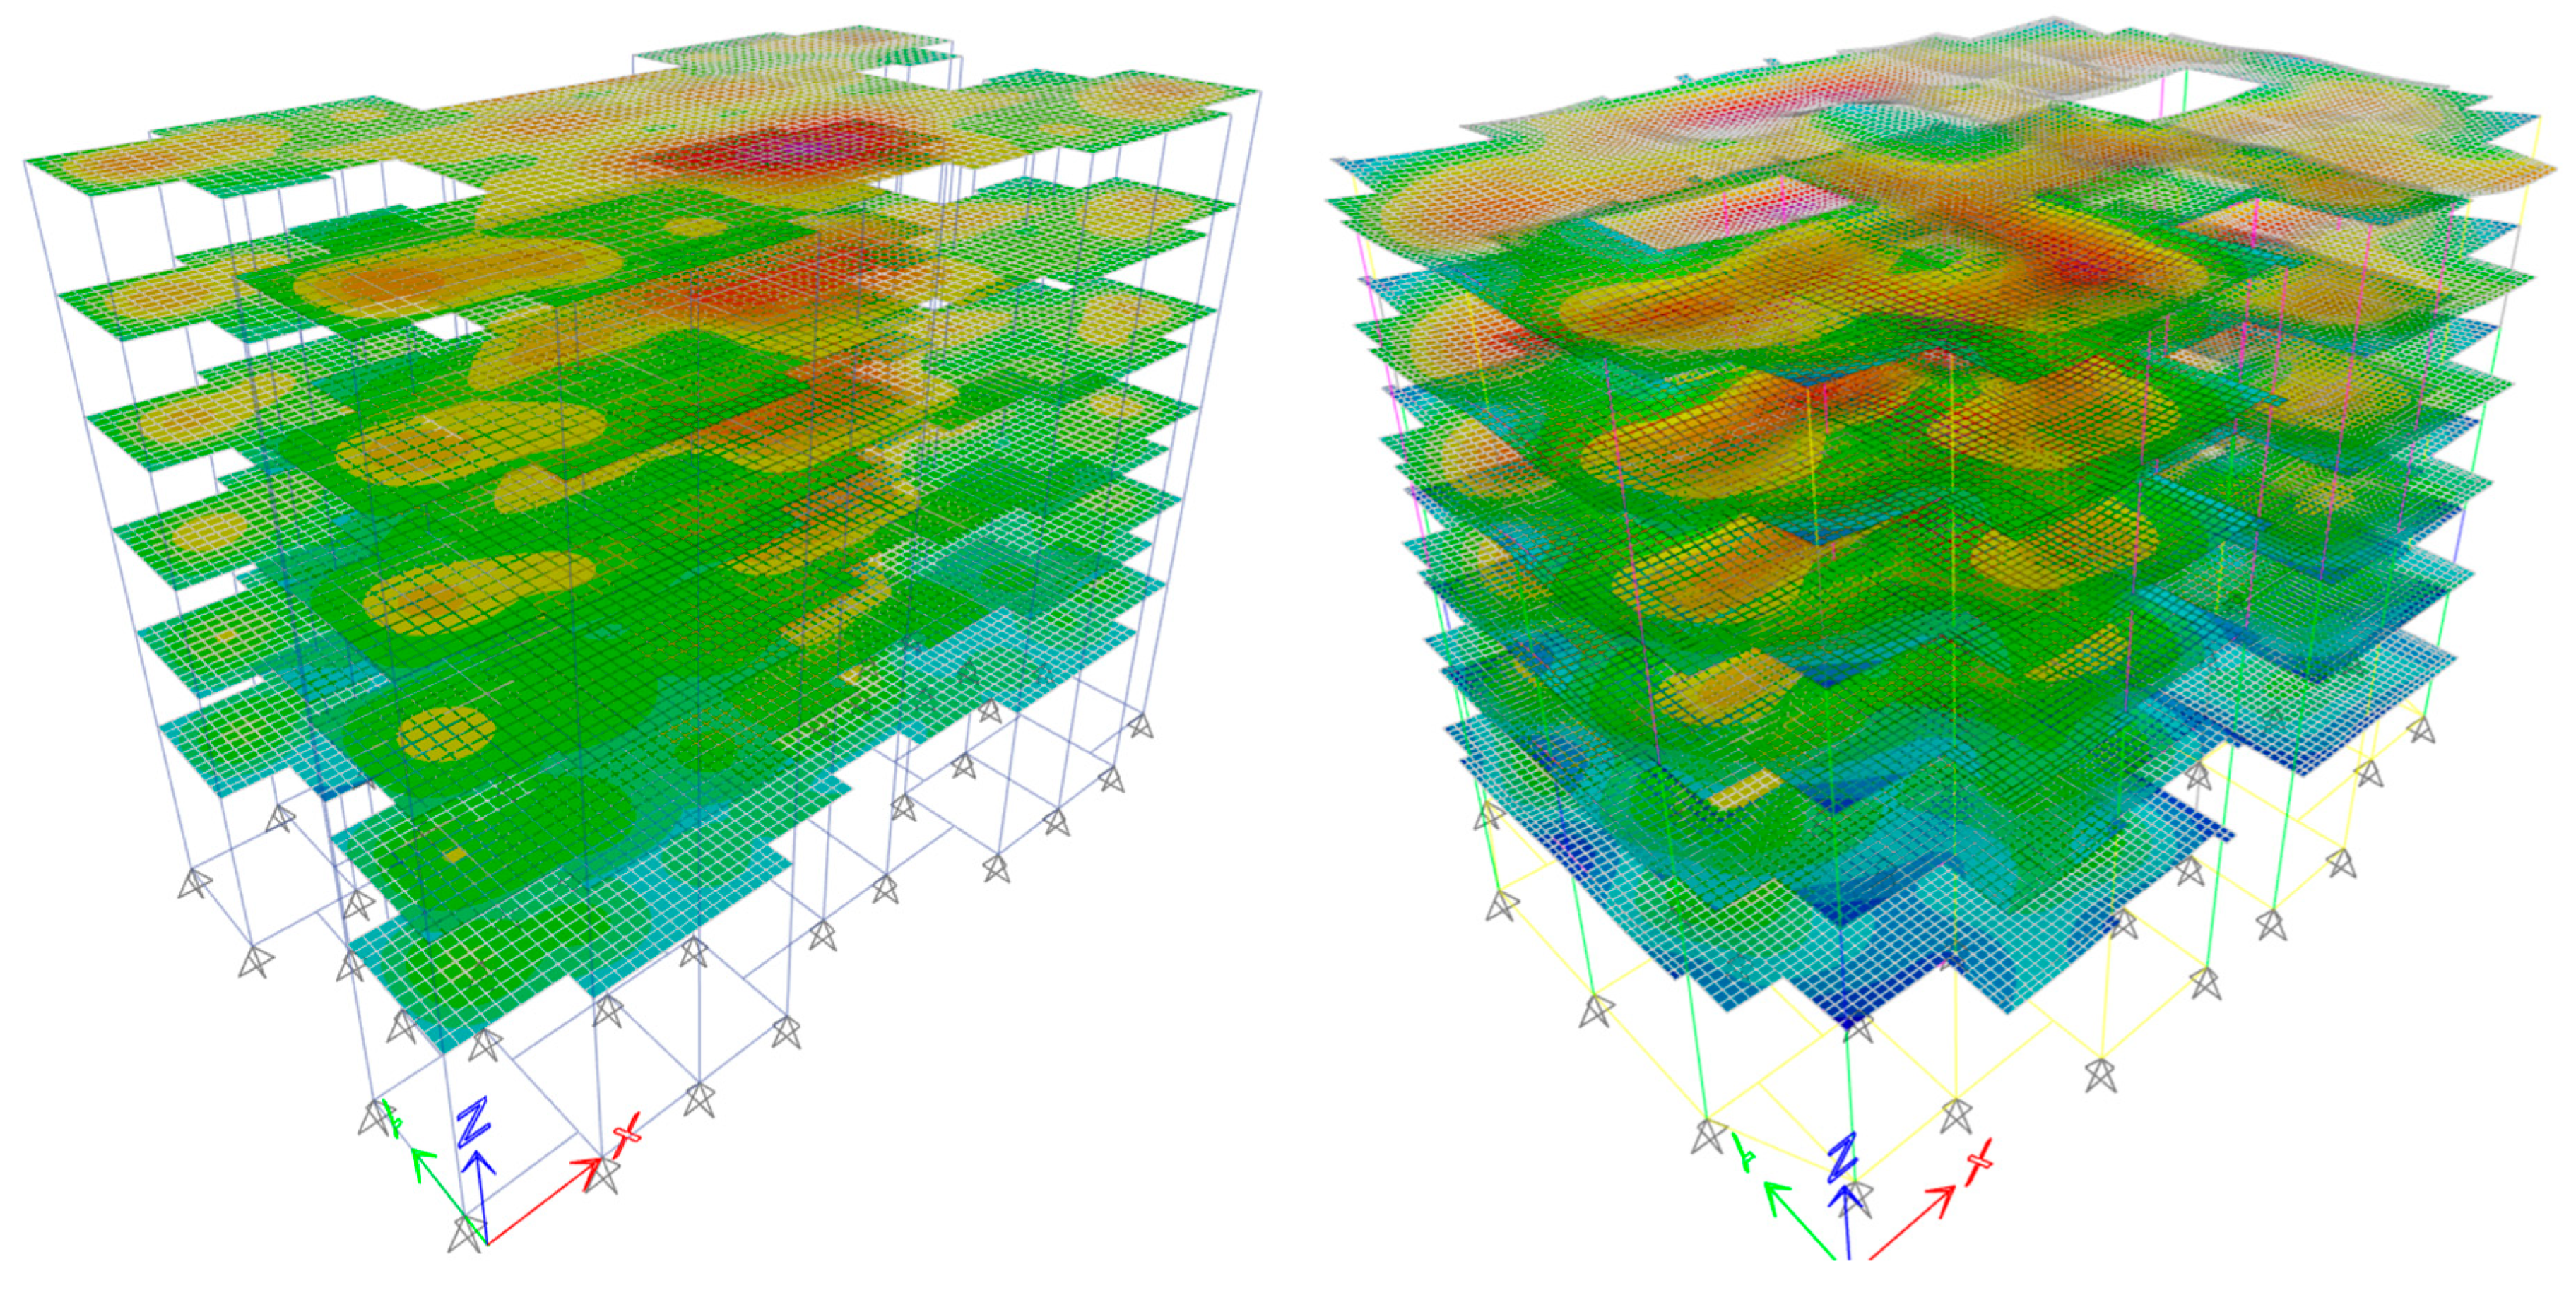
Finite element models were developed for both case studies under gravity and lateral load combinations defined by the Egyptian code framework.
Figure 7 shows the affordable housing finite element model, and
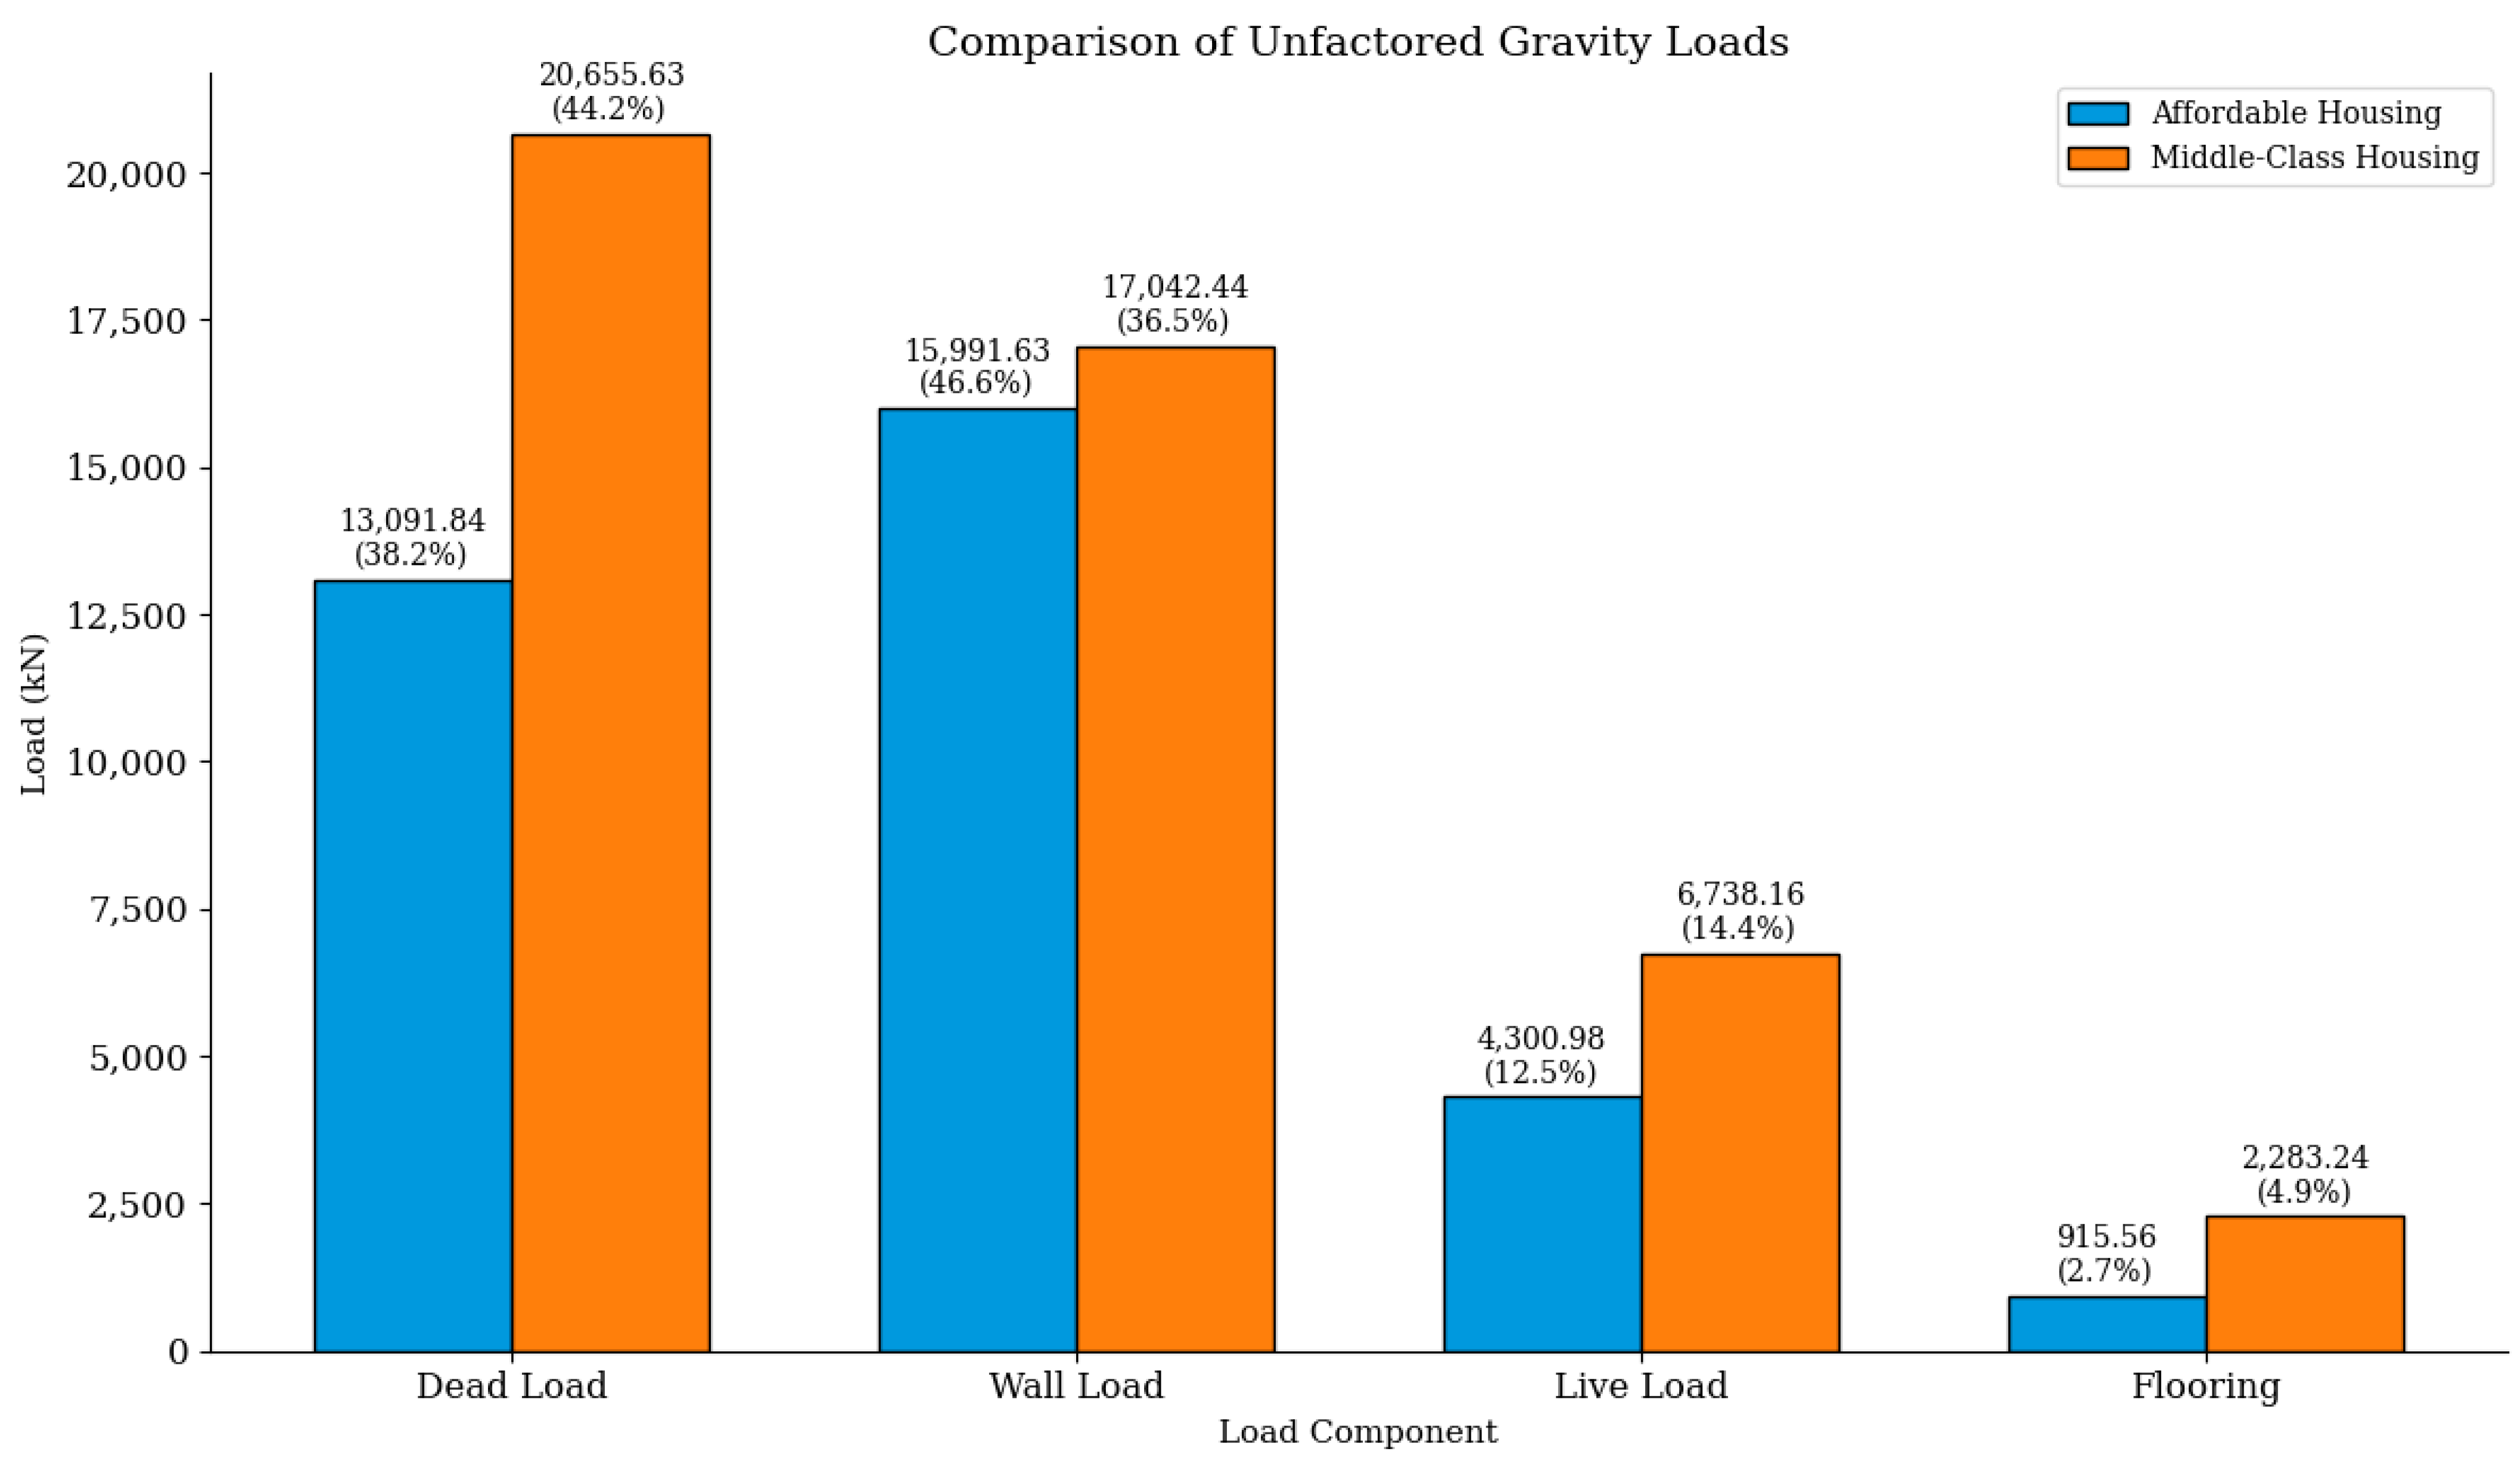
Figure 8 compares the decomposition of unfactored service gravity loads in the affordable and middle-class buildings.
In the affordable housing case, wall load is the largest gravity-load component at 15,991.63 kN, equal to 46.6% of the total, followed by structural dead load at 13,091.84 kN, or 38.2%. In the middle-class housing case, structural dead load is the dominant component at 20,655.63 kN (44.2%), while wall load remains large at 17,042.44 kN (36.5%). Live load is secondary in both buildings, contributing 4300.98 kN (12.5%) in the affordable case and 6738.16 kN (14.4%) in the middle-class case. Flooring load is the smallest component, contributing 915.56 kN (2.7%) in the affordable case and 2283.24 kN (4.9%) in the middle-class case.
This difference in baseline load composition is important. In the affordable housing case, partition walls carry the largest single gravity load, so reducing wall density has stronger direct structural leverage. In the middle-class housing case, wall load remains important, but the larger structural dead load reduces the relative influence of partition-wall substitution alone.
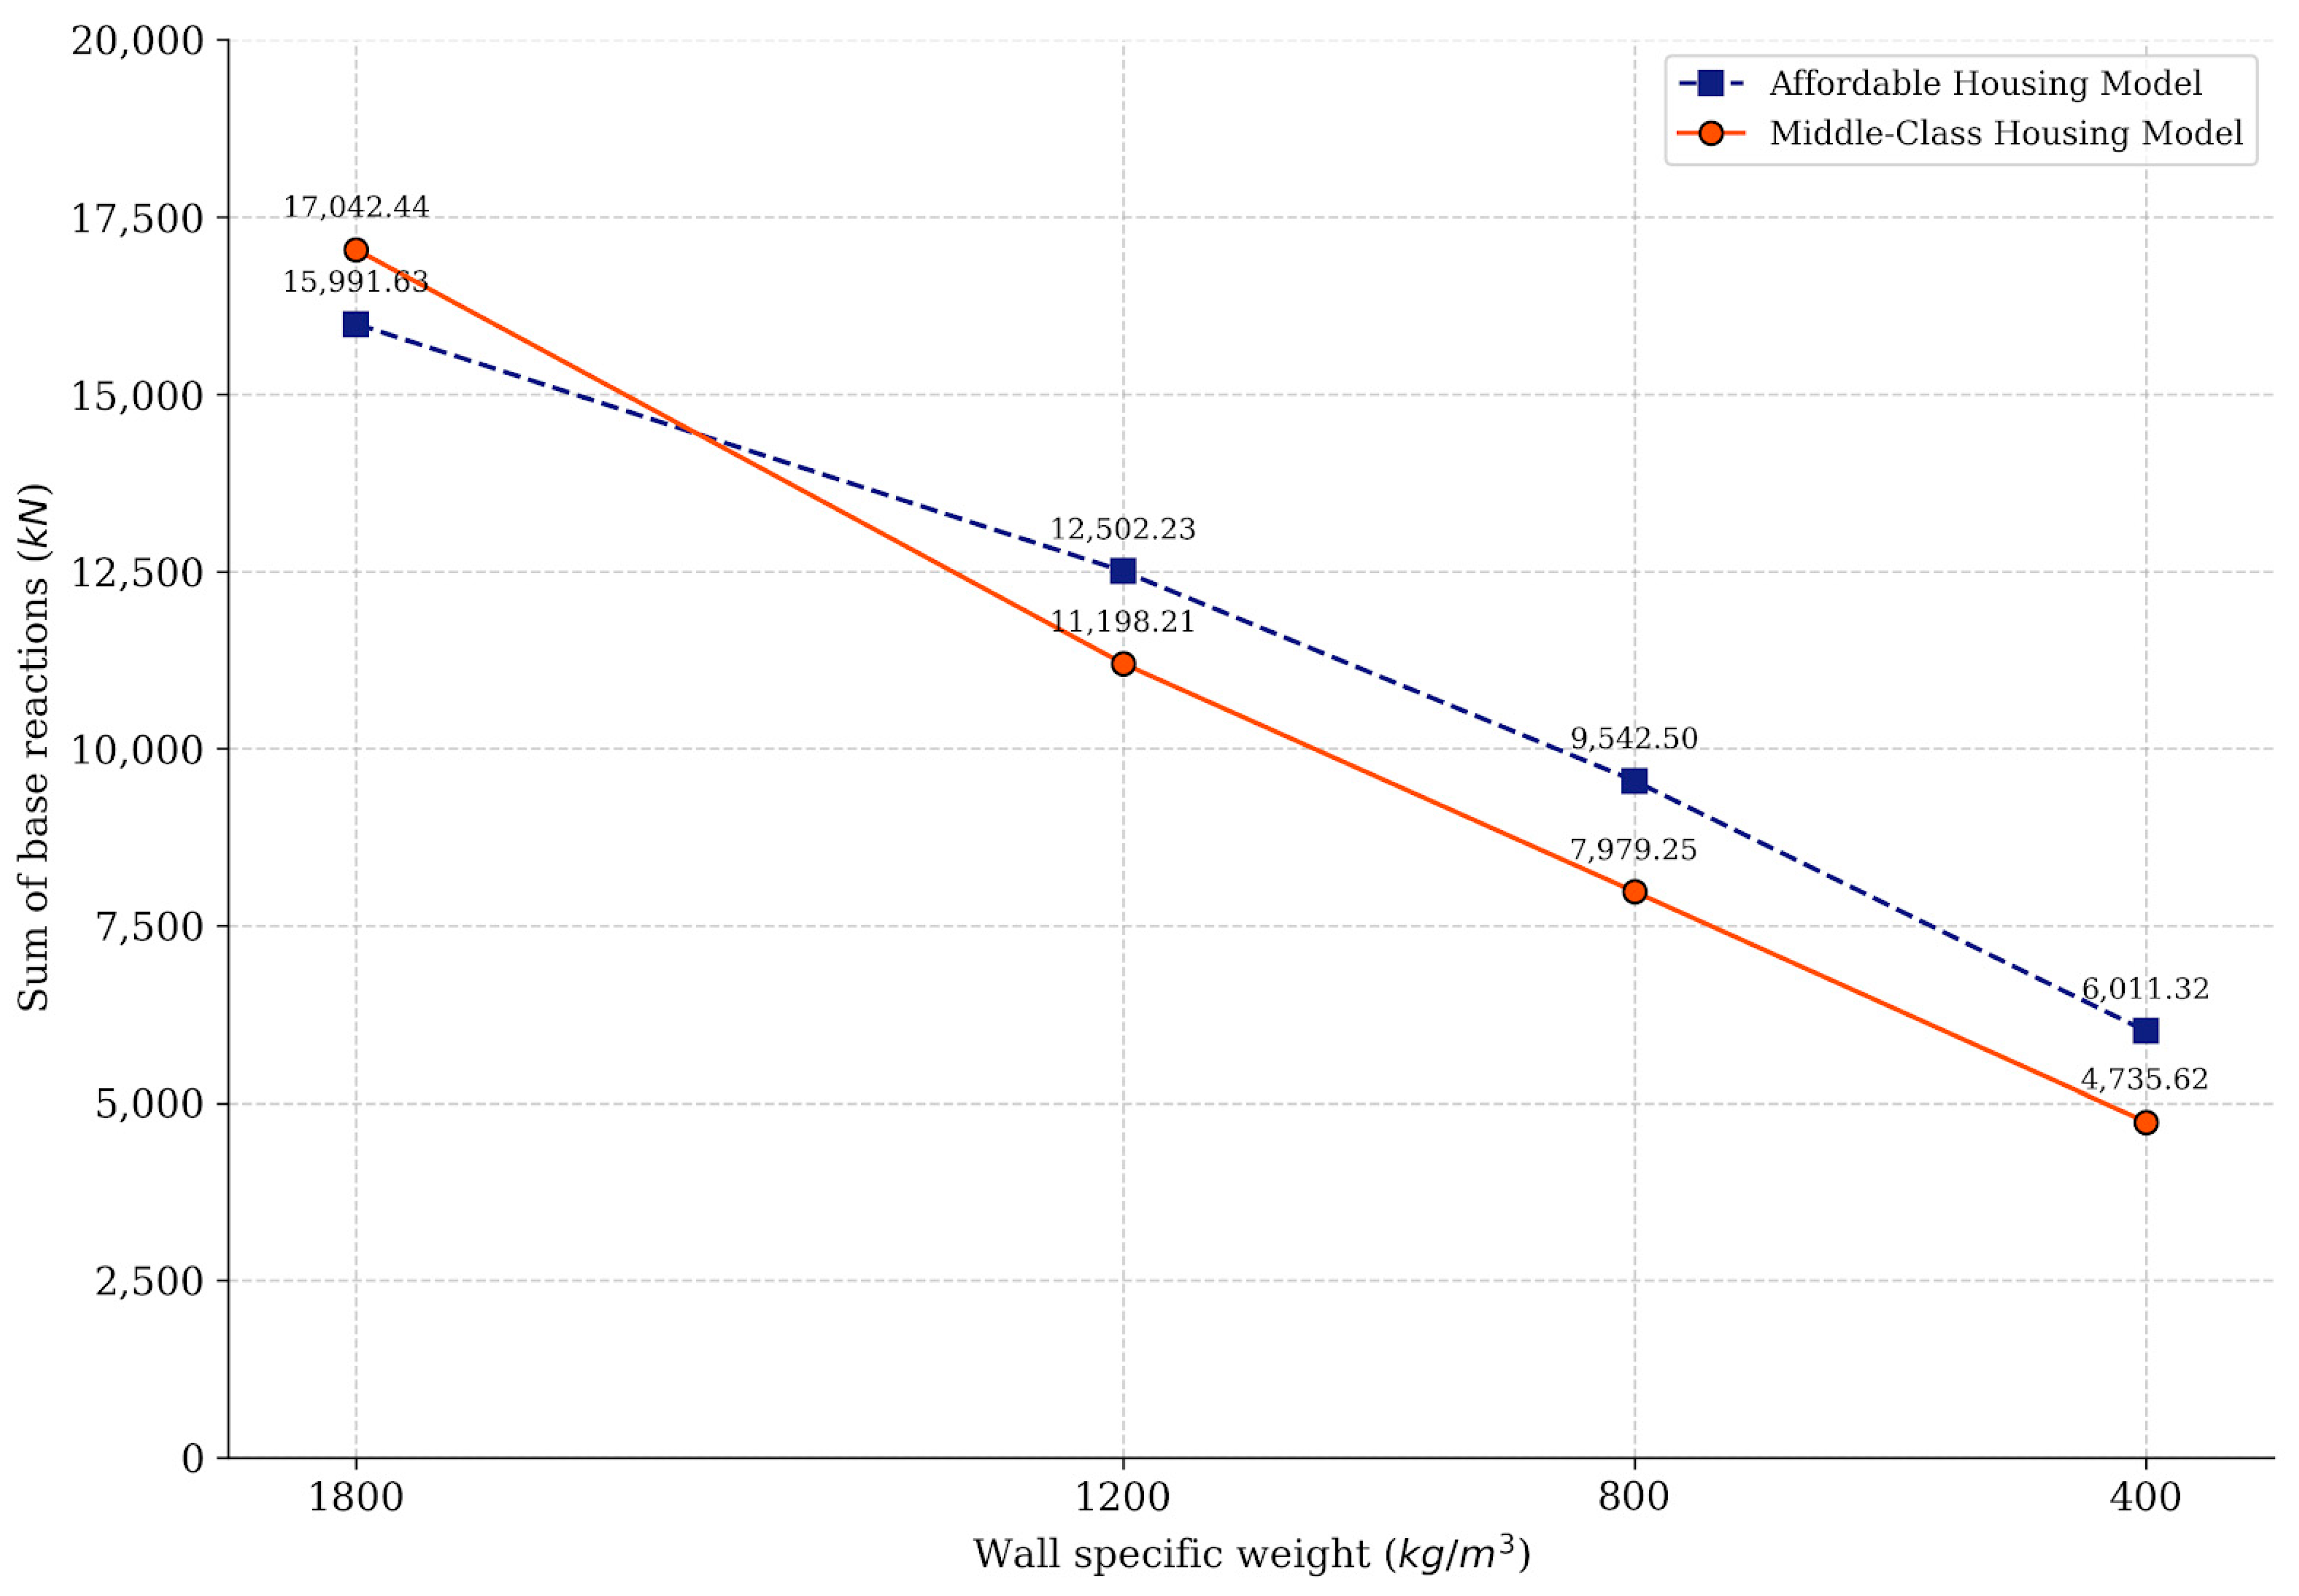
Figure 9 shows the effect of partition wall density on wall-induced base reactions. In the affordable housing model, wall-related base reactions decrease from 15,991.63 kN at 1800 kg/m
3 to 12,502.23 kN at 1200 kg/m
3, 9542.50 kN at 800 kg/m
3, and 6011.32 kN at 400 kg/m
3. These values correspond to reductions of 21.8%, 40.3%, and 62.4% relative to the baseline wall density.
In the middle-class housing model, wall-related base reactions decrease from 17,042.44 kN at 1800 kg/m3 to 11,198.21 kN at 1200 kg/m3, 7979.25 kN at 800 kg/m3, and 4735.62 kN at 400 kg/m3. These values correspond to reductions of 34.3%, 53.2%, and 72.2%, respectively. Although the middle-class case starts slightly higher at the baseline density, the reduction becomes steeper as density decreases. At 400 kg/m3, the wall-induced reaction reduction reaches about 9980 kN in the affordable housing case and about 12,307 kN in the middle-class housing case. These reductions directly lower substructure demand in the revised structural cases.
3.5. Embodied-Carbon Reduction in Lightweight Wall Core Scenarios
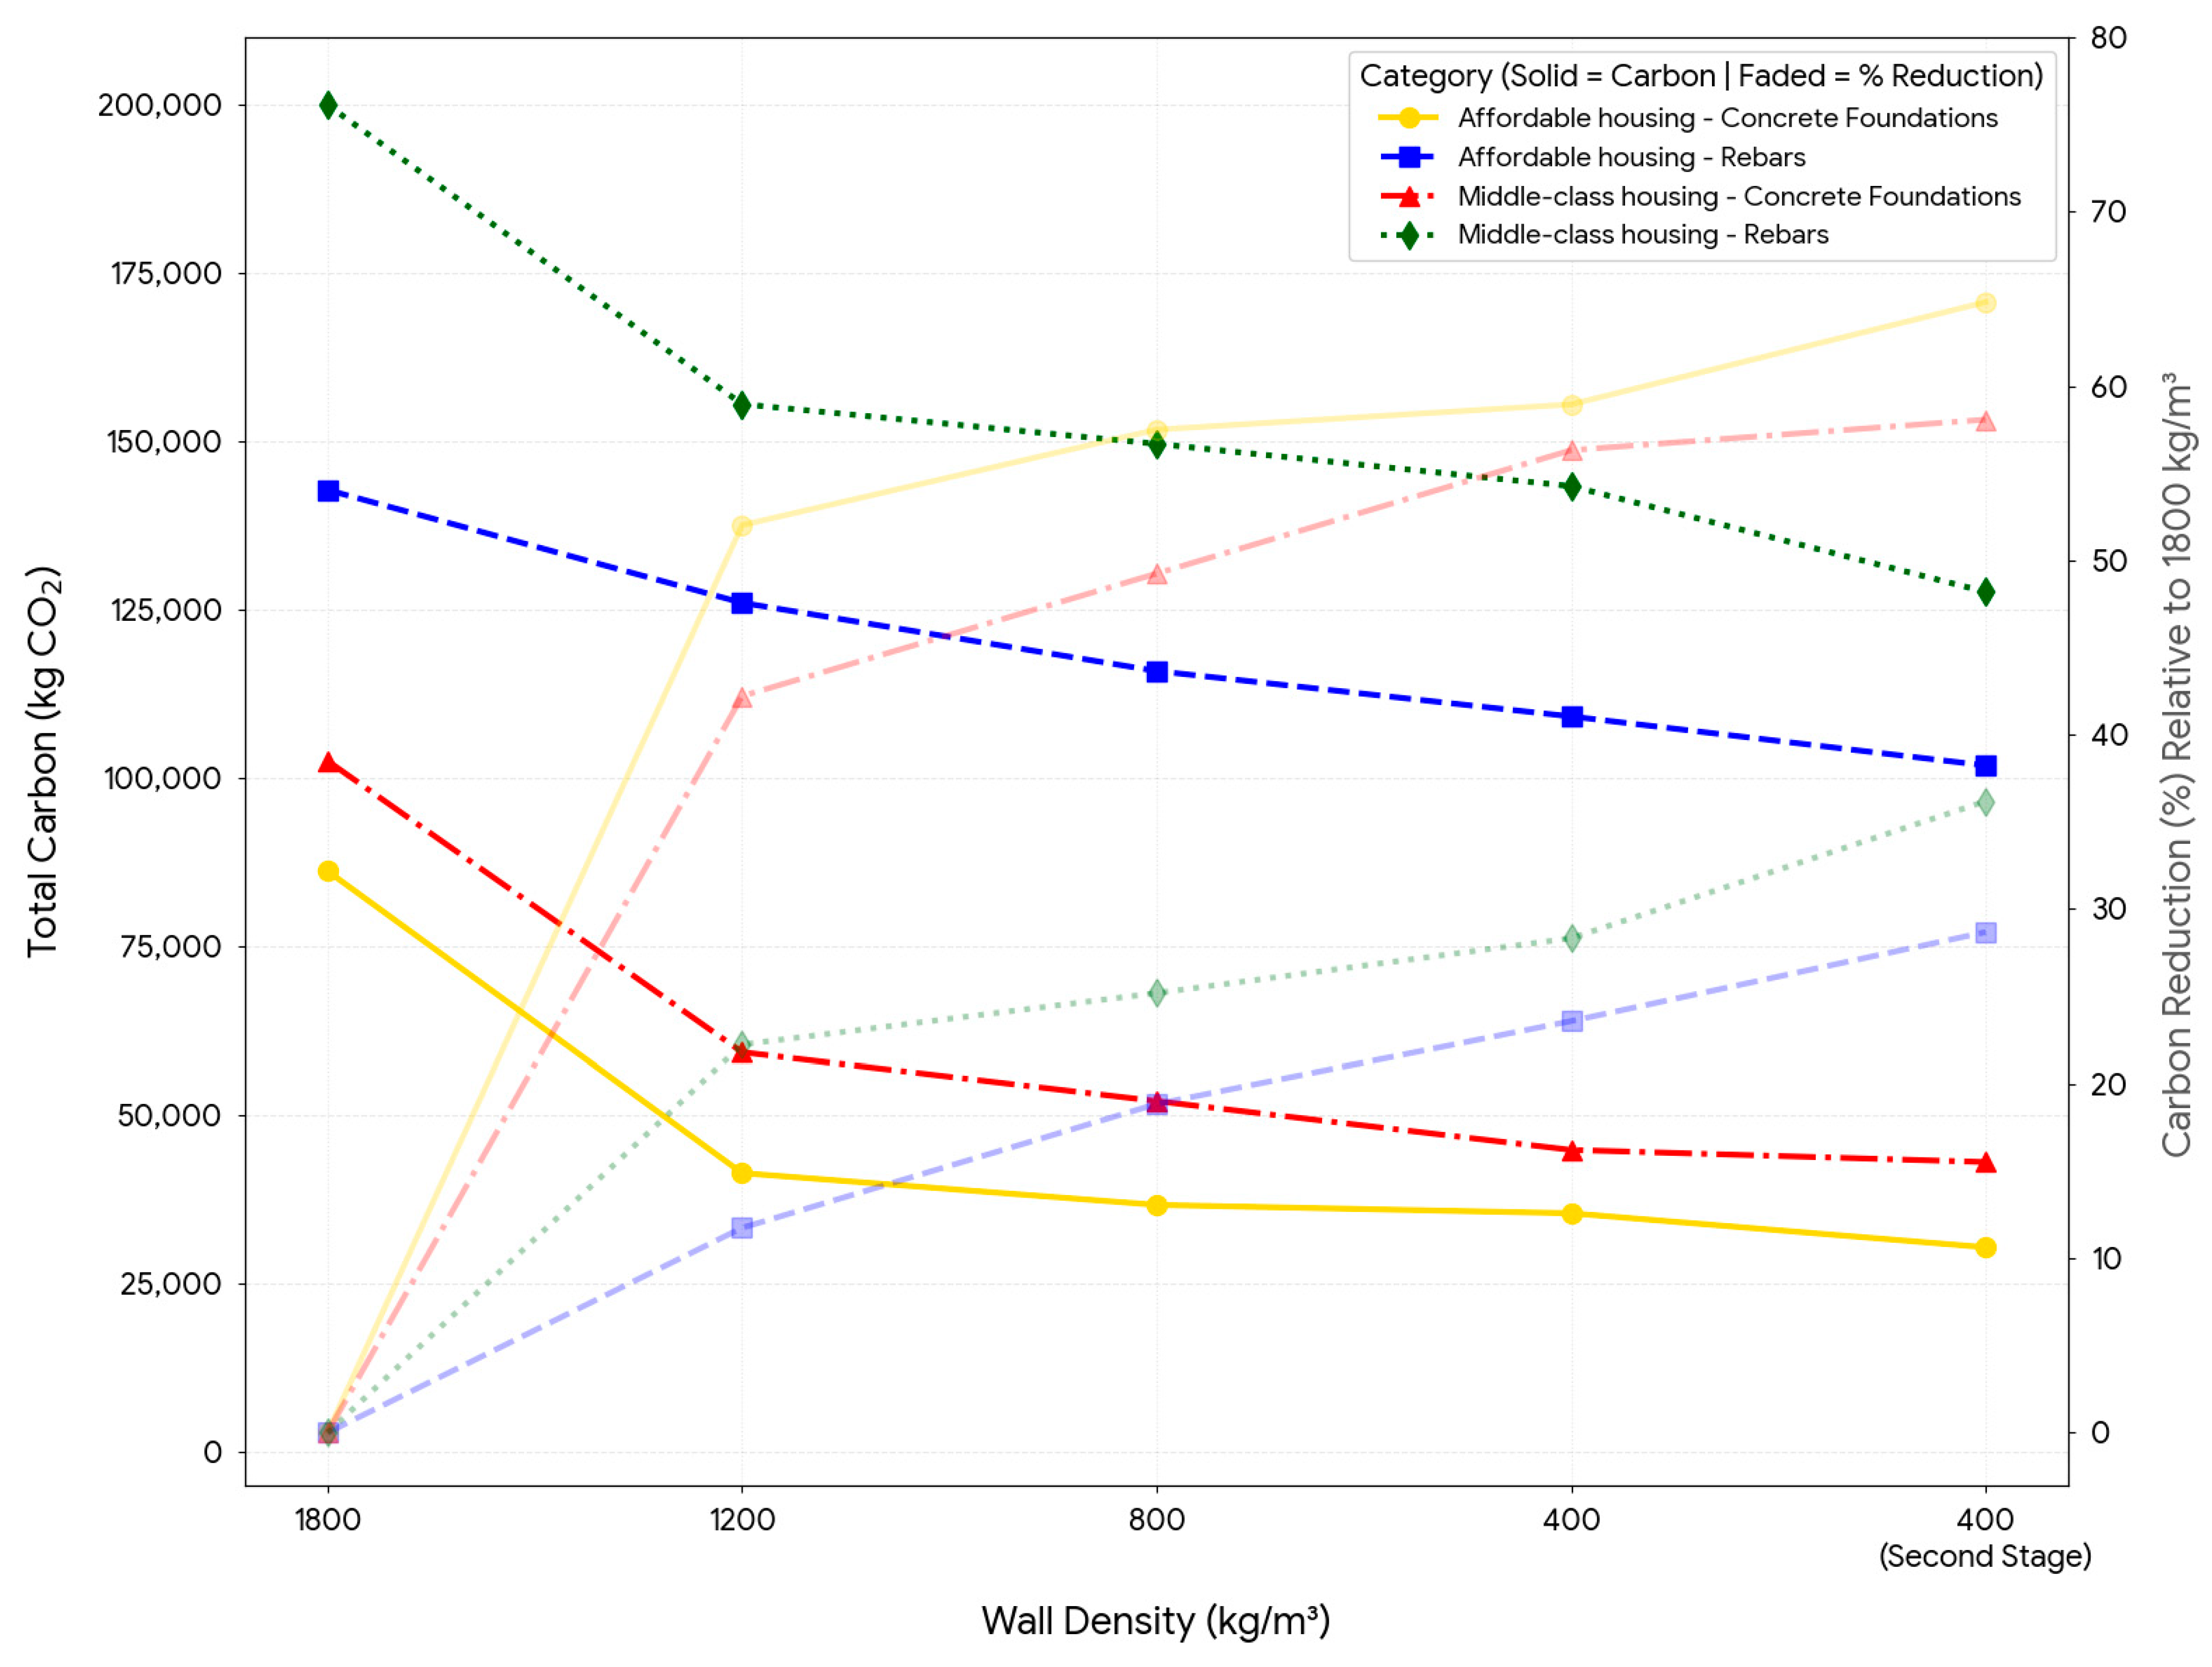
Figure 10 compares the embodied carbon of reinforcement and foundation concrete across the tested wall-density scenarios. Finite element assessment was carried out for wall core densities of 1800, 1200, 800, and 400 kg/m
3. In both case studies, reducing wall density lowered dead load, reduced base reactions, and decreased foundation demand.
In the first-stage 400 kg/m3 case, only the wall-density effect was introduced, while slab thickness remained unchanged. In the affordable housing case, foundation concrete embodied carbon decreased from 86,121 to 35,359 kgCO2e, a reduction of 50,762 kgCO2e or 58.9%. Reinforcement embodied carbon decreased from 142,742 to 109,093 kgCO2e, a reduction of 33,649 kgCO2e or 23.6%. In the middle-class housing case, foundation concrete embodied carbon decreased from 102,486 to 44,769 kgCO2e, a reduction of 57,717 kgCO2e (56.3%), while reinforcement embodied carbon decreased from 199,940 to 143,304 kgCO2e, a reduction of 56,636 kgCO2e (28.3%).
A second-stage assessment was then carried out for the 400 kg/m3 wall case by reducing slab thickness within code serviceability limits. This second stage reduced the slab self-weight and the slab reinforcement demand, thereby further reducing base reactions and substructure demand. In the affordable housing case, foundation concrete embodied carbon decreased further from 35,359 to 30,306 kgCO2e, yielding an additional savings of 5053 kgCO2e and a total reduction of 64.8% relative to the 1800 kg/m3 baseline. Reinforcement embodied carbon decreased further from 109,093 to 101,804 kgCO2e, yielding an additional savings of 7289 kgCO2e and a total reduction of 28.7%.
In the middle-class housing case, foundation concrete embodied carbon decreased further from 44,769 to 42,971 kgCO2e, for an additional savings of 1797 kgCO2e and a total reduction of 58.1% relative to the 1800 kg/m3 baseline. Reinforcement embodied carbon decreased further from 143,304 to 127,596 kgCO2e, for an additional savings of 15,708 kgCO2e and a total reduction of 36.2%.
These results show diminishing returns at lower wall density. Once the wall load has already been reduced substantially, further density reduction produces smaller additional decreases in base reactions and foundation demand.
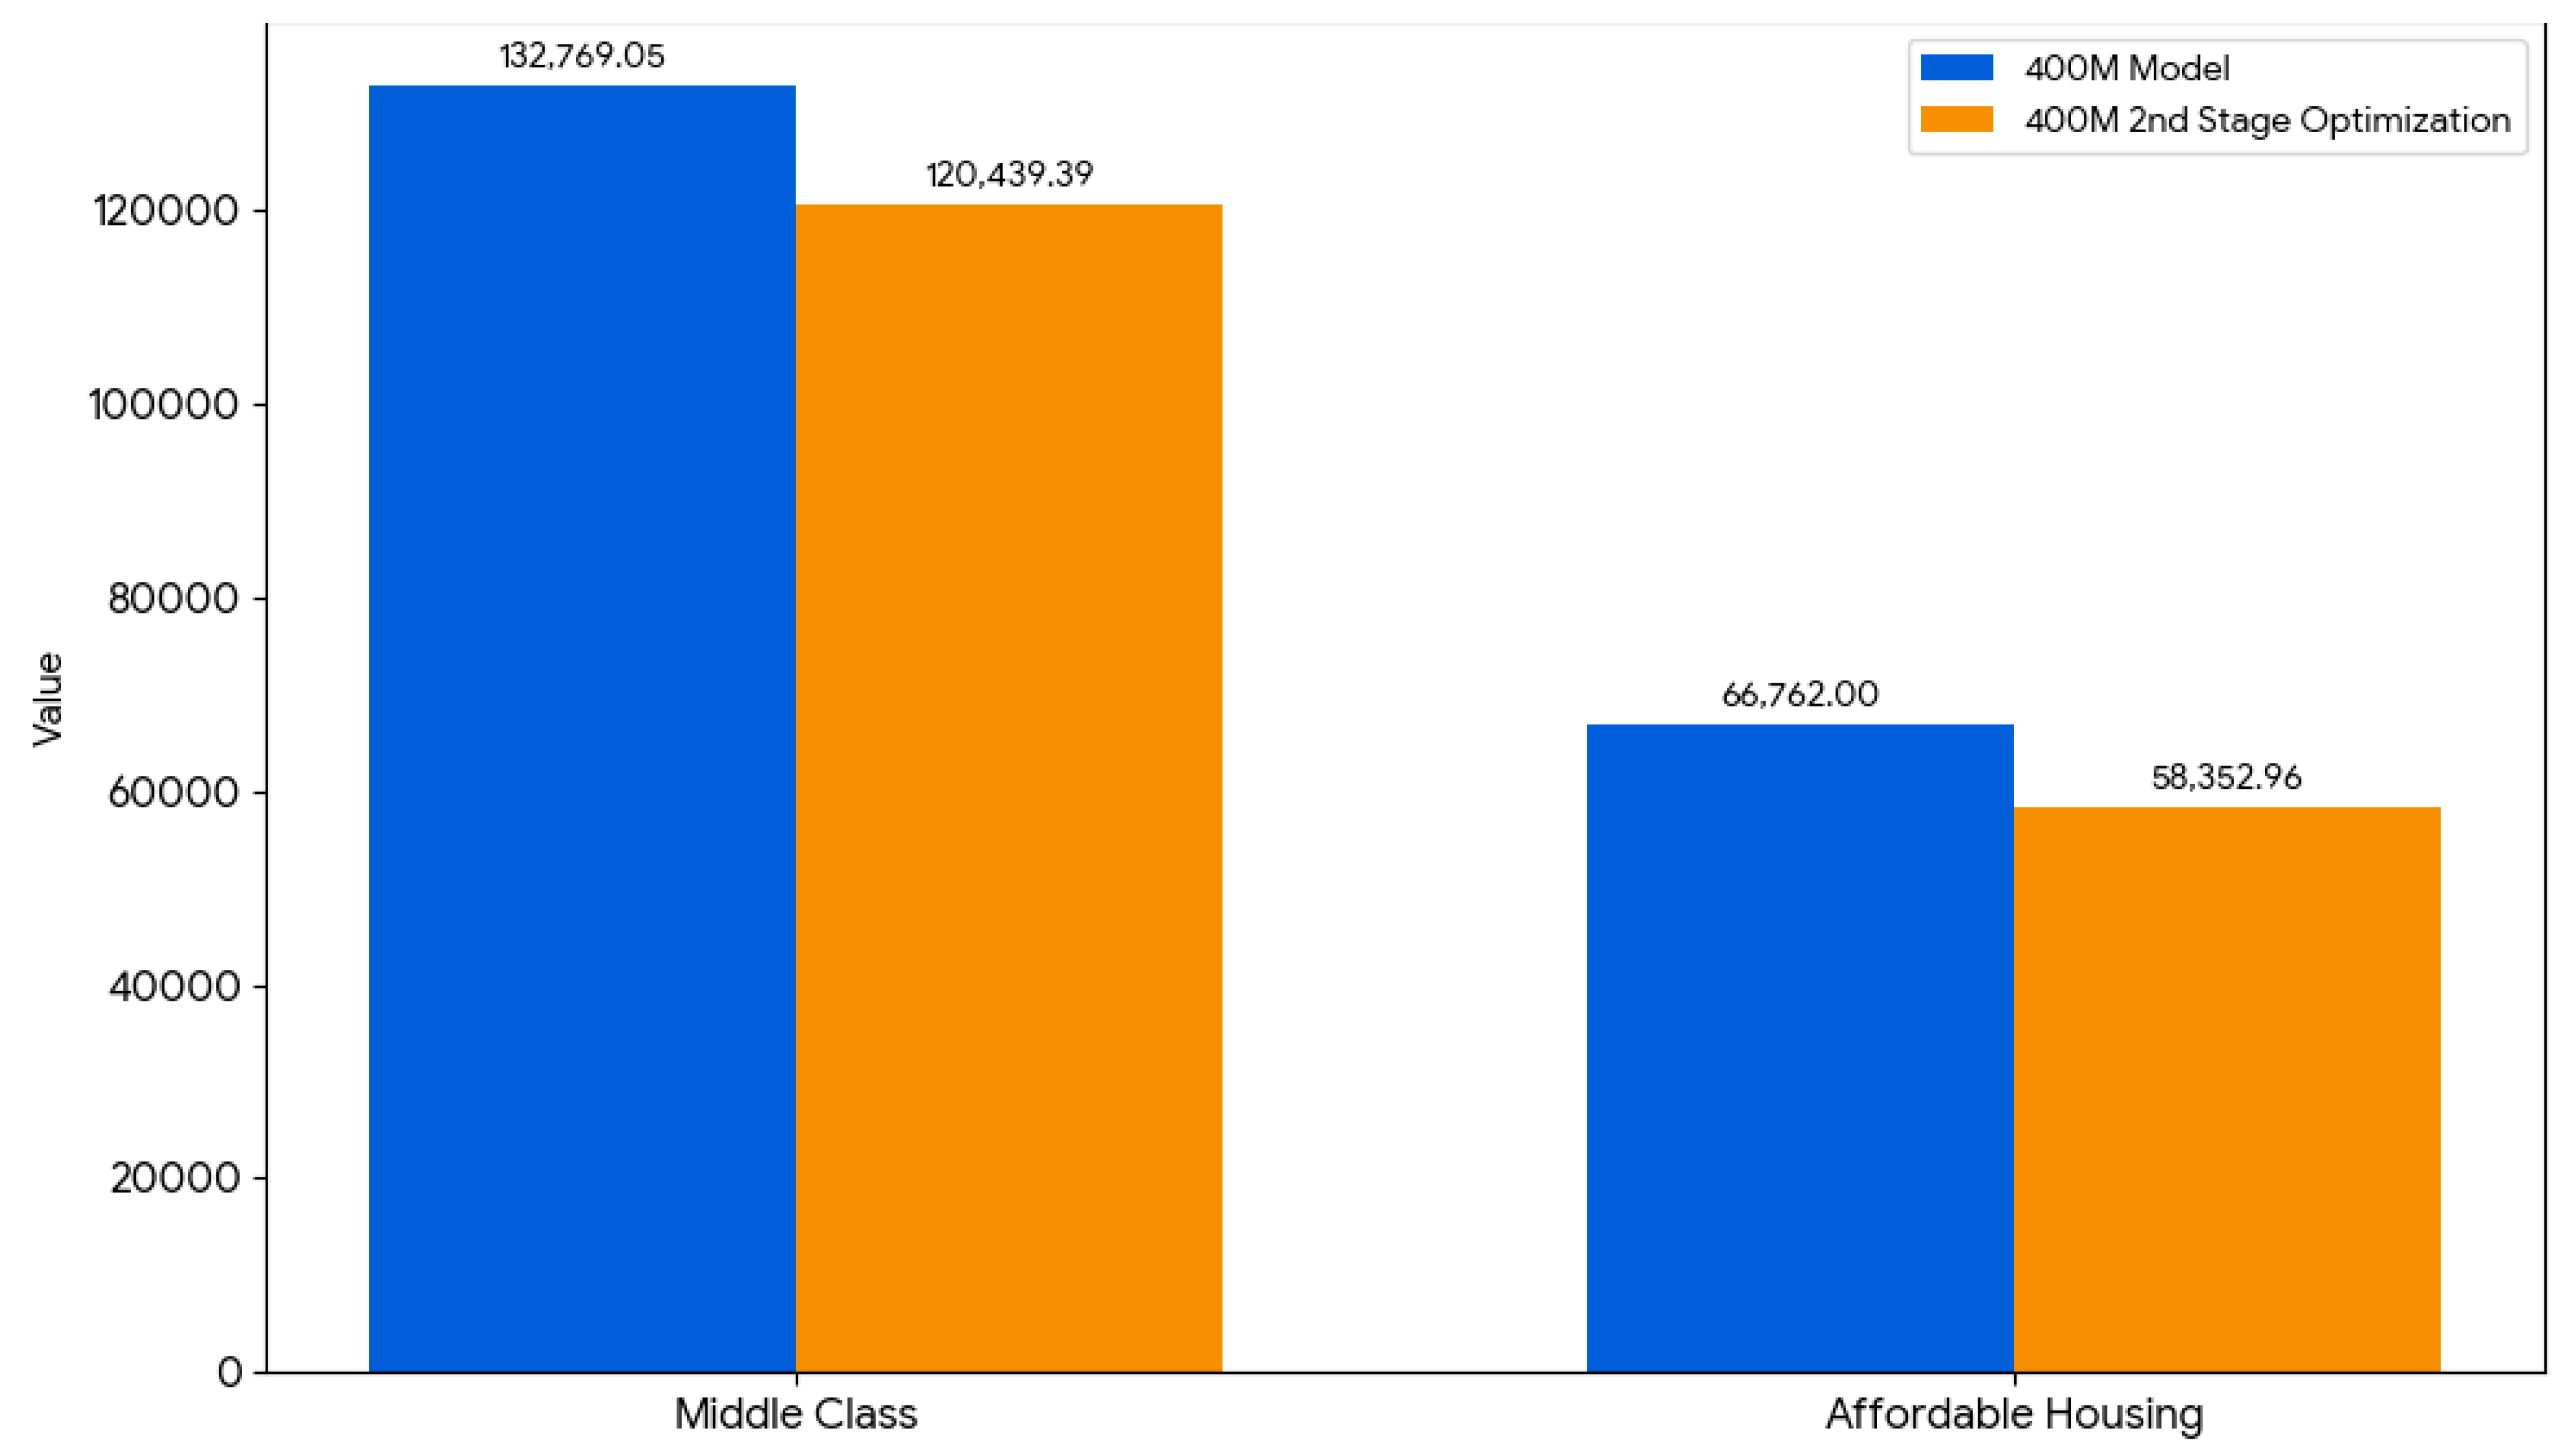
The second-stage 400 kg/m
3 case also directly reduced the embodied carbon of the slab concrete. In the middle-class housing case, slab concrete embodied carbon decreased from 132,769 to 120,439 kgCO
2e, for a savings of 12,330 kgCO
2e or 9.3%. In the affordable housing case, it decreased from 66,762 to 58,353 kgCO
2e, representing a savings of 8409 kgCO
2e (12.6%), as shown in
Figure 11.
3.6. Wall System Substitution and Wall Core Embodied Carbon
Wall system substitutions, as summarized in
Figure 12, were evaluated by replacing the baseline masonry core with alternative wall core materials of lower density and different thermal performance. For each alternative, wall core quantities were extracted from the BIM model and multiplied by the corresponding embodied-carbon factors to quantify the direct carbon effect of wall substitution.
To ensure consistent comparisons across systems, block and mortar volumes were quantified separately because unit geometry and joint thickness directly affect mortar demand and total material take-off. The baseline red-brick wall was modeled per the original project specification, while the alternative wall systems were standardized to common market dimensions. Mortar consumption parameters for the alternative systems are summarized in
Table 4. A detailed overview of the wall system substitutions is provided in the
Supplementary Materials.
3.6.1. Affordable Housing Case
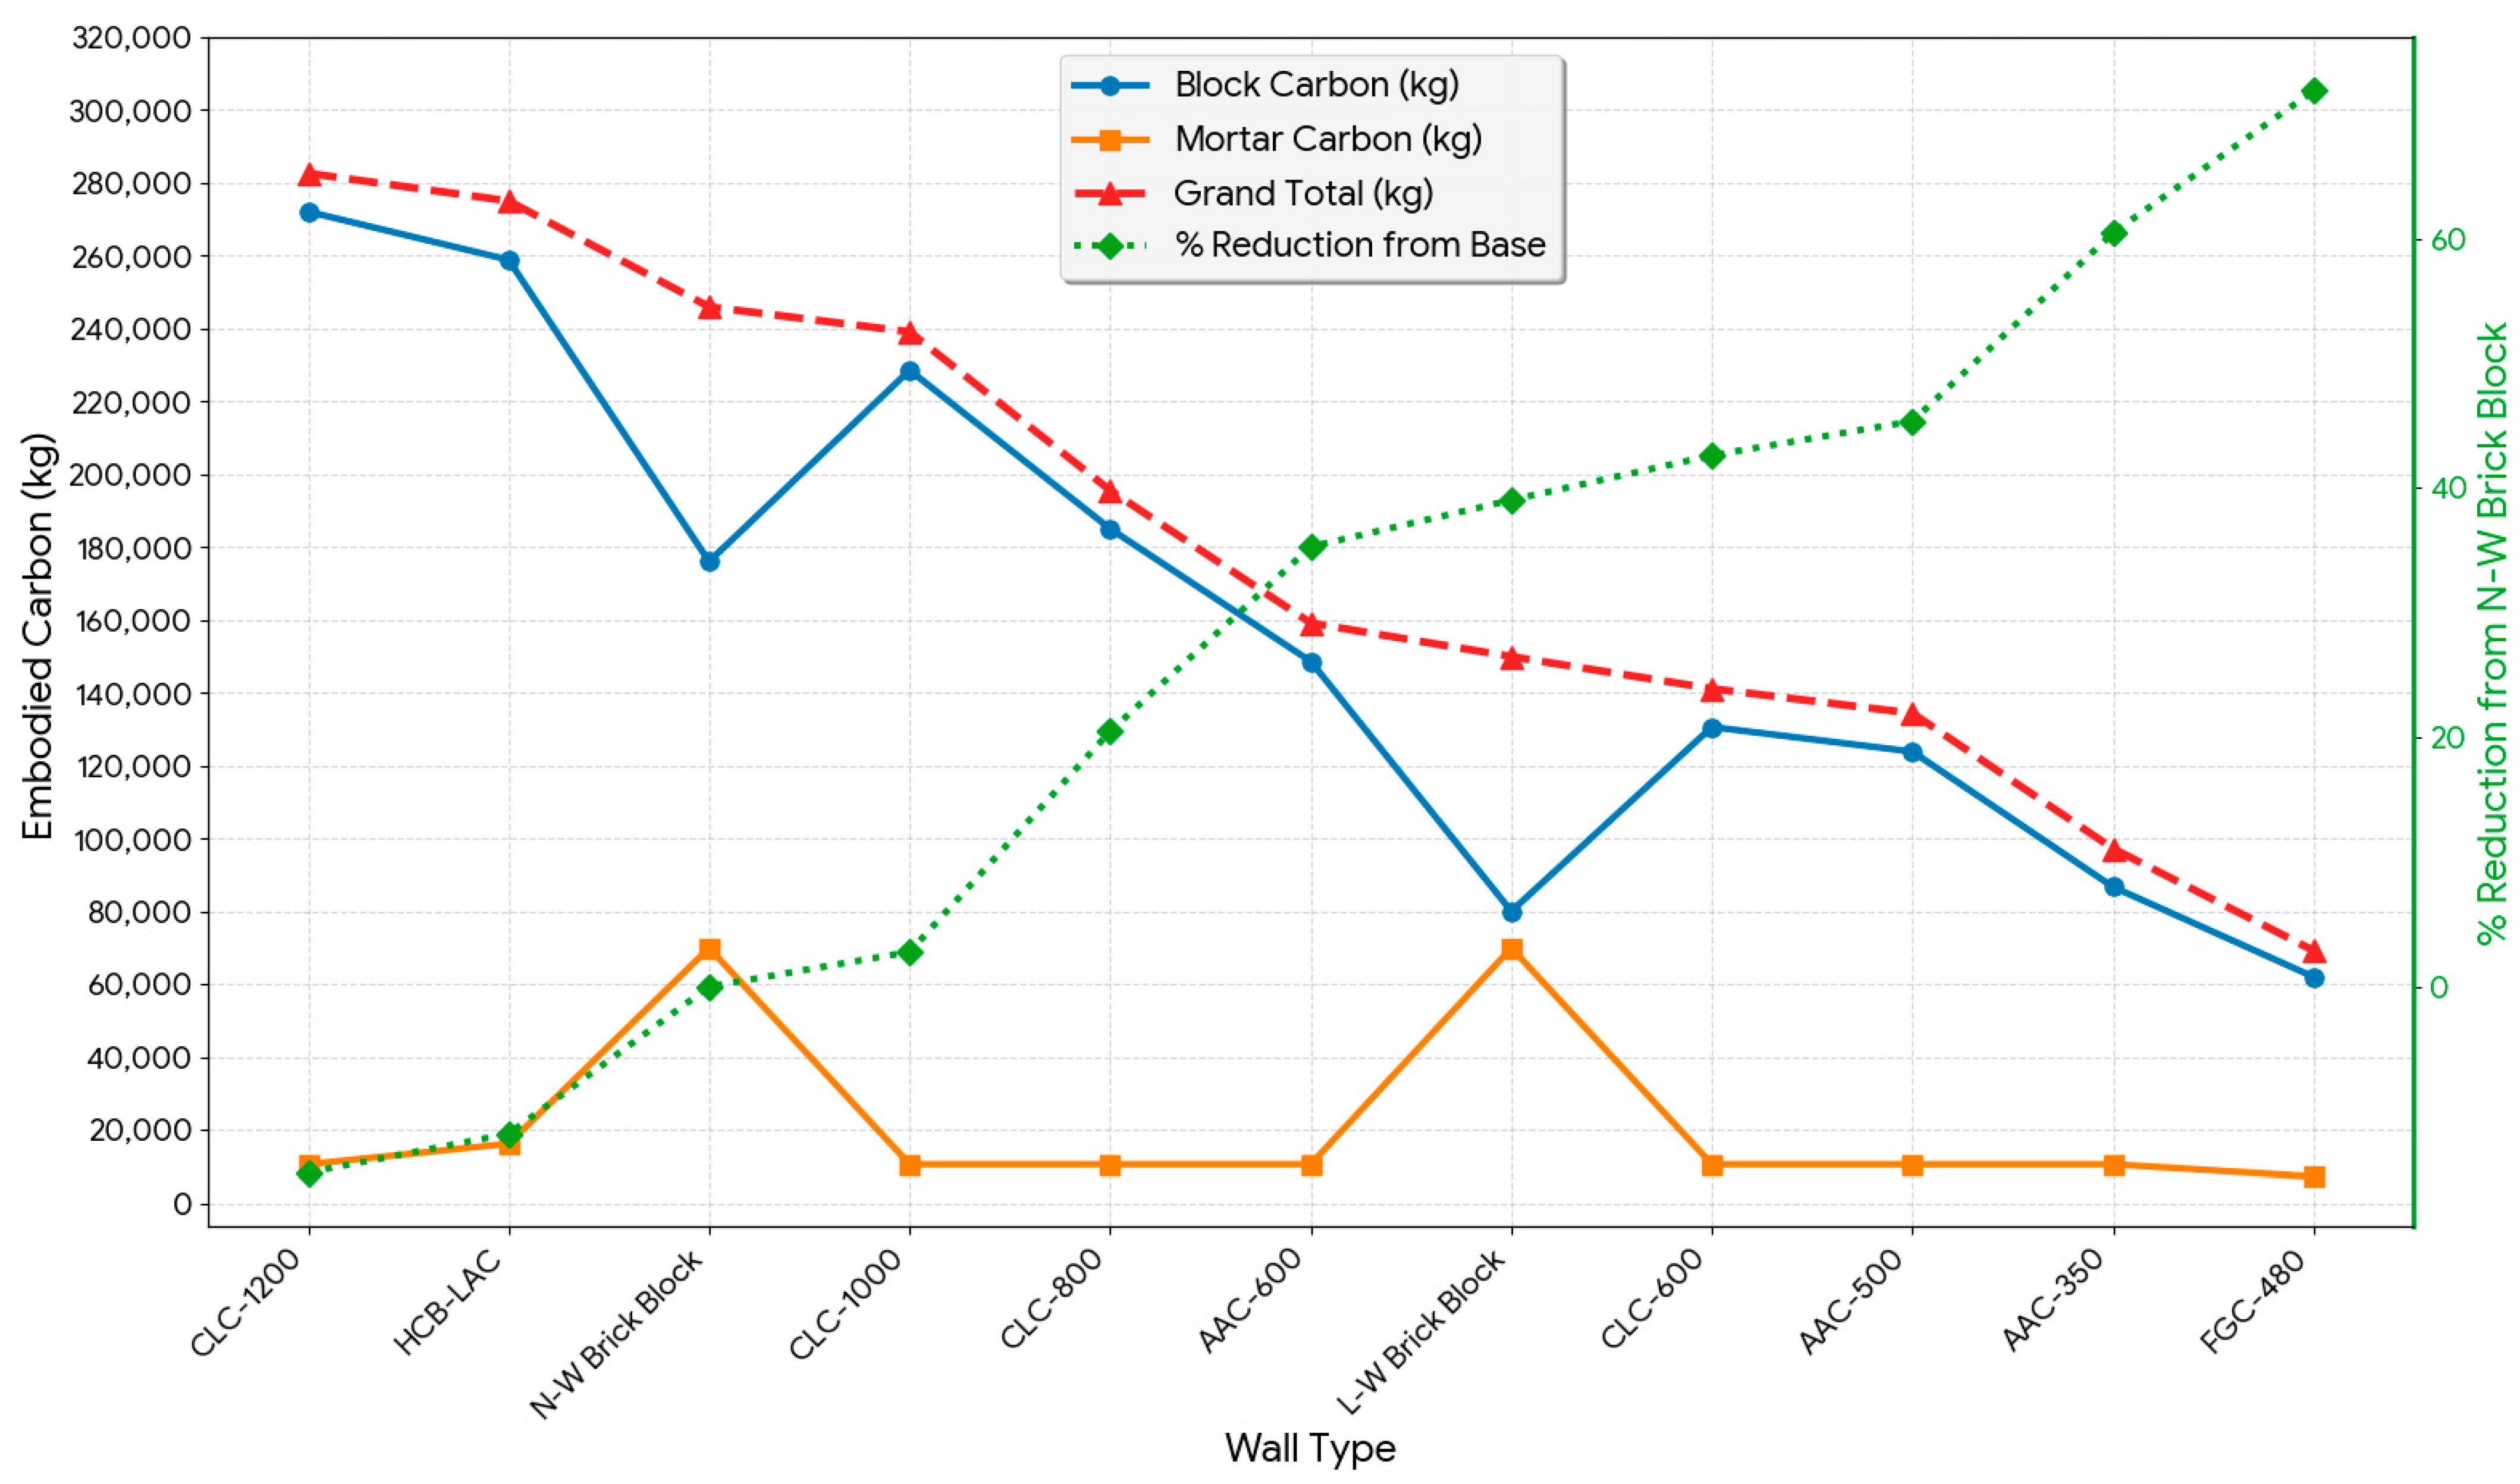
In the affordable housing case, the baseline normal-weight brick wall system has a total wall core embodied carbon of 245,872.09 kgCO2e. This total includes 175,968.06 kgCO2e from the block units and 69,904.03 kgCO2e from mortar, meaning that mortar accounts for 28.4% of the wall core total.
For the AAC and CLC systems, mortar embodied carbon remains nearly constant due to thin-joint construction. As a result, differences in total wall-core embodied carbon are driven primarily by the block component rather than the mortar. FGC-480 achieves the lowest wall-core embodied carbon, while AAC-350 also performs strongly. By contrast, some substitutions increase wall-core embodied carbon relative to the baseline. HCB-LAC reaches 274,918.20 kgCO
2e, which is 11.8% above the baseline, and CLC-1200 reaches 282,516.02 kgCO
2e, which is 14.9% above the baseline, as shown in
Figure 13.
These comparisons must be interpreted in light of wall thickness. The baseline wall thickness is 125 mm, whereas all alternative wall systems were modeled at 200 mm. Therefore, the increase in wall volume raises material demand before differences in material-level carbon intensity are accounted for.
3.6.2. Middle-Class Housing Case
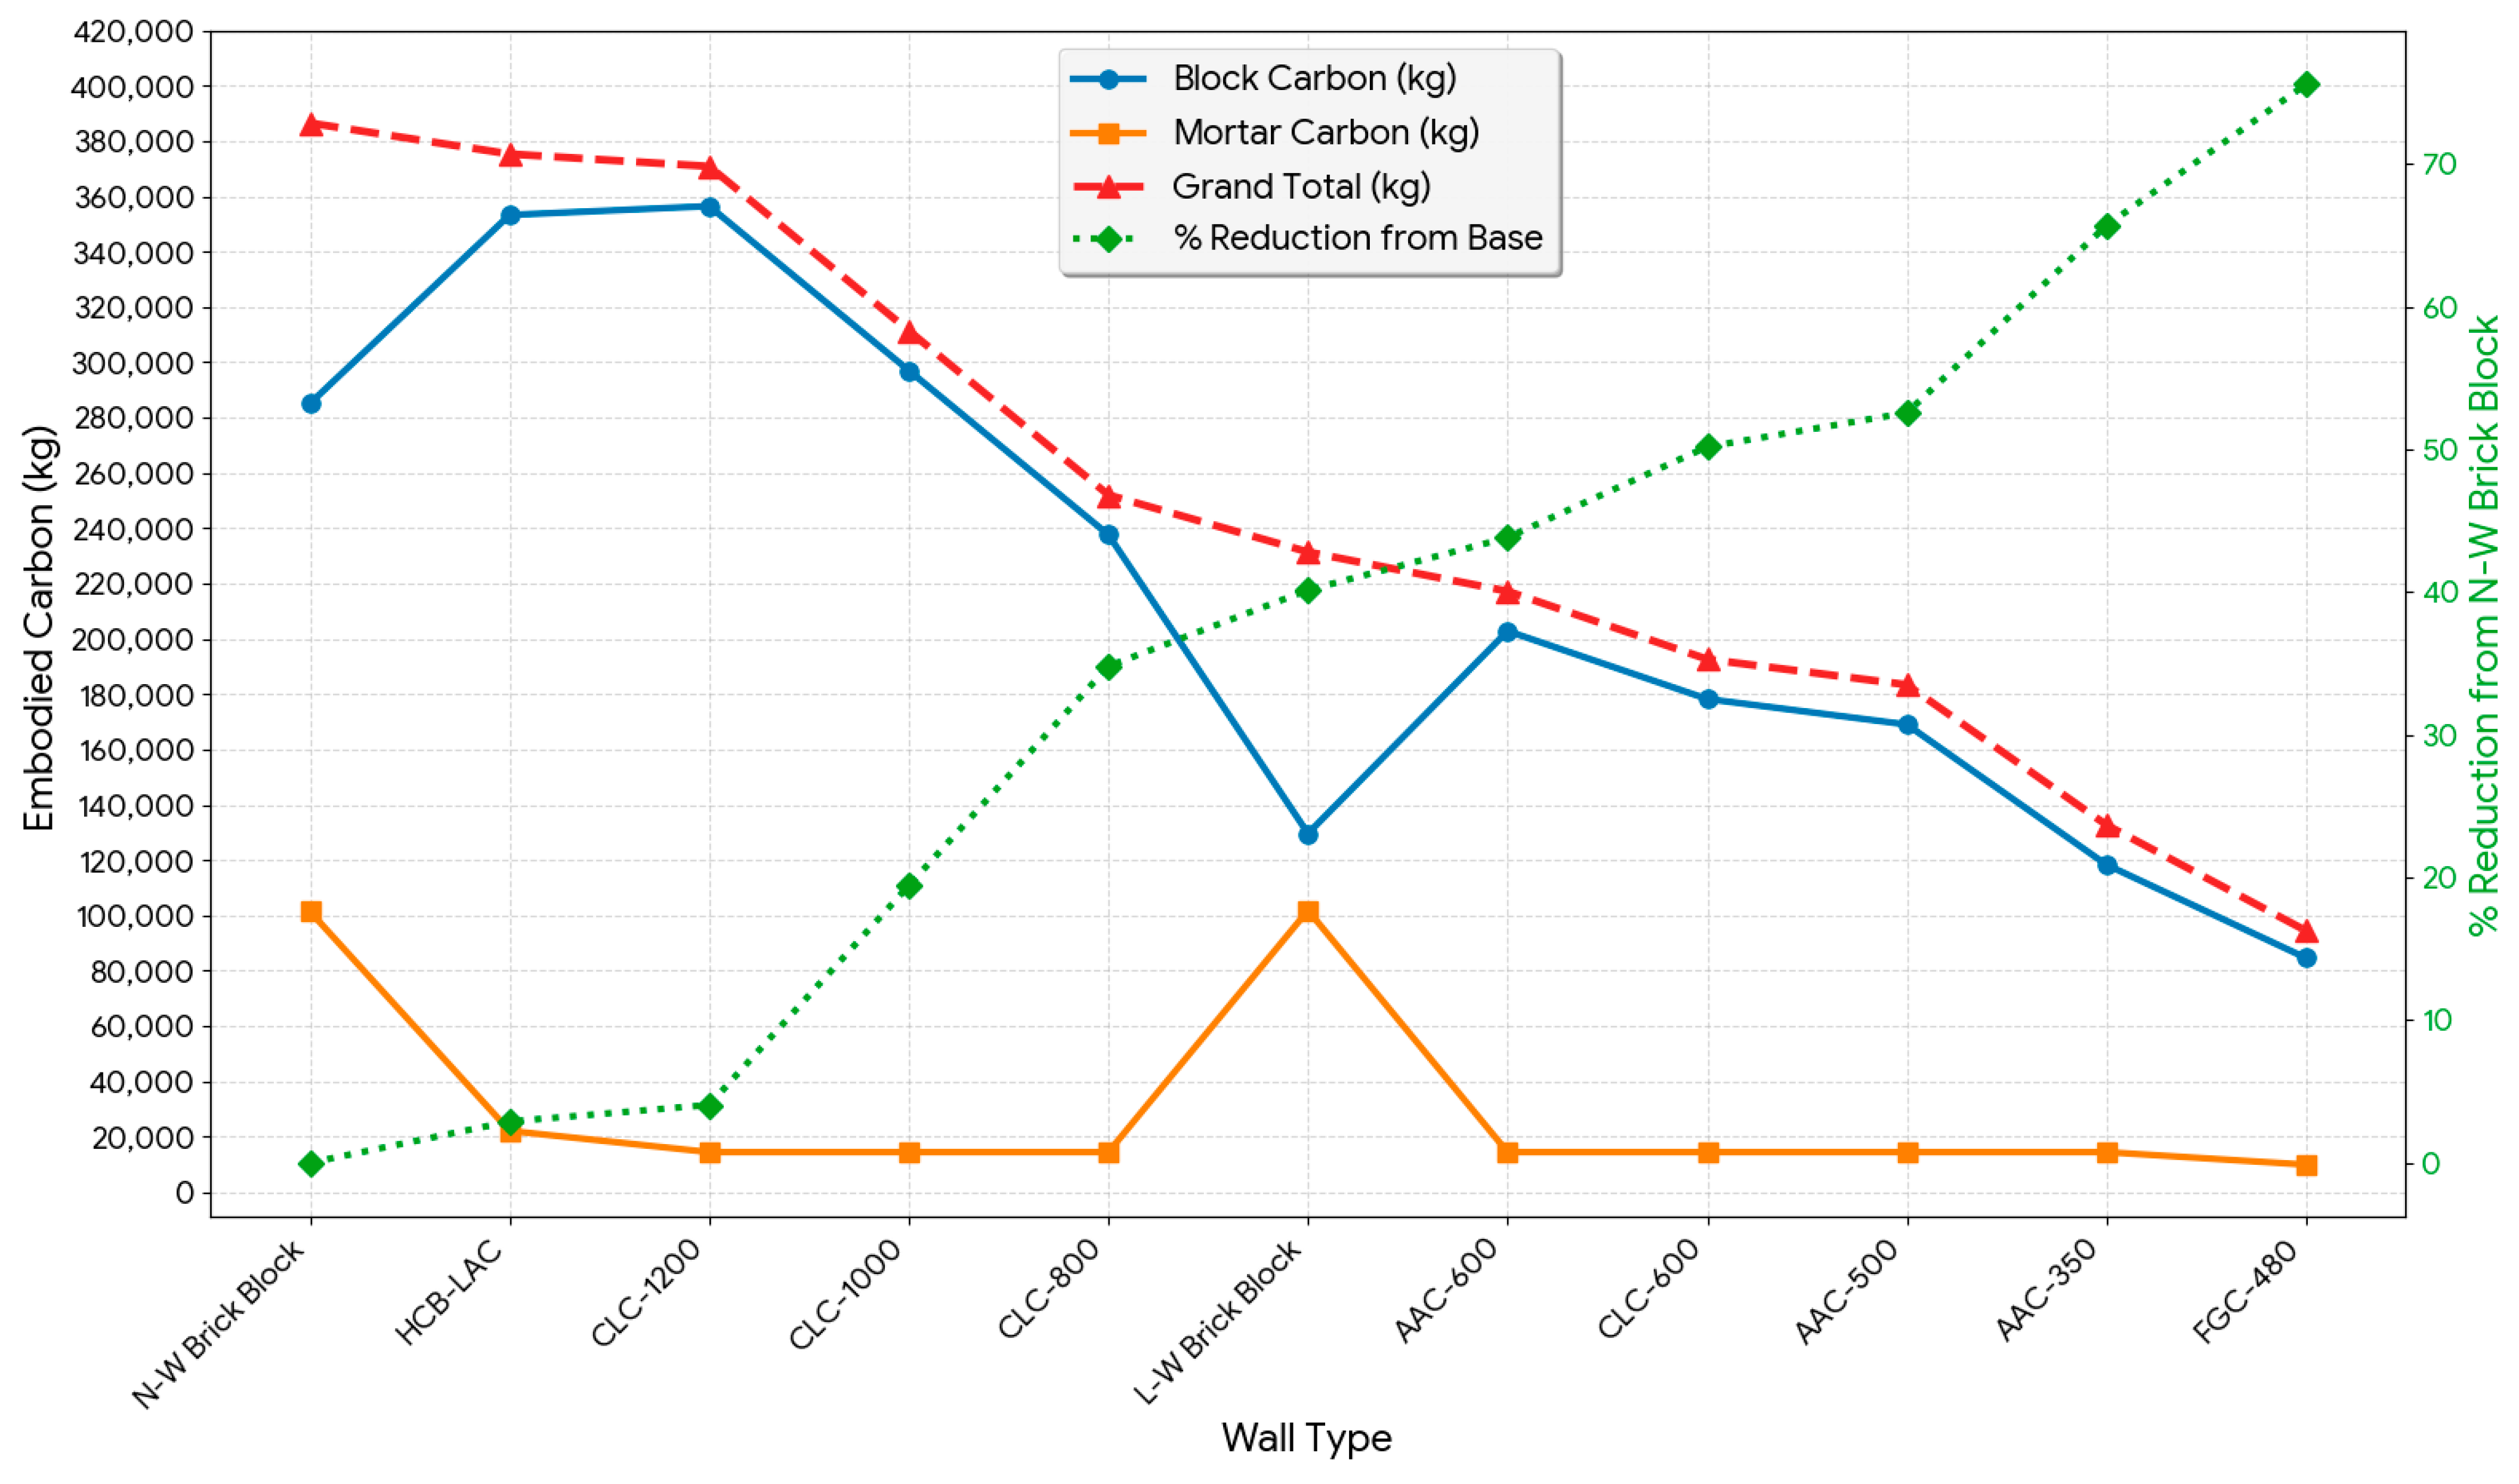
In the middle-class housing case, wall core embodied carbon varies widely across the alternative systems, from 94,425.24 kgCO2e to 386,500.72 kgCO2e. The baseline normal-weight brick wall system yields the highest total at 386,500.72 kgCO2e, with 285,102.29 kgCO2e from block units and 101,398.43 kgCO2e from mortar. Mortar accounts for 26.2% of the wall core total.
As in the affordable housing case, the AAC and CLC systems exhibit nearly fixed mortar embodied carbon due to thin-joint construction. Differences in total wall core embodied carbon are therefore driven mainly by the block component. Within the AAC family, total wall core embodied carbon increases from 132,683.83 kgCO2e for AAC-350 to 217,188.82 kgCO2e for AAC-600 as density increases. Within the CLC family, it increases from 192,605.55 kgCO2e for CLC-600 to 370,834.27 kgCO2e for CLC-1200.
FGC-480 achieves the lowest wall-core embodied carbon at 94,425.24 kgCO
2e, with 84,580.50 kgCO
2e from the block units and 9844.74 kgCO
2e from mortar. This is 75.6% lower than the baseline normal-weight brick system. High-density alternatives remain among the most carbon-intensive cases. HCB-LAC reaches 375,314.35 kgCO
2e, and CLC-1200 reaches 370,834.27 kgCO
2e, both dominated by block embodied carbon, as shown in
Figure 14.
3.7. Construction Time Comparison Across Wall Systems
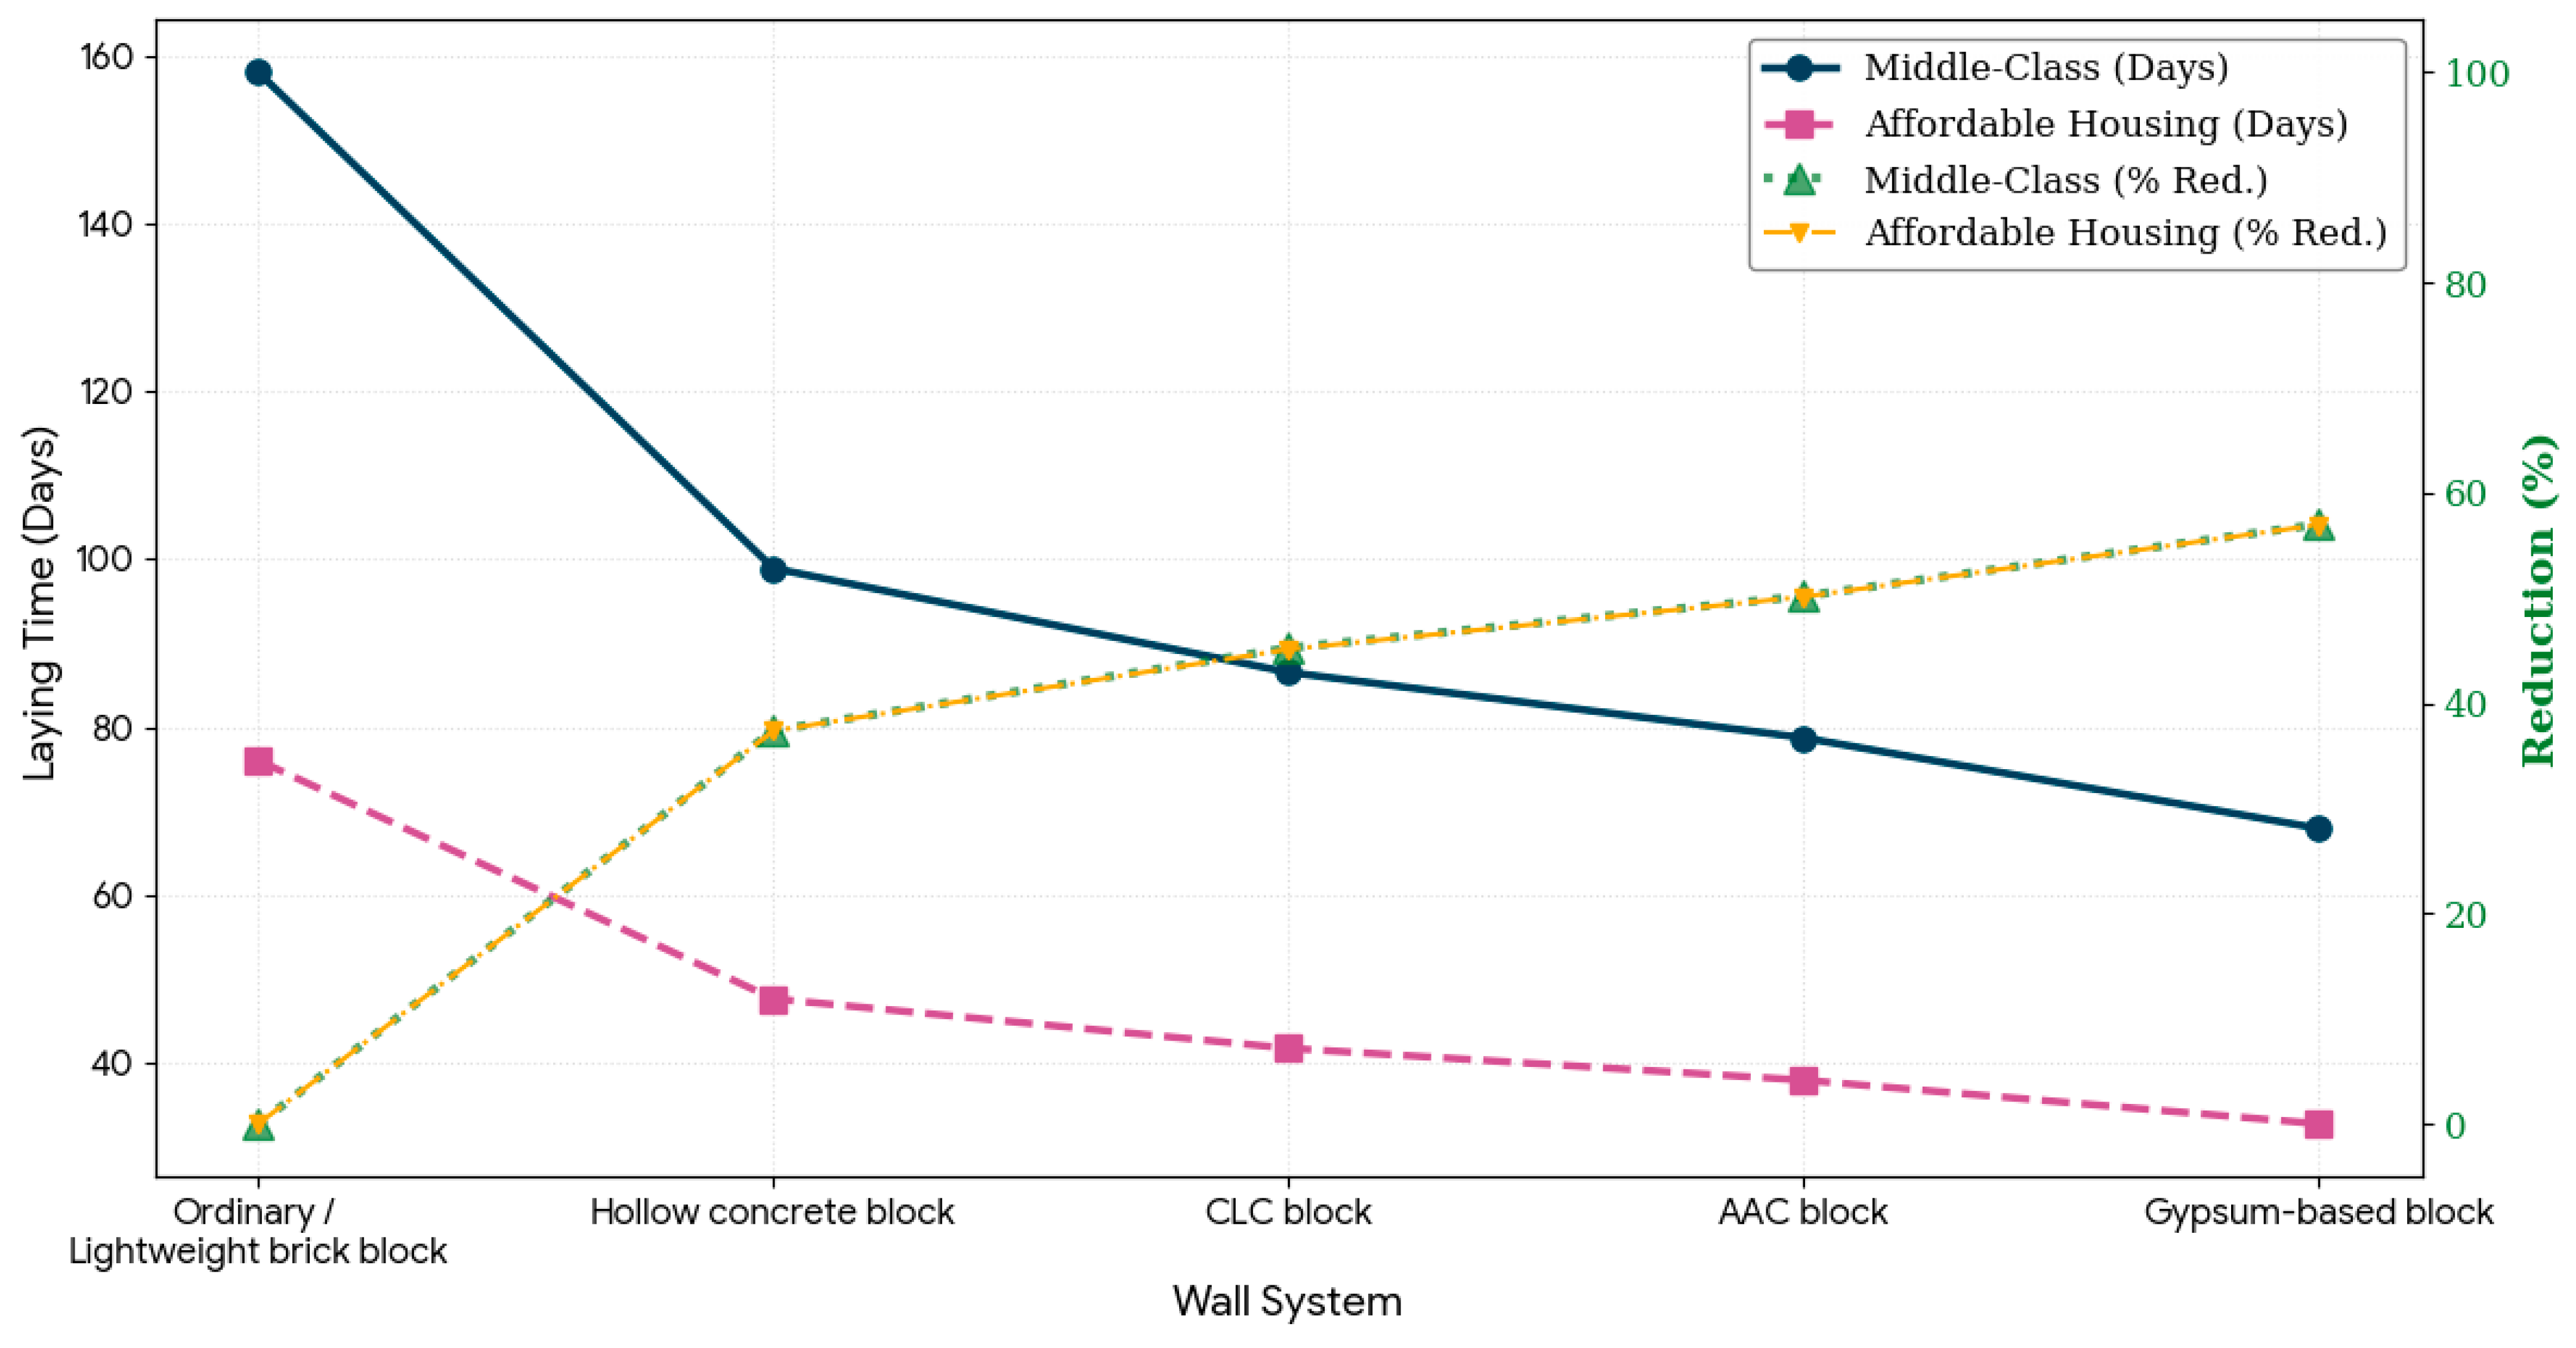
Wall construction duration was compared using an area-based productivity model with a consistent crew. Productivity varies with unit size, weight, jointing method, and cutting demand. Lightweight brick masonry yields the lowest productivity, about 12 m2 per gang per day. Hollow concrete blocks increase productivity to about 18 m2 per gang per day. AAC reaches about 22 m2 per gang per day because of larger units and thin-joint construction. CLC reaches about 20 m2 per gang per day, while gypsum-based blocks achieve the highest productivity at about 25 m2 per gang per day due to large units, reduced cutting, and adhesive or dry-joint installation.
Baseline wall construction duration is 158.0 days for the middle-class housing case and 76.0 days for the affordable housing case. For the alternative wall systems, duration decreases to 67.9 to 98.9 days in the middle-class case and to 32.7 to 47.6 days in the affordable case. Gypsum-based blocks yield the largest reduction, about 57.0% in both buildings. AAC follows at about 50%, CLC at about 45%, and hollow concrete blocks at about 37%, as shown in
Figure 15. Across all systems, middle-class durations remain about 2.08 times those of affordable housing, indicating that execution time scales approximately with wall quantity under the same productivity assumptions.
3.8. Thermal Performance of Alternative Wall Systems
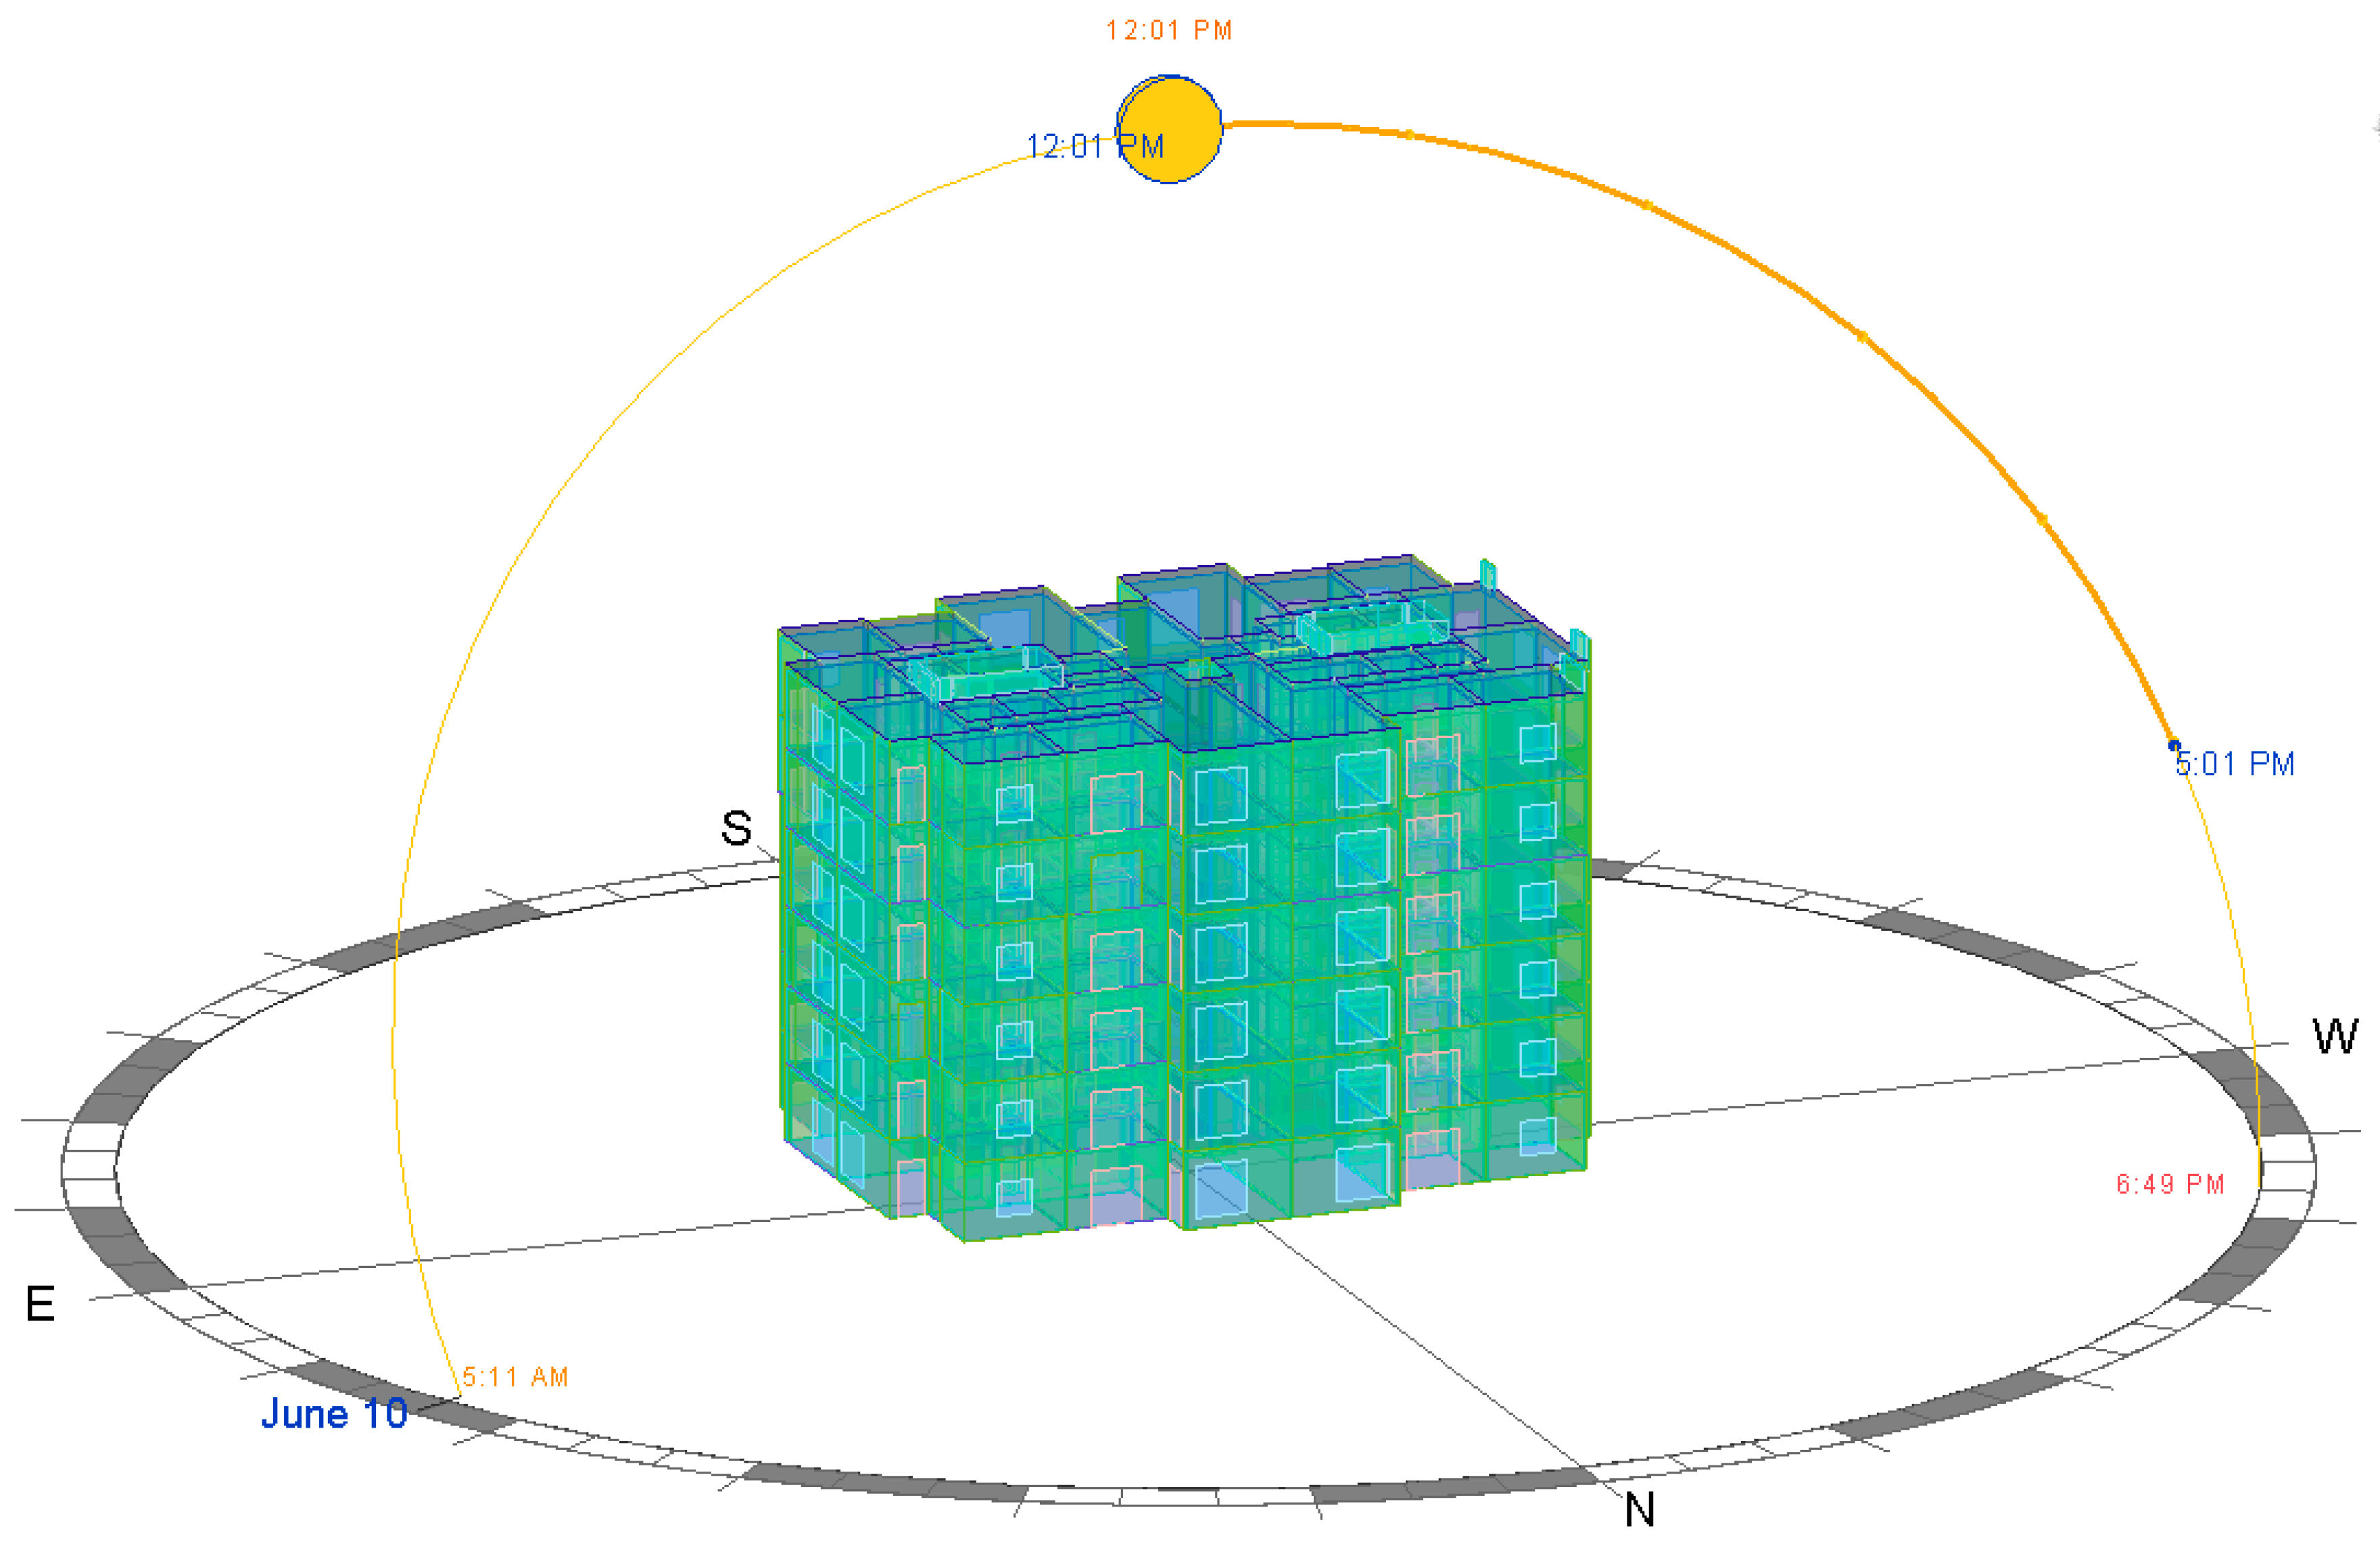
Operational performance was assessed using an EnergyPlus-based simulation to quantify the impact of wall thermal properties on cooling demand in multi-unit residential buildings under hot-arid climatic conditions. The simulations used BIM-derived geometry and material inputs and were benchmarked against an ASHRAE Standard 90.1 baseline under consistent climatic and operating assumptions.
Figure 16 shows the energy model used for the middle-class housing case.
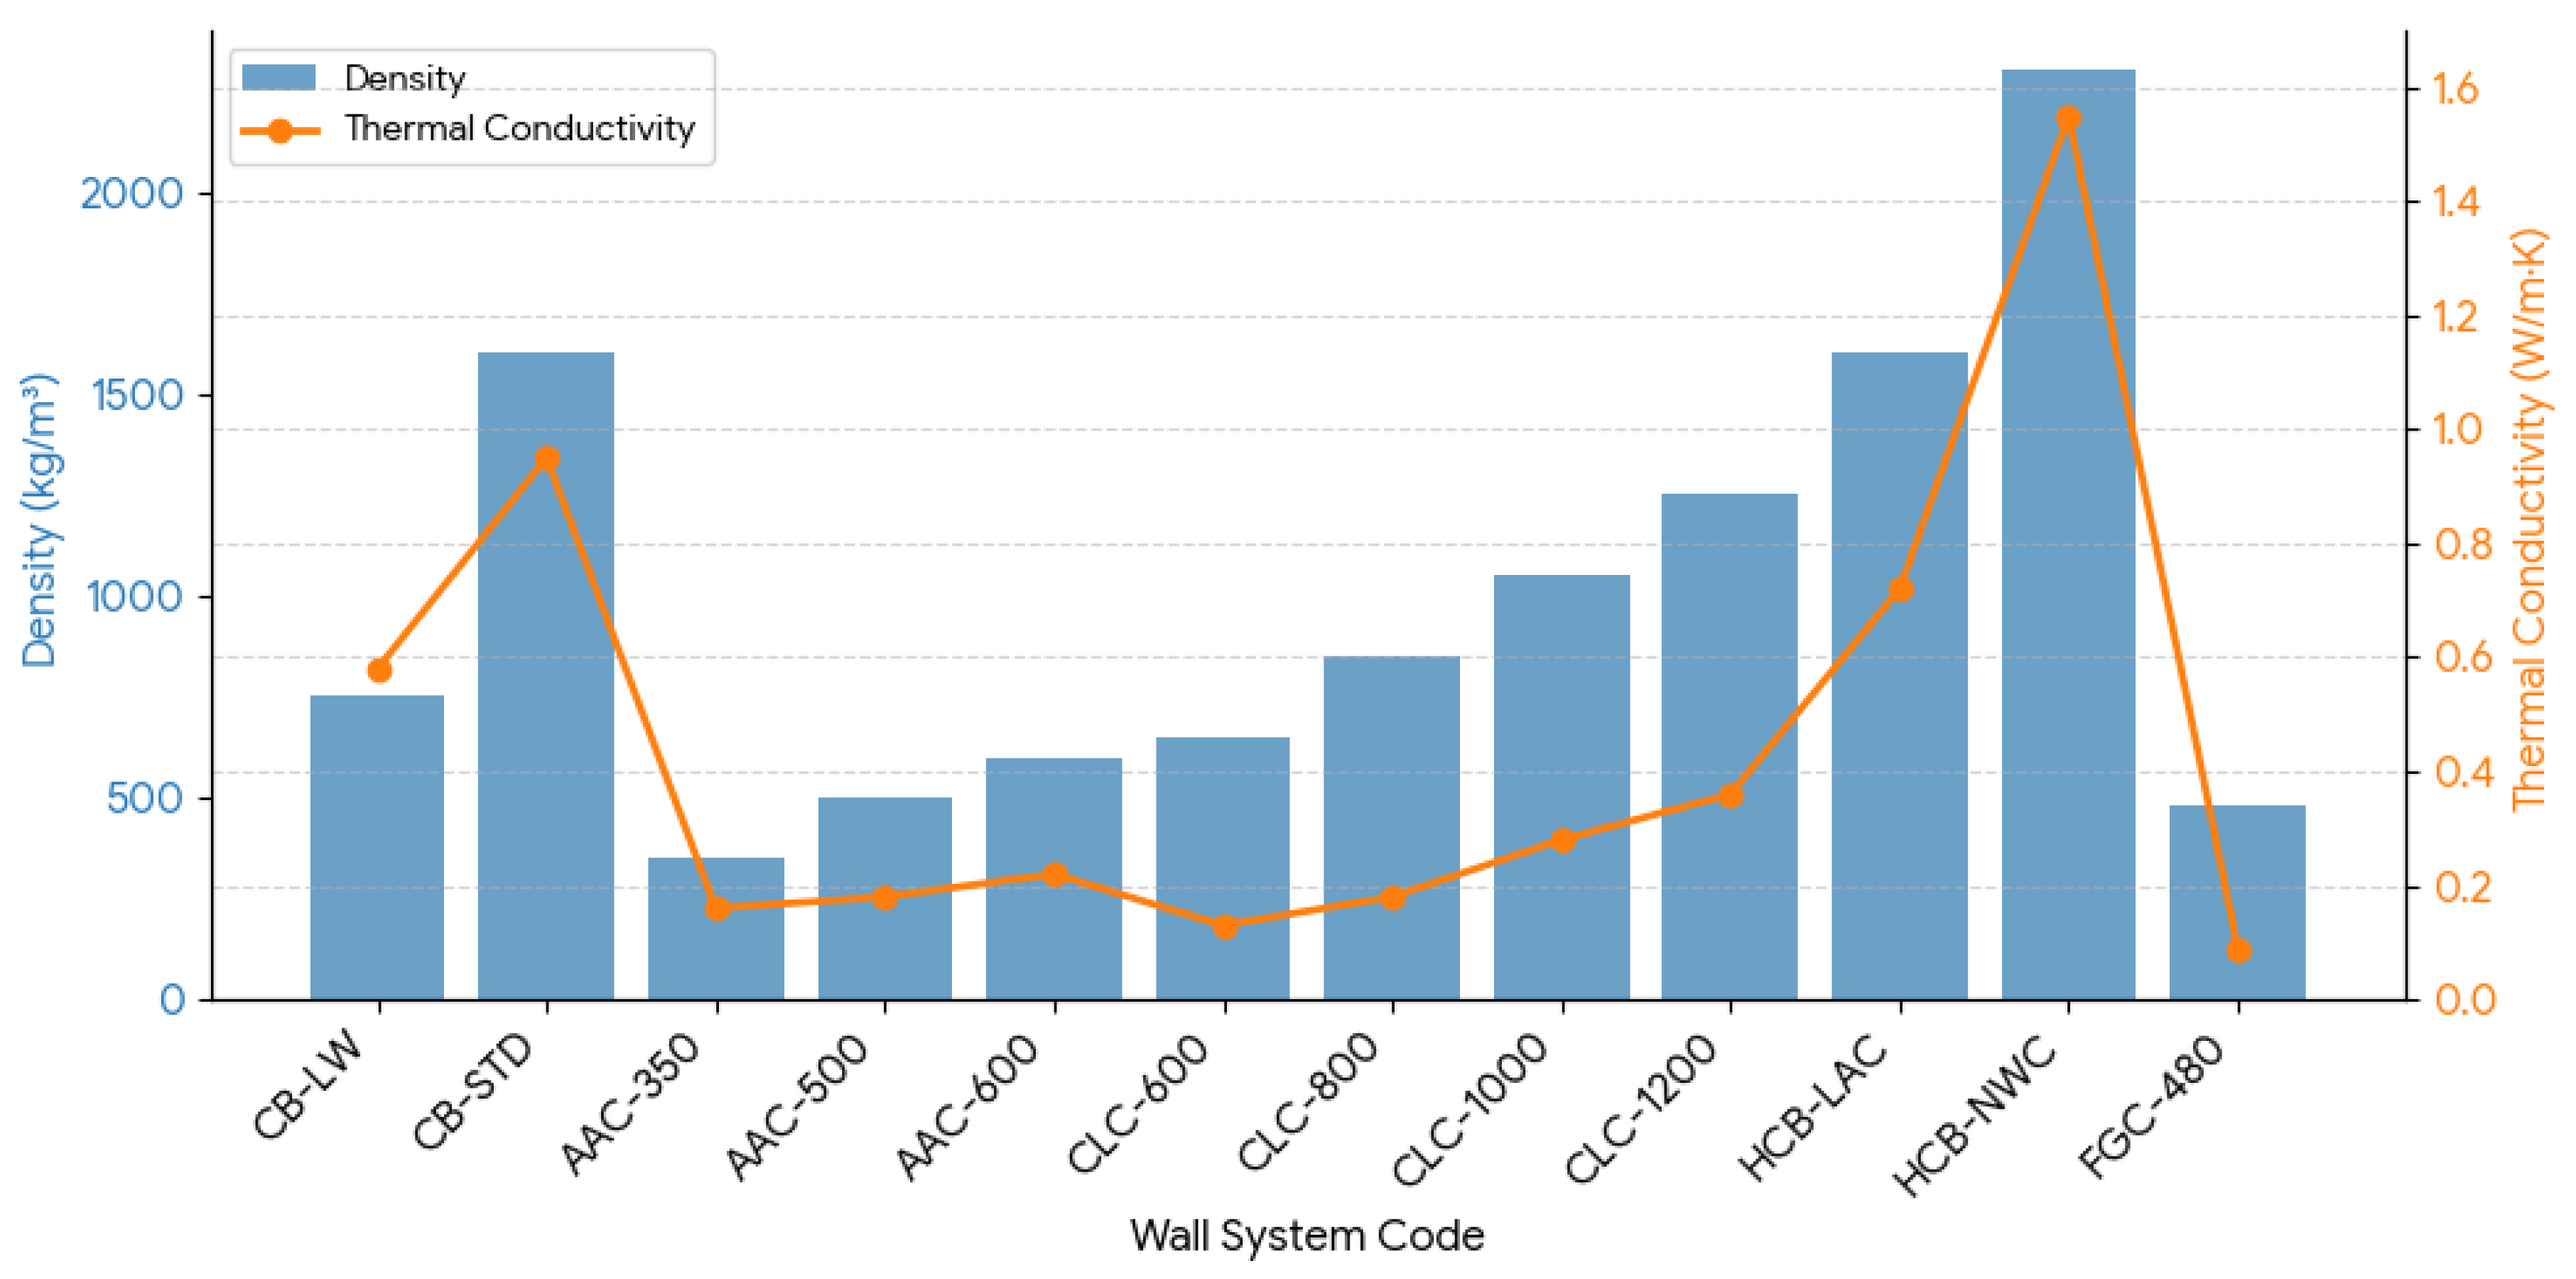
Table 5 shows the relationship between wall thermal conductivity and the annual cooling energy-use intensity. Conventional clay brick masonry, CB-STD, with a thermal conductivity of 0.90 W/m·K, was used as the baseline, at 200 kWh/m
2·y. Across the alternative systems, lower thermal conductivity consistently reduces cooling demand.
The lowest-conductivity wall systems deliver the best thermal performance. FGC-480, with a thermal conductivity of 0.12 W/m·K, yields the lowest cooling energy use intensity at 155.63 kWh/m2·y, representing a reduction of 44.37 kWh/m2·y, or about 22.2%, relative to the baseline. AAC-350 yields 160.00 kWh/m2·y, while CLC-600 yields 159.13 kWh/m2·y. As thermal conductivity increases within the AAC and CLC families, cooling demand rises progressively. For example, CLC increases from 159.13 kWh/m2·y at CLC-600 to 174.08 kWh/m2·y at CLC-1200.
Moderate-performance systems yield smaller savings. CB-LW reduces cooling energy use intensity to 185.51 kWh/m2·y, a reduction of about 7.2%, while HCB-LAC reduces it to 192.12 kWh/m2·y, a reduction of about 3.9%. In contrast, HCB-NWC performs worse than the baseline. With a thermal conductivity of 1.55 W/m·K, it increases cooling energy use intensity to 217.59 kWh/m2·y, which is 17.59 kWh/m2·y above the baseline, or about 8.8% higher.
3.9. Operational Carbon Comparison Across Wall Systems
The operational carbon assessment combined cooling-related electricity use with fixed non-cooling end uses, including lighting and plug loads. Because wall system substitution directly affects cooling demand through thermal conductivity, cooling was treated as the primary variable in the wall system comparison. At the same time, lighting and equipment loads were held constant.
Annual operational carbon was calculated by converting modeled electricity demand to CO
2e using the selected grid emission factor and the Electricity Generation Mix, as shown in
Figure 17.
Table 6 summarizes the life-cycle carbon-intensity ranges for major electricity sources, and
Table 7 reports the fixed energy-use intensities for non-cooling electricity demand.
Table 6.
Comparative life-cycle CO2 equivalent emissions per kWh for electricity sources.
Table 6.
Comparative life-cycle CO2 equivalent emissions per kWh for electricity sources.
| Energy Source | Equivalent (g CO2eq/kWh) | Source |
|---|
| Coal | 820 | IPCC AR5 Chapter 7 [54]; UNECE LCA Report (2021) [55] |
| Oil | ~650 | NREL 2021 Update [56]; World Nuclear Assoc. comparison |
| Natural Gas | 490 | UNECE (2021) [54]; NREL (2021) [57] |
| Hydropower | 24 | IPCC AR5; UNECE (2021) [55] |
| Renewables | 12 | NREL Life Cycle Update (2021) [56]; UNECE (2021) [55]; IPCC SRREN (2011) [54] |
Table 7.
Annual energy use intensity (EUI) breakdown by end use.
Table 7.
Annual energy use intensity (EUI) breakdown by end use.
| Category | Energy Use per Year (kWh/m2) |
|---|
| Interior Lighting | 23.662 |
| Interior Equipment | 33.803 |
Figure 17.
Egypt’s electricity generation mix in 2023 [
58].
Figure 17.
Egypt’s electricity generation mix in 2023 [
58].
Conditioned floor area for cooling was limited to the main occupied spaces, primarily bedrooms and living areas, while service and circulation spaces were excluded from cooling calculations. This reflects typical air-conditioning practices in Egyptian residential buildings.
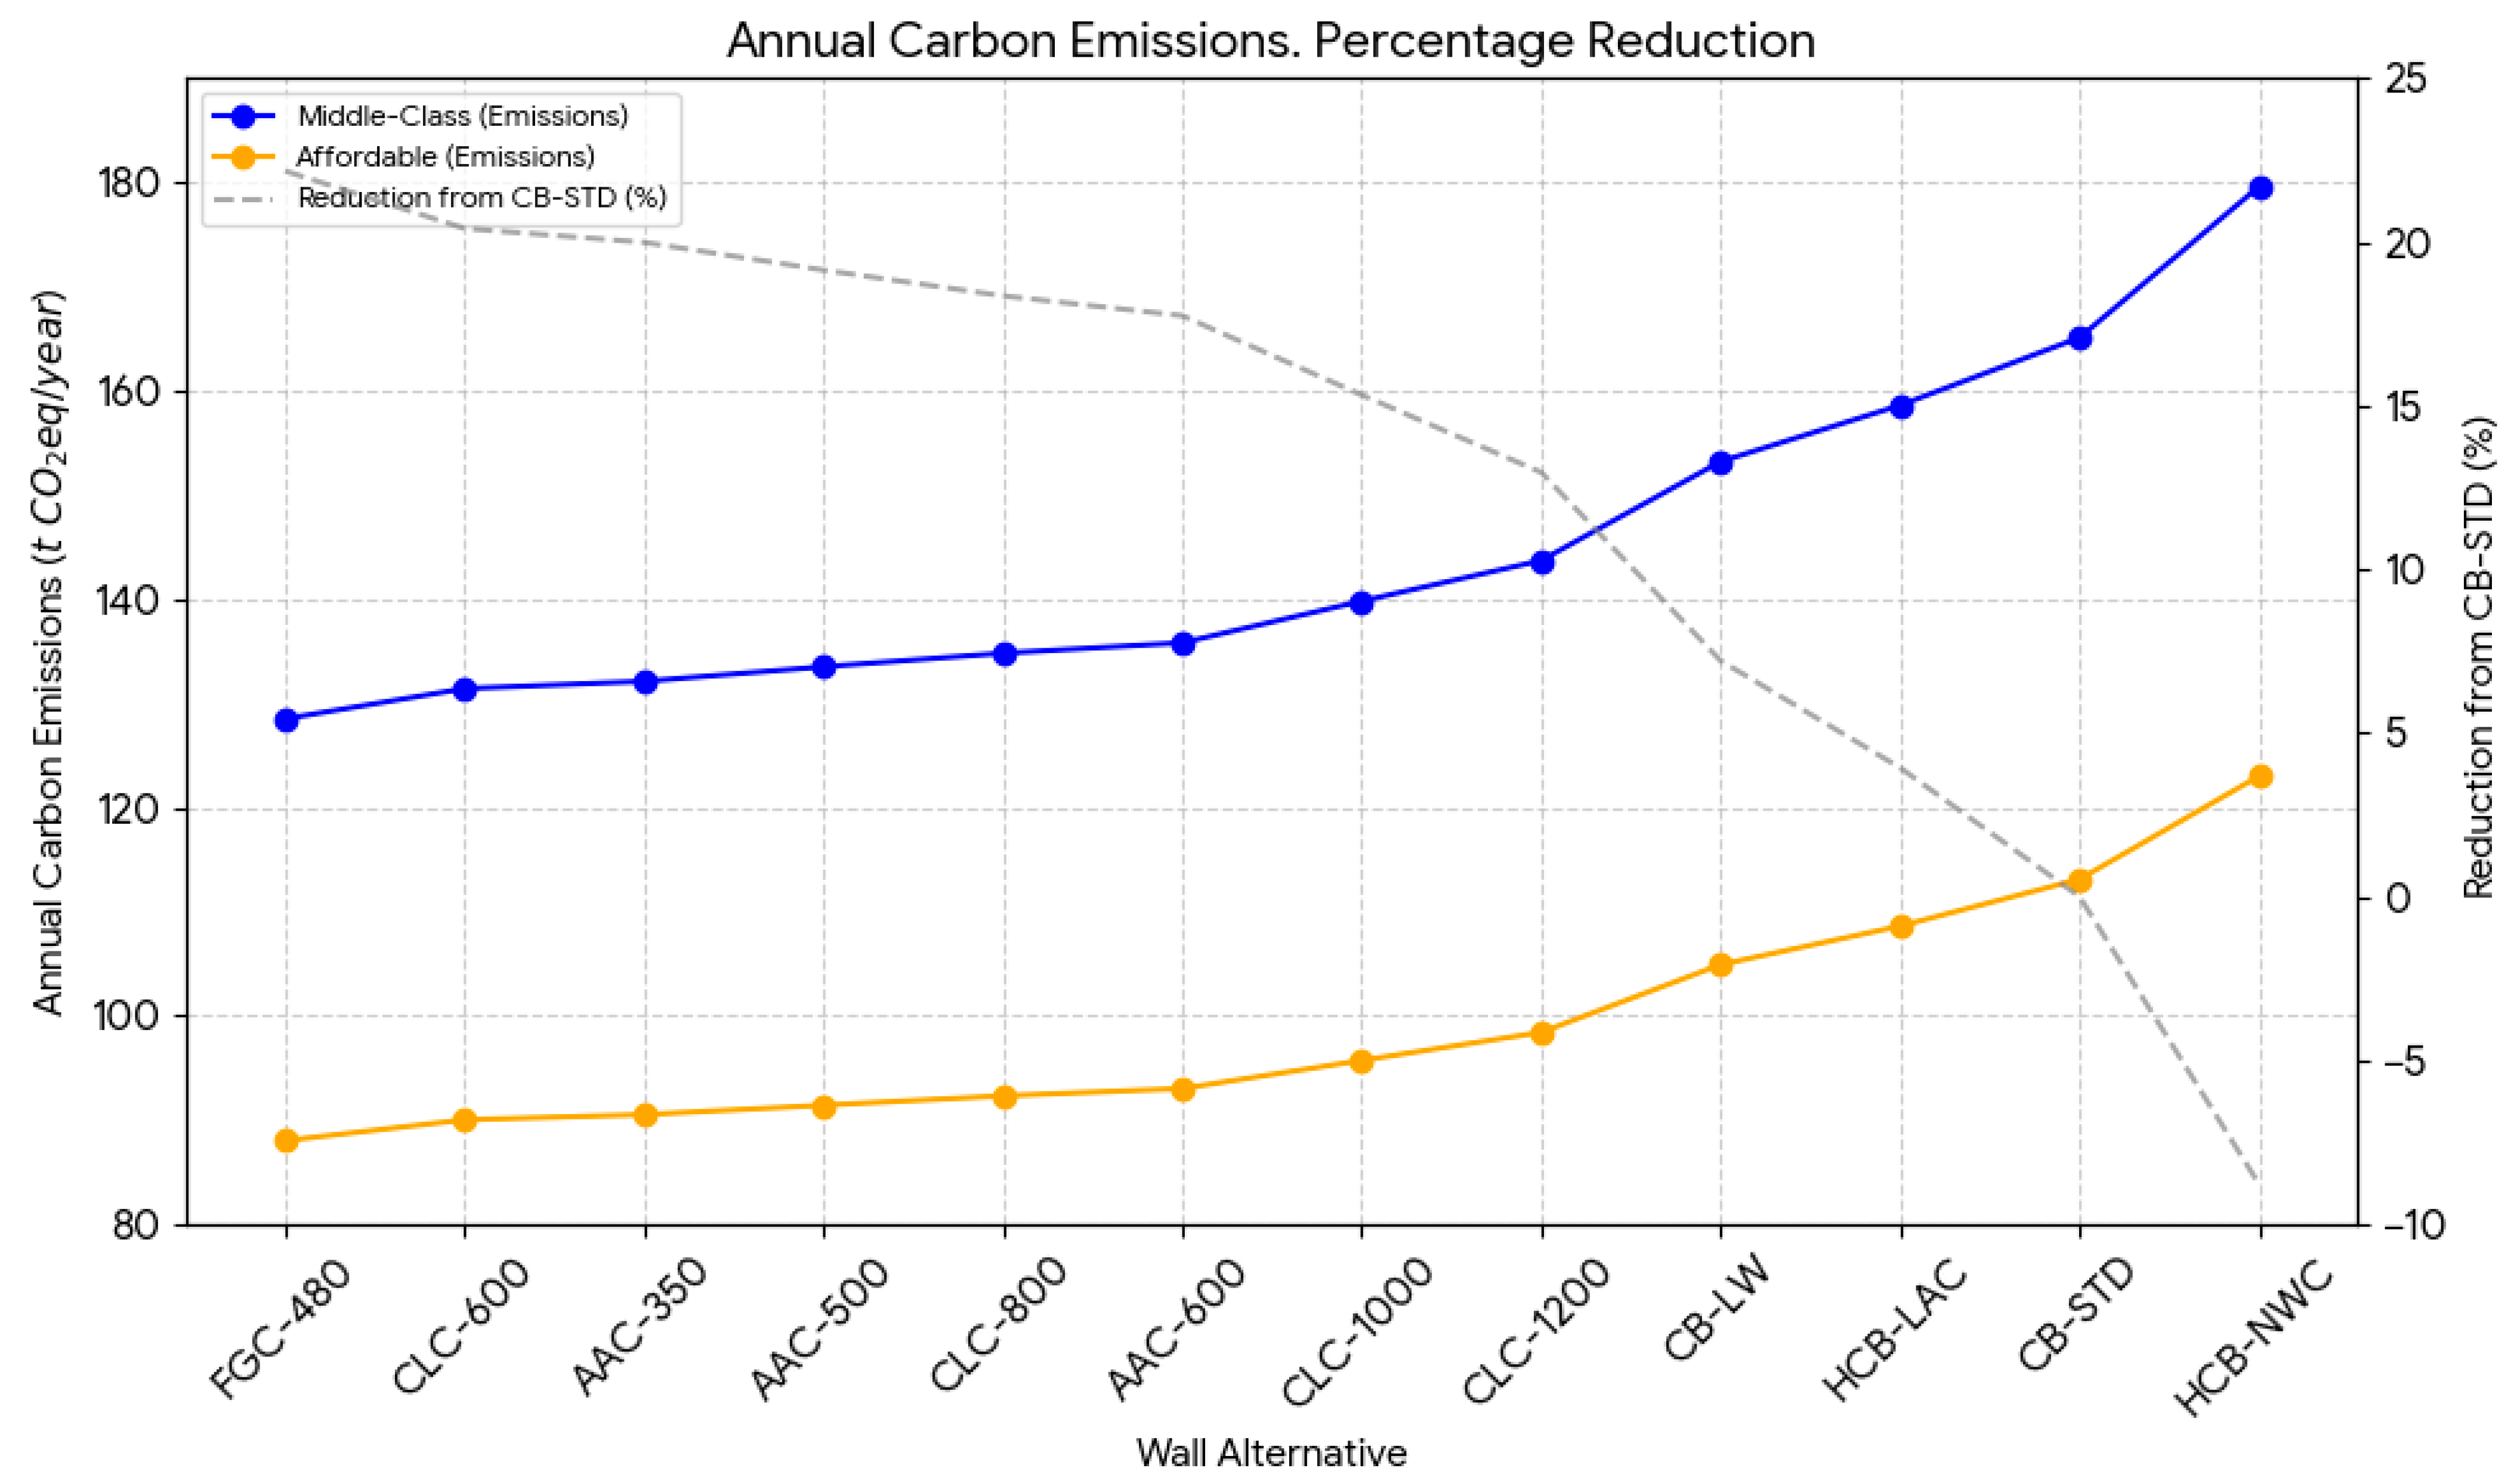
Figure 18 compares annual cooling-related operational carbon across the tested wall systems in the affordable and middle-class housing cases. FGC-480 achieves the lowest annual cooling carbon at 128.5 tCO
2eq/year in the middle-class housing case and 88.0 tCO
2eq/year in the affordable housing case. Relative to the CB-STD baseline, this corresponds to a 22.2% reduction in both cases.
AAC and CLC alternatives form a relatively narrow middle-performance band. In the middle-class housing case, annual cooling carbon for these systems ranges from about 131 to 144 tCO2eq/year. Within the CLC family, annual cooling carbon increases steadily from CLC-600 to CLC-1200 as thermal conductivity rises, which is consistent with the progressive increase in cooling energy use intensity reported earlier.
The highest operational carbon values are associated with conventional and heavier wall systems. Although CB-LW and HCB-LAC perform better than HCB-NWC, they remain above the CB-STD baseline in the ranking of best-performing alternatives. HCB-NWC yields the highest annual cooling carbon at 179.6 tCO2eq/year in the middle-class housing case and 123.0 tCO2eq/year in the affordable housing case, corresponding to an 8.8% increase relative to the CB-STD baseline.
3.10. Cost Implications of Lightweight Wall Substitution
Reducing wall density lowers structural dead load and seismic mass, thereby reducing reinforcement demand.
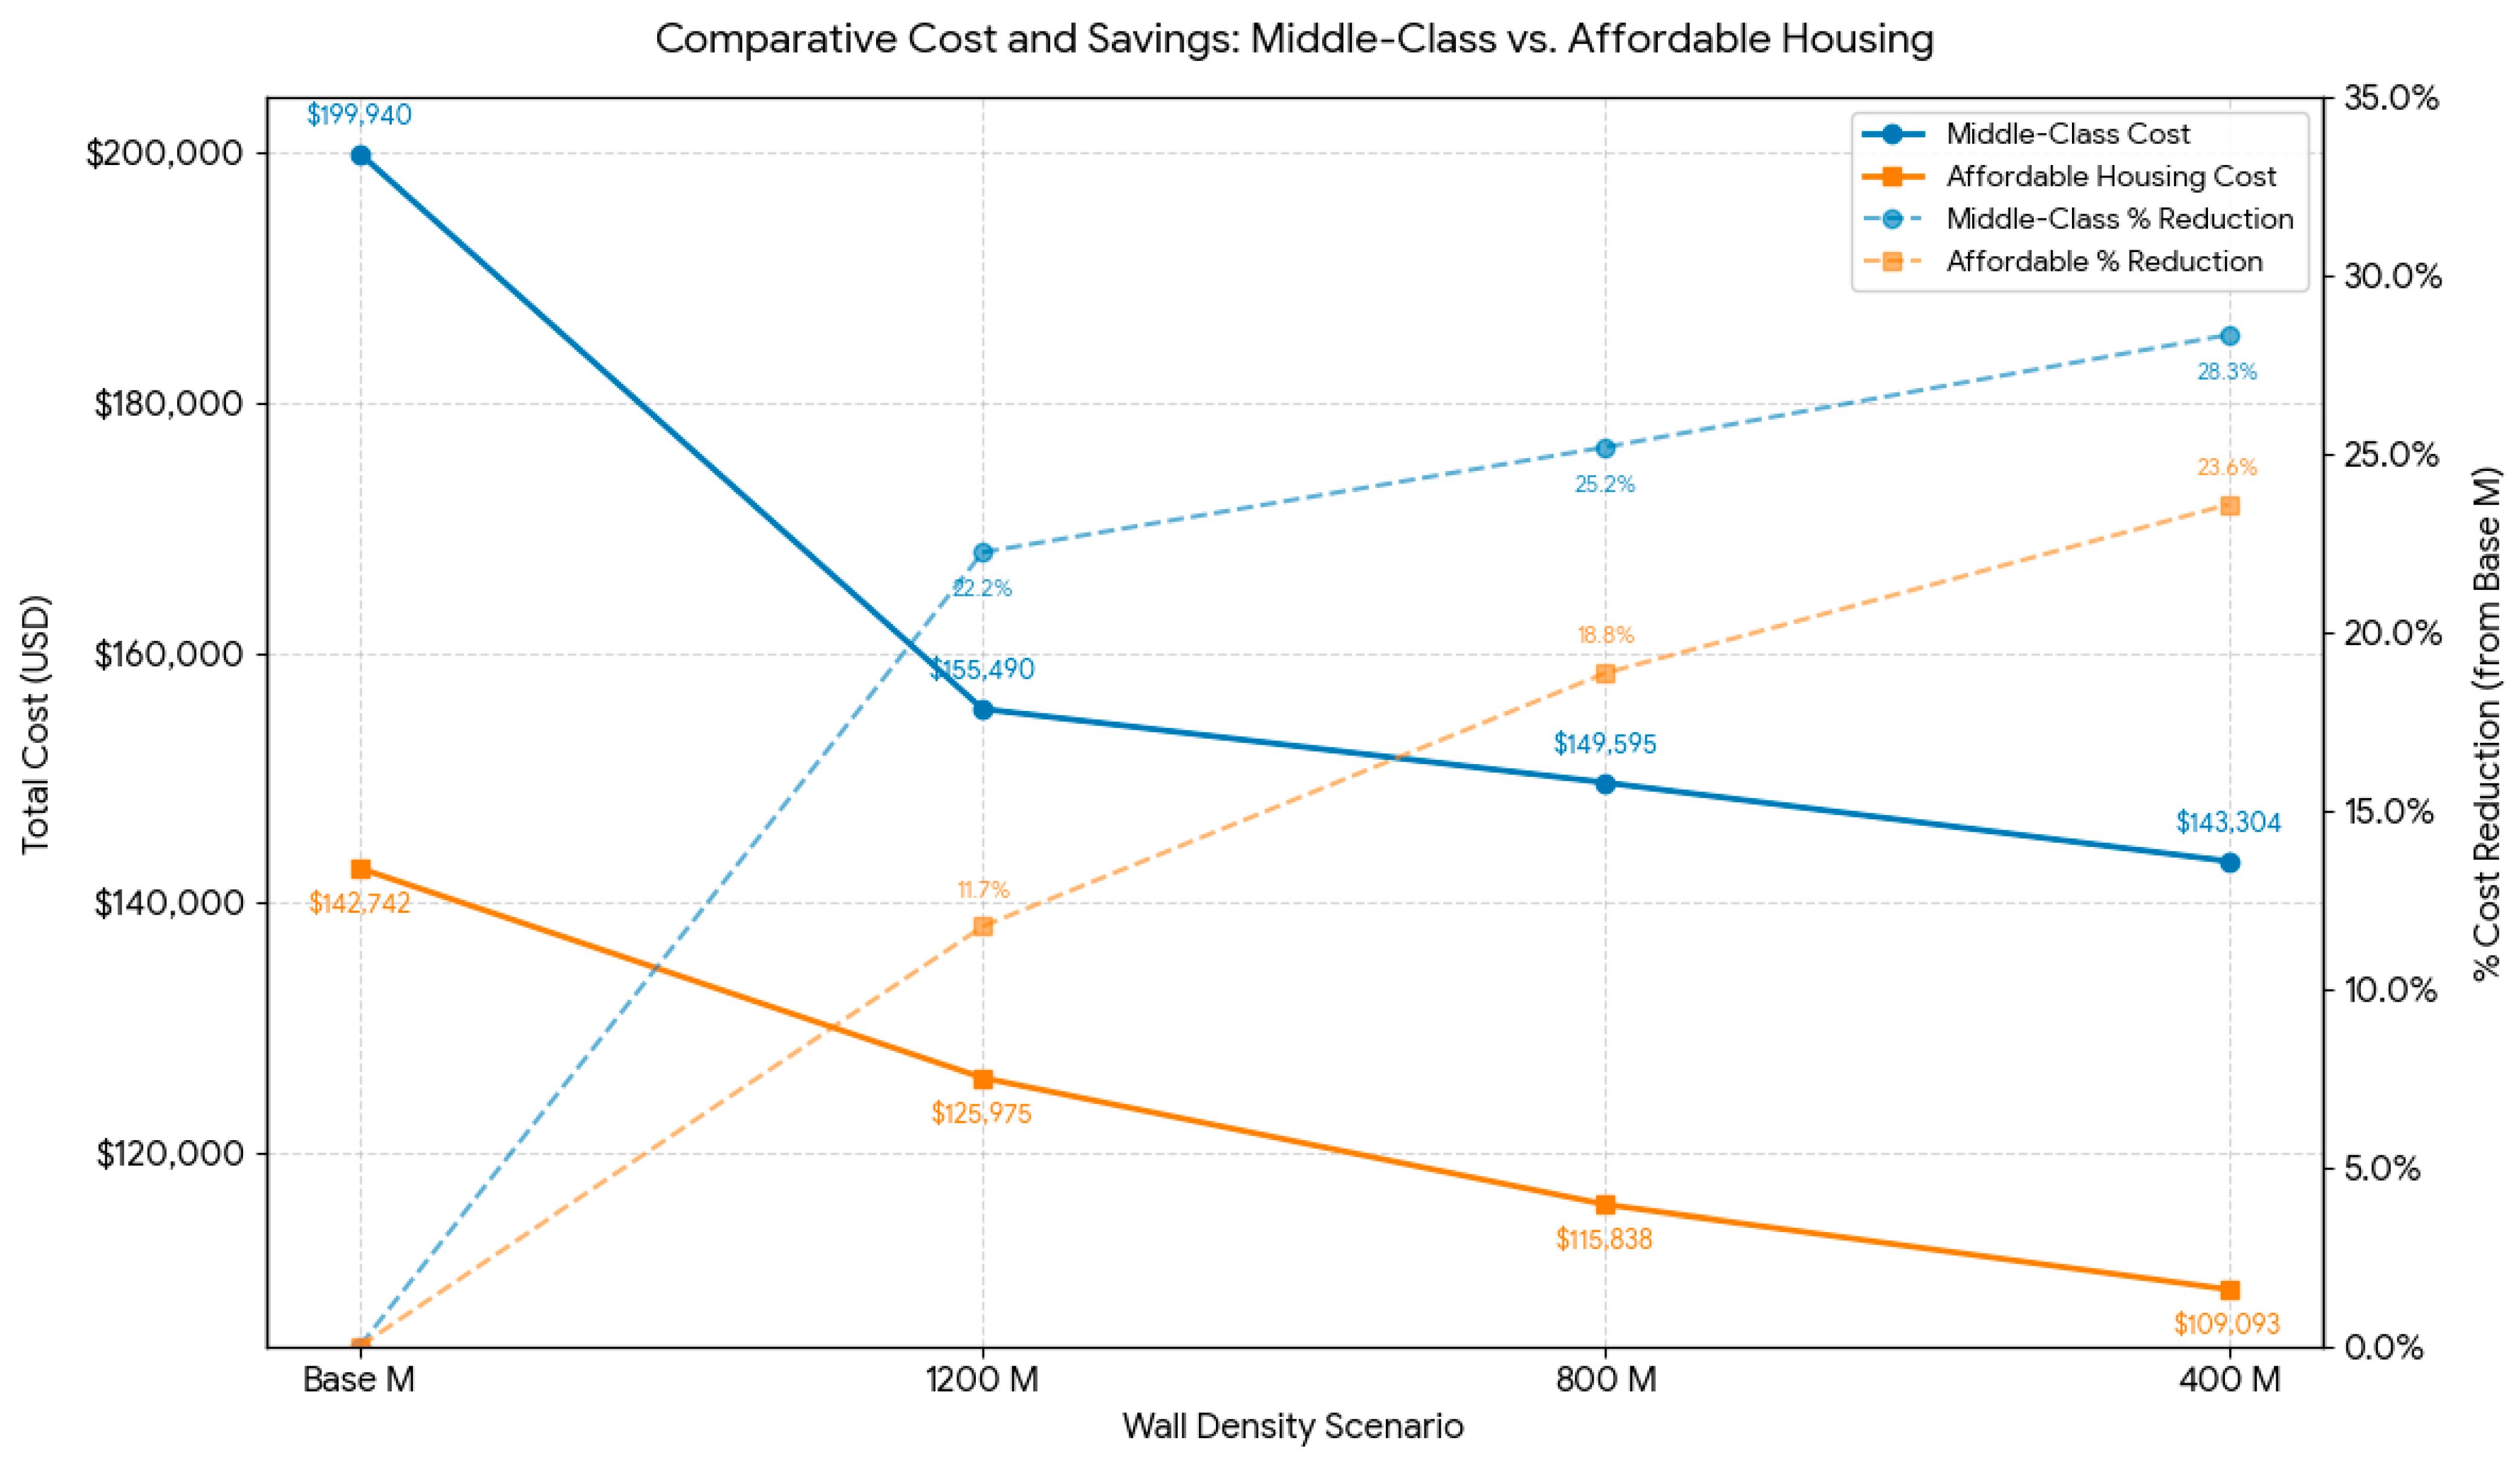
Figure 19 shows the sensitivity of reinforcement-related cost to wall density in the affordable and middle-class housing cases.
In the middle-class housing case, reinforcement-related cost decreases from 199,940 at the baseline density to 155,490 at 1200 kg/m3, 149,595 at 800 kg/m3, and 143,304 at 400 kg/m3. These values correspond to reductions of 22.2%, 25.2%, and 28.3%, respectively. The largest saving occurs in the 400 kg/m3 case, with a reduction of about 56,636 relative to the baseline.
In the affordable housing case, reinforcement-related cost decreases from 142,742 at the baseline density to 125,975 at 1200 kg/m3, 115,838 at 800 kg/m3, and 109,093 at 400 kg/m3. These values correspond to reductions of 11.7%, 18.8%, and 23.6%. The maximum savings are about 33,649 in the 400 kg/m3 case. Although the absolute savings remain substantial in both projects, the percentage reduction is lower in the affordable housing case, which reflects differences in baseline reinforcement demand and structural sizing margins between the two housing types.
3.11. Direct Cost and Schedule Comparison for Wall Systems
A direct cost comparison was carried out for 1000 m
2 of wall area under Egyptian 2026 price conditions to compare AAC walling with conventional red brick construction.
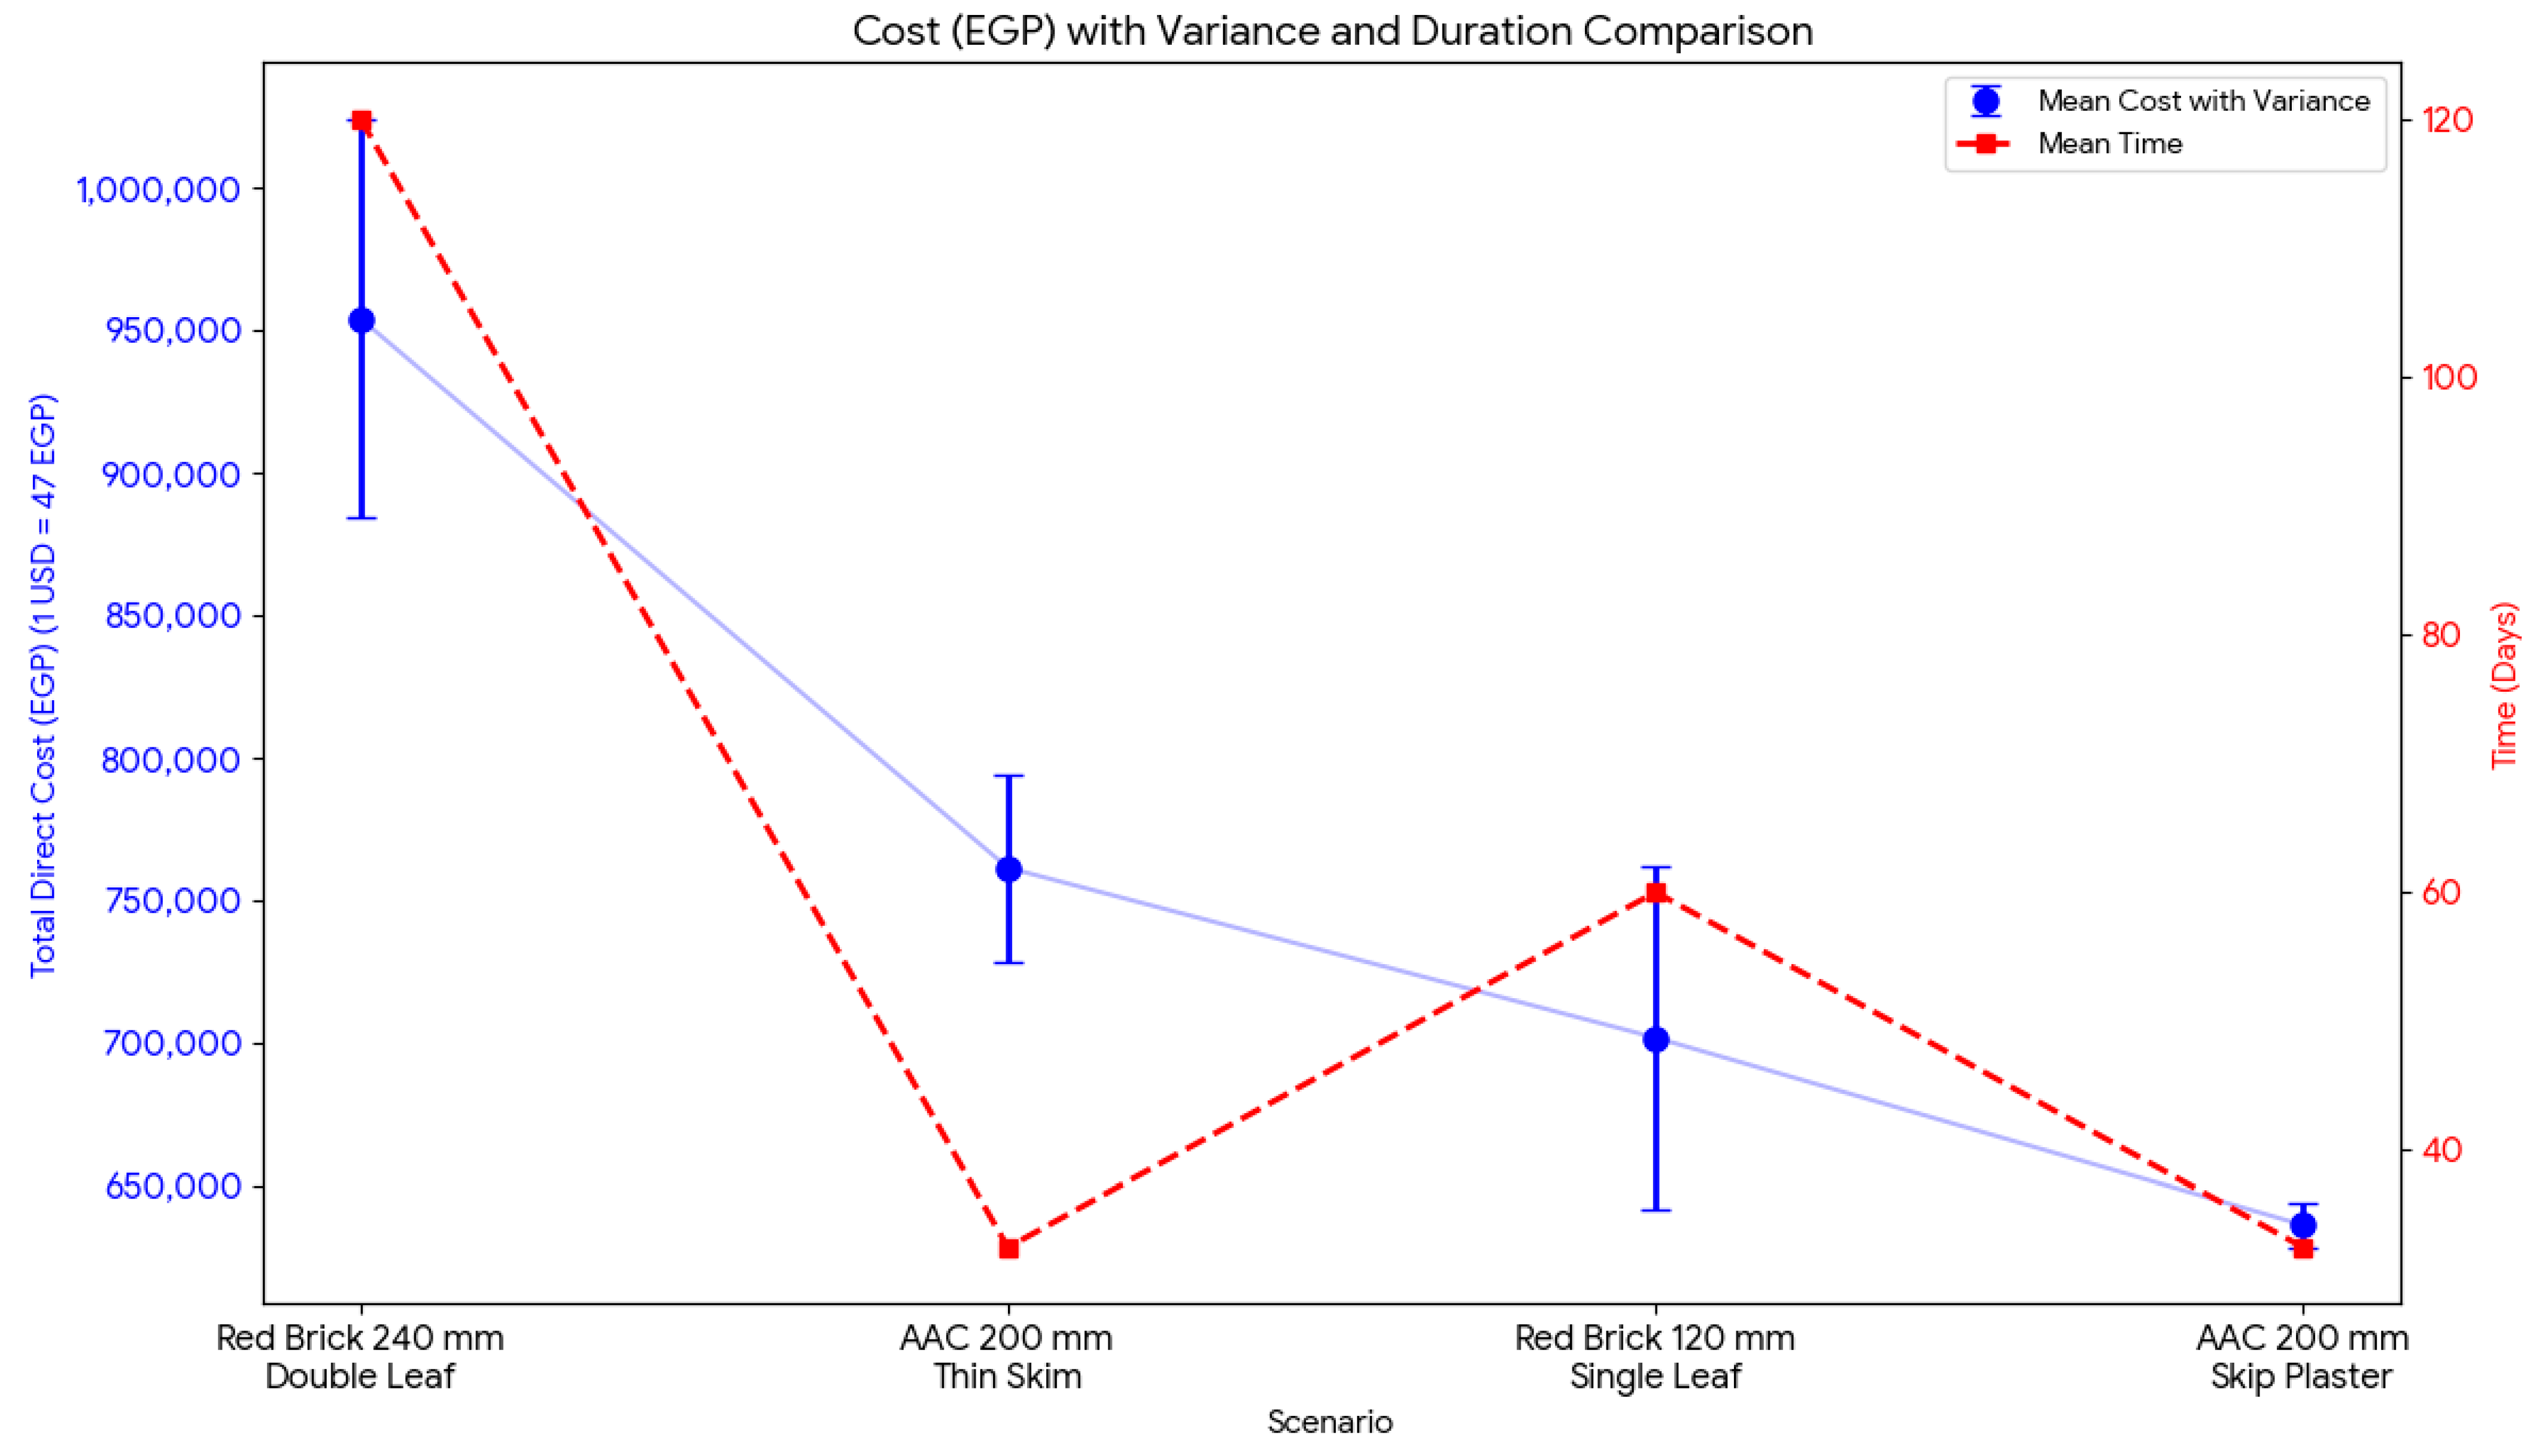
Figure 20 shows the cost schedule trade-off between the systems.
Although AAC has a higher unit purchase cost than red brick, its lower waste rate, lower mortar demand, and faster installation reduce total walling cost. For the 240 mm red brick wall, the total direct cost ranges from 884,144 to 1,024,144 EGP, with a construction duration of 110 to 130 days. For AAC with a thin skim finish, the total direct cost ranges from 728,800 to 794,400 EGP, with a construction duration of 30 to 35 days. This corresponds to a cost savings of 89,744 to 295,344 EGP and a schedule reduction of 75 to 100 days.
With the skip plaster option, AAC yields the lowest direct cost, ranging from 628,800 to 644,400 EGP, while maintaining the same 30- to 35-day installation period. Relative to the 240 mm red brick wall, this increases the savings to 239,744–379,744 EGP.
At the unit material level, AAC remains more expensive than red brick. However, when labor, installation rate, waste, mortar demand, and execution time are included, the total walling cost becomes competitive. At the same time, the associated reduction in structural demand also lowers reinforcement costs by about 25%.
4. Results, Discussion, and Conclusions
The integrated BIM-based digital twin provided a traceable workflow for linking quantity take-off, structural assessment, and energy simulation in support of sustainable housing assessment. The architectural model defined spaces, envelope assemblies, and material quantities, while the structural model quantified the effects of changes in wall density on slabs, columns, and foundations. This integrated workflow enabled tracking of how wall system substitution affects embodied carbon, operational carbon, and structural demand within a single assessment framework.
A key finding is that non-structural cement use forms a major but often overlooked carbon source.
Table 8 shows that mortars account for 36% of total cement demand in both case studies, equal to 161 tons in the affordable housing case and 229 tons in the middle-class housing case. This identifies a separate reduction pathway outside of the main structural frame. Replacing thick masonry mortars with thin-bed AAC adhesive, using tile adhesive for floor finishes, and adopting fair-faced blockwork and slab surfaces could avoid 161 to 229 tons of non-structural cement per building, with an average potential reduction of about 195 tons.
The finite element results also show that reinforcement demand decreases as wall density decreases, but the reduction is not proportional to the density. In the affordable housing case, the embodied carbon of reinforcement decreases from 83.97 tons at 1800 kg/m3 to 64.17 tons at 400 kg/m3, a reduction of 23.6%. In the middle-class housing case, it falls from 117.61 tons to 84.30 tons, a reduction of 28.3%. The benefit weakens at lower wall densities. Reducing wall density from 1800 to 800 kg/m3 saves 15.83 tons in the affordable housing case and 29.61 tons in the middle-class case, while the further reduction from 800 to 400 kg/m3 saves only 3.97 tons and 3.70 tons, respectively. This confirms a diminishing structural response once wall load becomes a smaller share of total demand.
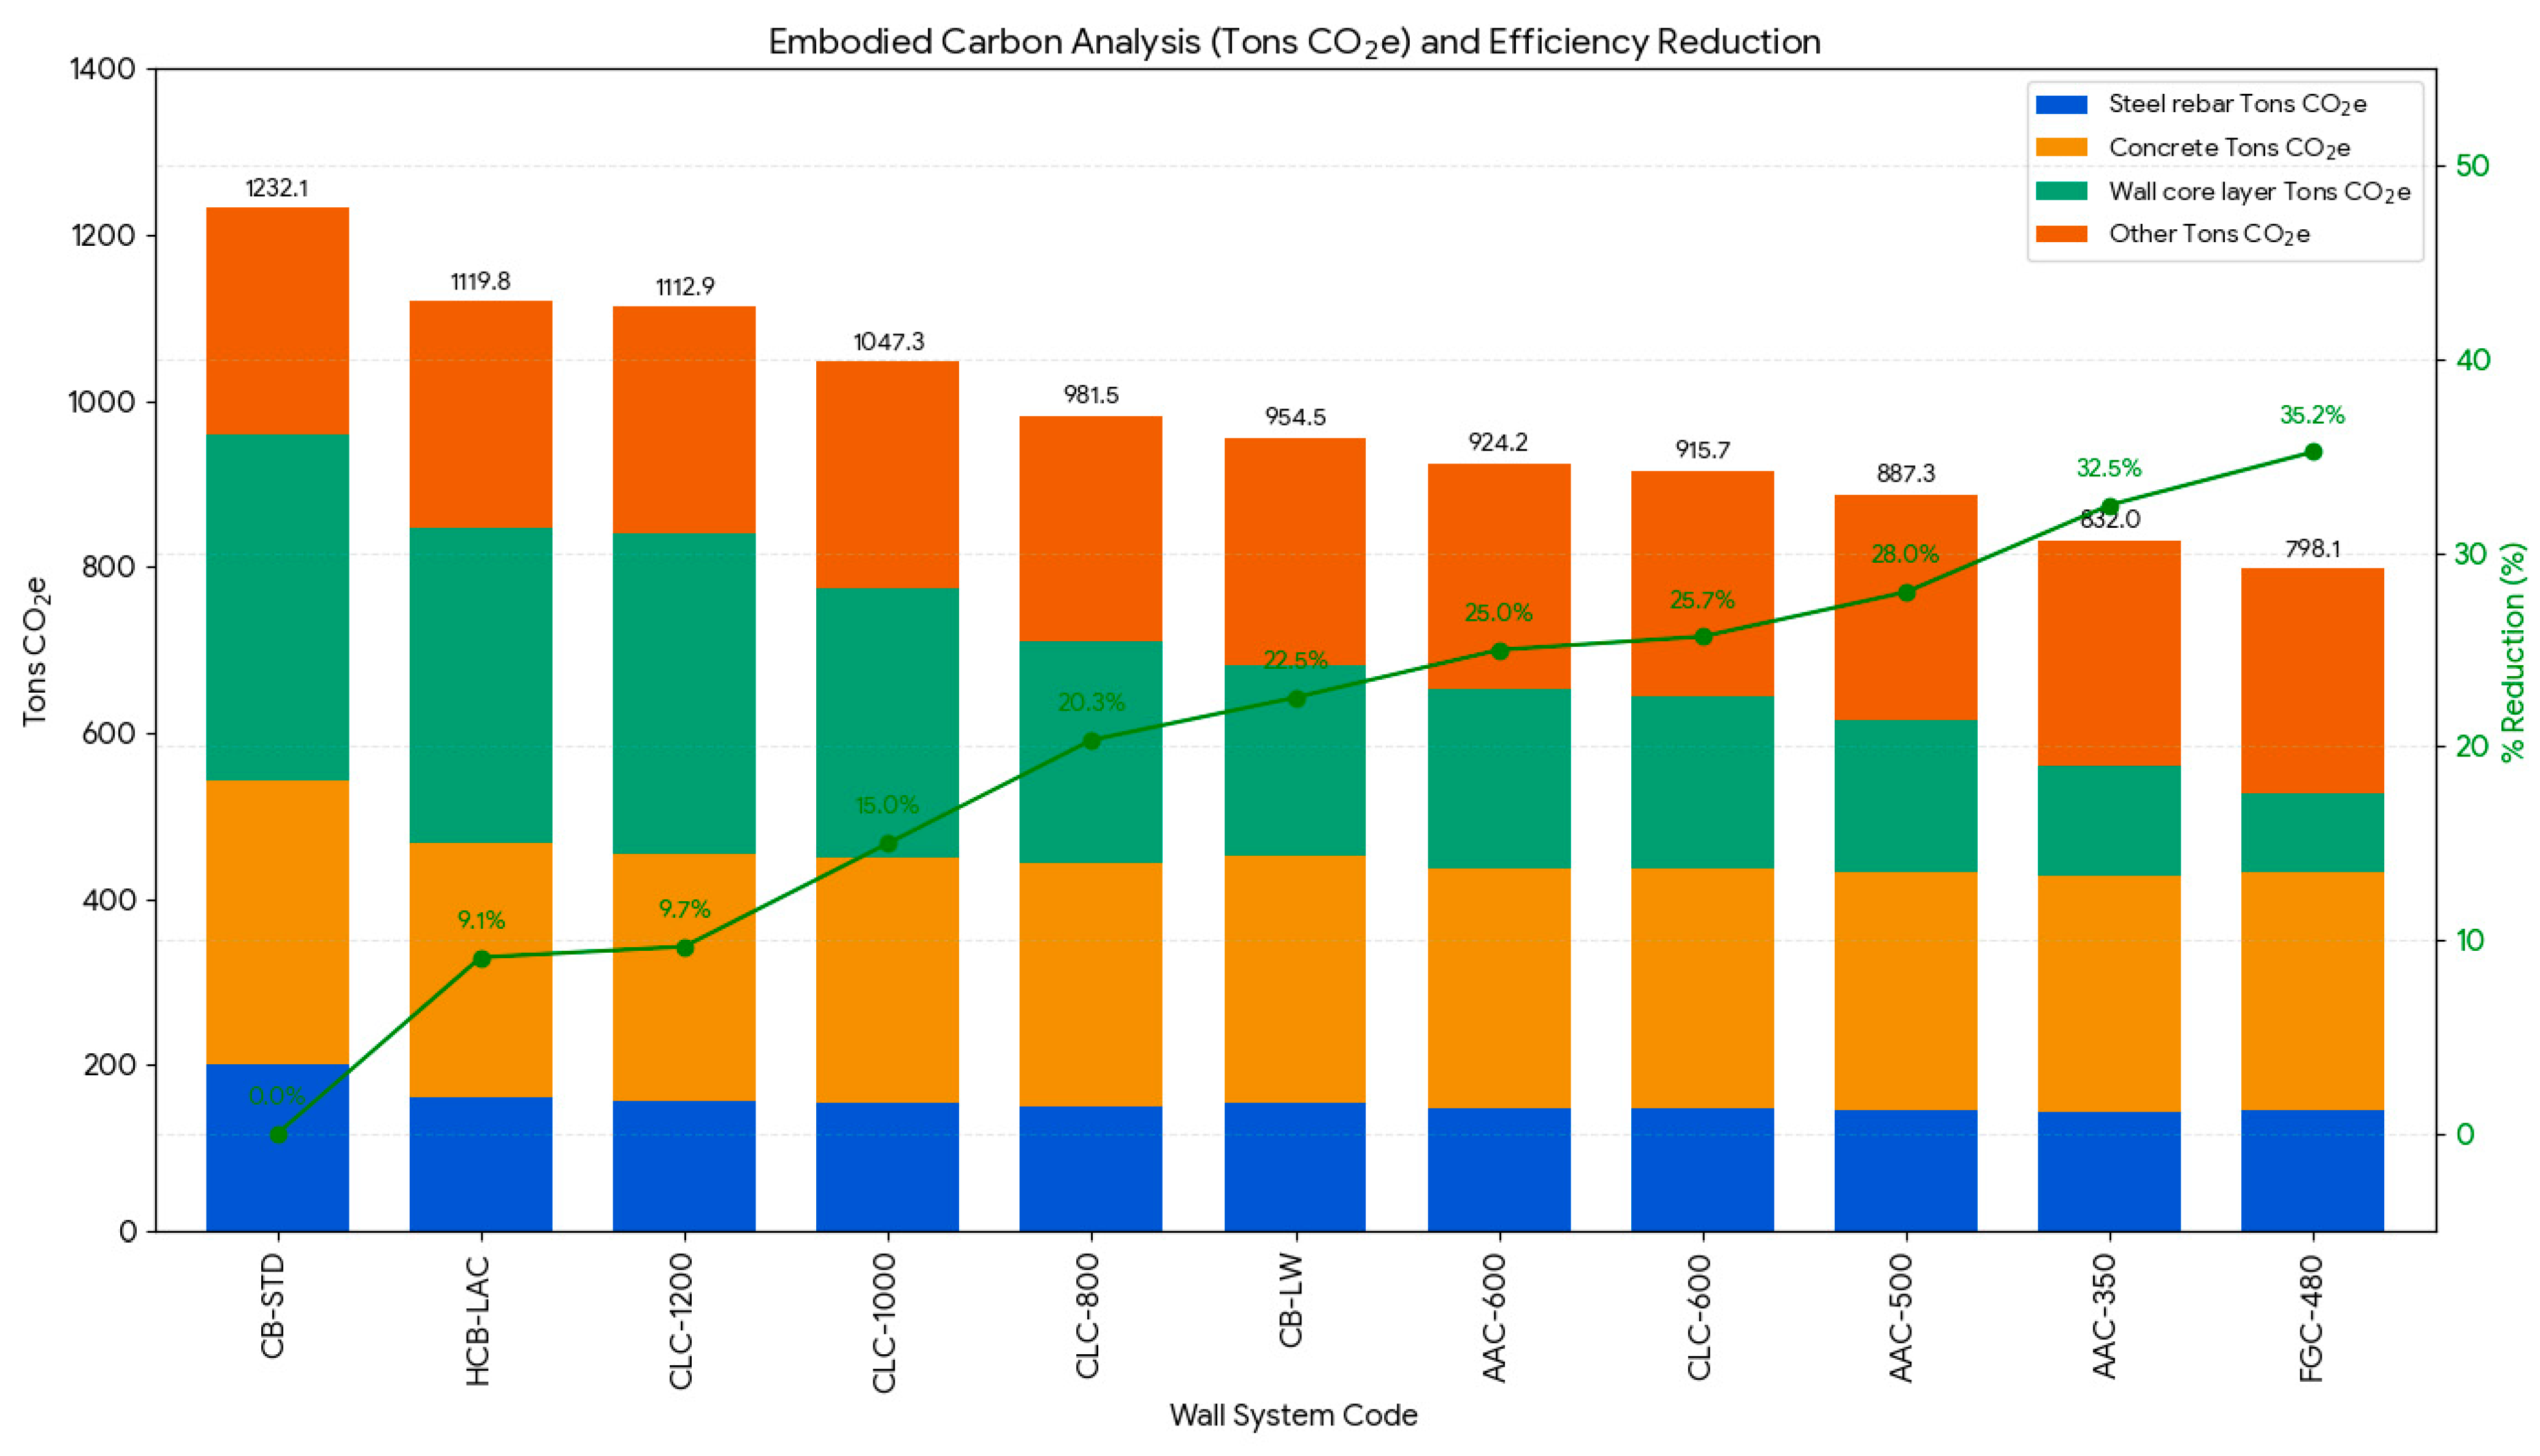
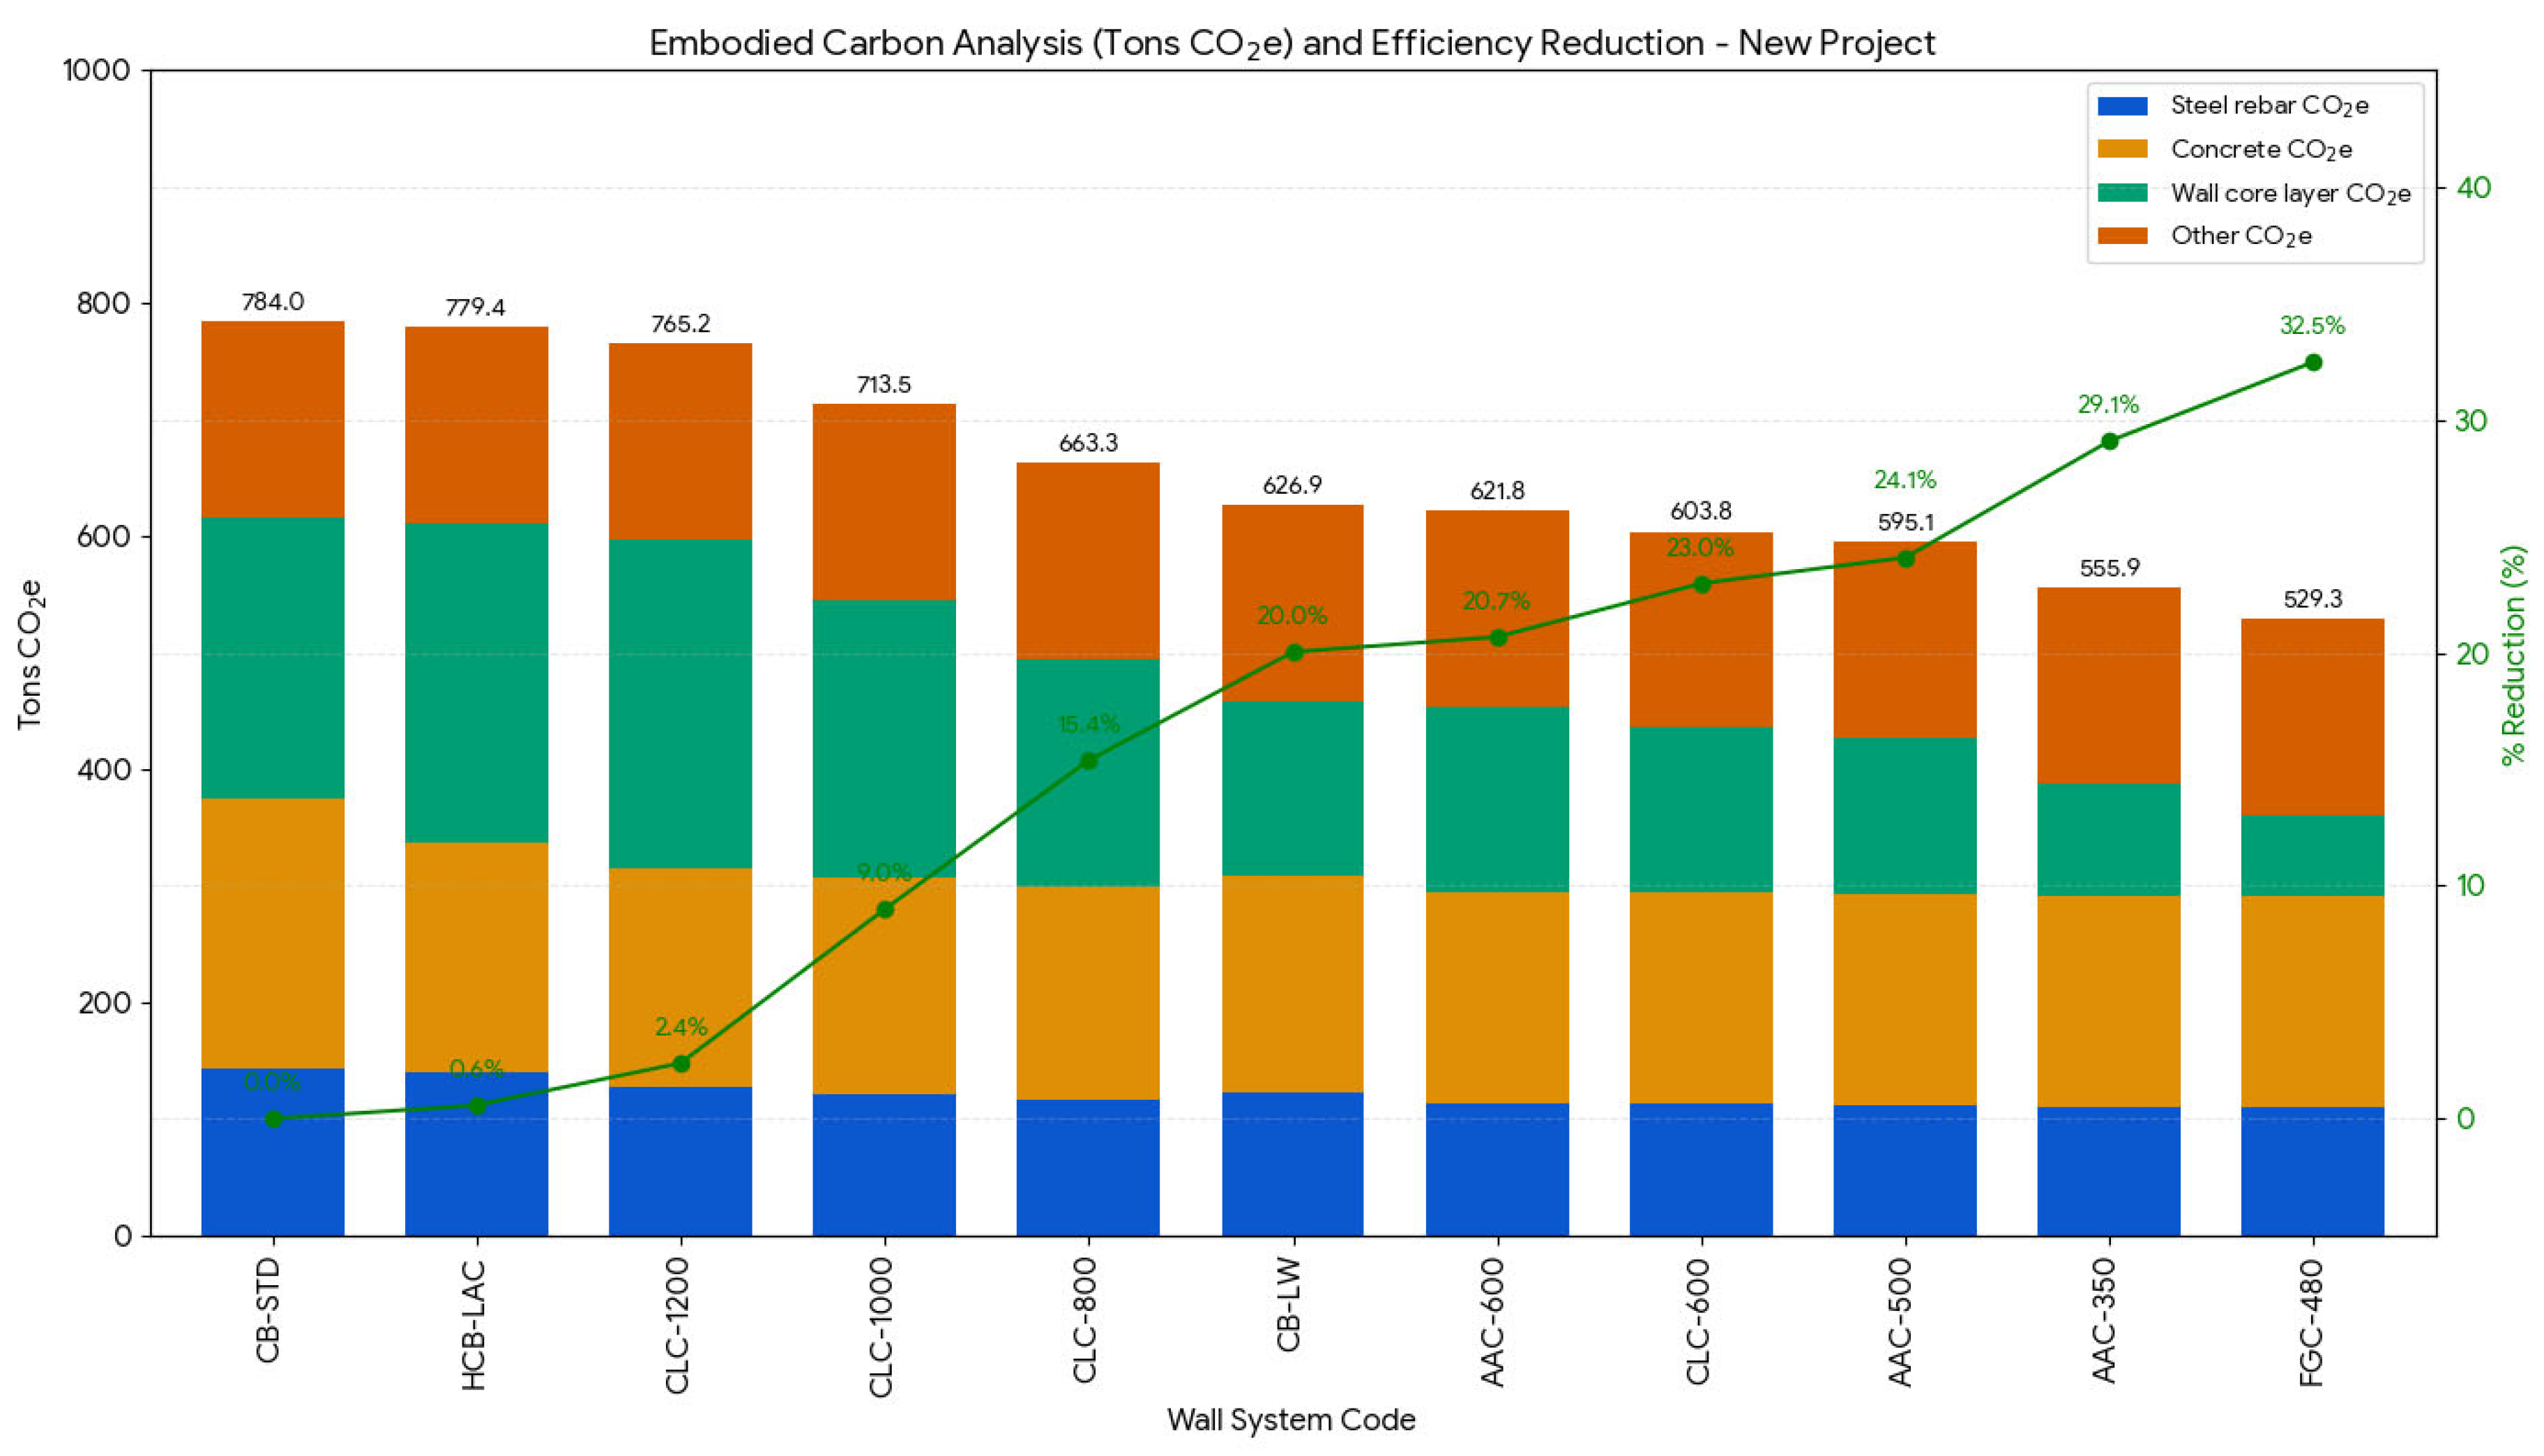
Across both housing types, the largest embodied carbon reduction is achieved by substituting wall cores. In the affordable housing case, replacing the baseline wall system with FGC-480 reduces total embodied carbon from 783,972 kgCO2e to 529,346 kgCO2e, a 32.5% reduction. AAC-350 also performs strongly, reducing total embodied carbon to 555,945 kgCO2e, or 29.1% below the baseline. In the middle-class housing case, FGC-480 reduces total embodied carbon from 1,232,123 kgCO2e to 798,138 kgCO2e, a reduction of about 35.2%, while AAC-350 reduces it to 831,983 kgCO2e.
The ranking of total embodied carbon is mainly determined by the wall core layer rather than the structural frame. In the middle-class housing case, wall core embodied carbon ranges from 94,425 kgCO2e for FGC-480 to 385,687 kgCO2e for CLC-1200, a spread of about 291,261 kgCO2e. Over the same alternatives, concrete varies by only about 21,842 kgCO2e and reinforcement by about 17,821 kgCO2e. The same pattern is observed in the affordable housing case, where lower-carbon wall systems sharply reduce total embodied carbon, while structural-material savings remain secondary. This shows that the wall core layer is the main embodied carbon lever in both building types.
Structural material response remains important, but it is not the dominant factor in the overall ranking. Heavier wall systems are associated with higher embodied carbon in concrete and reinforcement because they increase gravity load and seismic mass. Lighter systems reduce structural demand, but these savings are modest compared with the direct reduction achieved in the wall core layer itself. At the same time, finishes and formwork remain effectively constant across the wall scenarios, so they do not influence the ranking between alternatives.
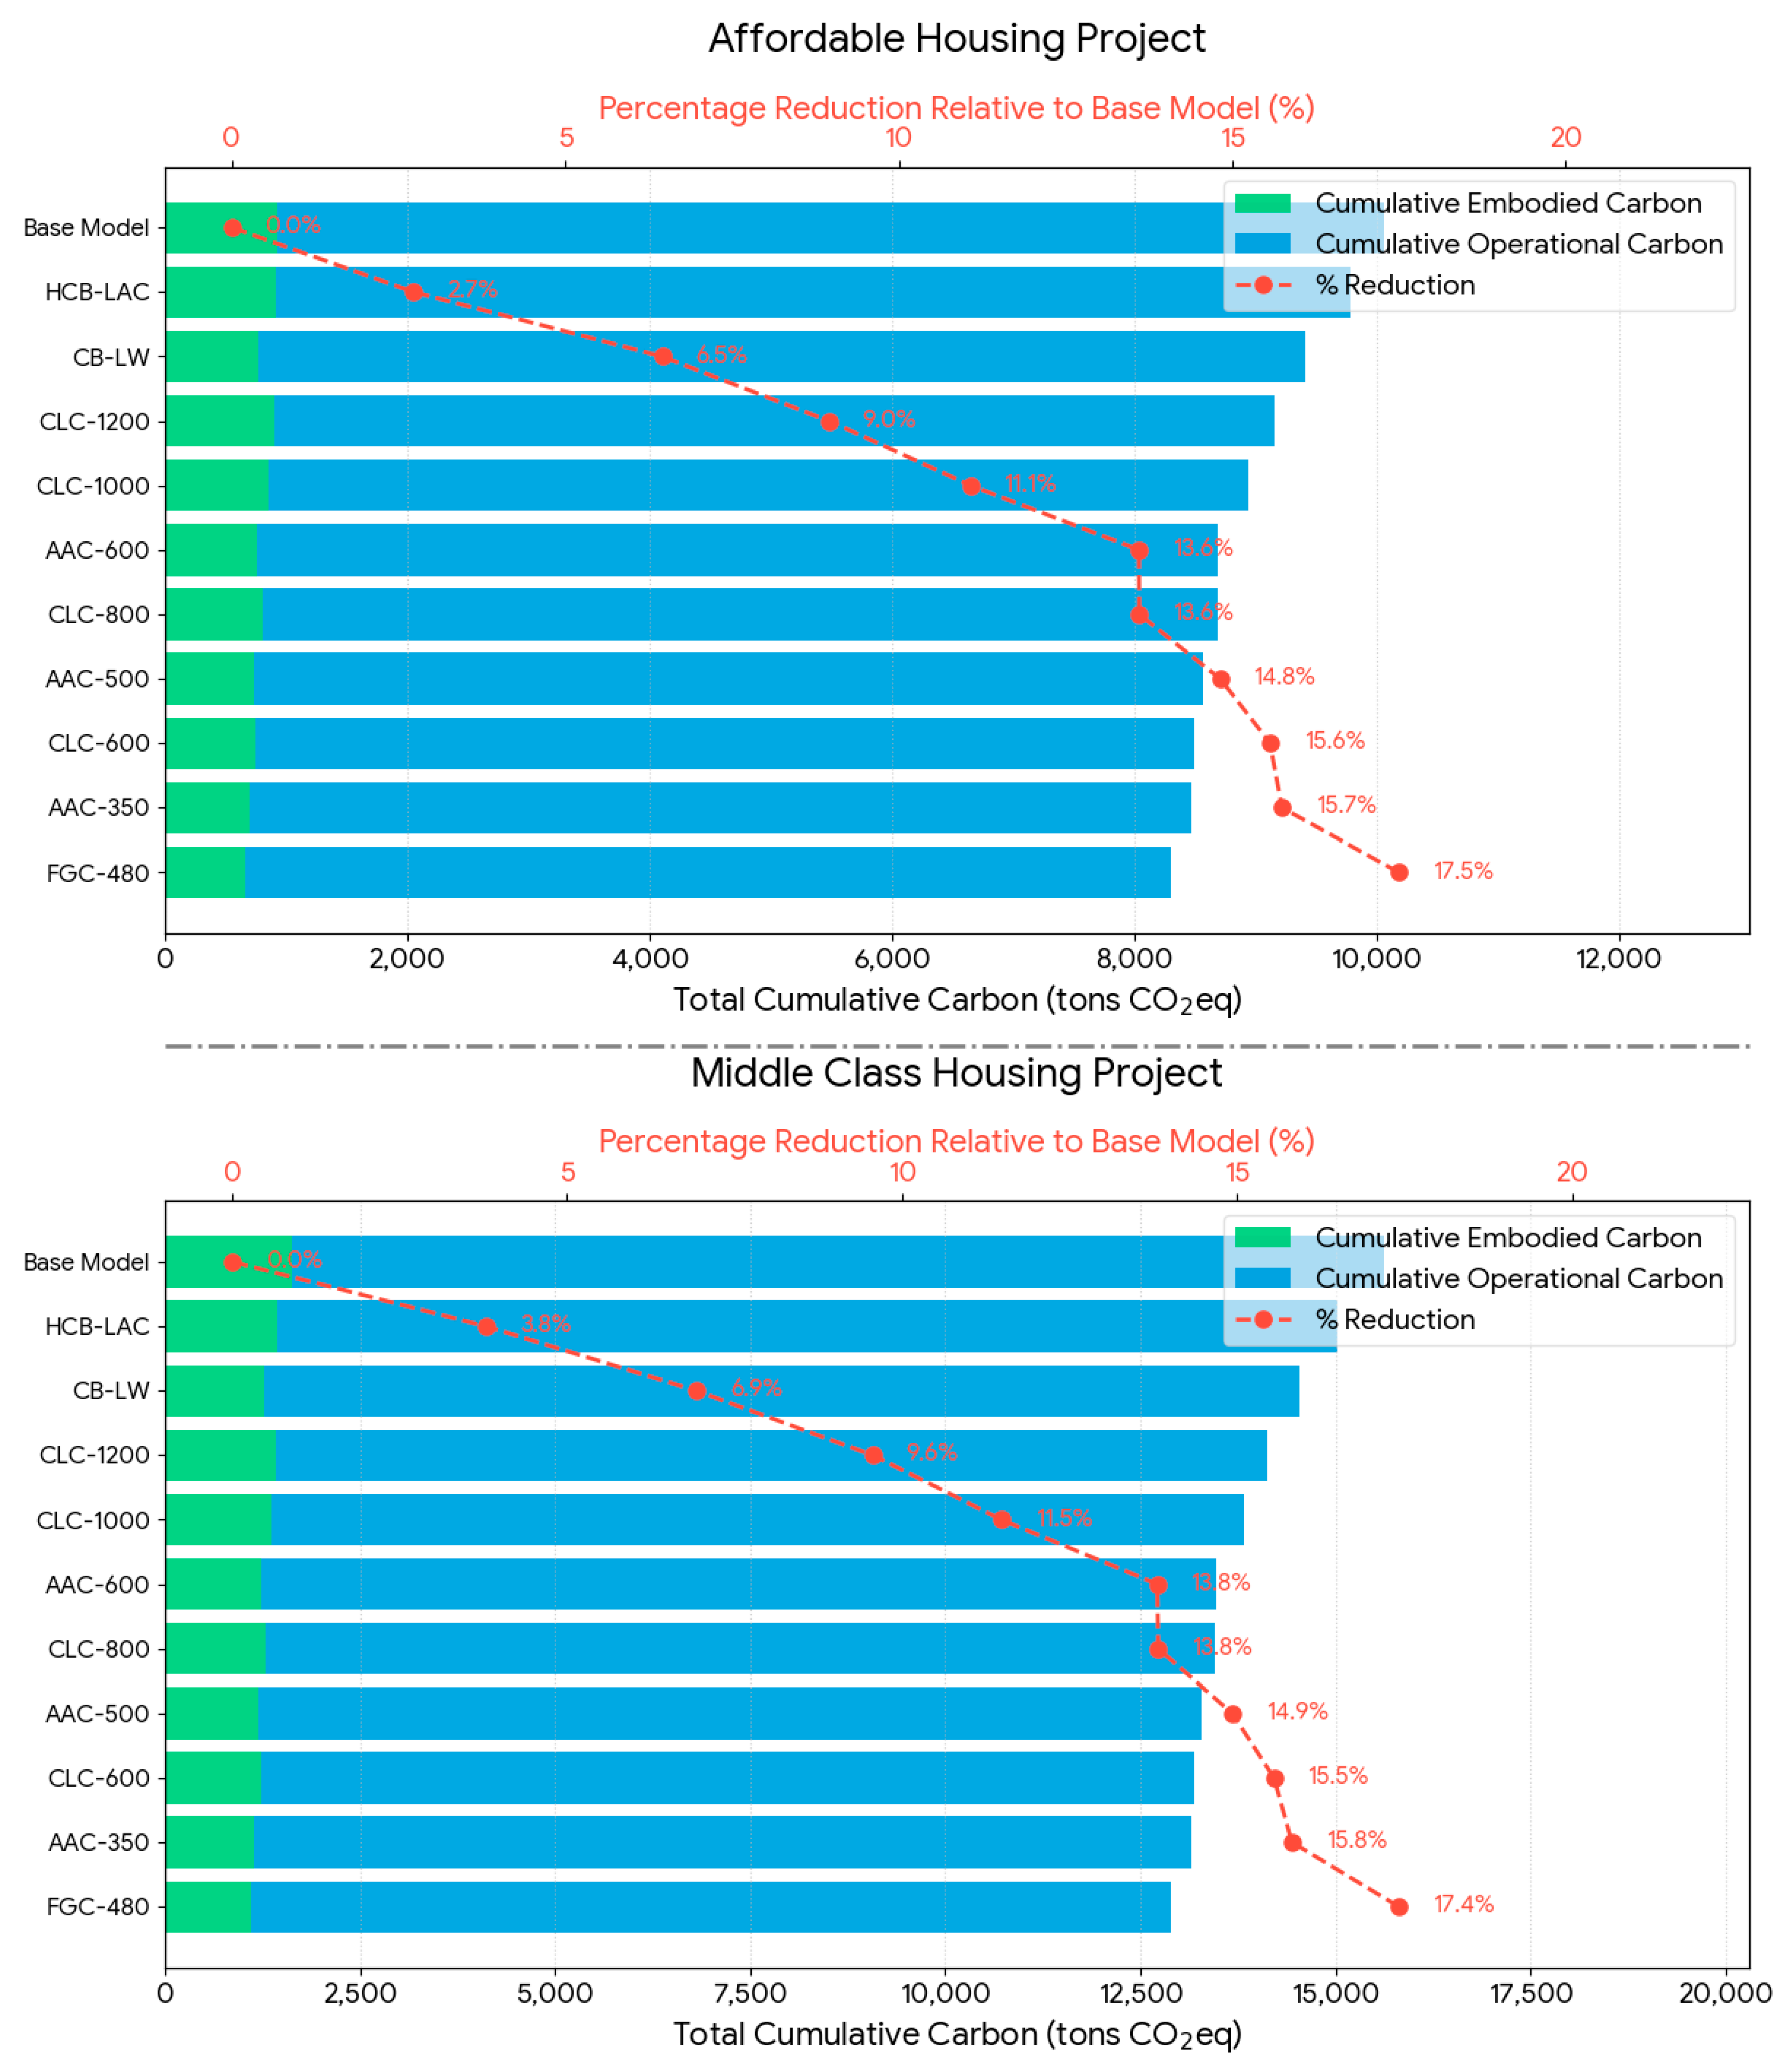
Operationally, cooling remains the dominant wall-sensitive end use. The best-performing wall systems reduce cooling-related operational carbon by lowering thermal conductivity and reducing conductive heat gain. Over a 60-year service life, the best wall systems reduce operational carbon by about 15.7% to 16.5% and total life-cycle carbon by about 17.4% to 17.5%. FGC-480 yields the best overall life-cycle result in both case studies. At the same time, AAC-350 follows closely because it combines low wall-core embodied carbon with strong thermal performance and a low structural penalty, as shown in
Figure 21 and
Figure 22.
The cost findings underscore the practical significance of these results. Lightweight wall systems reduce not only embodied and operational carbon but also execution time and structural material demand. The average embodied carbon savings per building equate to avoiding the use of about 30 tons of steel, 165 m3 of ready-mix concrete, and 191 m3 of mortar. These reductions conserve about 120 tons of cement, 400 m3 of aggregate, and 66 m3 of fresh water per project. The reduction in material demand also yields net savings of about 3.15 million EGP per building. The results identify a low-carbon pathway that is also economically favorable.
Overall, the study shows that integrated embodied and operational carbon reduction in Egyptian housing is most effectively achieved through wall-system substitution rather than structural frame modification alone. The primary benefit comes from replacing carbon-intensive masonry cores and thick-mortar systems with lightweight, energy-efficient wall systems that also reduce cooling and structural loads. In this study, FGC-480 and AAC-350 deliver the strongest combined performance across embodied carbon, operational carbon, structural-material demand, cost, and construction time.
4.1. Operational Carbon and Life-Cycle Findings
A 60-year service life was used to evaluate life-cycle carbon in both housing cases. Operational carbon was calculated for electricity-based end uses, while direct fossil fuel use, such as natural gas for cooking, was excluded from the assessment boundary. Embodied carbon was treated as an initial construction impact, with additional maintenance-related increments over the service life. Wall core alternatives were assumed to have service lives comparable to, or longer than, the building’s life. In contrast, shorter-life components, such as wall and ceiling paint and ceramic floor finishes, were assigned replacement intervals of 10 and 15 years, respectively. The replacement schedule and embodied carbon increments for these maintenance events are reported in the
Supplementary Materials.
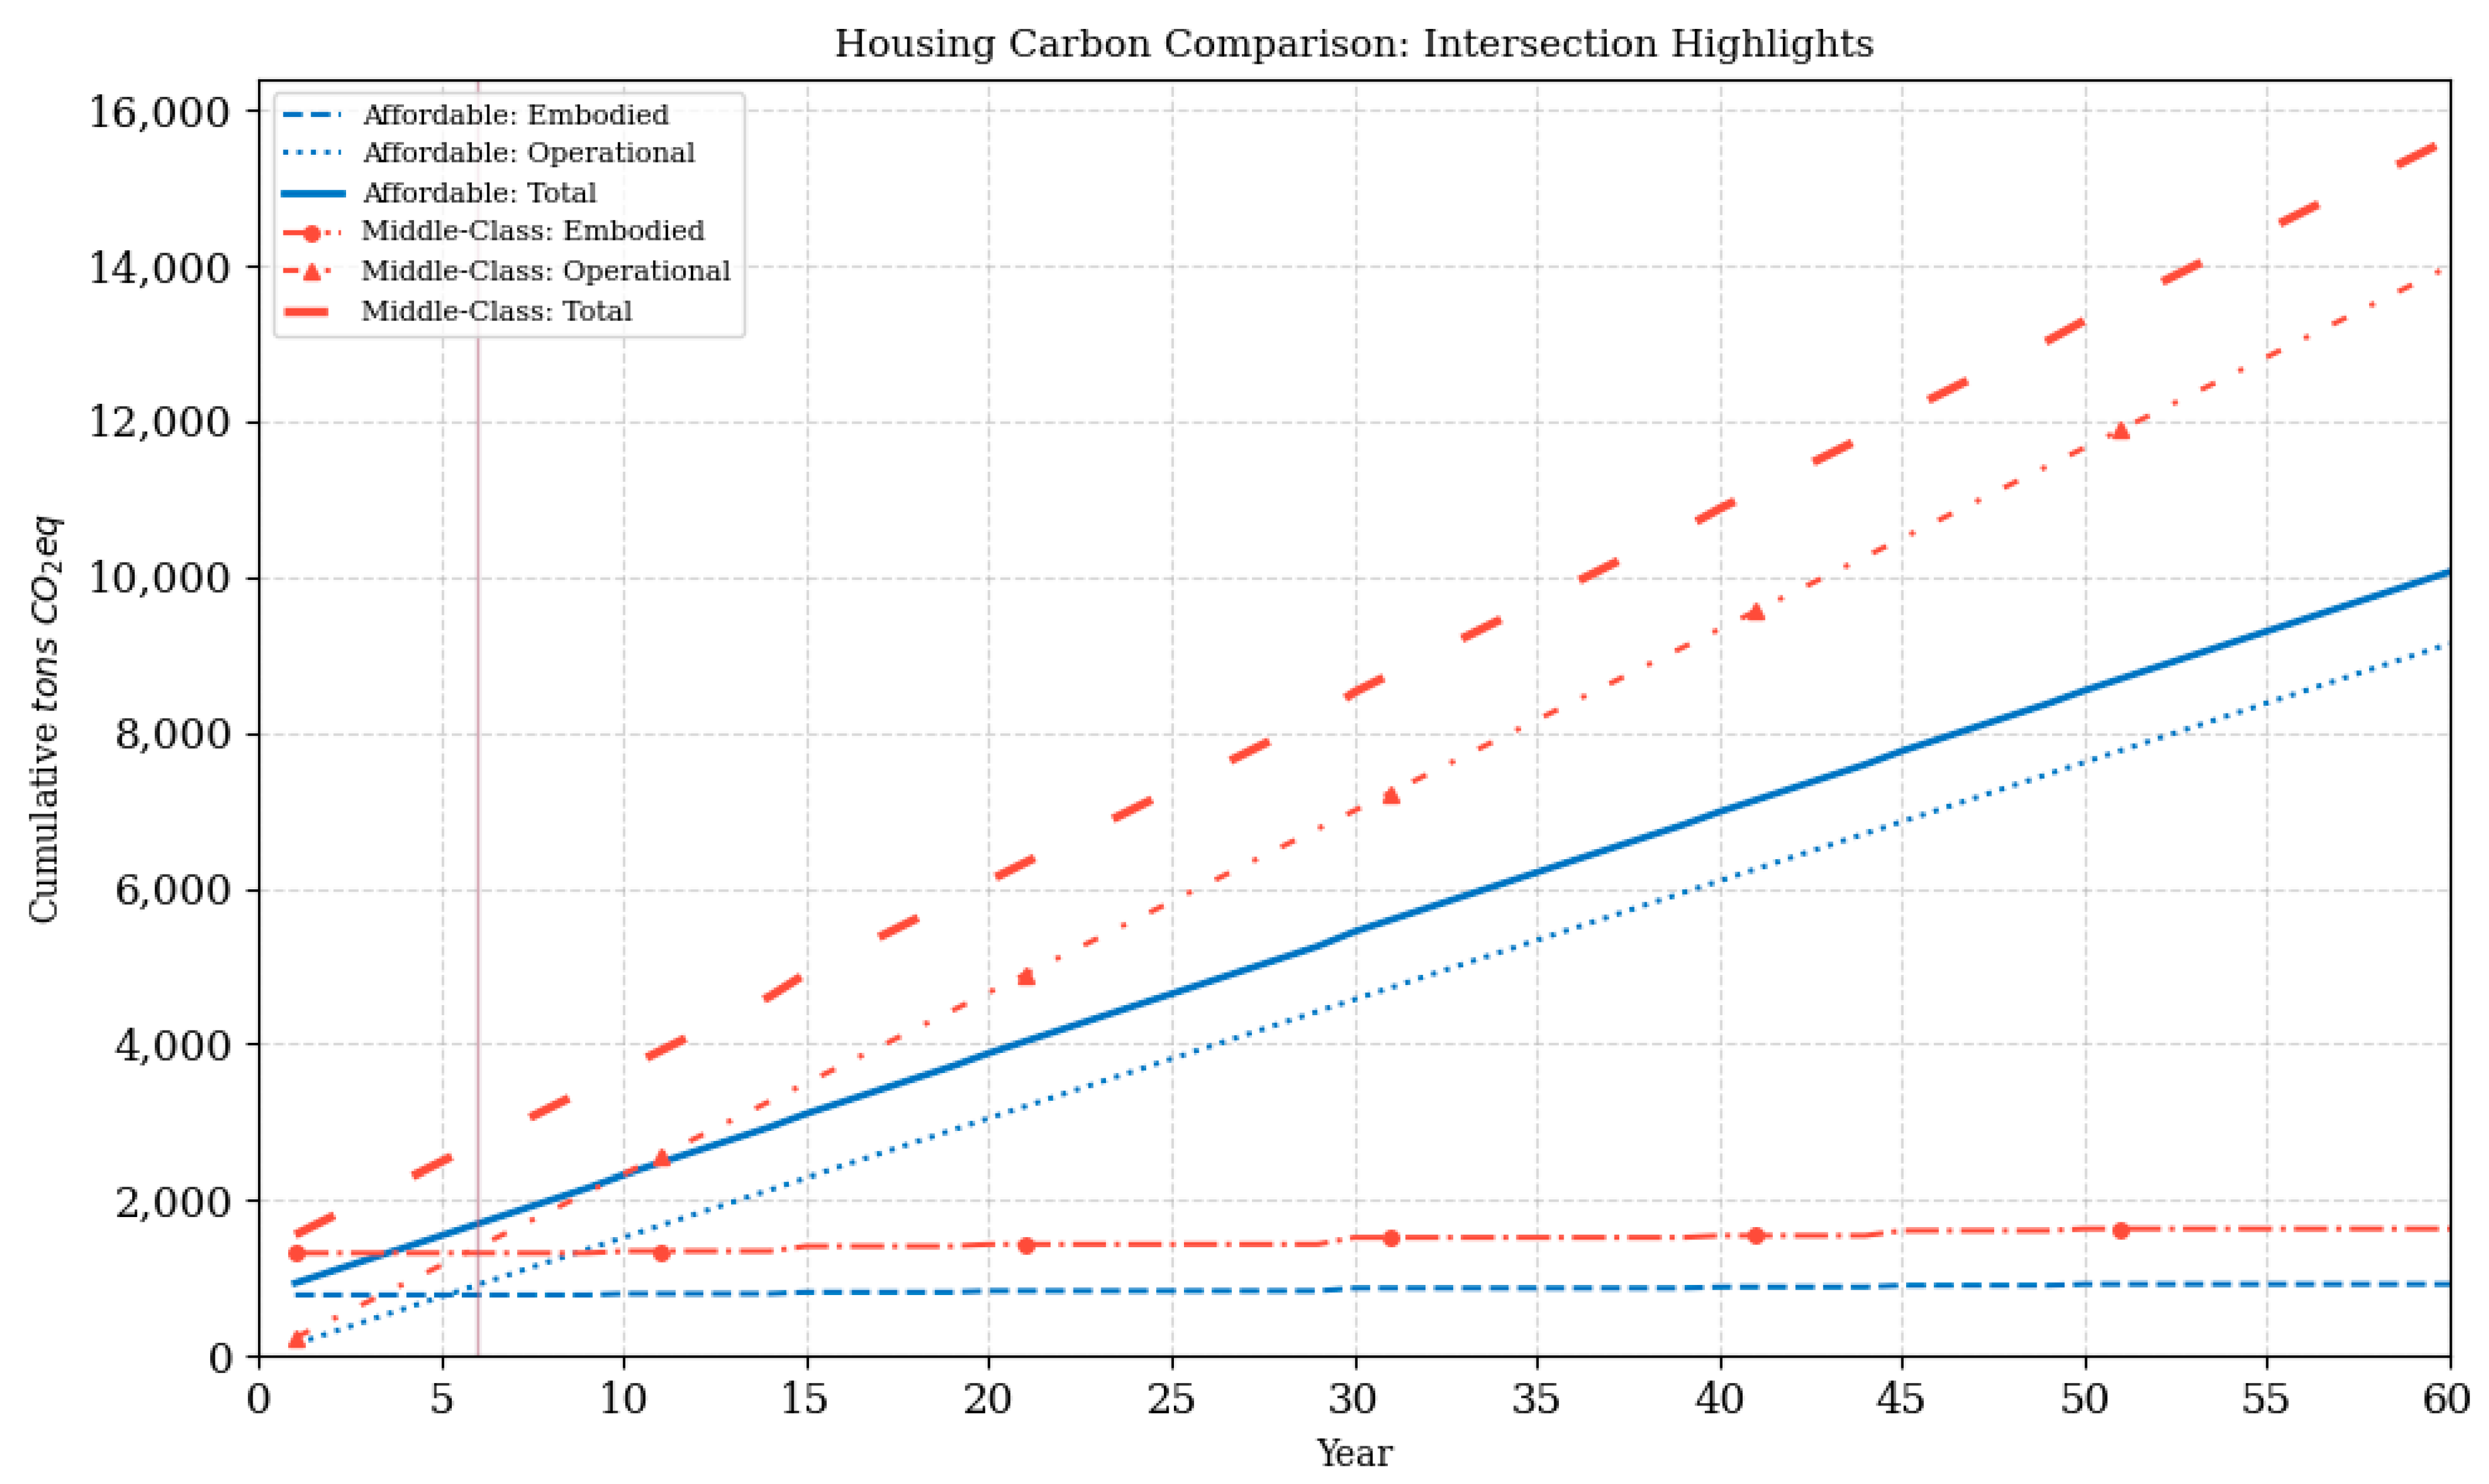
Figure 23 shows the business-as-usual life-cycle trajectories for the affordable and middle-class housing cases. In the affordable housing case, cumulative operational carbon emissions increase to 152.3 tCO
2e/year, reaching 9138.0 tCO
2e over 60 years. In the middle-class housing case, cumulative operational carbon emissions increase to 233.1 tCO
2e/year, reaching 13,986.0 tCO
2e over the same period. Embodied carbon increases in steps because of maintenance and replacements. Initial embodied carbon is 783.972 tCO
2e in the affordable housing case and 1322.122 tCO
2e in the middle-class housing case. After maintenance, total embodied carbon reaches 922.315 tCO
2e and 1633.292 tCO
2e, respectively.
In year 6, operational carbon exceeds embodied carbon in both projects. By year 60, total life-cycle carbon reaches 10,060.315 tCO2e for the affordable housing case and 15,619.292 tCO2e for the middle-class housing case. Operational carbon accounts for 90.8% of the affordable housing total and 89.5% of the middle-class housing total, confirming that long-term life-cycle performance is dominated by operational emissions under the current grid.
In the affordable housing case, the baseline 60-year total is 10,060.3 tCO2e, comprising 922.3 tCO2e of embodied carbon and 9138.0 tCO2e of operational carbon. FGC-480 yields the lowest total at 8299.7 tCO2e, a 17.5% reduction. Embodied carbon decreases from 922.3 to 667.7 tCO2e (27.6%), while operational carbon decreases from 9138.0 to 7632.0 tCO2e (16.5%). AAC-350 and CLC-600 follow closely at 8476.3 tCO2e and 8494.2 tCO2e, respectively. HCB-LAC yields only a modest improvement, reaching 9785.7 tCO2e, or 2.7% below the baseline.
In the middle-class housing case, the baseline 60-year total is 15,619.3 tCO2e, consisting of 1633.3 tCO2e of embodied carbon and 13,986.0 tCO2e of operational carbon. FGC-480 again yields the best result, reducing total life-cycle carbon to 12,899.3 tCO2e, a 17.4% reduction. Embodied carbon decreases to 1109.3 tCO2e, a reduction of 32.1%, while operational carbon decreases to 11,790.0 tCO2e, a reduction of 15.7%. AAC-350 and CLC-600 also perform strongly, with emissions of 13,149.2 tCO2e and 13,190.8 tCO2e, respectively. HCB-LAC again yields the smallest improvement, with a total of 15,027.0 tCO2e, or 3.8% below the baseline.
Across both housing types, operational carbon accounts for the majority of the 60-year total. As a result, total life-cycle reductions remain around 17.5% even when embodied carbon decreases by about 28% to 32%. This means that wall system substitution improves whole-life performance most effectively when it reduces both the embodied carbon of the wall core and the cooling-related operational carbon, as shown in
Figure 24.
The embodied carbon reductions achieved through lightweight wall core substitution in this study are consistent with previous research on residential construction in Egypt and South Asia. Earlier studies show that operational energy, driven mainly by cooling, accounts for about 72% to 90% of whole-life impacts, while embodied carbon accounts for the remaining 10% to 28% [
59,
60].
Comparative studies also report that autoclaved aerated concrete can reduce initial construction costs by 9% to 14% in Egypt’s New Administrative Capital [
61], and that replacing fired-clay brick with autoclaved aerated concrete can reduce wall-level or infill embodied energy by about 18% to 40% and whole-building impacts by about 15% to 25% [
62,
63].
However, important gaps remain in the literature. Most embodied carbon studies apply the conventional 80% hotspot rule, which often excludes or aggregates non-structural cement uses such as block-laying mortar, plaster, and finishes, even though thick mortar joints of about 20 to 25 mm and dual plaster layers remain standard in Egyptian red brick construction [
64].
Many studies also assess embodied and operational carbon separately. Structural effects of changes in wall density are rarely quantified. When finite element analysis is included, it is usually limited to a few discrete scenarios, without any fitted-approximation approach [
65].
BIM-LCA integration also remains fragmented. Most studies link architectural BIM either to quantity take-off and LCA tools or to energy-simulation platforms, but rarely use one traceable model that also includes structural FEM, mortar-adjusted wall densities, and consistent material mapping [
66].
In many studies, quantity take-off data are exported from BIM platforms to LCA tools such as One Click LCA, Tally, or SimaPro. Building geometry is often exported separately to operational energy tools such as EnergyPlus, DesignBuilder, or IES VE. Cost assessment is usually handled in a separate workflow using BOQ spreadsheets or cost-estimation software. This separation limits the ability to evaluate embodied carbon, operational carbon, and cost within one coordinated assessment process. Some low-carbon strategies can reduce embodied carbon but increase direct construction cost. For example, modular construction has been reported to reduce embodied carbon while increasing direct construction cost [
67].
In contrast, the present study applies one integrated BIM-based digital twin workflow that links a traceable architectural and structural model to FEM-based structural assessment, whole-building energy simulation, and A1 to A3 embodied carbon quantification. The framework is applied consistently to two Egyptian residential typologies, demonstrating that substantial embodied carbon reductions can be achieved alongside operational carbon reductions and net cost savings.
4.2. Study Limitations
This study uses a comparative design-stage boundary for embodied carbon rather than a full whole-life embodied carbon model. Product-stage embodied carbon was limited to Modules A1–A3. At the same time, transport, construction, end-of-life, and broader use-stage processes were excluded, except for the defined replacement events incorporated in the 60-year life-cycle assessment. International proxy emission factors were used where consistent Egypt-specific data were unavailable. Partition walls were modeled as superimposed line loads rather than stiffness-participating infill walls.
4.3. Conclusions
Wall system substitution affects more than the embodied carbon of the wall itself. It also changes the total building mass, which in turn alters seismic demand, internal forces, and reinforcement demand. The carbon benefit of lightweight non-structural wall core systems is therefore most clearly realized when the primary structural configuration is controlled, including slab thickness, column size, and beam depth. Otherwise, increased structural demand in other elements can offset part of the carbon savings achieved by lighter wall materials.
Lightweight wall core systems substantially reduce whole-building embodied carbon in both housing types. In the middle-class housing case, the best-performing wall system reduces total embodied carbon by 35.2%, from 1232 tCO2e to 798 tCO2e, which is equivalent to avoiding 434 tCO2e. In the affordable housing case, the corresponding reduction reaches about 255 tCO2e with the best-performing wall system.
The baseline embodied carbon intensity is similar in the two housing cases, averaging about 395 kgCO2e/m2, with 400 kgCO2e/m2 for the middle-class case and 390 kgCO2e/m2 for the affordable case. In the best-performing wall scenarios, embodied carbon intensity decreases to about 260 kgCO2e/m2 and 263 kgCO2e/m2.
The life-cycle results show that operational emissions dominate the 60-year total under the current electricity grid. The best-performing wall systems reduce annual operational carbon from 152.3 to 127.2 tCO2e/year in the affordable housing case and from 233.1 to 196.5 tCO2e/year in the middle-class housing case. These reductions correspond to annual savings of 25.1 and 36.6 tCO2e/year, or about 20% in both projects.
Over 60 years, total life-cycle carbon decreases by about 17.5% in both housing cases with the best-performing wall systems. Total life-cycle savings reach about 1760 tCO2e in the affordable housing case and 2720 tCO2e in the middle-class housing case, with an average of about 2240 tCO2e per building.
Future grid decarbonization strengthens the long-term value of demand reduction measures. National targets to increase renewable electricity to 42% by 2030, compared with the current share of about 9%, imply a lower grid emission factor over time. Under that condition, the operational share of life-cycle carbon decreases relative to the current-grid case, while the long-term benefit of wall-based demand reduction becomes more durable.
Lightweight energy-efficient wall core systems reduce not only wall-related embodied carbon, but also total structural-material demand. The average embodied carbon saving per building is equivalent to avoiding about 30 tons of steel, 165 m3 of ready-mix concrete, and 191 m3 of mortar. These reductions conserve about 120 tons of cement, 400 m3 of aggregate, and 66 m3 of fresh water per project. These results support sustainable housing delivery in Egypt by reducing carbon emissions, material demand, and project costs through the substitution of wall systems.