1. Introduction
Climate change has emerged as one of the most critical global challenges, significantly affecting natural resources, ecosystems, and human well-being. Rising levels of CO2 are massively recognized as a major driver of global warming and ecological deprivation [
1,
2]. The increasing concentration of GHGs contributes to severe environmental consequences, including rising temperatures, sea-level increases, water scarcity, declining agricultural productivity, and extreme weather events such as floods, heatwaves, and tropical cyclones [
3]. These challenges have prompted governments, international organizations, and non-government institutions to intensify efforts toward environmental protection and sustainable development [
4,
5].
In response to climate challenges, many nations have adopted policies aimed at reducing emissions and promoting sustainable development. Several European economies have strengthened their environmental commitments by setting ambitious emission reduction targets and advancing strategies for achieving carbon neutrality. For example, the EU has committed to reducing GHGs by at least 55% by 2030 as part of its long-term climate strategy [
6,
7]. These initiatives underscore the growing global emphasis on sustainable production systems, efficient resource management, and environmentally friendly technologies to mitigate environmental degradation [
8,
9].
One important strategy to gain increasing attention is the adoption of CE practices. The CE emphasizes resource efficiency, recycling, and waste reduction by transforming the traditional “take-make-dispose” production model into a regenerative system that minimizes environmental impacts. Previous studies indicate CE practices, such as biowaste recycling and improved municipal waste management, can significantly reduce CO2E and improve environmental sustainability [
10,
11]. According to the Ellen MacArthur Foundation, global implementation of CE strategies could reduce GHGs by up to 39% while lowering virgin material extraction by approximately 28% [
12,
13]. Despite these promising outcomes, much of the existing literature focuses primarily on the economic or business benefits of the CE rather than its broader environmental implications [
14].
At the same time, increasing energy demand, resource depletion, and unsustainable consumption patterns continue to intensify environmental pressures [
15]. The dominance of linear economic systems contributes to excessive resource extraction, waste generation, and rising emissions, thereby undermining environmental sustainability. In contrast, CE practices promote efficient resource utilization, encourage recycling and reuse, and support the transition toward sustainable production and consumption systems [
16,
17]. Although European countries have made notable progress in promoting recycling and resource efficiency, the practical implications of the CE principle still face structural and economic challenges [
18].
Despite the growing importance of CE initiatives, their environmental impacts remain conceptually and empirically unresolved. While a larger body of literature suggests that CE practices can reduce CO2E through improved resource efficiency and waste reduction [
3,
19,
20], other studies report insignificant or even adverse effects due to rebound mechanisms and energy-intensive recycling processes [
14,
19,
20]. These conflicting findings indicate that the relationship between CE and environmental sustainability is not straightforward and may depend on broader economic and structural conditions.
More importantly, existing studies exhibit several key limitations. First, much of the empirical evidence is based on sector-specific or short-term analysis, which fail to capture long-run macroeconomic dynamics [
21,
22]. Second, prior research often examines CE in isolation, without integrating it into a broader framework that includes critical drivers such as green energy transition, financial development, and economic growth [
23,
24]. Third, cross-country comparative evidence, particularly for European economies characterized by heterogeneous environmental policies and economic structures, remains limited [
25,
26]. Given these gaps, there is a clear need for a comprehensive, long-term, and macro-level analysis that evaluates the role of CE within a broader sustainability framework. This study addresses this gap by examining the impact of CE practices alongside green energy, financial development index, and economic growth on CO2E across European countries over the period 2000–2022. By doing so, the study not only reassesses the environmental effectiveness of CE but also explains its role relative to other key determinants.
The theoretical foundation of this study is grounded in the circular economy framework, energy transition theory, and the financial development index and environmental nexus. The circular economy perspective suggests that resource efficiency, recycling, and waste minimization reduce environmental pressure by promoting closed-loop production systems. Energy transition theory emphasizes the role of renewable energy in lowering carbon intensity and reducing dependence on fossil fuels. In addition, the finance environment nexus highlights how FDI influences environmental outcomes through investment allocation, technological innovation, and support for sustainable infrastructure. GDP is also an important factor, as it shapes energy demand, industrial activity, and environmental pressure. By integrating these perspectives, this study develops a comprehensive framework to explain the determinants of CO2E in EU economies.
Given these contrasting views, this study addresses the following research question:
Does the circular economy significantly reduce CO2E in European countries over the long term?
To provide a structured empirical assessment, the study develops the following testable hypotheses:
H1. Circular economy practices reduce CO2E.
H2. Green energy practices reduce CO2E.
H3. Financial development index contributes to reducing CO2E by facilitating green investments.
H4. Gross domestic product increases CO2E.
To test these hypotheses, this study examines the impact of CE practices, GE, FDI, and GDP on CO2E across European countries over the period 2000–2022. By adopting a comprehensive macro-level approach, the study contributes to the literature by providing long-term, cross-country evidence on the environmental effectiveness of the CE.
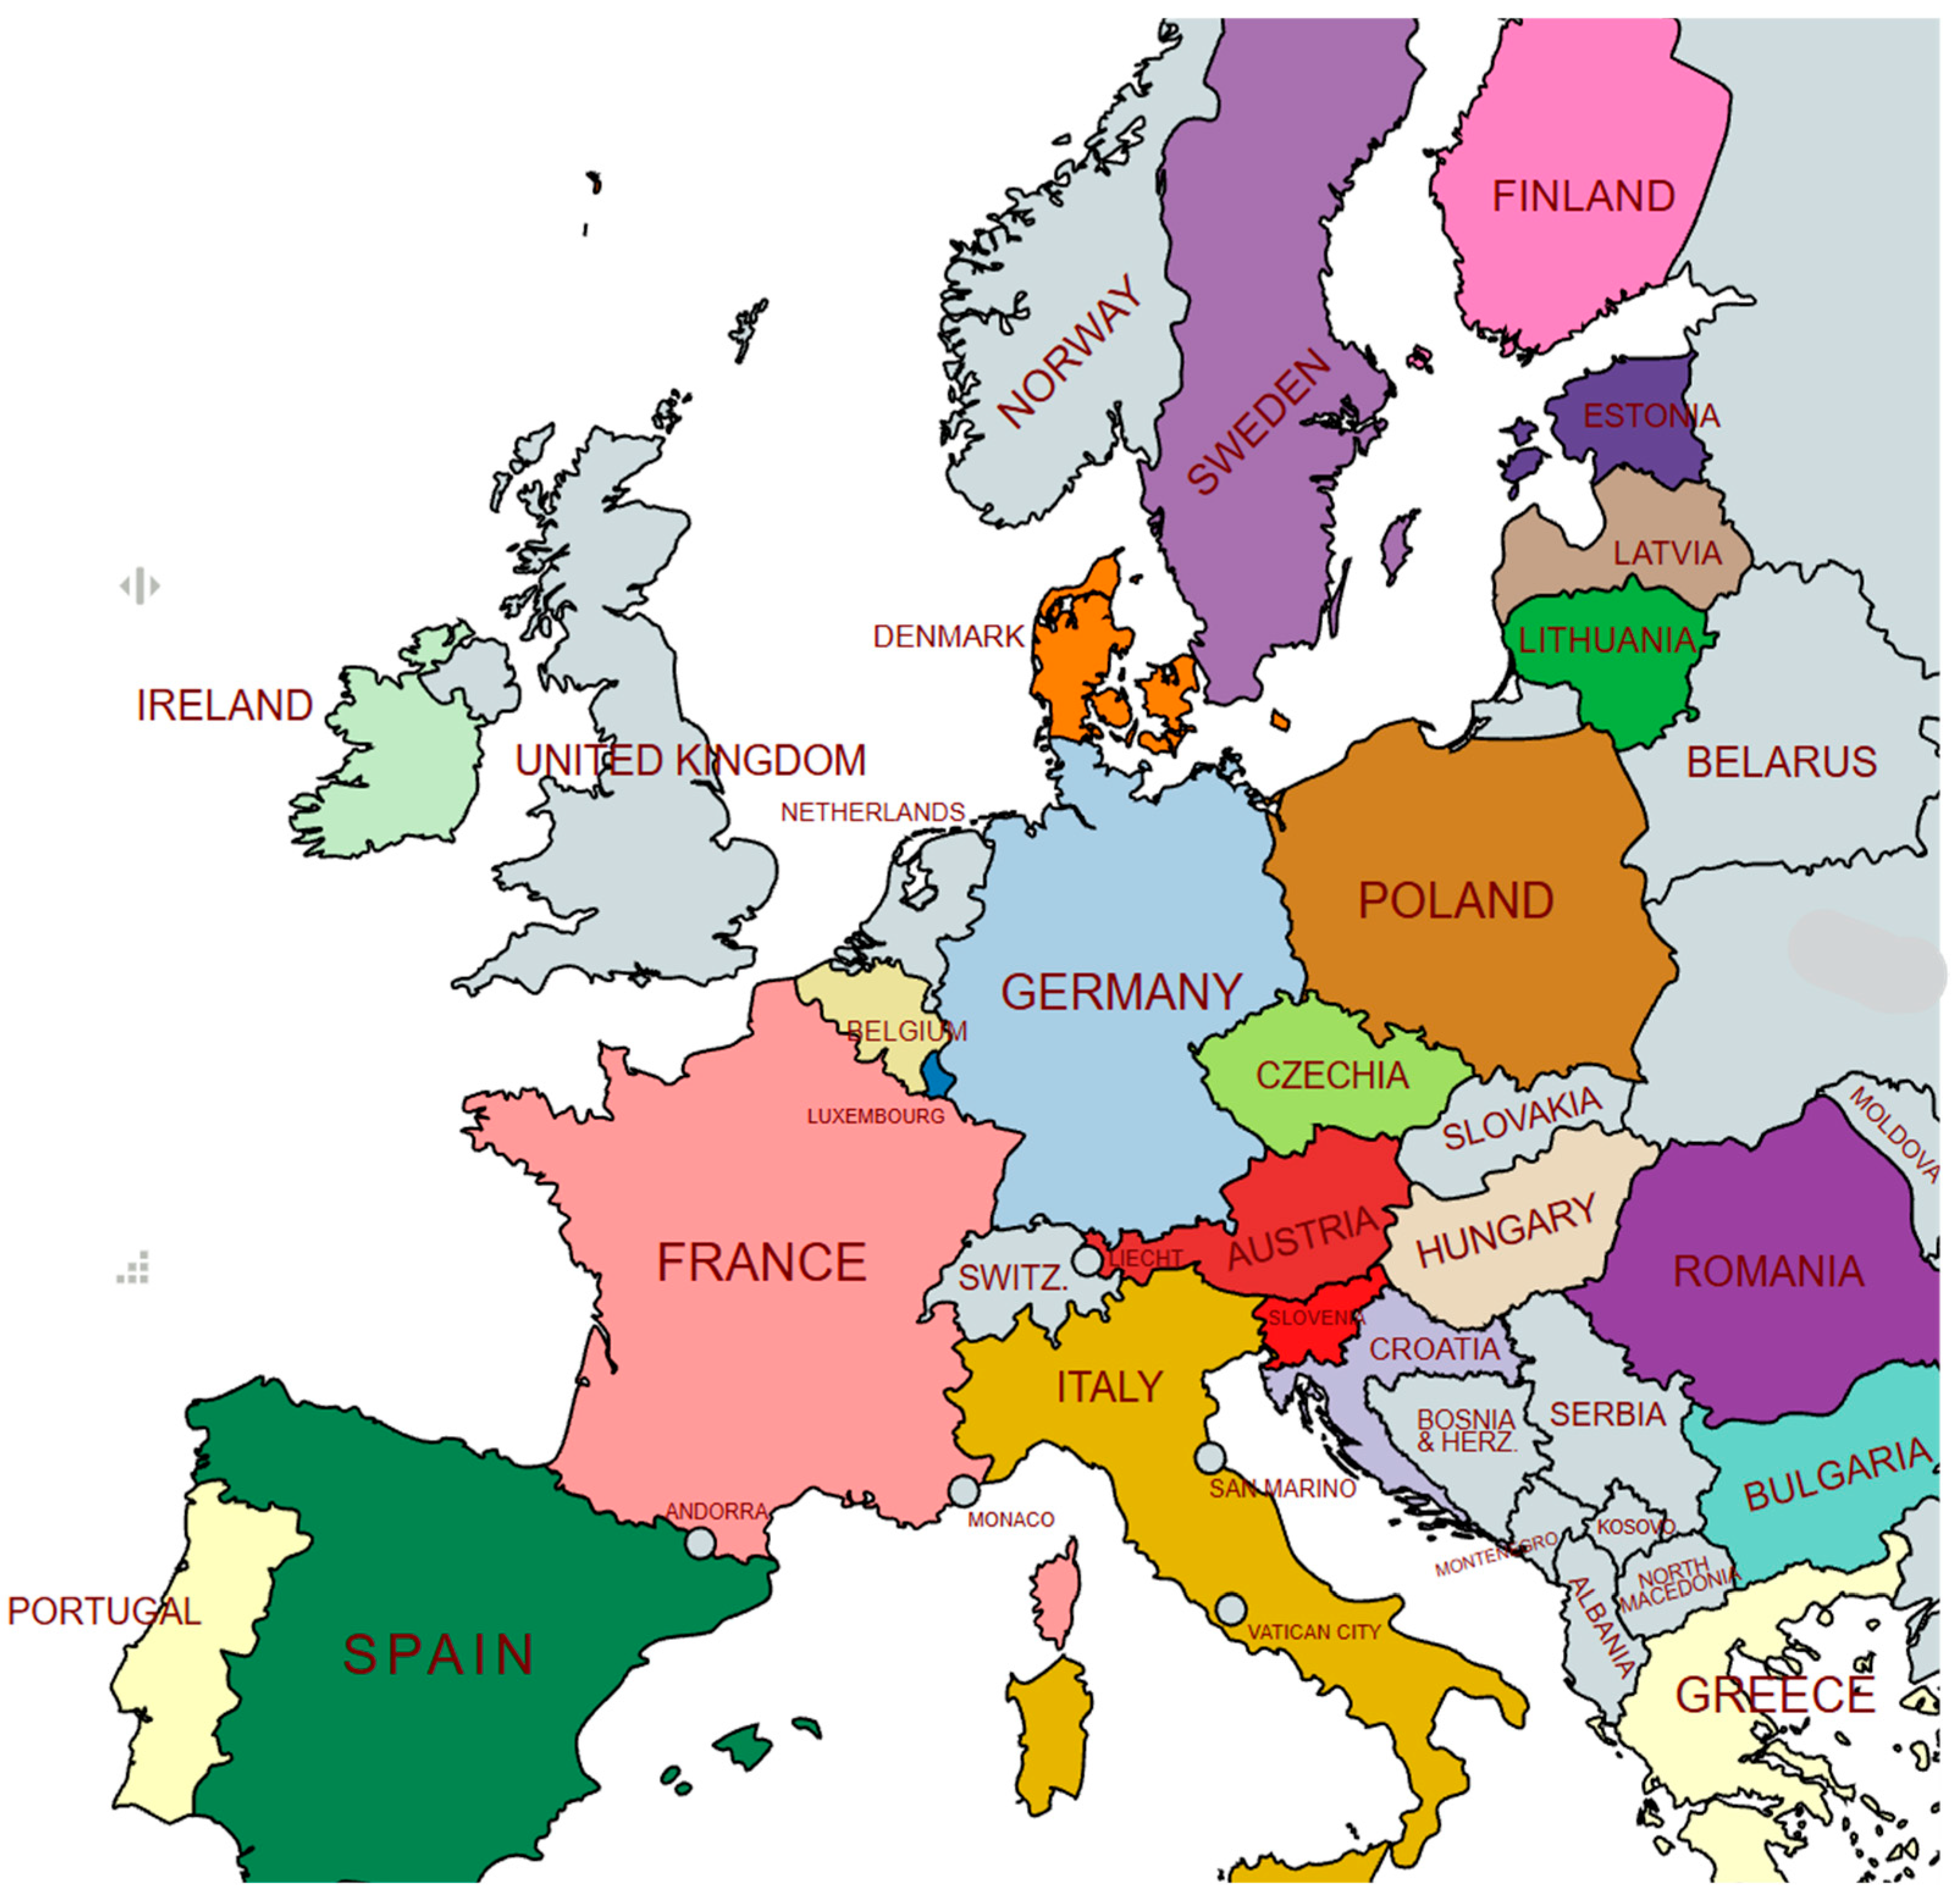
Figure 1 illustrates substantial cross-country disparities in CO2E across European nations. Large, industrialized economies, particularly Germany, France, Italy, and Poland, emerge as the dominant emitters, reflecting their scale of industrial activity and energy demand. A second group of countries, including Spain, Belgium, Czechia, and Romania, contributes moderately, while smaller and less industrialized economies such as Luxembourg, Latvia, and Estonia exhibit comparatively low emission levels. Inclusion, the figure highlights a pronounced contrast between Western Europe’s industrial powerhouses and smaller or less energy-intensive economies in Eastern and Northern Europe. These disparities underscore the heterogeneity of carbon footprints within Europe and suggest that achieving EU climate targets will require differentiated mitigation strategies tailored to national economic structures and emission profiles.
2. Literature Review
The circular economy has emerged as a key strategy for addressing environmental challenges, particularly CO2E reduction and sustainable resource management. However, the empirical literature presents mixed and often conflicting evidence regarding its effectiveness. To better understand these inconsistencies, existing studies can be grouped into three main theoretical perspectives.
The first strand of literature supports the resource efficiency perspective, which argues that CE practices contribute to reducing CO2E by improving material efficiency, promoting recycling, and minimizing waste. Several studies provide strong empirical support for this view. For instance, Hisao-Tien Pao and Chun-Chih Chen [
27] demonstrates how improved material cycles reduce resource consumption in industrial systems. Similarly, Magazzino et al. [
28], and Robina et al. [
13] show that waste management and recycling efficiency are associated with lower environmental pressure. Pao & Chen, ref. [
27] find that increases in recycling rates significantly reduce emissions in European countries, while Schwarz et al. [
2] highlight the substantial emission reduction potential of plastic recycling. These studies collectively suggest that CE practices can play a meaningful role in mitigating environmental degradation through resource optimization and reduced reliance on virgin materials.
In contrast, a second stream of literature reflects a more skeptical perspective, emphasizing that CE practices may not always lead to emission reductions. This view is often linked to the rebound effect and structural limitations. For example, Morseletto [
15] finds that improvements in energy efficiency do not necessarily translate into lower emissions in resource-intensive economies. Similarly, Li et al. [
29] argue that certain recycling processes may have higher environmental costs compared to conventional methods. Cudjoe et al. [
17] report that, in some cases, recycling activities may even increase emissions due to energy-intensive processing. Furthermore, Bayer et al. [
30] find no significant relationship between recycling and CO2E in EU countries. These findings suggest that the environmental benefits of CE are not automatic and may depend on technological efficiency and energy sources. A third strand of literature adopts a conditional or context-dependent perspective, arguing that the impact of CE on emissions varies across countries, sectors, and time horizons. Tian et al. [
31] and Hailemariam & Erdiaw-Kwasie [
32] emphasize that CE outcomes depend on institutional quality, technological development, and policy frameworks. Similarly, Aguilar-Hernandez et al. [
33] highlight that broader economic structures and complementary policies, such as renewable energy adoption and environmental regulation, shape macroeconomic and environmental impacts of CE.
Despite these important contributions, two key gaps remain in the literature. First, many studies rely on short-term or sector-specific data, limiting their ability to capture long-run dynamics. Second, there is limited cross-country empirical evidence that systematically evaluates the combined effects of CE alongside other macroeconomic factors such as green energy, financial development, and economic growth. To address these gaps, the present study provides a comprehensive panel analysis of European countries over the period 2000–2022. By integrating CE within a broader macroeconomic framework, this study offers new insights into its role in reducing CO2E and helps reconcile the mixed findings in the existing literature.
3. Methodology and Methods
3.1. Model Development
To examine the impact of CE practices on environmental sustainability, the following panel data model is specified:
where (
i = 1, …
N) denotes countries and (t = 2000–2022) represents time, CO2E
it is carbon dioxide emissions, which serves as the dependent variable. CE
it represents the circular economy practices, GE
it denotes green energy consumption, FDI
it captures the financial development index, and GDP
it represents gross domestic product.
ai captures country-specific fixed effects, while
uit is the error term.
All variables are transformed into natural logarithms to reduce heteroscedasticity and ensure comparability across countries. The coefficients B1 to B4 measure the elasticity of CO2E with respect to each explanatory variable. Based on the theoretical expectations, CE, GE, and FDI are expected to have negative effects on CO2E, while GDP is expected to have a positive effect.
3.2. Data Collection
Based on the limited data availability, we analyze CE, GE, FDI, and GDP, which are key determinants that significantly contributed to reduced CO2E over the period 2000–2022. For the analysis, we established a panel of European countries, including Austria, Belgium, Bulgaria, Croatia, Czechia, Denmark, Estonia, France, Finland, Germany, Greece, Hungary, Italy, Ireland, Luxembourg, Lithuania, Latvia, Portugal, Poland, Romania, Slovenia, Spain, and Sweden.
Carbon dioxide emissions are used as the dependent variable to capture environmental degradation. A composite Circular Economy (CE) index is constructed using (Generation packaging waste, resource productivity, and recycling rate of municipal waste), with the first principal component retained as a proxy for CE practices. Circular economy practices (CE) serve as the primary independent variables due to their direct role in promoting resource efficiency, recycling, and waste reduction, which are expected to lower emissions. Green energy (GE) is included to reflect the transition toward renewable energy sources and its contribution to reducing carbon intensity. Financial development index (FDI) is incorporated to capture the role of financial systems in facilitating investments in green technologies and sustainable infrastructure. Gross domestic product (GDP) is used as a control variable to represent economic activity, which is widely recognized as a key driver of environmental pressure.
Due to data limitations, the original annual data were converted into quarterly frequency using a standard interpolation approach. This transformation increases the number of observations, improves the efficiency of econometric estimation, and allows for better capturing of short-run dynamics and temporal variations across countries. Such an approach is commonly adopted in panel data studies when higher-frequency data are not directly available.
Various sources were employed for data collection, including OWDI, WID, IMF, and Eurostat, and the data were converted into natural to logarithmic forms to address scale inconsistencies.
Table 1 provides data sources, indicators, and corresponding links.
3.3. Econometric Approaches
This study adopts a structured and sequential econometric strategy to ensure robust and reliable estimation of the relationship between CE practices and CO2E. The combination of multiple econometric techniques is not arbitrary; rather, each method is employed to address specific econometric challenges commonly associated with macro-panel data, such as cross-sectional dependence, slope heterogeneity, and non-stationarity.
The empirical analysis proceeds in four main stages.
First, preliminary diagnostic tests are conducted to examine the fundamental properties of the panel data. The Pesaran (2004) CD test is applied to determine whether shocks are correlated across countries. Given the high level of economic and policy integration among European countries, ignoring such dependence may lead to biased and inconsistent estimates. In parallel, the Pesaran and Yamagata (2008) slope heterogeneity test is employed to assess whether the relationships between variables differ across countries. These tests provide essential guidance for selecting appropriate estimation techniques.
Second, the stationarity properties of the variables are examined using second-generation panel unit root tests, namely the CADF and CIPS tests. These methods explicitly account for CD, ensuring more reliable results compared to first-generation tests. Establishing the order of integration is necessary to avoid spurious regression and to justify subsequent long-run analysis. Third, the Westerlund (2007) cointegration test is used to determine whether a long-run equilibrium relationship exists among CO2E, CE practices, GE, FDI, and GDP. Confirming cointegration is a critical step, as it validates the use of long-run estimators and ensures that the estimated relationships are meaningful and not driven by common trends.
Finally, given the presence of CD and slope heterogeneity, this study employs advanced second-generation estimators, namely the AMG estimators and the DCCE estimator. The AMGE estimator is used as the baseline model because it captures heterogeneous long-run relationships across countries while controlling for unobserved common factors. To further strengthen the robustness of the results, the DCCE estimator is applied as a complementary approach, as it explicitly accounts for CD by incorporating cross-sectional averages into the regression. The consistency of results across these two estimators enhances the credibility of the findings. In addition to long-run estimation. The Dumitrescu-Hurlin panel causality test is employed to examine the direction of causality among the variables. This step complements the long-run analysis by identifying whether relationships are driven by causal mechanisms or simple correlations. Overall, this integrated econometric framework ensures that each method serves a distinct and complementary role, thereby addressing key econometric challenges and improving the reliability, consistency, and interpretability of the empirical results.
Importantly, the combination of these econometric techniques follows a coherent and structured empirical logic rather than a fragmented application of methods. Each technique is selected to address a specific econometric challenge, and their sequential use ensures that the limitations of one method are mitigated by the strengths of another. In particular, diagnostic tests inform model selection, unit root and cointegration tests establish the validity of the long-run relationship, and advanced estimators provide robust inference under cross-sectional dependence and heterogeneity. This integrated framework enhances the overall reliability, consistency, and methodological rigor of the analysis.
3.4. Descriptive Statistics
This analysis examines the dataset’s central tendency and variability by calculating key statistics such as the mean, median, minimum, maximum, and standard deviation. These measures help uncover the underlying distributional patterns of the variables. This step is essential for detecting potential outliers and evaluating the spread and variability of important parameters, including CO2E, CE, FDI, GE, and GDP. Following the descriptive analysis, a series of diagnostic tests was conducted to assess the dataset’s statistical validity and to confirm that the selected econometric techniques are suitable for producing reliable estimates.
3.5. Diagnostic Tests
A correlation matrix was generated to assess the direction and strength of bivariate linear relationships among the study variables, with coefficients ranging from −1 + 1. This analysis offers an initial insight into how closely the variables are related, highlighting any strong positive or negative associations that may suggest potential redundancy. Identifying these relationships is important for understanding the interactions among variables and for supporting the reliability of subsequent regression analysis.
However, it is important to note that the correlation matrix reflects only pairwise relationships and captures higher-order multicollinearity/therefore, additional diagnostic tests are employed later in this section to further evaluate this issue.
Given that European countries are exposed to common regional shocks, trade interconnections, and policy spillovers, it is important to test for cross-sectional dependence (CD) within the panel data. Ignoring CD may lead to biased standard errors and unreliable or inefficient estimates. To address this, the Pesaran (2004) CD test was employed. The null hypothesis assumes cross-sectional independence, while the alternative suggests the presence of dependence among panel units. The results indicate significant cross-sectional dependence, implying that economic and environmental shocks in one country can be transmitted to others within the region. As a result, econometric techniques that are robust to such dependence, specifically AMGE and CCE, were utilized in the empirical analysis. The Pesaran CD test assesses whether residuals across countries are independent, and its test equation is given as follows:
Here, T represents the study period, while N denotes the number of countries included in the panel (European countries). The term refers to the estimated pairwise correlation of residuals between cross-sectional units i and j.
Following the confirmation of cross-sectional dependence, the slope Heterogeneity (SH) test developed by Pesaran and Yamagata (2008) was applied to examine the consistency of parameters across cross-sectional units. This test evaluates whether slope coefficients vary significantly among countries, which is particularly important in heterogeneous panels like the EU, where structural, institutional, and environmental differences may affect parameter estimates. The SH test is based on Swamy’s (1970) statistics, which measure the dispersion of individual slope coefficients relative to the pooled estimator. The standardized Δ and adjusted Δ adj statistics are calculated as follows:
N = number of cross-sectional units.
K = number of regressors.
= Swamy test statistics (average).
E(S), Var(S) = expected value and variance of S.
To avoid spurious regression results and ensure the reliability of long-run estimations, this study assessed the stationarity properties of all variables using second-generation panel unit root tests, specifically the Cross-sectional Im, Pesaran, and Shin (CIPS) test and the Cross-sectional Augmented Dickey–Fuller (CADF) test. The CADF test controls cross-sectional dependence by incorporating cross-sectional averages into the standard ADF framework, while the CIPS test provides a panel-level statistic by averaging individual CADF results across countries. Both tests examine the null hypothesis of non-stationarity against the alternative of stationarity, ensuring more robust results in the presence of common shocks and interdependencies.
The Westerlund (2007) cointegration test was employed to examine the existence of a long-run equilibrium relationship among the variables. This test is particularly suitable for panel data with cross-sectional dependence, as it is based on error-correction models and allows for heterogeneity across cross-sectional units.
The test evaluates the null hypothesis of no cointegration against the alternative that at least some panel units are cointegrated. It provides four test statistics, Gt, Ga, Pt, and Pa, where the group statistics (Gt and Ga) assess cointegration at the individual country level, while the panel statistics (Pt and Pa) evaluate cointegration for the panel. Rejection of the null hypothesis indicates the presence of a long-run relationship among the variables, confirming that they move together over time despite short-run fluctuations.
3.6. Econometric Technique
The Augmented Mean Group (AMGE) estimator, proposed by Eberhardt and Bond (2009), is a second panel estimation technique designed for heterogeneous panels with cross-sectional dependence, non-stationarity, and unobserved common factors. Unlike conventional estimators such as pooled OLS or fixed effects, which assume slope homogeneity and cross-sectional independence, AMG allows coefficients to vary across countries while accounting for common dynamic processes.
The selection of the AMGE technique is particularly justified in the context of European countries, which are highly interconnected through trade integration, financial linkages, and shared policy frameworks (e.g., EU regulations and monetary coordination). These interdependencies often generate cross-sectional dependence and heterogeneous country-specific responses. In such settings, traditional estimators may yield biased and inconsistent results, whereas AMGE effectively controls these issues by incorporating unobserved common factors and estimating country-specific long-run relationships.
Furthermore, AMGE is robust to non-stationarity and suitable for panels with mixed integration orders, which are common in macroeconomic data. Its flexibility in capturing both heterogeneity and cross-sectional dependence makes it a superior and reliable method for obtaining consistent long-run estimates in this study.
For each cross-sectional unit
i, the baseline specification is expressed as:
where
represents the dependent variable,
is a vector of explanatory variables and
, and
denote unit-specific intercepts and slopes, respectively.
captures an unobserved common dynamic process, and
is the idiosyncratic error term.
To account for cross-sectional dependence arising from an unobserved common factor, the AMGE procedure first estimates a pooled regression in first differences augmented with time dummies to approximate the common dynamic process:
where
represents the estimated common factor. In the second step, the estimated common dynamic effect is included in individual country regression to obtain unit-specific long-run coefficients. The overall panel estimate is then computed as the simple average of the individual coefficients:
This method effectively controls unobserved common shocks while preserving country-specific heterogeneity. Given the presence of cross-sectional dependence and heterogeneous dynamics across European economies, AMGE provides robust and reliable long-run estimates.
The selection of the Dynamic Common Correlated Effects (DCCE) estimator, proposed by M. Hashem Pesaran (2006), is motivated by its ability to effectively address key econometric challenges inherent in macro-panel data. In panels consisting of European countries, strong economic integration, financial linkages, and shared policy environments often generate cross-sectional dependence through unobserved common factors such as global shocks, regional crises, or coordinated policy actions. Ignoring these common factors can lead to biased and inconsistent estimates in conventional panel models.
The DCCE estimator is considered superior to traditional panel techniques because it explicitly accounts for CD by augmenting the regression with the CD average of both dependent and independent variables. This approach serves as a proxy for unobserved common factors, thereby eliminating omitted variable bias associated with such latent influences. As a result, DCCE produces consistent and efficient estimates even in the presence of strong CD dependence.
Moreover, the DCCE framework allows for slope heterogeneity across countries, which is particularly important given that European economies differ in institutional quality, economic structure, and environmental policies. Unlike first-generation estimators that impose restrictive homogeneity assumptions, DCCE accommodates these differences, leading to more realistic and policy-relevant results. Therefore, the use of the DCCE estimator as a robustness check strengthens the empirical analysis by ensuring that the findings remain stable even after controlling for unobserved common shocks and heterogeneity. This enhances the credibility and reliability of the study’s conclusions.
3.7. Dumitrescu Hurlin Granger Causality
To investigate the orientation of the causal link between the variables, this study follows the Dumitrescu-Hurlin Granger causality test, which was developed by Elena Dumitrescu and Christophe Hurlin. This method extends the traditional Granger causality framework to heterogeneous panel data structures. Unlike the conventional Granger causality test, which uses homogeneous causal relationships to vary across cross-sectional units, the Dumitrescu-Hurlin approach permits the variation in causal correlation between different countries. This aspect makes the test especially suitable for macro-panel datasets in which structures of economies and policy environments vary across countries.
The baseline regression model for the Dumitrescu-Hurlin test can be expressed as:
where y
i,t and
xi,t represent the variables of interest for cross-sectional unit
i at time
t,
K denotes the lag length,
ai represents individual fixed effects, and
Ei,t is the error term. The null hypothesis of the test assumes that there is no Granger causality from variable x to variable y for cross-sectional units:
The alternative hypothesis allows causality for at least some cross-sectional units:
The Dumitrescu-Hurlin test computes individual Wald statistics for each cross-sectional unit and then averages them to obtain a panel statistic, which is standardized to produce the Z-bar statistic for statistical inference.
By applying this approach, the study identifies the direction of causal relationships among CE practices, GE, GDP, FD, and environmental indicators across the panel countries. This provides deeper insight into whether changes in one variable systematically precede changes in another within the panel framework.
4. Results and Discussion
4.1. Summary Statistics
The descriptive statistics reported in
Table 2 provide an overview of the key characteristics of the variables employed in the analysis, including CO2E, CE, GE, GDP, and FDI. These statistics summarize the central tendency and dispersion of the data, offering initial insight into the distribution and variability of the variables across countries and over time.
The descriptive statistics reported in
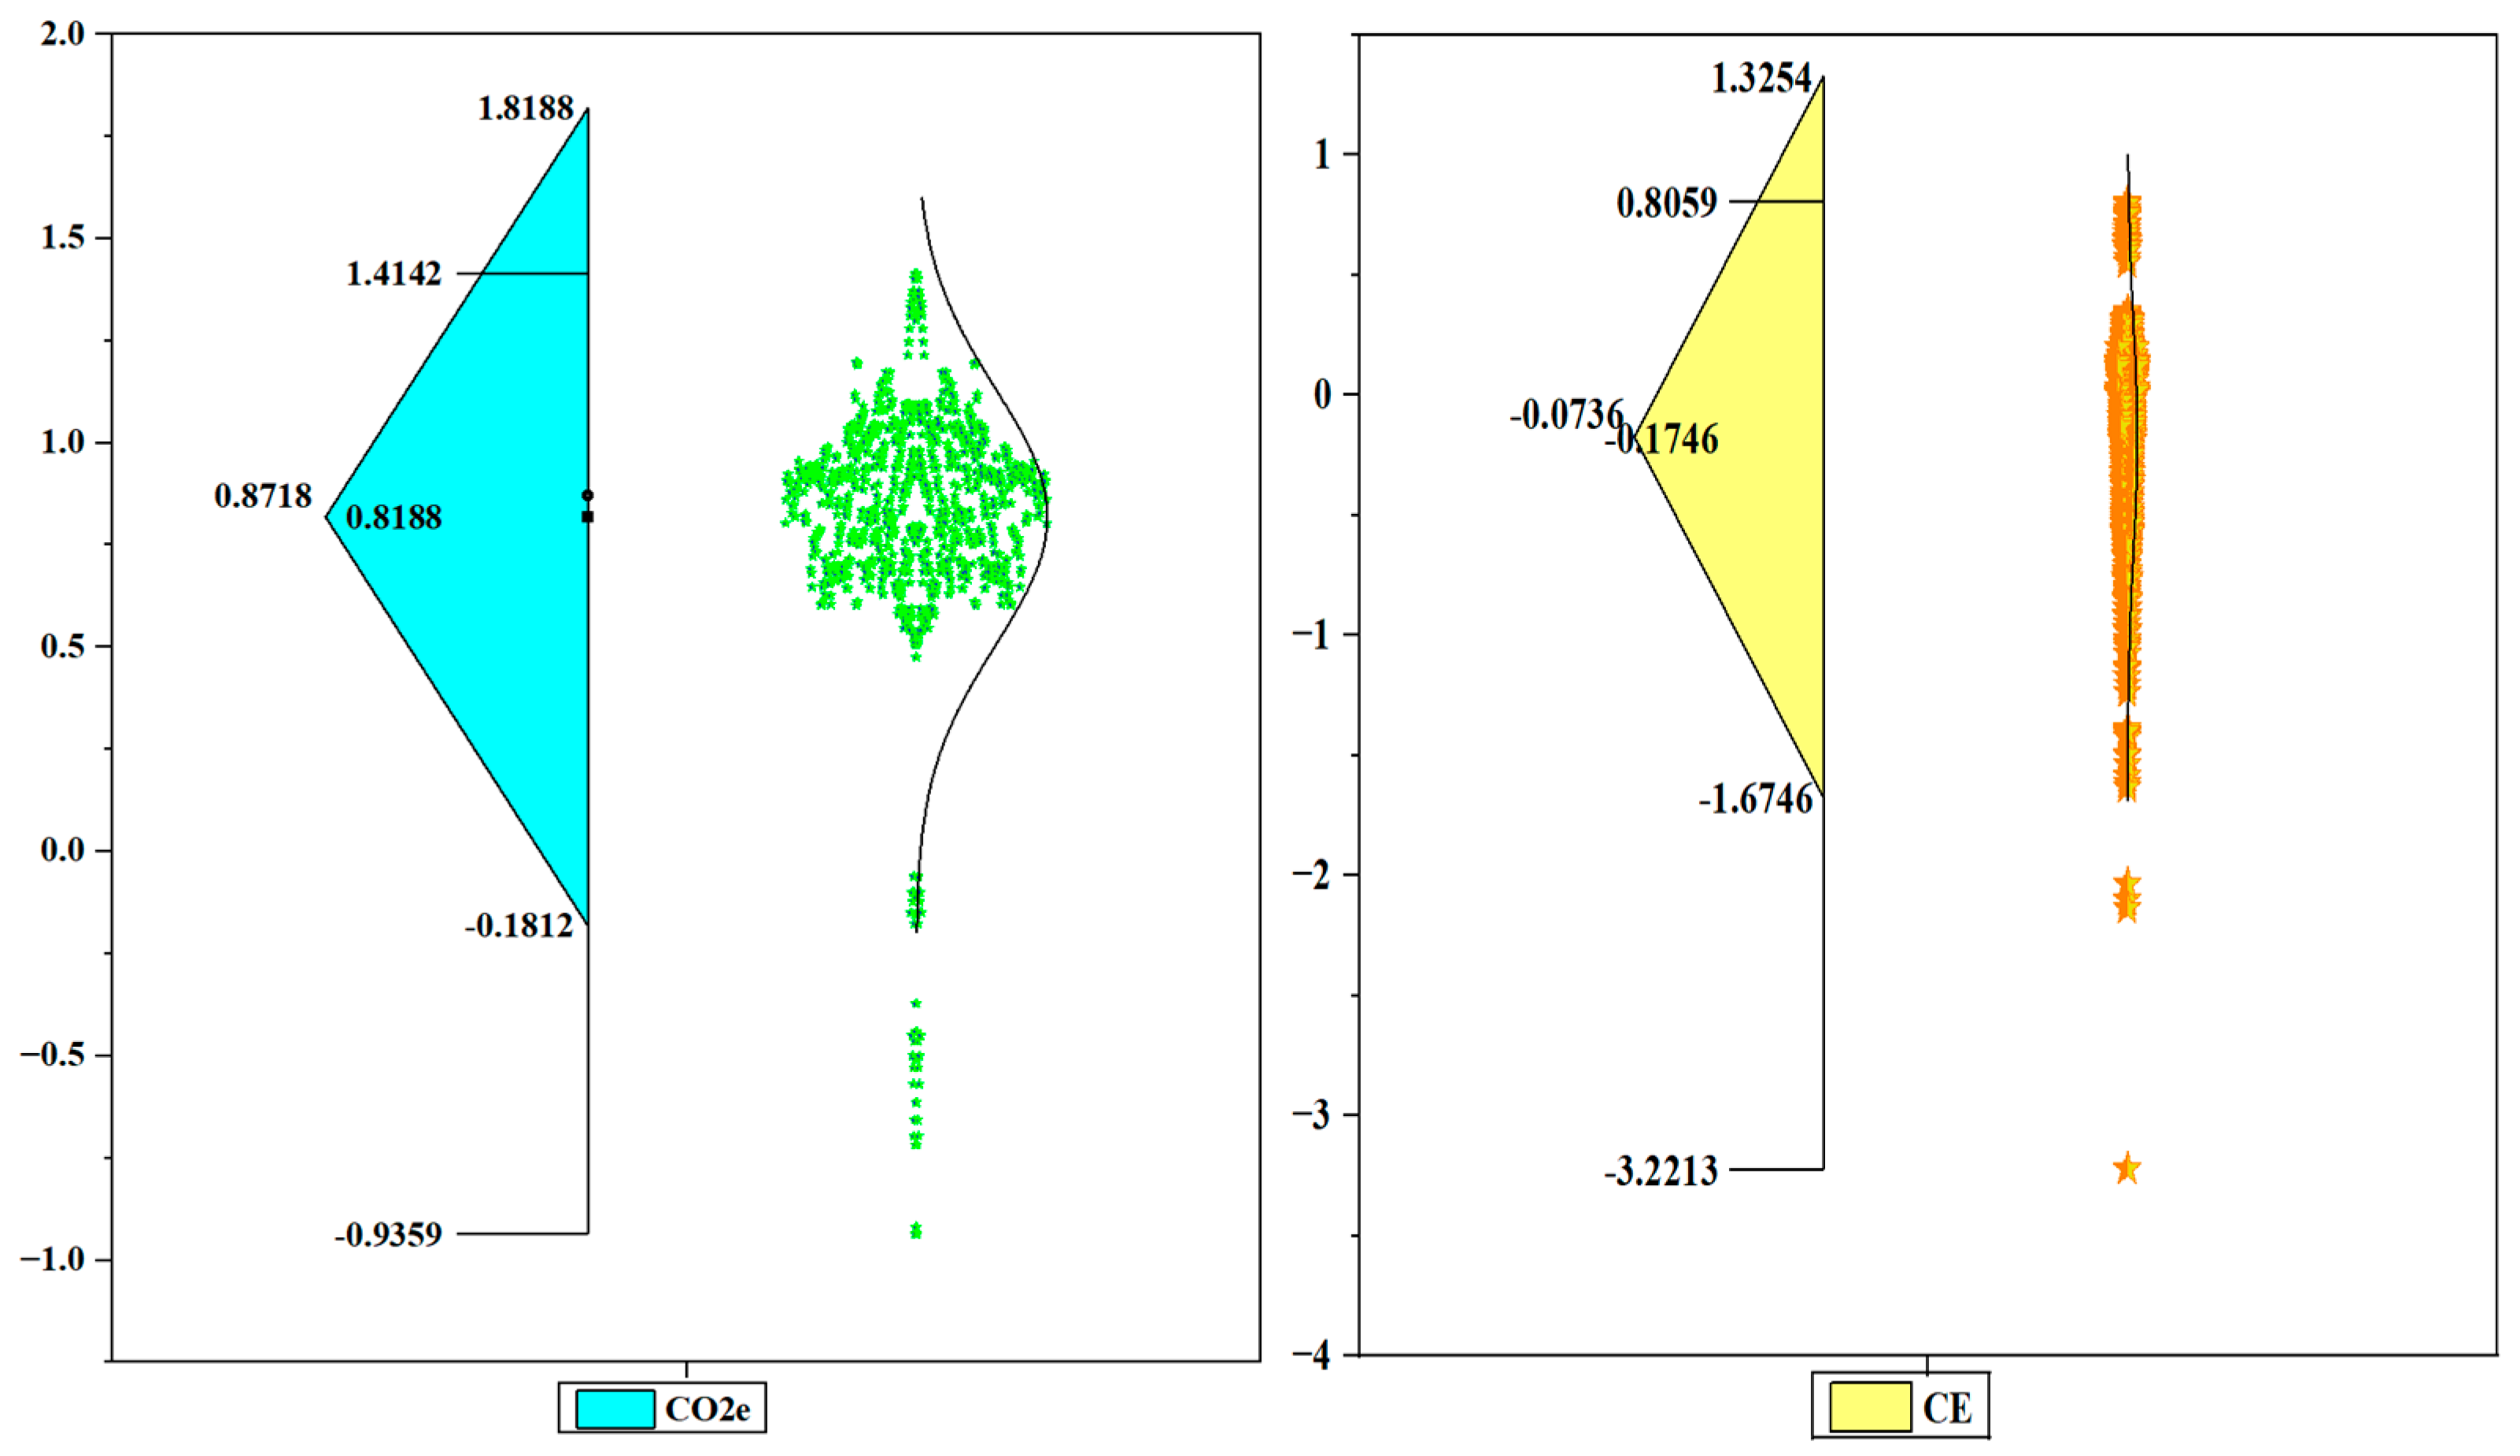
Table 2 provide important insights into the distribution and variability of the variables across the sample countries. The mean value of CO2E is 0.818, with a median of 0.87, suggesting a relatively symmetric distribution. The range between the maximum and minimum values (1.414 and −0.936, respectively) and a SD of 0.313 indicates moderate variation in emission levels across countries, reflecting differences in environmental performance. For CE, the mean is −0.175, and the median is −0.074, indicating that the overall level of CE performance remains relatively low across the standardized dataset. The wide range of values (from −3.222 to 0.806) and a SD of 0.466 highlight substantial heterogeneity in the adoption of CE practices across countries. This variation suggests that while some countries have made significant progress in circularity, others lag.
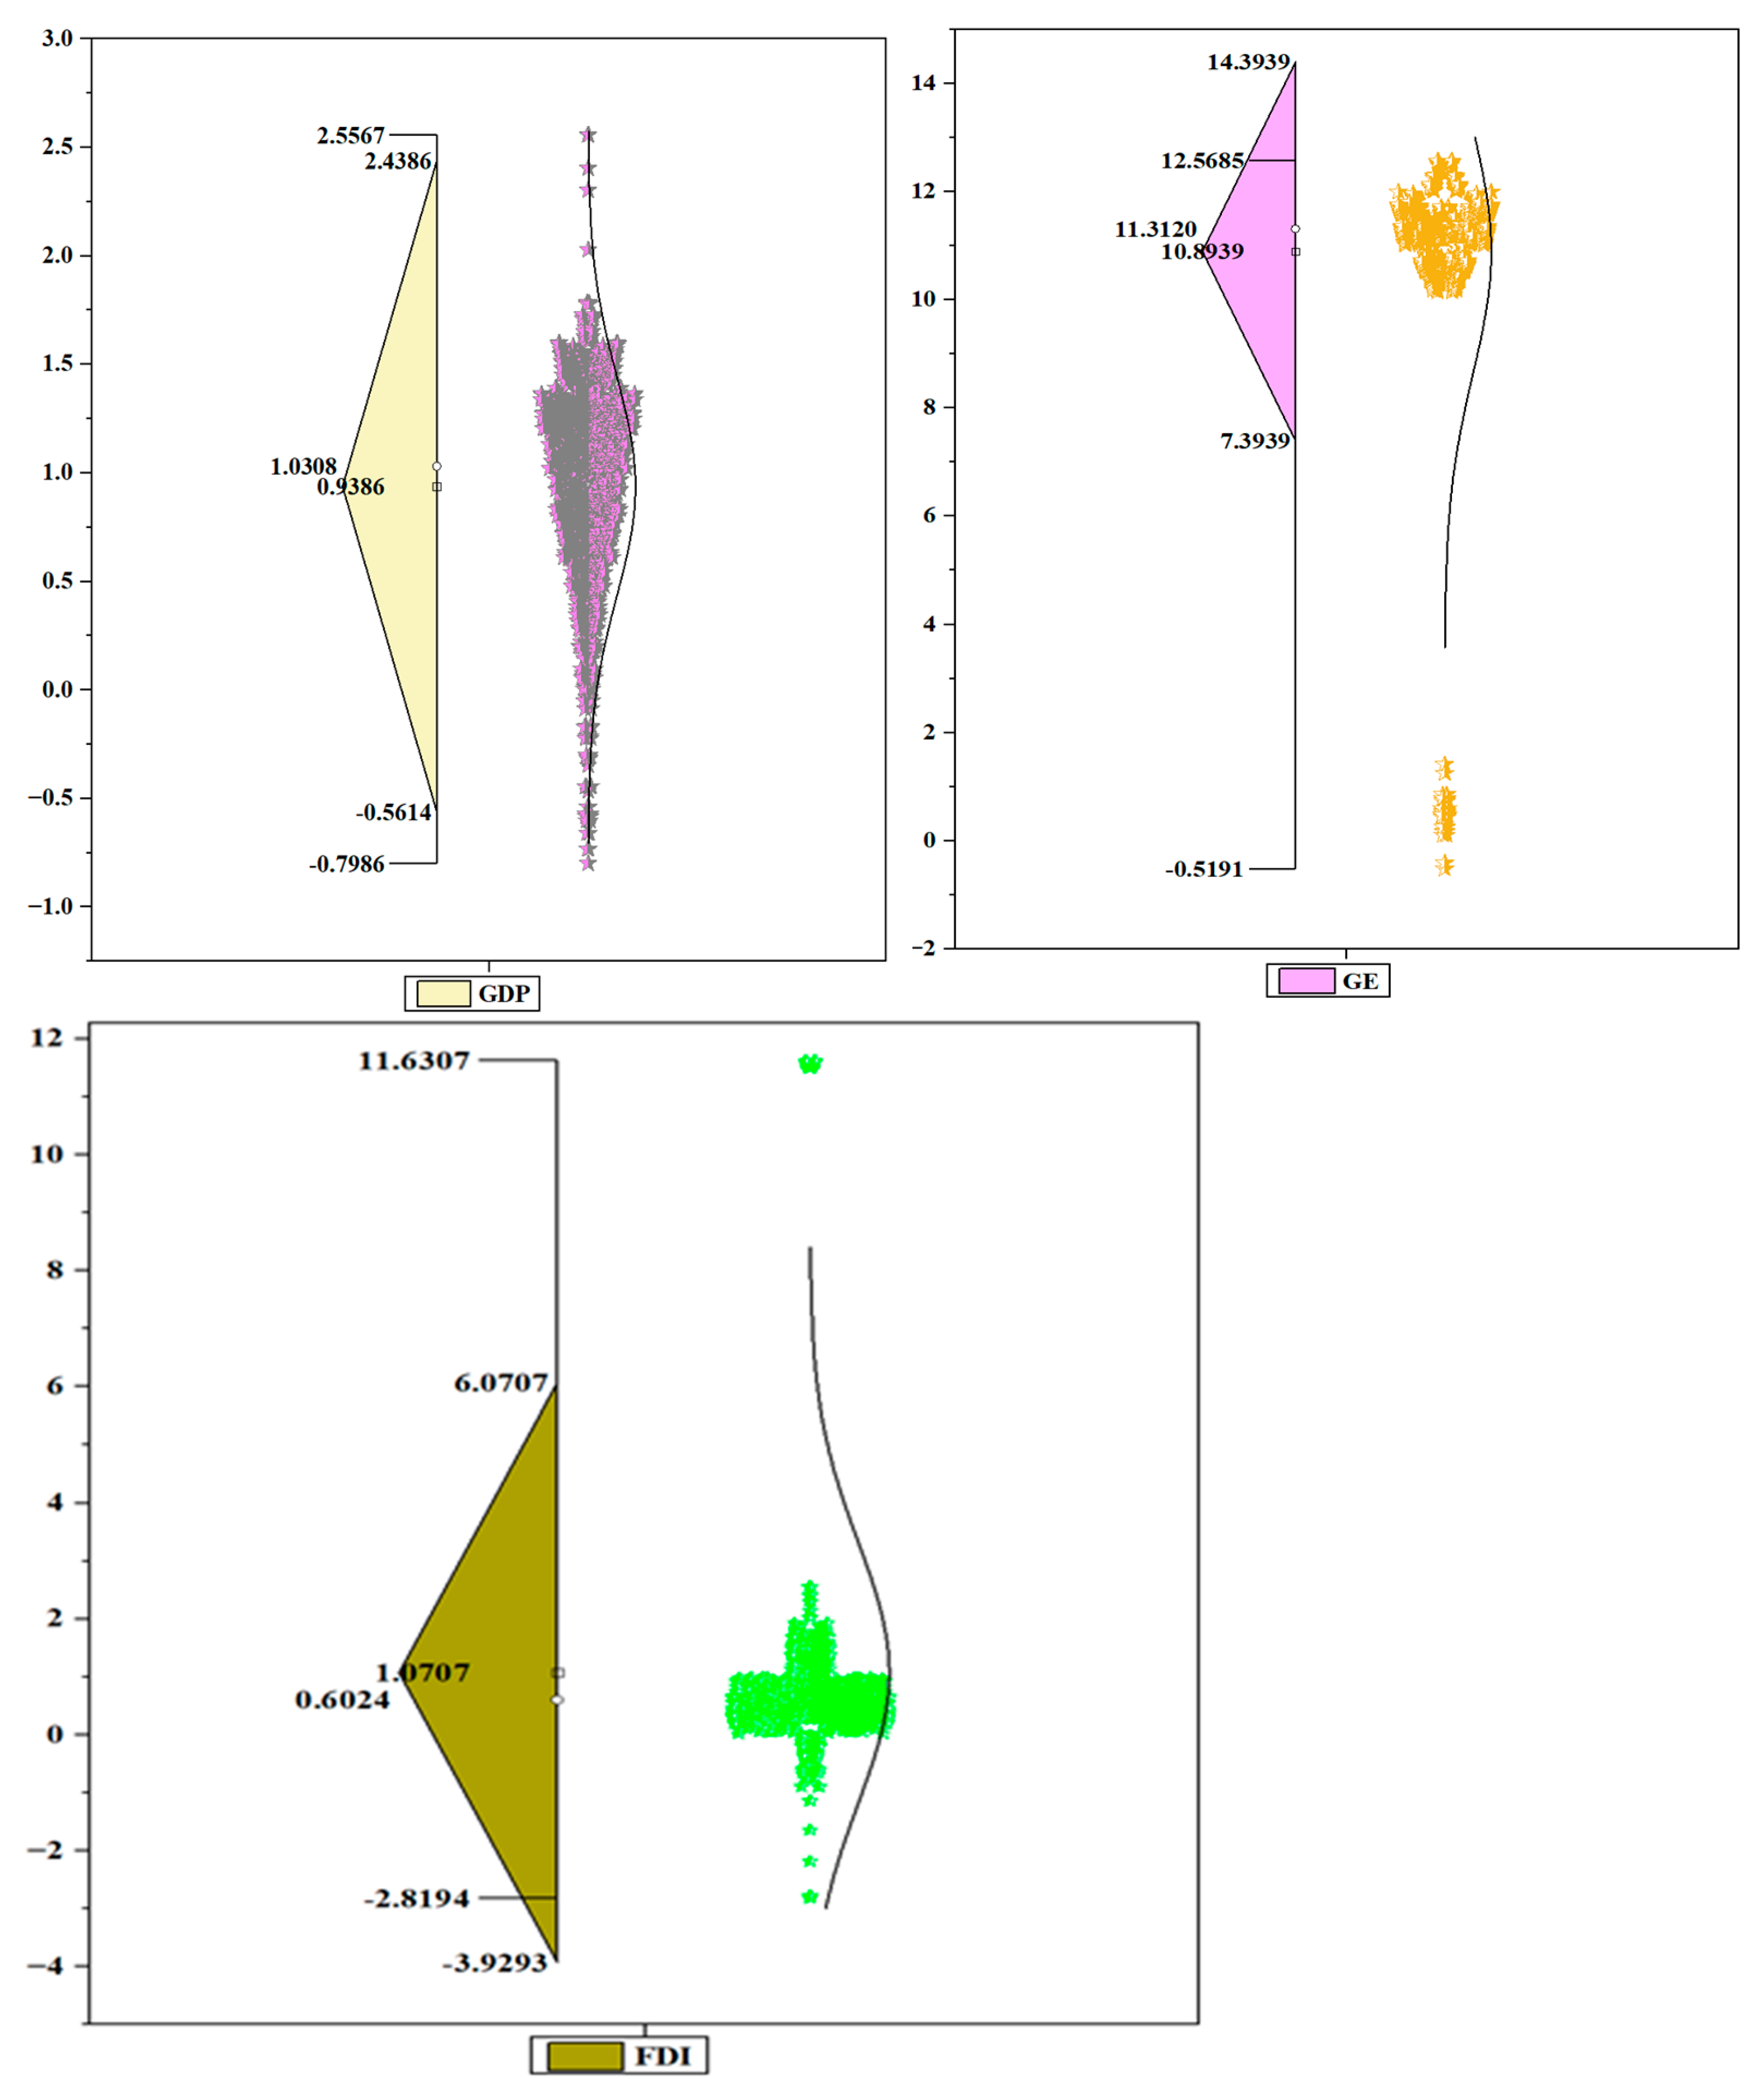
Regarding economic performance, GDP shows a mean of 10.894 and a median of 11.312, suggesting that most observations are concentrated around higher levels of economic output. The wide range between the maximum (12.568) and minimum (0.519) values, along with an SD of 2.254, indicates significant heterogeneity in economic development across the sample countries. Finally, FDI has a mean value of 1.071 and a median of 0.602, indicating a slightly right-skewed distribution. The large spread between the maximum (11.631) and minimum (−2.819) values, combined with a SD of 2.262, reflects substantial differences in financial development across countries.
Additionally,
Figure 2 presents box plots illustrating the distributional characteristics of the key, explanatory, and control variables under investigation. These plots provide a visual summary of the data by displaying the 25th, 50th (median), and 75th percentiles. The central circle represents the median value, while the squares indicate the mean, allowing for a comparison between central tendency measures.
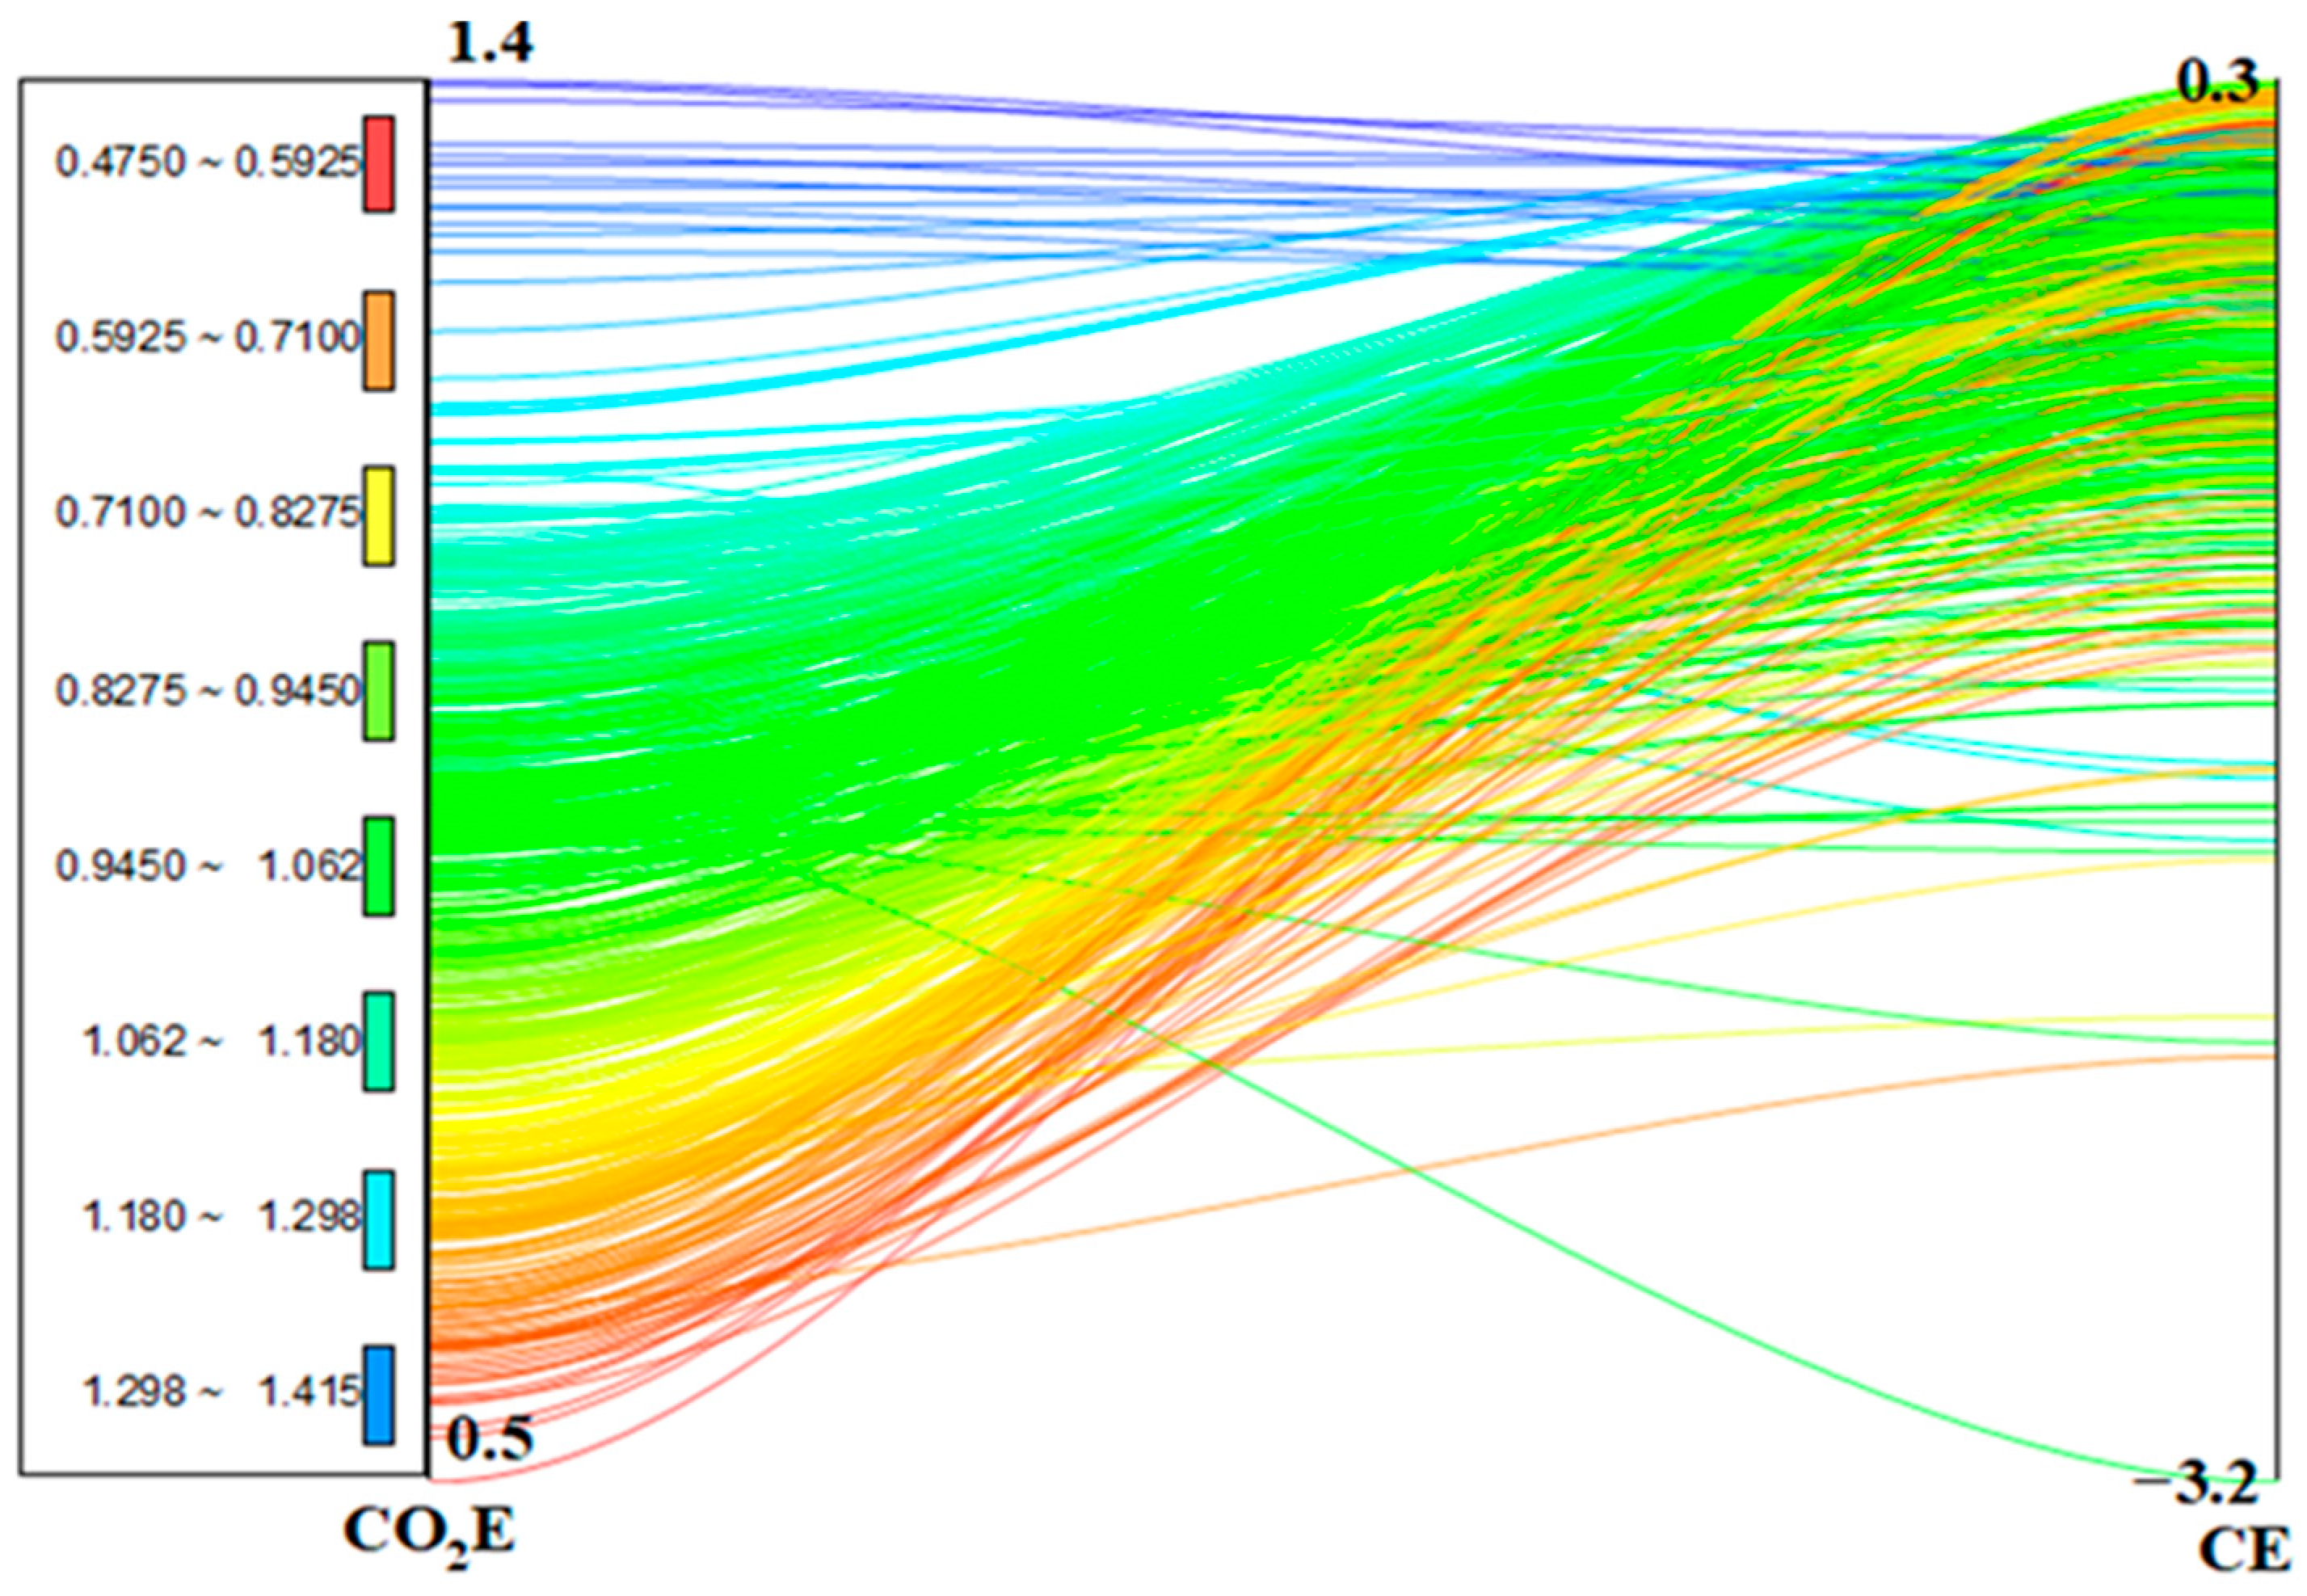
Figure 3 illustrates the distributional relationship between CO2E and CE practices. The flow patterns indicate that higher emissions levels are generally associated with lower levels of circular economy performance, suggesting a negative relationship between the two variables. However, some variation across observations is evident, reflecting cross-country differences in the adoption and effectiveness of CE practices. Overall, the figure supports the empirical findings that improvements in CE are linked to reductions in CO2E.
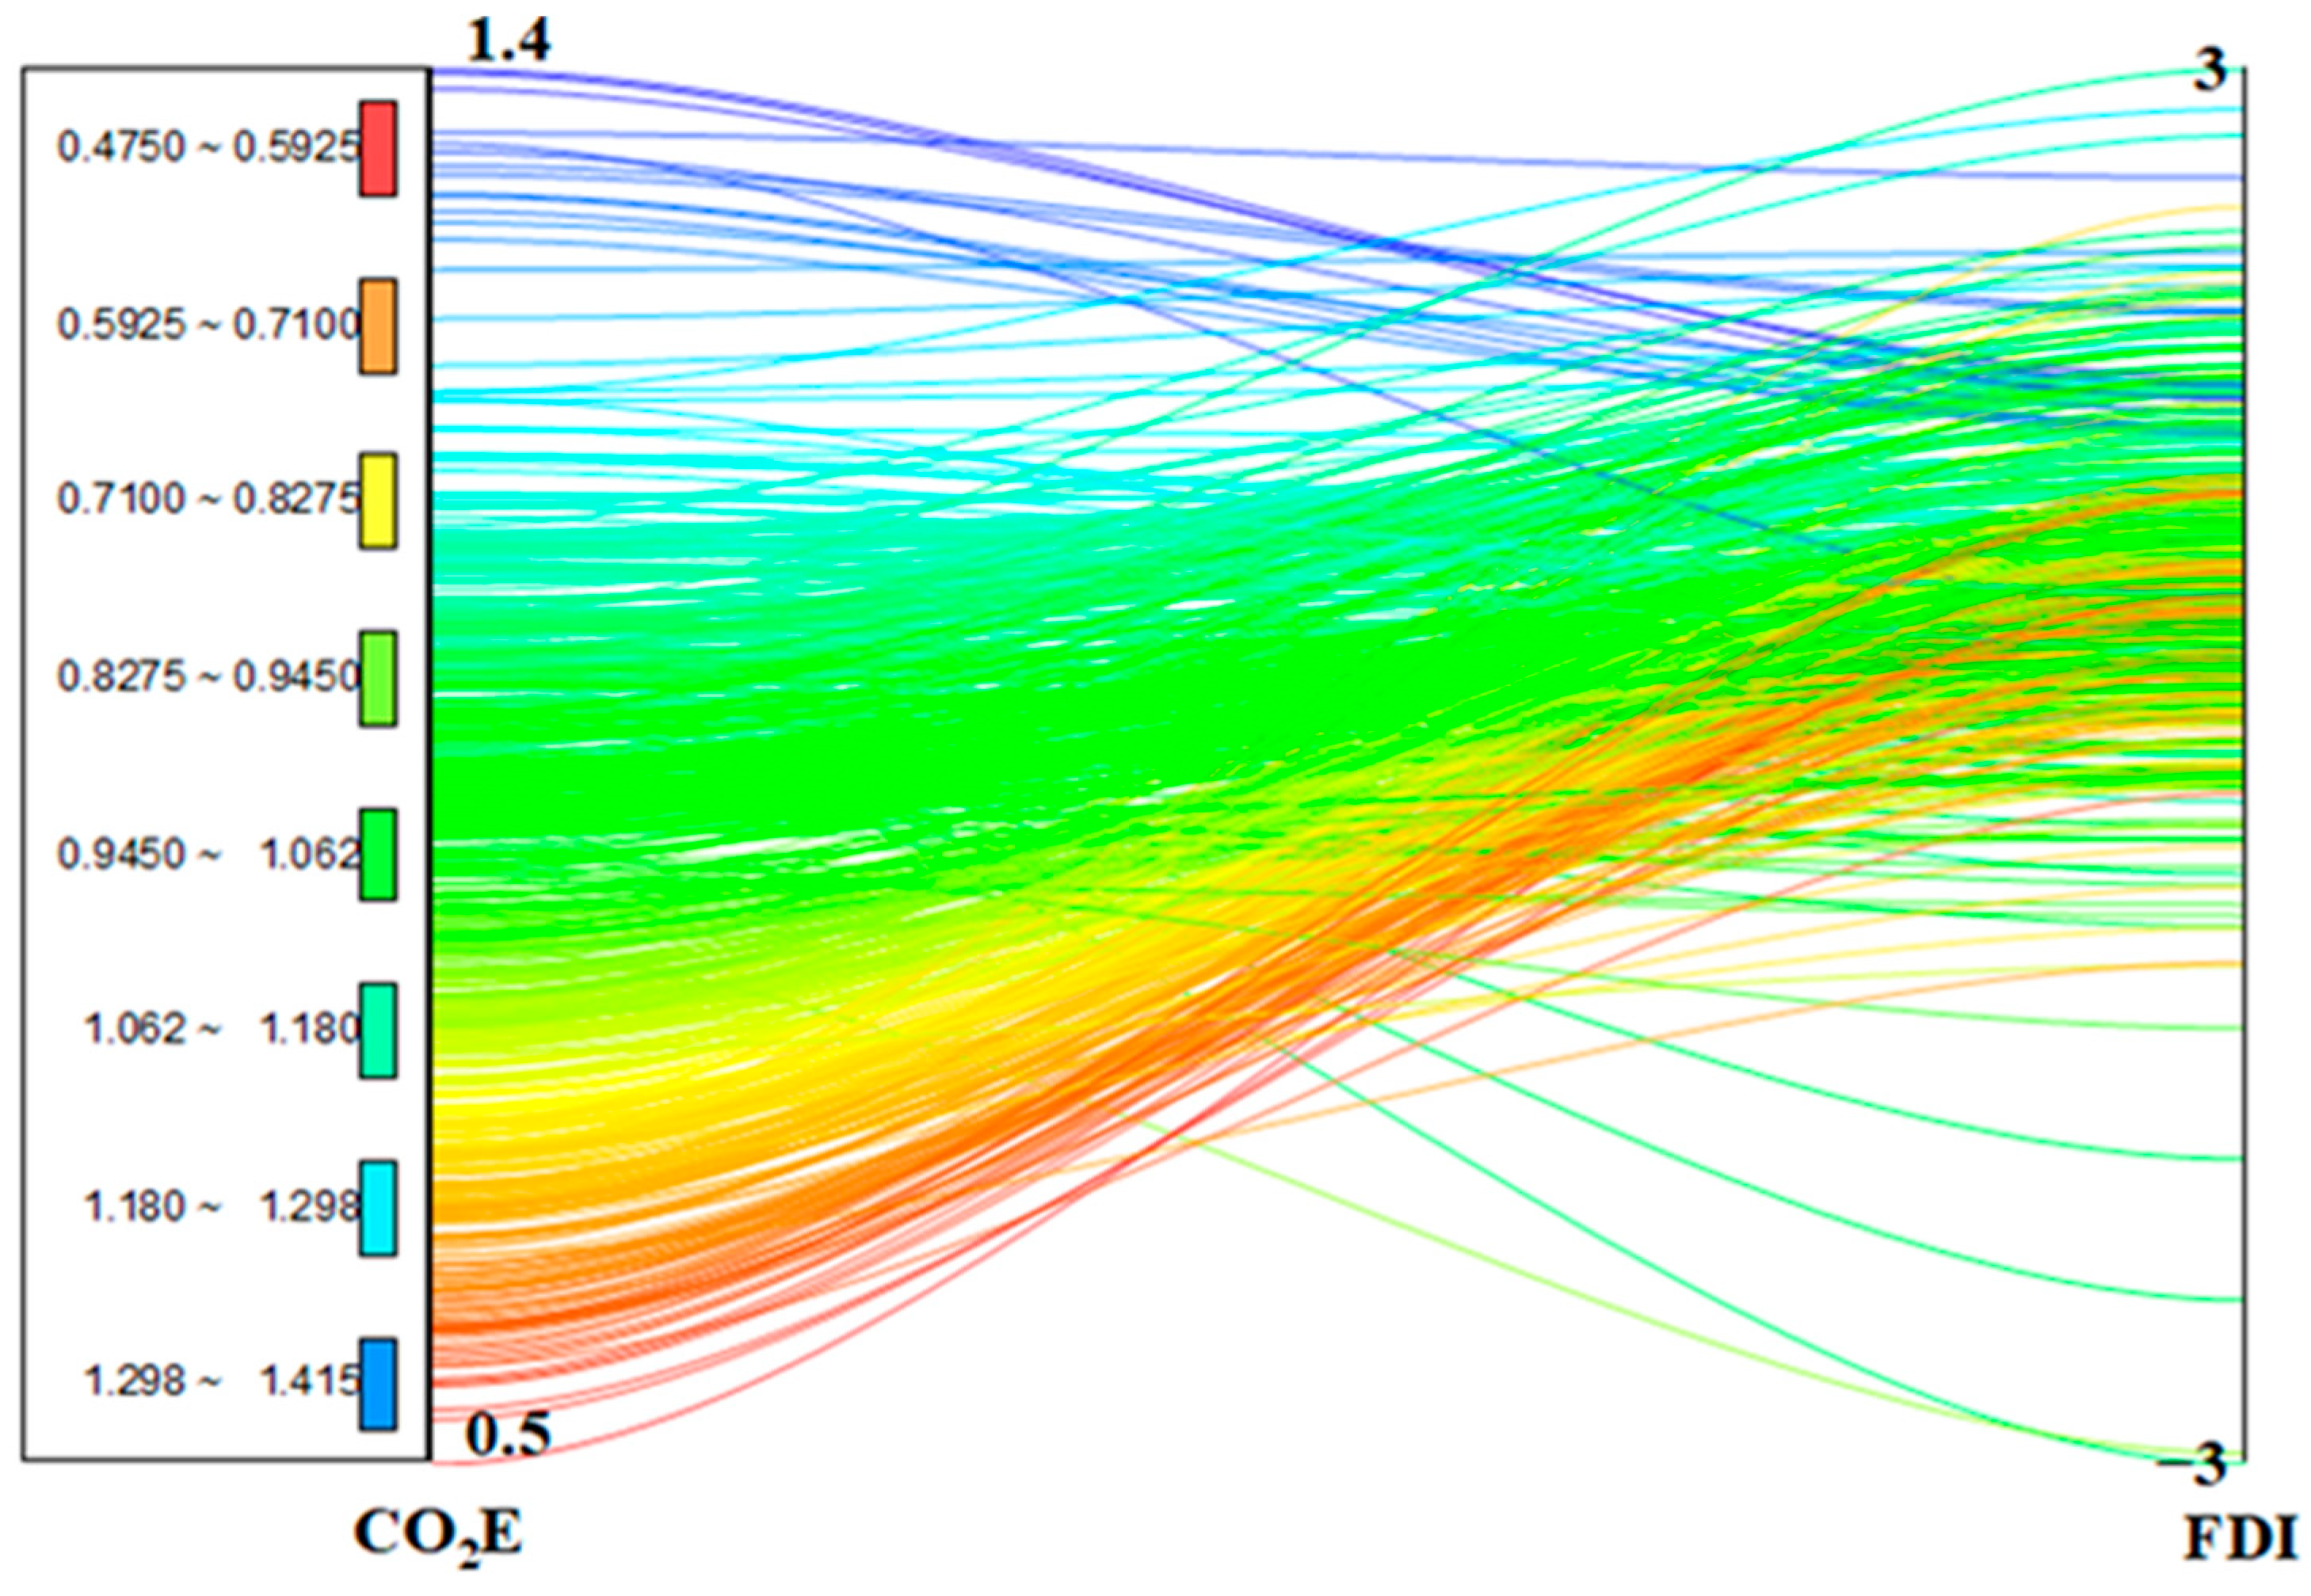
Figure 4 illustrates the distributional relationship between CO2E and FDI. The flow patterns indicate that higher levels of CO2E are generally associated with higher levels of FDI, suggesting a positive relationship between the two variables. However, the dispersion of trajectories also reveals noticeable heterogeneity across countries, indicating that the impact of FDI on emissions is not uniform. Overall, the figure supports the empirical findings that financial development plays a significant role in shaping environmental outcomes, although its effects may vary depending on country-specific conditions.
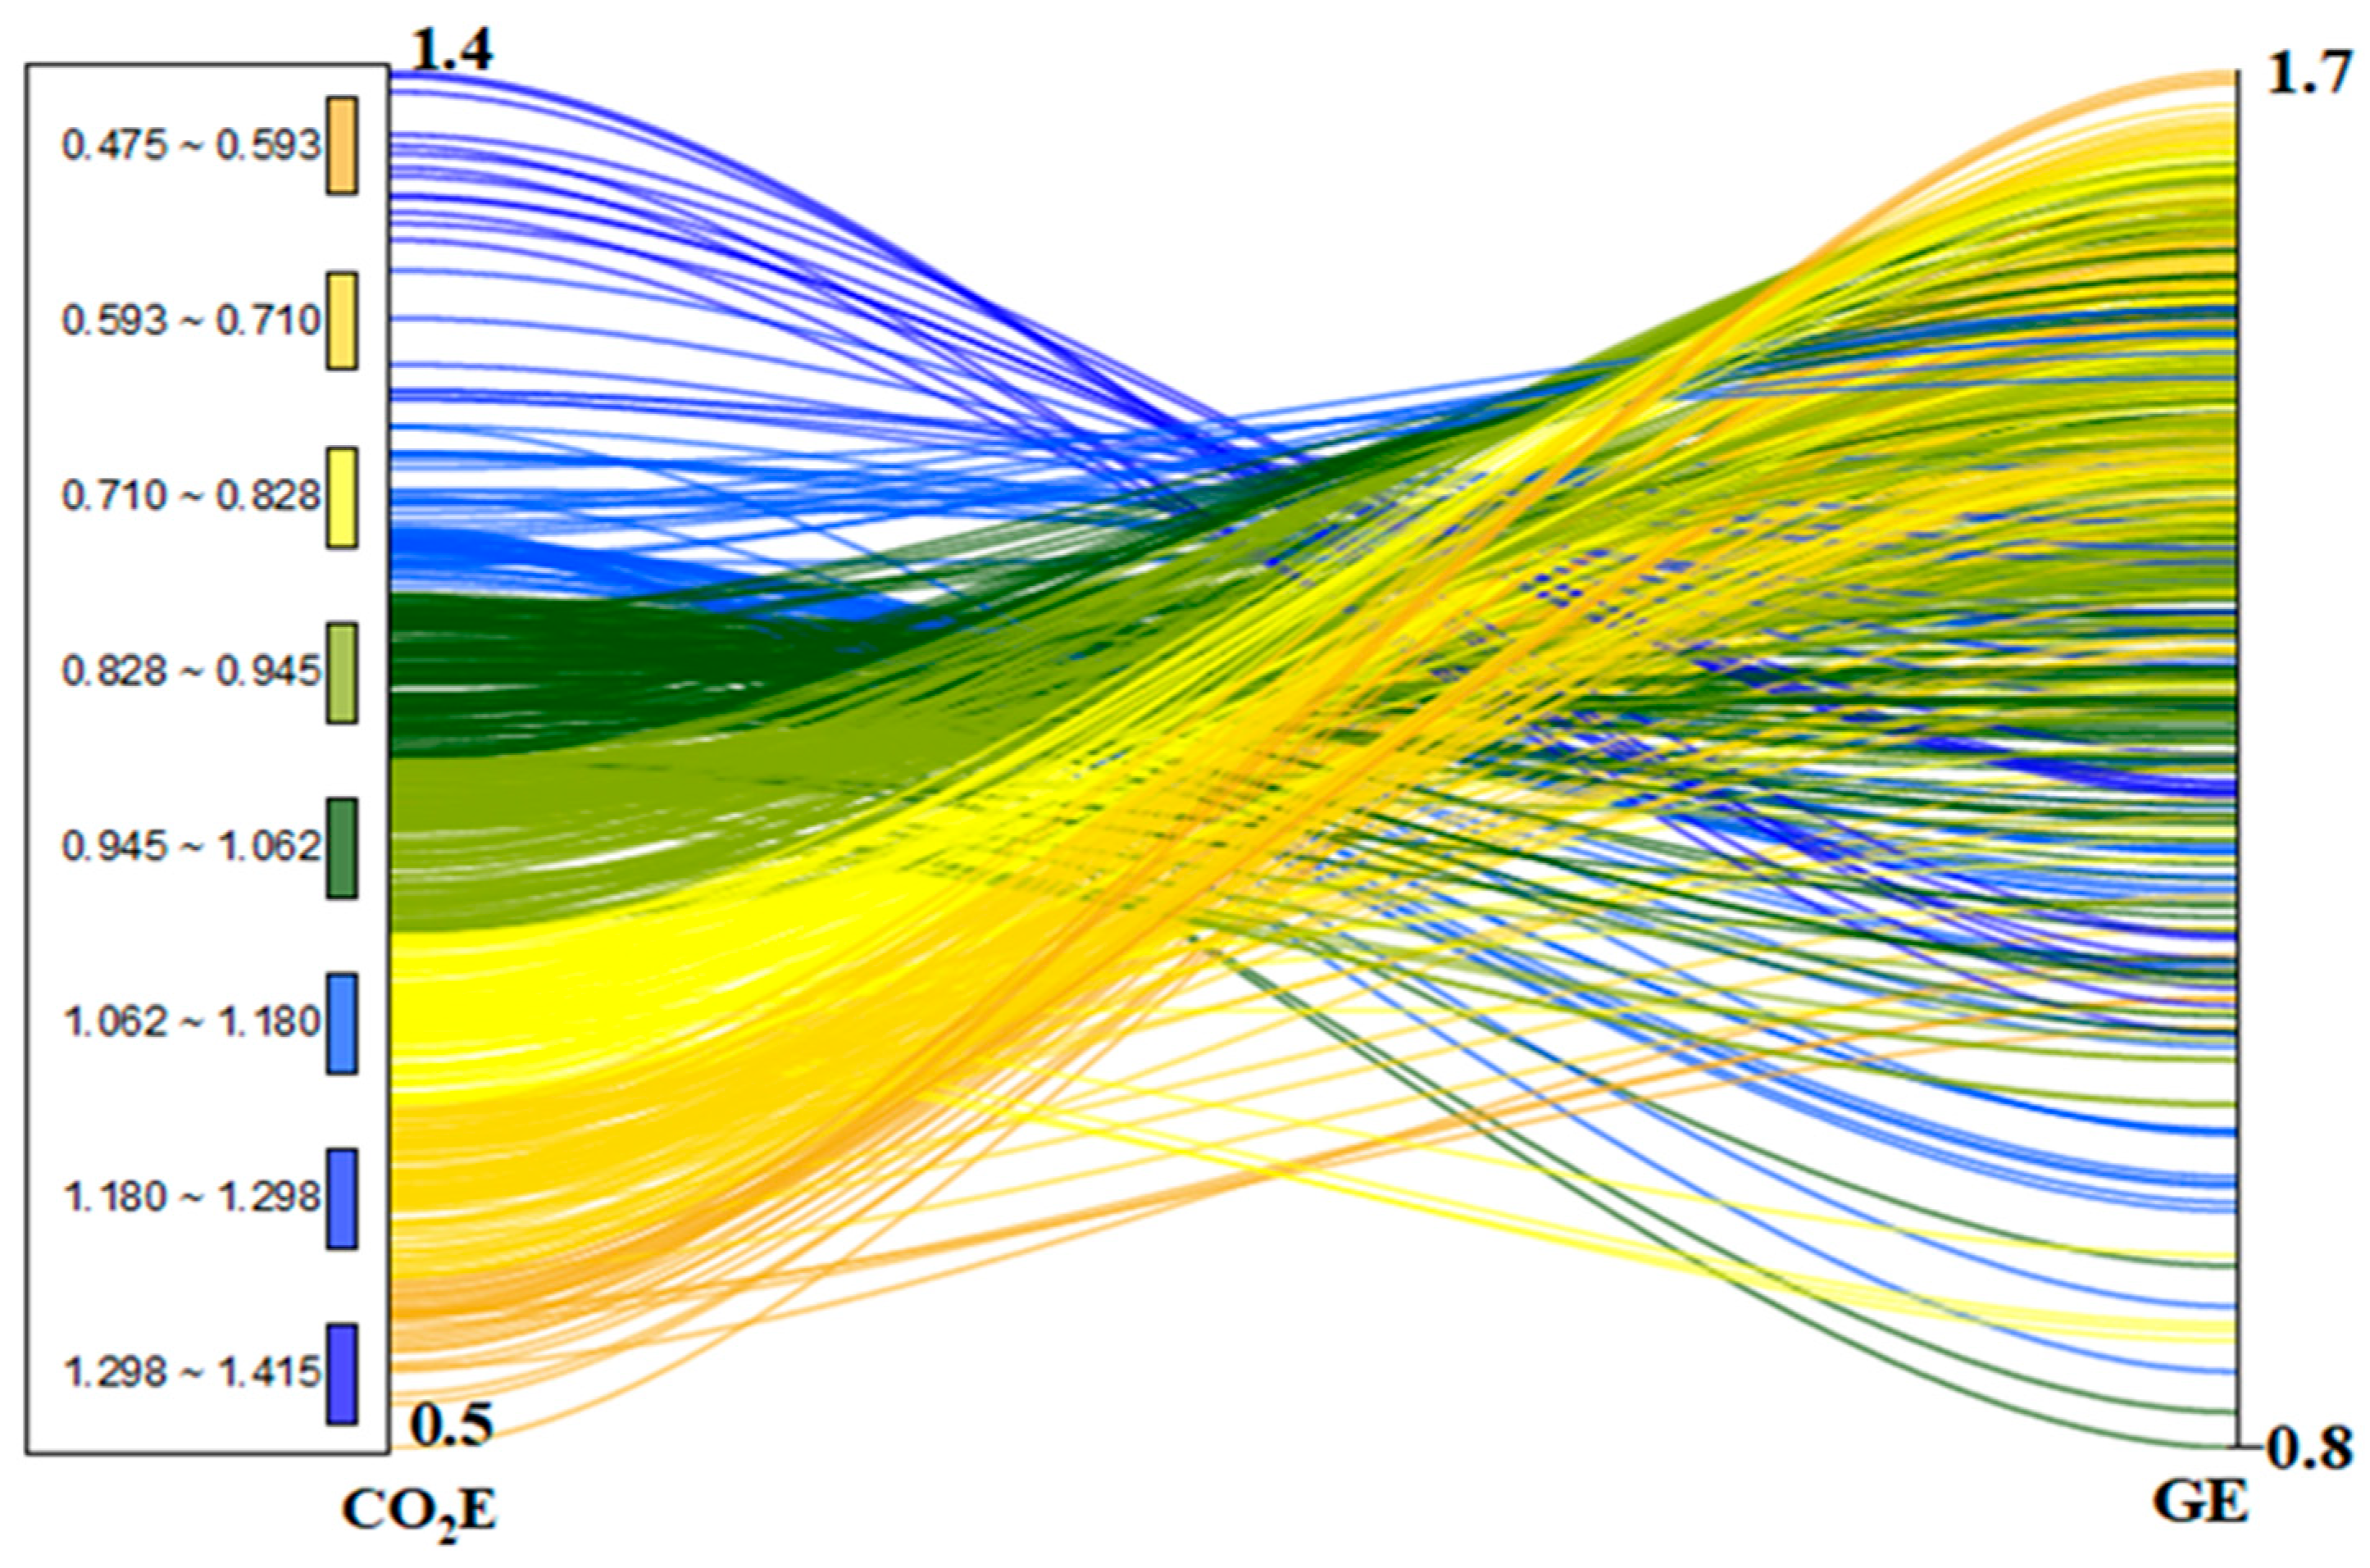
Figure 5 shows the distributional relationship between CO2E and GE. The flow patterns suggest that higher levels of green energy are generally associated with lower CO2E, indicating an inverse relationship between the two variables. However, the dispersion of trajectories reflects heterogeneity across countries, implying that the effectiveness of green energy in reducing emissions varies depending on structural and policy conditions. Overall, the figure visually supports the empirical findings that GE plays a key role in mitigating environmental degradation.
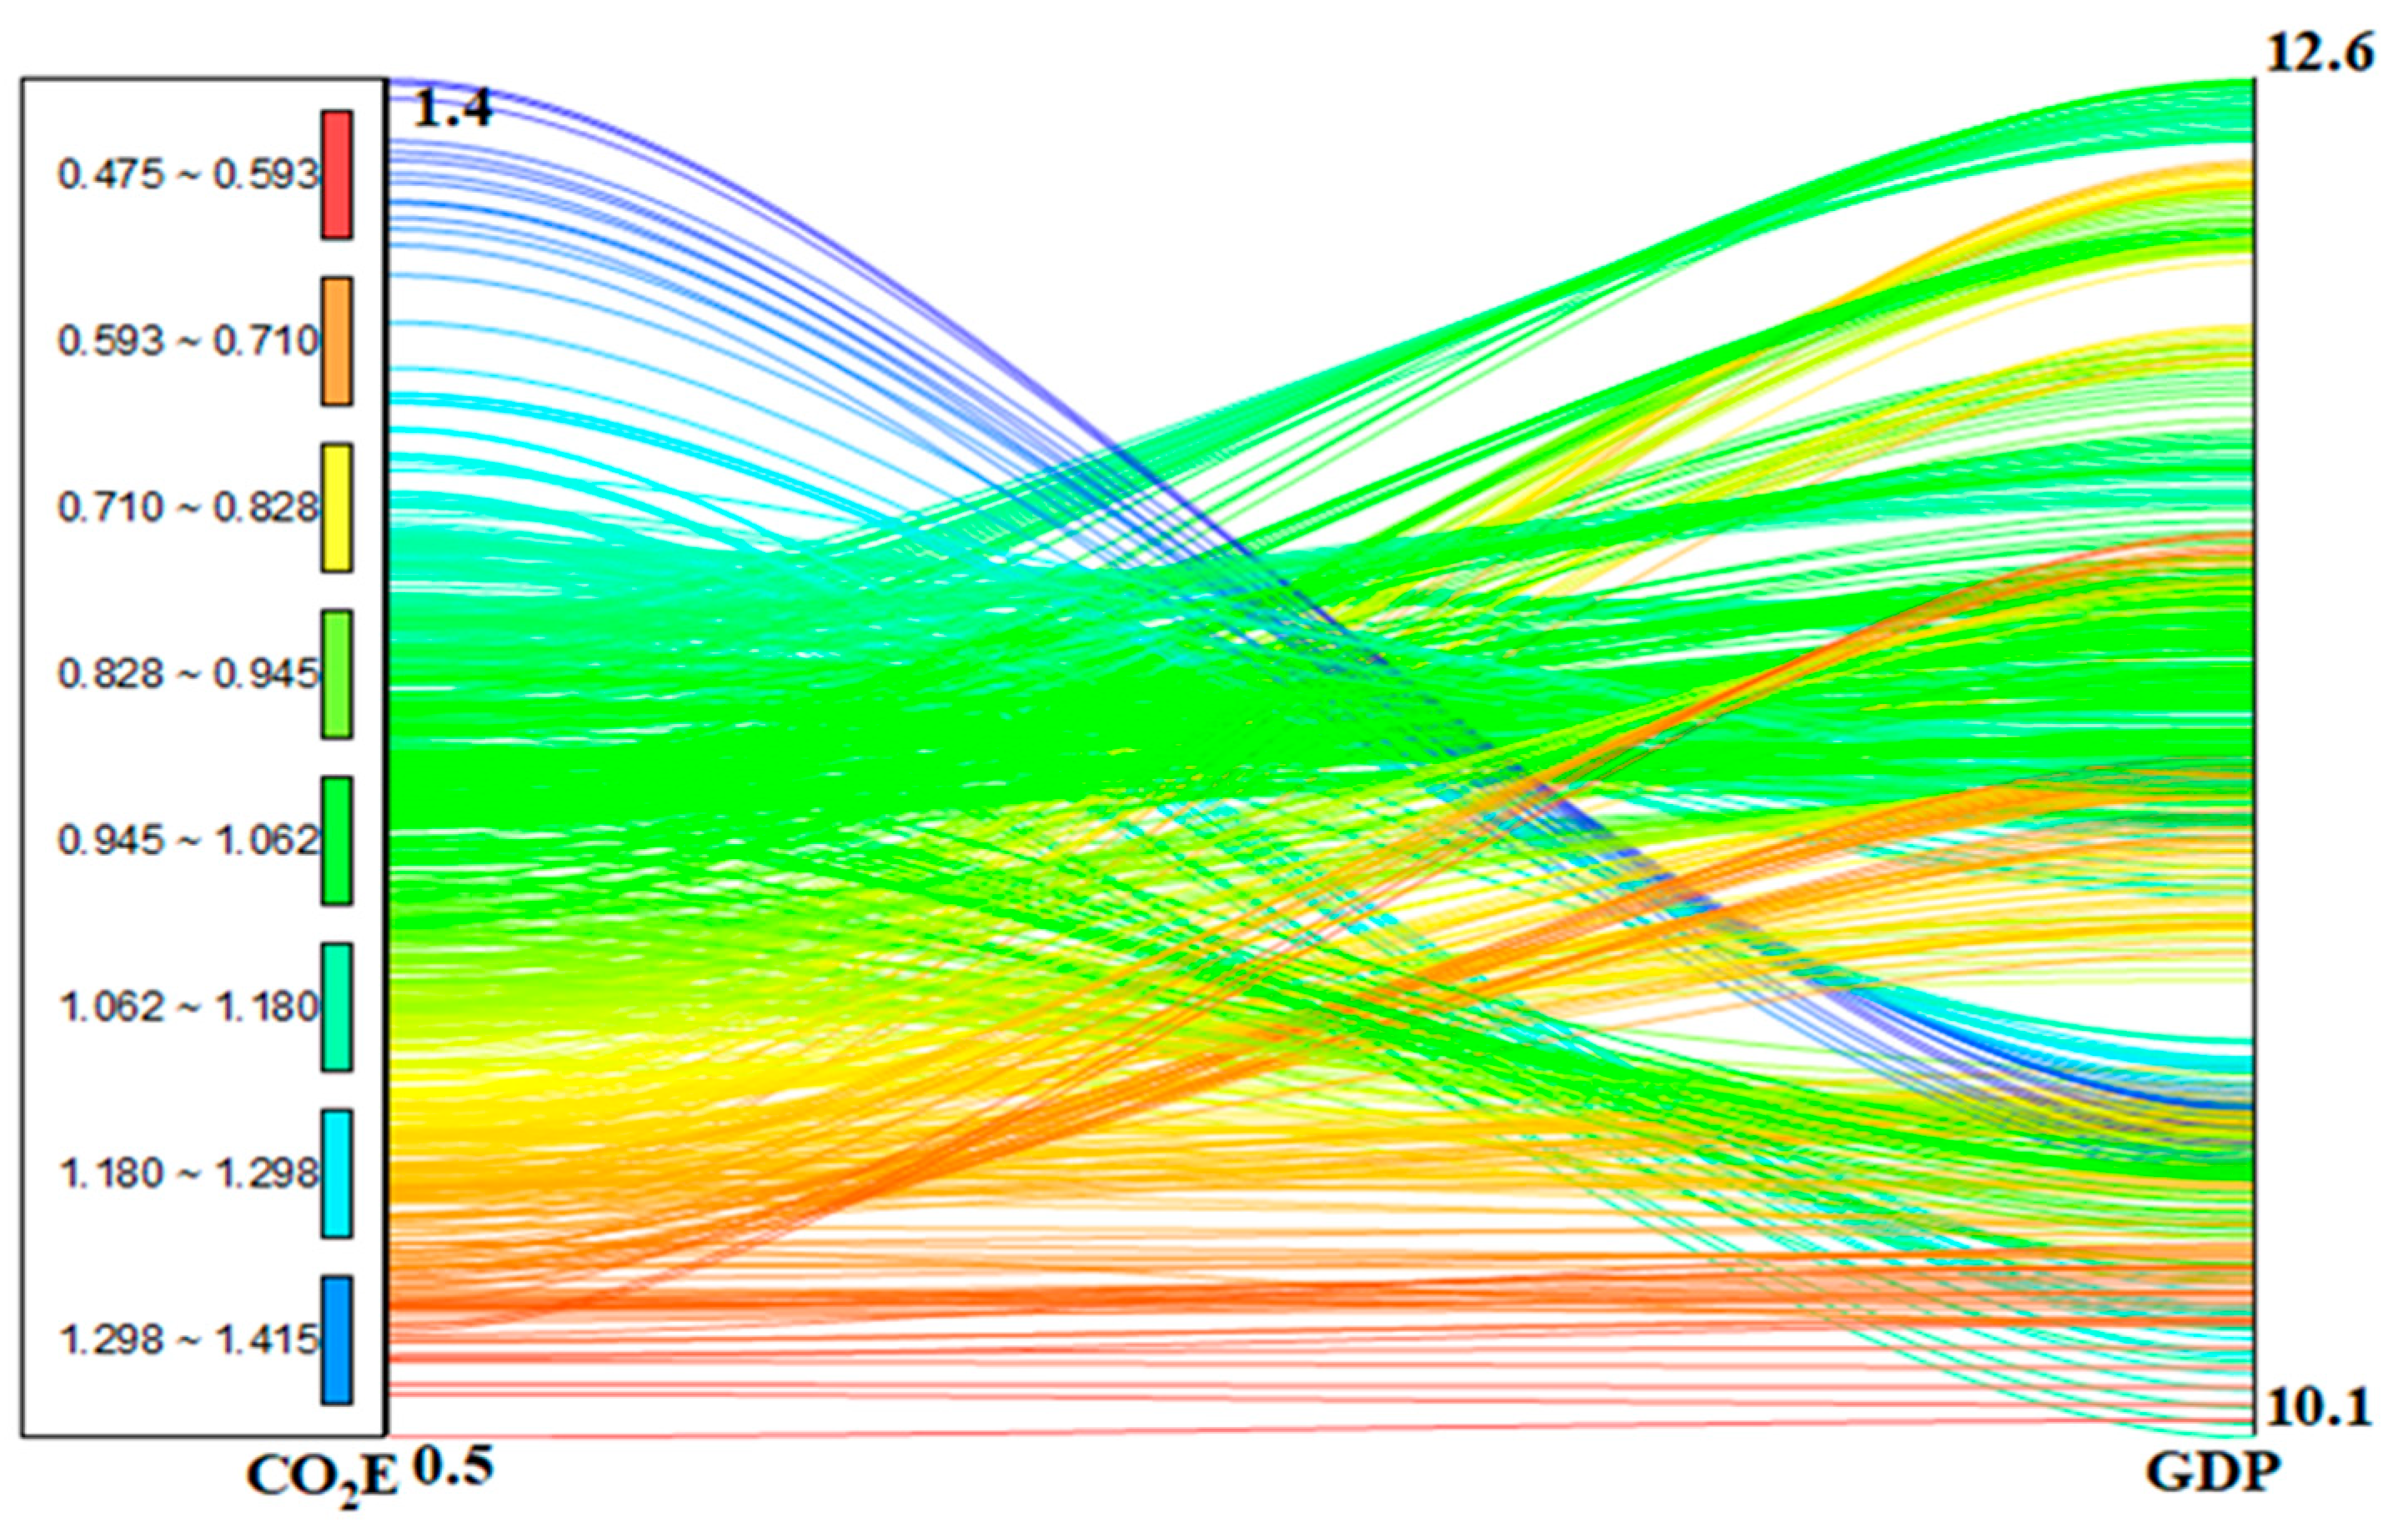
Figure 6 illustrates the distributional relationship between CO2E and GDP. The flow patterns indicate that higher levels of GDP are generally associated with higher CO2E, suggesting a positive relationship between economic expansion and environmental pressure. However, the dispersion of trajectories reveals notable heterogeneity across countries, indicating that the impact of economic growth on emissions varies depending on structural and policy conditions. Overall, the figure supports the empirical findings that economic growth remains a key driver of CO2E in the sample.
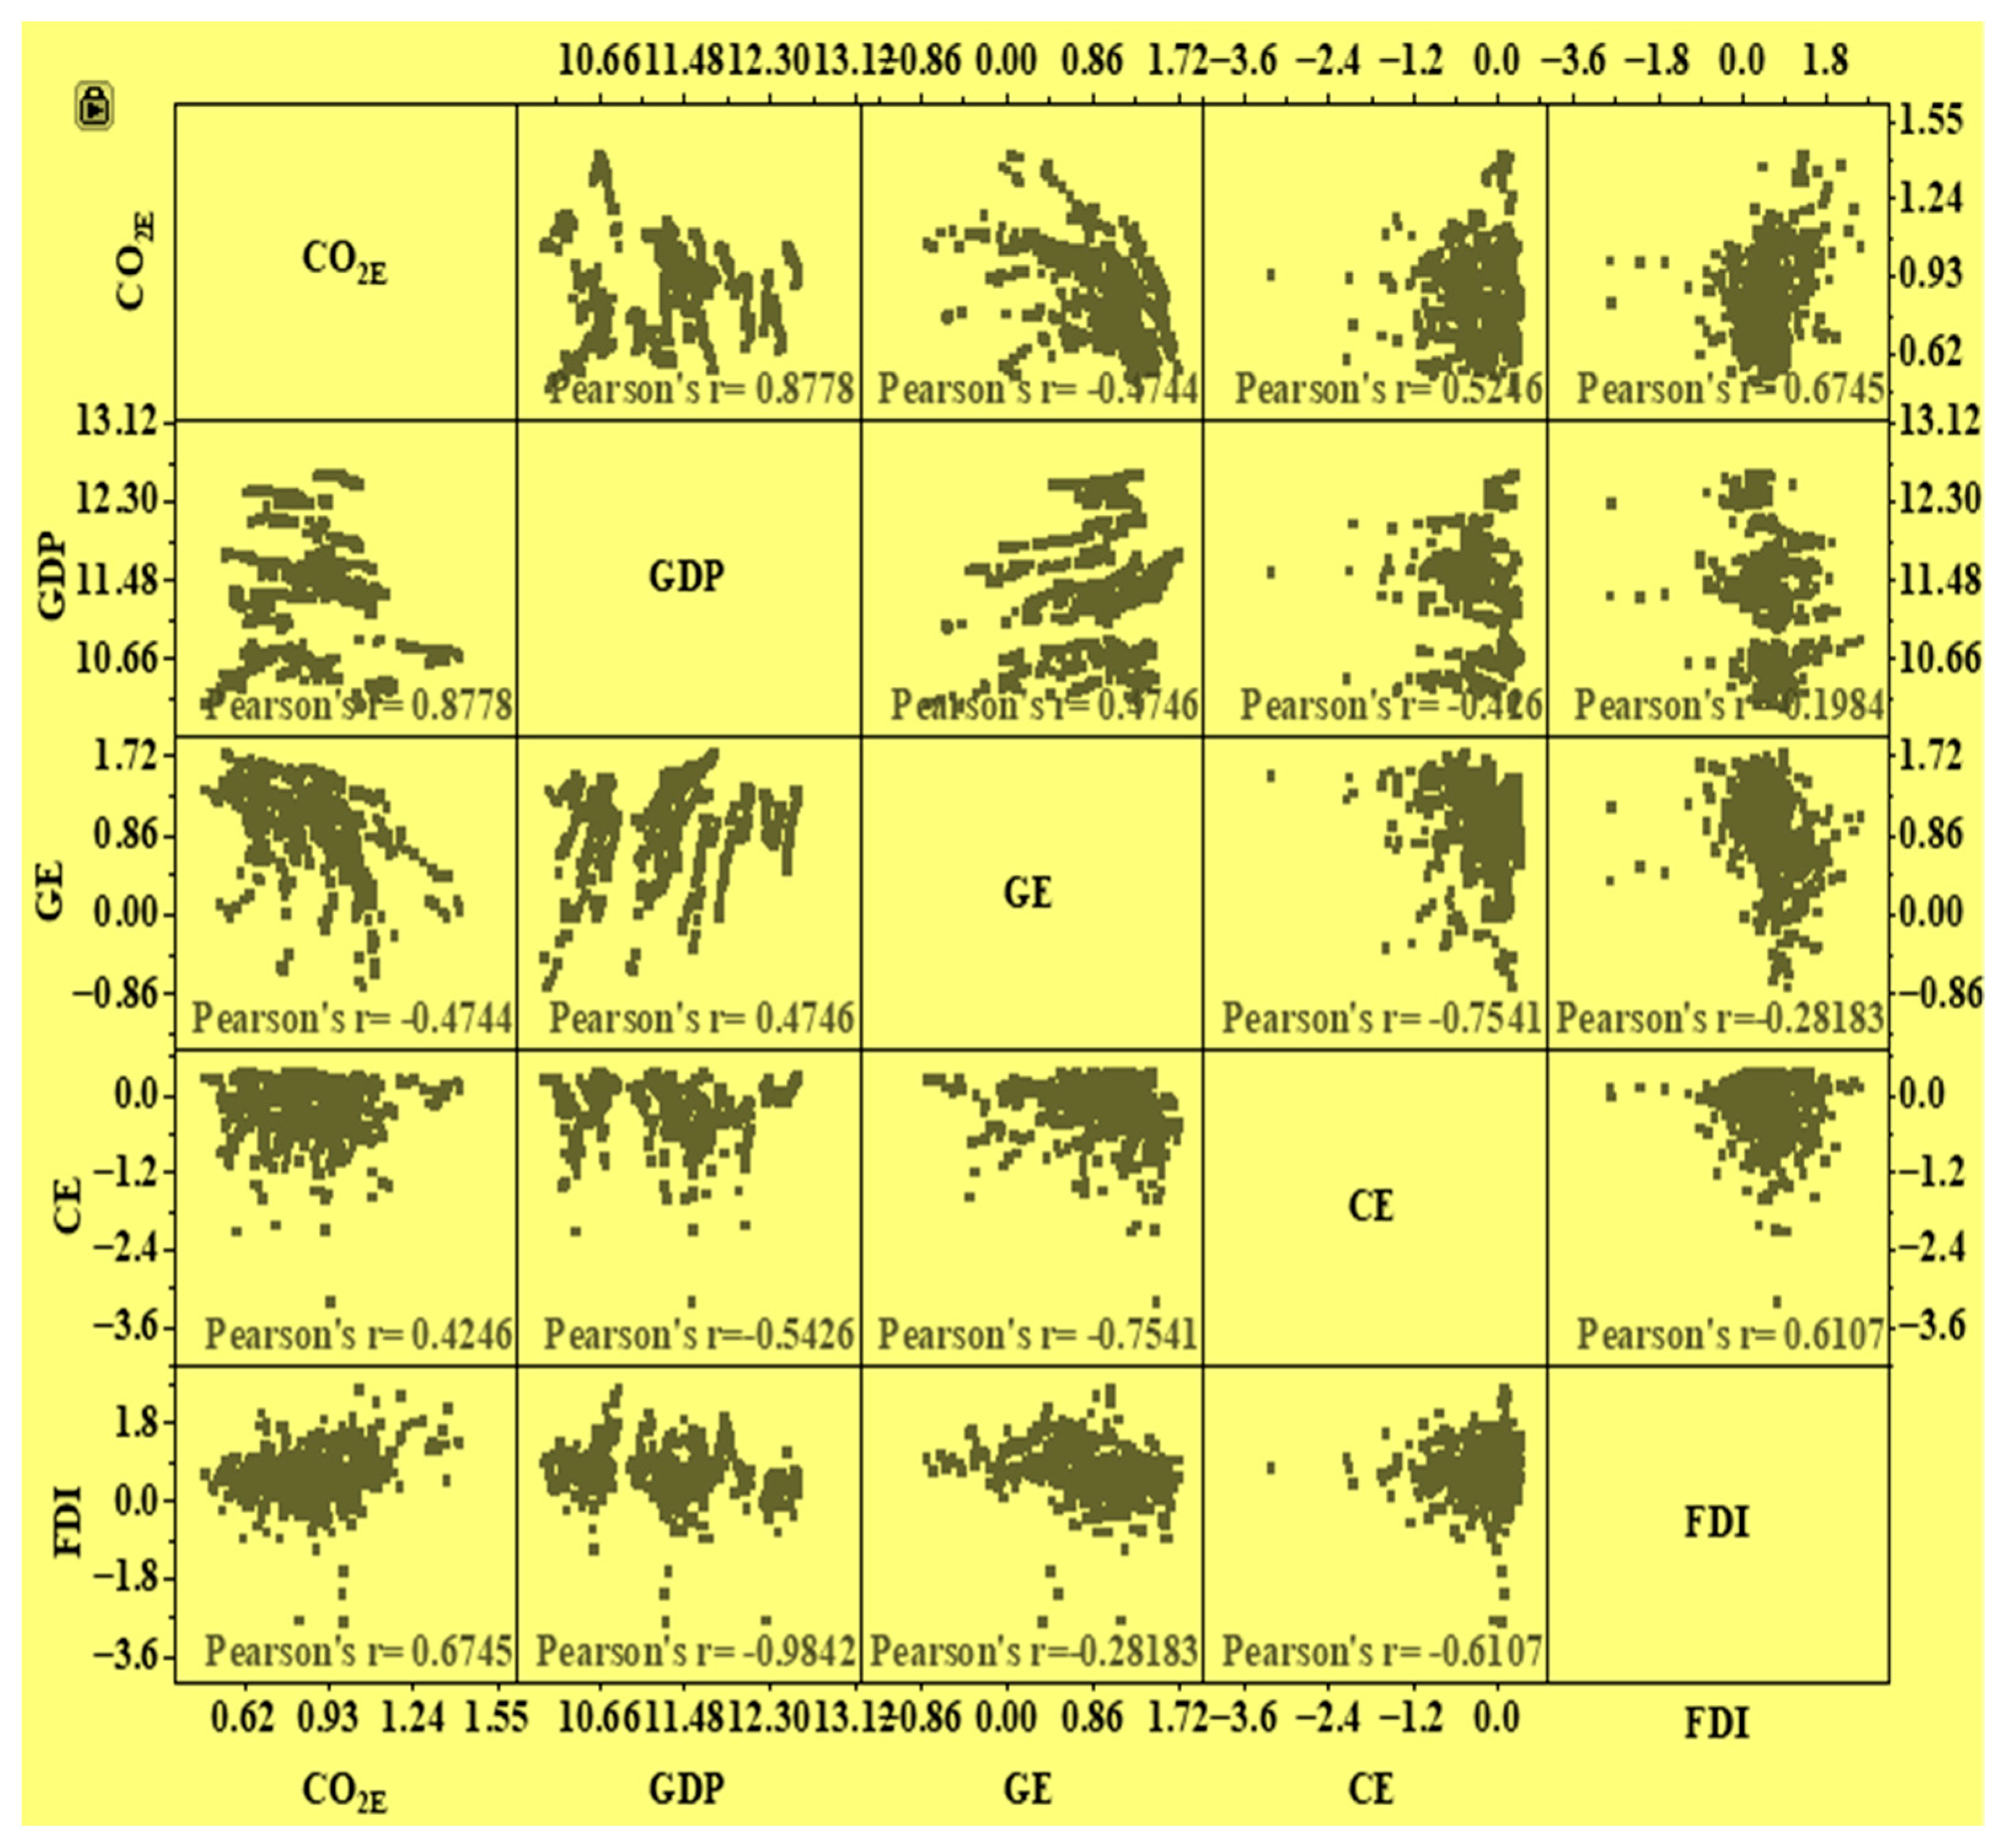
Figure 7 presents the correlation matrix of CO2E, GDP, GE, CE practices, and FDI. The outcomes express important patterns that provide preliminary insights into the relationship among the variables. A strong positive correlation is observed between CO2E and GDP (r = 0.8778), indicating that higher economic activity is associated with higher emissions. This suggests that economic growth in the sampled countries remains closely linked to energy-intensive production and consumption patterns. In contrast, CO2E exhibits a negative correlation with GE (r = −0.4744), implying that greater reliance on renewable energy sources is associated with lower emission levels. This finding provides initial support for the role of energy transition in mitigating environmental degradation.
CE practices show a moderate positive correlation with CO2E (r = 0.4246). This is a somewhat counterintuitive result that may reflect transitional dynamics, where countries with higher emissions are also those actively implementing CE strategies. It also suggests that the environmental benefits of CE may not be immediate and depend on the effectiveness of implementation. FDI is positively correlated with CO2E (r = 0.6745), indicating that more developed financial systems may initially be associated with higher emissions, potentially due to increased industrial activity and investment. However, this relationship may evolve as financial resources are increasingly directed toward sustainable investments.
Among the explanatory variables, a strong negative correlation is observed between CE and GE (r = 0.7541), suggesting that these sustainability strategies may operate through different channels or reflect varying policy priorities across countries. Additionally, the relatively low correlation between GDP and FDI (r = −0.0984) indicates the absence of strong multicollinearity between key explanatory variables. Overall, the correlation analysis provides useful preliminary evidence on the direction of the relationship while confirming that multicollinearity is not a serious concern. However, these pairwise associations do not capture causal or long-run dynamics, which are further examined using advanced panel econometric techniques in the subsequent analysis.
The results of cross-sectional dependency are mentioned in
Table 3. The findings indicate that all variables, CE practice, GE, GDP, and FDI, exhibit statistically significant CD-test statistics at the 1% level. Specifically, the CD test values for CE (189.56), GE (250.70), GDP (316.84), and FDI (308.15) confirm the presence of strong CD across the panel. These results suggest that the countries included in the sample are not independent of one another, but are instead influenced by common shocks, such as economic integration, shared environmental policies, and global market dynamics. The rejection of the null hypothesis of CD independence highlights the interconnected nature of the sample countries and indicates that ignoring CD may lead to biased and inconsistent estimation results.
The presence of CD has important implications for empirical analysis. It reflects the fact that European countries are highly interconnected through trade, financial markets, and coordinated environmental policies. As a result, shocks affecting one country, such as changes in energy prices, environmental regulations, or economic conditions, can spill over to others. From a methodological perspective, these findings justify the use of second-generation panel econometric techniques, such as AMG and DCCE, which are specifically designed to account for CD and unobserved common factors. Conventional estimation methods that assume CD independence would be inappropriate in this context and could produce misleading results.
Economically, the strong CD suggests that environmental and economic dynamics are not country-specific but are influenced by regional and global factors. This underscores the importance of coordinated policy approaches, particularly within the European context, where joint efforts in promoting CE practices, renewable energy adoption, and sustainable finance can have spillover effects across countries.
4.2. Slop Heterogeneity
The results for Pesaran and Yamagata slope heterogeneity are presented in
Table 4. The estimated Delta statistics are 2.612, which is statistically significant at the 5% level (
p = 0.009). Similarly, the adjusted Delta statistic is −3.016, which is significant at the 1% level (
p = 0.003). The statistical significance of both the Delta and adjusted Delta tests leads to the rejection of the null hypothesis of slope homogeneity. This indicates that the slope coefficient varies across countries, suggesting the presence of heterogeneity in the relationship among the variables.
The presence of slope heterogeneity has important implications for empirical analysis. It indicates that the impact of CE practices, GE, FDI, and GDP on CO2 is not uniform across countries. Instead, these relationships differ depending on country-specific characteristics such as economic structure, institutional quality, and policy framework. From a methodological perspective, this finding justifies the use of estimators that allow for heterogeneous slope coefficients, such as the AMGE and DCCE approaches. Conventional panel models that assume homogeneity would be inappropriate in this context and could lead to biased conclusions.
Economically, the heterogeneity suggests that policy interventions should not follow a one-size-fits-all approach. Different countries may require tailored strategies to effectively promote CE practices, renewable energy adoption, and sustainable financial systems. Therefore, acknowledging heterogeneity is essential for designing effective and context-specific environmental policies.
4.3. Unit Root
The panel unit root test results based on the CADF and CIPS tests are reported in
Table 5. At the level forms, all variables are found to be non-stationary, as their test statistics are statistically insignificant. After taking the first difference, all variables become statistically significant at the 1% level under both CADF and CIPS tests. The CADF statistics range from −3.926 to −5.745, while the CIPS statistics range from −5.152 to −6.180. These values strongly reject the null hypothesis of unit roots. Thus, all variables are integrated of order one, l (1), indicating that they achieve stationarity after first differencing.
The results indicate that CO2E, CE, GE, GDP, and FDI are non-stationary at levels but become stationary after first differencing. This behavior is typical for macroeconomic, environmental, and financial variables, where trends and structural changes often lead to non-stationarity in level data. The confirmation that all variables are I (1) has important econometric implications. It supports the use of panel cointegration techniques to examine the long-run equilibrium relationships among environmental quality, CE, GE, GDP, and FDI. Estimating correlation without accounting for non-stationarity could otherwise produce misleading or spurious outcomes.
Moreover, the consistency of findings across both CADF and CIPS tests enhances the reliability of the results, as these second-generation unit tests account for cross-sectional dependence. This is particularly relevant given the interconnected nature of economies, environmental policies, and financial systems across countries. Inclusion, these findings provide a strong basis for proceeding with further long-run and short-run dynamic analysis, such as panel cointegration and error correction modeling, to better understand the interactions among CE, FDI, and environmental sustainability.
4.4. Westerlund Cointegration
The results of the Westerlund cointegration test are expressed in
Table 6 using four statistics: Gt, Ga, Pt, and Pa. The findings reveal that the Gt and Pt statistics are statistically significant at the 1% level, with values of −19.213 and −42.885, respectively, and a corresponding
p-value of 0.000. These outcomes strongly reject the null hypothesis of no cointegration. In contrast, the Ga and Pa statistics are statistically insignificant, as indicated by their high
p-values (1.000), suggesting a failure to reject the null hypothesis under these specific measures. Lastly, despite the mixed outcomes, the significance of both Gt and Pt statistics provides sufficient evidence to confirm the existence of a long-run cointegration relationship among the variables.
The panel cointegration results provide important insights into the long-run relationships among the variables under study. The statistically significant Gt and Pt statistics indicate strong evidence of cointegration, implying that the variables move together over time and share a stable long-run equilibrium association. Although the Ga and Pa statistics are not significant, such mixed results are not uncommon in panel cointegration analysis. Different test statistics capture different dimensions of cointegration, and researchers often rely on the majority or the most robust statistics when concluding. In this case, the significance of both Gt and Pt, especially with a very low p-value, offers convincing support for cointegration.
The existence of cointegration suggests that variables such as CO2E, CE, GE, GDP, and FDI are interconnected in the long run. This implies that any short-term deviations from equilibrium are likely to be temporary and will adjust back over time. These findings justify the use of long-run estimation, such as AMGE or DCCE, as well as Granger causality models, to further explore long-run dynamics. Additionally, the presence of cointegration rules out the risk of spurious regression, thereby strengthening the reliability of subsequent.
4.5. Augmented Mean Group Estimator Results
Table 7 reports the long-run estimates obtained from the Augmented Mean Group (AMGE) estimator discussed above, which accounts for cross-sectional dependence and slope heterogeneity across countries.
The results from the AMGE estimator provide important insights into the economic relationship between CE practices and environmental sustainability across European countries. The coefficient of CE is negative and statistically significant (−0.013, p value 0.01), indicating that the improvements in CE practices contribute to reducing CO2E. In elasticity terms, a1% increase in CE is associated with a 0.013% reduction in emissions. Although the magnitude appears modest, this effect is economically meaningful at the macro level.
From an economic perspective, this result reflects improvements in material efficiency and reduced dependence on primary resource extraction. By promoting recycling, l reuse, and extended product life cycles, CE practices lower the demand for energy-intensive production processes, particularly in resource-intensive sectors such as manufacturing and construction. However, the relatively small magnitude of the coefficient suggests that the environmental benefits of CE may be partially offset by rebound effects and the energy requirements of recycling processes, which is consistent with the conditional circular economy literature [
6,
34,
35,
36,
37,
38].
The coefficient of GE is negative and statistically significant (−0.044,
p value 0.01), with a comparatively larger magnitude, indicating that green energy is a dominant driver of emissions reduction. Specifically, a 1% increase in renewable energy consumption leads to a 0.044% decrease in CO2E. Economically, this reflects a structural transformation in the energy system, where renewable energy sources directly substitute for fossil fuels in electricity generation and industrial processes. This substitution effect reduces carbon intensity across both production and consumption activities, consistent with the energy transition literature [
39,
40,
41,
42,
43].
In contrast, the coefficient of GDP is positive and highly significant (0.163,
p value 0.01), indicating that economic growth continues to increase CO2E. This result reflects the dominance of the scale effect, where increased economic activity leads to higher energy demand, industrial output, and resource consumption. Despite advancements in environmental regulation and clean technologies, economic expansion in EU countries remains partially dependent on fossil fuel-based production systems. This finding aligns with the environmental Kuznets curve and related empirical studies highlighting incomplete decoupling between growth and environmental quality [
26,
44,
45,
46].
The coefficient of FDI is negative and statistically significant (−0.018,
p value 0.01), suggesting that financial development contributes to reducing emissions. From an economic standpoint, this indicates that more developed financial systems improve capital allocation efficiency, enabling greater investment in cleaner technologies, renewable energy projects, and sustainable infrastructure. Financial development also facilitates innovation and technological upgrading, which can enhance environmental performance. However, since the index captures overall financial development rather than explicitly green finance, the environmental benefits depend on whether financial resources are directed toward sustainable or carbon-intensive activities. This interpretation is consistent with the finance environment nexus literature [
47,
48,
49,
50,
51,
52].
4.6. Robustness
To ensure the reliability and stability of the baseline outcomes obtained from the AMGE estimator, this study employs the DCCE estimator as a robustness check. The DCCE approach, proposed by Pesaran (2006), is widely applied in panel econometrics to address cross-sectional dependence arising from unobserved common factors that may simultaneously affect all cross-sectional units. In the context of European countries, such dependence is particularly relevant due to economic integration, financial linkages, and coordinated environmental policies. By incorporating cross-sectional averages of both dependent and independent variables, the DCCE estimator effectively controls for latent common shocks and prevents biased or inconsistent parameter estimates.
The results presented in
Table 8 confirm the robustness of the main findings. The coefficient of the CE remains negative and statistically significant (−0.078,
p < 0.01), indicating that enhanced CE practices, such as improved recycling, resource efficiency, and waste minimization, consistently contribute to reducing CO2E. This finding supports the baseline AMGE results and reinforces the argument that CE strategies play a meaningful role in mitigating environmental degradation [
5,
6,
22,
53].
Similarly, GE retains a negative relationship with CO2E, although its statistical significance is comparatively weaker under the DCCE specification (−0.016,
p < 0.05). This difference in magnitude relative to the AMGE estimates may reflect the ability of the DCCE model to absorb common factors, such as EU-wide climate policies and global energy transitions, which partially capture the effect of renewable energy. Nevertheless, the negative coefficient confirms that increased adoption of renewable energy sources contributes to emission reduction. These findings are consistent with existing literature emphasizing the importance of clean energy investment and policy support, including feed-in tariffs and renewable energy incentives, in achieving environmental sustainability [
54,
55,
56,
57].
The coefficient of GDP remains positive and statistically significant (0.024,
p < 0.01), indicating that economic growth continues to increase CO2E. This result is consistent across both AMGE and DCCE estimators and reflects the continued reliance on energy-intensive production and consumption patterns in the sampled countries. The findings suggest that economic expansion, in its current forms, remains associated with higher environmental pressure, emphasizing the need for cleaner technologies and more sustainable production systems [
58,
59,
60]. Furthermore, the financial development index (FDI) maintains a negative and statistically significant coefficient (−0.057,
p < 0.01), indicating that FDI contributes to reducing emissions. This outcome suggests that a more developed financial system facilitates investment in green technologies, enhances resource allocation efficiency, and supports sustainable economic activities. The role of financial development in promoting environmental sustainability is well documented in the literature, particularly through mechanisms such as green bonds, sustainability-linked loans, and environmentally responsible investment frameworks [
61,
62,
63].
The DCCE results are broadly consistent with the AMGE estimates in terms of coefficient signs and overall interpretation, confirming the robustness of the main findings. In both estimators, CE practices, GE, and FDI are associated with lower CO2E, whereas GDP exerts upward pressure on emissions. However, differences in coefficient magnitudes are observed between AME and DCCE. These variations are not unexpected, as the two estimators differ in how they account for cross-sectional dependence, slope heterogeneity, and unobserved common factors. More specifically, the DCCE estimator explicitly incorporates cross-sectional averages of the dependent and explanatory variables, allowing it to absorb unobserved common shocks that may affect all countries simultaneously. As a result, DCCE may generate larger or smaller coefficient estimates relative to AMGE, depending on the extent to which common factors influence the relationship under investigation. Therefore, the difference in magnitudes should not be interpreted as contradictory evidence, but rather as a reflection of estimator sensitivity to model structure and cross-sectional dynamics. Importantly, the consistency in the direction of the estimated relationship across AMGE and DCCE supports the stability of empirical conclusions. This indicates that the emissions-reducing role of the CE practices, GE, and FDI remains robust to alternative second-generation panel specifications.
4.7. Dumitrescu Hurlin Granger Causality
The Dumitrescu-Hurlin panel causality test is employed to investigate the direction of the relationships among CE practices, GE, FDI, GDP, and CO2E. The theoretical motivation for this test arises from the possibility of bidirectional linkages. On the one hand, CE practices may reduce emissions through improved resource efficiency, recycling, and waste minimization. On the other hand, countries with lower emissions and strong environmental performance may be more likely to adopt CE policies. Similar bi-directional mechanisms may also exist between emissions and GE, FDI, and GDP. Therefore, causality analysis is necessary to distinguish between proactive drivers and reactive responses within the panel framework. The results of the pairwise Dumitrescu-Hurlin Panel Causality approach are exhibited in
Table 9.
Based on the results of the Dumitrescu-Hurlin panel causality test, several significant causal relationships are identified among the variables, providing important insights for policymakers. The results show a unidirectional causality from CE practices to CO2E at the 1% level of significance (
p < 0.003). This indicates that the improvements in CE practices act as a driving force in reducing emissions, rather than being merely a response to environmental changes. This result is consistent with prior studies that highlighted the role of CE strategies in mitigating environmental degradation [
34,
64].
Similarly, FDI exhibits a causal effect on CO2E (
p = 0.059), while the reverse relationship remains statistically insignificant. This suggests that financial systems play a proactive role in shaping the environmental outcomes, likely through facilitating investments in sustainable and green technologies. This finding aligns with existing literature emphasizing the importance of financial mechanisms in promoting environmental sustainability [
65,
66].
Additionally, a significant causal relationship is observed from GDP to CO2E (
p < 0.000), indicating that economic expansion contributes to increased environmental pressure [
52,
67]. In addition, a bidirectional causal relationship is identified between CE (
p = 0.000) and FDI (
p = 0.005), indicating a reinforcing dynamic in which financial development supports the adoption of CE practices, while CE initiatives may simultaneously stimulate financial system development.
Furthermore, GDP Granger causes CE (
p = 0.011), indicating that higher levels of economic growth encourage the adoption of circular economy engagement. This finding is consistent with previous empirical evidence [
68,
69]. Regarding energy transition-related dynamics, the results suggest that GDP has a significant causal influence on GE (
p < 0.000), underscoring the role of economic performance in driving renewable energy adoption. However, no significant causality is found between GE and CO2E, implying that although the expansion of green energy is key, its short-run impact on carbon emissions may be limited. This result is consistent with existing literature on the gradual effects of energy transition on environmental outcomes [
26].
6. Limitations and Future Directions
Despite its significant contributions, this study is subject to several limitations that open avenues for future research. First, due to the lack of consistent high-frequency data, the annual data were converted into a quarterly frequency using an interpolation approach. While this approach increases the number of observations and improves estimation efficiency, it may not fully capture the actual intra-year variations and could introduce measurement bias. Future studies should therefore prioritize the use of original high-frequency datasets to enhance precision.
Second, the analysis is based on a limited set of macro-level variables, including CE practices, GE, FDI, and GDP. Although these variables capture key dimensions of environmental sustainability, additional factors, such as environmental policy stringency, technological innovation, institutional quality, and environmental taxation, may further enrich the analysis and reduce potential omitted variables bias.
Third, while this study employs robust second-generation panel techniques (AMG and DCCE), these methods rely on specific assumptions regarding cross-sectional dependence and unobserved common factors. Future research extends the analysis by applying alternative econometric approaches, such as spatial econometric models to capture cross-country spillover effects, or nonlinear frameworks (e.g., QARDL or threshold models), to identify asymmetric relationships. Additionally, causal inference techniques could provide deeper insights into the direction and magnitude of policy impact. Fourth, the study adopts a macro-level perspective, which may mask important sectoral differences. Future research could conduct sector-specific analyses (e.g., manufacturing, energy, or waste management) to better understand how CE practices influence emissions across different industries and to support more targeted policy design. Finally, the geographical focus on European countries may limit the generalizability of the findings. Expanding the analysis to include other regions, such as OECD, BRICS, or developing economies, would provide a broader comparative perspective and help identify how institutional and economic differences shape environmental outcomes. Overall, future research should be more data-intensive, methodologically diverse, and policy-oriented to better capture the complex dynamic between CE practices and environmental sustainability.