1. Introduction
In recent decades, increases in outdoor air temperature associated with the urban heat island (UHI) phenomenon and global warming (GW) have become a major challenge for sustainable urban development. In Japan, the national mean air temperature has risen by approximately 1 K over the past century, primarily due to global warming [
1]. In large metropolitan areas, the combined effects of UHI and GW have further intensified urban thermal environments, increasing daily maximum temperatures in summer by approximately 1–2 K and minimum temperatures in winter by approximately 3–6 K [
2]. These changes are expected to continue, highlighting the need for effective and evidence-based UHI mitigation strategies.
Rising urban temperatures affect cities through multiple pathways, including energy demand, human health, thermal comfort, and environmental quality. Previous studies by the authors have quantified the relationships between outdoor air temperature and urban impacts, particularly energy consumption and health outcomes. These studies showed that higher temperatures generally increase cooling demand and heat-related health risks, while reducing heating and domestic hot water demand and some cold-related health risks. Therefore, the effects of UHI mitigation measures cannot be evaluated solely by their summer cooling benefits. A comprehensive assessment must also consider seasonal trade-offs, including potential wintertime penalties.
Various UHI mitigation measures have been proposed at building, district, and urban scales, including high-albedo materials, urban greening, water-based cooling, and land-use planning. Among them, rooftop-based measures such as highly reflective roofs (HR), green roofs (GR), and rooftop water sprinkling (WR) are practical options because large roof areas are available in dense urban areas and these measures can be implemented without major changes to urban land-use. However, most previous studies have evaluated their effectiveness using physical indicators, such as reductions in air temperature, surface temperature, or cooling load, mainly during summer. Although the effects of temperature changes on energy consumption, health risks, and air quality have been examined separately [
3,
4,
5,
6,
7], relatively few studies have integrated these impacts over an annual period and translated them into economic indicators.
This gap is particularly important for sustainability assessment. UHI mitigation measures may provide environmental and health benefits in summer, but they may also increase winter heating demand or entail implementation and maintenance costs. As a result, a measure that is effective in reducing summer air temperature is not necessarily the most beneficial from an annual, multi-sectoral, or economic perspective. To support sustainable urban climate policy, it is therefore necessary to evaluate UHI mitigation measures using an integrated framework that links meteorological effects with energy, health, and economic outcomes.
In this study, we develop and apply an integrated assessment framework to evaluate the impacts of rooftop UHI mitigation measures in Osaka Prefecture, Japan. Three measures are considered: HR, GR, and WR. First, the temperature changes induced by each measure are estimated using the Weather Research and Forecasting (WRF) model. These temperature changes are then linked to changes in energy consumption in the residential, office, and commercial sectors, as well as to health impacts quantified using disability-adjusted life years (DALYs). Finally, these impacts are monetized and evaluated through cost–benefit analysis.
The novelty of this study lies in its annual and integrated evaluation of rooftop UHI mitigation measures by explicitly considering temporal characteristics, seasonal trade-offs, sectoral differences in energy response, and multiple health outcomes within a common economic framework. By comparing HR, GR, and WR under the same analytical conditions, this study clarifies how different rooftop strategies vary in terms of environmental, health, and economic performance. The findings provide evidence for targeted and sustainable implementation of UHI mitigation measures in high-density urban regions.
2. Methodology
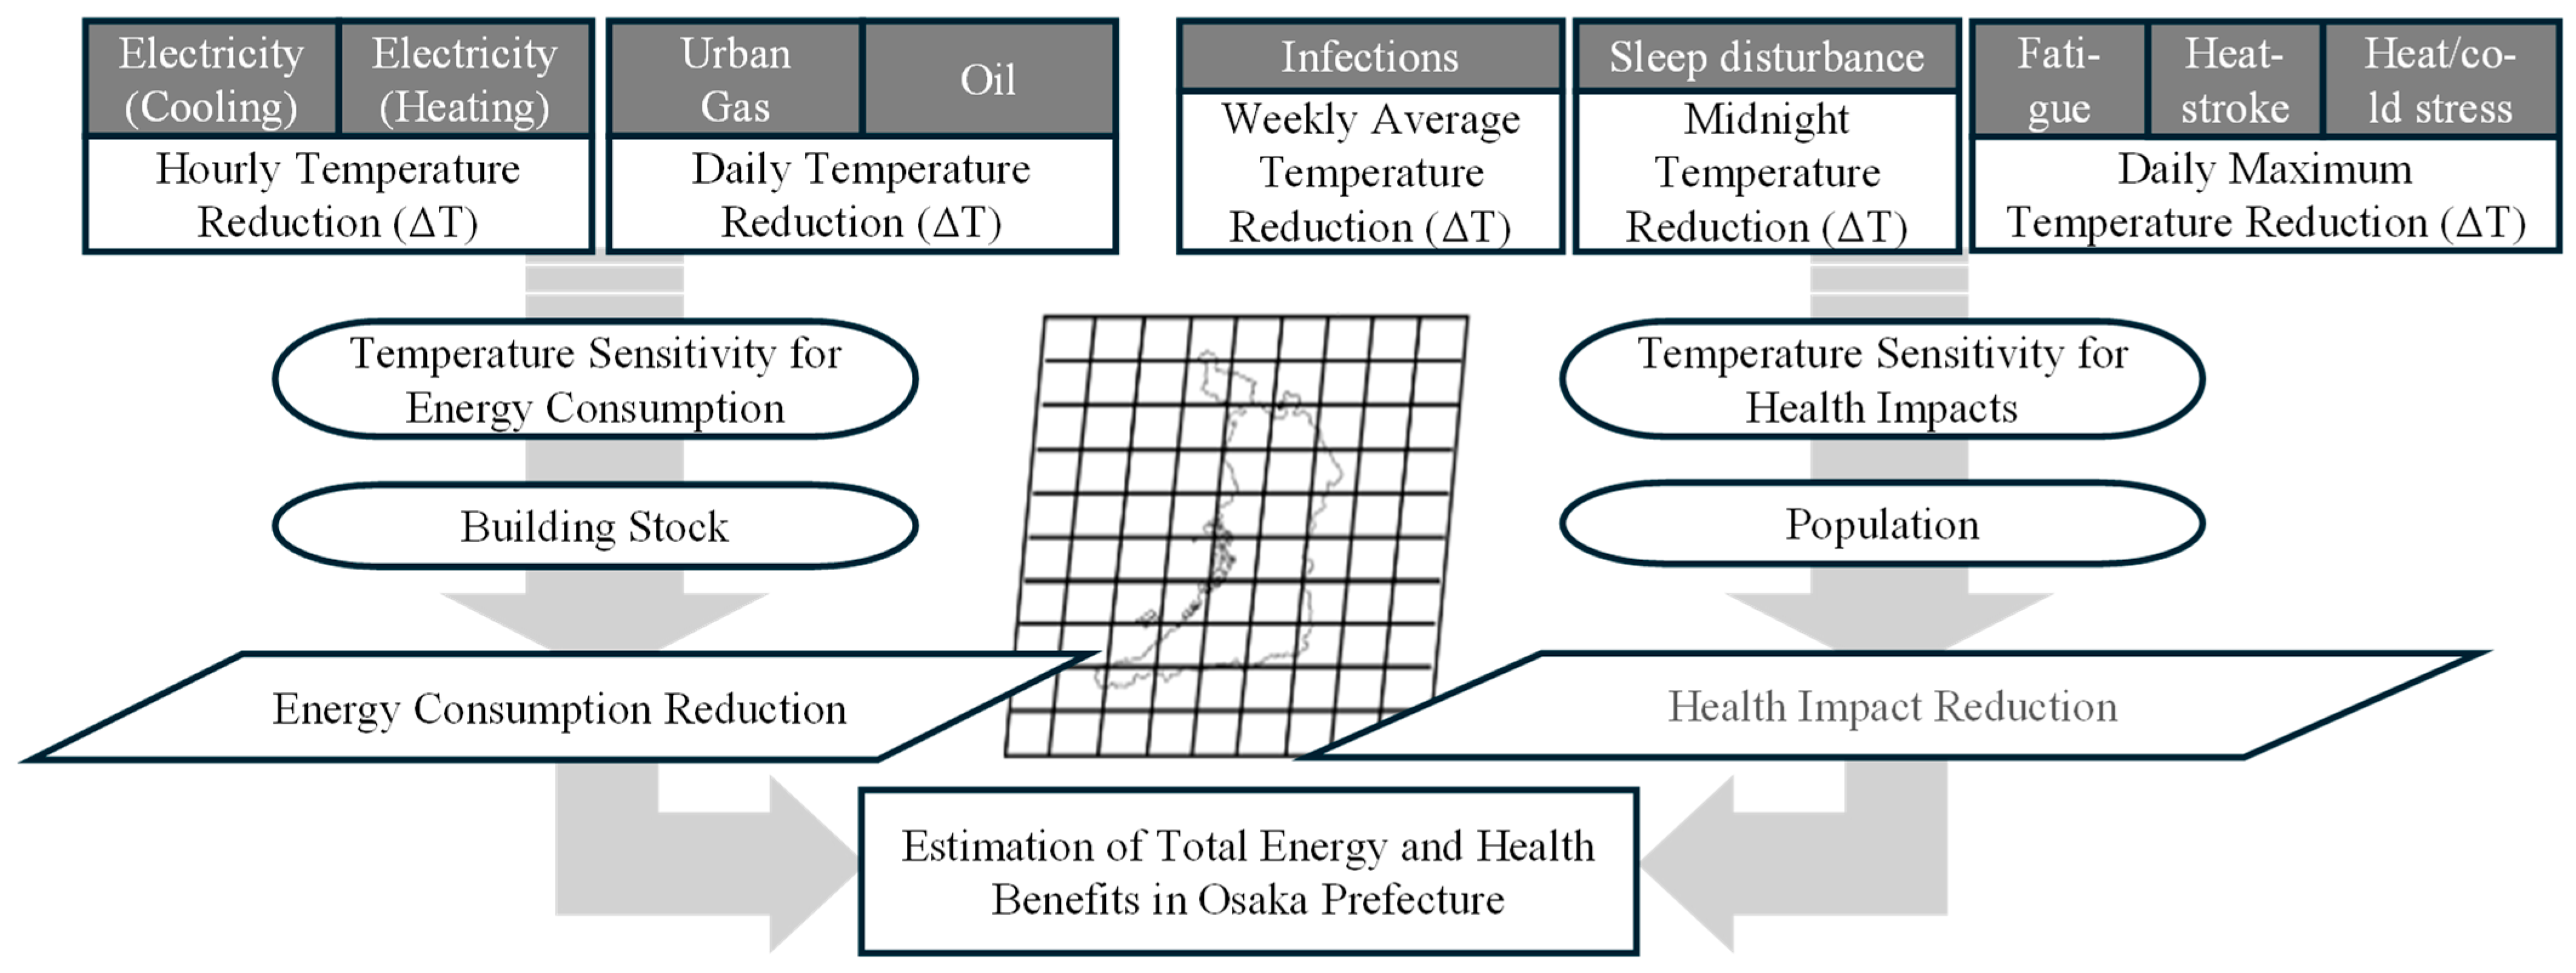
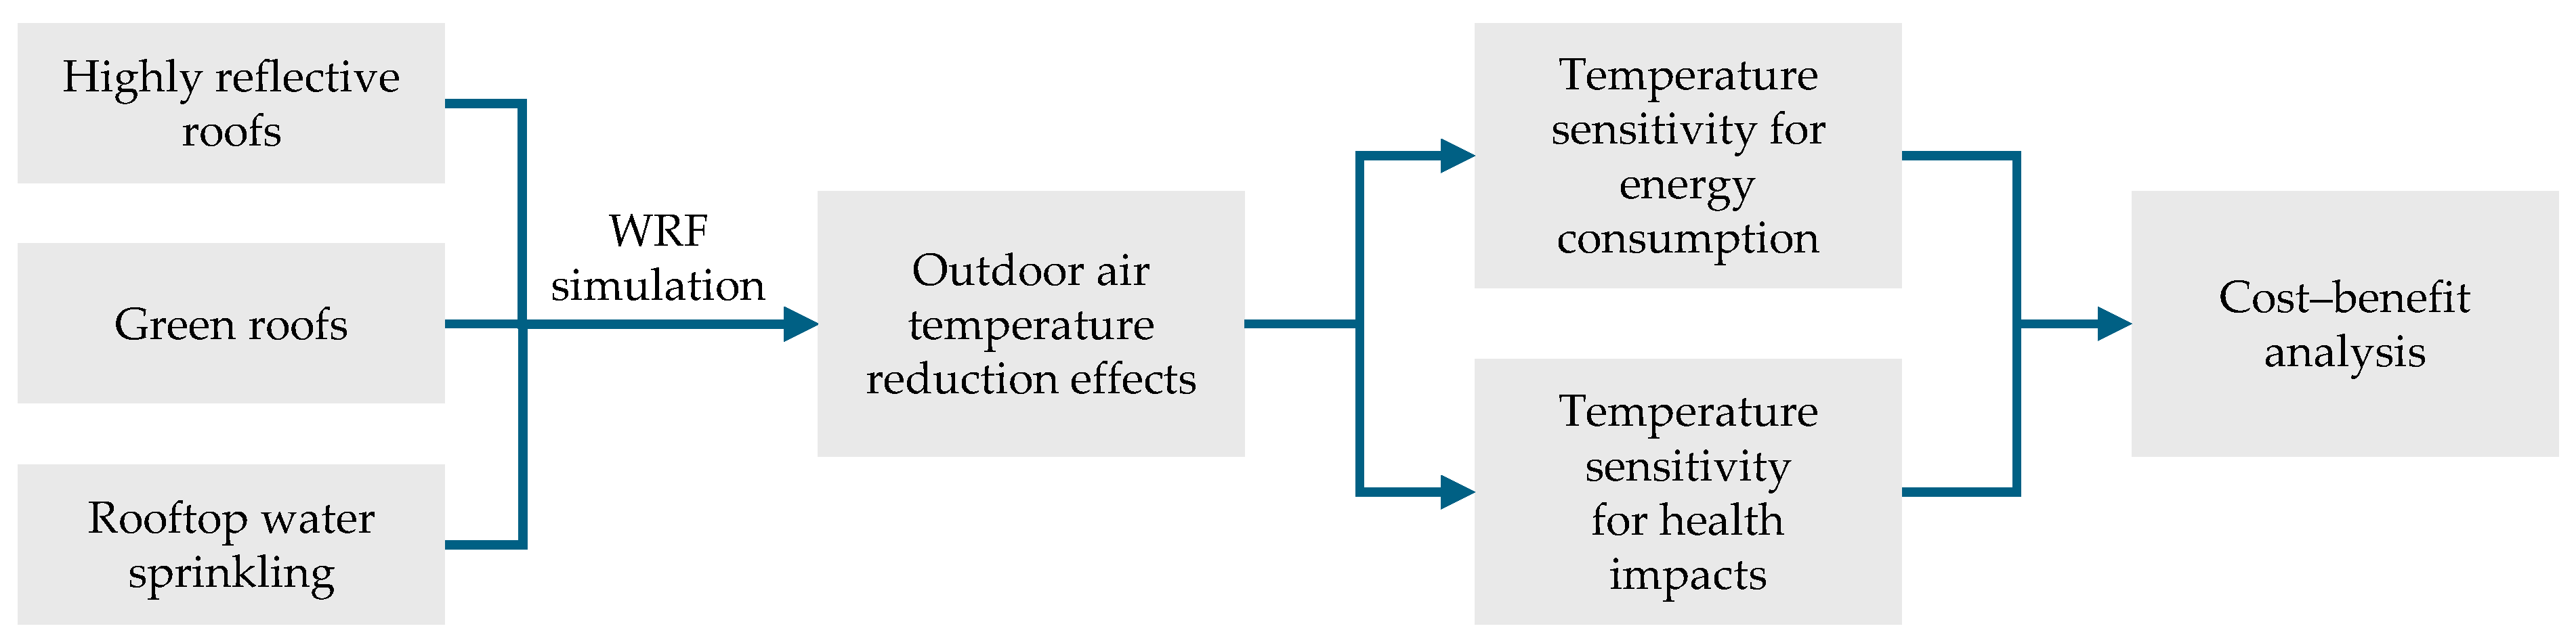
Figure 1 illustrates the analytical framework used for the cost–benefit analysis in this study. The framework consists of three main steps. First, changes in outdoor air temperature caused by rooftop UHI mitigation measures are estimated using a mesoscale meteorological model. Second, these temperature changes are linked to energy consumption and health impacts using temperature sensitivity coefficients. Third, the resulting changes in energy consumption and health impacts are monetized and compared with implementation costs to calculate the benefit–cost ratio (B/C).
This study focuses on three rooftop mitigation measures: highly reflective roofs (HR), green roofs (GR), and rooftop water sprinkling (WR). Their effects are evaluated for Osaka Prefecture, Japan, on an annual basis in order to capture both summer cooling benefits and potential wintertime penalties. Energy impacts are estimated for the residential, office, and commercial sectors based on the method proposed by Kiyokawa et al. [
8]. Health impacts are evaluated using the temperature sensitivity method developed by Terui et al. [
9]. The following sections describe the key assumptions and methodological choices used in each step.
2.1. Estimation of the Impact of Rooftop UHI Mitigation Measures on Outdoor Air Temperature
The outdoor air temperature changes induced by HR, GR, and WR were estimated using the Weather Research and Forecasting model, Advanced Research WRF version 4.3.3 [
10]. To ensure direct comparability with our previous analysis of highly reflective roofs [
9], the same WRF configuration was used, including the physical parameterization schemes, domain settings, simulation period, and spin-up procedure. Briefly, the Single-Layer Urban Canopy Model (SLUCM) [
11,
12,
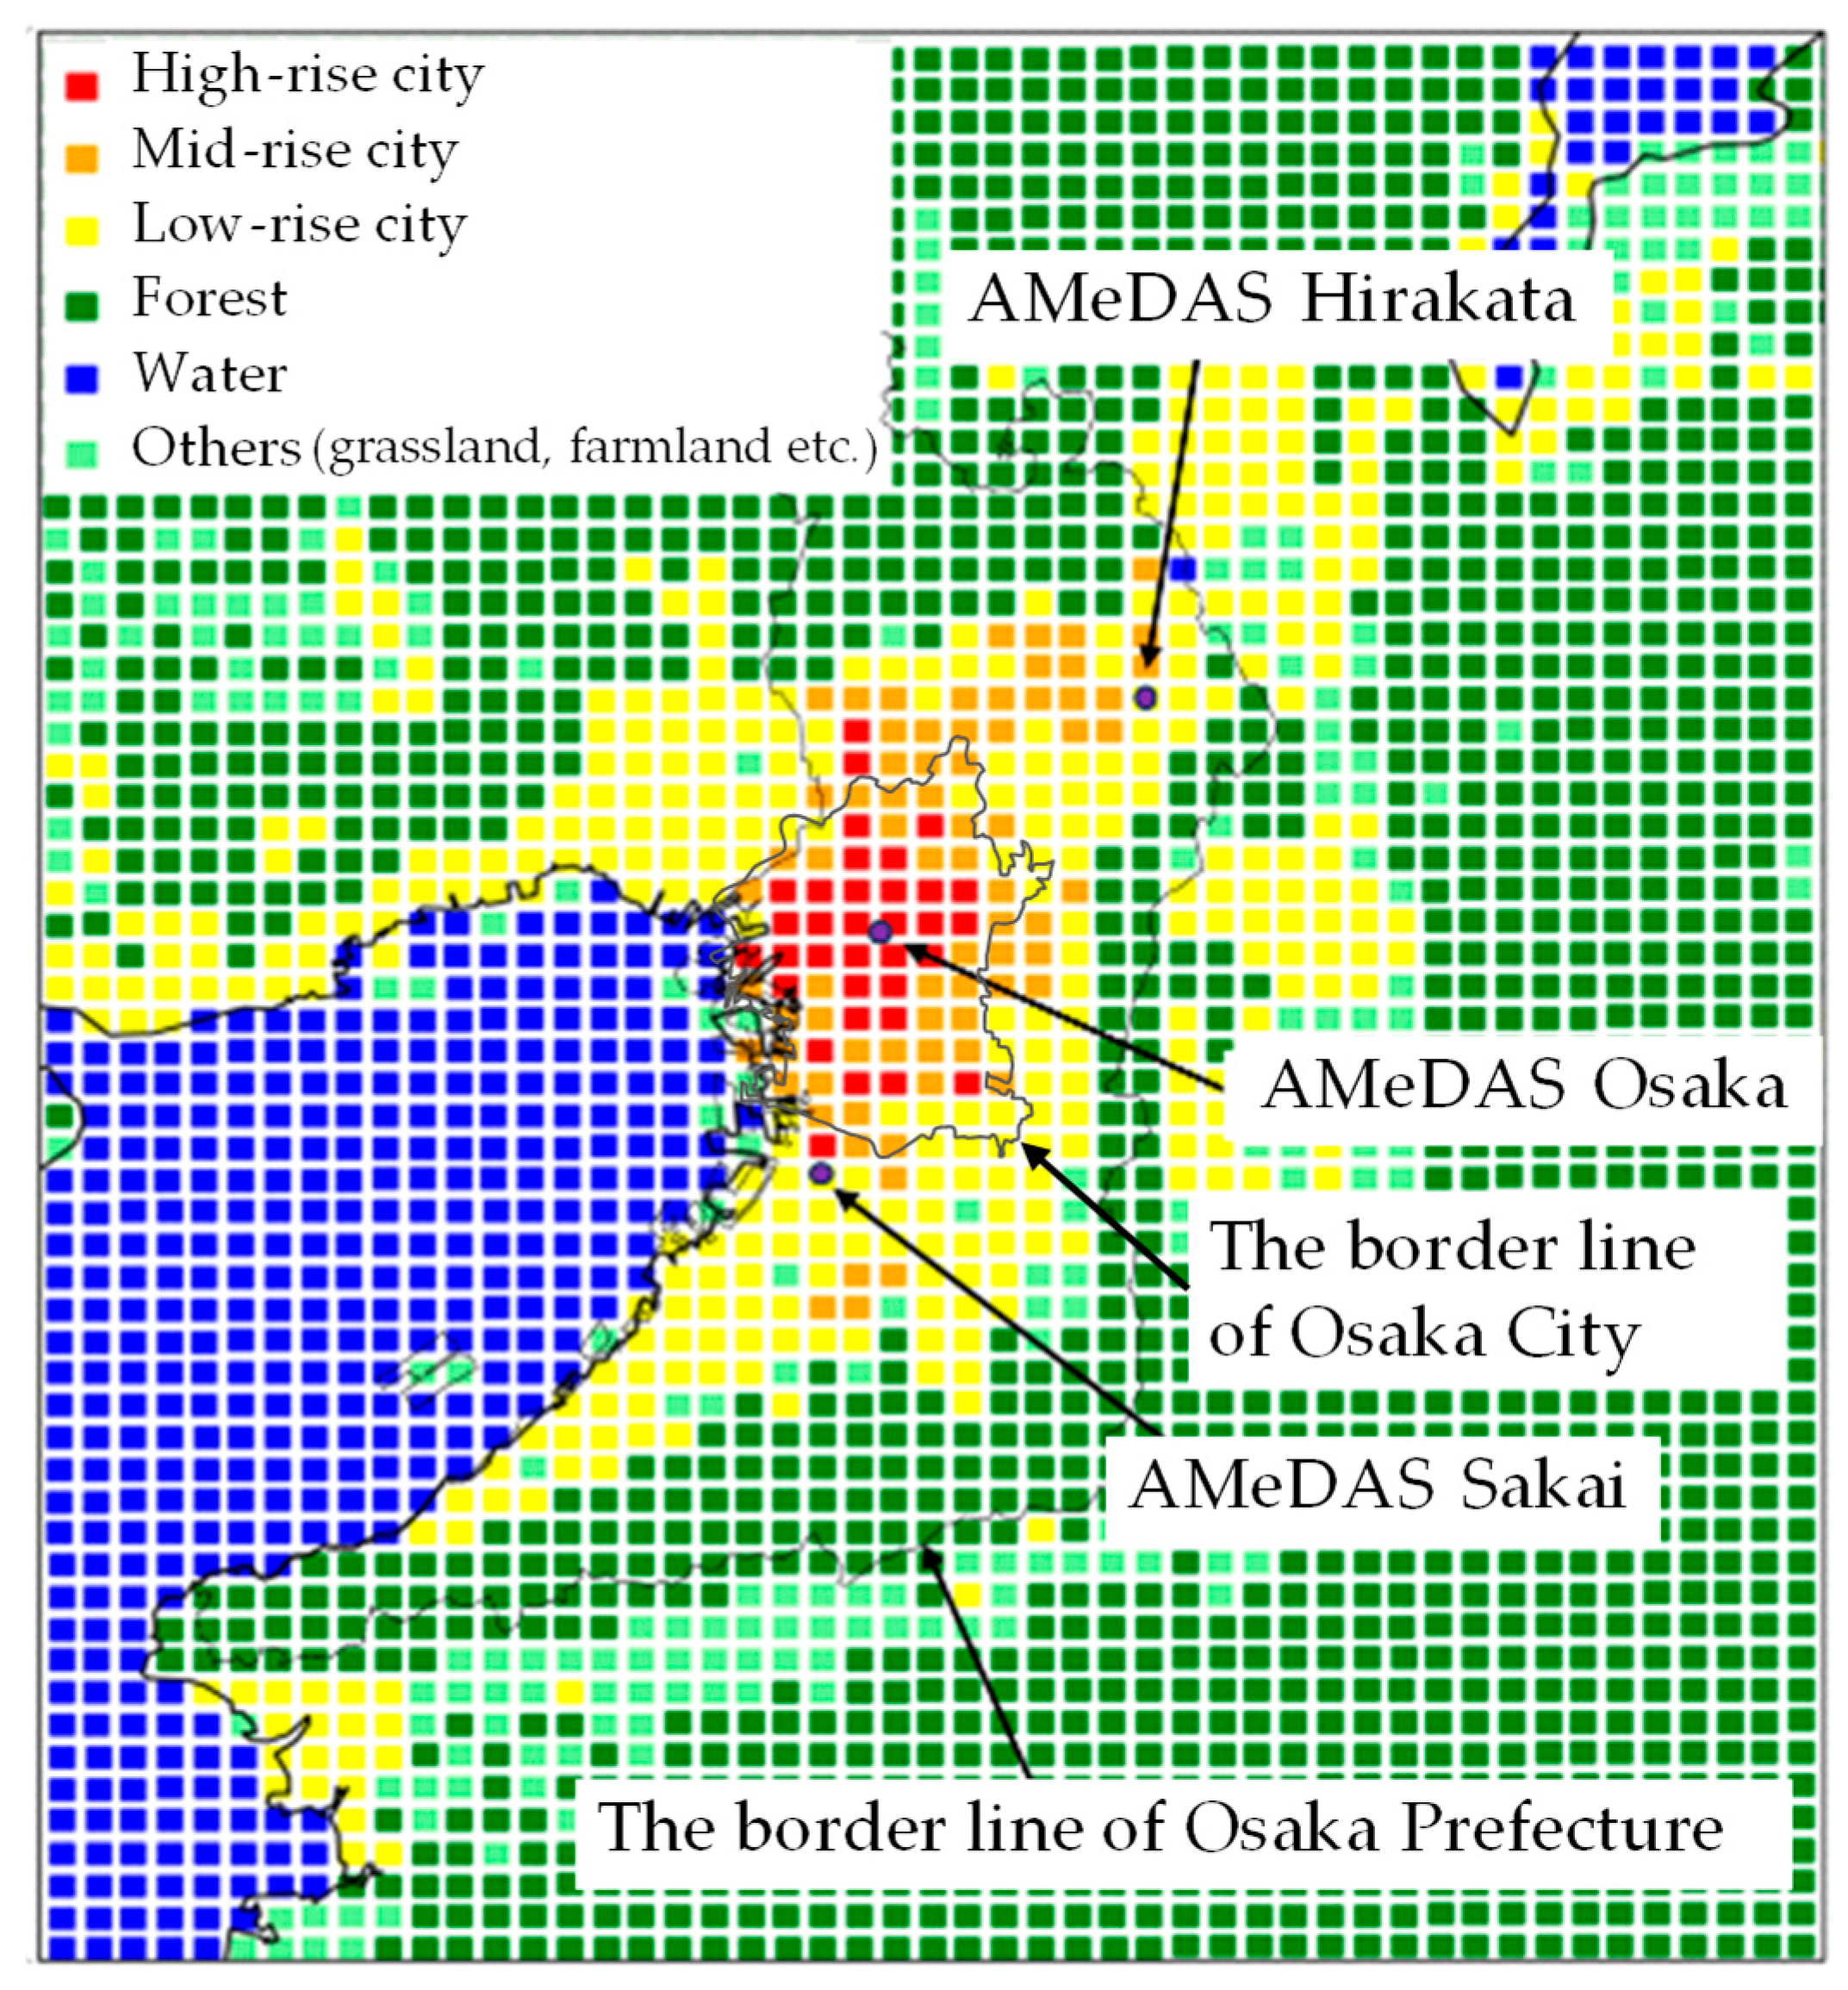
13] was used to represent urban surface processes, and a three-domain one-way nested configuration was adopted. The innermost domain, Domain 3, covered Osaka Prefecture and the surrounding region at a horizontal resolution of 2 km and was used as the target domain for evaluating the effects of rooftop UHI mitigation measures. The evaluation domain and land-use classification used in Domain 3 are shown in
Figure 2. The simulations were conducted monthly from April 2015 to March 2016, with a three-day spin-up period for each run.
Because the common meteorological model settings, including the physical parameterization schemes and domain configuration, have already been reported in detail in our previous study [
9], they are not repeated here. Instead, this study focuses on the rooftop surface parameters specific to the present comparison of HR, GR, and WR.
Urban areas in Domain 3 were classified into high-rise, mid-rise, and low-rise categories based on building height and building coverage ratio. Representative urban canopy parameters and anthropogenic heat emission profiles were assigned to each category. This classification was adopted to reflect the spatial heterogeneity of urban form in Osaka Prefecture while maintaining consistency with the SLUCM framework.
The rooftop mitigation measures were represented by modifying roof surface parameters in the SLUCM. The baseline case (BASE) used roof properties corresponding to conventional concrete materials. For HR, roof albedo was increased to 0.65 [
14]. For GR, roof albedo, heat capacity, thermal conductivity, and evaporation efficiency were modified to represent Sedum-based rooftop greening [
15,
16]. For WR, evaporation efficiency was set to 0.7 from 09:00 to 17:00 during the warm season from April to October, and was then assumed to decrease linearly to 0 by 09:00 on the following day [
17]. The parameter settings for each case are shown in
Table 1.
These settings were intended to represent typical initial performance values for rooftop mitigation measures applied to flat urban roofs. Long-term performance degradation due to aging, soiling, vegetation condition, or maintenance differences was not explicitly modeled. Therefore, the simulation results should be interpreted as the effects under representative initial-performance conditions.
The WRF results were validated using hourly ground-level air temperature data from the Automated Meteorological Data Acquisition System (AMeDAS) operated by the Japan Meteorological Agency [
18]. Three observation stations—Osaka, Sakai, and Hirakata—were selected to represent different urban conditions within the study region. Simulated temperatures were extracted from the grid cells corresponding to each observation site and compared with the observed data for the same period.
2.2. Estimation of the Impact of Temperature Changes on Energy Consumption
The effects of temperature changes on energy consumption were estimated using temperature sensitivity coefficients. In this study, temperature sensitivity is defined as the change in energy consumption associated with a 1 °C change in outdoor air temperature.
Figure 3 shows the calculation procedure for estimating energy and health impacts from simulated temperature changes.
The temperature sensitivity coefficients developed by Kiyokawa et al. [
8] were used. These coefficients were prepared by building use and energy source, covering the residential, office, and commercial sectors. An overview of the coefficients is provided in
Table 2.
For electricity, the coefficients were derived from hourly and daily electricity supply data for 2015 in three supply areas of Osaka Prefecture, provided by Kansai Electric Power Company [
19]. For residential urban gas and kerosene, the coefficients were estimated from household energy expenditure data from the Family Income and Expenditure Survey [
20], combined with unit price data for urban gas and kerosene [
21,
22]. For urban gas and heavy oil consumption in the office and commercial sectors, data from the Database for Energy Consumption of Commercial Buildings (DECC) were used [
23].
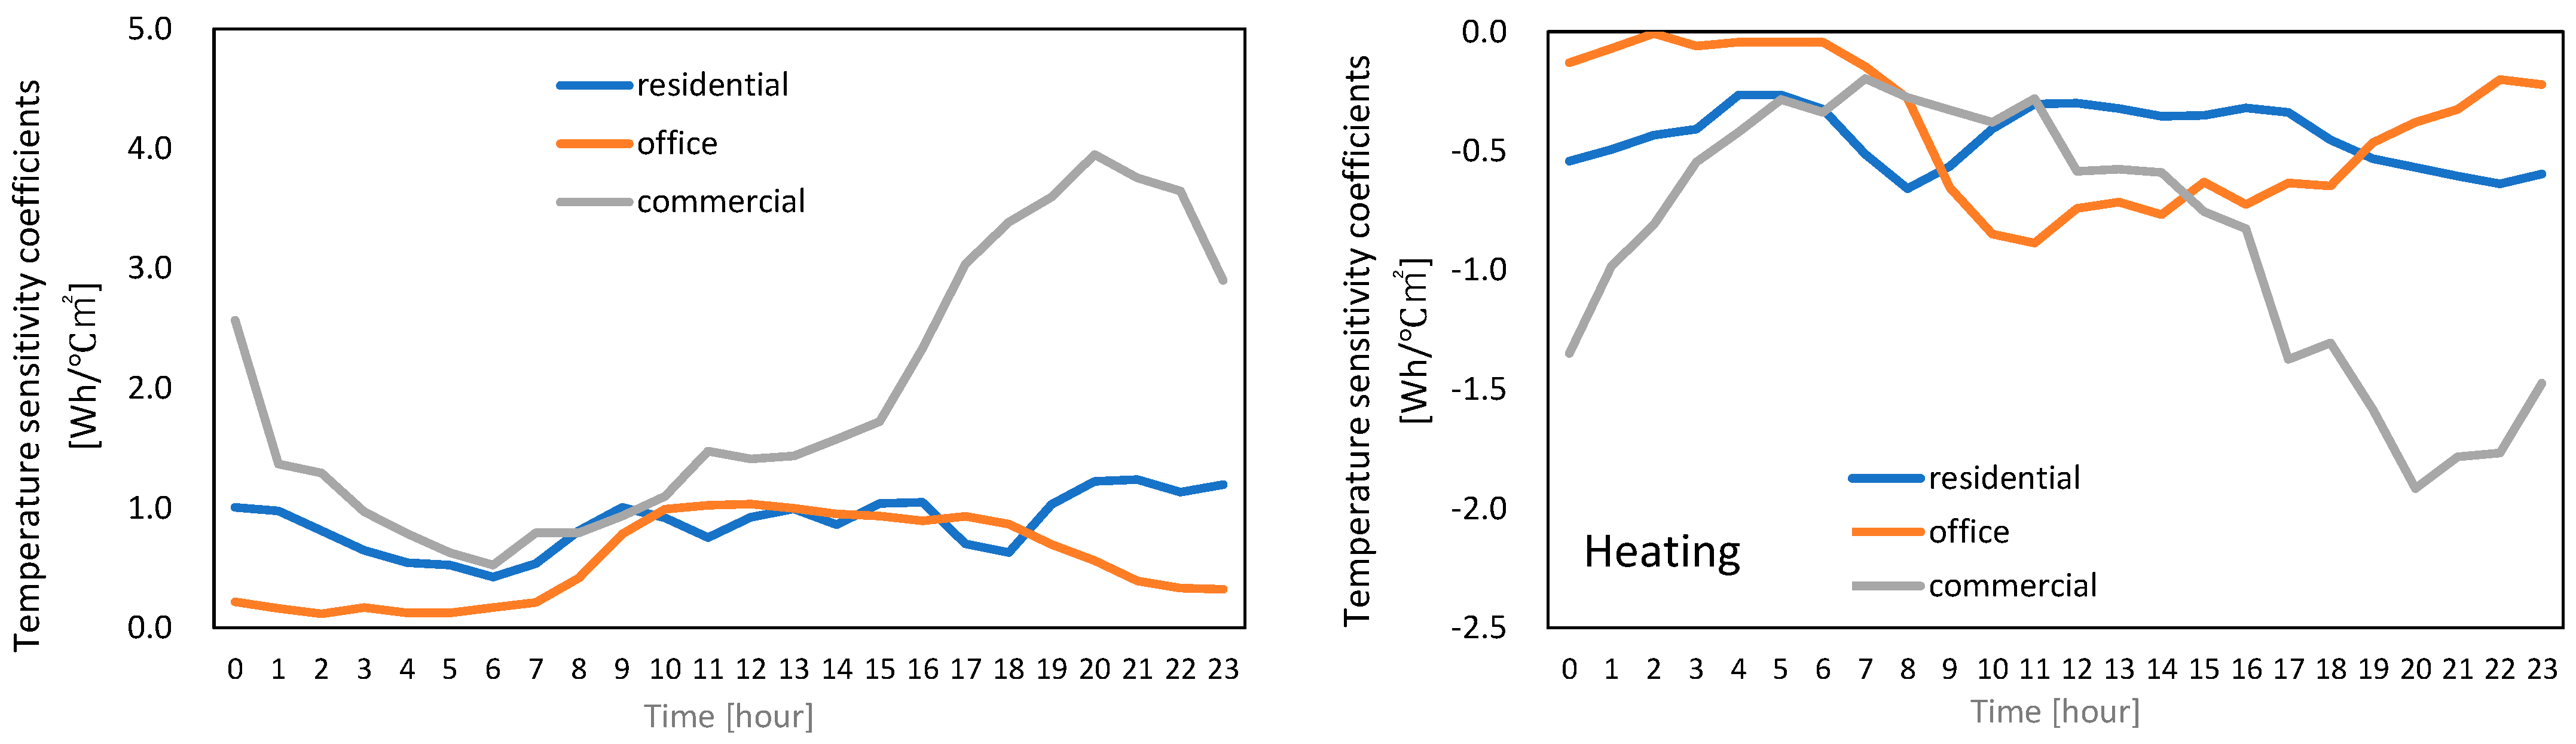
Figure 4 presents examples of the electricity temperature sensitivity coefficients for cooling and heating.
Energy consumption changes were estimated at the grid-cell level. First, hourly and daily temperature changes caused by each mitigation measure were calculated from the WRF outputs. These temperature changes were then multiplied by the corresponding temperature sensitivity coefficients to estimate unit changes in energy consumption. Finally, these unit changes were multiplied by the building stock in each grid cell and aggregated over Osaka Prefecture. The calculations were conducted on an annual basis to account for both cooling-season reductions and heating-season increases.
The estimated final energy changes were also converted into primary energy consumption and CO
2 emissions using standard conversion factors and emission factors provided by the Agency for Natural Resources and Energy [
22,
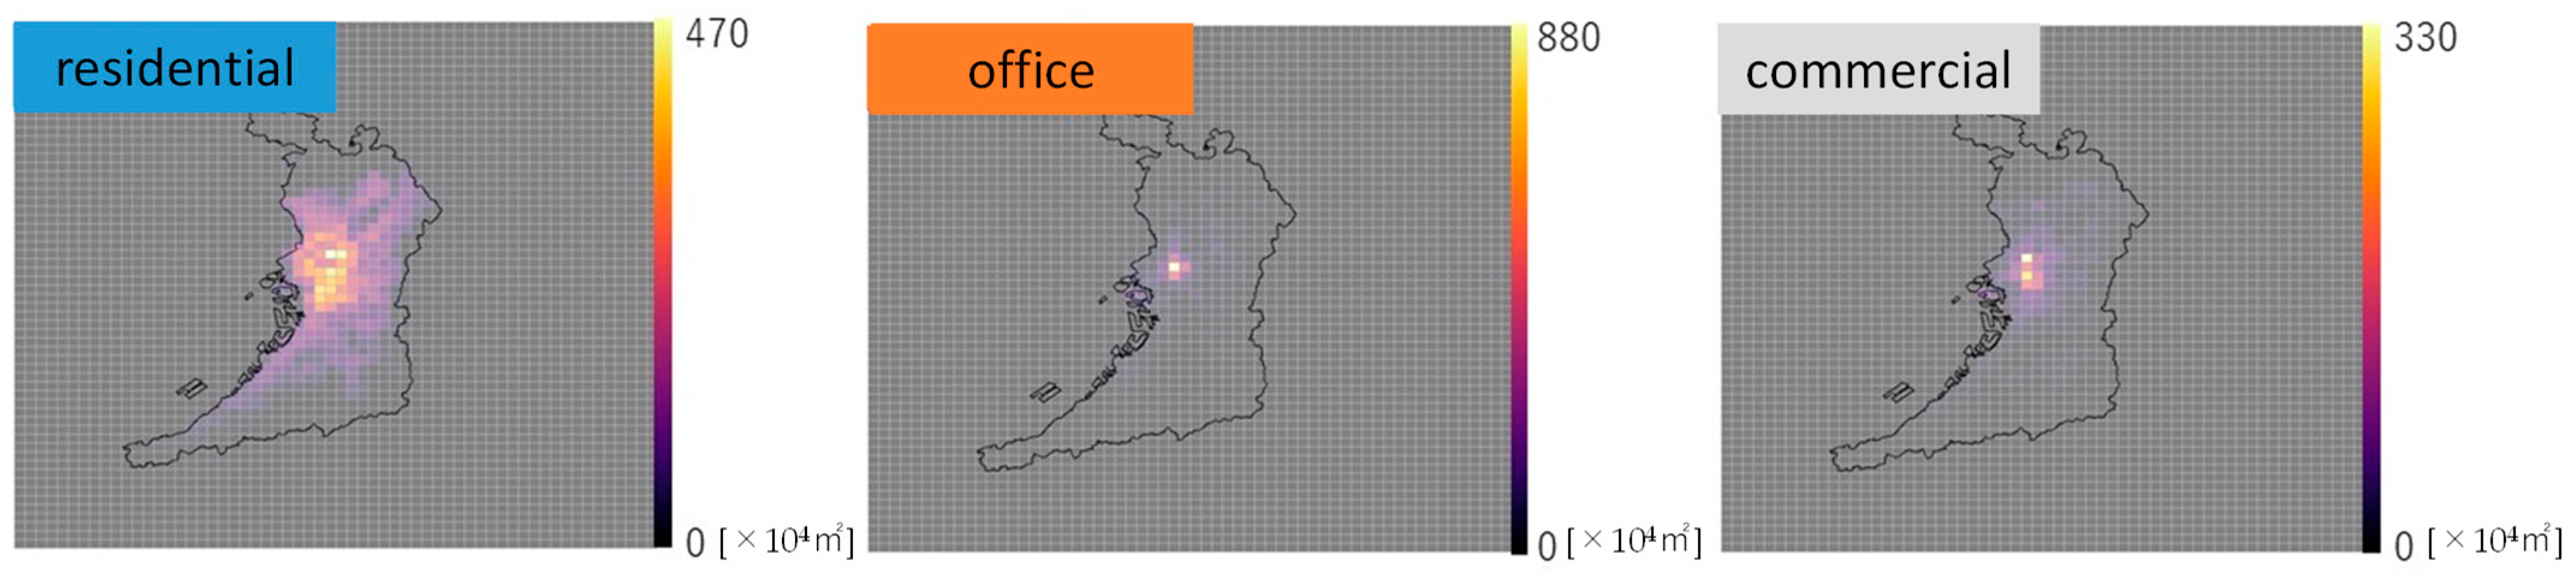
24]. The building stock data used in the analysis are summarized in
Table 3, and their spatial distribution within Domain 3 is shown in
Figure 5.
2.3. Estimation of the Impact of Temperature Reductions on Human Health
The impacts of temperature changes on human health were evaluated using disability-adjusted life years (DALYs). Temperature sensitivity coefficients for health impacts developed by Terui et al. [
9] were applied to the WRF-derived temperature changes.
Five health endpoints were considered: infectious diseases, sleep disturbance, fatigue, heatstroke, and heat/cold stress. For each endpoint, changes in DALYs were estimated by combining the simulated temperature changes, the corresponding health-related temperature sensitivity coefficients, and the population in each grid cell. The population data were based on the Grid Square Statistics derived from the Population Census of Japan, published by the Statistics Bureau of Japan, Ministry of Internal Affairs and Communications [
25]. The estimated DALY changes were then aggregated over Osaka Prefecture to obtain the annual health impact for each mitigation measure. Details of the health impact coefficients and endpoint definitions are provided in Terui et al. [
9].
2.4. Cost–Benefit Analysis
The cost–benefit analysis was conducted by comparing the monetized benefits of each rooftop mitigation measure with its annualized implementation cost. Two types of benefits were considered: reductions in energy costs and reductions in adverse health impacts.
Energy-related benefits were calculated by converting the estimated changes in energy consumption into changes in utility costs by energy source and building use. The unit prices used for this conversion are summarized in
Table 4 [
22,
24,
26,
27].
Health-related benefits were calculated by monetizing the estimated changes in DALYs. In this study, the economic value of one DALY was assumed to be 594,000 JPY. The reduction in DALYs estimated in
Section 2.3 was multiplied by this value to obtain the health-related benefit.
Implementation costs were estimated based on the applicable rooftop area in Osaka Prefecture and the unit cost of each measure. The total building area by building use is shown in
Table 5, and the unit costs of HR, GR, and WR are summarized in
Table 6. The cost data for HR and GR were obtained from a survey report on heat island countermeasure implementation published by the Ministry of the Environment [
28]. The cost parameters for WR were based on Narumi et al. [
17]. The annualized cost was calculated by dividing the sum of initial and maintenance costs by the service life of each measure.
Finally, the B/C of each mitigation measure was calculated as follows:
The analysis assumed uniform implementation of each rooftop mitigation measure across the applicable building area in Osaka Prefecture. This assumption was used to compare the relative performance of HR, GR, and WR under consistent implementation conditions.
In addition, to examine how the effects of the mitigation measures differ by region, the share of effects occurring in the urban area was also calculated. Specifically, for energy consumption reduction, health impact reduction, and the benefit–cost ratio, we calculated the extent to which Osaka City contributed to the overall results for Osaka Prefecture.
3. Results
3.1. WRF-Simulated Outdoor Air Temperatures
In this section, the cooling effects of HR, GR, and WR are evaluated using the WRF model. The meteorological model validation was conducted using the same WRF configuration, simulation period, and AMeDAS observation stations as those used in our previous study [
9]. Therefore, the detailed validation figures are not repeated in this paper. Briefly, hourly ground-level air temperatures observed at the Osaka, Sakai, and Hirakata AMeDAS stations were compared with the simulated air temperatures from the corresponding WRF grid cells. The monthly RMSE values were all below 1.5 °C, with annual averages of 1.3 °C for Osaka, 1.3 °C for Sakai, and 1.4 °C for Hirakata. The annual MBE values were 0.5 °C, 0.7 °C, and 0.2 °C, respectively, indicating a slight positive bias in the simulated temperatures. These validation results confirm that the model performance is sufficient for evaluating relative temperature differences among the rooftop mitigation scenarios. In this study, the following analysis therefore focuses on the comparative temperature changes induced by HR, GR, and WR.
Next, as examples of the results calculated from the outdoor air temperatures simulated by the model,
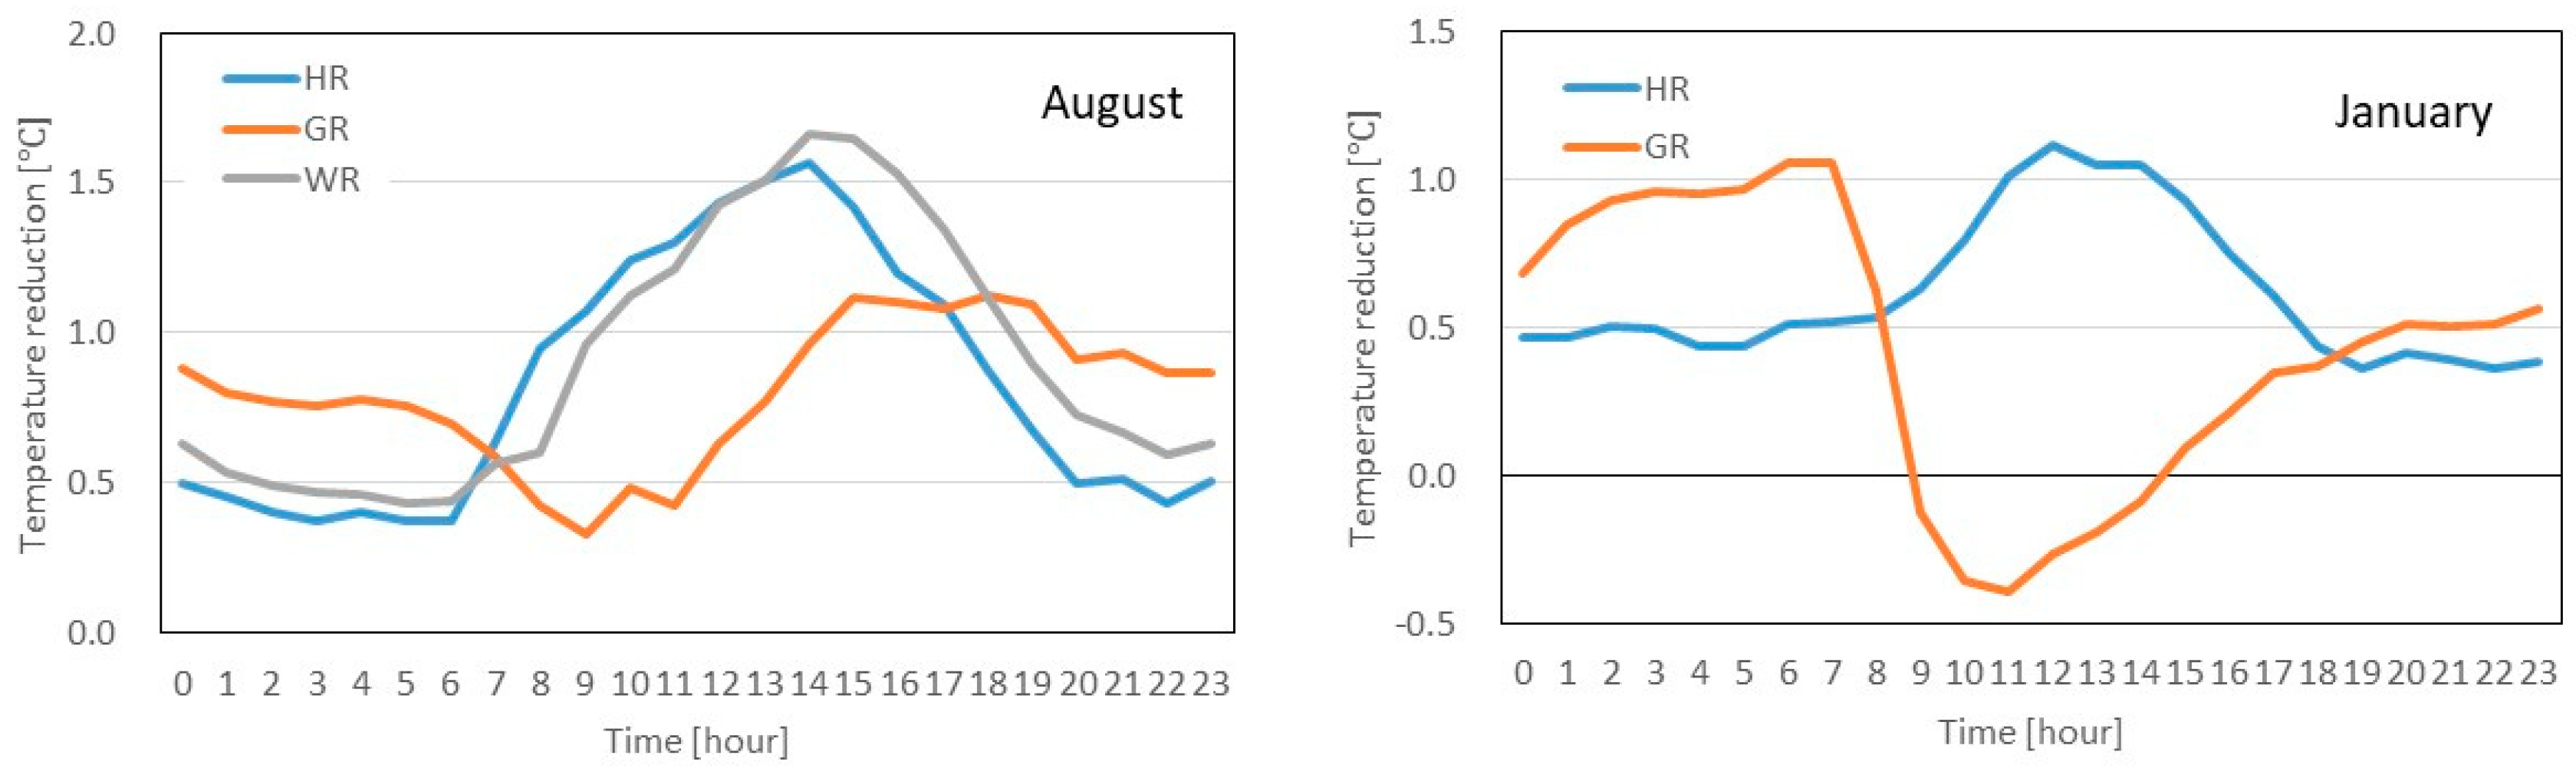
Figure 6 presents the monthly mean diurnal variations in outdoor air temperature reduction in August and January for each mitigation measure, while
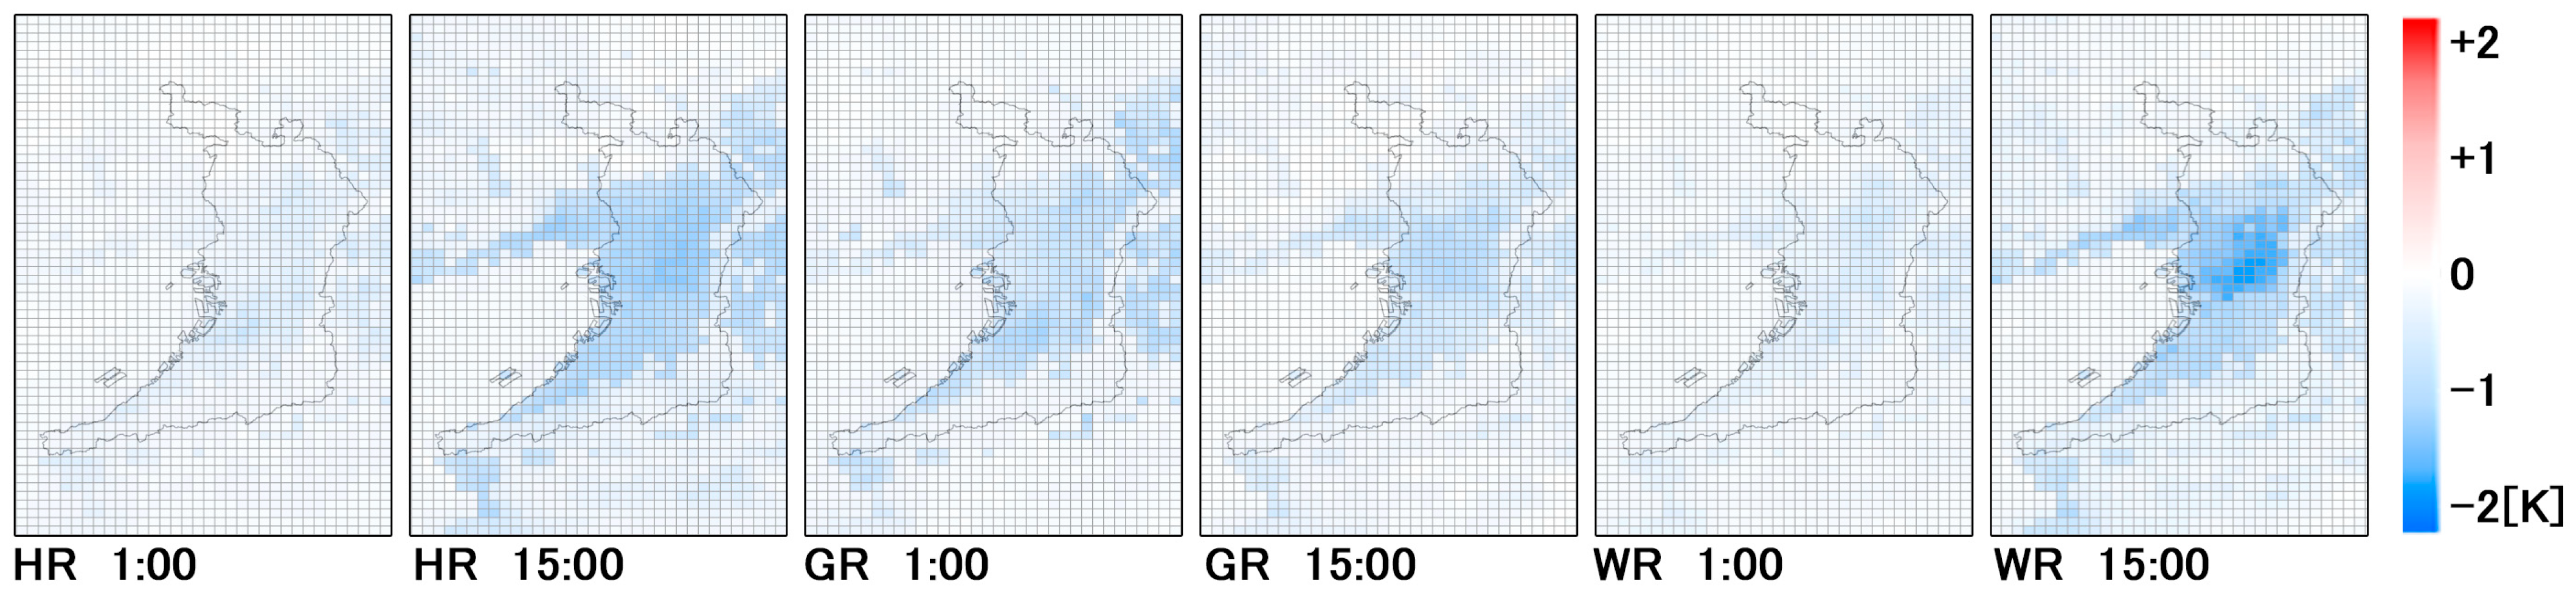
Figure 7 presents the spatial distributions of outdoor air temperature reduction at 1:00 and 15:00 in August.
For HR, a clear reduction in daytime air temperature is observed, with a cooling effect of approximately 1.5 °C in summer, when solar radiation is strong. In addition, a cooling effect of approximately 1.0 °C is observed even in winter. This is attributed to the increased roof albedo, which reduces both heat storage within the roof and heat release from the roof surface. Consequently, the cooling effect is particularly pronounced during daytime in summer when solar radiation is highest.
For GR, a cooling effect of approximately 0.8–1.1 °C is observed from evening to nighttime throughout the year. This can be attributed to two primary mechanisms: (1) reduced heat storage during the daytime due to decreased heat capacity, leading to lower roof surface temperatures from evening to nighttime, and (2) reduced heat conduction, which limits heat transfer between the roof surface and the building interior, resulting in relatively higher surface temperatures during the daytime and lower temperatures at night. In winter, however, a slight increase in daytime air temperature (up to approximately 0.4 °C) is observed. This is likely due to (1) an increased tendency for the roof surface temperature to rise as a result of reduced heat capacity and thermal conductivity, leading to enhanced sensible heat release to the atmosphere, and (2) suppression of vertical heat diffusion under stable atmospheric stratification conditions in winter.
For WR, similar to HR, a pronounced reduction in daytime air temperature is observed, with a maximum cooling effect ranging from 0.9 to 1.6 °C. However, unlike HR, the cooling effect outside the summer season is relatively small. This is considered to be due to two factors: (1) reduced solar radiation and heat input during the intermediate seasons (e.g., April and October), which limits evaporative cooling, and (2) fewer days of water application.
A comparison by month indicates that the maximum daytime cooling effect is greater in summer, when solar radiation is strong, than in winter. Furthermore, spatial comparisons reveal that the temperature reduction effect is more pronounced in urban areas such as Osaka and Sakai than in suburban areas such as Hirakata.
Although the cooling effect of HR tends to be relatively larger in high-density urban areas, the quantitative relationship between this effect and urban morphological indicators remains to be clarified and should be addressed in future research. The findings of this study can therefore be regarded as preliminary evidence indicating the potential for such analyses.
3.2. Impact of Temperature Reduction on Energy Consumption
This section presents the results of the estimated impacts of rooftop mitigation measures on energy consumption in Osaka Prefecture.
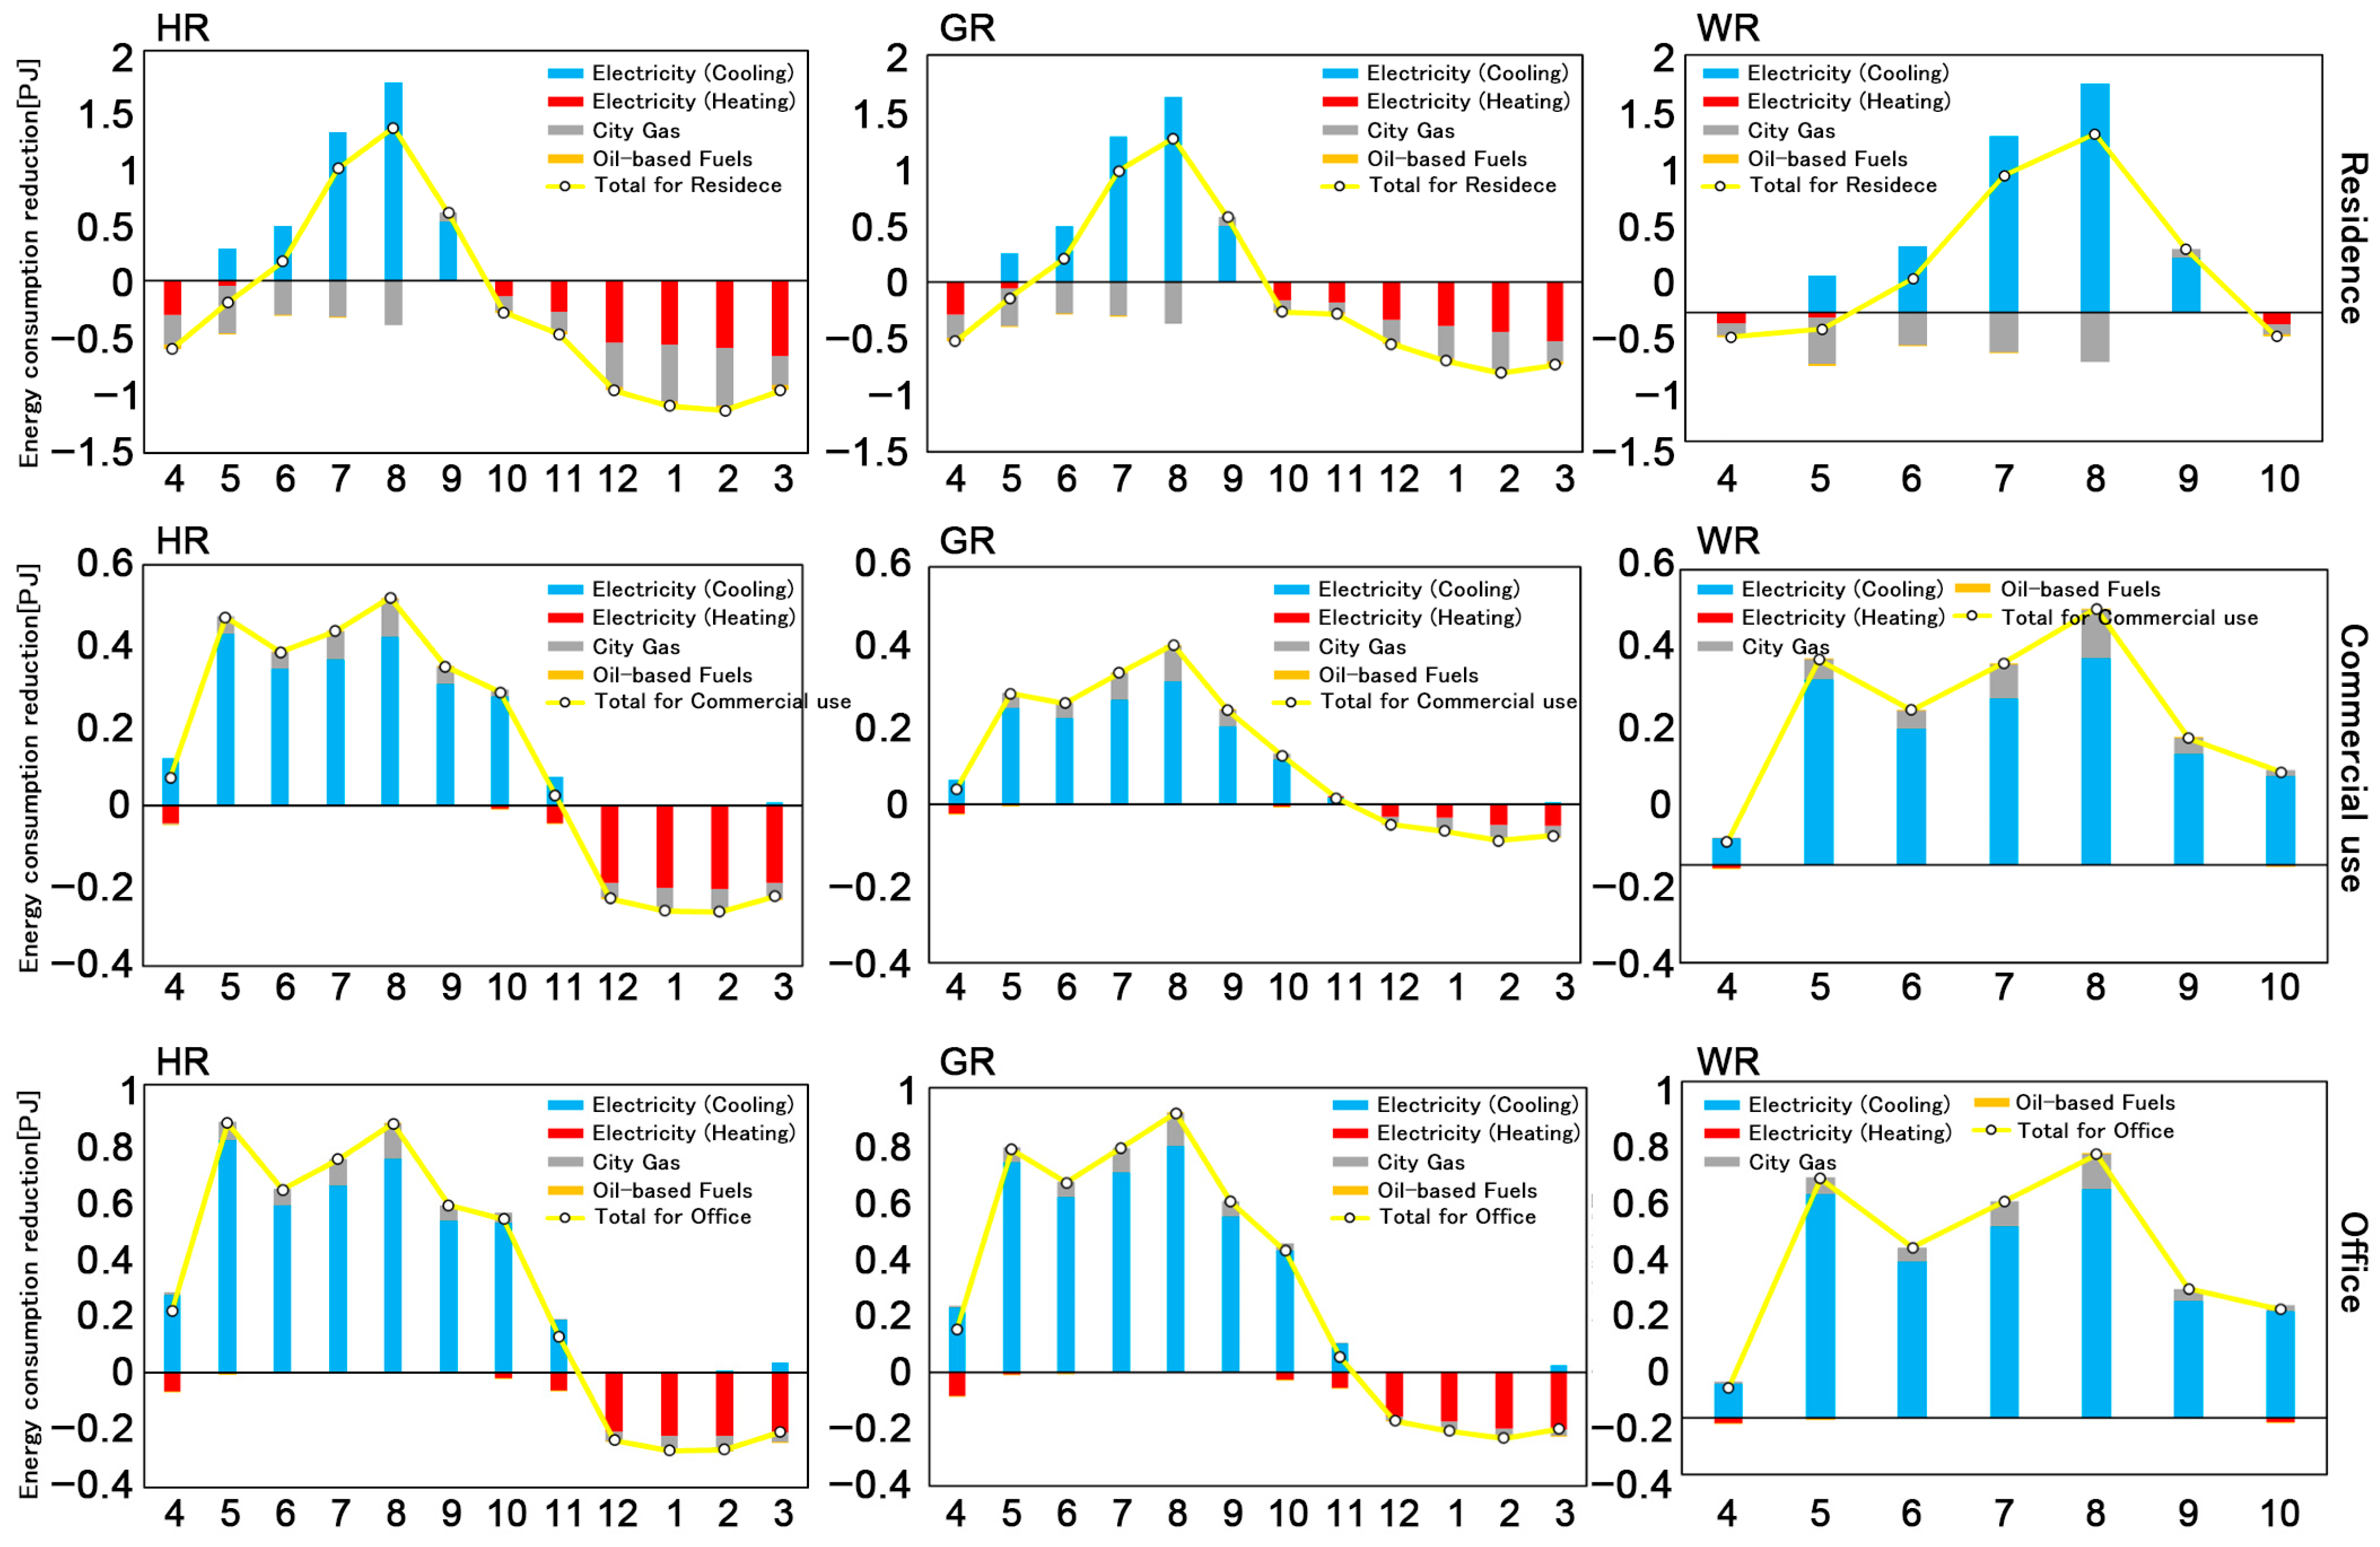
Figure 8 shows the monthly changes in energy consumption by energy source for each building use under each UHI mitigation scenario, while
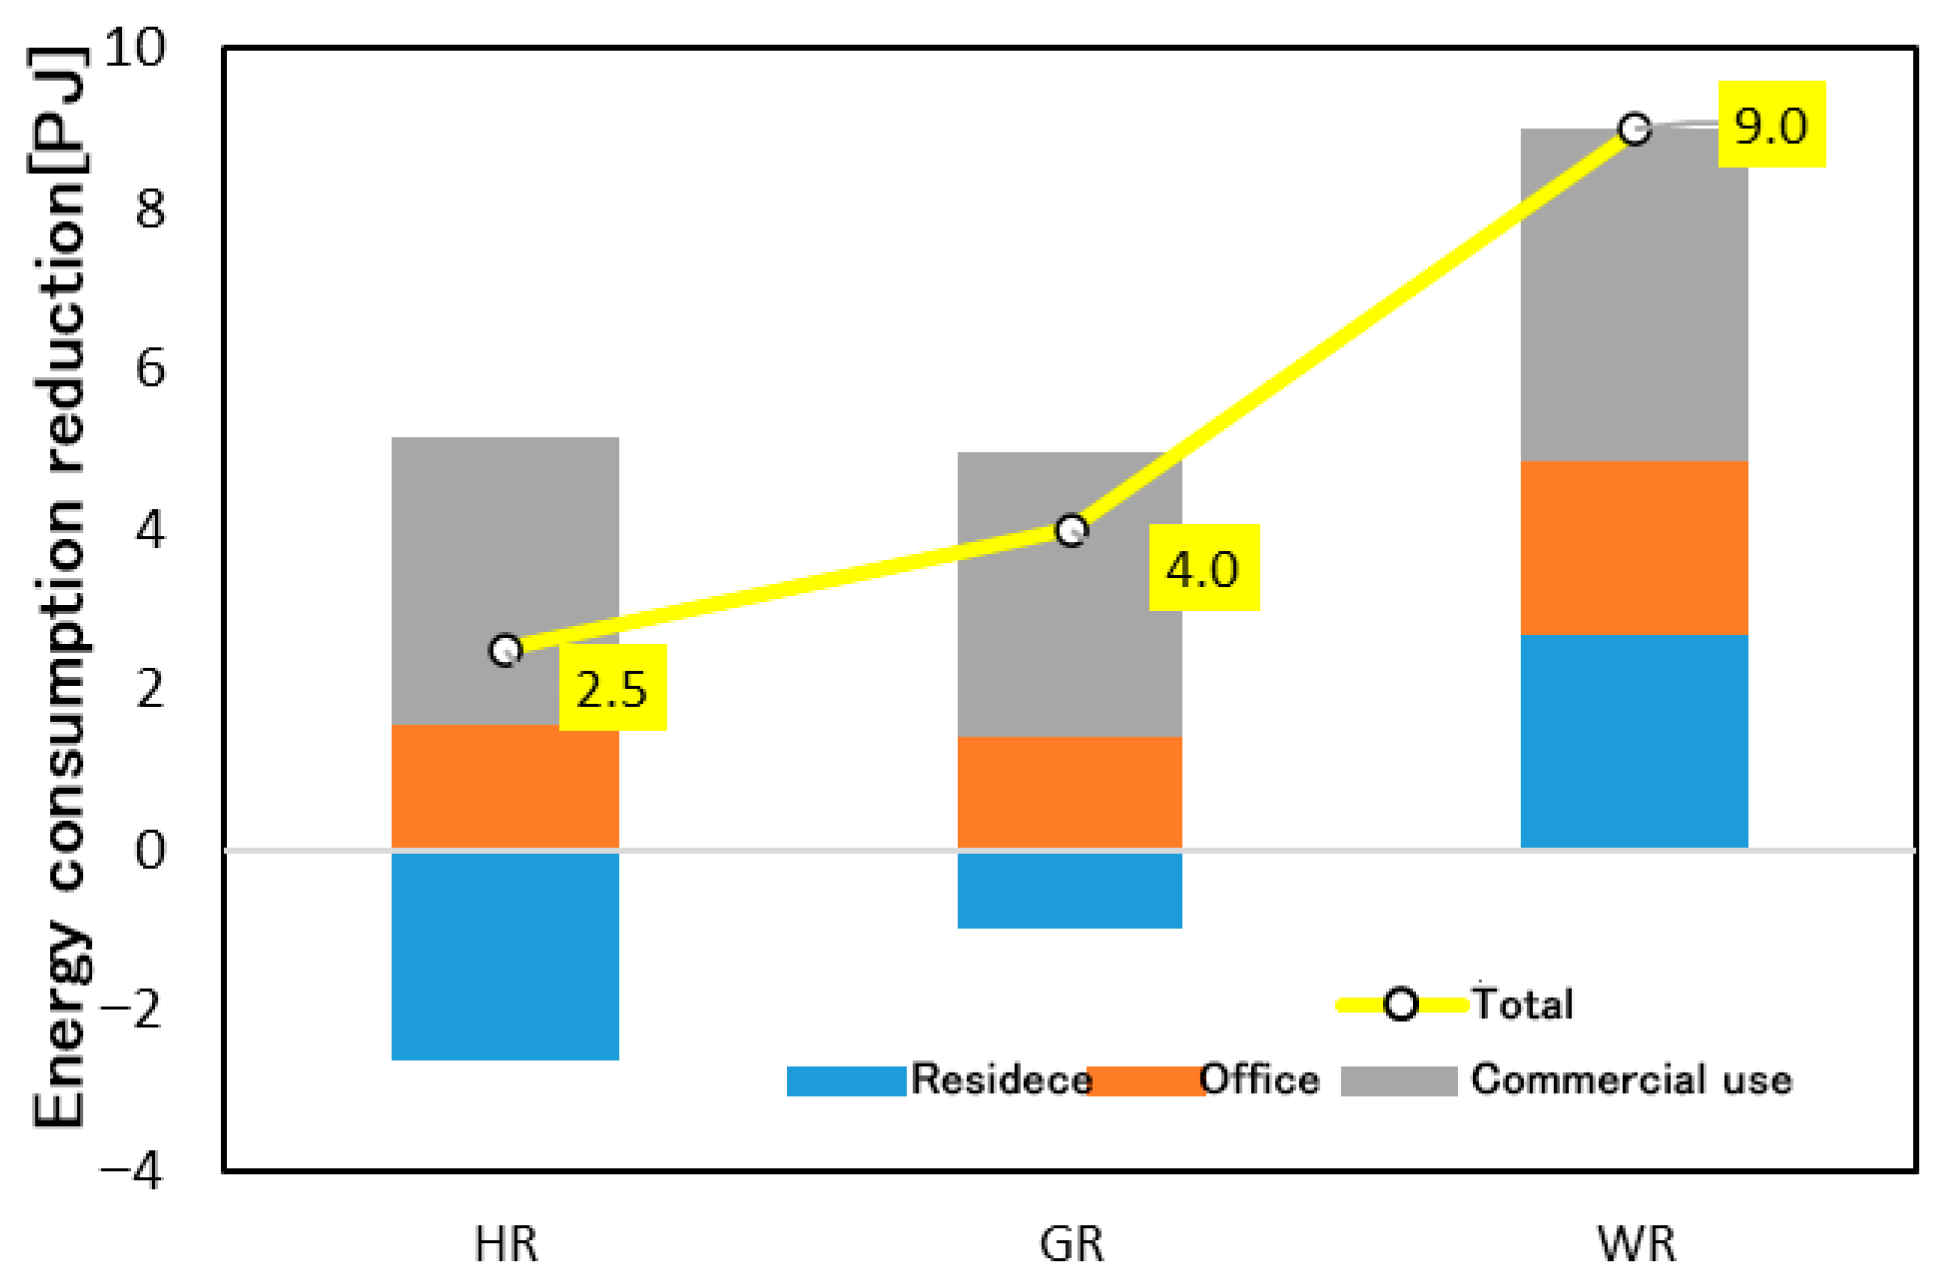
Figure 9 presents the annual total changes aggregated across all building uses.
First, as shown in
Figure 8, in the residential sector, cooling demand decreased in summer due to temperature reductions. However, in the HR and GR scenarios, heating demand increased in winter as a result of lower temperatures. Since heating demand generally exceeds cooling demand in the residential sector, the implementation of HR and GR led to an overall increase in annual energy consumption. In contrast, rooftop water sprinkling (WR), which is applied only in summer, avoids wintertime penalties and results in a clear change in energy consumption in summer.
In the office sector, similar to the residential sector, energy consumption decreased in summer due to reduced cooling demand, while it increased in winter due to higher heating demand. However, unlike the residential sector, cooling demand in the office sector exceeds heating demand. Therefore, for HR and GR, which are applied throughout the year, the increase in heating demand in winter is offset by the reduction in cooling demand, resulting in a net annual change in energy consumption. In addition, because the temperature threshold for cooling in the office sector is lower than that in the residential sector, substantial energy savings are observed during the extended cooling period from May to October. Since the timing of temperature reduction differs between HR (daytime) and GR (evening to nighttime), HR has a greater overall impact—both positive and negative—in the office sector, where air-conditioning operation is concentrated during daytime hours. As WR does not increase heating demand, results similar to those in the residential sector are obtained. Overall, all mitigation measures result in energy savings in the office sector, with WR showing the largest reduction of 2.2 PJ.
In the commercial sector, similar trends are observed: energy consumption decreases in summer due to reduced cooling demand and increases in winter due to increased heating demand. As in the office sector, cooling demand exceeds heating demand; therefore, HR and GR achieve net annual energy savings despite wintertime penalties. Compared with HR, GR results in smaller changes in energy consumption in the residential and office sectors; however, in the commercial sector, GR achieves energy savings comparable to those of HR. This is because the temperature sensitivity of the commercial sector is higher from evening to nighttime, during which GR provides greater cooling effects. Consequently, all mitigation measures lead to net energy savings, with WR again showing the largest reduction, amounting to 4.1 PJ.
Finally, as shown in
Figure 9, when aggregating across all building uses, the annual energy savings are 2.5 PJ for HR, 4.0 PJ for GR, and 9.0 PJ for WR, with WR exhibiting the greatest effect. This is attributed to its strong cooling effect in summer and the absence of wintertime penalties.
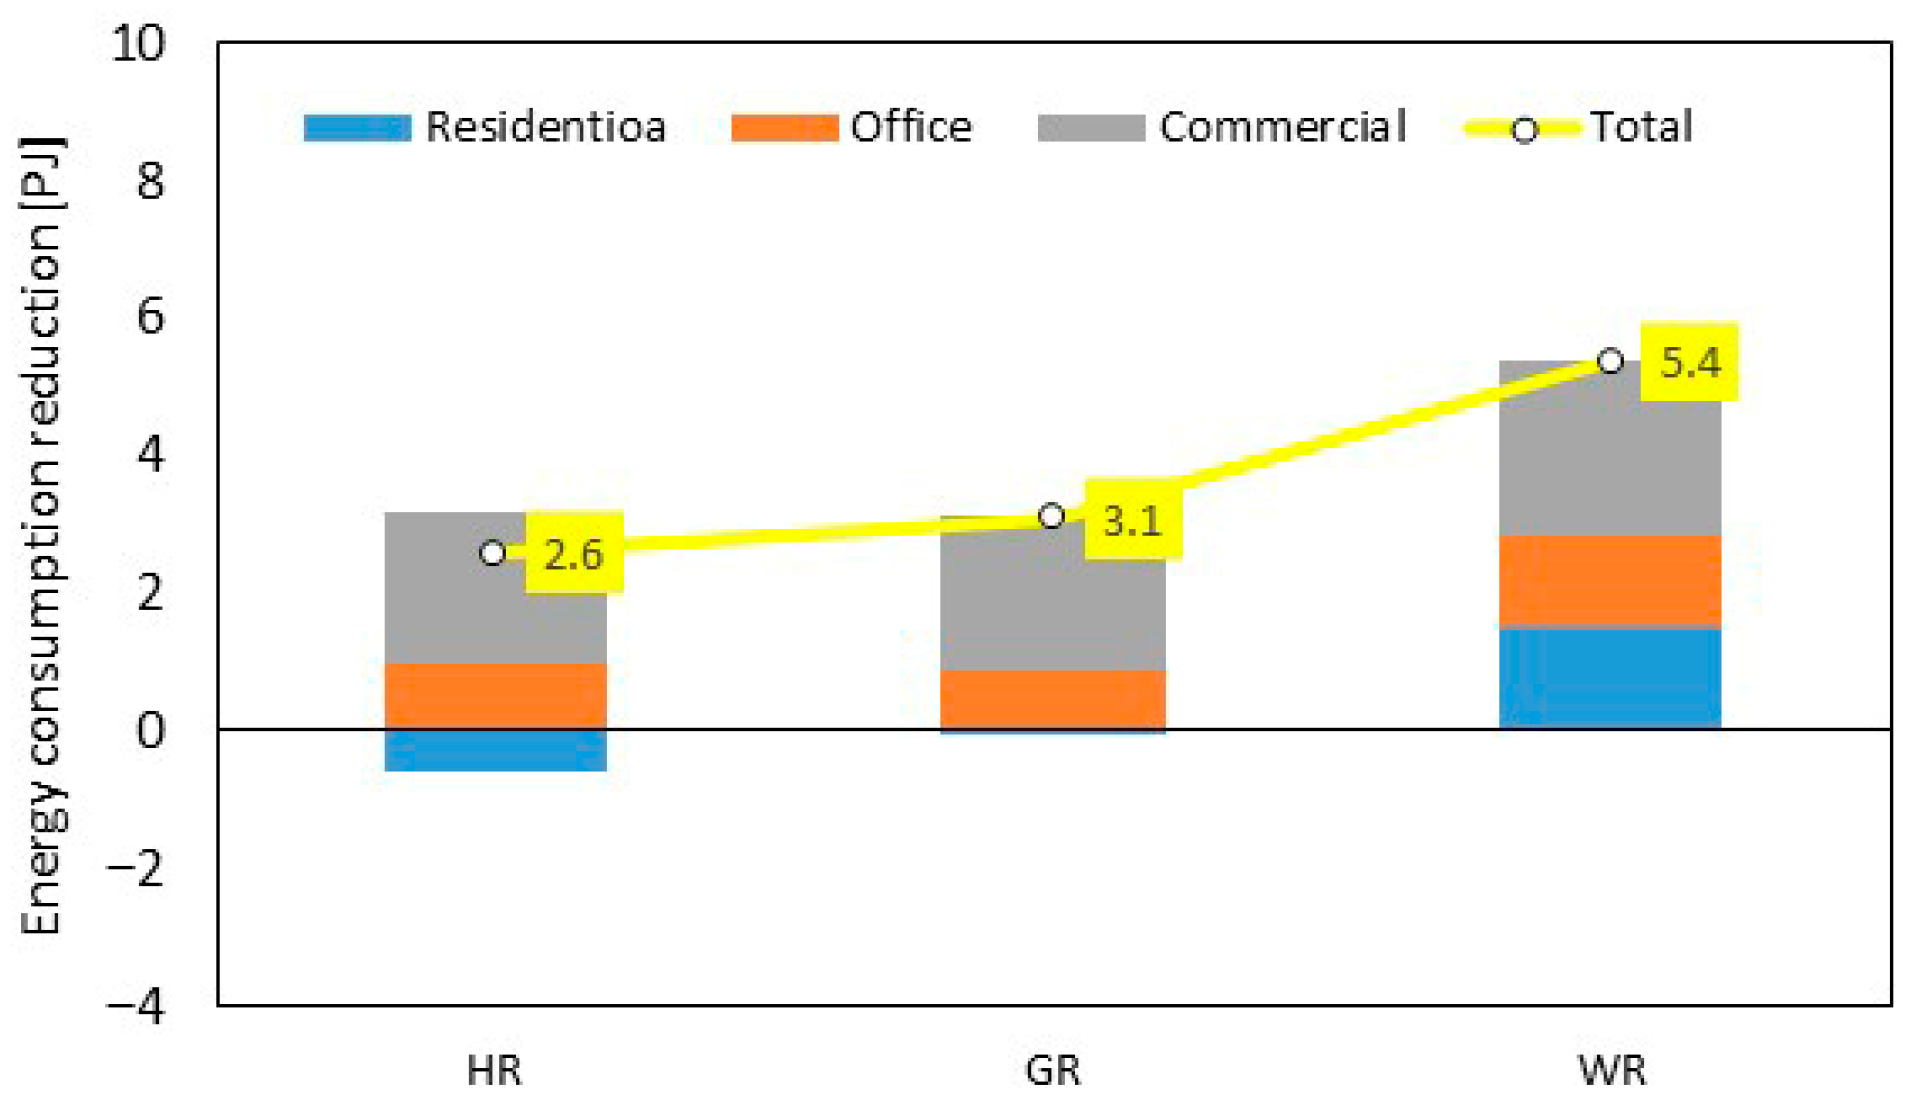
Figure 10 shows the annual energy consumption reduction in Osaka City, and
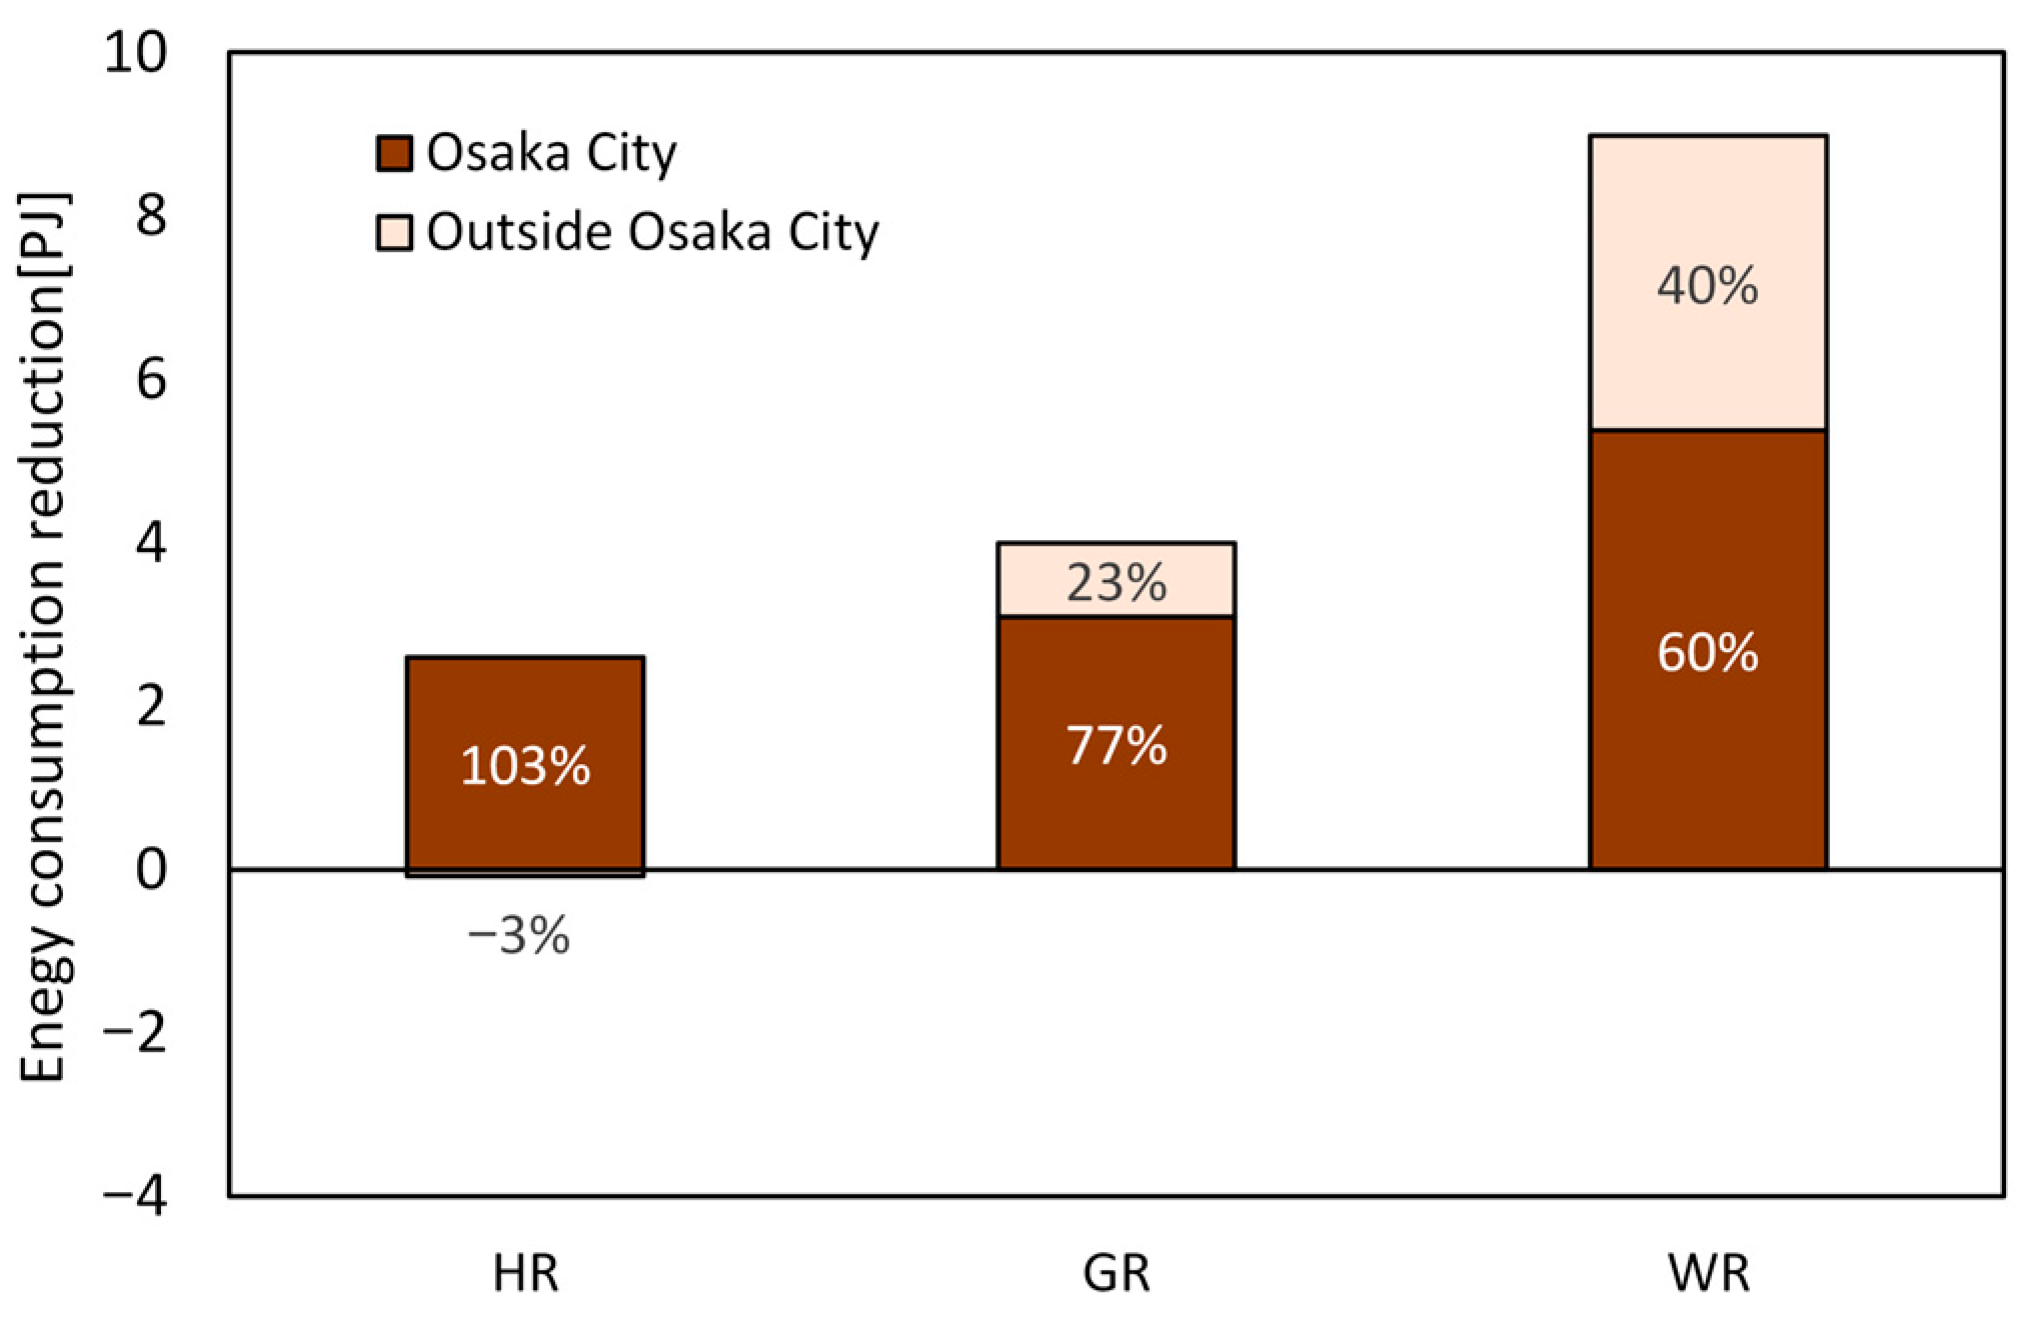
Figure 11 shows the share of Osaka City in the annual energy consumption reduction in Osaka Prefecture.
For both HR and GR, the share of the wintertime increase in residential energy consumption is considerably smaller in Osaka City than in Osaka Prefecture as a whole. As a result, the total energy consumption reductions in Osaka City correspond to 103% for HR, 77% for GR, and 60% for WR of the prefecture-wide values, which are substantially larger than the Osaka City/Osaka Prefecture total floor area ratio of 46%. This is because the share of residential floor area in Osaka City is smaller than that in Osaka Prefecture as a whole, at 60% compared with 67%. In addition, as can be seen from the land-use distribution map, Osaka City has a large building footprint, corresponding to a large applicable area for the mitigation measures. The cooling effect is also enhanced by an aggregation effect [
29,
30], whereby horizontal heat exchange with non-treated areas is relatively limited, resulting in a larger reduction in outdoor air temperature.
3.3. Impact of Temperature Reduction on Human Health
This section presents the estimated reductions in health impacts in Osaka Prefecture resulting from each UHI mitigation measure.
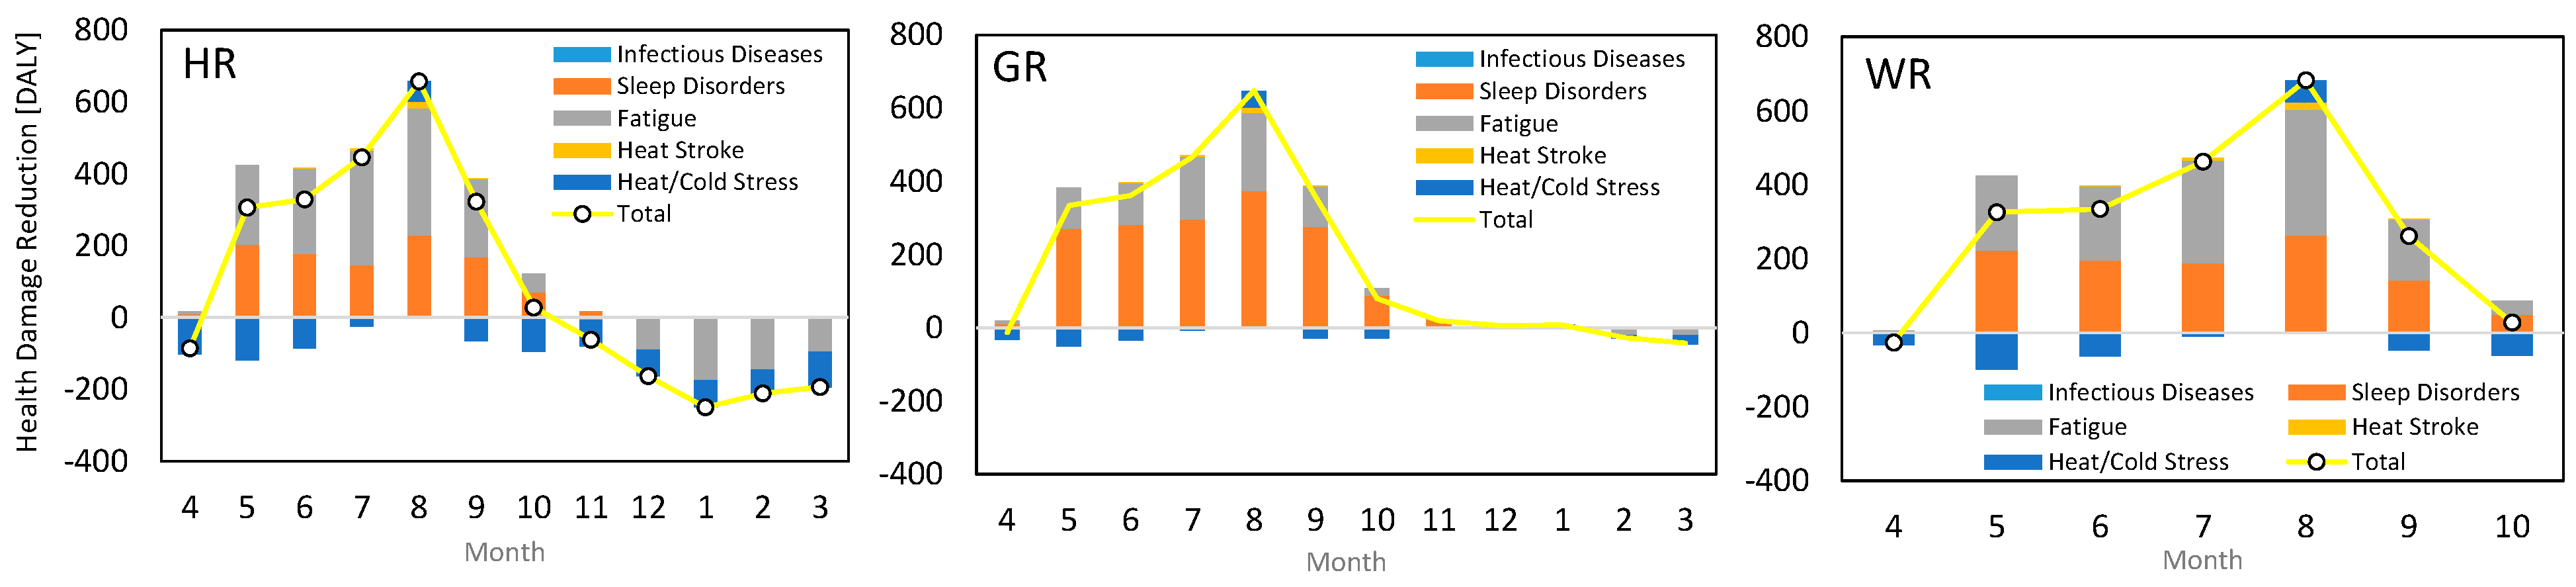
Figure 12 shows the monthly variations, while
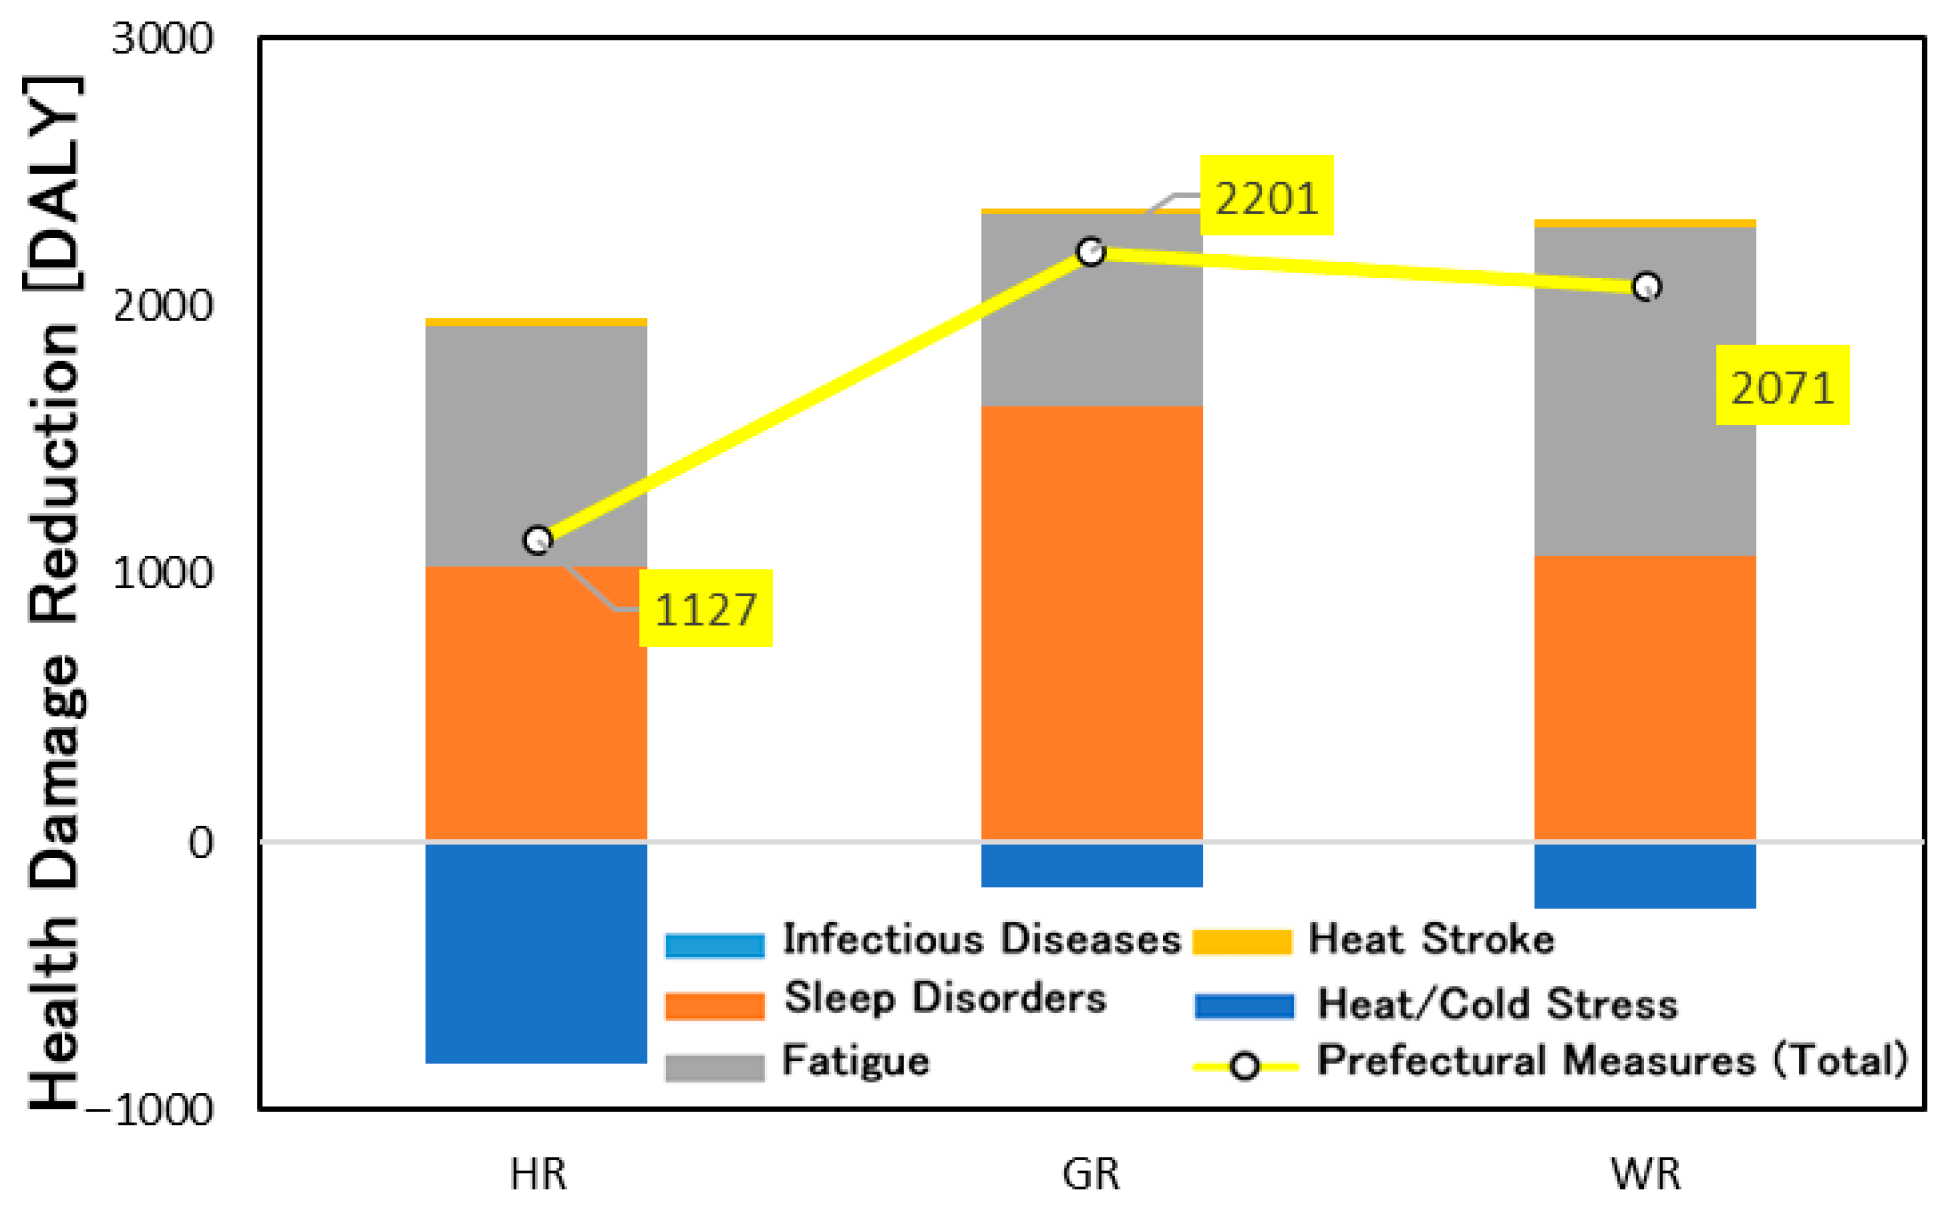
Figure 13 presents the annual totals. Among the evaluated health endpoints, fatigue and sleep disturbance exhibited the most pronounced changes.
As shown in
Figure 12, in the HR scenario, the cooling effect is more pronounced during daytime; therefore, relatively large changes in health impacts associated with fatigue are observed in both summer and winter. In addition, reductions in heat stress are observed only in August, whereas in other months, the decrease in temperature leads to an increase in cold stress.
In the GR scenario, the cooling effect is more significant from evening to nighttime, resulting in substantial reductions in health impacts related to sleep disturbance in summer. In contrast, for fatigue and heat/cold stress—evaluated based on daily maximum temperature—the magnitude of change is smaller than that in the HR scenario, and almost no change is observed in winter.
In the WR scenario, similar to HR, the cooling effect is more pronounced during daytime, leading to relatively large reductions in health impacts associated with fatigue.
For infectious diseases, the values for all mitigation measures are less than 1 DALY/month and are therefore not discernible in the figure.
As shown in
Figure 13, on an annual basis, GR achieves the largest reduction in health impacts (2201 DALYs), primarily due to its substantial benefits for sleep disturbance and relatively small wintertime penalties. This is followed by WR (2071 DALYs), which also exhibits limited wintertime penalties because it is not applied during the cold season. In contrast, HR shows a smaller net reduction (1127 DALYs), as its benefits are partially offset by adverse effects in winter. Overall, the effectiveness in reducing health impacts is ranked as GR > WR > HR.
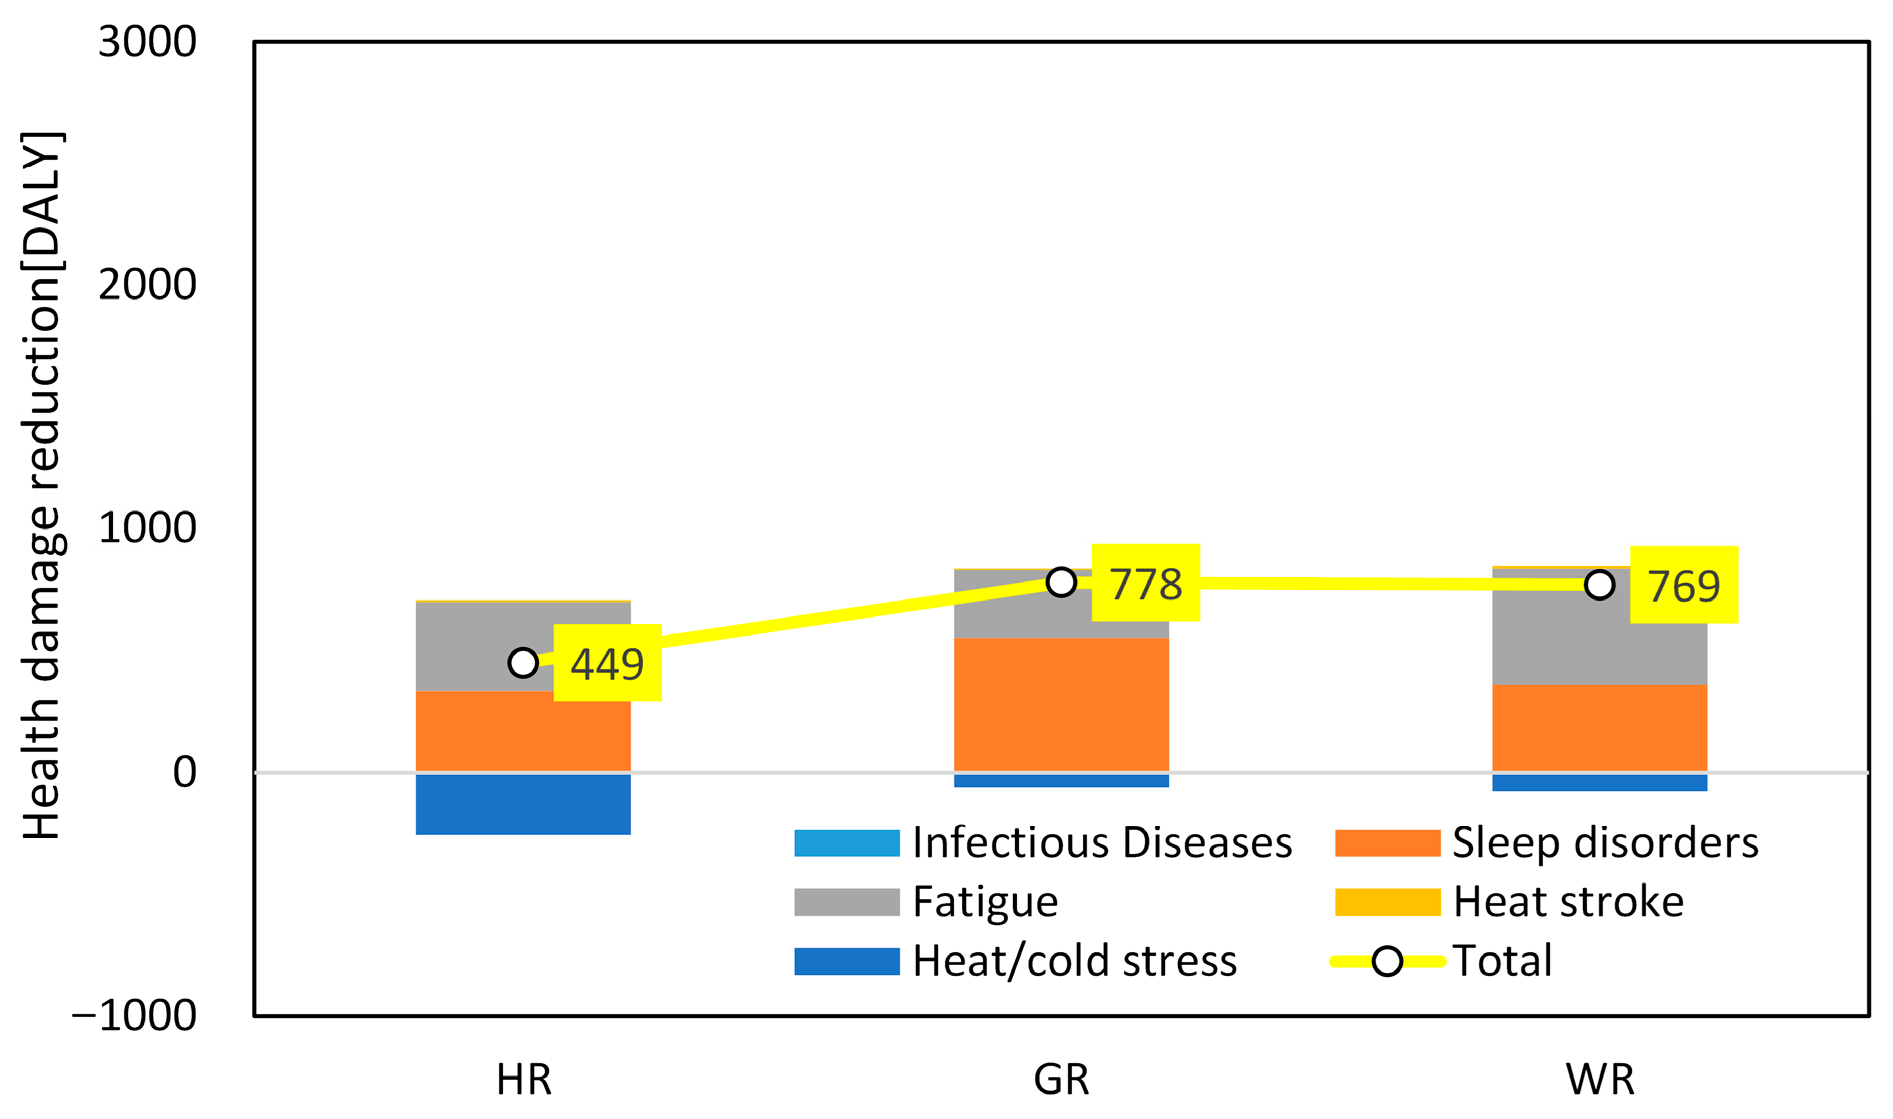
Figure 14 shows the annual health impact reduction in Osaka City, and
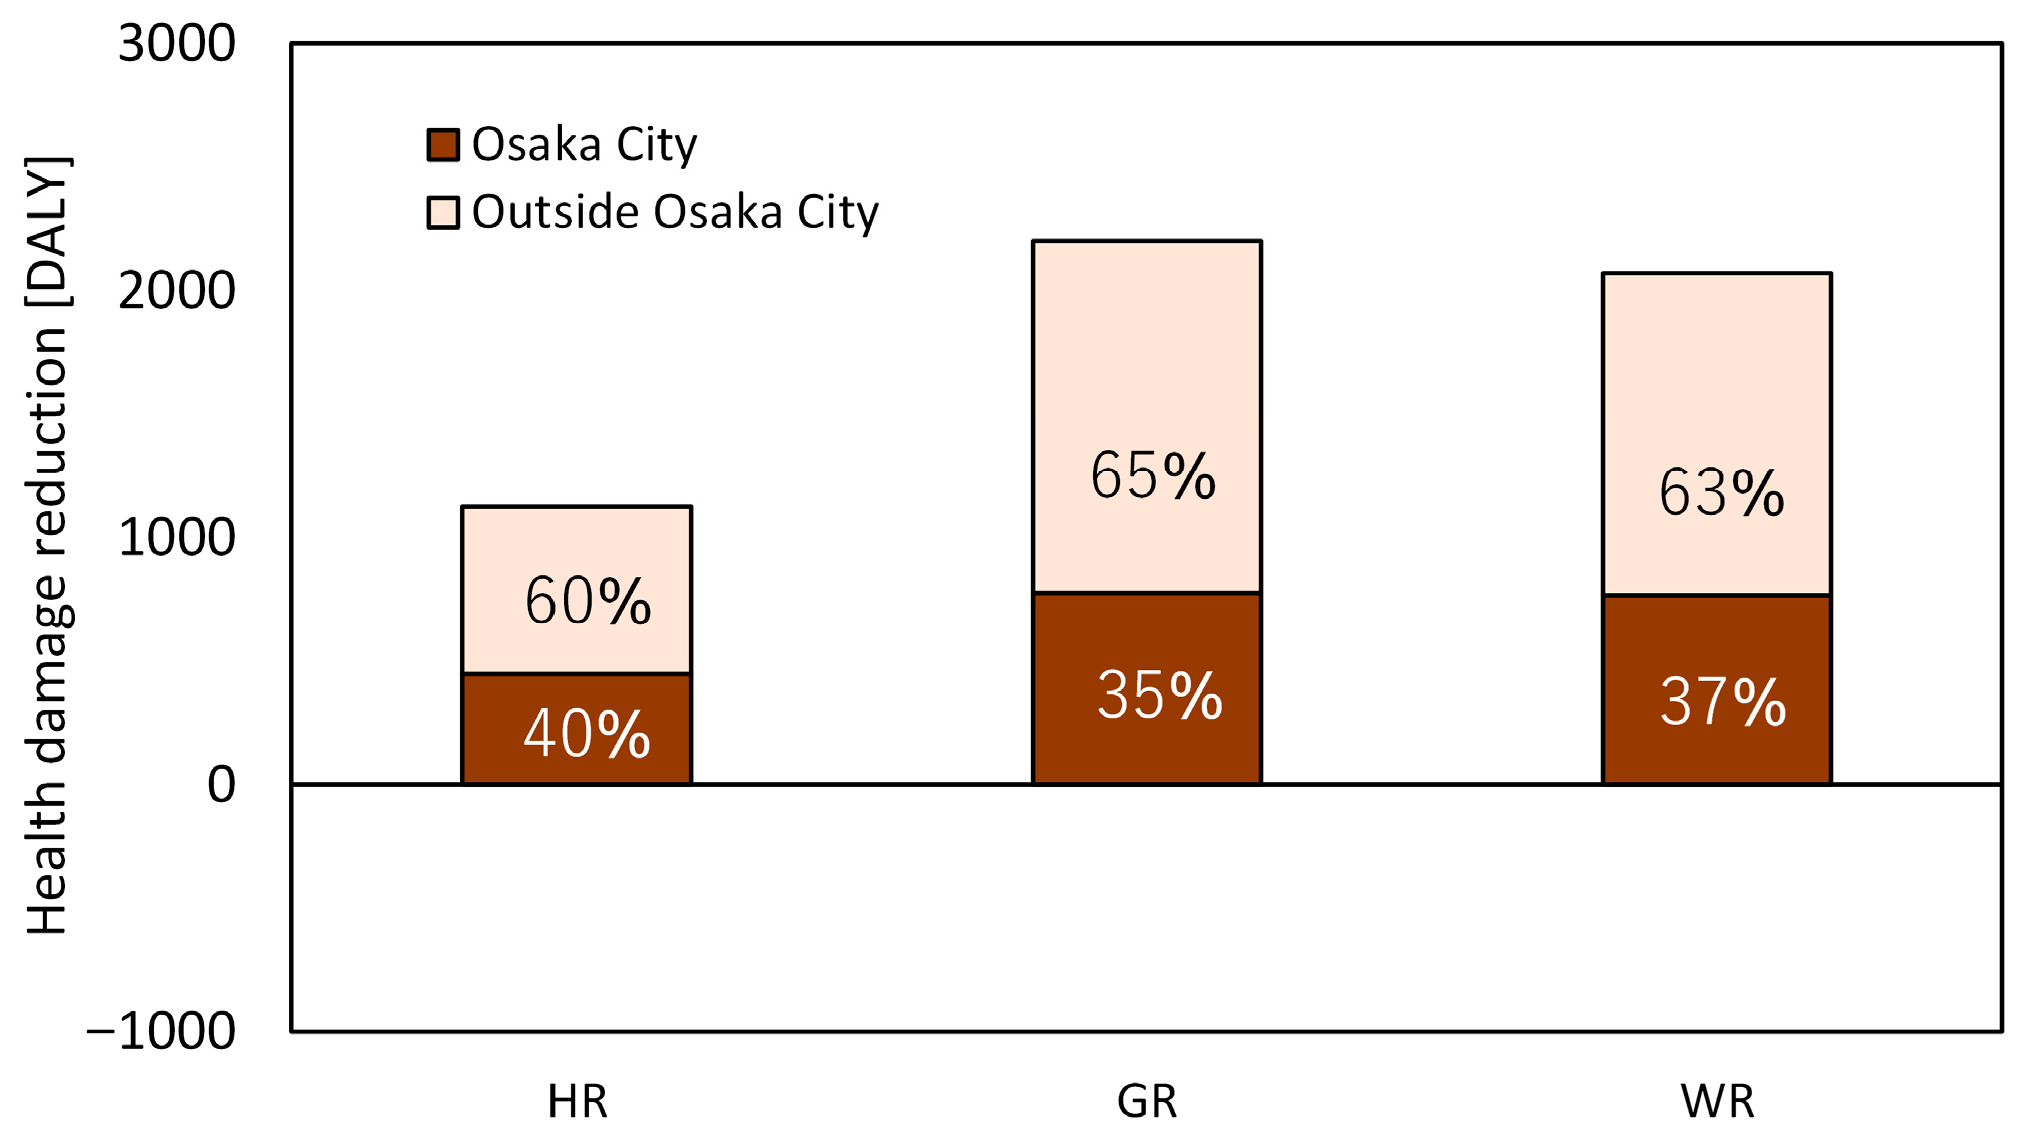
Figure 15 shows the share of Osaka City in the annual health impact reduction in Osaka Prefecture.
Health impacts tend to be larger in areas with larger populations. For all mitigation measures, however, the share of Osaka City does not differ substantially from its population share and remains relatively close to that value. The slightly higher share of health impact reduction in Osaka City compared with its population share is considered to result from the larger temperature reduction effect within Osaka City, as discussed above.
3.4. Results of the Cost–Benefit Analysis
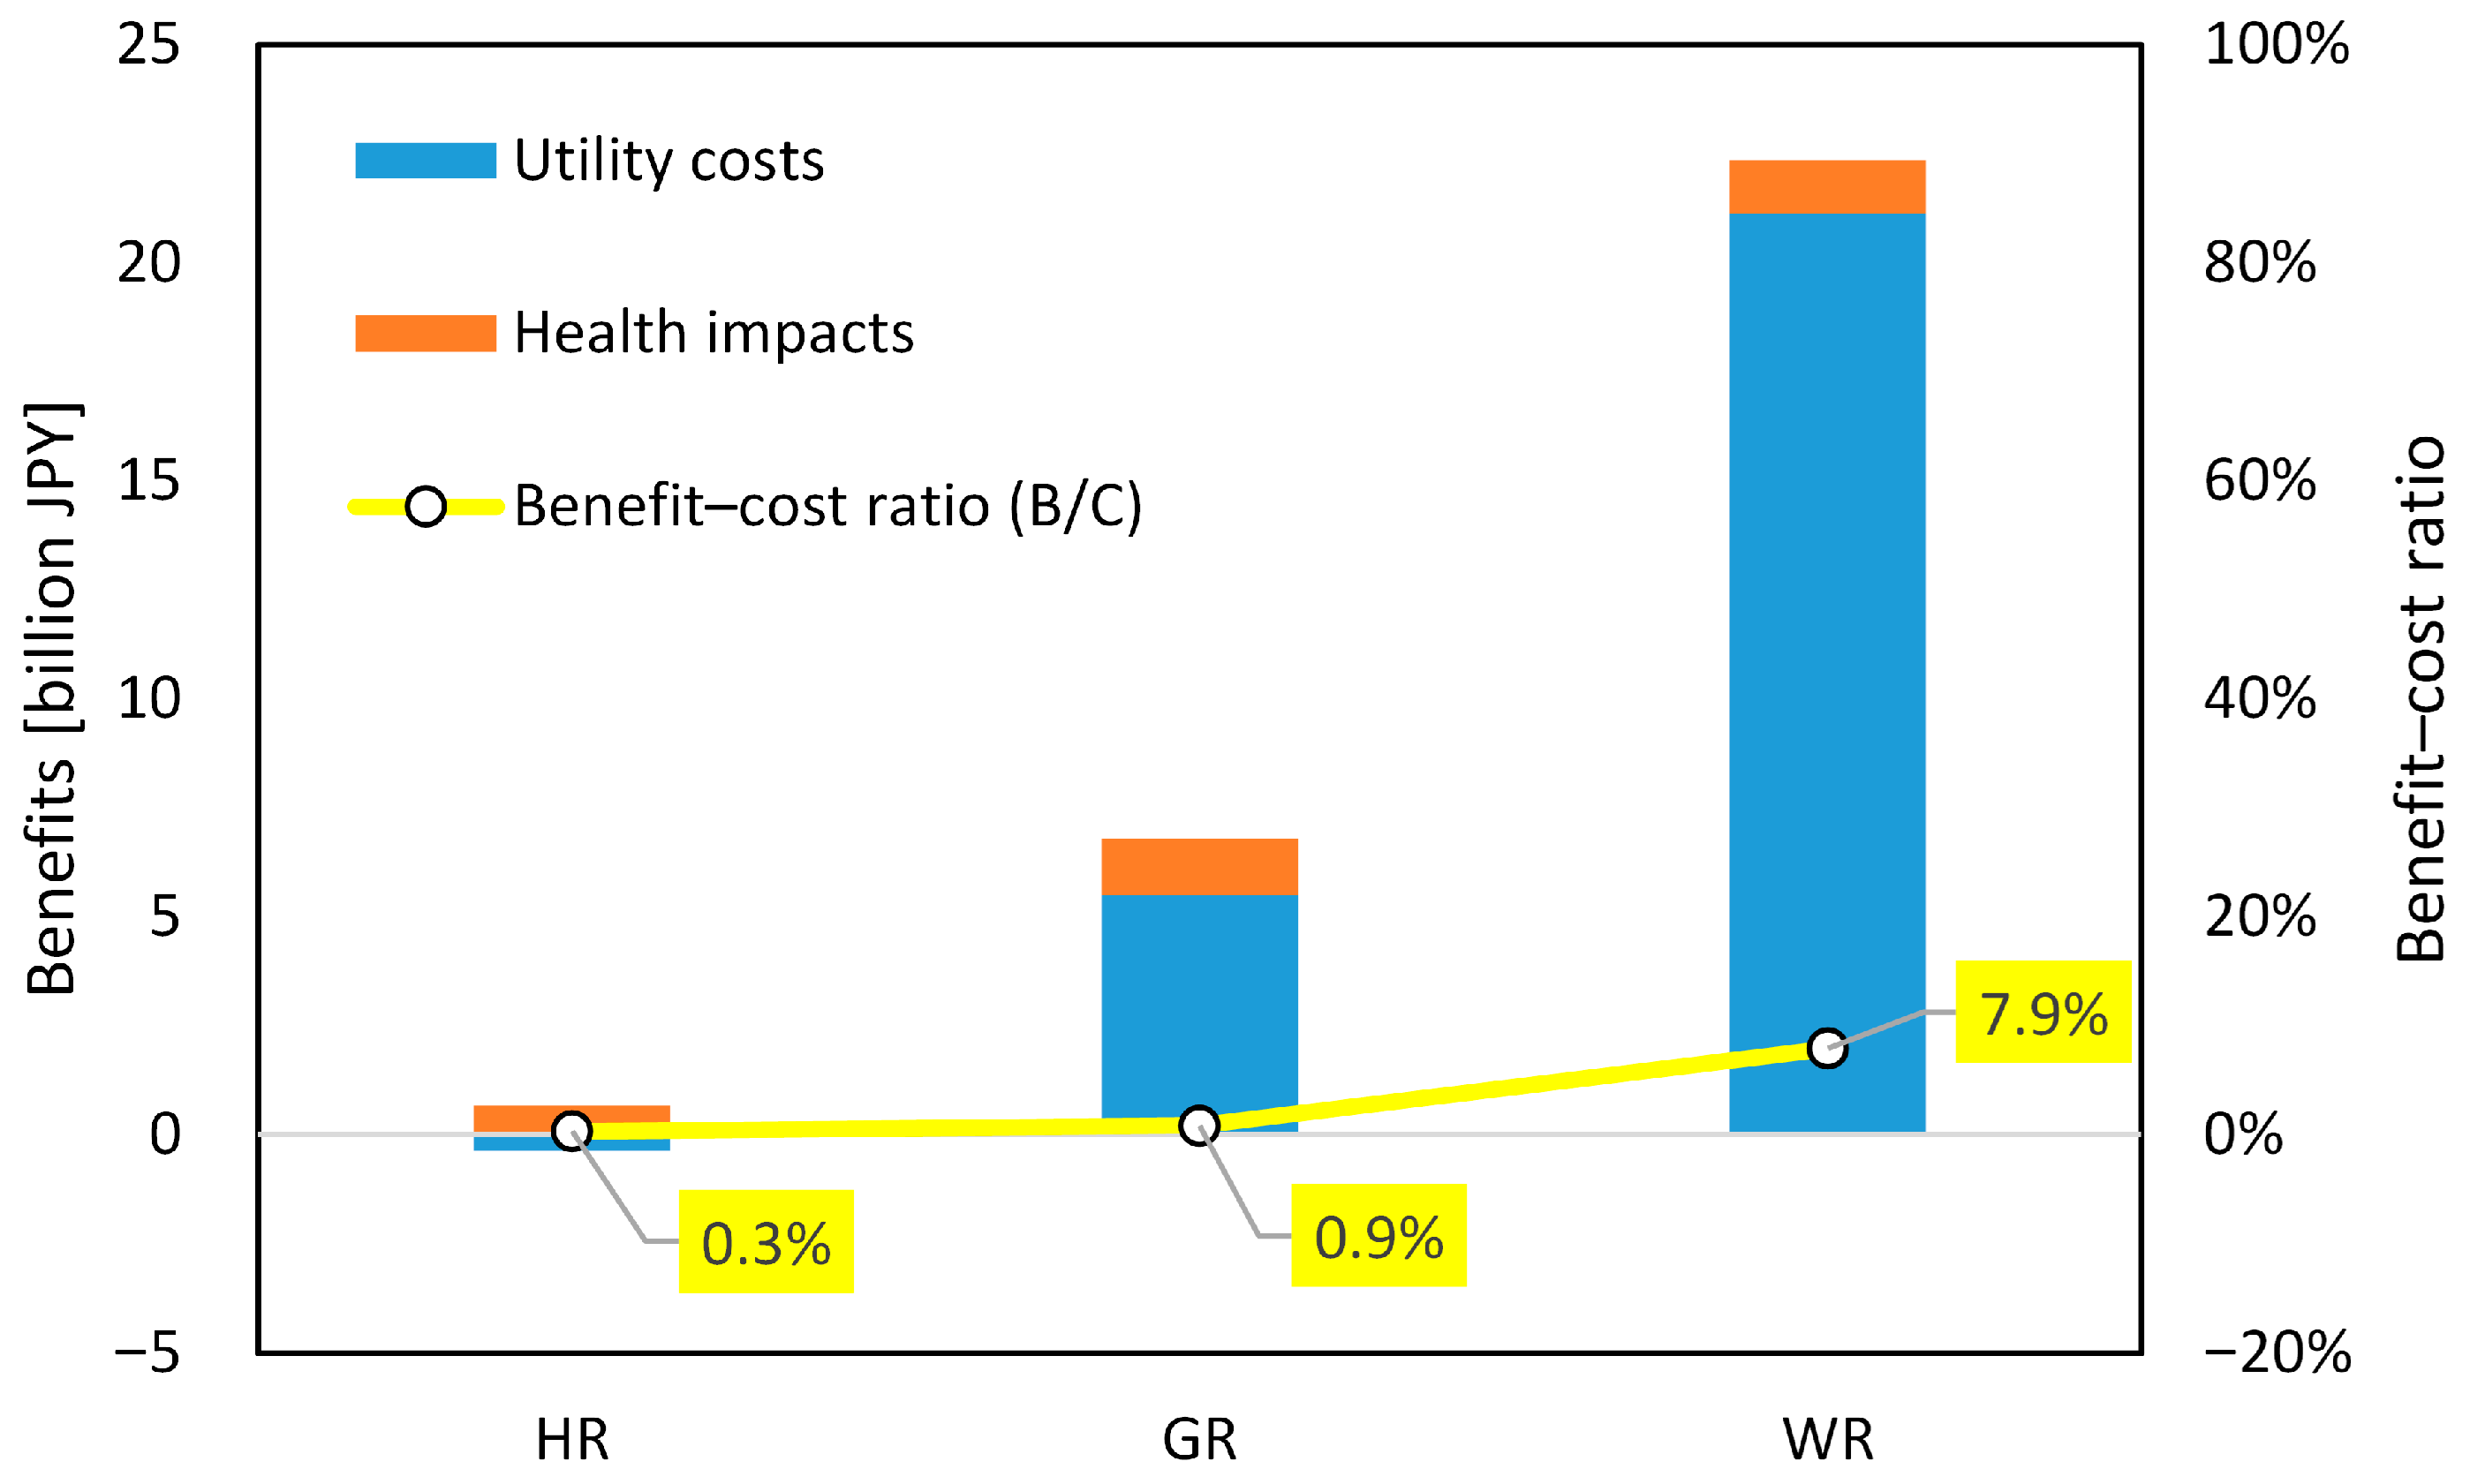
Table 7 summarizes the total costs, benefits, and B/C, while
Figure 16 presents the benefits and B/C values for each mitigation measure.
For HR, although energy cost savings of 3.4 billion JPY and 7.9 billion JPY were obtained in the office and commercial sectors, respectively, these benefits were outweighed by a loss of 11.7 billion JPY in the residential sector due to increased energy demand. As a result, the total net benefit from energy consumption amounted to a loss of 0.4 billion JPY. The impact in the residential sector is particularly large because electricity unit prices are higher than those in the office and commercial sectors. When combined with the health-related benefits, the total benefit of HR was 0.3 billion JPY.
For GR, the positive effects in the office and commercial sectors (3.2 billion JPY and 7.9 billion JPY, respectively) exceeded the residential loss (5.6 billion JPY), resulting in a net energy-related benefit of 5.5 billion JPY. Including the health-related benefit of 1.3 billion JPY, the total benefit of GR reached 6.8 billion JPY.
For WR, no wintertime penalties occur; therefore, a substantial benefit of 6.8 billion JPY was also obtained in the residential sector. As a result, the total benefit reached 21.1 billion JPY, which is the largest among all mitigation measures. Overall, the total benefits are ranked as WR > GR > HR.
In terms of costs, the order from lowest to highest is HR < WR < GR. However, the ranking of B/C values follows the same order as that of the benefits: WR > GR > HR. Despite having the lowest total cost (96.6 billion JPY), HR yields only a small benefit, resulting in a very low B/C of 0.3% and thus poor economic efficiency. Although GR achieves higher benefits than HR, its B/C remains low at 0.9%, primarily due to its high implementation cost (797.3 billion JPY). WR exhibits the highest B/C of 7.9%, owing to the absence of wintertime penalties.
Nevertheless, although all UHI mitigation measures yield positive annual total benefits, these benefits are considerably smaller than the associated costs. Consequently, none of the measures achieve a B/C exceeding 10%.
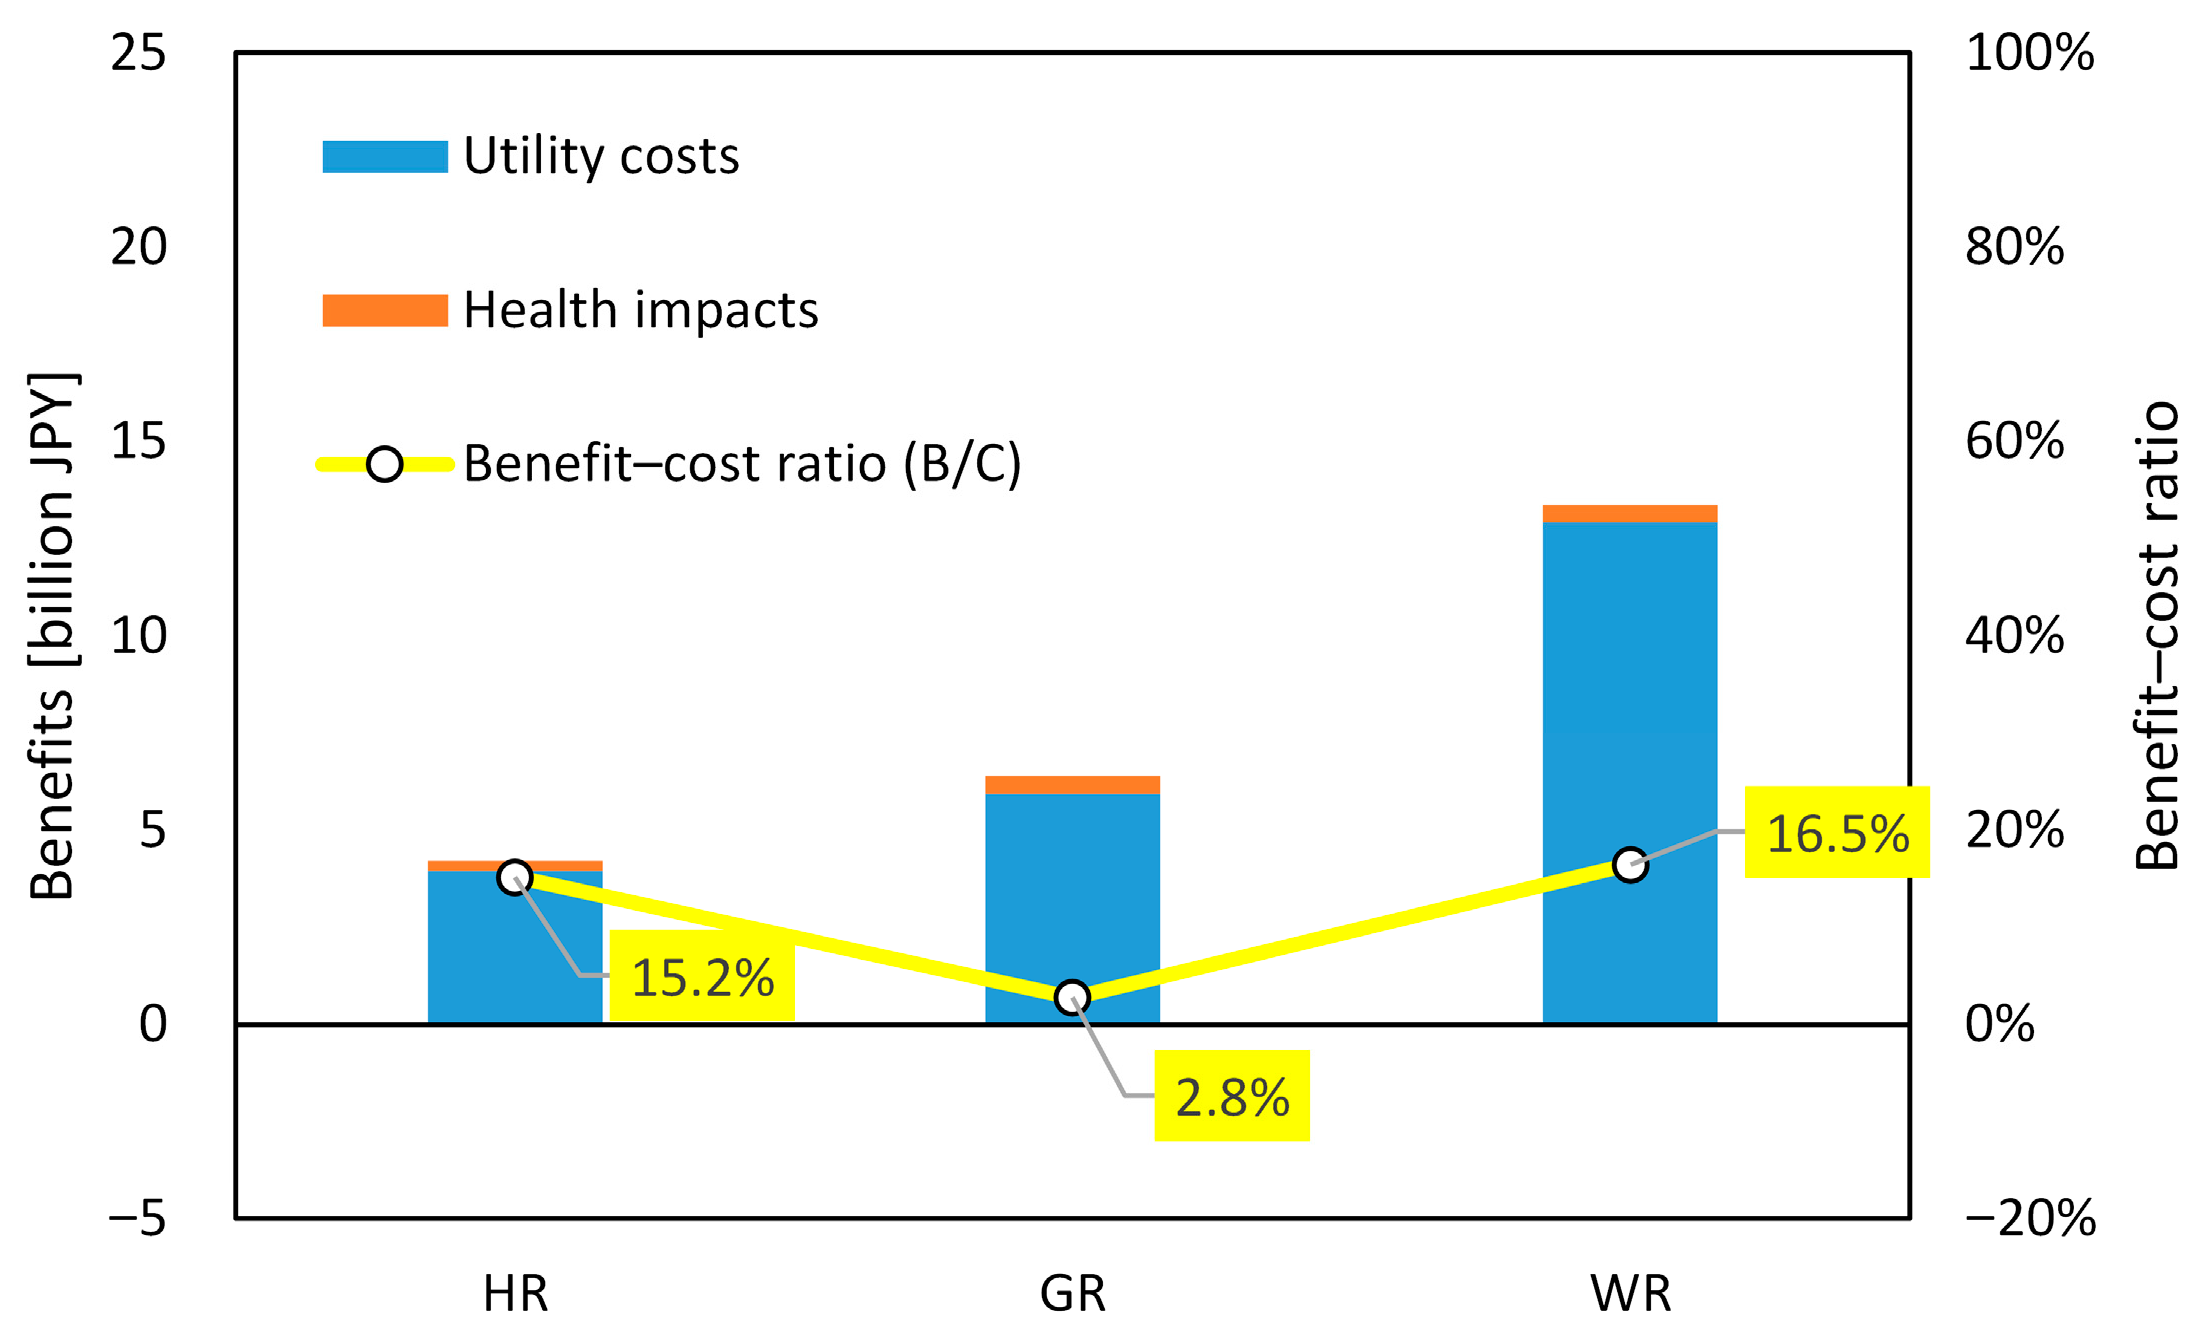
Table 8 summarizes the total costs, benefits, and B/C, and
Figure 17 shows the benefit–cost ratio in Osaka City.
Regarding benefits, HR shows a much larger total benefit in Osaka City, at 4.2 billion yen, compared with 0.3 billion yen for Osaka Prefecture as a whole. This is because the disadvantage associated with increased residential energy consumption is reduced in Osaka City. For GR, the total benefit slightly decreases from 6.8 billion yen for Osaka Prefecture to 6.2 billion yen for Osaka City. For WR, the total benefit decreases substantially from 22.3 billion yen for Osaka Prefecture to 13.4 billion yen for Osaka City.
Although the benefits increase or decrease depending on the measure, the benefit–cost ratios improve for all measures. The prefecture-wide B/C values for HR, GR, and WR are 0.3%, 0.9%, and 7.9%, respectively, whereas the corresponding values for Osaka City are 15.2%, 2.8%, and 16.5%. This improvement is mainly attributable to the reduction in implementation costs resulting from the smaller applicable area in Osaka City, where the city-to-prefecture applicable area ratio is 29%. However, even in Osaka City, all B/C values remain at around the 10% level, indicating that the economic efficiency is still limited.
4. Discussion
This study conducted a cost–benefit analysis of rooftop UHI mitigation measures—HR, GR, and WR—by integrating temperature reductions estimated using the WRF model with temperature sensitivity coefficients for energy consumption and health impacts, and subsequently converting these effects into economic indicators. The primary contribution of this study lies in the unified evaluation of energy, health, and economic impacts within a single analytical framework, explicitly incorporating seasonal trade-offs that have not been comprehensively addressed in previous studies.
A key finding is that the effectiveness of UHI mitigation measures depends not only on the magnitude of temperature reduction but also strongly on the temporal characteristics of cooling (daytime vs. nighttime) and its seasonal persistence. HR and WR primarily exhibit daytime cooling effects, whereas GR provides relatively greater cooling from evening to nighttime. These differences are directly reflected in both energy demand and health outcomes. In particular, the alignment between the timing of cooling effects and the temporal structure of energy demand is a critical determinant of mitigation effectiveness.
Furthermore, this study highlights an important issue that has received limited attention in previous research: year-round cooling measures may produce adverse effects in winter. For HR and GR, the reduction in temperature throughout the year increases heating demand in the residential sector and leads to additional health burdens such as increased cold stress. In contrast, WR, being a summer-limited measure, avoids these wintertime penalties while achieving substantial benefits. These findings underscore the importance of considering seasonal asymmetry (summer–winter trade-offs) when evaluating UHI mitigation strategies, rather than focusing solely on summer cooling effects.
In the assessment of health impacts, the use of DALYs enabled an integrated evaluation that reveals aspects not sufficiently captured in previous studies. Notably, conditions such as sleep disturbance and fatigue—despite having relatively low disability weights—were found to contribute substantially to total DALYs at the regional scale. This suggests that evaluations focusing solely on severe conditions such as heatstroke may underestimate the health benefits of UHI mitigation. Moreover, the results indicate that the temporal characteristics of cooling influence the type of health benefits: HR and WR, with stronger daytime cooling, are more effective in reducing fatigue and heat stress, whereas GR, with enhanced nighttime cooling, is particularly effective in alleviating sleep disturbance.
The cost–benefit analysis shows that WR achieves the highest total benefits and B/C, followed by GR and HR. The absence of wintertime penalties is a key advantage of WR. Although GR yields moderate benefits, its relatively high implementation cost reduces its economic efficiency, while HR exhibits lower economic performance due to wintertime disbenefits. Furthermore, when uniformly implemented across Osaka Prefecture, all measures result in low B/C values, indicating limited economic feasibility for large-scale uniform deployment. These findings suggest that targeted implementation—such as prioritizing high-density urban areas or zones with concentrated commercial activities—may be more effective than uniform application.
Compared with previous studies, this research offers three key contributions: (1) explicit quantification of wintertime disbenefits, (2) integrated assessment of health impacts using DALYs, and (3) a unified urban-scale framework combining energy, health, and economic perspectives. While many previous studies have focused primarily on summer temperature reduction or energy savings, integrated assessments incorporating seasonal trade-offs and health impacts remain limited.
However, several limitations, uncertainties, and scope constraints should be critically discussed.
First, uncertainties arise from the modeling framework and input data. This study adopts a two-step approach combining WRF-based temperature simulations and temperature sensitivity models. Although model performance was evaluated using RMSE and MBE, systematic biases may remain. However, because the analysis is based on differences between mitigation and baseline scenarios under identical model configurations, such biases are expected to largely cancel out when evaluating temperature reductions (ΔT). Therefore, their influence on the relative comparison among mitigation measures is considered limited, although temporal variations in bias may affect seasonal evaluations.
Second, this study relies on temperature sensitivity coefficients derived from historical data, primarily from the 2010s. Structural changes after 2020—such as improvements in building performance, energy efficiency, and behavioral patterns—may alter these sensitivities. While such changes may influence the absolute magnitude of estimated impacts, the fundamental relationships identified in this study, including the importance of temporal cooling characteristics and seasonal trade-offs, are primarily governed by physical mechanisms and are therefore expected to remain qualitatively robust.
Third, this study focuses on indirect effects mediated by changes in ambient air temperature and does not explicitly consider direct building-level effects, such as changes in conductive heat transfer through building envelopes. This scope was intentionally defined to evaluate public benefits in a consistent manner at the urban scale. Previous analyses by the authors suggest that such direct effects are relatively smaller than indirect effects in city-scale assessments. Nevertheless, excluding direct effects may lead to an underestimation of total benefits, particularly for HR and GR, and should be incorporated in future integrated evaluations.
Fourth, the economic evaluation is based on simplified assumptions. Costs were annualized without applying discount rates, and a representative value of 594,000 JPY/DALY was adopted based on existing studies. While these assumptions introduce uncertainty, they are applied consistently across all measures to ensure comparability. Variations in these parameters may affect absolute B/C values but are unlikely to substantially alter the relative ranking or structural differences among mitigation measures.
In addition, this study does not include several important co-benefits, such as CO2 emission reduction, stormwater management, biodiversity enhancement, peak electricity demand reduction, and improvements in urban thermal comfort. These benefits are particularly relevant for GR and WR. For instance, GR contributes to stormwater retention and ecosystem services, while WR and HR may reduce peak electricity demand during summer. Incorporating these co-benefits would likely increase the economic attractiveness of GR and WR and potentially strengthen their relative advantages. Therefore, the B/C values reported in this study should be interpreted as conservative lower-bound estimates.
Furthermore, uncertainty quantification, such as sensitivity analysis or Monte Carlo simulation, was not conducted. Although such analyses are important for policy-oriented applications, this study adopts a deterministic framework to prioritize consistent comparison among mitigation measures. Given the relatively small magnitude of temperature changes and the approximately linear relationships assumed, the main conclusions regarding relative effectiveness are considered robust. Nevertheless, future work should incorporate uncertainty analysis to improve confidence in the results.
Recent studies from the Global South further indicate that UHI mitigation benefits and implementation priorities are highly context-dependent. Elshater et al. [
31] a showed that heat exposure, noise, working hours, and socio-morphological conditions affect outdoor workers’ satisfaction in Cairo. Jha et al. [
32] a demonstrated that the cooling effects of blue-green spaces in Delhi depend on their size, connectivity, and spatial configuration. Binabid et al. [
33] also emphasized that vegetation-based cooling in hot arid climates is influenced by canopy coverage, vegetation type, urban configuration, and local climate, while water availability, maintenance, and equity remain important constraints. These findings suggest that future applications of the proposed framework should consider local climatic, social, and infrastructural conditions.
Finally, the applicability of the findings to other regions should be considered with caution. Since this study focuses on Osaka Prefecture, differences in climate, urban morphology, and socio-economic conditions may influence the effectiveness of mitigation measures. However, the fundamental insights obtained in this study—particularly the importance of temporal cooling characteristics and seasonal trade-offs—are expected to be broadly applicable.
5. Conclusions
This study quantitatively evaluated the impacts of rooftop urban heat island (UHI) mitigation measures—highly reflective roofs (HR), green roofs (GR), and rooftop water sprinkling (WR)—on outdoor air temperature, energy consumption, and human health in Osaka Prefecture and conducted an integrated cost–benefit analysis.
The results highlight three key findings.
First, the effectiveness of UHI mitigation measures is strongly governed by the temporal characteristics of cooling effects. HR and WR primarily provide daytime cooling, whereas GR exhibits stronger cooling from evening to nighttime. These differences directly influence both energy demand patterns and health outcomes, indicating that the timing of temperature reduction is as important as its magnitude.
Second, this study quantitatively demonstrates the importance of seasonal trade-offs, particularly the wintertime penalty associated with year-round cooling measures. While HR and GR reduce cooling demand in summer, they increase heating demand in winter, especially in the residential sector. This seasonal asymmetry significantly affects both energy consumption and health impacts, highlighting the necessity of year-round evaluation rather than a summer-only perspective.
Third, among the examined measures, WR exhibits the most favorable overall performance, achieving the largest energy savings and high health benefits while avoiding wintertime penalties. In contrast, although GR provides important benefits through nighttime cooling and improvements in sleep-related health outcomes, its high implementation cost reduces its economic efficiency. HR shows relatively limited overall benefits due to wintertime disadvantages.
From a policy perspective, the findings suggest that uniform large-scale implementation is not economically optimal, as all measures show relatively low B/C when applied across the entire prefecture. Instead, targeted deployment strategies should be prioritized. Specifically, WR is particularly suitable for high-density urban and commercial areas due to its strong daytime cooling and absence of winter penalties. GR is effective in residential areas with high nighttime population density, where improvements in sleep quality are critical. HR should be applied selectively, with careful consideration of regional climate and building use, especially in areas with significant heating demand.
It should be noted that the B/C values reported in this study represent a conservative lower bound of the potential economic performance of the examined measures. This is because the present analysis focuses on indirect benefits associated with changes in ambient outdoor air temperature, namely changes in energy consumption and health impacts, and does not include direct building-level energy savings or ecosystem co-benefits. In particular, the direct effects of rooftop measures on building heat loads, as well as additional co-benefits such as stormwater management, biodiversity enhancement, improved urban amenity, and other ecosystem services, were outside the scope of this study. Including these effects would likely increase the estimated benefits, especially for GR and WR.
These implications are relevant not only for Osaka but also for high-density cities in Japan and globally, where similar climatic conditions and urban structures exist. The results emphasize that effective UHI mitigation requires an integrated approach that accounts for temporal dynamics, seasonal trade-offs, and sector-specific impacts, rather than relying solely on peak summer cooling performance.
Overall, the framework proposed in this study provides a basis for evidence-based decision-making in urban thermal environment mitigation. Future research should focus on integrating direct building-level effects, conducting spatially explicit analyses, and incorporating additional co-benefits such as ecosystem services and stormwater management to further enhance the comprehensiveness of UHI mitigation assessments.