Article

Causation Analysis of Maritime Accidents Based on Coupled AcciMap and GCN Model

1
State Key Laboratory of Maritime Technology and Safety, Wuhan University of Technology, Wuhan 430063, China
2
Changjiang Waterway Institute of Planning and Design, Wuhan 430040, China
3
Yangtze River Communications Administration, Ministry of Transport, Wuhan 430010, China
*
Authors to whom correspondence should be addressed.
Sustainability 2026, 18(10), 4700; https://doi.org/10.3390/su18104700
Submission received: 26 March 2026 / Revised: 17 April 2026 / Accepted: 1 May 2026 / Published: 8 May 2026
(This article belongs to the Section Sustainable Transportation)

Abstract

With the development of sustainable inland waterway transportation, maritime safety has become a matter of wide concern. Causation analysis of ship accidents is known as an important prerequisite for achieving waterborne transportation safety. A novel AcciMap–graph convolutional network (GCN)-based causation analysis model has been proposed for maritime traffic accidents in the main Yangtze River waterway. Mutual information, a grey wolf optimizer (GWO), a dropout layer and weakly supervised learning are introduced to obtain causal chains and the causal importance scores of accident causes. The results indicate that, compared with baseline models (e.g., GIN, GAT, APPNP, and GraphSAGE), the AcciMap–GCN model achieved the lowest values for all performance metrics, with an MAE of 0.0820, an RMSE of 0.1694, and a training convergence epoch of 74. The model robustness was comprehensively investigated through ablation experiments. Based on the causal importance scores of accident causes, maritime safety administration strategies are systematically proposed. The present study provides a novel perspective for analyzing the causal relationships of maritime accidents and shares useful insights into sustainable waterway transportation.

1. Introduction

With the rapid development of sustainable inland waterway transport, representative navigation vessels are trending toward larger sizes and higher speeds. Owing to the dynamic hydrological and meteorological conditions, vessel traffic flows show complex features and thus pose significant challenges to inland navigation safety in the Yangtze River. Ship accidents result in significant economic losses, environmental pollution and even casualties. It is necessary to carry out the cause analysis of ship accidents to enhance maritime safety. Accident causation analysis generally refers to the systematic characterization of the causal relationships and pathways among accident-causing factors. It aims to reveal the underlying causal mechanisms and evolutionary processes. Thus, the critical intervention points which provide causal evidence for accident risk control and safety decision making can be effectively identified.
In recent years, great progress has been made in the research field of accident causation analysis. Commonly used models include Bayesian networks [1,2,3], complex network theory [4,5,6,7] and fault trees [8,9,10,11], which support the risk assessment and safety management of maritime accidents. On the basis of the literature and accident reports, Yin et al. [12] investigated causal relationships by employing the expert judgment method and fuzzy Bayesian risk analysis approach. The authors demonstrated that insufficient language proficiency and communication problems are the most critical risk-influencing factors in maritime accidents. Liu et al. [13] proposed a data-driven Bayesian network and identified the key risk-influencing factors and critical scenarios in coastal waters. By collecting 564 official reports, Yang et al. [14] studied the highly influential static risk factors through complex network theory combined with Natural Language Processing (NLP). Five typical risk propagation patterns were extracted, which provided effective guidance for maritime safety management. Zhang et al. [15] evaluated the key risk factors via a complex network model and quantified the levels of various risk indicators, sharing useful insights into ship accident analysis and prevention. Ugurlu et al. [16] used fault tree analysis to identify the main causes of ship collision accidents and concluded that 94.7% of collisions were related to human factors. Although these methods identify the key contributing factors of accidents to a certain extent, they fail to uncover the deep-seated causes and relationships that lead to accidents, and they also have certain deficiencies in handling massive accident data scenarios. In inland waterways with dense vessel traffic (e.g., the Yangtze River waterway), the coupling of various risk-influencing factors poses a challenge to the causation analysis of maritime accidents.
With the advent of the big data era, neural network (NN) models [17,18,19,20] have been gradually applied in causal relationship analysis. Among these, the graph neural network (GNN) model has gained widespread adoption due to its ability to handle graph-structured datasets. Chen et al. [21] employed the GNN method to identify the accident chain in oil and gas pipeline incidents, simulating complex spatial and temporal dependencies and achieving early prediction of accidents. Wang et al. [22] constructed a fault causality-directed graph and employed the GNN method to conduct causal diagnosis for the nuclear power plant system. The effectiveness of their method was further verified using simulated data. Gan et al. [23] converted the textual data of maritime accident reports into graph data and predicted accident causal relationships via a graph convolutional network (GCN). Compared with conventional GNNs, the GCN-based model demonstrated superior effectiveness. Liu et al. [24] applied causal inference-based NN, and conducted decile-level causal intervention analysis on key contributing variables (e.g., ship characteristics and port-state control inspection). Thus, their impact on the incidence rate and severity of various maritime accidents could be quantified. Although NN methods can effectively capture the importance of causal factors and have made certain progress in the causation analysis of maritime accidents, they cannot infer the relationships among various factors within different levels of causal factors, lacking a systematic method for analyzing the causal factors of accidents.
The AcciMap model provides causal relationships characterized by high connectivity, compact structure, and clear hierarchical organization. Furthermore, it captures the complex causal links both horizontally and vertically. Lee et al. [25] conducted causation analysis of South Korean Sewol ferry accidents via an AcciMap model. By leveraging a multi-hop information propagation mechanism, GCN achieves feature aggregation and fully captures both intra-layer and inter-layer causal relationships in AcciMap. Moreover, GCN features weight-sharing mechanisms, enabling it to integrate vast amounts of causal edge information without requiring additional parameters. The integration of AcciMap and GCN yields a multi-level accident causation analysis framework, which depicts the complex dependencies among different nodes. An AcciMap-GCN-based causation analysis model has been proposed to reveal the underlying causal relationships in the main Yangtze River waterway. This study bridges the research gap between graph neural networks and maritime accident models, enables an effective investigation of relationships among risk-influencing factors and facilitates its application in maritime safety management. The remainder of this paper is structured as follows. A brief introduction of the AcciMap-graph neural network-based model is provided in Section 2. The research materials and data pre-processing methods are thoroughly demonstrated in Section 3. Subsequently, the model application results in the Yangtze River waterway are elaborated in Section 4, together with model discussion. Section 5 concludes the paper and outlines future research directions.

2. AcciMap-Graph Neural Network-Based Model

The AcciMap model has been utilized to derive node graphs for each ship accident. GCN is introduced to analyze both intra-layer and inter-layer causal relationships among node graphs, thereby revealing causal importance scores of each node and constructing an AcciMap-GCN-based causation analysis model.
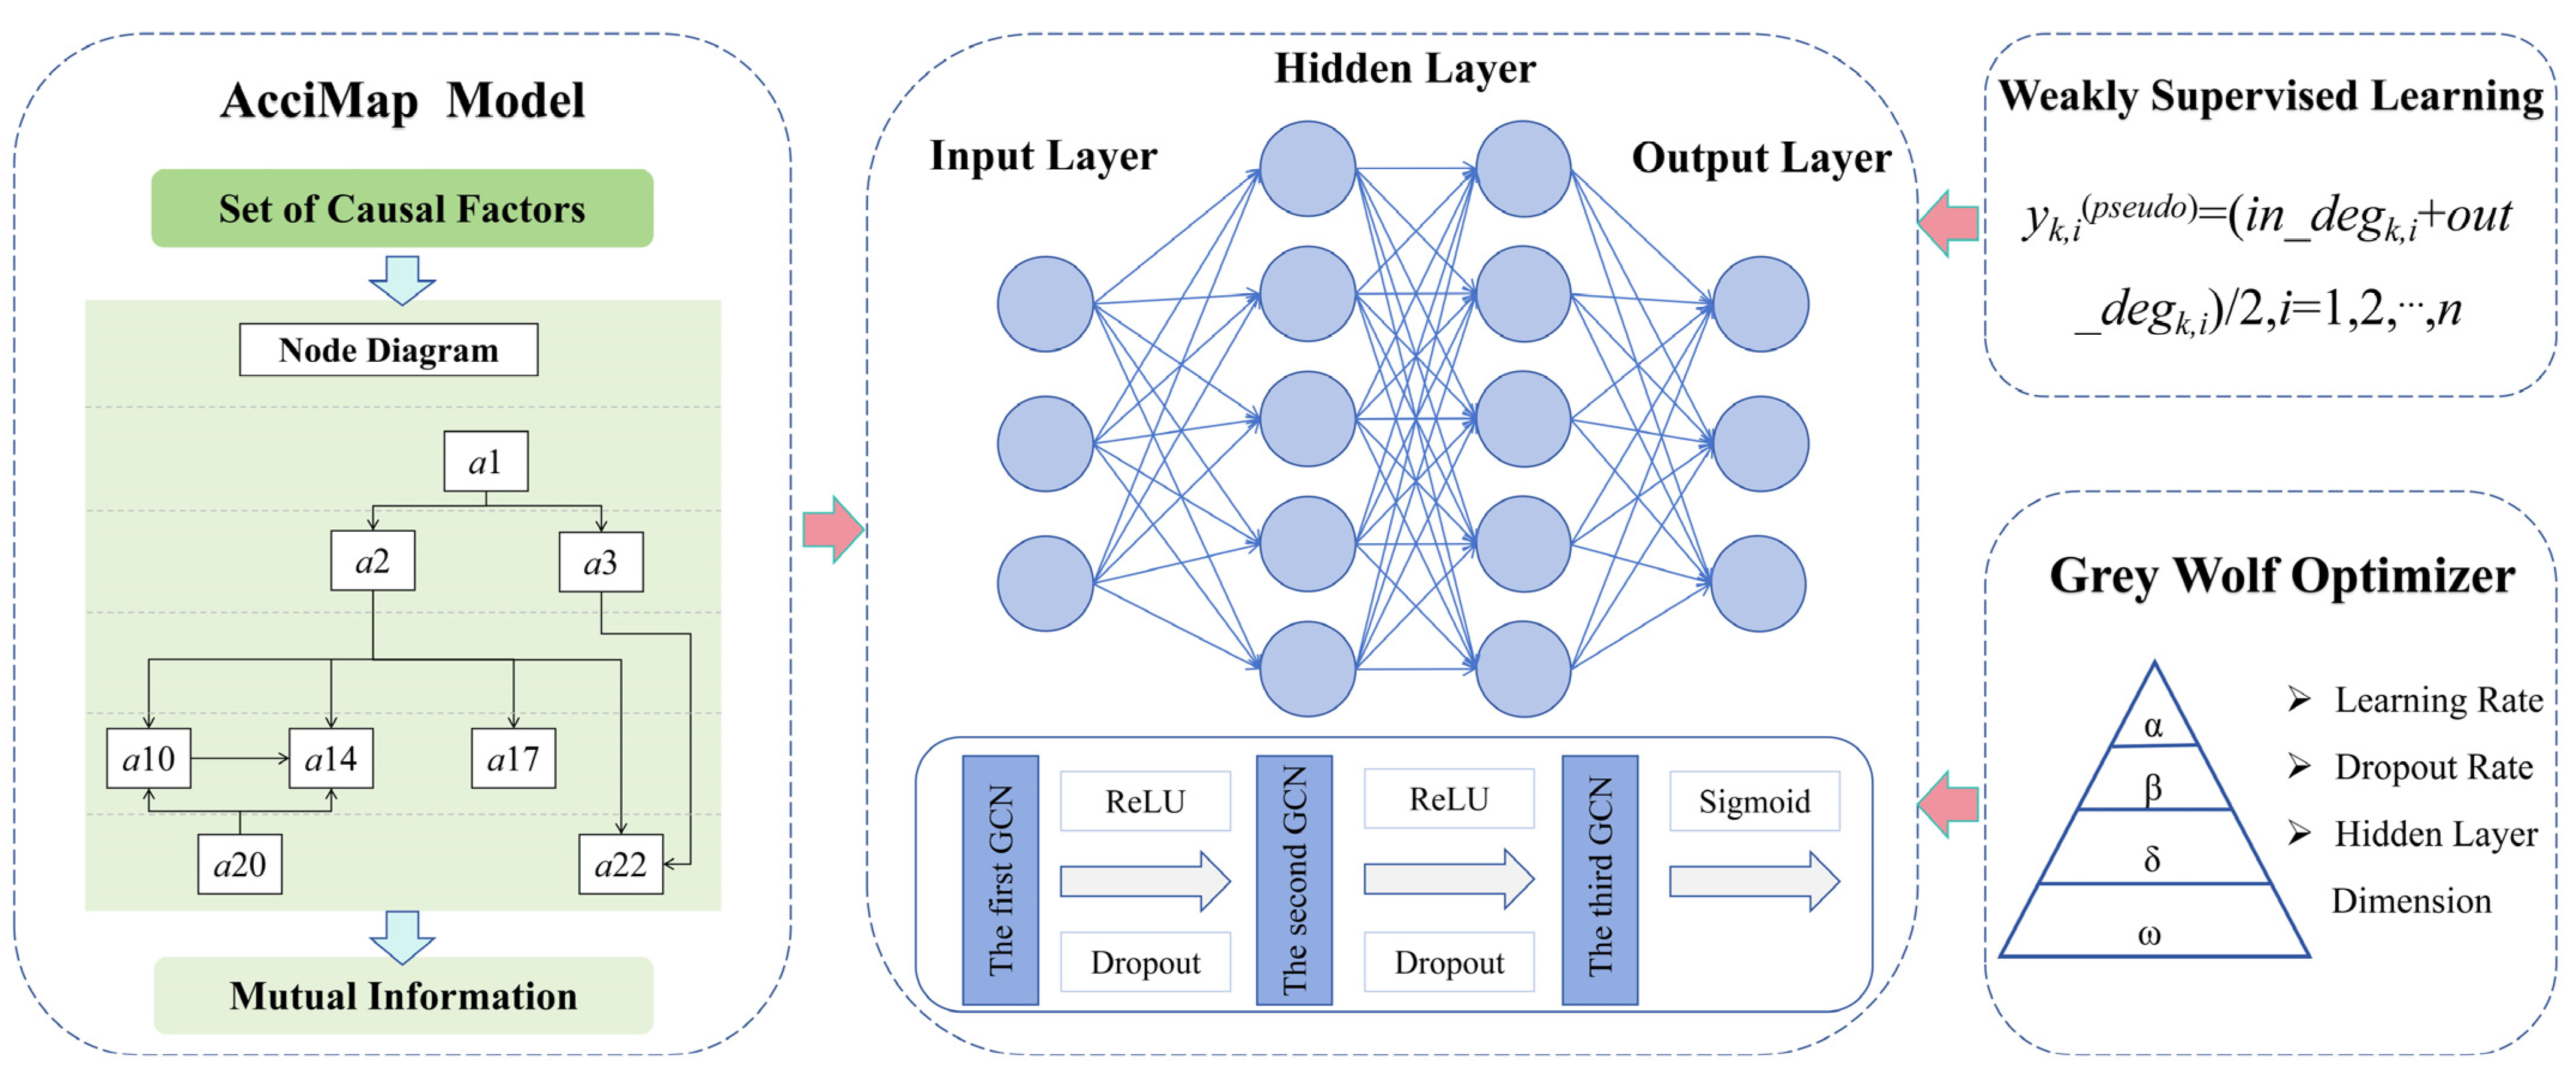
By means of inductive analysis, the AcciMap node graph is obtained to construct adjacency matrixes. Mutual information is adopted to compute the weights of model input layer, while hyperparameters of GCN (e.g., learning rate, hidden layer dimensions, Dropout rate) were optimized through grey wolf optimizer algorithm (GWO). In the present study, a three-layer GCN is employed for model training, with the first two convolutional layers adopting ReLU as the activation function and incorporating Dropout layers to randomly deactivate certain neurons to prevent overfitting. The final convolutional layer employs the Sigmoid activation function. Additionally, a weakly supervised learning algorithm is integrated to capture the structural information. Through model training and optimization, the causal importance score of each node is ultimately obtained, providing a foundation for causation analysis of maritime accidents. Furthermore, appropriate maritime safety strategies could be formulated. The framework of the proposed AcciMap-GCN model is illustrated in Figure 1.

2.1. Input Layer

2.1.1. AcciMap Node Graph Construction

In the AcciMap-based causation analysis model, six hierarchical levels (i.e., government policies and budgets, regulatory authorities and associations, relevant enterprise management, technology and operations management, accident progress and personnel activities, equipment and environment) are defined as first level causes. Following the characteristics of different types of accidents, the first level causes can be further subdivided into a number of second level causes [26].
Generally, secondary contributing factors are assigned to the corresponding first level causes to construct a risk influencing factor set based on the AcciMap model. These factors are numbered as a1, a2, …, ai, …, a25. Furthermore, accident investigation reports are utilized to construct several AcciMap frameworks according to the set of risk-influencing factors. The specific operational procedures are described as below:
  • Place the set of causal factors into the AcciMap model, construct first level and secondary level causal factors, and assign numbers to the secondary level causal factors.
  • A total of 141 maritime accident investigation reports of the Yangtze River waterway were reviewed. More attention was paid to the sections concerning accident causation analysis and safety management recommendations, thus identifying the contributors of maritime accidents.
  • The causal relationships among the second-level contributors in each report were extracted and represented by directed arrows, yielding several AcciMap node diagrams.
The edges are determined based on whether the accident investigation report explicitly or implicitly indicates that one factor influences another. In such cases, a directed edge is established between the corresponding nodes, with a direction from cause to effect. The coding was independently conducted by seven experts (i.e., three scientific researchers, two maritime authorities, and two captains) with rich experience in maritime safety research. The results were then summarized and discussed to reach a consensus, ensuring the rationality of the coding process.

2.1.2. Construction of the Adjacency Matrix

When training a GCN using the AcciMap model, the node graphs need to be transformed into adjacency matrices recognizable by GCN. The adjacency matrix is essentially an N × N matrix, where N represents the number of nodes in the graph. It is assumed that the initial features of each node are independent and equivalent. The adjacency matrix which represents the node features is formally defined as follows [27]:
A i , j = 1 , v i , v j E 0 , v i , v j E
where v i and v j represent nodes, and E denotes the set of edges in the graph. When an edge exists between v i and v j , A ( i ,   j ) is assigned a value of 1; otherwise, A ( i ,   j )   =   0 .

2.1.3. Introduction of Mutual Information

To enhance the model’s early learning capability, mutual information is introduced to characterize the statistical relationship between initial nodes. Mutual information measures the amount of information one random variable contains about another [28]. The mutual information weighted matrix is used as the initial edge weight to enhance the model’s structural awareness. Given two random variables X and Y, the mutual information is defined as follows:
I X ; Y = y Y x X p x , y log p x , y p x p y
where X and Y represent any two causation factors; p ( x ,   y ) is the joint probability distribution of X and Y; p ( x ) and p ( y ) denote the marginal density distributions of X and Y, respectively. Mutual information is computed based on the edge co-occurrence, and is further used to assign weights to edges.
In the present study, causation analysis is conducted for vessels in the accident investigation reports, which are treated as independent modeling units. The data are split at the level of vessel in accident, with a ratio of 8:2 for model training and testing, respectively. Therefore, the potential information leakage could be effectively avoided.

2.2. Grey Wolf Optimization Algorithm (GWO)

GWO is a population-based metaheuristic algorithm inspired by the social hierarchy and hunting behavior of grey wolves in nature [29]. It has been widely applied in various research fields, including path planning [30], traffic flow prediction [31], and environmental sustainability [32]. It is featured by simple structure, fewer control parameters, strong global search capability, and good convergence performance. Moreover, it achieves a reasonable balance between global exploration and local exploitation, thus effectively avoiding premature convergence [33]. Provided a grey wolf population of N individuals in a D-dimension search space, the position of the i-th grey wolf is denoted as Xi = (X1(1), X2(2), …, Xi(D)). The hunting behavior of the wolf pack can be further described as follows:
(1)
Encirclement behavior
When prey is detected, grey wolves encircle it. The mathematical formulae are written as follows:
D = C X P t X t
X t + 1 = X P t A D
where D is the distance between the wolf and the prey; t is the current iteration number; X P ( t ) is the position vector of the prey at iteration t; X ( t ) is the position vector of the grey wolf. The coefficient vectors A and C are computed as below:
A   =   2 a ( r 1 1 )
C = 2 r 2
where r 1 and r 2 are random scalars in [0, 1]; a is a convergence factor linearly decreasing from 2 to 0.
(2)
Hunting behavior
The grey wolf pack is led by α, β and δ, which gradually approach the prey. Equations (7)–(9) represent the distances between wolves α, β, δ and the prey. Equations (10)–(12) describe the updates of their position vectors. Equation (13) shows the position update of ω wolves, which follows the positions of the other three wolves.
D α = C 1 X α t X t
D β = C 2 X β t X t
D δ = C 3 X δ ( t ) X ( t )
X 1 ( t + 1 ) = X α ( t ) A 1 D α
X 2 ( t + 1 ) =   X β ( t )   A 2 D β
X 3 ( t + 1 ) = X δ ( t ) A 3 D δ
X ( t + 1 ) = X 1 ( t + 1 ) + X 2 ( t + 1 ) + X 3 ( t + 1 ) 3
where X α ( t ) , X β ( t ) , X δ ( t ) denote the position vectors of wolves α, β, δ at iteration t; D α , D β , D δ represent the distances to the prey; X 1 ( t + 1 ) , X 2 ( t + 1 ) , X 3 ( t + 1 ) are the updated positions; X ( t ) represents the position of the ω wolves.

2.3. Graph Convolutional Network (GCN)

GCN updates node feature representations by aggregating information from the local neighborhoods. It relies on the spectral graph theory based on the Laplacian matrix and the Fourier transform [15]. Given a graph G = (V, E), where V is the set of nodes and E is the set of edges, the graph can be represented by an adjacency matrix A. The standard Laplacian matrix is defined as follows [34]:
L = DA
where D is the degree matrix, a diagonal matrix with elements D ii = j A ij . The symmetric normalized Laplacian is demonstrated as follows:
L ~ = I D 1 2 AD 1 2
For a three-layer GCN, the first two layers adopt the ReLU activation function, while the last layer uses a Sigmoid activation function. The forward propagation formula is written as below:
f ( X ,   A ) = σ ( A ^ ReLU ( A ^ ReLU ( A ^ X W ( 0 ) ) W ( 1 ) ) W ( 2 ) )
A ^ = D ~ 1 2 A ~ D ~ 1 2
where f ( X ,   A ) denotes the predicted output; X is the adjacency matrix; W ( 0 ) , W ( 1 ) , W ( 2 ) are the weight matrices of the three layers.

2.4. Dropout Layer

To enhance the generalization ability of the GCN model and prevent overfitting, Dropout layers are added to the first two layers. Dropout is a commonly used regularization technique that randomly deactivates neurons and their connections during training, reducing inter-neuron dependency. The network is represented as follows:
y i l + 1 = f ω i l + 1 y l + b i l + 1
where ω i l + 1 denotes the weight of the (l+1)-th hidden layer; y l is the input vector of the lth hidden layer; b i l + 1 represents the bias; f denotes the activation function. The architecture of the network can be further obtained.
r j l = Bernoulli p
y ~ j ( l ) = r j ( l ) y j ( l )
y i ( l + 1 ) = f ( w i ( l + 1 ) y ~ l + b i ( l + 1 ) )
where r j l is a Bernoulli random vector with retention probability p. ⊙ denotes element-wise multiplication. The resulting y j ( l ) serves as an input of the next layer, as shown in the learning operation of Equation (21).

2.5. Weakly Supervised Learning Training

Weakly supervised learning [35] training can be achieved with minimal labeled data. Therefore, it is employed to better identify the importance of different nodes since labeled target data are absent in the present study. It effectively constructs pseudo-labels for model training, thereby achieving robust predictive performance [36,37]. The pseudo-labels are generated based on the structural characteristics of each node in the AcciMap graph, as defined in Equation (22).
y ^ k , i ( pseudo ) = in _ deg k , i + out _ deg k , i 2 ,   i = 1 , 2 ,   ,   n
where y ^ k , i ( pseudo ) denotes the pseudo-label of the i-th node in the k-th adjacency matrix; in _ deg k , i and out _ deg k , i denote the in-degree and out-degree of the i-th node, respectively; n represents the total number of adjacency matrices. The pseudo-labels are subsequently normalized and mapped within the range of [0, 1].
The mean squared error (MSE) between predicted scores and pseudo-labels is adopted as a loss function.
l k = 1 n i = 1 n ( y ^ k , i y ^ k , i ( pseudo ) ) 2
where l k represents the loss for the k-th adjacency matrix; y ^ k , i denotes the predicted causal importance score of the i-th node in the k-th adjacency matrix.

2.6. Output Layer

To obtain the overall node importance features, the predicted causal importance scores of each node across all AcciMap graphs are averaged. By applying normalization to the results, a dimensionless importance score of each node is obtained. The calculation formula is written as follows:
y - i = 1 N k = 1 N y ^ k , i
where y - i denotes the averaged causal importance score of node i; y ^ k , i is the score of the i-th node in the k-th AcciMap graph; N = 209 in the present study. To enhance the interpretability and visualization of the model results, the normalized scores are linearly enlarged to the range of [0, 10].

2.7. Model Performance Evaluation Metrics

To validate the model’s performance in terms of causal importance scores, various metrics have been employed, namely Mean Absolute error (MAE), Root Mean Square Error (RMSE). Their definitions are provided as follows:
M A E = 1 n i = 1 n y ^ i y ^ i ( p s e u d o )
R M S E = 1 n i = 1 n y ^ i y ^ i ( p s e u d o ) 2
where y ^ i is the predicted value; y ^ i ( pseudo ) denotes the pseudo-label value. Meanwhile, Epochs to converge is also adopted to assess the model efficiency.

2.8. Implementation of AcciMap-GCN Model

The core workflow of the coupled AcciMap-GCN model for computing the importance scores of accident causation factors is demonstrated by Algorithm 1 as follows:
Algorithm 1: AcciMap–GCN Framework for Maritime Accident Analysis
      Input: D = {d1, d2, …, dN}: Maritime Accident Investigation Reports
      Output: importance scores of accident factor S
1 Extract accident causation-related text from D
2 Identify accident factors and map them into predefined categories
3 for each ship accident report d∈D do
4     Construct a multi-level AcciMap structure
5     Identify relationships among accident factors
6     Build a directed node graph Gd
7 end for
8 for each graph Gd do
9     Convert Gd into adjacency matrix Ad
10   Initialize node feature matrix Xd
11   Compute mutual information between nodes based on co-occurrence
12   Update node features Xd using mutual information weights
13 end for
14 Construct dataset {Xd}
15 Split dataset into training dataset and testing dataset (e.g., 8:2)
16 Initialize hyperparameter search space for GCN
17 Apply Grey Wolf Optimizer (GWO) to obtain optimal parameters
18 Initialize GCN model with optimized parameters
19 Generate pseudo-labels via weakly supervised learning
20 Training GCN by using {Xd}
21 Obtain node scores from trained GCN
22 Normalize node scores within each graph
23 Aggregate node scores across all graphs
24 Compute final importance score S
25 return S

3. Materials and Data Pre-Processing

3.1. Data Sources

To study the basic characteristics of maritime accidents in the main Yangtze River waterway, the official maritime accident investigation reports were systematically collected for a time period of January 2015 to April 2025. A total number of 141 official reports have been obtained through the maritime safety administration of P.R. China and GISIS database of International Maritime Organization (IMO), as shown in Table 1.

3.2. Spatial–Temporal Characteristics of Maritime Accidents

3.2.1. Distribution Pattern of Ship Accident Types

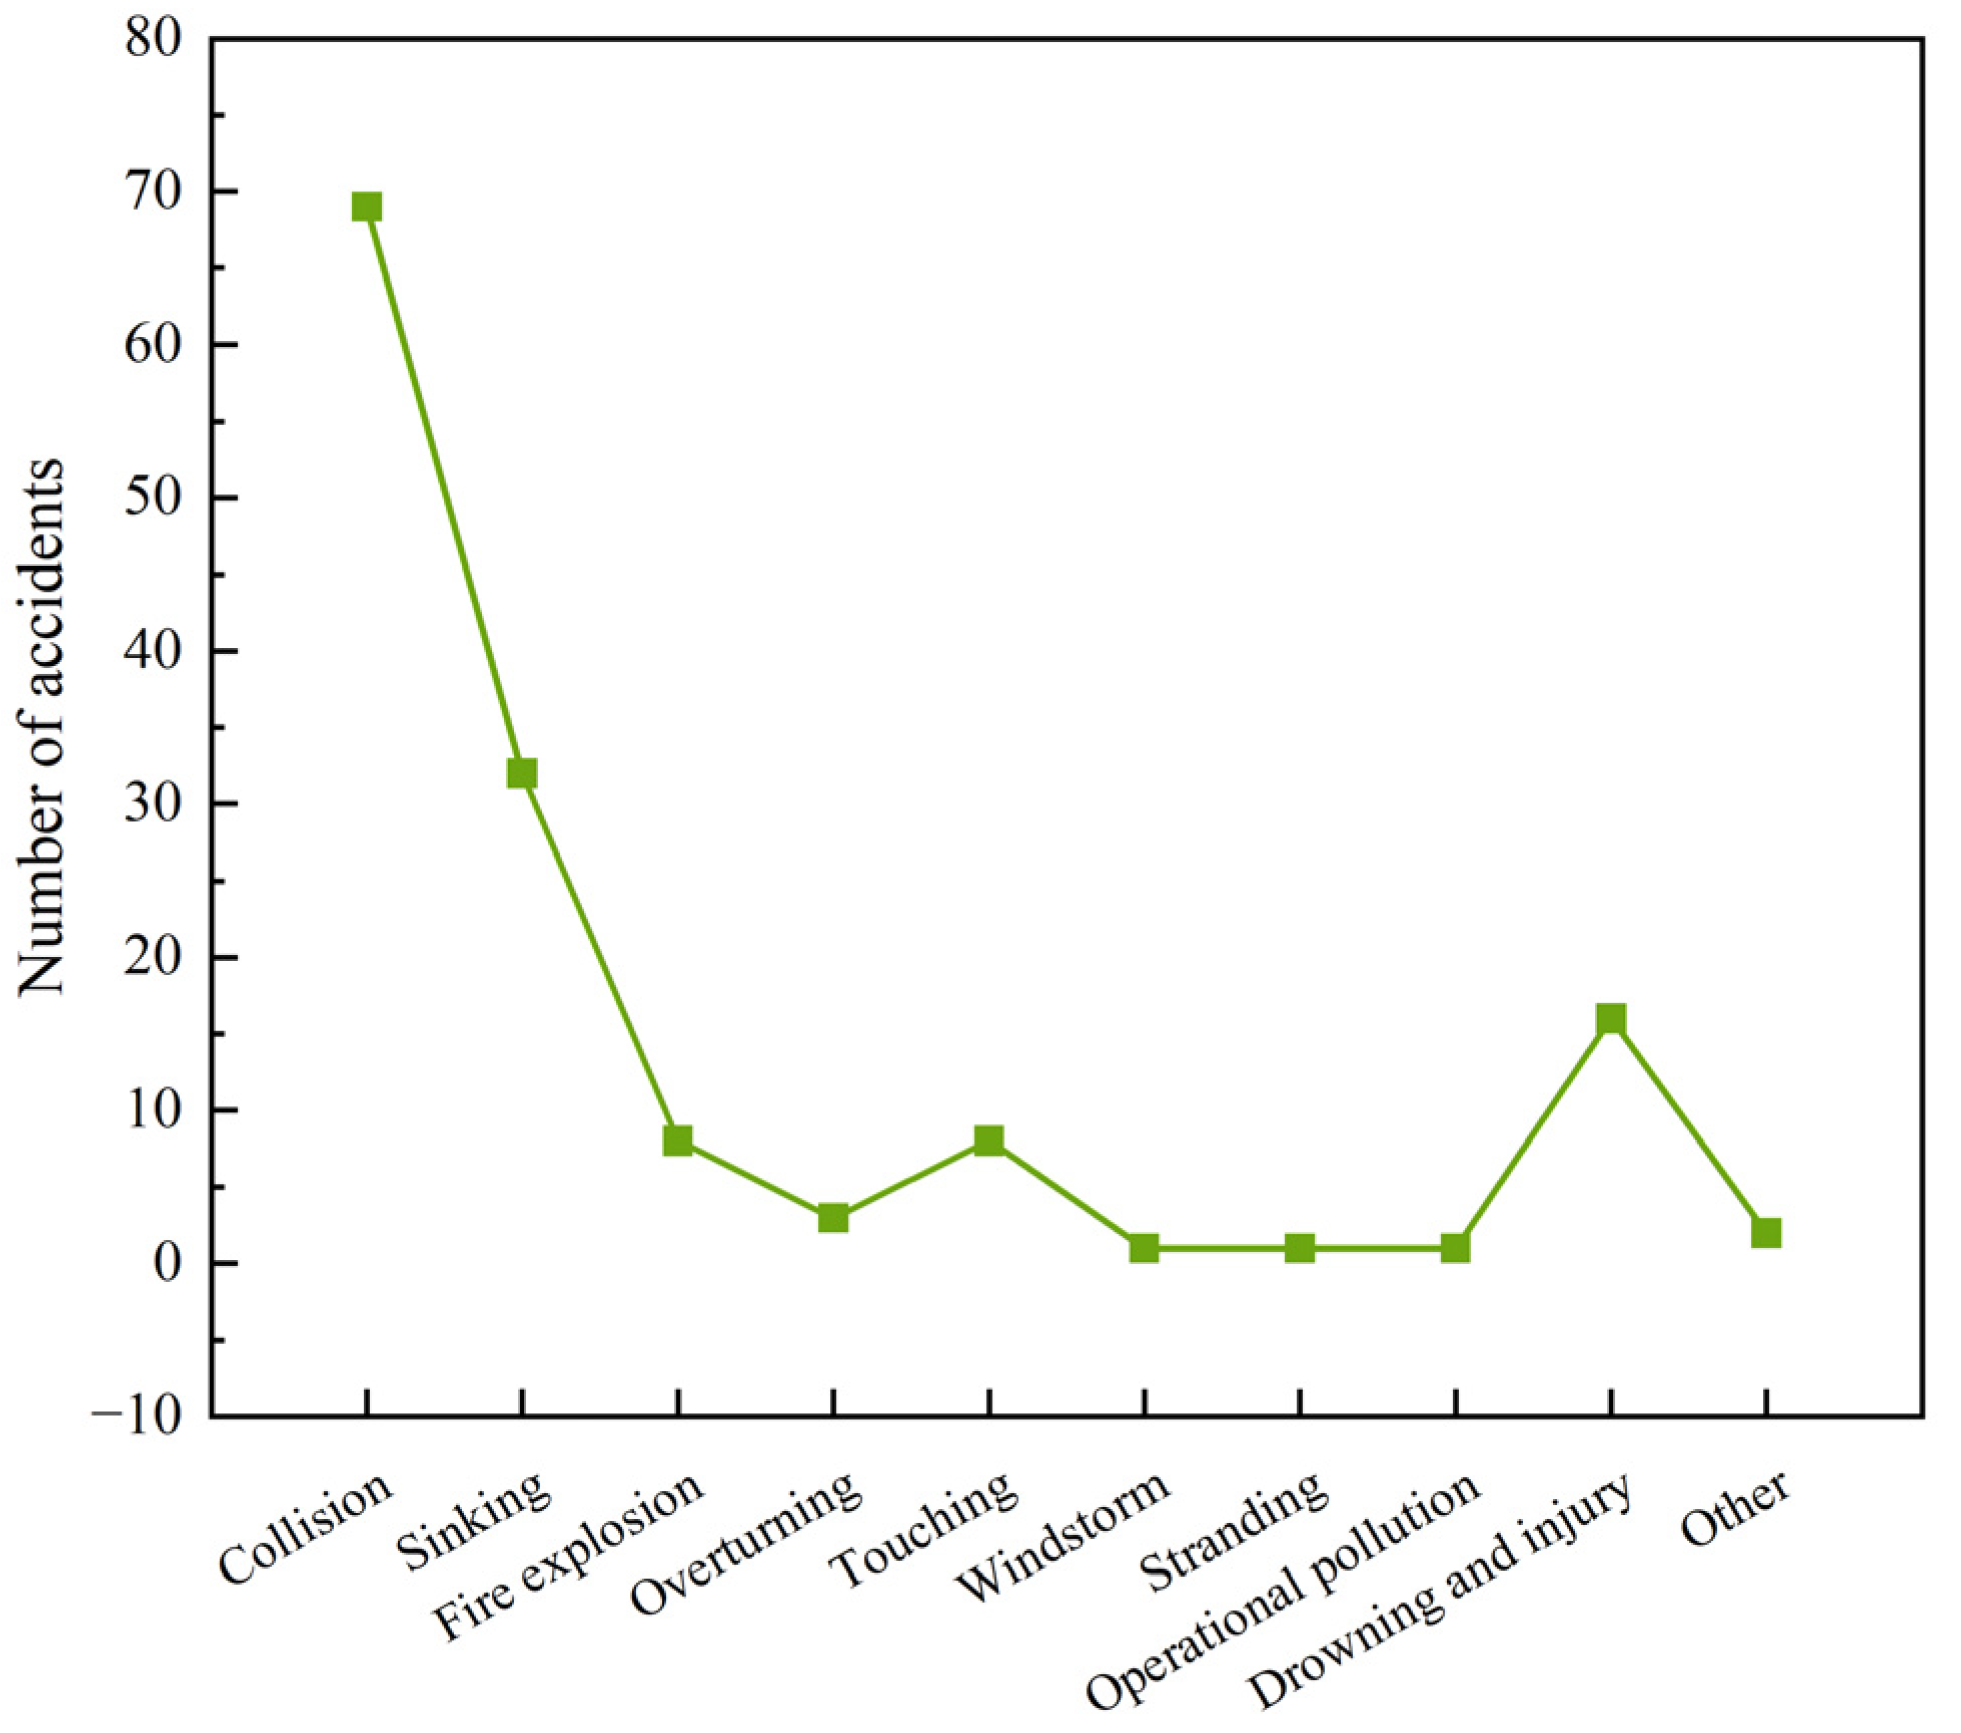
By analyzing the types of ship accidents in the Yangtze River waterway, the accident distribution is shown in Figure 2. Collision accidents are the most frequent type, with 69 occurrences, accounting for 48.94% of the total number of accidents. Sinking accidents rank as the second most frequent type, with 32 occurrences, accounting for 22.70%. Drowning and injury accidents rank the third with 16 occurrences, accounting for 11.35%. These three types of accidents are recognized as the main types of traffic accidents in the Yangtze River waterway, and deserve special attention in maritime safety management.

3.2.2. Temporal Distribution Patterns of Ship Accidents

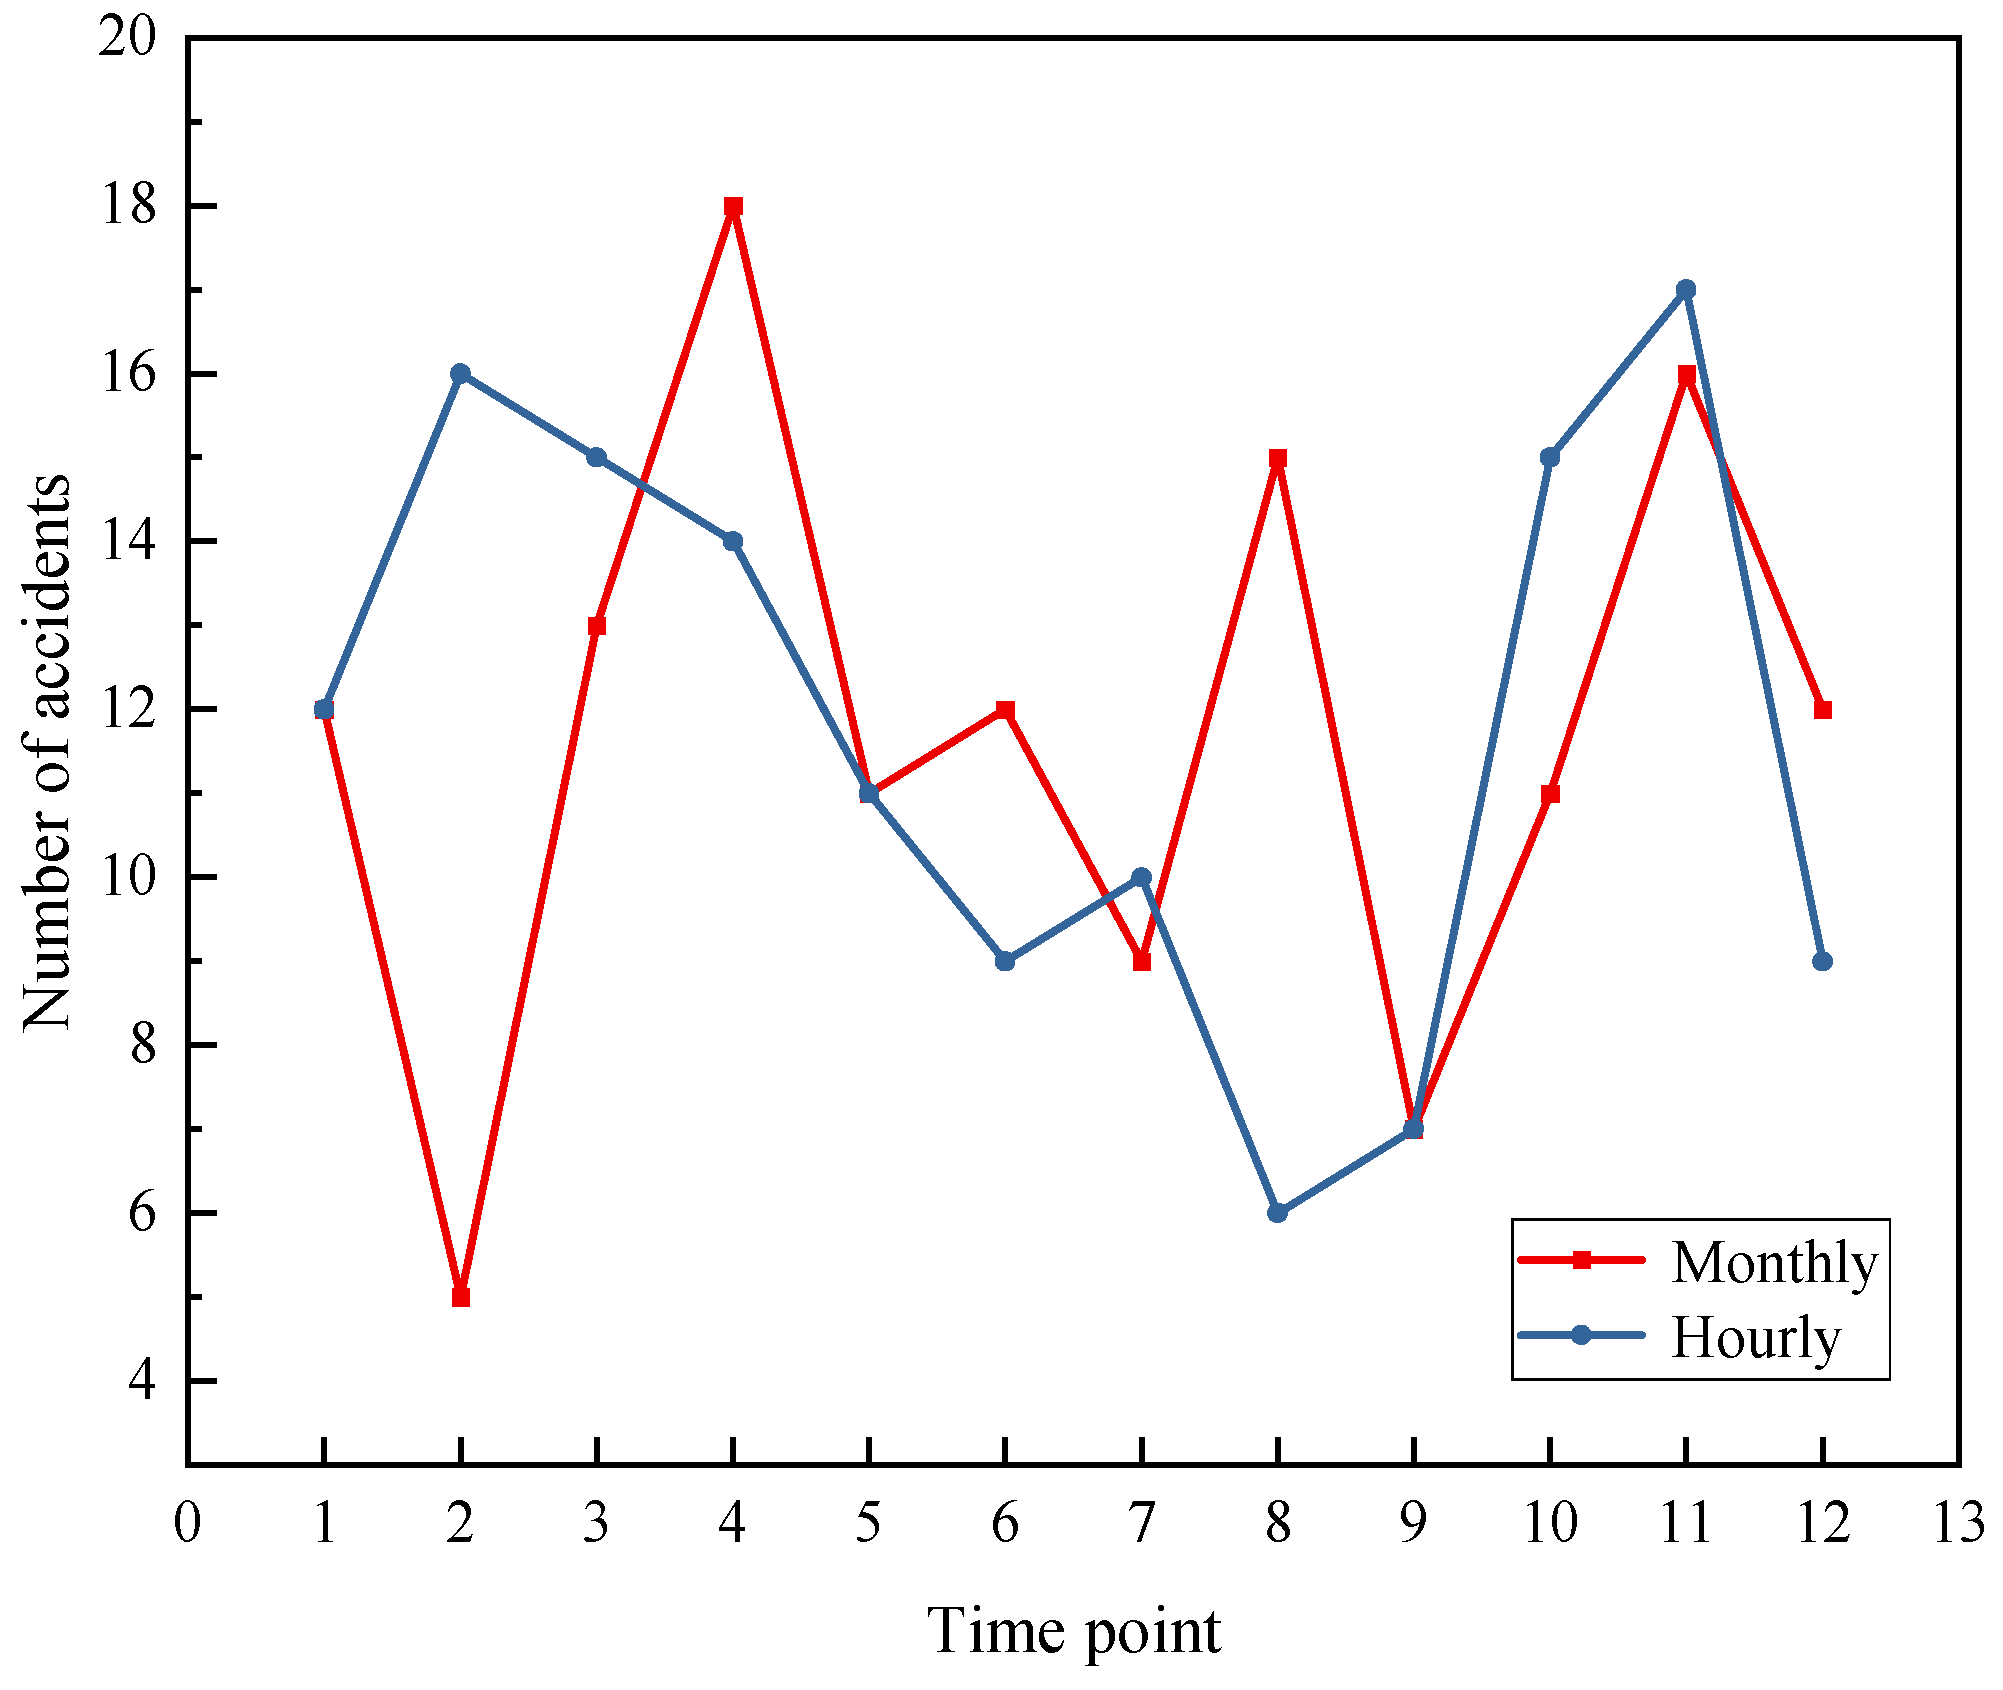
The monthly distribution of ship accidents in the Yangtze River waterway are further analyzed. The accidents are divided into 12 time periods with a time interval of two hours. The periods are labeled as (1, 2, …, 12), and the specific distribution pattern is illustrated in Figure 3. It is noted that the monthly distribution shows an overall imbalance. The number of accidents in February was the lowest, possibly because there were fewer ships navigating during the lunar New Year Festival. A shipping peak period appears after the New Year Festival in March to June. The number of maritime accidents decreases in July. The flooding season in the Yangtze River is featured as having high water-level and complex waterway conditions, resulting in a local peak of accident number in August. Therefore, more efforts need be made to enhance maritime safety administration. In terms of hourly distribution, the number of accidents in the time period from 1800 to 0800 was relatively high, accounting for 69.50%. The peak value occurs around 2000–2200, which might be related to the low visibility in the inland waterway at night and the fatigue of the crew, posing a threat to sustainable waterway transportation. Therefore, it is urgent to strengthen the maritime safety administration at night and reduce the navigation risk posed by the fatigue state of the ship crew.

3.2.3. Spatial Distribution Patterns of Ship Accidents

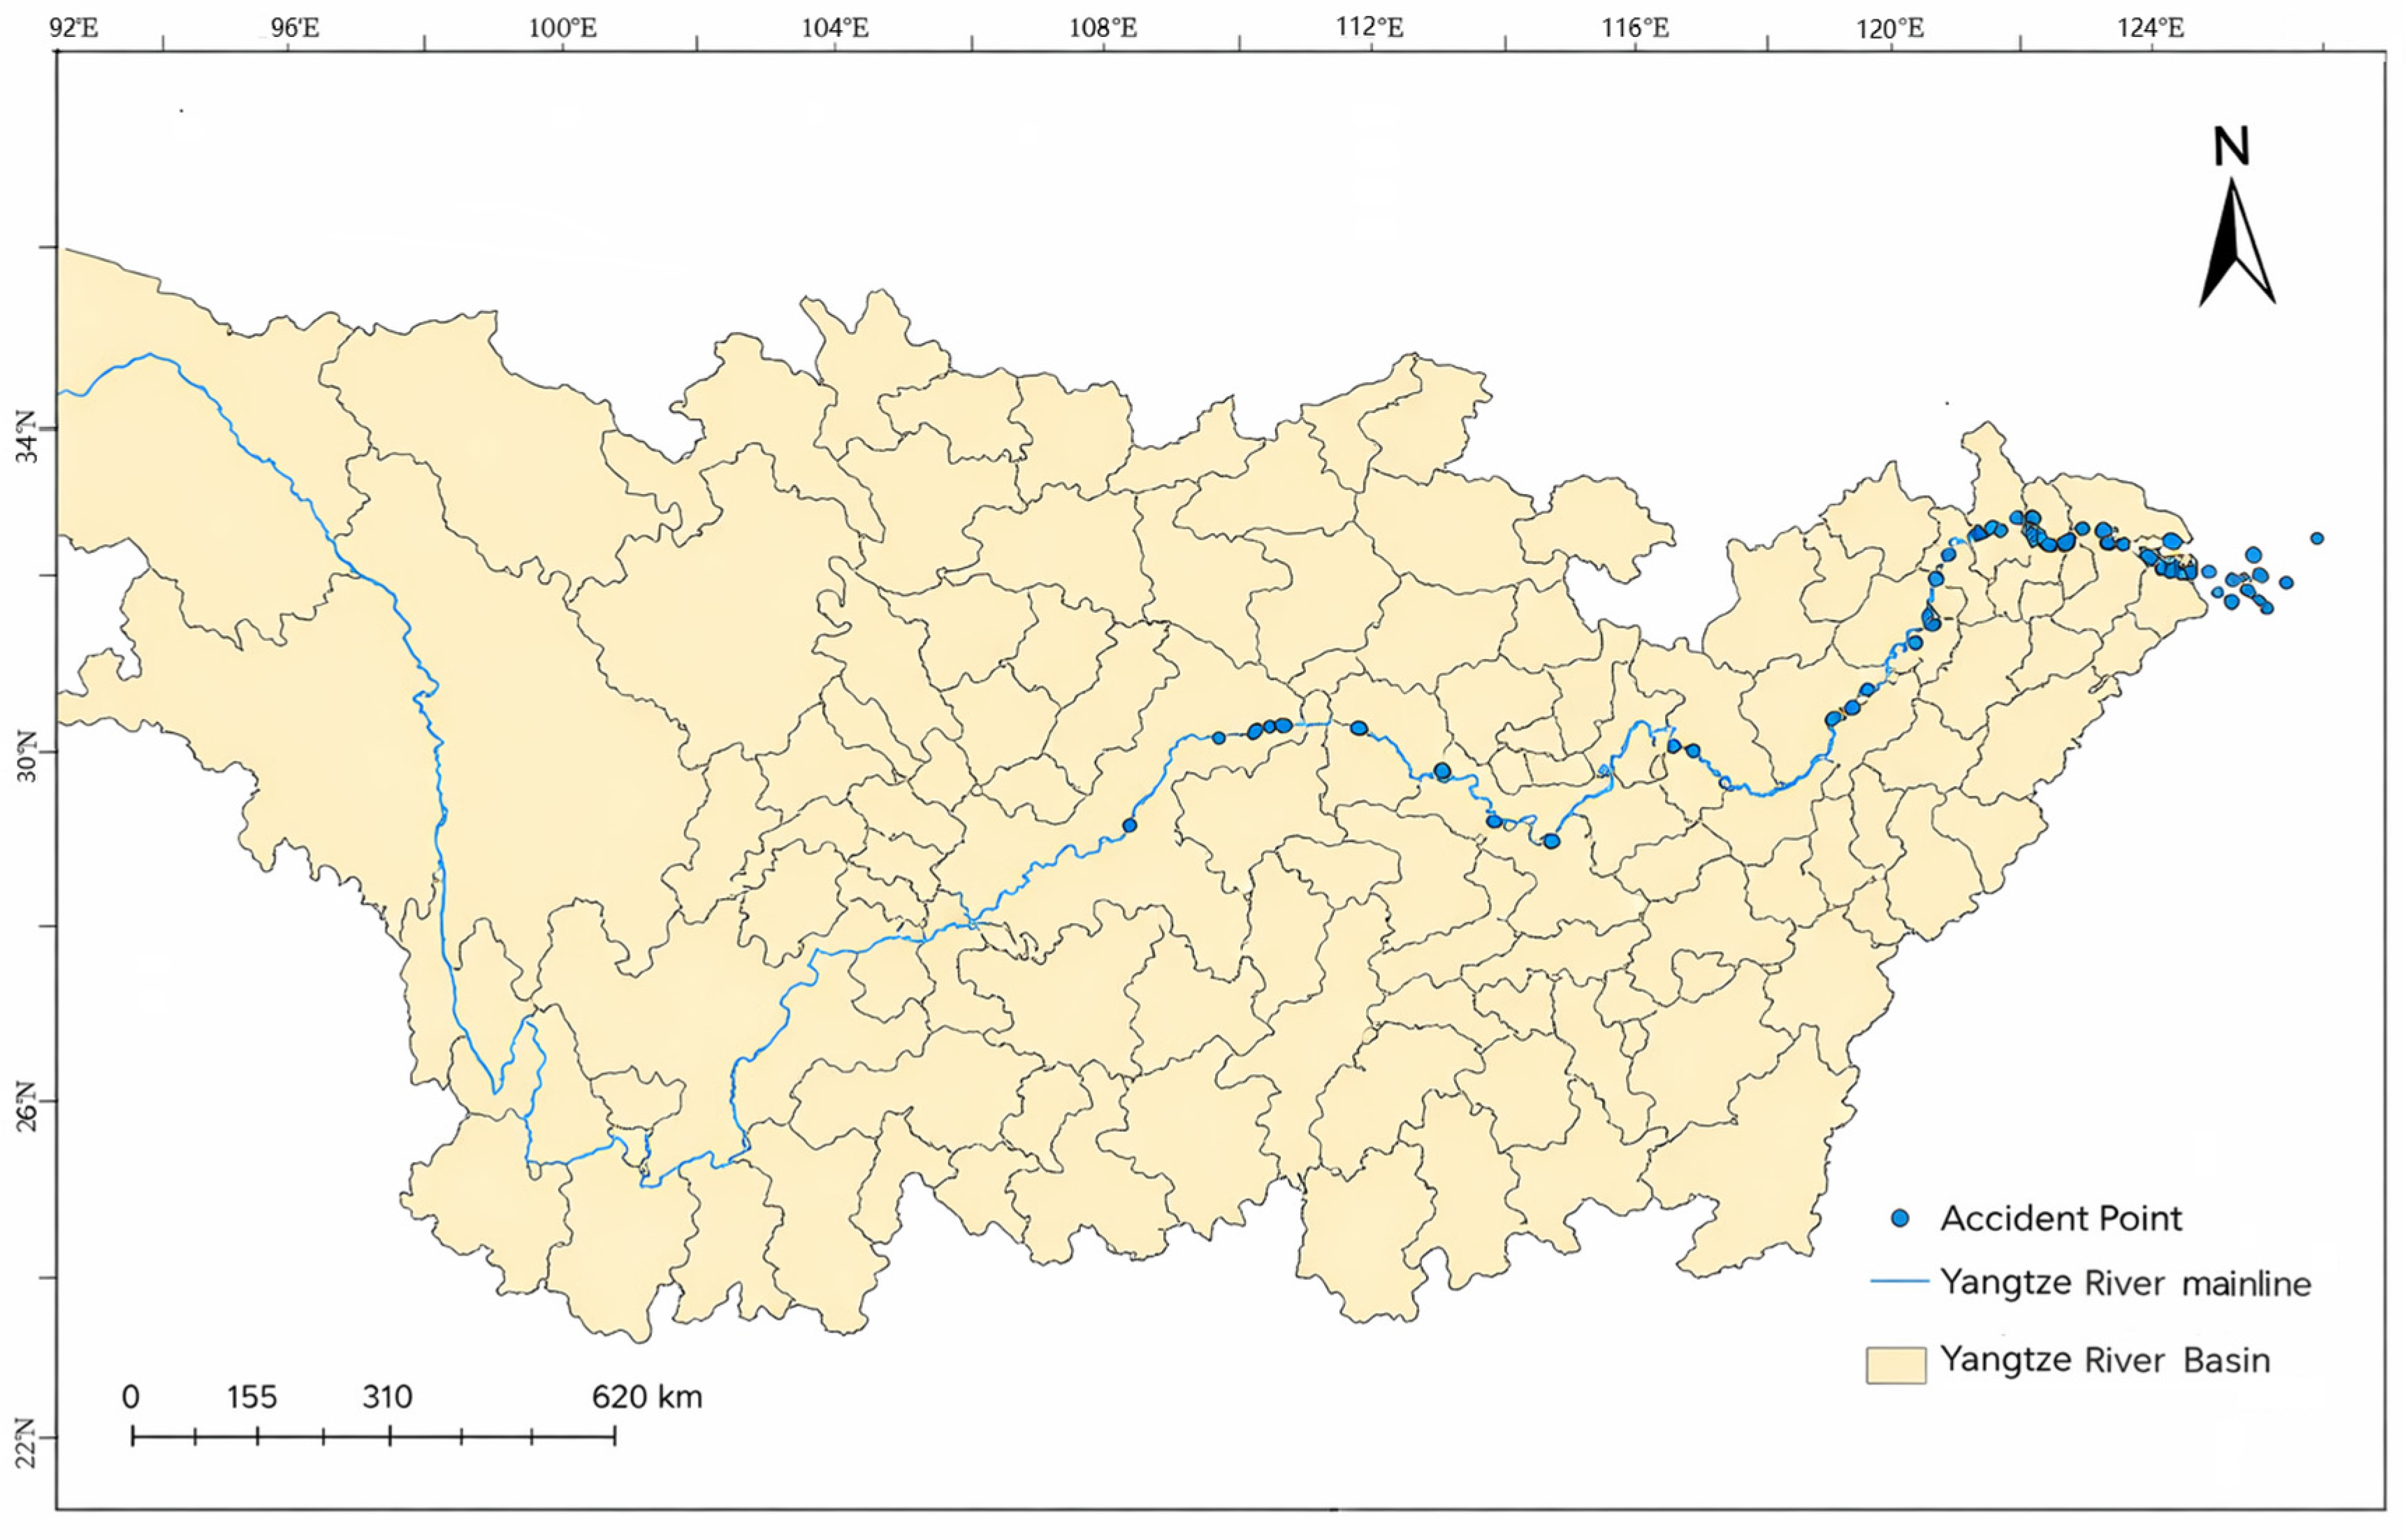
This article has collected the latitude and longitude coordinates of each accident for all 141 ship accident reports from 2015 to 2025. The latitude and longitude coordinates of one maritime accident were missing, so it was excluded from this study. The spatial distribution of ship accidents is shown in Figure 4.
As shown in Figure 4, the maritime traffic accidents in the Yangtze River waterway mainly occur in the lower reaches and the Yangtze River estuary. The amount in the middle and upper reaches of the Yangtze River is relatively small. The high-incidence feature in the lower Yangtze River waterway is related to the dense shipping activities in this region. As the most important inland waterway and the gateway for external navigation in China, there are many ports in this region. Moreover, the busy ship traffic flow and time-varying hydrometeorological conditions jointly lead to the complex ship navigation situation. The pressure on maritime safety administration is extremely high.

3.3. Data Pre-Processing

In the present study, the BERTopic model has been employed to mine the causative factors section of ship accident reports, thereby identifying a set of causal factors related to maritime accidents in the Yangtze River waterway (including environmental, human-related, vessel-related, management-related factors). Firstly, the causation sections of the maritime accident investigation reports were processed separately through text vectorization and tokenization. Then, the optimal number of topics was determined using topic coherence scores, and hyperparameters were further explored through sensitivity analysis. Finally, 25 causal factors were extracted and mapped to the first-level categories of the AcciMap model. The BERTopic model is primarily used to standardize the set of causation factors, thereby facilitating the construction of AcciMap node relationship graphs.
The AcciMap model is known as a six-level accident causation analysis framework, with the first level focusing on government policies and budgets. No relevant causal factors at the first level were identified by the BERTopic model. Considering that a comprehensive framework of laws and regulations has been established to enhance maritime safety in the Yangtze River, the influence of government policies and budget level was not taken into account. The relationships between the primary and secondary causal factors are clarified along with the specific content in Table 2. Moreover, numerical index has been assigned to each secondary causal factor, e.g., ai (i = 1, 2, 3, …, 25).

4. Results and Discussion

4.1. Input of AcciMap-GCN Model

4.1.1. Build the AcciMap Node Relationship Graph

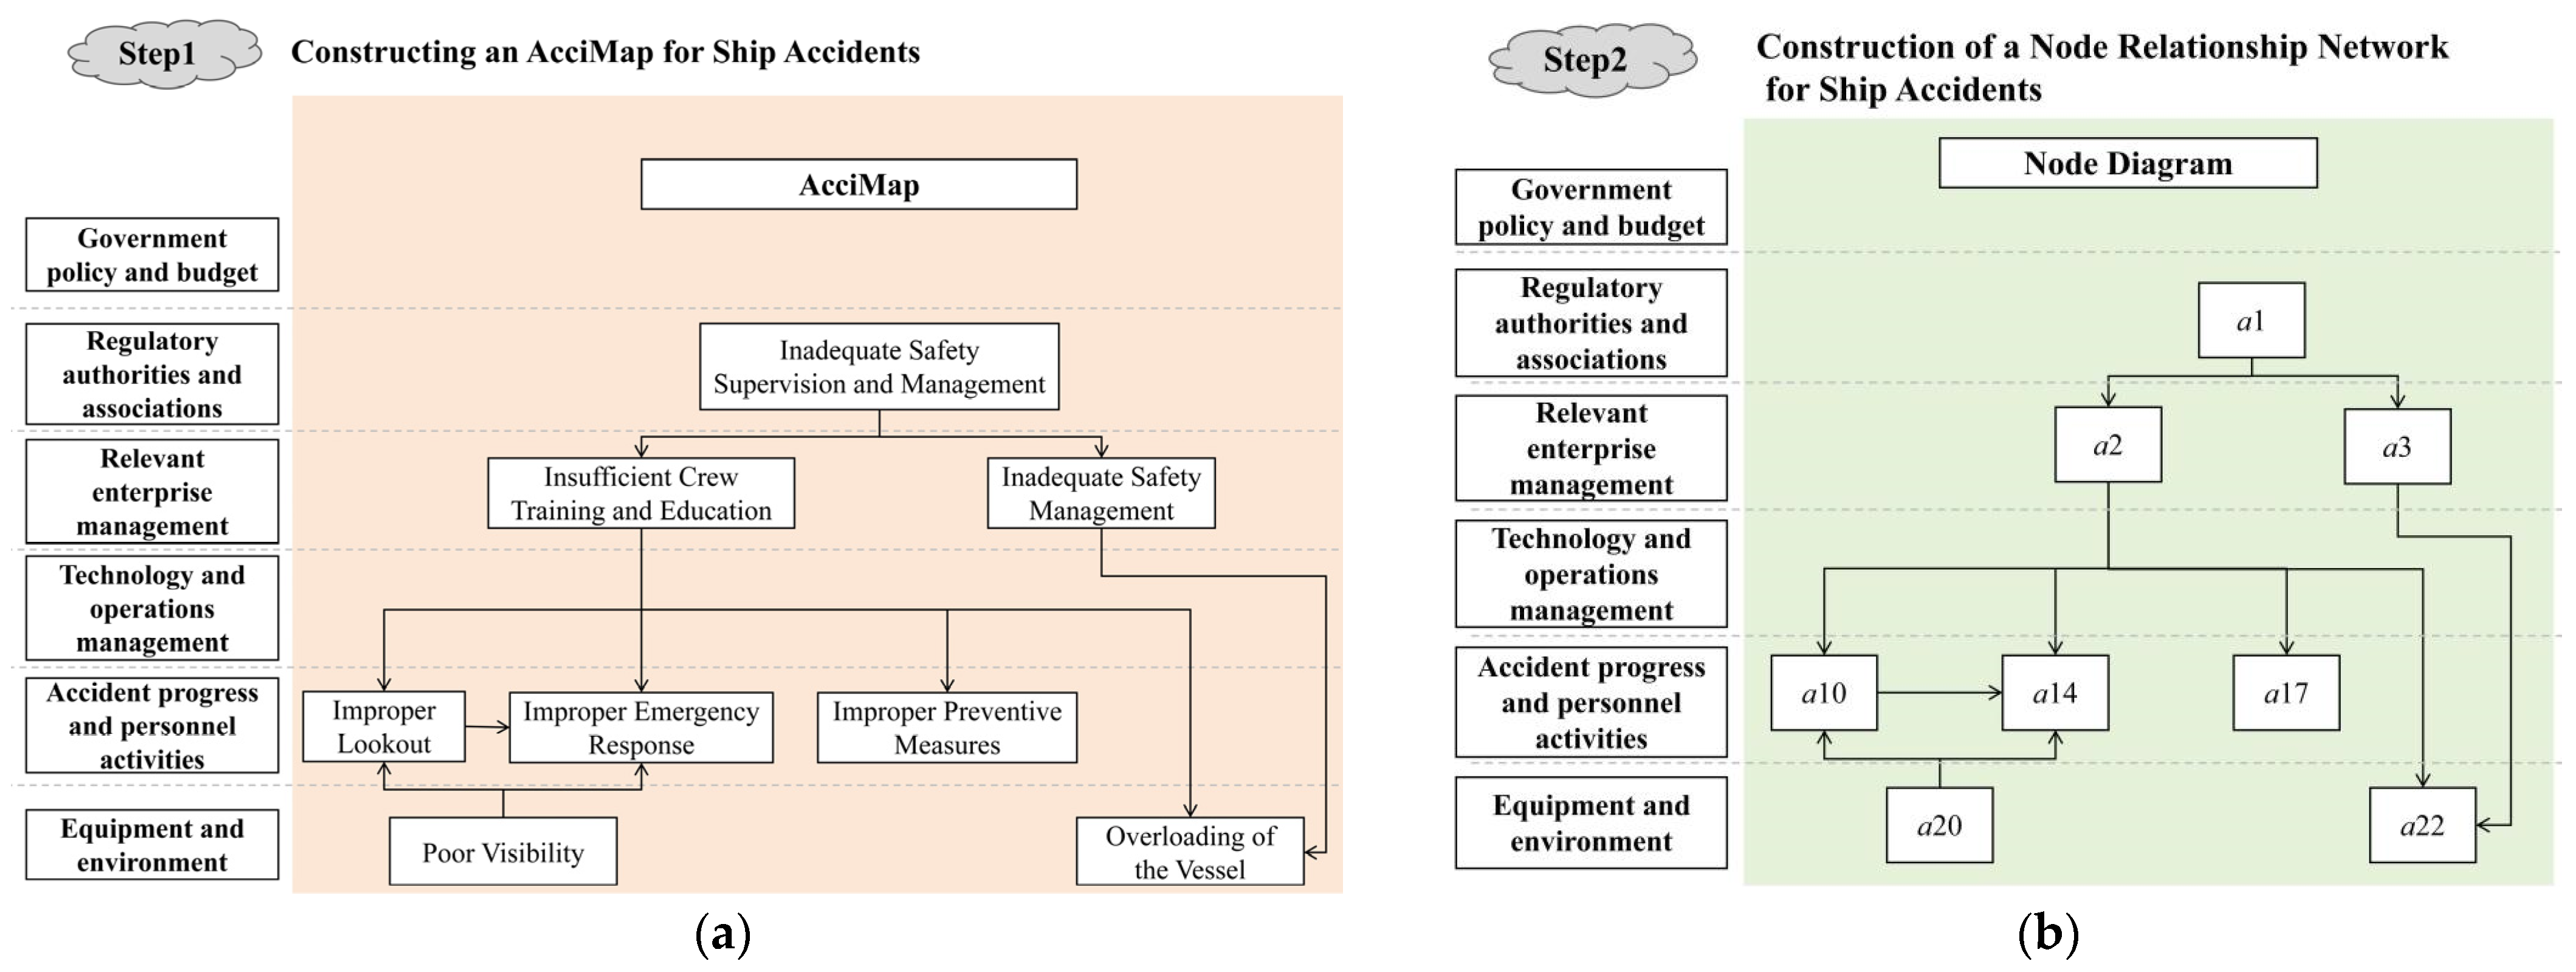
Firstly, the maritime accident reports of Yangtze River waterway from 2015 to 2025 were collected, reviewed, and summarized. Since multiple vessels might be involved in one single accident report, total accident contributors are derived for 209 inland vessels. Secondly, the contributor datasets of each vessel were incorporated into the AcciMap model to construct AcciMap diagrams. Thirdly, each accident report was examined to analyze the causal relationships among the contributors of each vessel. Arrows were plotted to demonstrate their relationships, with the arrowhead indicating the effect and the tail indicating the cause, as illustrated in Figure 5a, thereby constructing the AcciMap causal relationship diagrams of maritime accidents. Finally, the contributors in each AcciMap causal diagram were numbered as ai (i = 1, 2, 3, …, 25), as shown in Figure 5b, resulting in 209 AcciMap causal relationship node diagrams. Figure 5 presents an example of the construction process for the AcciMap causal relationship node diagram of the collision accident vessel T at Taizhou (Jiangsu Province), which occurred at 07:30 on 27 June 2015.

4.1.2. Acquisition of the Adjacency Matrix

A total of 209 summarized node diagrams were utilized to construct 209 adjacency matrices, with a schematic diagram shown in Figure 6. The matrix size is N × N, where N represents the number of accident contributors. The unity appearing in the matrix indicates the presence of a causal relationship between two contributors, pointing from the row to the column, while a value of 0 indicates the absence of a relationship.

4.1.3. Introduction of the Mutual Information Weights

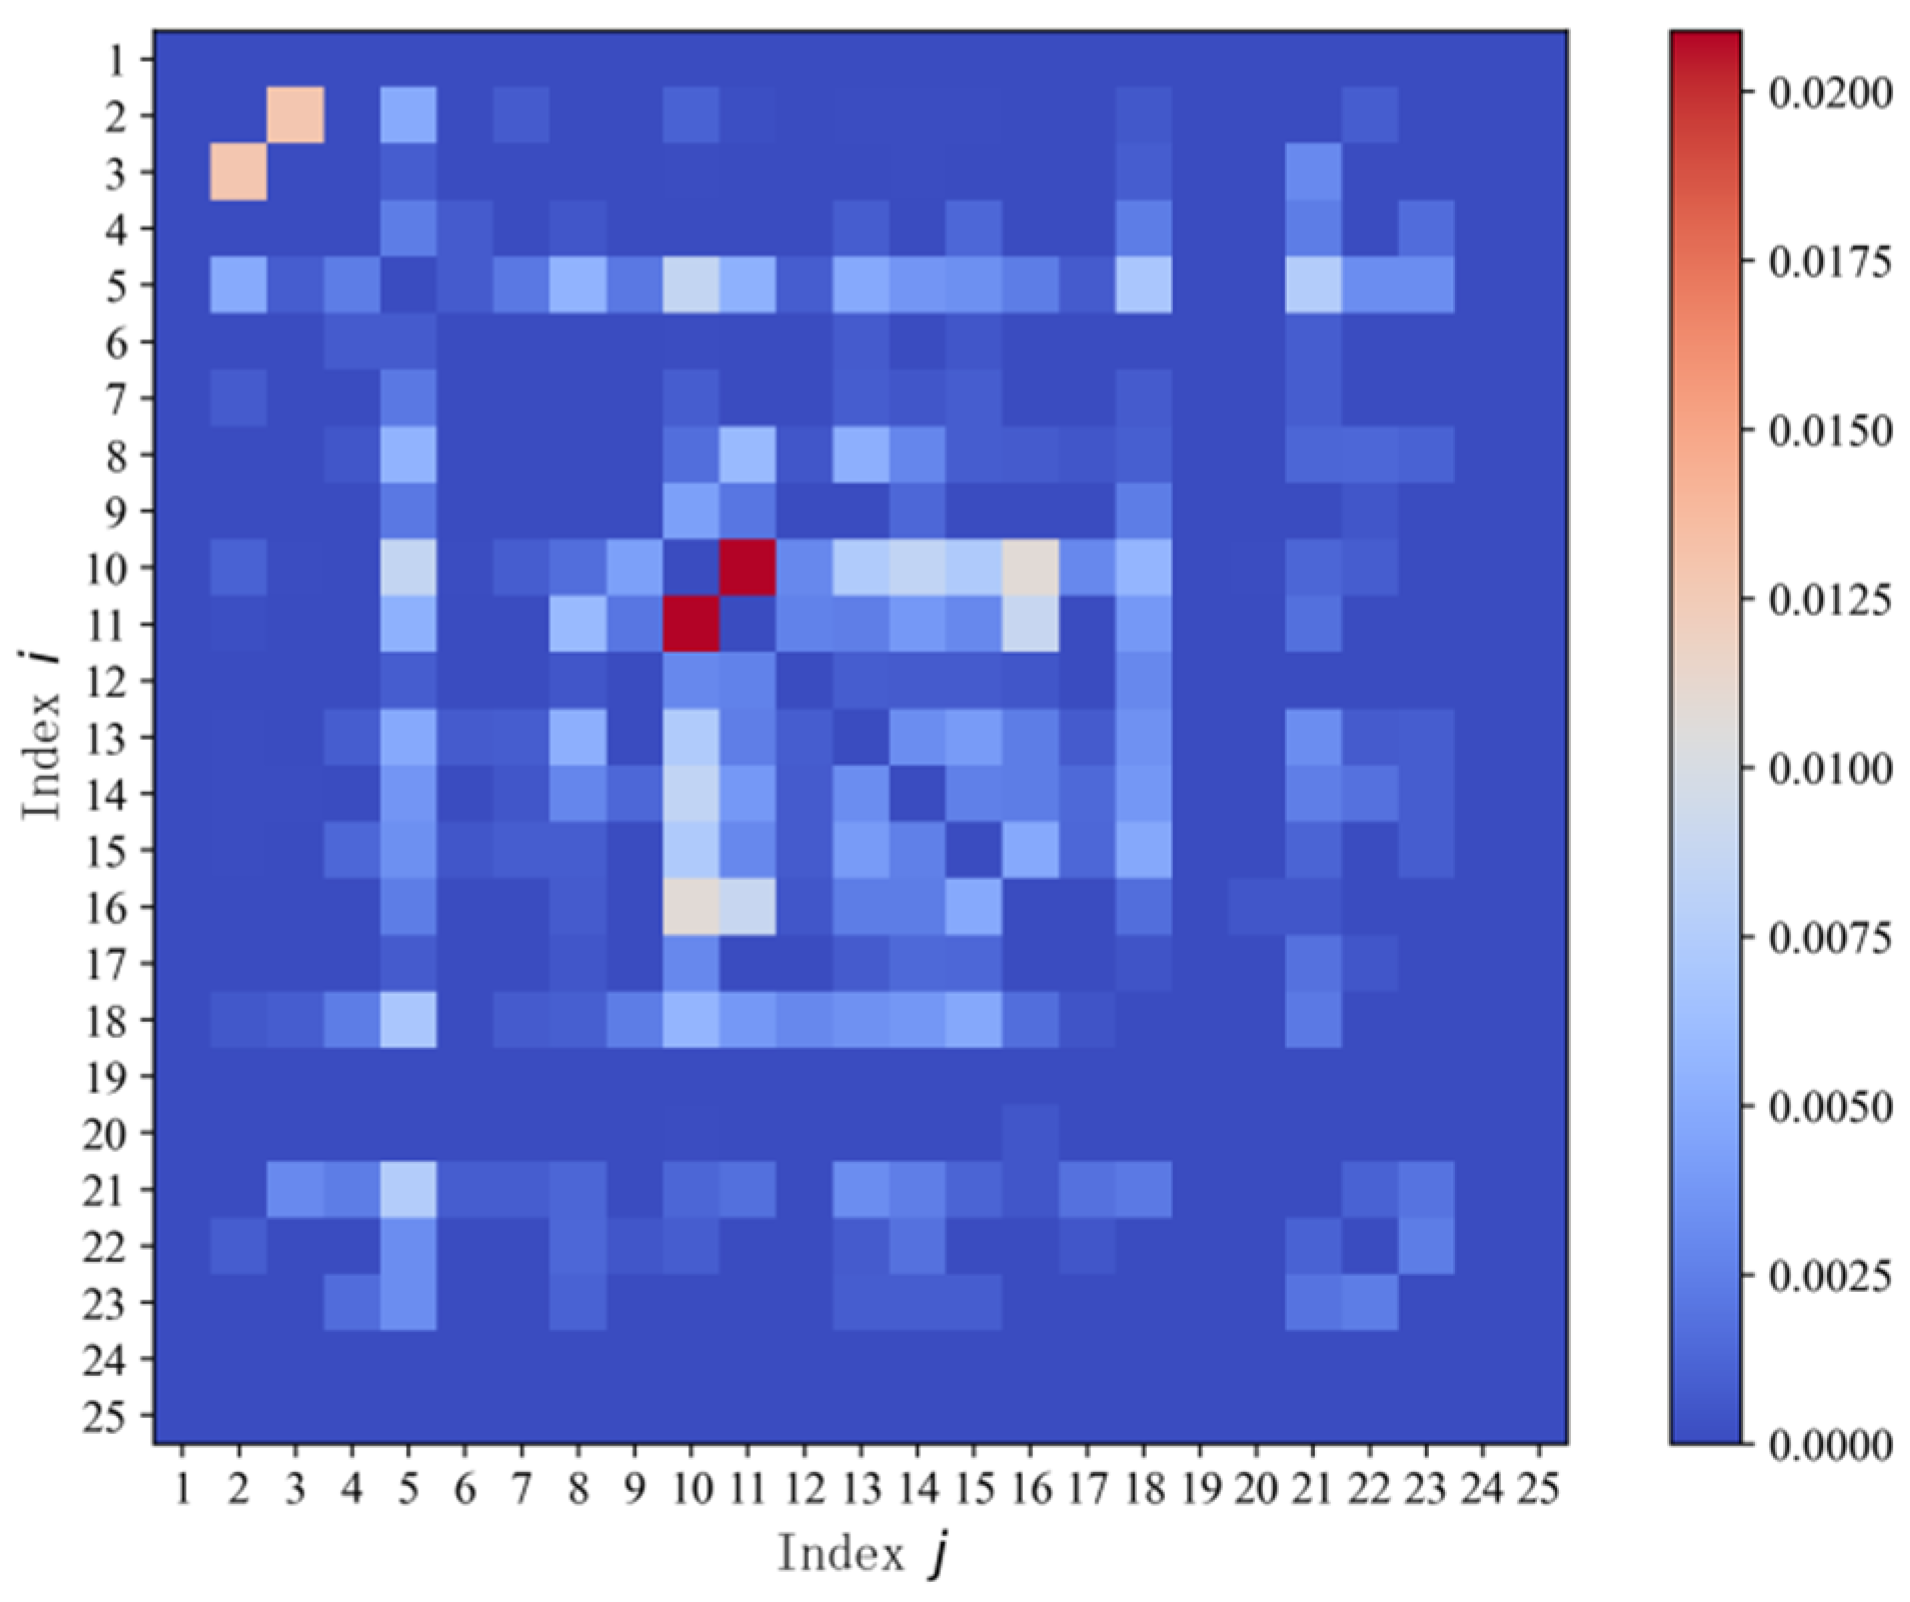
As demonstrated in Section 2.1, mutual information was integrated to enhance the early learning capability of the model. Different weights were assigned to the adjacency matrices as input for the GCN model. The mutual information of each adjacency matrix was calculated, and the average mutual information across the 209 nodes was computed to obtain the mutual information between each pair of nodes. The heatmap of average mutual information is shown in Figure 7. The heatmap illustrates the interdependencies among different accident contributing factors, while the color intensity indicates the strength of their dependency.
As shown in Figure 7, the mutual information value between node 10 (improper lookout) and node 11 (failure to take timely and effective evasion measures) is the highest (i.e., 0.0209), highlighting the strong dependency between node 10 and node 11. It is suggested that both nodes frequently co-occur within the same AcciMap node graph. Specifically, improper lookout is often accompanied by the failure to take timely and effective avoidance measures in the Yangtze River waterway, which in turn can lead to collision accidents and other serious accidents resulting in casualties, environmental pollution and severe consequences.
The mutual information value between node 2 (inadequate crew training and education) and node 3 (inadequate safety management) ranks the second (i.e., 0.0129), appearing as pink in the heatmap. This indicates that inadequate safety management occurs in conjunction with insufficient crew training and education, highlighting the significant impact of maritime safety administration on accident occurrences in the Yangtze River waterway.
In the heatmap, blue or lighter colors indicate that either mutual independence or a weak mutual dependency exists for the corresponding nodes.

4.2. Hyperparameter Optimization

To improve the predictive performance of GCN model, hyperparameters were further optimized. Specifically, GWO has been utilized for model optimization. In this paper, the mean square error (MSE) is introduced as the fitness function. The optimization process terminates when the MSE decreases to 10−3 and remains at this level for 5 consecutive rounds, indicating that the model training has reached its optimal state. The optimized hyperparameters are summarized in Table 3.

4.3. Analysis of Causal Importance Scores

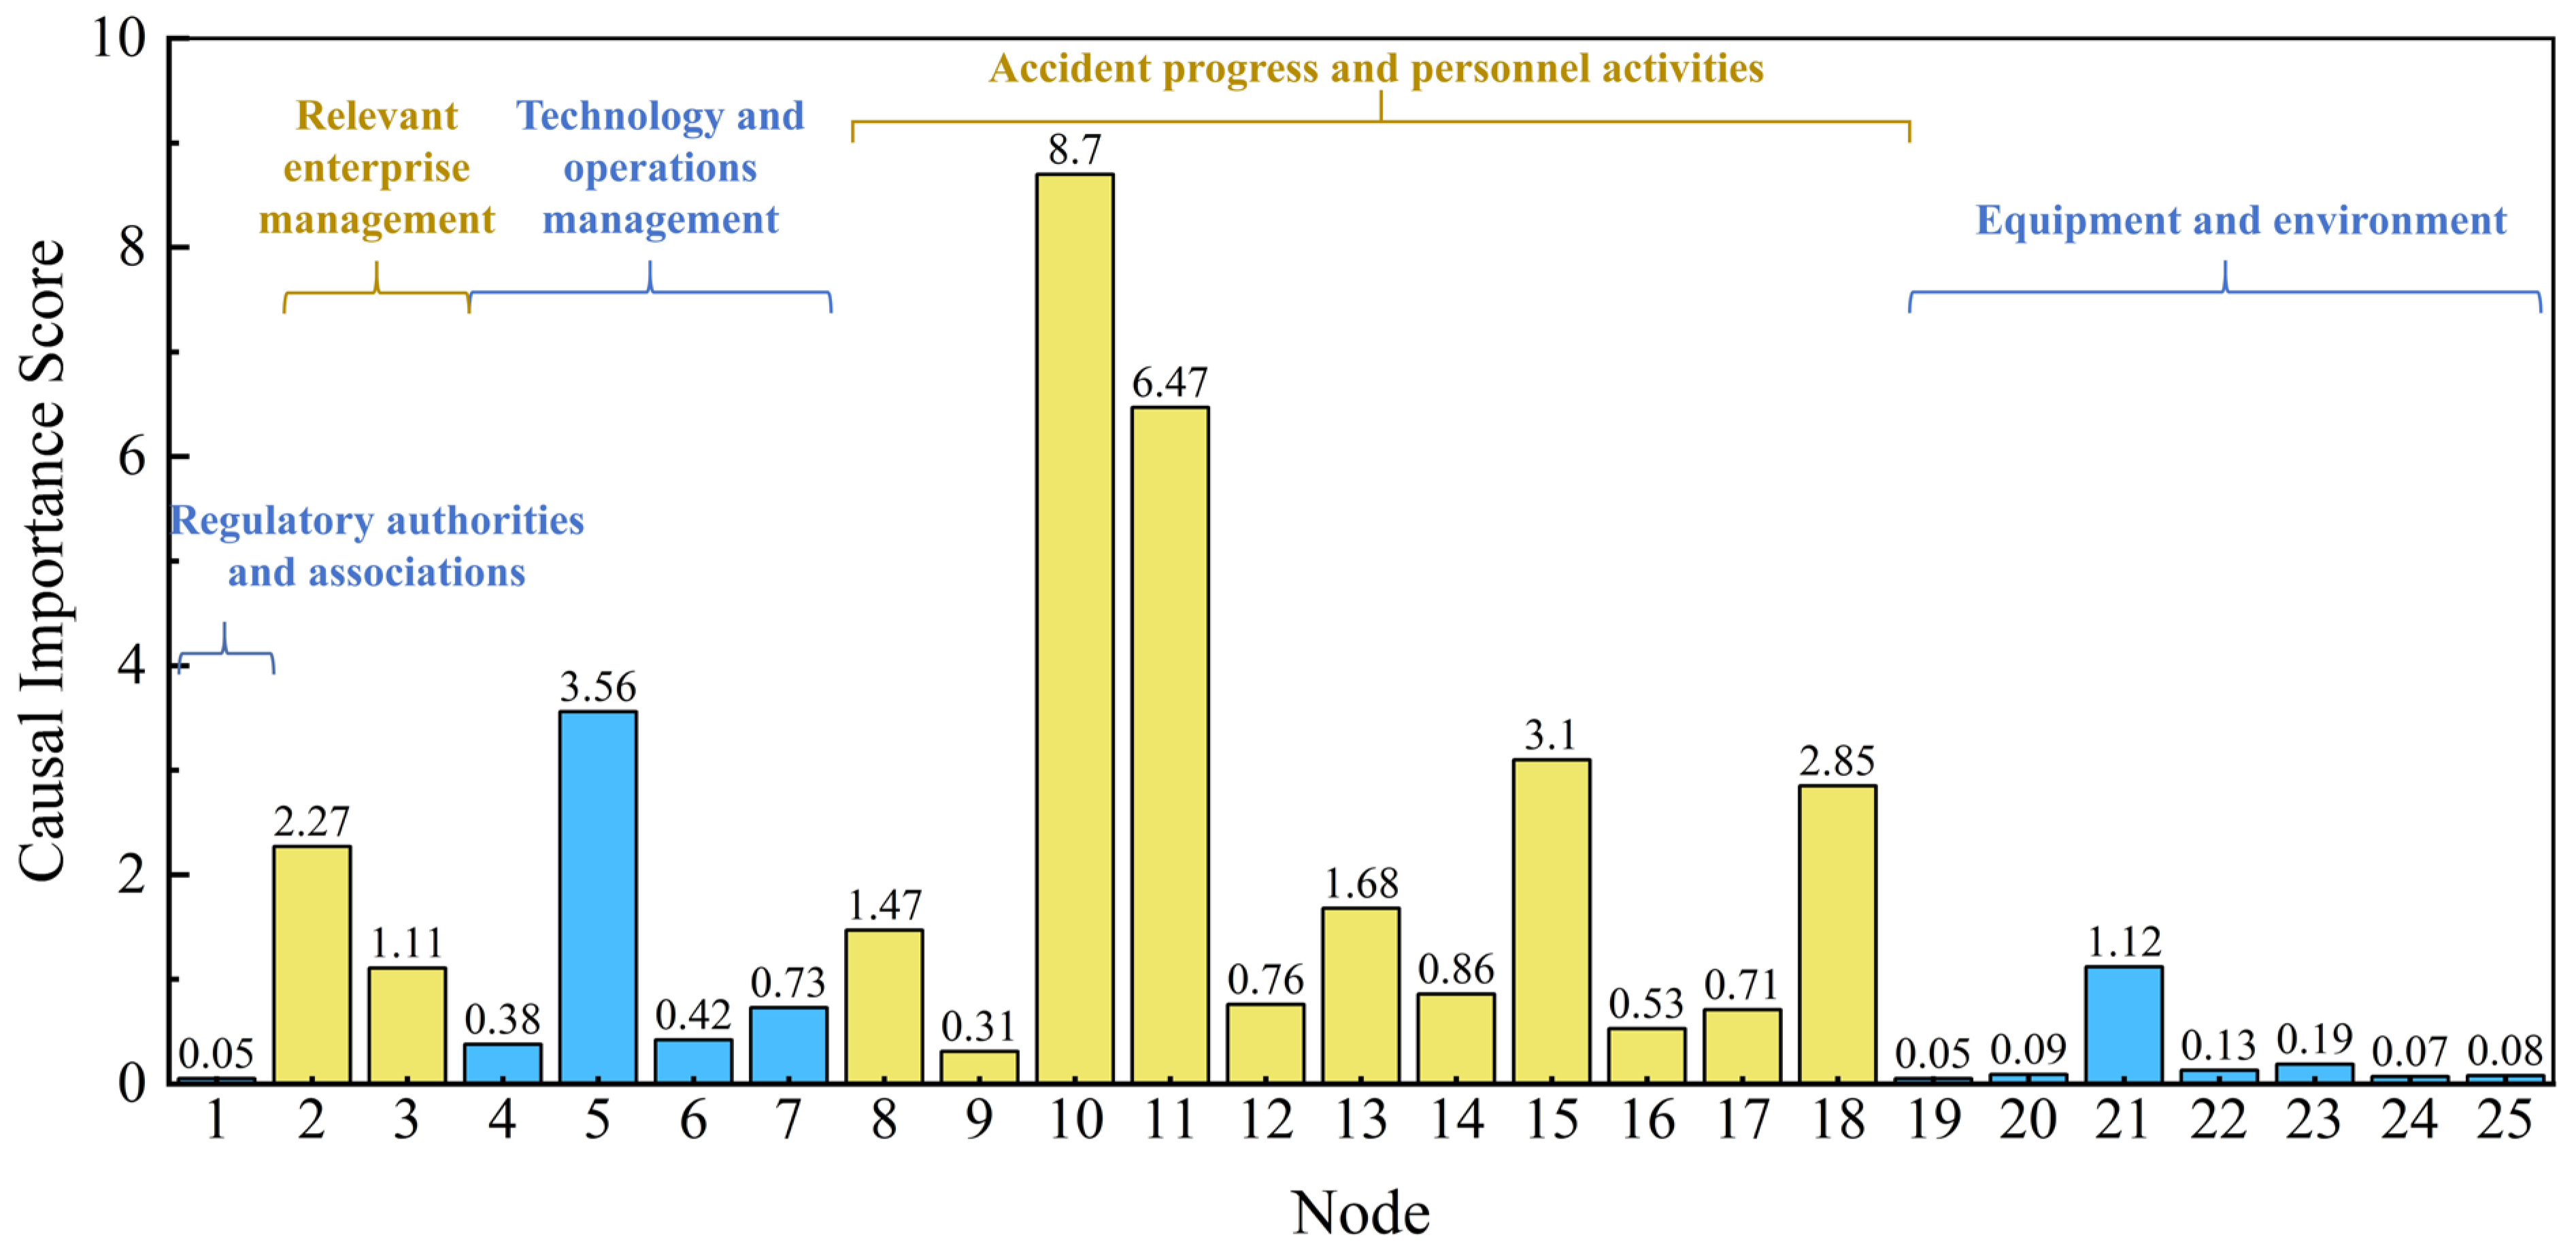
The present study employs an AcciMap-GCN-based causation analysis model for maritime accidents in the Yangtze River waterway. The model is optimized via GWO, incorporates with Dropout layer to prevent overfitting, and applies weakly supervised learning to constrain the model. Ultimately, it outputs the causal importance score for each contributing factor, with the specific results shown in Figure 8.
As presented in Figure 8, the causal importance scores of all nodes fall within a range of 0 to 10. The higher the causal importance score, the more frequently the node appears in the accident causal chain, indicating that it is a primary factor contributing to maritime traffic accidents.
Node 10 (improper lookout) has the highest causal importance score (i.e., 8.7). Its total in-degree is 148 and its total out-degree is 67, indicating that this node occupies a mid-to-lower position in the accident causation chain. This means improper lookout not only frequently appears as a downstream, frontline contributor but also exerts an influence on the other factors. A typical mechanism is described as follows: inadequate management → human error/inappropriate operation → accident occurrence.
Node 11 (failure to take timely and effective evasion measures) ranked second in terms of causal importance, with a score of 6.47. Its total in-degree was 120 and its total out-degree was 2, indicating that this node is located downstream in the accident causation chain and serves as a direct contributor triggering maritime accidents, highlighting its relatively high structural importance within the accident chain.
Node 5 (insufficient number of qualified crew members) has the third-highest causal importance score (i.e., 3.56). Its total in-degree is 73 and its total out-degree is 59. This node lies in the middle segment of the accident causation chain. The lack of a sufficient number of qualified crew members is often caused by improper or absent management, which in turn affects the course of the accident and the activities of personnel, ultimately leading to consequences such as ship collisions, self-sinking, and grounding.
The causal importance score of Node 15 (improper operation) follows closely behind, with a score of 3.1. Its total in-degree is 77 and its total out-degree is 1. This node is consistent with Node 11, both located downstream in the causal chain of the accident, and represents a direct contributor to the occurrence of waterway accidents.
The nodes with the lowest causal importance scores are Node 1 (inadequate safety supervision and management) and Node 19 (strong wind conditions), both scoring 0.05. Node 1 has an in-degree of 0 and an out-degree of 77. Node 19 has an in-degree of 0 and an out-degree of 27. Both Node 1 and Node 19 occupy upstream positions in the accident causation chain and represent indirect, underlying causes. Strong winds are an objective, force-majeure factor, and insufficient safety supervision and management indicate that regulatory inspections have failed to effectively prevent the occurrence of accidents.
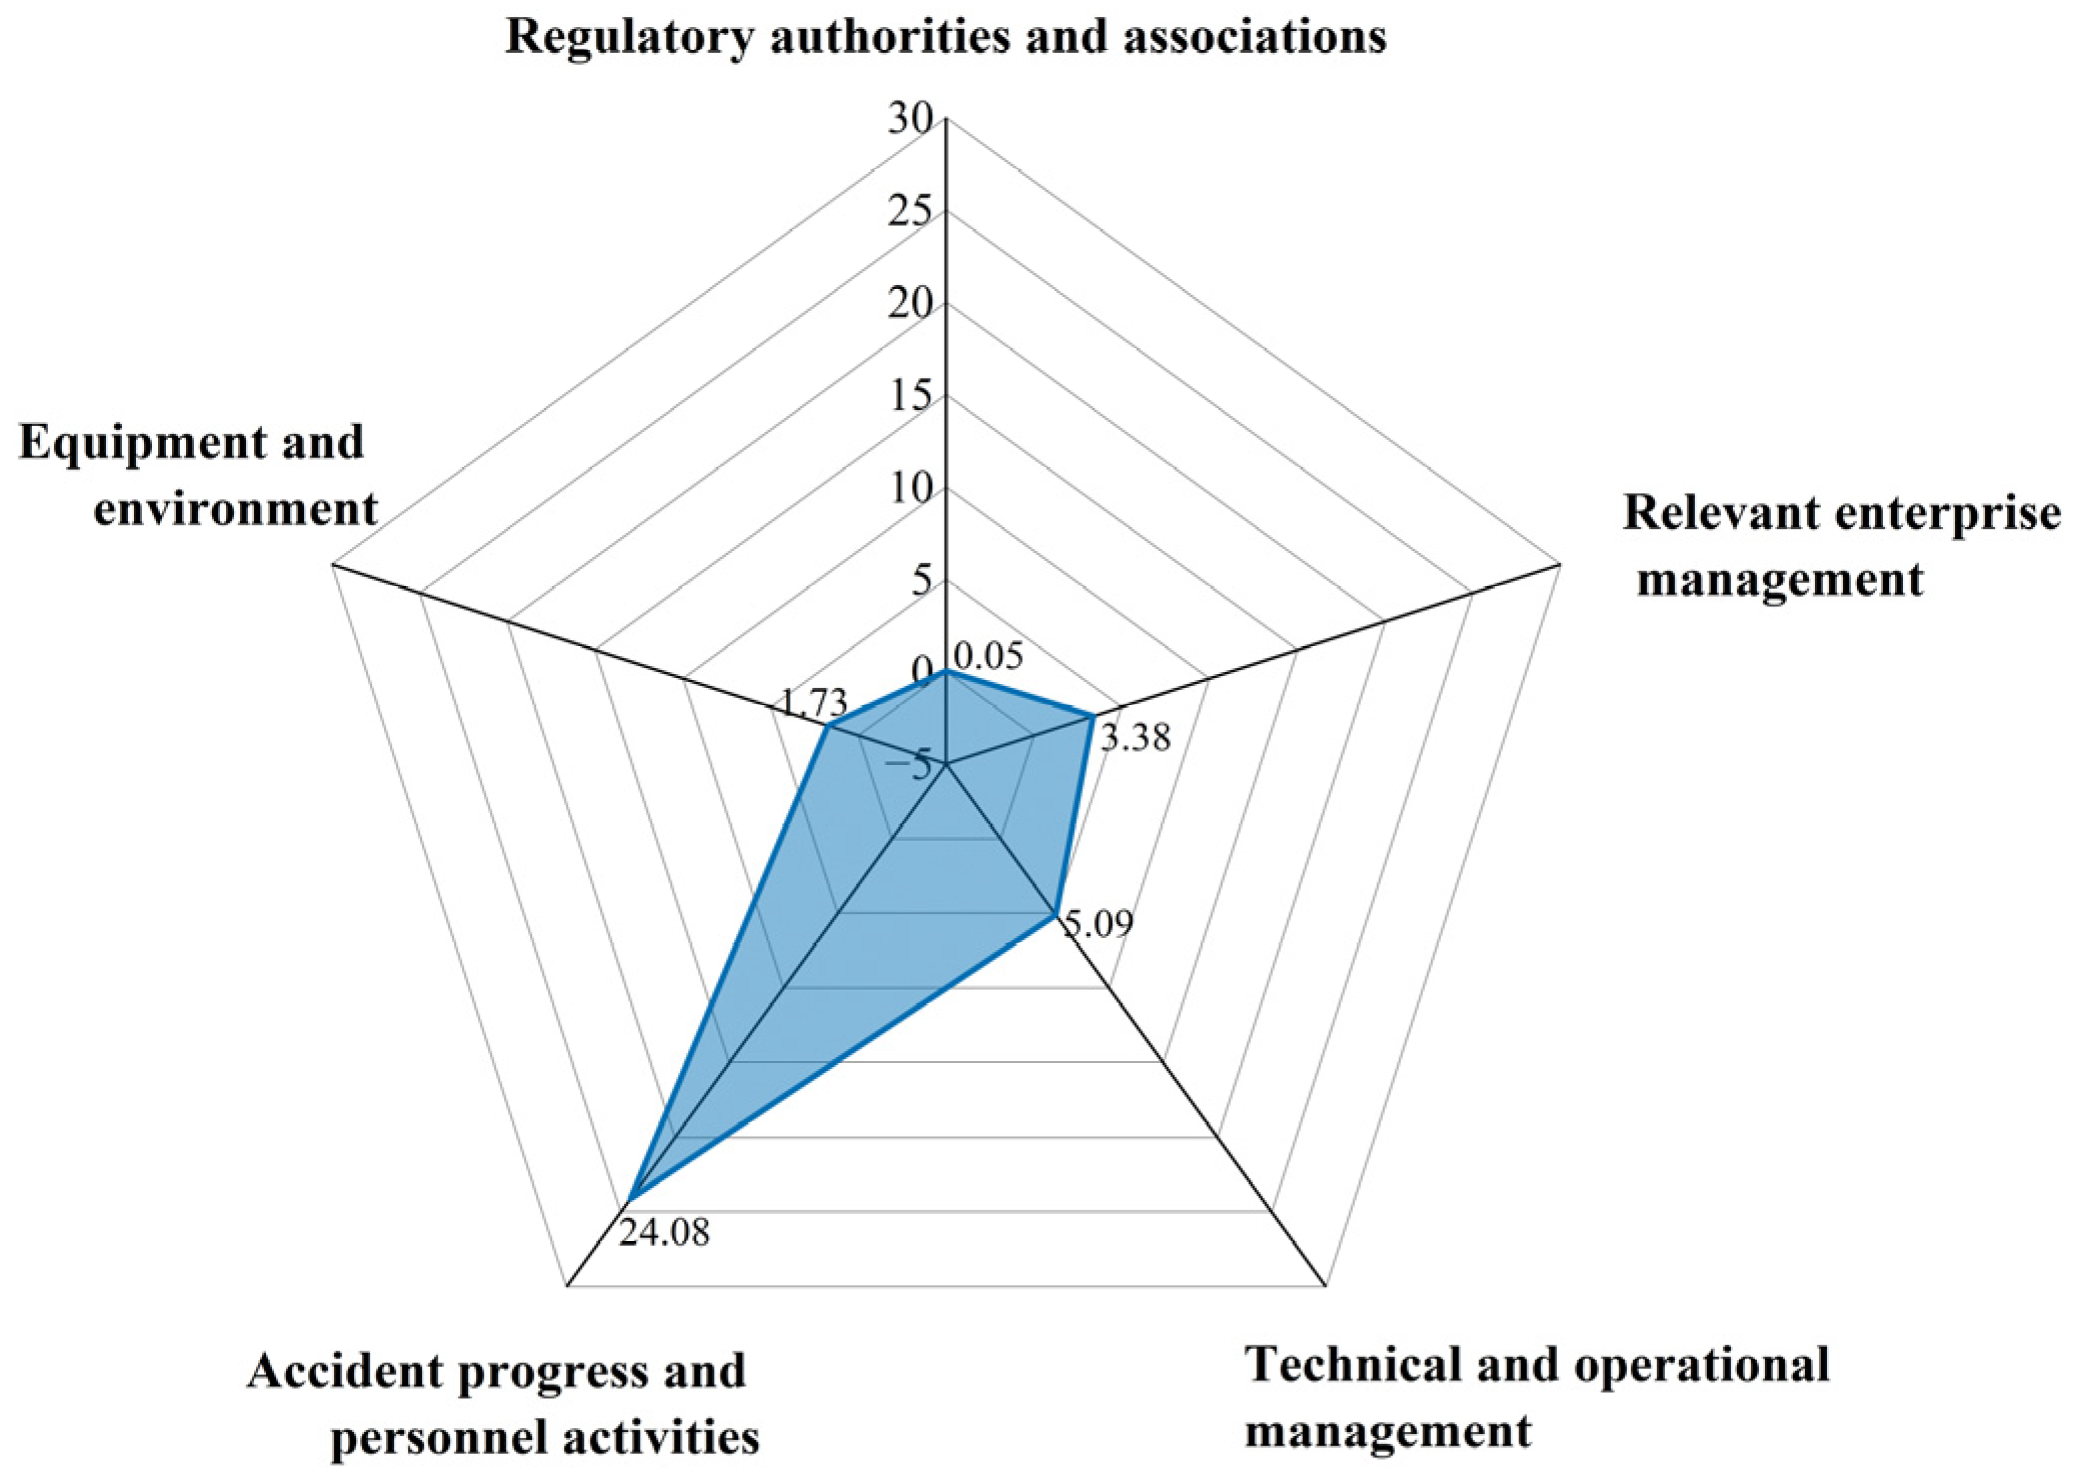
To further investigate the causal importance scores across the five hierarchical levels in the AcciMap model and analyze the significance of contributors to maritime accidents from a systemic perspective, the importance scores of the first-level contributors were calculated and are presented in Figure 9.
As shown in Figure 9, accident progress and personnel activities scored the highest total causal importance, at 24.08, significantly higher than that of other levels. This demonstrates that frontline personnel operations remain a key contributor. In particular, nodes 10 (improper lookout), 11 (failure to take timely and effective avoidance measures), and 15 (improper operation) continue to be critical issues, accounting for a disproportionately large share. The total causal importance score for regulatory authorities and organizations was the lowest (i.e., 0.05), which suggests that this level has a limited direct role in the accident causation chain. Furthermore, it might also be influenced by the way the causal relationship information is recorded or encoded in the accident investigation report. The causal importance scores for equipment and environment ranked second lowest (i.e., 1.73), and node 21 (ship equipment and structural defects) stood out particularly, with a score of 1.12. The results suggest that issues such as steering gear failures and structural defects have adverse effects on vessel navigation safety. The total causal importance score for related enterprise management was 3.38, with nodes 2 (inadequate crew training and education) and 3 (inadequate safety management) accounting for a substantial proportion, underscoring the critical role of crew education and safety management in waterway transport safety. The total causal importance score for technology and operational management was 5.09, with Node 5 (insufficient number of qualified crew members) accounting for as much as 3.56, indicating that shipping companies are prone to under-staffing and employing unqualified crew members in their vessel assignments.

4.4. Discussion

4.4.1. Model Performance Evaluation

To validate the effectiveness and advantages of the AcciMap-GCN model in causation analysis, a comparative study has been conducted against four typical GNN models, namely graph isomorphism network (GIN), graph attention network (GAT), approximate personalized propagation of neural predictions layer (APPNP), Graph Sample and AggreGatE (GraphSAGE). By adopting the optimal hyperparameter settings and model layer numbers, an experimental study was carried out and performance metrics were calculated, as shown in Table 4. The hyperparameters of four typical GNN models are summarized in Table A1.
As shown in Table 4, the AcciMap-GCN model achieves an MAE of 0.0820, an RMSE of 0.1694, and Epochs to converge of 74. All evaluation metrics of the AcciMap-GCN model are lower than the benchmark models (i.e., GIN, GAT, APPNP, and GraphSAGE), indicating that it delivers the best prediction accuracy and performance in causal forecasting. Moreover, the relatively low number of epochs required to converge highlights that the proposed AcciMap-GCN based model not only maintains high prediction accuracy but also exhibits superior training efficiency.
It can be concluded that GCN outperforms other neural network models in the study of causal relationships of maritime accidents. GIN primarily focuses on the discriminative capability of graph structure, and the causal graph structures of maritime traffic accidents are generally consistent. The GAT model mainly employs an attention mechanism to weight important information, and the causal graphs of maritime traffic accidents are typically clean and free of noise. APPNP enhances the long-range information propagation through random walks, which may affect the importance of key information. The GraphSAGE model is primarily designed for handling large-scale graph-structured data, while the dataset used in this study is relatively small. None of these models are suitable for predicting and analyzing causal relationships in maritime accidents. The results validate the applicability and effectiveness of the AcciMap-GCN-based model for causation analysis and prediction of maritime accidents in the Yangtze River waterway.
The complex network model [13] has been primarily used to describe the associations and relative importance among contributing factors. The proposed AcciMap-GCN model can analyze the causal relationships among the contributors of learning accidents and reveal the causal significance of each factor. The fault tree model [16] can only describe the top-down, linear causal relationships of individual accidents, while the AcciMap-GCN model is capable of learning causal relationships across different levels in various directions, and can also be applied to multiple accidents. Compared with Bayesian network models [12], the model proposed in this article leverages the information propagation mechanism of GNN, enabling it to dynamically learn causal importance, and reducing the degree of subjective judgment to some extent. Additionally, the AcciMap-GCN-based model is better suited for big data analysis and intelligent applications.
In summary, the AcciMap-GCN model demonstrates significant advantages in multi-level causation relationship analysis. Building upon the structure of the AcciMap framework, the model incorporates GCN to learn the topological relationships among causal nodes, thereby enabling the analysis of multi-factor, multi-level, and nonlinear causal relationships. This framework effectively addresses the shortcomings of traditional causal models in systematic analysis and big data mining.

4.4.2. Ablation Experiment

To further reveal the effectiveness of each model component, ablation experiments have been conducted by sequentially removing GWO, mutual information, and Dropout layer from the complete model, and then compared with the proposed AcciMap-GCN model. The models were trained by using the maritime accident dataset and the performance metrics were calculated for each model. MAE, RMSE, and Epochs to converge are summarized in Table 5.
As shown in Table 5, the AcciMap-GCN model exhibits the lowest MAE, RMSE, and Epochs to converge, indicating that it achieves optimal performance. Removing any one of its modules would negatively impact the performance. By removing GWO, the reduction in MAE and RMSE is relatively small, but the Epochs to converge is reduced by 22%, suggesting that GWO can enhance the operational efficiency to some extent. Compared with the model without mutual information, the MAE and RMSE decreased significantly by 42.74% and 28.67%, respectively, indicating that mutual information can effectively enhance predictive performance and plays an important role in causal importance analysis. Compared with the model without the dropout layer, Epochs to converge of the AcciMap-GCN model remains roughly unchanged, but both MAE and RMSE values decline to a certain degree, suggesting that the Dropout layer can enhance predictive performance and improve its generalization capability.

4.5. Recommendations for Maritime Safety Administration

Based on the aforementioned research findings, management recommendations in ship accident reports and suggestions provided in References [38,39], as well as extended recommendations for maritime safety administration have been provided to guide risk control in the Yangtze River waterway as follows:
  • Regulatory authorities and associations
Inadequate safety supervision and management is the primary contributing factor at this level, manifesting as insufficient oversight of shipping companies, resulting in gaps in safety management systems, expired ship certificates, unqualified crew members, and unsafe vessel modifications. Therefore, supervision of shipping companies should be strengthened, with particular attention to the establishment, implementation, and enforcement of safety policies.
2.
Relevant enterprise management
Deficiencies mainly involve inadequate crew training and education as well as inadequate safety management (as stated in Section 4.1.3), which are closely related to accident progress and personnel activities. Insufficient crew training may lead to operational errors, while inadequate safety management can negatively affect technical and operational management. Both issues would result in severe consequences. Therefore, shipping companies should strengthen training in operational skills and safety awareness of ship crews, and organize education programs on applicable laws and regulations for different waterways. Additionally, it is imperative to establish a comprehensive safety administration system.
3.
Technology and operations management
Causal factors include insufficient number of qualified crew members, inadequate cargo and equipment management, and improper watchkeeping, with insufficient number of qualified crew members being the primary factor, as shown in Figure 8. Operating vessels should be staffed with qualified crew members holding valid certifications, and schedules should be properly arranged and adhered to in order to prevent fatigue and negligence. All cargo handling operations (including loading, transshipment, and unloading) should be conducted according to the safety regulations to enhance maritime operational safety.
4.
Accident progress and personnel activities
This level consists of primary hierarchical factors contributing to ship accidents (as illustrated in Figure 9). The main causal factors at this level include improper lookout, improper operation, and weak safety awareness. Prior to navigation, crew members should be trained with emergency response, operational skills, and safety practices to enhance overall competence. During navigation, vigilant lookout should be maintained, continuous internal communication within the vessel should be ensured, and all available means (including VHF, lights, and sound signals) should be employed to mitigate navigation risk. Inland navigation regulations need be complied with to avoid shipping routes crossing without prior communication. Crew members should remain alert and exercise safety awareness, operating and responding to situations appropriately, and taking timely and effective evasive and preventive measures when emergencies arise.
5.
Equipment and environment
Key causal factors include vessel equipment and structural defects, overloading, and improper loading of the vessel (see Figure 8), which are closely related to enterprise management. Prior to navigation, crews should be familiar with the topography, hydrodynamic, and meteorological conditions. Proper cargo stowage should be ensured, with effective securing of cargo and strict avoidance of overloading. Vessel equipment should be carefully inspected to follow operational limits and ensure that the structural integrity is maintained. Critical shipboard equipment should be continuously monitored to ensure readiness in response to emergencies or unexpected situations.

5. Conclusions

This paper constructs a causation analysis model for maritime traffic accidents in the Yangtze River waterway based on the AcciMap-GCN model. By collecting official maritime accident investigation reports, the capability of the AcciMap-GCN-based model is further validated and the causal importance scores were calculated for each contributor. The model effectiveness is investigated through comparative experiments and ablation studies. The main conclusions are drawn as follows:
(1)
Based on the GCN model, mutual information weights were introduced to improve the early learning capability of the model, resulting in significant reductions in MAE and RMSE by 42.74% and 28.67%, respectively. In addition, GWO was employed to optimize the model hyperparameters, which reduced the training convergence epochs by 22%. Dropout layers were adopted to enhance the generalization ability of the proposed model, leading to decreased MAE and RMSE. These results verify the effectiveness of the proposed AcciMap-GCN model.
(2)
Compared with the benchmark models (i.e., GIN, GAT, APPNP, and GraphSAGE), the proposed model achieved an MAE of 0.0820, an RMSE of 0.1694, and converged within 74 training epochs. All evaluation metrics are better than those of benchmark models, suggesting that the coupled AcciMap-GCN model achieves superior prediction accuracy.
(3)
Among all causal factors, improper lookout obtained the highest causal importance score of 8.7, followed by failure to take effective evasive actions in time (6.47). Insufficient qualified crew members ranked the third with a score of 3.56. The lowest causal importance scores were observed for inadequate safety supervision and management, and strong winds, both of which score at 0.05.
Following the causal importance scores of the contributors at different hierarchical levels, several recommendations have been presented for maritime safety administration. These findings provide useful references for promoting sustainable and intelligent waterway transport in the Yangtze River. In future, intelligent methods (e.g., text augmentation, relation extraction and sequence labeling) can be employed to extract causal network relationships. In addition, semantic embeddings, hierarchical structure information, and frequency-aware features can be further incorporated, thereby supporting the large-scale textual analysis of maritime accidents.

Author Contributions

Z.J.: Conceptualization, funding acquisition, methodology, writing—original draft preparation, writing—review and editing. D.Y.: data curation, formal analysis, validation. Z.Y.: formal analysis, investigation, writing—review and editing. C.H.: software, validation, writing—review and editing. J.L.: data curation, resources. All authors have read and agreed to the published version of the manuscript.

Funding

This research was funded by the National Natural Science Foundation of China, grant number 52071250.

Data Availability Statement

The data can be obtained from the People’s Republic of China Maritime Safety Administration at https://www.msa.gov.cn/ (accessed on 30 April 2026) and the GISIS database of IMO at https://gisis.imo.org/Public/Default.aspx (accessed on 7 October 2025).

Conflicts of Interest

The authors declare no conflicts of interest.

Appendix A

To ensure fairness and rigor of model comparison, the hyperparameters of baseline models are optimized by adopting a grid search strategy within the predefined search spaces. The details of hyperparameter settings for different models are summarized and provided in Table A1.
Table A1. Hyperparameter settings of four baseline models.
ModelHidden Layer DimensionLayersLearning RateDropout RateKey Parameters
GIN6430.0010.3MLP = 2
GAT6430.0010.2Heads = 8
APPNP6420.010.2α = 0.1, K = 10
GraphSAGE6430.0010.3Aggregator = mean

References

  1. Jiang, H.; Zhang, J.; Wan, C.; Zhang, M.; Soares, C.G. A Data-Driven Bayesian Network Model for Risk Influencing Factors Quantification Based on Global Maritime Accident Database. Ocean Coast. Manag. 2024, 259, 107473. [Google Scholar] [CrossRef]
  2. Fan, C.; Bolbot, V.; Montewka, J.; Zhang, D. Advanced Bayesian Study on Inland Navigational Risk of Remotely Controlled Autonomous Ship. Accid. Anal. Prev. 2024, 203, 107619. [Google Scholar] [CrossRef]
  3. Ma, S.; Zayed, T.; Xing, J.; Ren, Z. Analyzing Factors Influencing Defect-Based Conditions for Sewer Pipes Using Bayesian Networks. Reliab. Eng. Syst. Saf. 2025, 262, 111243. [Google Scholar] [CrossRef]
  4. Yang, J.-F.; Wang, P.-C.; Liu, X.-Y.; Bian, M.-C.; Chen, L.-C.; Lv, S.-Y.; Tao, J.-F.; Suo, G.-Y.; Xuan, S.-Q.; Li, R.; et al. Analysis on Causes of Chemical Industry Accident from 2015 to 2020 in Chinese Mainland: A Complex Network Theory Approach. J. Loss Prev. Process Ind. 2023, 83, 105061. [Google Scholar] [CrossRef]
  5. Wang, L.; Yang, Z. Bayesian Network Modelling and Analysis of Accident Severity in Waterborne Transportation: A Case Study in China. Reliab. Eng. Syst. Saf. 2018, 180, 277–289. [Google Scholar] [CrossRef]
  6. Shi, J.; Liu, Z.; Feng, Y.; Wang, X.; Zhu, H.; Yang, Z.; Wang, J.; Wang, H. Evolutionary Model and Risk Analysis of Ship Collision Accidents Based on Complex Networks and DEMATEL. Ocean Eng. 2024, 305, 117965. [Google Scholar] [CrossRef]
  7. Guo, S.; Zhou, X.; Tang, B.; Gong, P. Exploring the Behavioral Risk Chains of Accidents Using Complex Network Theory in the Construction Industry. Phys. A Stat. Mech. Its Appl. 2020, 560, 125012. [Google Scholar] [CrossRef]
  8. Diao, X.; Jiang, J.; Mebarki, A.; Ni, L.; Duo, Y.; Chen, S.; Wang, Y.; Zhang, S. Risk Analysis of Domino Effect of Leakage Accident of Petrochemical Pipeline Based on Analytic Hierarchy Process and Fuzzy Fault Tree Analysis. Saf. Sci. 2025, 187, 106852. [Google Scholar] [CrossRef]
  9. Xing, S.; Ling, L.; Zhang, W.; Zhang, C.; Cheng, Q.; István, K.D.; Sheng, X.; Duan, Y.; Liao, Q. Risk Assessment of Hydrogen-Powered Vehicle Accidents Based on Fuzzy Fault Tree and ALARP Criterion. Int. J. Hydrogen Energy 2026, 207, 153482. [Google Scholar] [CrossRef]
  10. Zhao, F.; Zou, S.; Xu, S.; Wang, J.; Xu, T.; Tang, D. Safety Analysis of Marine Nuclear Reactor in Severe Accident with Dynamic Fault Trees Based on Cut Sequence Method. Nucl. Eng. Technol. 2022, 54, 4560–4570. [Google Scholar] [CrossRef]
  11. Guan, W.; Zhang, C.; Dong, C.; Xia, Y. Ship Fire and Explosion Accident Statistical Analysis Based on Fault Tree and Bayesian Network. Fire Saf. J. 2025, 153, 104358. [Google Scholar] [CrossRef]
  12. Yin, J.; Khan, R.U.; Afzaal, M.; Nawaz, R.; Shanshan, X.; Jamal, A. A Fuzzy Bayesian Quantitative Risk Assessment for Language and Communication Induced Accidents in Maritime Operations. Ocean Coast. Manag. 2024, 259, 107449. [Google Scholar] [CrossRef]
  13. Liu, K.; Yu, Q.; Yuan, Z.; Yang, Z.; Shu, Y. A Systematic Analysis for Maritime Accidents Causation in Chinese Coastal Waters Using Machine Learning Approaches. Ocean Coast. Manag. 2021, 213, 105859. [Google Scholar] [CrossRef]
  14. Yang, L.; Liu, J.; Liu, Z.; Zhou, Q.; Liu, Y.; Wang, Y.; Wu, W. From Text to Network: A Framework for Identifying Causal Factors and Risk Propagation Paths in Maritime Accidents. Reliab. Eng. Syst. Saf. 2026, 271, 112282. [Google Scholar] [CrossRef]
  15. Zhang, X.; Chen, P.; Mou, J.; Chen, L.; Li, M. Critical Causation Factor Analysis in Ship Collision Accidents with Complex Network. Ocean Eng. 2025, 315, 119837. [Google Scholar] [CrossRef]
  16. Ugurlu, H.; Cicek, I. Analysis and Assessment of Ship Collision Accidents Using Fault Tree and Multiple Correspondence Analysis. Ocean Eng. 2022, 245, 110514. [Google Scholar] [CrossRef]
  17. Ma, L.; Zhao, R. AcciMap Causal Analysis of Chinese Chemical Industry Accidents Unraveled by Graph Neural Networks. Reliab. Eng. Syst. Saf. 2025, 264, 111425. [Google Scholar] [CrossRef]
  18. Zhang, X.; Lin, Y.; Yang, S.; Liu, Y.; Yu, A. Research on Accident Evolution Analysis of Hazardous Gas Leak Based on Graph Neural Networks. J. Loss Prev. Process Ind. 2026, 101, 105938. [Google Scholar] [CrossRef]
  19. Ning, N.; Zhang, W.; Li, W.; Li, H.; Zhang, Y.; Zhou, Y.; Liu, F. Spatial–Temporal Causal Fusion Graph Neural Networks for Urban Traffic Prediction. Comput. Netw. 2025, 271, 111582. [Google Scholar] [CrossRef]
  20. Gao, P.; Shuai, B.; Zhang, R.; Wang, B. STCAGNN-RNKDE: A Traffic Accident Prediction Model for Spatiotemporal Combinatorial Attention Graph Neural Networks Using Ripley’s K and Network Kernel Density Estimation. Reliab. Eng. Syst. Saf. 2026, 265, 111593. [Google Scholar] [CrossRef]
  21. Chen, L.; Ding, Y.; Gu, J.; Dong, X. A Study on Accident Chain Identification for Oil and Gas Pipelines Based on Graph Neural Network Algorithms. Procedia Comput. Sci. 2025, 266, 1012–1019. [Google Scholar] [CrossRef]
  22. Wang, X.; Wang, H.; Peng, M. Interpretability Study of a Typical Fault Diagnosis Model for Nuclear Power Plant Primary Circuit Based on a Graph Neural Network. Reliab. Eng. Syst. Saf. 2025, 261, 111151. [Google Scholar] [CrossRef]
  23. Gan, L.; Gao, Z.; Zhang, X.; Xu, Y.; Liu, R.W.; Xie, C.; Shu, Y. Graph Neural Networks Enabled Accident Causation Prediction for Maritime Vessel Traffic. Reliab. Eng. Syst. Saf. 2025, 257, 110804. [Google Scholar] [CrossRef]
  24. Liu, R.; Zhang, M.; Yan, R.; Yang, Z. Causal Analysis of Ship Inspection Data and Maritime Accidents through Causal Neural Networks. Reliab. Eng. Syst. Saf. 2026, 271, 112255. [Google Scholar] [CrossRef]
  25. Lee, S.; Moh, Y.B.; Tabibzadeh, M.; Meshkati, N. Applying the AcciMap Methodology to Investigate the Tragic Sewol Ferry Accident in South Korea. Appl. Ergon. 2017, 59, 517–525. [Google Scholar] [CrossRef] [PubMed]
  26. Chen, J.; Wu, L.; Zhou, Y.; Hua, F.; Zhong, M. Lessons and Improvements: Subway Waterlogging Catastrophe in Zhengzhou, China. Tunn. Undergr. Space Technol. 2024, 144, 105541. [Google Scholar] [CrossRef]
  27. Liu, J.; Wang, X.; Wang, C.; Gao, Y.; Liu, M. Temporal Decoupling Graph Convolutional Network for Skeleton-Based Gesture Recognition. IEEE Trans. Multimed. 2024, 26, 811–823. [Google Scholar] [CrossRef]
  28. Behera, S.; Contreras-Reyes, J.E.; Kayal, S. Mutual Information Matrix and Global Measure Based on Tsallis Entropy. Nonlinear Dyn. 2025, 113, 5239–5249. [Google Scholar] [CrossRef]
  29. Mirjalili, S.; Mirjalili, S.M.; Lewis, A. Grey Wolf Optimizer. Adv. Eng. Softw. 2014, 69, 46–61. [Google Scholar] [CrossRef]
  30. Zhao, D.; Cai, G.; Wang, Y.; Li, X. Path Planning of Obstacle-Crossing Robot Based on Golden Sine Grey Wolf Optimizer. Appl. Sci. 2024, 14, 1129. [Google Scholar] [CrossRef]
  31. Lan, T.; Zhang, X.; Qu, D.; Yang, Y.; Chen, Y. Short-Term Traffic Flow Prediction Based on the Optimization Study of Initial Weights of the Attention Mechanism. Sustainability 2023, 15, 1374. [Google Scholar] [CrossRef]
  32. Tahraoui, H.; Toumi, S.; Hassein-Bey, A.H.; Bousselma, A.; Sid, A.N.E.H.; Belhadj, A.-E.; Triki, Z.; Kebir, M.; Amrane, A.; Zhang, J.; et al. Advancing Water Quality Research: K-Nearest Neighbor Coupled with the Improved Grey Wolf Optimizer Algorithm Model Unveils New Possibilities for Dry Residue Prediction. Water 2023, 15, 2631. [Google Scholar] [CrossRef]
  33. Wang, Q.; Huang, R.; Xiong, J.; Yang, J.; Dong, X.; Wu, Y.; Wu, Y.; Lu, T. A survey on fault diagnosis of rotating machinery based on machine learning. Meas. Sci. Technol. 2024, 35, 102001. [Google Scholar] [CrossRef]
  34. Gasteiger, J.; Bojchevski, A.; Günnemann, S. Predict Then Propagate: Graph Neural Networks Meet Personalized PageRank. arXiv 2018, arXiv:1810.05997. [Google Scholar]
  35. Zhou, Z.-H. A Brief Introduction to Weakly Supervised Learning. Natl. Sci. Rev. 2018, 5, 44–53. [Google Scholar] [CrossRef]
  36. Ren, Z.; Wang, S.; Zhang, Y. Weakly Supervised Machine Learning. CAAI Trans. Intell. Technol. 2023, 8, 549–580. [Google Scholar] [CrossRef]
  37. Chen, H.; Hu, Q.; Zhai, B.; Chen, H.; Liu, K. A Robust Weakly Supervised Learning of Deep Conv-Nets for Surface Defect Inspection. Neural Comput. Appl. 2020, 32, 11229–11244. [Google Scholar] [CrossRef]
  38. Yuan, Z.; Li, W.; Zhao, X.; Wei, T.; Liu, Y.; Liu, J. Enhancing the Efficiency of Maritime Navigation Environmental Resource Management Based on Text Mining Techniques. Reg. Stud. Mar. Sci. 2025, 81, 103988. [Google Scholar] [CrossRef]
  39. Leatherman, S.P.; Leatherman, S.B.; Rangel-Buitrago, N. Integrated Strategies for Management and Mitigation of Beach Accidents. Ocean Coast. Manag. 2024, 253, 107173. [Google Scholar] [CrossRef]
Figure 1. Structure of the proposed AcciMap-GCN model.
Sustainability 18 04700 g001
Figure 2. Distribution of accident types in the main Yangtze River waterway.
Sustainability 18 04700 g002
Figure 3. Temporal distribution of maritime accidents in the main Yangtze River waterway.
Sustainability 18 04700 g003
Figure 4. Spatial distribution of maritime accidents in the Yangtze River waterway (2015–2025).
Sustainability 18 04700 g004
Figure 5. Construction process of the AcciMap node diagram for ship accidents. (a) Construction of the AcciMap diagram for ship accidents; (b) an example of constructing a node relationship diagram for ship accident.
Sustainability 18 04700 g005
Figure 6. An example of ship accident adjacency matrix construction.
Sustainability 18 04700 g006
Figure 7. Heatmap of the average mutual information.
Sustainability 18 04700 g007
Figure 8. Causal importance scores of secondary contributors of maritime accidents.
Sustainability 18 04700 g008
Figure 9. Causal importance scores of the primary-level factors in maritime traffic accidents.
Sustainability 18 04700 g009
Table 1. Sources of official maritime accident investigation reports.
SourcesAffiliationsNumber of Accident ReportsTime Period
Maritime Safety Administration of the People’s Republic of ChinaYangtze River Maritime Safety Administration28January 2015–April 2025
Jiangsu Maritime Safety Administration67
Shanghai Maritime Safety Administration43
International Maritime Organization (IMO)GISIS official website3
Table 2. Set of contributors of maritime traffic accidents based on the AcciMap model.
First LevelShip Accident Causal Factors
(Secondary Causes)
Index
Regulatory Authorities and Associations (A1)Inadequate Safety Supervision and Managementa1
Relevant Enterprise Management (A2)Inadequate Crew Training and Educationa2
Inadequate Safety Managementa3
Technology and Operations Management (A3)Inadequate Cargo and Equipment Managementa4
Insufficient Number of Qualified Crew Membersa5
Failure to Comply with Safety Operating Regulations and Requirementsa6
Improper Watchkeepinga7
Accident Progress and Personnel Activities (A4)Violating Navigation Regulationsa8
Failure to Follow Designated Routesa9
Improper Lookouta10
Failure to Take Timely and Effective Evasion Measuresa11
Failure to Maintain Adequate Safety Distancea12
Poor Communicationa13
Improper Emergency Handlinga14
Improper Operationa15
Failure to Use Safe Speeda16
Inadequate Preventive Measuresa17
Weak Safety Awarenessa18
Equipment and Environment (A5)Strong Wind Conditionsa19
Poor Visibilitya20
Ship Equipment and Structural Defectsa21
Overloading of the Vessela22
Improper Loading of the Vessela23
Sudden Fog Conditionsa24
Complex Navigational Environmenta25
Table 3. Hyperparameter optimization by GWO.
HyperparameterDescriptionValue
Learning rateStep size for parameter updates0.0013
Dropout rateProportion of neurons randomly deactivated0.2
Hidden layer dimensionDimensionality of feature representation64
Table 4. Performance comparison with other benchmark models.
ModelMAERMSEEpochs to Converge
AcciMap-GCN0.08200.169474
GIN0.09620.1802115
GAT0.12970.2034219
APPNP0.14570.219089
GraphSAGE0.08550.1772120
Table 5. Model performance comparison for ablation experiments.
ModelMAERMSEEpochs to Converge
AcciMap-GCN0.08200.169474
No GWO0.08890.179595
No mutual information0.14320.237579
No Dropout layer0.11430.238575
Disclaimer/Publisher’s Note: The statements, opinions and data contained in all publications are solely those of the individual author(s) and contributor(s) and not of MDPI and/or the editor(s). MDPI and/or the editor(s) disclaim responsibility for any injury to people or property resulting from any ideas, methods, instructions or products referred to in the content.