Abstract
To effectively mitigate risks in highway construction and thereby ensure the sustainable development of the transportation sector, this study identifies 27 risk factors across five dimensions—human–machine–environment–process–management—through a combination of literature review, construction accident case analyses, and expert interviews. The Decision-Making Trial and Evaluation Laboratory (DEMATEL) method, combined with the Maximum Mean Deviation Entropy (MMDE) approach for threshold determination, quantifies centrality and causality of these factors. An Interpretive Structural Modeling (ISM) is employed to construct a multi-level hierarchical framework. The research reveals that highway construction safety risks follow a seven-tier structure: “risk characterization-process assurance-source governance-driven”. Safety education and regulatory systems serve as fundamental drivers, while hazard identification and mitigation, extreme weather response protocols, and equipment compliance form critical safeguard mechanisms. Building on this framework, the study proposes a risk control pathway of “source governance–process interruption–terminal response”, offering practical recommendations for safety management and providing new perspectives for engineering risk assessment and method optimization.
1. Introduction
As the core carrier of the transportation infrastructure network, the safety and stability of highway engineering, as well as resource utilization efficiency during its construction phase, directly determine the sustainability level of the transportation system throughout its entire life cycle. With the rapid advancement of infrastructure construction in China, highway engineering, as a vital component of the national transportation network, has witnessed increasingly prominent complexity and uncertainty in its construction process. Highway construction often confronts issues such as complex geological conditions, variable climatic environments, high requirements for construction technology, and a large number of participating entities. These factors are intertwined, making it highly prone to triggering various risk events. Therefore, in-depth research on highway construction safety risk factors and identification of key risk factors hold significant practical significance for effectively preventing safety accidents and ensuring the smooth progress of highway engineering projects.
In the evolution of research methodologies for risk factors, traditional tools such as Fault Tree Analysis (FTA) and Analytic Hierarchy Process (AHP) struggle to handle the complex interrelationships among factors. However, the integration of Decision-Making Trial and Evaluation Laboratory (DEMATEL) and Interpretive Structural Modeling (ISM) has provided a new approach: DEMATEL identifies core driving factors by calculating centrality and causality, while ISM reveals the hierarchical transmission paths among factors through a multi-level hierarchical structure.
In the field of basic applications of the DEMATEL-ISM method, it has been widely used in multiple fields including engineering technology, social services, and industry management. Its core function is to provide support for practical decision making by identifying key factors and constructing analytical models [1,2,3,4,5,6,7]. In the field of fuzzy improvement applications, the fuzzy DEMATEL-ISM method effectively addresses the uncertainty of evaluation information and has been extensively applied in studies such as the evaluation of sustainable development of agricultural mechanization, the construction of construction safety climate, and supply chain barrier analysis. By constructing a hierarchical model to clarify core driving factors, it enhances the objectivity and adaptability of analytical results [8,9,10,11].
In research on multi-method integration, the combination of DEMATEL-ISM and Bayesian Network (BN) focuses on risk early warning and causal path identification. It has realized the expansion of quantitative risk prediction and diagnosis functions [12,13]; Additionally, this method has been cross-integrated with several algorithms. These include the entropy weight method, Failure Mode, Effects, and Criticality Analysis (FMECA), and Analytic Network Process (ANP). Such integrations have been applied in various scenarios, such as system structure analysis, fault diagnosis, and indicator system construction. Through functional complementarity, they enhance the scientific rigor and accuracy of the analysis [14,15,16,17,18,19]. In terms of methodological optimization and improvement, scholars have made adaptive modifications to the DEMATEL-ISM method. They have achieved this by introducing new consensus algorithms, fuzzy set theory, or optimizing algorithmic logic. These improvements make the method more suitable for specific scenario requirements. Typical examples include blockchain optimization, complex system analysis, and supply chain resilience research. Consequently, the practicality and efficiency of the DEMATEL-ISM method have been significantly enhanced [20,21,22,23,24].
In the traditional DEMATEL-ISM method, experts are required to score to determine the degree of influence between risk factors for the first time, and the determination of thresholds in the process of converting to the reachability matrix of ISM also usually relies on experts’ subjective judgments, which is a common problem. However, the maximum entropy principle in the field of physics, which calculates inverse entropy through probability distribution and locates critical values based on the “maximum average” logic—with the common goal of maximizing system order—can be directly applied to impact matrix analysis, allowing data rules to determine thresholds and thereby reducing subjective biases. Therefore, this study proposes to introduce the Maximum Mean Deviation Entropy (MMDE) into the DEMATEL-ISM method for the analysis of highway construction safety risk factors, so as to reduce its subjective errors.
2. Methodology
The DEMATEL-ISM method is a comprehensive analytical tool that combines DEMATEL (Decision-Making Trial and Evaluation Laboratory) and ISM (Interpretive Structural Modeling). It is mainly used to analyze the influence relationships among various elements in complex systems, reveal the hierarchical structure and core driving mechanism of the system, and is widely applied in the fields of management science, engineering technology, social economy, etc. Its core logic lies in transforming the vague relationships among system elements into a visual structured model through a progressive process of “quantifying the intensity of influence relationships → identifying core elements → constructing a hierarchical structure”.
The MMDE method introduced in this study focuses on the determination of the threshold during the conversion process to the reachability matrix of ISM. It optimizes the threshold in a more objective and scientific manner, thereby improving the objectivity and accuracy of the system as a whole. The specific process is shown in Figure 1.
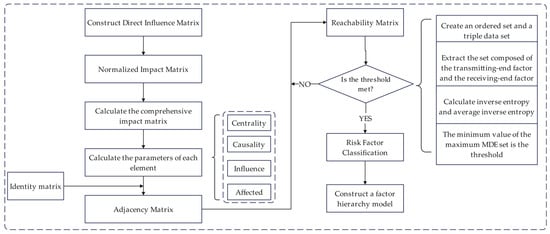
Figure 1.
Improved DEMATEL-ISM flow chart.
The specific steps are as follows:
(1) Construct the direct influence matrix M. The expert scoring method is used to evaluate the pairwise influence degree among elements. To reduce the interference of individual subjective cognitive bias on the results, a 0–1 scale is adopted to define the direct influence relationship between elements, representing “no direct influence” and “having direct influence” respectively. The evaluation results of all experts are integrated and processed based on Formula (1), and the influence degree between elements is quantified into a numerical value (aij) ranging from 0 to 3. The specific assignment criteria are as follows: 0 points correspond to no influence, 1 point to weak influence, 2 points to moderate influence, and 3 points to strong influence. Finally, the direct influence matrix M = (mij)n×n is constructed.
(2) The solved direct impact factor matrix M is subjected to a normalization process. Specifically, the factors in each row are summed up, and the maximum value among these row sums is taken as the denominator for normalization, yielding the normalized matrix D = (dij)n×n.
(3) Calculate the comprehensive impact matrix E = (eij)n×n, which characterizes the comprehensive direct and indirect impacts between various factors.
where I is the identity matrix and −1 is the inverse matrix in Equation (3).
(4) Compute the degree of influence (ci), degree of being influenced (fi), centrality degree (zi), and cause degree (ri) for each factor, as shown in Equations (4)–(7).
(5) Determination of the threshold λ using the MMDE method.
Traditional methods for determining the threshold can generally be categorized into two types: one involves thresholds determined based on expert decisions, field investigations, and literature research, while the other adopts the sum of the mean value α and standard deviation β of the adjacency matrix as the threshold. However, both methods rely on expert judgments, making it difficult to eliminate subjective biases. To address this limitation, this study introduces the MMDE method. By leveraging the information entropy analysis of mutual influences within the system, this method enables a more objective and reasonable determination of the threshold λ.
For the implementation of the MMDE method, a set of random variables is defined as X = {x1, x2, …, xn}, with their relative probabilities denoted as P = {p1, p2, …, pn}. The information entropy is defined as: H(p1, p2, …, pn) = −∑pilnpi where ∑pi = 1, and if pi = 0, then pilnpi = 0 (following the convention for entropy calculation at zero probability). The entropy removal (HD) is defined as:
Construct the set of ordered triplets: Convert the comprehensive impact matrix E = (eij)n×n into a set of triplets, where each element is formatted as {comprehensive impact value, row index of the element, column index of the element}. Sort these triplets in descending order of the comprehensive impact values to form the set E∗.
Extract row/column sets: Separately extract the row indices corresponding to all elements in E∗ to form the row set Ed; similarly, extract the column indices to construct the column set Er.
Calculate Modified Data Entropy (MDE) values: For the i-th element in Ed(or Er), compute its MDE value as follows:
In the formula, N(Eid) or N(Eir) denotes the number of categories of factors in Eid (or Eir).
Filter key rows/columns: Traverse the set composed of and , extract the maximum value; filter out elements in the rows (or columns) whose influence degree exceeds this maximum value, remove duplicates to retain unique elements, and construct a new set.
Determine the maximum influence set: The results of Step 4 are triplet sets and , corresponding to the elements with the highest influence degree in E∗.
Calculate the threshold value: Take the union Eth of and , and use the minimum influence degree value in Eth as the final threshold.
(6) Calculate the adjacency matrix H = (hij)n×n and the reachability matrix L = (lij)n×n.
(7) Hierarchical division based on the reachability matrix: By defining the “reachability set” (i.e., the set of all elements directly or indirectly influenced by the factor) and “antecedent set” (i.e., the set of all elements that directly or indirectly influence the factor) for each risk factor (or system element), screen out elements that simultaneously satisfy “reachability set = antecedent set” and “reachability set ∩ antecedent set = reachability set”, and designate them as the top level of the system. Subsequently, eliminate the elements of the already classified level from the reachability matrix, and repeat the aforementioned calculation and screening processes of reachability sets and antecedent sets until all elements are assigned to corresponding levels. Ultimately, a hierarchical structure model among the elements is formed.
3. Indicator System for Construction Risk Factors of Highway Engineering
3.1. Data Sources and Expert Panel
As a core component of national infrastructure, highway engineering is crucial to the life and health of practitioners, engineering construction benefits, and public safety. However, its construction process is characterized by high risk and complexity. Although the safety management system for highway construction in China has been gradually improved, accidents such as collapses and mechanical injuries still occur from time to time. Existing studies mostly focus on single risk types, lacking systematic sorting and mechanism analysis of risk factors throughout the entire construction process, which makes it difficult to support precise risk prevention and control. Given this, this study conducts an analysis of safety risk factors in combination with highway construction practices, aiming to identify core factors, clarify their attributes (e.g., human, equipment, structure, environmental, and management factors) and interrelationships. This work provides preliminary support for subsequent risk assessment and control and promotes the transformation of safety management from “post-event disposal” to “pre-event prevention”.
To collect safety risk factors of highway construction, this study comprehensively adopts three research methods: literature review, case analysis, and expert interviews. Firstly, academic databases including CNKI, Wanfang Data, and Web of Science were searched using core keywords such as “highway construction safety,” “risk index system,” and “risk identification.” After screening, 63 representative studies were finally included. Secondly, combined with relevant research projects participated in by the research team, 216 relevant case datasets from 2008 to 2024 were collected from official websites of governments and enterprises, covering major accident types such as collapses, mechanical injuries, and falls from heights. Finally, a total of 42 experts in related fields were invited to participate in questionnaire interviews. After excluding questionnaires with incomplete information and those completed by experts with less than 10 years of work experience, 35 valid questionnaires were retained. The composition of the expert panel is shown in Table 1.

Table 1.
Expert Panel.
3.2. Scoring Process and Data Validation
In accordance with the industry standard Technical Requirements for Safety Monitoring and Early Warning Systems in Highway Engineering Construction (JT/T 1498-2024) [25], officially implemented by the Ministry of Transport of the People’s Republic of China on 1 July 2024, the monitoring of safety risk factors in highway engineering construction shall cover five dimensions: human factors, structural factors, mechanical and equipment factors, environmental factors, and management factors.
Through systematic literature review and case analysis, core studies and industry standards in the fields of highway construction safety management and risk assessment were comprehensively summarized. High-frequency risk dimensions and core indicators were extracted, and an initial indicator framework consisting of 5 core dimensions was established. Subsequently, an expert questionnaire survey was conducted. Based on the recovered questionnaire data, the expert recognition ratio of each preliminary indicator was calculated, with 0.5 set as the screening threshold. Indicators with a recognition ratio exceeding 50% were retained, while non-compliant indicators such as “structural response” and “drainage facilities” were eliminated. New indicators including “professional ethics and sense of responsibility of construction workers” and “temporary traffic organization facilities” were added. Meanwhile, “meteorological environment” was adjusted to “extreme weather” to improve indicator accuracy, Table 2. Finally, 27 highway construction safety risk factors were determined, and the framework of the highway construction safety risk factor index system was constructed, as shown in Figure 2.
Table 2.
Establishment Process of the Highway Construction Safety Risk Factor Index System.
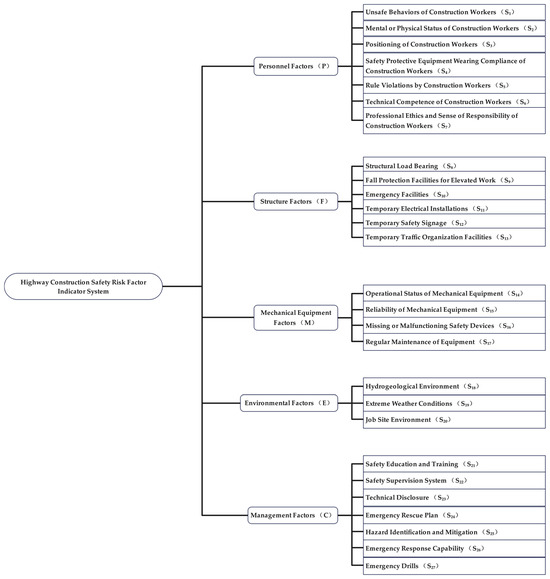
Figure 2.
Road construction safety risk factor index system framework.
The two-round Delphi method was adopted for scoring. In the first round, experts independently conducted 0–1 scale scoring for 27 × 27 factor pairs. For the relationships between factors with significant discrepancies (agreement rate < 50%), an offline seminar was organized to clarify the judgment basis, followed by the second round of scoring to ultimately reach a consensus.
To verify the reliability of experts’ judgments on 729 sets of direct influence relationships (0 = no influence/1 = having influence) among 27 highway construction safety risk factors, the Fleiss’ Kappa coefficient was used for the consistency test of multi-rater binary classification. As a classic tool for quantifying the consistency of multi-expert classification judgments, this method has core advantages in separating the actual agreement rate from the expected random agreement rate, effectively eliminating false consistency caused by random coincidence. Its calculation logic follows the corresponding formula, which is suitable for the “multi-expert—binary classification” judgment scenario of this study and superior to the traditional simple agreement rate test. The calculation results showed that the Fleiss’ Kappa coefficient was 0.7382 (p < 0.001), indicating that experts’ judgments on the direct influence relationships between risk factors had significant non-random consistency, and the consistency level reached a good grade. This result verifies the objectivity and reliability of experts’ judgments, provides a solid data foundation for the subsequent integration and construction of the direct influence matrix, and ensures the scientificity and effectiveness of the hierarchical analysis of the DEMATEL-MMDE-ISM model.
4. Research Results and Discussion
4.1. Matrix Construction and Core Degree Analysis
Based on the expert scoring results and Formula (1), the direct influence matrix M was integrated and obtained, Table 3.
Table 3.
Direct impact matrix.
Subsequently, Steps 2 to 4 outlined in Chapter 2 were performed. First, matrix M was subjected to normalization processing to obtain the normalized influence matrix. Then, the comprehensive influence matrix E = (eij)n×n was derived using Formula (3). The influence degree ci, affected degree fi, centrality zi, and causality degree ri among each factor were calculated using Formulas (4)–(7), as illustrated in Figure 3.
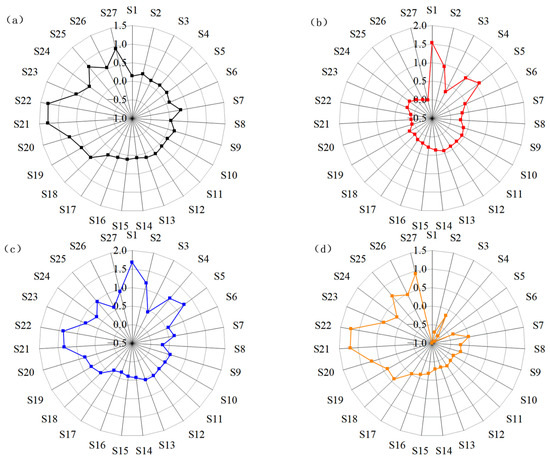
Figure 3.
Risk cause diagram. (a) Impact Degree of Risk Factors; (b) Degree of Impact on Risk Factors; (c) Risk Factor Centrality; (d) Degree of Causality of Risk Factors.
Based on the DEMATEL analysis results, the 27 indicators are classified into causal factors and result factors according to causality degree: 10 indicators, including hydrogeological environment (S18), site environment (S19), extreme weather (S20), safety education and training (S21), and safety supervision system (S22), are categorized as causal factors—acting as “source factors” that actively influence other indicators. In contrast, 17 indicators such as unsafe behaviors of construction workers (S1) and psychological or physical conditions (S2) are result factors, which are passively affected “derivative indicators”. From the perspective of centrality, unsafe behaviors of construction workers (S1, 1.676), safety supervision system (S22, 1.379), and safety education and training (S21, 1.332) are the most important indicators in the overall system. Among them, safety supervision system (S22, causality degree = 1.214), safety education and training (S21, causality degree = 1.205), and emergency drills (S27, causality degree = 0.926) possess both high causality degree and high centrality, serving as core sources for risk control. Meanwhile, high-centrality result factors such as unsafe behaviors of construction workers (S1), violation of operating procedures (S5), and psychological or physical conditions (S2) are direct focal points for risk prevention and control, requiring indirect improvement through the management of source causal factors.
4.2. Threshold Determination and Hierarchical Model Analysis
Finally, the threshold λ was determined, and the reachability matrix T = (tij)n×n was calculated using the MMDE method described in Step (5) of Chapter 2. First, the influence values in the comprehensive influence matrix E were sorted in descending order to obtain the set of triplets E∗ = (eij, i, j), where each triplet can be interpreted as (influence value, influence source, influence sink). The influence sources corresponding to all factors in E∗ form the influence source set Ed; similarly, the influence sinks were extracted to form the influence sink set Er. Using Formulas (8) and (9), the step size was increased by 1 incrementally n ϵ [1, 729] to calculate the MDE values, resulting in MDE results corresponding to a total of 1458 factor sets, as illustrated in Figure 4. The step size n corresponding to the maximum MDE of the influence source was 31, and that corresponding to the maximum MDE of the influence sink was 3. Finally, the influence values in E corresponding to the maximum values of MDED (maximum MDE of influence source) and MDER (maximum MDE of influence sink) were extracted to construct a set containing these two values. The minimum influence value in this set was adopted as the threshold λ, as presented in Table 4.
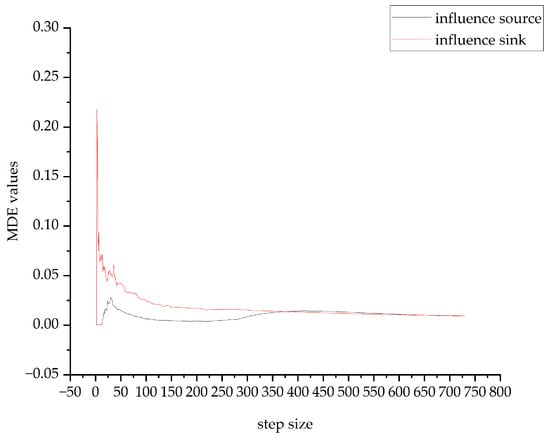
Figure 4.
MDE value plot.
Table 4.
Threshold results by MMDE.
Based on the threshold λ = 0.041 obtained above, the reachability matrix L = (lij)27×27 can be derived using Formula (10), and the results are presented in Table 5.
Table 5.
Reach matrix.
The hierarchical system of construction safety factors presents a progressive logic of “risk manifestation—guarantee support—source driving”, as illustrated in Figure 5. Level 1 (top layer), serving as the risk manifestation layer, centrally includes direct violation indicators such as unsafe behaviors of construction workers (S1), safety protective equipment (PPE) usage (S4), and violation of operating procedures (S5), as well as the structural safety indicator of structural load-bearing capacity (S8). It represents the most intuitive external output of safety risks. Levels 2 to 5 constitute the intermediate guarantee support layer: Level 2 covers indicators related to the basic status of personnel, temporary facilities, and equipment, including the psychological or physical conditions of construction workers (S2), technical competence (S6), emergency facilities (S10), and temporary electrical facilities (S11); Level 3 comprises indicators for personnel detail management and special protection, such as construction worker positioning (S3), professional ethics and sense of responsibility (S7), and fall protection facilities for high-altitude operations (S9); Level 4 involves environmental prerequisites and key capability indicators, including hydrogeological environment (S18), technical disclosure (S23), and emergency response capability (S26); Level 5, as the extreme risk prevention and control layer, consists of extreme weather (S20) and hidden danger investigation and rectification (S25). Collectively, these intermediate levels perform functions of “risk buffering—process regulation—compliance guarantee” and serve as critical transmission carriers connecting top-level risks and bottom-level management. Levels 6 to 7 (bottom layers) act as the source driving and ultimate guarantee layer: Level 6 provides institutional design and capability input through safety education and training (S21) and safety supervision system (S22); Level 7 achieves the closed-loop transformation of emergency management via emergency drills (S27). Together, they form the foundation of the safety management system. Meanwhile, factors at each level exhibit clear functional differentiation and cross-level collaborative linkage. For instance, the safety supervision system (S22) can influence the compliance of personnel behaviors in Level 2, and emergency drills (S27) can enhance the emergency response capability (S26) in Level 4, highlighting the characteristics of “classified management—collaborative linkage”. Additionally, this system provides a theoretical basis for “priority ranking—targeted intervention” in safety management: Level 1 is identified as the primary target for safety inspections, Level 6 requires integration into long-term planning, and Levels 5 and 7 serve as key areas for special management. Furthermore, a targeted intervention model can be constructed based on the path of “institutional improvement (S21, S22) → process regulation (intermediate layer factors) → risk reduction (S1, S4, S5, S8)”, offering reference for the scientization and systematization of construction safety management.
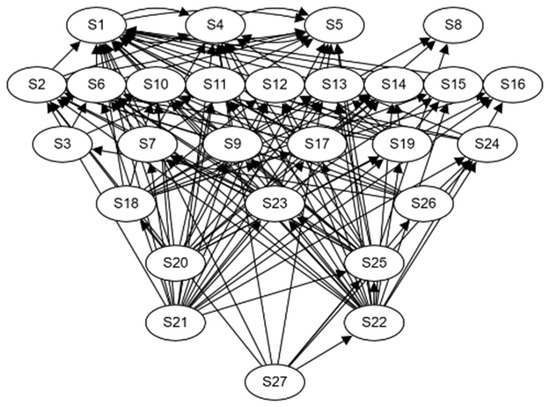
Figure 5.
Hierarchical model.
5. Comparison Results and Discussion
To verify the superiority of the MMDE-derived λ, two traditional threshold methods were selected for comparison: ① expert-selected threshold (λ = 0.052); ② λ = mean(E) + std(E), (λ = 0.023 + 0.014 = 0.037). The comparison results are shown in Table 6.
Table 6.
Comparison of Threshold Methods.
The comparison results indicate that the 7-layer structure determined by the MMDE threshold not only avoids the hierarchical compression issue of the expert-subjectively determined threshold but also addresses the excessive segmentation flaw of the mean + standard deviation threshold. The hierarchical logic is highly consistent with the actual process of highway construction safety management, namely “source governance—process control—terminal response,” exhibiting the optimal interpretability.
Compared with most existing studies (e.g., [2,13,15]), this study refines the intermediate process layers, which is more in line with the characteristics of engineering construction featuring “multiple links and strong correlations.” Meanwhile, two new layers—“extreme prevention and control layer” and “emergency closed-loop layer”—are added to highlight the uncertainty of the highway construction environment and the importance of emergency management.
The risk control system proposed in this study is highly aligned with the sustainable development of transportation systems, reflected in the following aspects: ① Taking life-cycle safety as the core, it reduces accident rates, extends engineering service life, and lowers full-cycle maintenance costs through source governance; ② Regarding resilience improvement as the key, it enhances the adaptability of infrastructure to sudden risks by relying on emergency drills and extreme weather response measures; ③ Targeting resource efficiency, it eliminates potential hazards in advance through hidden danger investigation and remediation, avoiding resource waste and environmental damage caused by accidents. Fully integrating the concept of green construction, this system promotes the safe, efficient, and low-carbon development of transportation systems.
In the future, more cross-domain technologies could be integrated. For instance, monocular depth estimation technology [26] could be applied to real-time distance monitoring of construction machinery operations; the idea of vehicle kinematics information mining [27] could be drawn on to optimize the operational safety management and control of engineering vehicles; or predictive control strategies [28] could be introduced to further improve the timeliness and accuracy of risk prediction. The integrated application of such cross-domain technologies is expected to realize the transformation of highway construction risk management from “static assessment” to “dynamic early warning”.
6. Conclusions
Addressing the practical needs of identifying and controlling safety risk factors in highway construction, this study applies an improved DEMATEL-ISM method (with the threshold scientifically determined by the MMDE method) to risk factor analysis. This approach effectively overcomes the limitation of strong subjectivity in threshold setting in traditional methods. Compared with the two conventional methods, it enhances the accuracy and reliability of identifying the correlation relationships among risk factors. By constructing a hierarchical structural model of risk factors, the study clarifies the core driving factors and key transmission paths affecting highway construction safety and reveals the hierarchical correlation mechanism between various risk factors. This research not only enriches the theoretical and methodological system of highway construction safety risk assessment but also provides clear guidance for formulating targeted risk prevention and control strategies in engineering practice. It helps reduce the incidence of highway construction safety accidents from the source and holds practical significance for protecting life and property safety.
There is a lack of empirical data such as actual project accident rates to verify the predictive power of the hierarchical structure. Additionally, quantifying influences using 0–3 discrete scores ignores continuous differences, leaving room for further improvement in accuracy.
First, apply the constructed hierarchical structure and control paths to specific highway construction projects and verify the practical effect of the model by tracking indicators such as accident rate and hidden danger rectification rate. Second, integrate Bayesian Network (BN) to achieve quantitative prediction of risk factors, thereby enhancing the dynamic early warning capability of the model.
Supplementary Materials
The following supporting information can be downloaded at: https://www.mdpi.com/article/10.3390/su18010116/s1, Figure S1: Direct impact matrix; Table S1: Standardize the impact matrix; Table S2: Comprehensive Impact Matrix.
Author Contributions
Conceptualization, P.Z. and Y.H.; methodology, Y.H.; validation, Y.H.; formal analysis, Y.H.; data curation, Y.H.; writing—original draft preparation, Y.H.; writing—review and editing, P.Z., Y.H. and B.W.; supervision, Y.Z. and R.L.; project administration, P.Z.; funding acquisition, B.W. All authors have read and agreed to the published version of the manuscript.
Funding
This research was supported by the Key R&D Plan-Guided Project of Heilongjiang Province (GZ20210152), the Project of Double First-Class Discipline Collaborative Innovation Achievement of Heilongjiang Province (LJGXCG2024−P16) and the Project of Transportation Science and Technology of Heilongjiang Province (HJK2021A014).
Institutional Review Board Statement
Ethical review and approval were waived for this study by Institution Committee due to Legal Regulations (The Ethical Review of Biomedical Research Involving Humans issued by the National Health Commission of the People’s Republic of China).
Informed Consent Statement
Informed consent for participation was obtained from all subjects involved in the study.
Data Availability Statement
The original contributions presented in this study are included in the article/Supplementary Material. Further inquiries can be directed to the corresponding author.
Conflicts of Interest
The authors declare no conflicts of interest.
References
- Zhang, Z.; Li, S.; Su, Y.K. Prominence Factors of Recycled Concrete Based on the DEMATEL-ISM Method. J. Shenyang Jianzhu Univ. (Soc. Sci.) 2024, 26, 479–486. [Google Scholar]
- Jin, L.H.; Zhang, R.H.; Ming, H.J.; Li, Y.H.; Li, C.X.; Zou, S.X. Accident Causation Chain Analysis of Hydropower Unit Maintenance Operations Based on the DEMATEL-ISM Method. J. Water Resour Hydropower Technol. 2024, 44, 71–77. [Google Scholar]
- Alqahtani, Y.A.; Makki, A.A. A DEMATEL-ISM Integrated Modeling Approach of Influencing Factors Shaping Destination Image in the Tourism Industry. Adm. Sci. 2023, 13, 201. [Google Scholar] [CrossRef]
- Ankur, C.; Amol, S.; Sanjay, J. An Interpretive Structural Modeling (ISM) and Decision-Making Trail and Evaluation Laboratory (DEMATEL) Method Approach for the Analysis of Barriers of Waste Recycling in India. J. Air Waste Manag. Assoc. 2018, 68, 100–110. [Google Scholar] [CrossRef] [PubMed]
- Tian, X.Z.; Wu, J.L. Analysis of Influencing Factors on Vocational Education Teacher Team Building Based on DEMATEL-ISM. J. Ningbo Vocat. Tech. Coll. 2025, 29, 101–108. [Google Scholar]
- Zhou, X.Y.; Dong, X.W.; Li, R.X.; Yu, S.J.; Xue, J.Y. Accident Cause Analysis of Agricultural Machinery Based on DEMATEL-ISM. South Agric. Mach. 2025, 56, 15–19+27. [Google Scholar]
- Wang, Q.T.; Long, C.; Wang, Z.W. Research on Collaborative Influencing Factors and Capability Enhancement of Emergency Logistics Service Supply Chain Based on DEMATEL-ISM. J. Supply Chain. Manag. 2025, 6, 40–53. [Google Scholar]
- Peng, H.; Chen, J.Y.; Li, G.Z.; Zhang, S.T.; Qiang, C.J.; Zhang, H. Research on Resilience Influencing Factors in Civil Aviation Fuel Supply Chain Based on DEMATEL-ISM Model. J. Civ. Aviat. 2025, 9, 138–144. [Google Scholar]
- Zhang, W.; Deng, S.J.; Yu, G.B. Analysis of Safety Influencing Factors for Storage, Transportation, Dispatching, and Shipping Based on Improved DEMATEL-ISM. Fire Control Command. Control 2025, 50, 71–79. [Google Scholar]
- Liu, W.; Dai, P.; Zhao, F.L.; Cui, K.X. Tourism Safety Risk Assessment of Mountain-Type Scenic Areas: A Case Study of Beijing. J. Saf. Sci. China 2024, 34, 168–177. [Google Scholar]
- Zhang, Z.Z. Risk Early Warning and Legal Safeguard System Construction for Sports Injury Accidents in Universities—Review of “Research on Risk Management and Legal Response Mechanisms for Campus Sports Personal Injury Accidents”. J. Saf. Sci. China 2024, 34, 226. [Google Scholar]
- Wang, Q.E.; Jing, H.F.; Guo, Z.X.; Wang, C.J. A Risk Early-Warning Model for Technology Transfer in Major Engineering Projects Based on DEMATEL-ISM-BN. J. Railw. Sci. Eng. 2025, 22, 1315–1327. [Google Scholar]
- Ye, Y.S.; Zhu, Y.Q.; Wang, N.M.; Zhang, Q.L. Risk Analysis of Railway Bridge and Tunnel Engineering Technical Interfaces Based on DEMATEL, ISM, and BN. J. Chongqing Jiaotong Univ. (Nat. Sci.) 2023, 42, 104–111. [Google Scholar]
- Li, Z.; Zhu, M.; Huang, H. Evaluation of Sustainable Agricultural Mechanization Development in Hubei Province Using Fuzzy DEMATEL-ISM. J. Agric. Eng. 2022, 38, 51–58. [Google Scholar]
- Li, H.J.; Chen, H.H.; Cheng, B.Q.; Hu, X.D.; Cai, Q. A Study on the Formation Model of Safety Atmosphere in Metro Construction Based on Fuzzy ISM-DEMATEL. J. Railw. Sci. Eng. 2021, 18, 2200–2208. [Google Scholar]
- Sahebi, I.G.; Toufighi, S.P.; Azzavi, M.; Masoomi, B.; Maleki, M.H. Fuzzy ISM-DEMATEL Modeling for the Sustainable Development Hindrances in the Renewable Energy Supply Chain. Int. J. Energy Sect. Manag. 2024, 18, 43–70. [Google Scholar] [CrossRef]
- Fu, K.; Xia, J.B.; Zhang, X.Y.; Shen, J. System Structural Analysis of Communication Networks Based on DEMATEL-ISM and Entropy. J. Cent. South Univ. 2017, 24, 1594–1601. [Google Scholar] [CrossRef]
- Shen, G.X.; Sun, S.G.; Zhang, Y.Z.; Wang, Z.Q.; Chen, B.Q.; Ma, C. System Failure Analysis Based on DEMATEL–ISM and FMECA. J. Cent. South Univ. 2014, 21, 4518–4525. [Google Scholar] [CrossRef]
- Wang, L.H.; Dang, R.; Liu, K.C. Health Status Assessment of Ancient Architectural Timber Structures Combined with DEMATEL-ISM-ANP. J. Northwest Univ. (Nat. Sci.) 2025, 55, 12–20. [Google Scholar]
- Wang, C.; Song, Y.C.; Wu, L.Y.; Zhao, X.T. Road Congestion Risk Assessment Method for Downstream Vehicles Based on Improved DEMATEL-ISM Model. J. Guangxi Univ. (Nat. Sci.) 2024, 49, 146–154. [Google Scholar]
- Xu, J.P.; Zhang, B.Y.; Zhang, X.; Wang, X.Y.; Li, F.; Zhao, Y.D. Blockchain-Based Optimization of Grain and Oil Quality and Safety Using DEMATEL-ISM. J. Agric. Mach. 2022, 53, 412–423. [Google Scholar]
- Lu, J.; Wang, J.; Song, Y.; Yuan, C.; He, J.; Chen, Z. Influencing Factors Analysis of Supply Chain Resilience of Prefabricated Buildings Based on PF-DEMATEL-ISM. Buildings 2022, 12, 1595. [Google Scholar] [CrossRef]
- Li, M.H.; Xia, J.B.; Chen, C.Q. A Network Genealogical Model with Reachable Influence Factors Based on Decision Experiment, Evaluation Experiment Method, and Interpretive Structural Model. J. Jilin Univ. (Eng.) 2012, 42, 782–788. [Google Scholar]
- Wang, D.D.; Yang, A.B.; Wang, Z.H.; Zhao, J.R.; Dong, G.Y.; Tong, R.P. Human Reliability Analysis of Emergency Responders in Hazardous Chemical Accidents in Chemical Industrial Parks. J. Saf. Sci. China 2025, 35, 21–27. [Google Scholar]
- Ministry of Transport of the People’s Republic of China. Technical Requirements for Safety Monitoring and Early Warning Systems in Highway Engineering Construction: JT/T 1498-2024; People’s Communications Press: Beijing, China, 2024. [Google Scholar]
- Chen, X.; Ma, F.; Wu, Y.; Han, B.; Luo, L. MFMDepth: Metaformer-Based Monocular Metric Depth Estimation for Distance Measurement in Ports. Comput. Ind. Eng. 2025, 207, 111325. [Google Scholar] [CrossRef]
- Li, Y.; Pu, Z.; Liu, P.; Qian, T.; Hu, Q.; Zhang, J.; Wang, Y. Efficient Predictive Control Strategy for Mitigating the Overlap of EV Charging Demand and Residential Load Based on Distributed Renewable Energy. Renew. Energy 2025, 240, 122154. [Google Scholar] [CrossRef]
- Chen, X.; Ma, Q.; Wu, H.; Shang, W.; Han, B.; Biancardo, S.A. Autonomous Port Traffic Safety-Oriented Vehicle Kinematic Information Exploitation via Port-Like Videos. Transp. Saf. Environ. 2025, 7, tdaf048. [Google Scholar] [CrossRef]


Disclaimer/Publisher’s Note: The statements, opinions and data contained in all publications are solely those of the individual author(s) and contributor(s) and not of MDPI and/or the editor(s). MDPI and/or the editor(s) disclaim responsibility for any injury to people or property resulting from any ideas, methods, instructions or products referred to in the content. |
© 2025 by the authors. Licensee MDPI, Basel, Switzerland. This article is an open access article distributed under the terms and conditions of the Creative Commons Attribution (CC BY) license.