Article

Sustainable Digital Rural Development: Measurements, Dynamic Evolutions, and Regional Disparities—A Case Study of China

1
College of Urban Construction, Yangtze University, Jingzhou 434023, China
2
College of Economics and Management, China University of Geosciences, Wuhan 430074, China
3
Financial Affairs Department, Yangtze University, Jingzhou 434023, China
4
Infrastructure Department, Hubei Minzu University, Enshi 445000, China
*
Author to whom correspondence should be addressed.
Sustainability 2025, 17(9), 4250; https://doi.org/10.3390/su17094250
Submission received: 28 February 2025 / Revised: 21 April 2025 / Accepted: 25 April 2025 / Published: 7 May 2025

Abstract

Amid the Fourth Industrial Revolution and the 2030 Sustainable Development Goals (SDGs), China’s digital village initiative has emerged as a localized implementation for achieving multidimensional sustainability. However, the progress of digital villages in China remains uneven, posing challenges to achieving sustainable rural transformation. This study develops a multidimensional index system at four levels: rural digital infrastructure, the digital development environment in rural areas, the digital industry in rural areas, and agricultural production digitalization. Entropy weighting was used to evaluate digital village progress across 30 Chinese provinces (2013–2022). Kernel density estimation, the Dagum Gini coefficient, and the obstacle degree model were used to study China’s spatiotemporal dynamics, regional disparities, and digital village development barriers. The results show that between 2013 and 2022, digital villages in China advanced (the average annual growth rate: 9.43%), with a spatial distribution pattern of “east superior, west inferior, south prosperous, and north declining”. National and regional digital villages have advanced yearly, with absolute and relative disparities increasing, extensibility increasing, and multi-polarizing rising. Digital village development is becoming increasingly imbalanced, with inter-regional differences driving “east, central, and west” disparity and intra-regional disparities driving North–South disparity. Ranking the average hurdle levels: the digital industry in rural areas (45.94%) > the digital development environment in rural areas (24.83%) > rural digital infrastructure (21.85%) > agricultural production digitalization (7.38%). Taobao villages are a major restraint on China’s digital village development.

1. Introduction

For the Fourth Industrial Revolution and the 2030 Agenda for Sustainable Development (SDGs), digital technologies are recognized for their strategic value in global transformations. As a localized implementation of the SDGs, China’s Digital Village initiative is offering a “China solution” to global rural development challenges through the dual approach of technological and institutional innovation. The swift ascent of the digital economy in recent years has created developmental prospects for digital rural regions [1]. In recent years, China’s digital economy has steadily penetrated agriculture and rural regions, with the utilization of digital technologies becoming more prevalent in these areas. Digital rural governance has become an essential approach in advancing the modernization of grassroots government systems and competencies. It will substantially improve the governing structure in rural regions, providing a new and vigorous impetus for quickening rural rejuvenation. Creating digital villages has emerged as a viable strategy for tackling the issues of rural development [2]. The “China Digital Village Development Report (2022)”, published by the Information Center of the Ministry of Agriculture and Rural Affairs in March 2023, points out that by the end of 2022, the informatization rate in agricultural output across the nation reached 25.4%. The number of rural Internet users was 293 million, showing an Internet penetration rate of 58.8%, which is twice that of the early phase of the 13th Five-Year Plan. The rural express logistics system is consistently improving, and rural e-commerce is at the forefront of the rural digital economy, achieving an administrative village coverage rate of 86.0%. The data presented above reveals a favorable trend in the advancement of digital villages. During the “14th Five-Year Plan” period, the Chinese government set specific measures to support the advancement of digital villages [3]. The Communist Party of China stressed the need to continue rapid development in rural areas, fully promote rural regeneration, and hasten to settle a strong agricultural nation in the report of the 20th National Congress in 2022 [4]. In the new era, comprehensively promoting rural revival is important to building a powerful agricultural nation. Creating a digital countryside will offer full support to achieve the strategic goals of rural rejuvenation. In the current circumstances in our nation, providing and advancing digital villages in impoverished rural regions is the optimal strategy for gaining sustainable rural development [5].
In 2008, IBM presented “Smart Earth”, representing the first appearance of the term “smart”, which later became prevalent in the contexts of smart cities and smart villages. Intelligence and sustainability are interconnected concepts that heighten quality of life, equity, and socio-economic progress [6]. Several developed nations have amassed extensive experience in rural digitization and governance. This is chiefly seen in developing smart villages. In December 2019, the European Parliament began the first preparatory activity for smart rural regions in the 21st century, termed the Smart Villages 21 project (2019–2022), representing the onset of a new era for smart rural development [7]. Since 2019, the South Korean government has stressed promoting IT technology and intelligent services associated with smart villages. The aim is to improve the living conditions in rural regions, identify new sources of growth, and establish a strong network among residents, communities, and regional economies [8]. In 2016, Finland launched a study on smart villages aimed at dealing with rural social problems and boosting the digitization of services. They established seven main service categories, with the planning of 19 projects. In 2017, Finland started a digital government project and set up a broadband network infrastructure. The results were notable, chiefly comprising the establishment of a public access platform that enabled the use of database resources and the effective reduction of digital information disparity. Concurrently, relevant digital popularization strategies have been developed. The Spanish government has underscored the significance of directing sustainable rural development in alignment with the “Smart Territories National Plan” measures, which seek to create intelligent rural regions to address rural depopulation. The Spanish government has allocated subsidies totaling 510 million euros to help this strategy. The aim is to achieve the smart rural vision via a thorough array of methods. The project parts encompass promoting normalized rural development, performing pilot projects, seeking innovative ideas, conducting topical meetings, and improving relevant research initiatives [9].
The notion of a “Smart Village” now lacks a broadly recognized definition within the academic sphere. The European Union’s “Smart Villages” initiative, launched in 2017, provides an often-used definition. Smart Villages adeptly combine the intrinsic advantages of rural regions with digital communication technology and network developments, thus benefiting both the countryside and society at large. In reaction to global demands, China imposed the “Digital Village Strategy” in its No. 1 Central Document of 2018. This was the first formal “Digital Village” application in Chinese national policy documents. The “Digital Village Development Strategy Outline”, published in 2019, offers a clear and detailed definition of digital villages. Digital villages are a contemporary developmental model and transitional process fundamentally propelled by using information, networks, and digital technologies throughout diverse agricultural and rural sectors, coupled with improving digital information technology skills among farmers [10]. In recent years, the Chinese government has significantly stressed digital village development. It has released several policy documents, such as the “Digital Agriculture and Rural Development Plan (2019–2025) [11]“, the “Digital Village Development Action Plan (2022–2025) [12]”, and the “Digital Village Construction Guidelines 1.0 [13] and 2.0” [14]. The No. 1 Central Document issued this year did not expressly reference “Digital Village”. However, many sections are intricately linked to digital village development, underscoring the fundamental importance of digital technology in rural rejuvenation. The document offers policy support and implementation strategies for digital village development by advancing quality productive forces in agriculture, improving rural infrastructure, and modernizing rural governance. These measures promote agricultural and rural modernization while fulfilling the strategic objectives of rural revitalization.
In recent years, academic studies have focused on digital villages as a strategic strategy for rural rejuvenation. Two primary areas are currently the focus of our country’s study on digital villages: the first part concerns the theoretical examination of digital village creation, encompassing its content [15], theoretical framework, and implementation strategies [5,16]; the second includes digital rural development evaluation indicators. Scholars have differing views on classing and building our country’s digital villages at the local level. Xiaojing Li et al. developed a digital rural assessment index system that encompasses three primary domains: main development capabilities, infrastructure construction, and information environment [17]. Li et al. examined the system, human resources, and technology to develop a comprehensive evaluation framework for assessing the level of digital rural development [18]. Cao et al. developed a three-tiered evaluation system for digital rural construction in China, which includes the development of digital rural infrastructure, rural industry digitization, and rural digital industrialization [19]. Liu et al. developed an indicator system that identifies the influencing factors of digital rural development, classifying these factors into five categories: digitalization of infrastructure, digitalization of services, digitalization of the economy, digitalization of daily life, and digitalization of green production [20].
The aforementioned research offers significant insights for a scientifically rigorous evaluation of the development status of digital villages; yet, certain shortcomings persist. Since our nation’s rural digital growth is constant, the assessment index for its development level continuously evolves and improves. Considering that the strategy of digital rural development was proposed relatively recently, research into it is still in its infancy [21,22]. So, the examination of its assessment metrics remains in an experimental phase. Despite the evaluation framework established by scholars being underpinned by a robust theoretical foundation and being aligned with our country’s national context and relevant policies, there remains scope for improvement in dimension selection and the practicality of indicators. Certain scholars have confined their research on the development of digital villages to provincial [23,24,25,26,27] and county levels [28,29,30], neglecting to do a broad, comprehensive, and systematic assessment of the national context for digital village construction. The complexity and diversity of geographical spatial units in China lead to great regional differences in digital village development levels. Systematic research on the measurement, dynamic evolution, and regional differences in digital villages in our nation is absent. Most scholars have examined this problem from an East–West spatial viewpoint. Nonetheless, due to the growing economic inequality between the northern and southern regions of our country, there exists a significant lack of work examining the distinctions and dynamic evolutionary traits of these areas.
This paper’s contributions and innovations are mainly focused on three areas, based on current research:
  • A more comprehensive evaluation index system for digital rural development:
The study seeks to provide a more extensive evaluation index system for assessing the degree of digital village growth. It integrates multidimensional perspectives, aligns with national policies and practical realities, and addresses gaps in existing systems (e.g., dimension selection and indicator practicality). The objective is to serve as a reference for future investigations into the economic and social advantages of digital village development.
2.
Multidimensional analysis of development dynamics:
We conduct a systematic, nationwide examination of digital village development across 30 provinces (2013–2022) through the lenses of temporal evolution, dynamic progression, and regional disparities. This approach transcends prior localized studies and addresses the lack of holistic, longitudinal insights into national trends and spatial heterogeneity.
3.
Dual geographical perspectives:
We examine the developmental status of digital villages in China from the dual perspectives of “East–Central–West” and “North–South” by addressing the limits of previous analyses that focused solely on the “East–Central–West” dimension.

2. Materials and Methods

2.1. Data Source

The research sample for this study is panel data from 30 Chinese provinces (excluding Tibet, Hong Kong, Macau, and Taiwan) between 2013 and 2022. The primary sources of the original data are the China Macroeconomic Database, the official website of the National Bureau of Statistics, the China Agricultural and Forestry Database, the EPS Database, etc. Linear interpolation addressed the missing data for specific years in different provinces. According to the classification standards of economic geography, the eastern region includes Beijing, Hebei, Tianjin, Liaoning, Jiangsu, Shanghai, Zhejiang, Shandong, Fujian, Hainan, and Guangdong; the central region includes Shanxi, Anhui, Heilongjiang, Jilin, Jiangxi, Hunan, Hubei, and Henan; and the western region includes Inner Mongolia, Guangxi, Sichuan, Chongqing, Guizhou, Yunnan, Shaanxi, Qinghai, Gansu, Xinjiang, and Ningxia (Figure 1a). Xizang, Hong Kong, Macao, and Taiwan are not included in the sample of this study. According to the classification standards of economic geography, the northern region includes Beijing, Tianjin, Hebei, Shanxi, Inner Mongolia, Liaoning, Jilin, Heilongjiang, Shandong, Henan, Shaanxi, Gansu, Qinghai, Ningxia, and Xinjiang. The southern region includes Shanghai, Jiangsu, Zhejiang, Anhui, Fujian, Jiangxi, Hubei, Hunan, Guangdong, Guangxi, Hainan, Chongqing, Sichuan, Guizhou, and Yunnan (Figure 1b). Xizang, Hong Kong, Macao, and Taiwan are not included in the sample of this study.

2.2. Methods

2.2.1. Construction and Evaluation Method of the Digital Rural Indicator System

The Evaluation Index System of the Digital Rural Indicator System:
This article sets up an indicator system for digital development in rural areas based on prior research and the national context. It focuses on four dimensions: the level of digital infrastructure in rural areas, the level of digital development environment in rural areas, the level of development of the digital industry in rural areas, and the level of digitalization in agricultural production. The selection of these indexes is based on an analysis of scholarly articles published in China about digital village construction, as well as relevant policy documents released by the Chinese government. Table 1 identifies 24 unique indicators selected based on scientific rigor, objective, representativeness, and data availability.
The level of digital infrastructure in rural areas:
The digital economy mainly relies on data as its principal production part. The methods and efficiency of data collection mostly depend on the digital infrastructure in rural regions. Thus, the infrastructure for digital villages is essential for the advancement of these digital rural settings. Their establishment increases information accessibility for rural inhabitants [31], offering them digital services. The “Outline of the Digital Village Development Strategy” clearly underscores in its primary objective the imperative to accelerate rural digital transformation through infrastructure development. This requires focused efforts to upgrade rural network facilities, improve information terminals and service delivery systems, while expediting the digital upgrading process of rural infrastructure [10]. The number of broadband access users in rural areas (X1), the number of computers owned (X2), and the number of mobile Internet users (X3) serve as significant indications of residents’ awareness and understanding of the Internet. The ability for digital communication and the quality of information infrastructure can be evaluated to ascertain if current resources are enough to fulfill the information transmission and usage requirements of rural regions.
The level of the digital development environment in rural areas:
The digital development environment in rural areas is essential for the progress of digital villages, significantly enhancing the diverse requirements of digital development in rural areas. Farmers are the primary agents of rural development in our nation and play a crucial role in the advancement of rural areas. Thus, the consumption situations of rural residents can directly indicate the degree of their investment in digitalization. Rural broadcasting and television shows are essential instruments for cultural advancement in the countryside. Rural residents can access more cultural content, improve their cultural literacy and aesthetic awareness, and enjoy spiritually enriching pleasure and leisure through broadcasting and television. The quantity of health clinics is a vital indicator for evaluating basic healthcare. Establishing a national comprehensive management platform for grassroots healthcare to protect the fundamental tier of the digital rural healthcare system is essential. Investment in funding serves as a strong assurance for the advancement of digital villages [32]. This paper identifies four indicators: local fiscal expenditures on science and technology, transport, education, and healthcare, to represent the intensity of financial investment in digital development through the lenses of technical support, transport, human resources, and medical resources.
The level of development of the digital industry in rural areas:
Industrial development is essential for the progress of rural economies. The elements of industrial digitization specifically include rural digital basis and the level of digital transactions. Establishing Taobao villages shows the advancement of rural e-commerce and serves as a reliable indicator of sales digitization [21]. The proportion of administrative villages with postal services shows the extent of e-commerce advancement in the area and the amount of digital integration in the lives of rural inhabitants. The amount of digital transactions reflects the degree of industrial digitalization. E-commerce procurement and sales amount represent the commercial transactions completed via the Internet within the new digital agriculture [33] by showing the extent of digital trade. Annual data can be employed to evaluate improvements in the quality of life for rural residents.
The level of digitalization in agricultural production:
Agriculture forms the principal industry, while science and technology serve as the primary producing forces. This dimension identifies three metrics for assessment based on their quantitative nature: degree of agricultural mechanization [34], effective irrigation rate of farmland, and degree of electrification in agricultural production. Increasing the supply of agricultural science and technology innovation and fully integrating technology into agricultural production can promote the transformation and upgrading of traditional agriculture, promoting a transition from quantitative to qualitative development in the sector [35].
Measurement method:
This study employs Stata16 software, using the entropy approach to weight indicators, aiming to reduce the impact of subjective human variables. It also seeks to more accurately represent the significance of each evaluation metric within the overall evaluation system [36,37]. The entropy method is an objective weighting technique that essentially depends on the extent of variance among the values of assessment indicators to precisely assign weight coefficients [38]. A linear weighting method is employed to estimate the overall indicators of digital rural development levels across different provinces over the years. The precise steps are outlined as follows:
Step 1: Due to the different units of each indicator, the extreme value method is applied to normalize the evaluation indicators. The calculation formulas are as follows [39]:
For positive indicators:
y i j = x i j m j M j m j
For negative indicators:
y i j = M j x i j M j m j
In the equation, y i j represents the standardized data of x i j , where x i j denotes the original data of the indicator for the i -th evaluation object j , and M j and m j indicate the maximum and minimum values of indicator x i j within the sample period, respectively.
Step 2: Normalize the data:
P i j = y i j i = 1 300 y i j ,       i = 1 , , 300 ;       j = 1 , , 24
Step 3: Determine the entropy value for the j -th indicator:
e i j = 1 ln 300 × i = 1 300 P i j ln P i j
Step 4: Establish the weights for each indicator:
w j = 1 e i j Σ j = 1 24 1 e i j
Step 5: Calculate the comprehensive index of digital rural development levels for different provinces over the years:
S c o r e = j = 1 24 w j × y i j

2.2.2. Kernel Density Estimation

This article employs Matlab2024a software, using kernel density estimation to illustrate the dynamic evolution trends of digital rural development levels in China from 2013 to 2022. The specific formula is as follows:
f ( x ) = 1 n h i = 1 n K ( x i x ¯ h ) K ( x ) = 1 2 π exp ( x 2 2 )
Here, n denotes the total number of observations, x i represents the individual observations, and x ¯ signifies the mean of all observations; K ( ) is the kernel density function and h refers to the bandwidth.

2.2.3. Decomposition of Dagum Gini Coefficient

This study employs Matlab2024a software, using the Dagum Gini coefficient method to measure disparities in rural digital development levels across China’s East–West and North–South axes. It further decomposes these disparities using this method to explore the primary sources influencing regional differences. The specific calculation steps are as follows:
Step 1: Define the overall Gini coefficient G :
G = j = 1 k h = 1 k i = 1 n j r = 1 n k y j i y h r 2 n 2 y ¯
Among them, y j i ( y h r ) represents the level of digital rural development in a certain province within the j ( h ) region, y ¯ denotes the arithmetic mean of the digital rural development levels across various provinces, n and k indicate the number of provinces and regions, respectively, while n j ( n h ) signifies the number of provinces within the j ( h ) region.
Step 2: Prior to the decomposition of the Gini coefficient, regions must be ranked based on the mean level of digital rural development, as shown below.
Y h ¯ Y j ¯ Y k ¯
Step 3: Decompose the overall Gini coefficient G into intra-regional disparities G w , inter-regional net disparities G n b , and hyper-variable density G t , ensuring that the relationship among the three components is satisfied as follows: G = G w + G n b + G t . The specific calculation formula is as follows [40]:
G j j = i = 1 n j r = 1 n j | y j i y j r | 2 Y j ¯ n j 2
G w = j = 1 k G j j p j s j
G j h = i = 1 n j r = 1 n h | y j i y h r | n j n h ( Y j ¯ + Y Y h ¯ )
G n b = j = 2 k h = 1 j 1 G j h ( p j s h + p h s j ) D j h
G t = j = 2 k h = 1 j 1 G j h ( p j s h + p h s j ) ( 1 D j h )
p j = n j Y ¯ , s j = n j Y j ¯ n Y ¯ ( j = 1 , , k )
D j h = d j h p j h d j h + p j h
d j h = 0 d F j ( y ) 0 y ( y x ) d F h ( x )
p j h = 0 d F h ( y ) 0 y ( y x ) d F j ( x )
Among them, G j j denotes the Gini coefficient of region j , while G j h represents the inter-regional Gini coefficient between regions j and h . D j h signifies the relative impact of digital rural development levels between regions j and h ; d j h indicates the mathematical expectation of the sum of all y j i y h r > 0 sample values within regions j and h ; p j h represents the mathematical expectation of the total values of all y h r y j i > 0 samples in regions j and h ; F j ( F h ) refers to the cumulative density distribution function of region j ( h ) .

2.2.4. Obstacle Degree Model

To improve the development level of digital villages in China, this document employs SPSS 27 software, using the obstacle degree model to identify and diagnose obstacle factors at both the subsystem and secondary index levels. The specific calculation steps are as follows:
Step 1: Calculate the Indicator Deviation Degree
I i j = 1 y i j
Here, I i j represents the deviation of the i -th evaluation object for the j -th indicator, while y i j denotes the standardized value of a single indicator.
Step 2: Calculate the degree of factor contribution
F j = W j × R k
Among them, F j represents the factor contribution of indicator j within the secondary index layer, W j denotes the weight of indicator j , and R k signifies the sum of the weights of all indicators within the k -th Primary Index layer.
Step 3: Calculate the degree of obstruction
M i j = F j × I i j j = 1 n F j × I i j × 100 %
Here, M i j represents the obstacle level of the j -th indicator of the i -th evaluation object.

3. Results

3.1. Analysis of Measurement Results

3.1.1. National Level

Our nation’s general trend of digital village development is favorable and rising, as shown in Table 2 and Figure 2, which show trends in the overall and regional development levels of digital villages in China from 2013 to 2022. From a national perspective, our country’s average digital rural development has increased from 0.083 to 0.186, with an annual average growth rate of 9.432%. However, it is worth noting that in 2020, the degree of digital village development decreased compared to 2019. This suggests the COVID-19 pandemic breakout at the end of 2019 had a certain degree of influence on the growth of digital villages in our country. This effect was especially noticeable in the per capita disposable income of rural residents, the volume of rural postal and telecommunications services, and the amount of sales and purchases of e-commerce. Following the COVID-19 pandemic, notable changes in consumer behavior and activity patterns have transpired [41]. These changes have significantly impacted the course of digital rural development in China. The modified activity patterns of urban inhabitants during the pandemic highlight the need to consider behavioral changes in digital rural development carefully. Because of the limits on urban–rural logistics, fluctuations in residents’ income, and changes in consumption habits during the epidemic, the digitalization process in rural areas has been hindered.

3.1.2. Regional Level

Figure 2 explains the evolving digital rural development across several regions, which generally presents an upward trajectory akin to the national average, except for a significant decline in 2019. From the view of “East, Central, and West”, the eastern region has the highest comprehensive index of digital rural development (0.104–0.252), followed by the central (0.083–0.173) and western (0.060–0.130) regions, with average annual growth rates of 10.286%, 8.436%, and 8.865%, respectively. Besides Tianjin and Hainan being behind, most eastern provinces show high digital rural growth. Also, most provinces in the central and western regions are below the national average, highlighting the need to catch up with the national pace and the growing disparity between the eastern and central/western areas. According to China’s “North–South” digital rural development index, the southern region (0.089–0.226) is superior to the northern region (0.076–0.146), and the south’s average annual growth rate (10.840%) is higher than the north’s (7.564%). Overall, our country’s digital rural building achievements are notable, characterized by a pattern of “higher in the east, lower in the west, stronger in the south, and weaker in the north”. Nonetheless, development gaps, especially the North–South divide, persist.
Therefore, considering the country’s specific circumstances and relevant policies, a detailed socioeconomic examination of the digital gap in China’s rural growth highlighted East–West and North–South discrepancies. The “east-high, west-low” pattern can be ascribed to various reasons: 1. Policy considerations: The eastern areas have received improved policy aid and targeted investment for digital infrastructure and agricultural digital transformation. In contrast, the western regions may have reduced priority in policy execution and resource distribution. Also, eastern local governments are more predisposed to implement measures that promote digital economic advancement, such as pilot initiatives for digital villages. However, the western regions may experience decreased policy enforcement due to constrained financial resources. 2. Disparities in economic foundations include capital investment and industrial infrastructure differences. The eastern regions, characterized by high economic development, can draw greater social capital for investment in digital agriculture and rural digital infrastructure. The western areas, however, face challenges in offering equivalent capital support due to their less robust economic foundations. The eastern regions own a more robust base in agricultural modernization and industrial integration, promoting a faster integration of the digital economy with agriculture. The western areas, however, face significant opposition to digital transformation owing to the prevalence of conventional sectors. 3. Divergences in local governing structures. This encompasses disparities in governance capacity and inequities in resource distribution. Local governments in the eastern areas have great policy implementation capacities and administrative efficiency, promoting the effective execution of digital agriculture initiatives. In contrast, governments in the western areas may face obstacles such as short governance ability and bureaucratic inefficiencies, which can hinder the successful implementation of initiatives. Differences in local government structures might result in disproportionate resource distribution. For example, eastern regions can more efficiently coordinate diverse resources to further digital agricultural development, while western regions may have significant challenges in resource coordination. 4. Socioeconomic determinants. These include gaps in digital literacy, agricultural structural transformation, and education and human capital. Inhabitants of the eastern regions typically show high digital literacy, allowing them to more effectively employ digital technologies to augment agricultural productivity and improve their quality of life. Conversely, inhabitants of the western regions may have decreased talents in this aspect, thus resulting in an inequitable distribution of digital dividends. The eastern regions display a higher level of agricultural modernization, presenting increased opportunities for digital transformation. In contrast, the western areas, characterized by their relatively conventional agricultural frameworks, meet greater challenges and expenses in digital transformation. The eastern regions hold a more favorable position on education and human capital reserves, attracting greater talent in digital technology. The western areas may face limits in implementing and advancing digital technologies due to inadequate educational and training resources.
The reasons for digital rural development’s discrepancies between northern and southern China are similar to those between the east and the west. However, the differences arise in geographical variables and governmental policies. The key factors are as follows: Firstly, a notable disparity exists in the two regions’ economic foundations and developmental paths. The southern regions typically display vigorous economic activity, a more extensive contemporary industrial framework, and greater local government financial capacities, promoting increased capital investment for digital rural programs. In contrast, the northern regions may depend more on conventional sectors, weakening the basis for digital economic advancement. Secondly, the competence of local governance is a crucial factor in the growth of digital rural initiatives. The southern areas have typically adopted digital governance earlier, showing a deeper understanding of digital transformation among local governments and improving resource integration for digital rural development. Conversely, the northern regions may be deficient in governance structures and digital competencies. Thirdly, differences in educational achievement and digital literacy between the North and South may intensify the digital divide. Finally, the northern and southern agricultural sectors show large disparities in specialization, supply chain frameworks, and the need for digital transformation. The southern regions may be predisposed to develop high-value-added digital agriculture, while the northern regions may prioritize the digital transformation of fundamental agricultural methods.

3.1.3. Provincial Level

Guangdong, Zhejiang, Jiangsu, Shandong, and Hebei were among the top five regions in the average composite index assessing the degree of development of digital villages between 2013 and 2022, while Jilin, Tianjin, Qinghai, Ningxia, and Hainan were among the bottom five. The leading five provinces in digital rural development have achieved this status due to several key causes. 1. A robust economic foundation provides a strong impetus for digital rural development. For instance, as the province with the largest economic output in China, Guangdong has great economic strength and plentiful digital economic resources. Its well-established industrial chains and advanced Internet infrastructure provide a solid base for digital rural development. With its earlier development of the digital economy and a thriving Internet economy, Zhejiang benefits from the support of leading enterprises like Alibaba, which has spurred rapid growth in rural e-commerce. Jiangsu boasts a strong industrial base. Concentrating agricultural science parks and high-tech zones helps integrate digital technologies into rural areas. Shandong is a big agricultural province. It benefits from the local government’s strong emphasis on agricultural and rural modernization, which promotes the widespread application of digital technologies in local agriculture. Hebei lags behind the top three provinces in economic output. However, its agricultural strengths in the southern-central plain and policy support have stepped up digital rural progress in Hebei. 2. Policy support and local governance. Guangdong Province took the lead in issuing the “Implementation Opinions on the Development of Digital Villages in Guangdong Province”. This document promotes digital infrastructure construction in rural areas through special funds and policy incentives. The Zhejiang Provincial Government has integrated digital villages into the core objectives of its rural revitalization strategy by promoting the deep integration of information technology and the rural economy. Jiangsu and Shandong provinces prioritize agricultural technology and impose digital transformation initiatives within the agricultural sector. Benefiting from policy support within the Beijing–Tianjin–Hebei coordinated development, Hebei has seen a steady increase in investment in agricultural technology. 3. Technological innovation and human capital are key drivers. Guangdong, home to technology giants such as Huawei and Tencent, provides important technological support. Research institutions like the Pengcheng Laboratory are fostering innovation in digital agriculture. Hangzhou, Zhejiang Province, benefits from a significant concentration of Internet talent, providing a robust human base for digital village development. Jiangsu’s many universities contribute to strong research abilities, helping translate agricultural technology advancements. Shandong Agricultural University and other colleges are conducting extensive research in agricultural digitalization, driving technological innovation. Hebei is improving its technological support for digital village development by recruiting external talent and cultivating local scientific and technological personnel. The five provinces with the lowest rankings share common challenges, including a weak economic base, a lack of prioritization by local governments, and inadequate policy support. Specifically, Jilin’s economy is mainly driven by traditional agriculture, resulting in limited financial resources that constrain large-scale investments in digital village initiatives. Qinghai and Ningxia, located in remote areas, face fiscal constraints that hinder their capacity to support extensive digital village projects. Although Tianjin has a relatively developed economy, its policies mainly favor urban digitalization, leading to the delayed development of rural areas.
In particular, Guangdong, which came in first, had an average composite index of 0.330. Guangdong remained at the top of the composite index from 2013 to 2022, except in 2021 and 2022, when it came second. The average composite index of Hainan, which came in last, was only 0.040, showing the stark differences in the levels of digital village development by province.

3.2. Analysis of the Characteristics of Dynamic Evolution of the Distribution of Levels of Digital Rural Development in China

Figure 3 presents six kernel density plots that depict the evolving distribution of digital village development levels throughout China and its five principal regions from 2013 to 2022. The two principal axes of the kernel density graphs are as follows: The X-axis shows the value of index values indicative of the degree of digital village development. A higher value on the horizontal axis means greater digital village growth in that location, while a lower value shows a lesser degree of development. A movement to the right on the horizontal axis notes a general improvement in the degree of digital village growth, while a movement to the left represents the contrary. The Y-axis means the kernel density value, suggesting the concentration of data points inside a range of values. A higher kernel density number shows more concentration of data points within that range, while a lower kernel density value notes a sparser distribution of data points.

3.2.1. National Level

Figure 3a shows our country’s dynamic evolution of digital rural areas from 2013 to 2022. Regarding the distribution location, our country’s overall growth of digital rural regions has gradually shifted to the right during the sample period. The kernel density curve consistently presents a distinct peak, approaching 0.06 to 0.12, highlighting a significant growth trend that aligns with previous analyses. From an analysis of distribution patterns, the principal peak in 2013 was sharp and confined, suggesting relatively few regional differences. After that, the peak progressively waned yearly, briefly rebounding in 2019 before finally leveling off and decreasing, with an expansion in width. This indicates that the absolute gaps in development levels of our nation’s digital rural areas have significantly increased. Analyzing polarization advancements, the national digital rural kernel density curve transitioned from a bimodal state between 2013 and 2017 to a multimodal state from 2018 to 2022. This highlights the growing polarization effects and shows a growing dispersion in our nation’s rural digital growth over the sample period. The kernel density curve exhibits a notable right-tail phenomenon, which has been increasingly extending annually from the perspective of distribution extensibility. This means that some provinces are assuming a “pioneering role” in advancing digital rural areas in our nation, finding a progressively pronounced leadership disparity relative to other regions by advancing the national digital rural development to unprecedented levels.
In summary, the degree of digital rural development in our country has progressively improved yearly, with a notable expansion of absolute differences. This phenomenon may stem from variations in resource endowments, policy support, and infrastructure development across different provinces. The pace of development varies unevenly between different regions. The gap in leading advantages between the individual and the remaining provinces is gradually widening.

3.2.2. Regional Level

Figure 3b–f shows the dynamic progression of the levels of digital rural development in five main regions: East, Central, West, North, and South throughout the observation period. From a distributional standpoint, the kernel density curves’ central tendency and scope of change for digital rural areas across regions have migrated rightward across the sample period, signaling continued digital rural development. The distribution pattern analysis reveals that principal peak morphology in the eastern region shifts from “sharp and narrow” to “broad and low”, highlighting disparities in digital rural development, which is anticipated to increase. This gap may be ascribed to the vigorous economic growth, significant policy backing, and sophisticated technological infrastructure characteristic of the eastern regions. As a result, although certain provinces have undergone swift progress, the developmental disparity has increased in provinces with relatively weaker economies. The kernel density map in the central region reveals a peak value trend characterized by “decline-rise-decline”. Initially, the peak width contracts before widening, intensifying volatility in this area’s absolute disparities of digital rural development. The differing rates of digital village development among provinces in the central area are likely due to incremental changes in policy support and economic progress. This has thus produced variations in regional inequalities. In the western region, kurtosis shows a trend of a significant fall followed by a minor gain. Then, another decline, with the width of the curve continuously expanding, shows that absolute inequalities in digital rural development are also widening. The economic base of the western region is fragile, and its technological infrastructure is inferior to that of the East, leading to reduced development. In addition, great discrepancies are present throughout the provinces in the region. The peaks of the northern regions’ distribution curves have generally shrunk, but the width has widened, suggesting a rise in absolute differences. This disparity may be attributed to the rapid development observed in certain regions, such as Beijing and Tianjin, in contrast to the slower growth in other provinces. Kurtosis has swung during the observation period in the southern regions, with the fall being noticeably more remarkable than the gain. Further, the peaks have been broader yearly, underscoring the growing inequality problem in this field. From the standpoint of polarization trends, all five of our nation’s major regions display different multipeak phenomena, showing that the polarization trend in the growth of rural digital areas is still noticeable. Among these, the eastern region is the one that constantly displays a multipeak state, and the separation between the primary and secondary peaks is progressively growing with time. This suggests a persistent multi-polarization trend with notable regional imbalance problems and significant internal disparities. The dual-peak configuration in the center region is changing to a multipeak one. This shows a shift in digital village development within the region, transitioning from relative equilibrium towards a more multi-polarization structure. Certain provinces are experiencing accelerated growth by widening the developmental disparities with other provinces. The western region shows a gradient effect and a conspicuous primary peak with a low secondary peak, indicating a lesser tendency to multi-polarization in developing digital rural regions. This phenomenon likely stems from a few provinces in the western region that have displayed relatively advanced progress. At the same time, the majority lag, resulting in a gradient distribution across the region. Both the northern and southern regions’ kernel density curves show a shift from a “dual-peak to multipeak” pattern, suggesting that both are multi-polarizing and that there are significant developmental differences within each region. The northern region’s right tail has considerably lengthened from the view of distribution extensibility, suggesting a rise in relative disparities. This disparity may be attributed to the accelerated economic expansion observed in certain provinces, such as Beijing and Tianjin, juxtaposed with the comparatively slower growth trajectories in other regions. Both sides of the tail have become more extended in the other four locations. This implies that regional differences are beginning to emerge within these four zones, with some provinces functioning as “leaders” and “laggards” in their respective regions. The result is the phenomenon in which the strong become stronger, and the weak become weaker.
Clearly, the five main regions of our nation are seeing an increase in the development of digital rural areas, and the absolute differences are widening to differing degrees. Regional disparities and polarization trends are still notable.

3.3. Spatial Decomposition of Disparities in Digital Rural Development Levels in China

3.3.1. Analysis of General Disparity

The evolution of the Dagum Gini coefficient nationally is shown in Figure 4a. The average total Gini coefficient for the sample period was 0.2849, with variations ranging from 0.2553 to 0.3187. However, the overall gap was at its lowest in 2014, falling by 0.0066, or 2.53%, to reach its lowest point that year. The coefficient then rose yearly, reaching a peak of 0.3187 in 2022, a 24.78% increase, which suggests that national inequities are gradually growing. In general, the problem of unequal growth in our nation’s digital rural areas has gotten worse, and closing the gaps between various regions is becoming more intensifying. Achieving the goal of balanced national development in digital rural areas remains a significant undertaking.

3.3.2. Analysis of Intra-Regional Disparities

According to the regional split “East–Central–West” (shown in Figure 4b), the average yearly internal differences in the three regions for the sample period were 0.2910, 0.1620, and 0.2172, respectively. Interestingly, the eastern region has the largest internal disparity and is slightly above the national average (0.2849); the western region is second, while the center region has the least internal variance. This shows that the issue of uneven digital rural development in the eastern region is severe, with the central region being the least severe. On temporal trends, the central region’s Gini coefficient has increased significantly by 44.29%, with a slight decline in 2016. In contrast, the western region shows a “W”-shaped gradual change trend. Internal differences in levels of digital rural development in the eastern region have shown an upward trend marked by significant volatility. By the regional division between the “North and South” (refer to Figure 4c), the differentiation degree in the northern region (0.2670) was slightly higher than that in the southern region (0.2651) throughout the observation period, with both values falling below the national average (0.2849). Regarding temporal trends, trends varying the Gini coefficient in the northern region displayed a pattern nearly consistent with the overall national Gini coefficient. However, all values remained lower than the national level. In contrast, the southern region’s Gini coefficient experienced a “U”-shaped movement, falling from 0.2594 in 2013 to 0.2458 in 2016, a 55.40% decrease, before rising to 0.2965, a 20.64% increase. In general, there are varying degrees of uneven development in rural digital areas in different regions, with this problem pronounced in the eastern region.

3.3.3. Analysis of Inter-Regional Disparities

The shifting patterns of the Gini coefficient between regions across Chinese regions for the degree of development of digital rural areas throughout the sample period are depicted in Figure 4d. When ranking the mean disparities between regions by annual average results, East–West (0.3680), North–South (0.3037), East–Central (0.2834), and Central–West (0.235) are the largest to smallest. With the noticeable East–West and North–South discrepancies, there are large differences in the degree of development of digital rural areas throughout the nation. Regarding the changing trend, the first three pairings (East–West, East–Central, and North–South) show a similar pattern, with 2014 being a turning point. This pattern is defined by an early fall followed by a wavering increase. In comparison, the disparities between the central and western regions presented moderate swings during the observation period, although overall, there was an upward trend with an increase of 8.25%. In general, the pace of digital rural development in the central and western regions has been relatively consistent. In contrast, the development rates in other regions have varied significantly, leading to widening gaps that hinder the balanced development of digital rural areas throughout the country.

3.3.4. Sources and Contributions of Differences

As shown in Figure 5a for the “East, Central, and West” regions, inter-regional disparities are the leading cause of digital rural area variations across our nation, with intra-regional disparities coming in second, and hyper-variable density being minimal (24.16%). This suggests that the overlapping parts between the East, Central, and West samples have little effect. The changing patterns in the contribution rates of the three variables are further explained in Figure 6a. Throughout the observation period, there were only slight variations in the intra-regional disparities, mostly constant at 29%. However, the hyper-variable density contribution rate and the inter-regional difference contribution rate exhibited inverse movements; a rise in the former was accompanied by a fall in the latter, and vice versa. Significantly, the rate of inter-regional inequalities has been steadily increasing, suggesting the problem of uneven digital rural development across the three regions is serious and urgently needs to be addressed.
According to the “North–South” viewpoint, Figure 5b shows that intra-regional differences account for 46.80% of the total differences in China’s digital rural growth. The contributions from hyper-variable density and inter-regional disparities, at 26.51% and 26.69%, respectively, are comparable, signaling that both causes impact the overall differences. From a temporal perspective, Figure 6b displays that from 2013 to 2022, the contribution rate of intra-regional differences has consistently reduced. In contrast, the contribution rate of inter-regional disparities has wavered in an “N” shape with a slight upward trend. On the other hand, the hyper-variable density contribution rate has shown a “decline-slight recovery-decline” pattern, with its lowest value occurring in 2019 at 22.03%. As a result, it is critical to address the issue of unequal development between the northern and southern regions, which calls for developing focused initiatives to support balanced growth.

3.4. Diagnosis of Obstacle Factors Affecting the Level of Development of Digital Villages in China

3.4.1. Identification of Obstacles at the Subsystems Level of the Indicator System

Based on the formula for calculating the degree of obstacles, we can find the subsystemic barriers to digital rural development in China from 2013 to 2022 and rank them accordingly. It is evident that the level of development of the digital industry in rural areas (45.94%) surpasses the level of the digital development environment in rural areas (24.83%), followed by the level of digital infrastructure in rural areas (21.85%) and the level of digitalization in agricultural production (7.38%). The main factor that hinders the development of rural digital areas in China is undoubtedly the growth of the rural digital industry.
Figure 7 shows the progression of subsystemic obstacles to digital rural development in our nation from 2013 to 2022. Although the total variations in these subsystemic obstacles are negligible, the trends differ markedly. In particular, the obstacles to rural digital industry development have remained relatively high throughout the sample period, showing a slow upward trend, increasing from 45.00% in 2013 to 45.94% in 2022. This suggests that the advancement of the rural digital industry is a significant bottleneck that needs immediate focus within the larger. The obstacles to the digitalization of agricultural production show a subtle alternating pattern of “rise and fall”, showing a slight overall increase and hinting that enhancements are still necessary within our country. The digital development environment and infrastructure in rural areas have seen progressive barrier reduction, with the former decreasing from 25.44% (2013) to 24.83% (2022) in a “decline-rise-decline-rise” trajectory. In contrast, the latter (digital infrastructure barriers) displays a distinct “U” shaped trend over the same period. In a word, the advancement of digital rural areas must set priorities for reforming industrial shortages while continuously enhancing the environment and infrastructure to expedite rural revival.

3.4.2. Identification of Barrier Factors at the Secondary Index Level of the Indicator System

This study finds the impact of evaluation signs on the advancement of digital villages in our nation based on the assessment results of digital village development levels. It conducts a diagnostic analysis of obstacles to digital village development across five regions in our country by studying subsystemic layer hurdles. Due to the numerous indicators, Table 3 shows the five main barrier elements and their associated barrier levels for developing digital villages in our nation from 2013 to 2022. Diagnostic results show the number of Taobao villages (X18), e-commerce procurement amount (X20), e-commerce sales amount (X21), the volume of rural postal and telecommunications services (X7), and local government science and technology expenditures (X14) are the top five barriers to digital rural development in five regions. This means the principal impediments are defined by the prevalence of “focusing firstly on the barriers to the development of digital industries in rural areas, with shared challenges across the five regions being especially evident”. The number of Taobao villages (X18) tops the list, representing a great bottleneck faced throughout the country and in many locations, especially in the central region, which is significantly affected at 27.11%. In the western region, it achieves 26.02%, underscoring its widespread restricting influence. The e-commerce procurement amount (X20) and e-commerce sales amount (X21) are closely followed. Obstacles in five regions are consistently ranked, marking their importance in advancing digital rural areas in our country. Regional disparities become evident in the fourth and fifth barrier causes: the eastern region emphasizes the balanced enhancement of rural postal and telecommunications business volume (X7) and fiscal technology expenditure (X14). In contrast, other areas display a contrasting trend, showing a varied demand for regional development tactics.
In summary, the number of Taobao villages (X18), e-commerce procurement amount (X20), e-commerce sales amount (X21), the volume of rural postal and telecommunication services (X7), and local government expenditures on scientific and technological development (X14) collectively mean the primary limits on the advancement of digital rural areas in our nation. So, priority should be given to strategically developing Taobao villages, expanding e-commerce transaction channels, improving local government investment in technology, and improving rural postal and telecommunication services to comprehensively and synergistically advance digital rural areas.

3.4.3. Analysis of Barrier Factors

The assessment of obstacle degree shows that the development of the rural digital industry faces the most significant impediment, at 45.94%. The rural digital industry is now the principal obstacle to developing digital villages. The causes of this obstacle can be analyzed from multiple viewpoints: 1. Disparate e-commerce advancement: Current data suggests large regional inequalities in the allocation of Taobao villages and the amount of e-commerce transactions. In 2022, the eastern coastal regions, particularly Guangdong, saw a notable concentration of Taobao villages, amounting to 1466. This province shows large e-commerce transaction volumes, totaling 7.0458 trillion yuan. In contrast, the western areas, particularly Gansu, have a few Taobao villages, with merely three documented in 2022 and lower e-commerce transaction volumes of 231 billion yuan. This disparity may arise from differences in regional economic conditions, with the eastern regions presenting more advanced economies and Internet infrastructure. Conversely, the western regions show comparatively lower levels of development, characterized by worse digital infrastructure. 2. Inadequate digital infrastructure in rural regions: The advancement of e-commerce is impeded by inadequate digital infrastructure, including broadband networks and logistical systems, notably in the rural central and western regions. The e-commerce development in Gansu Province has been sluggish due to the limited investment in digital infrastructure, resulting from economic limits. 3. Branding and quality assurance of agricultural products: The expansion of e-commerce needs not only quantitative growth but also qualitative improvements. Many regions face difficulties in agricultural product branding and quality assurance, impeding their competitive market capabilities. This, thus, limits the sustainable advancement of e-commerce. 4. Uniform e-commerce transaction framework: E-commerce transactions in Gansu are primarily focused on big cities, with a minimal share assigned to rural platforms. This could lead to an incomplete e-commerce ecosystem, hindering the establishment of an independent e-commerce environment.

4. Discussion

This article presents the following principal conclusions based on the above research analysis.
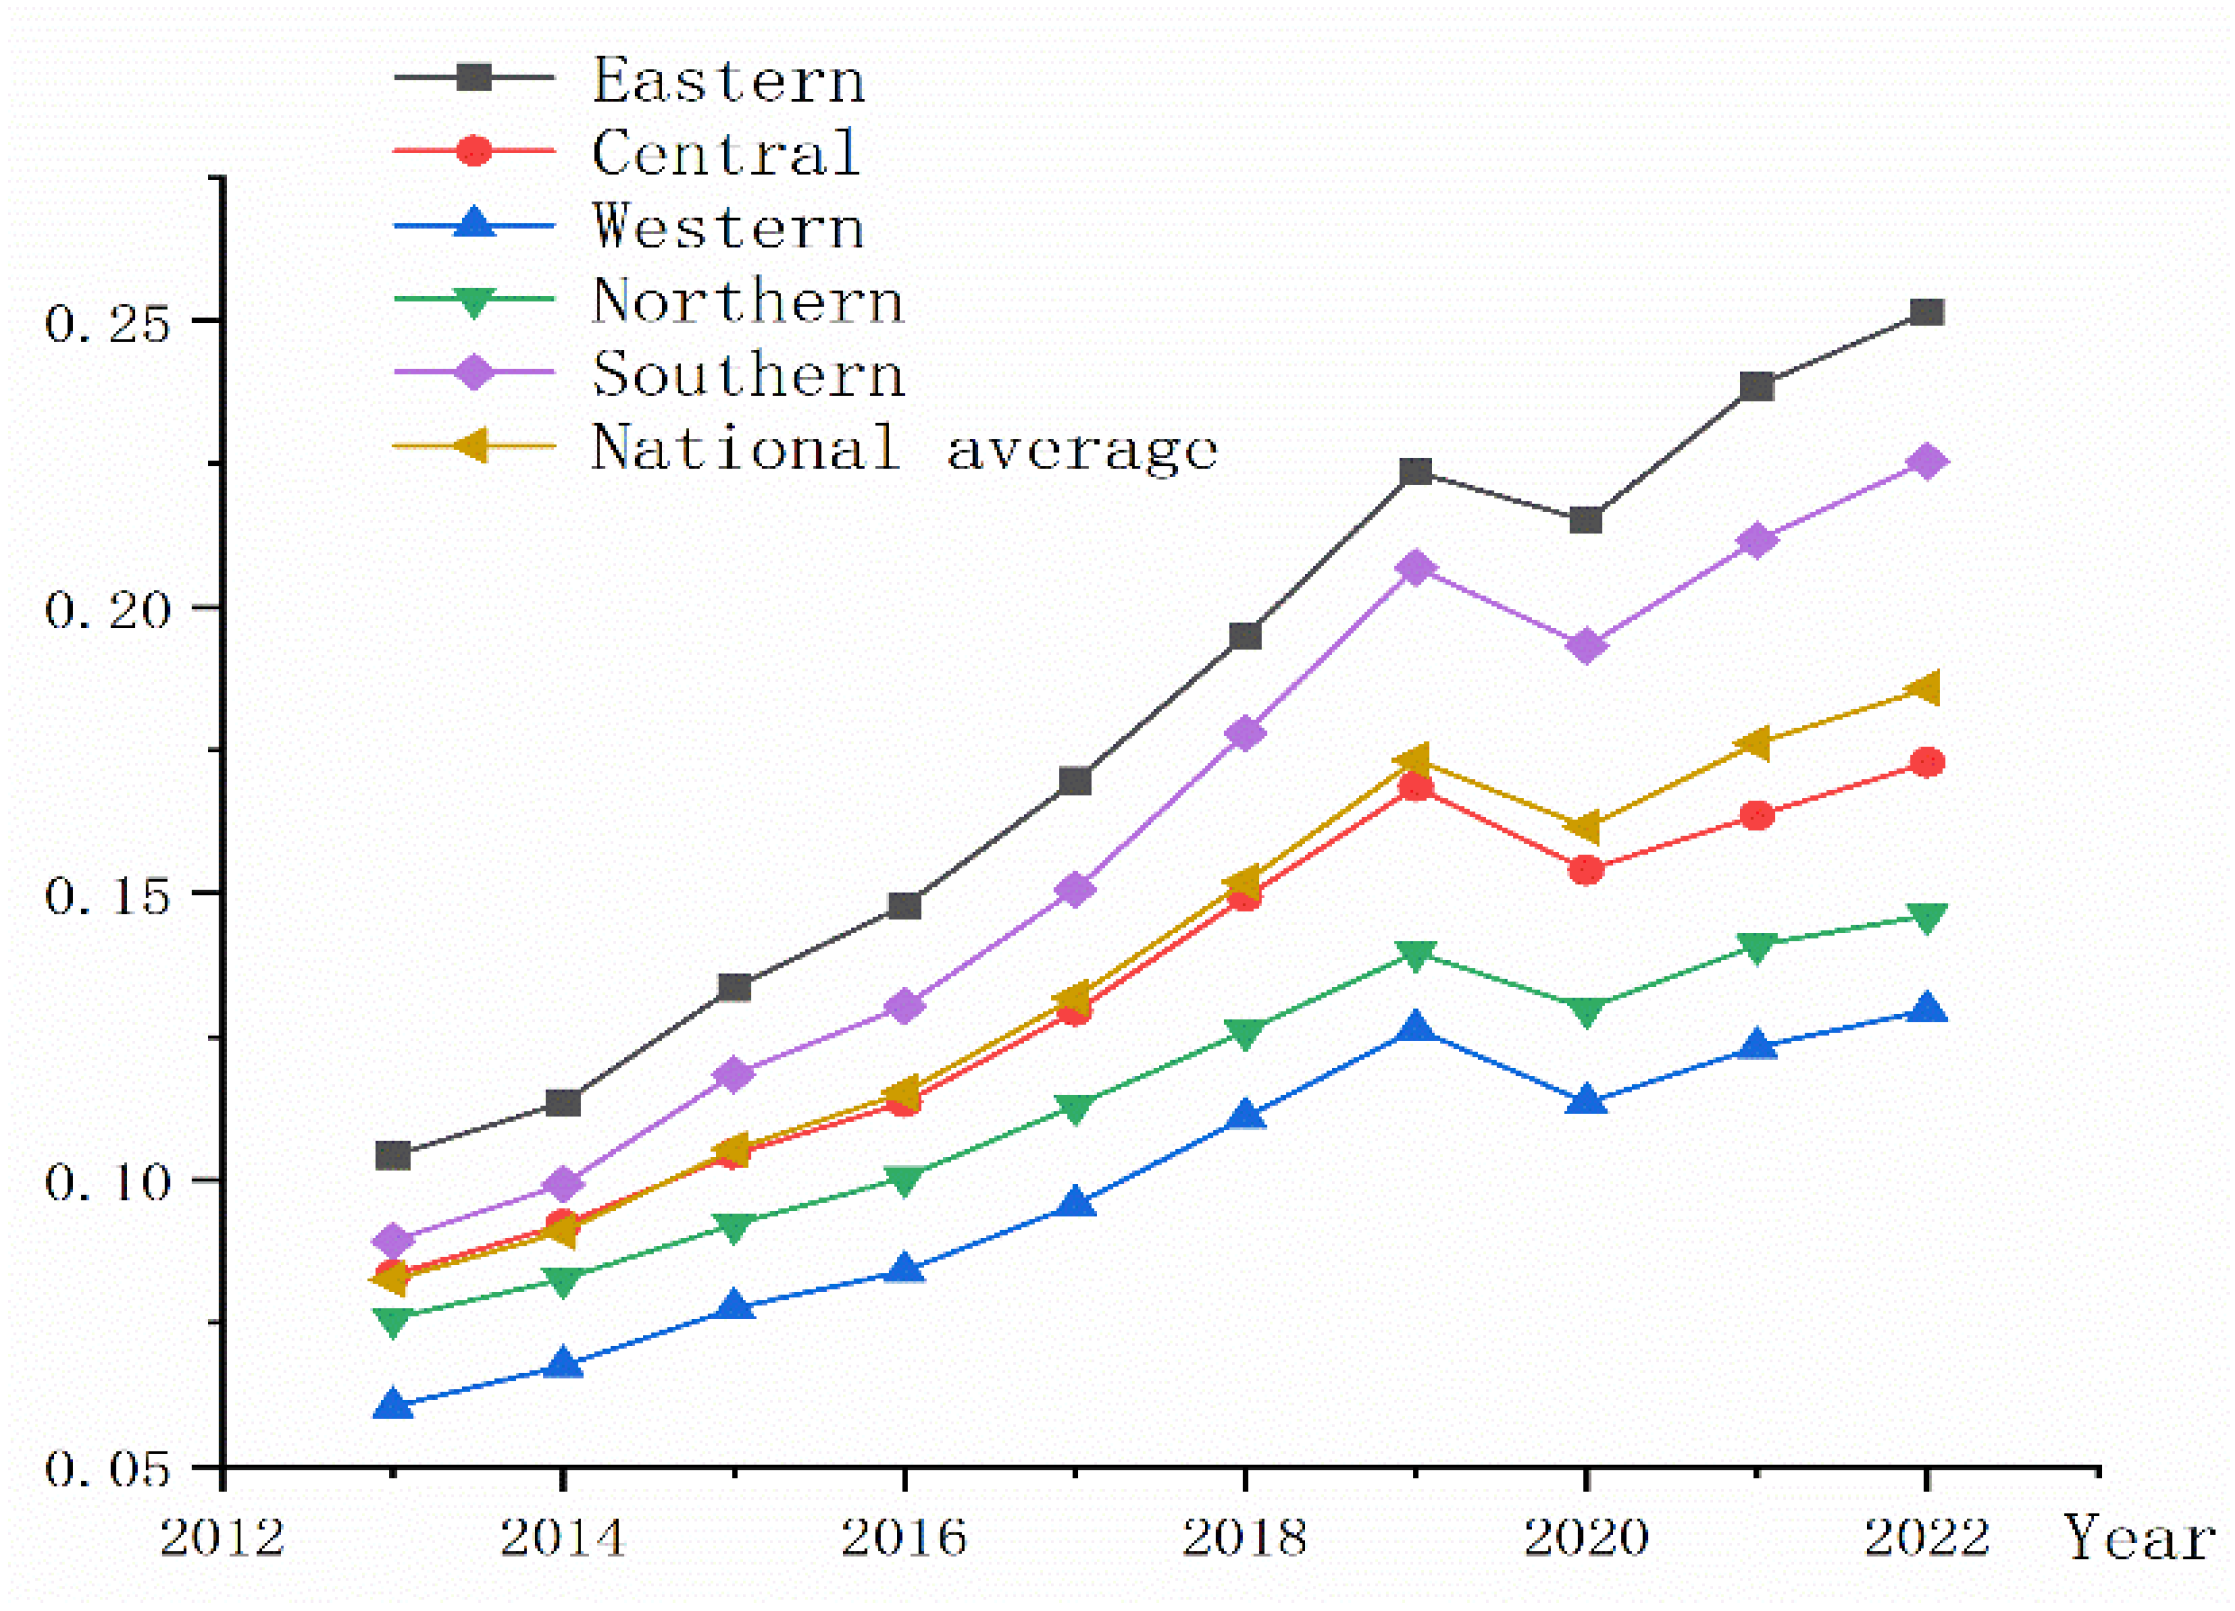
  • The entropy weight method is first used to evaluate the level of digital village development in China. Our research findings show that between 2013 and 2022, our country’s overall development of digital rural areas had a swinging upward trajectory, with an average annual growth rate of 9.432%. The development trends of digital rural areas in the five regions are closely similar to the national level, with a significant fall in 2019, while the other years had an upward trajectory. Notably, notable discrepancies are evident at the province level, especially between Hainan (0.040) and Guangdong (0.330).
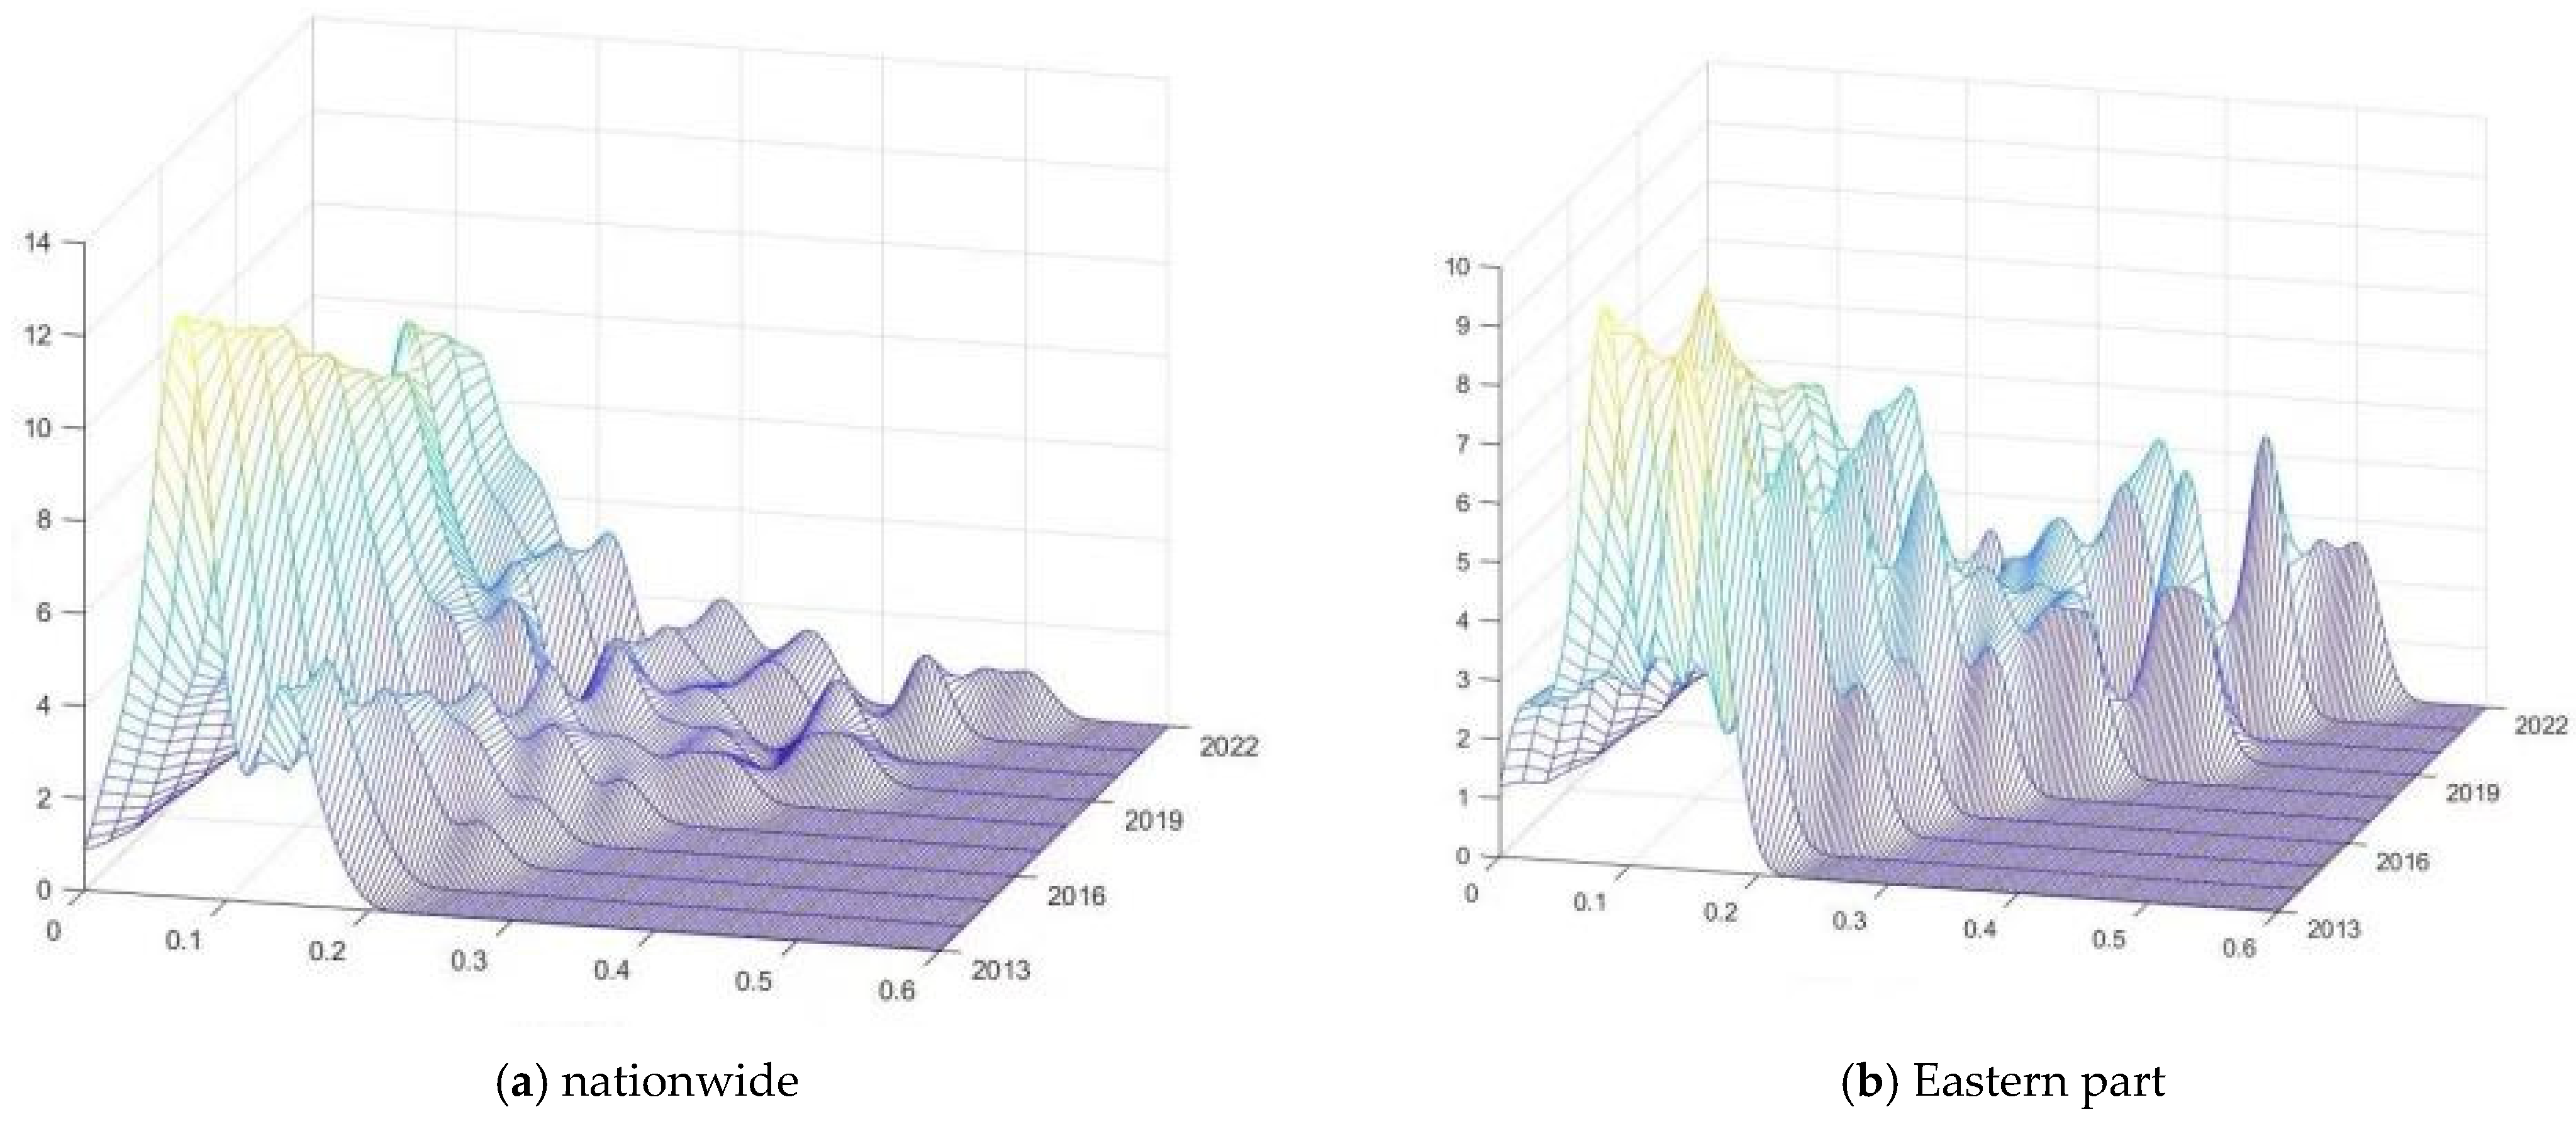
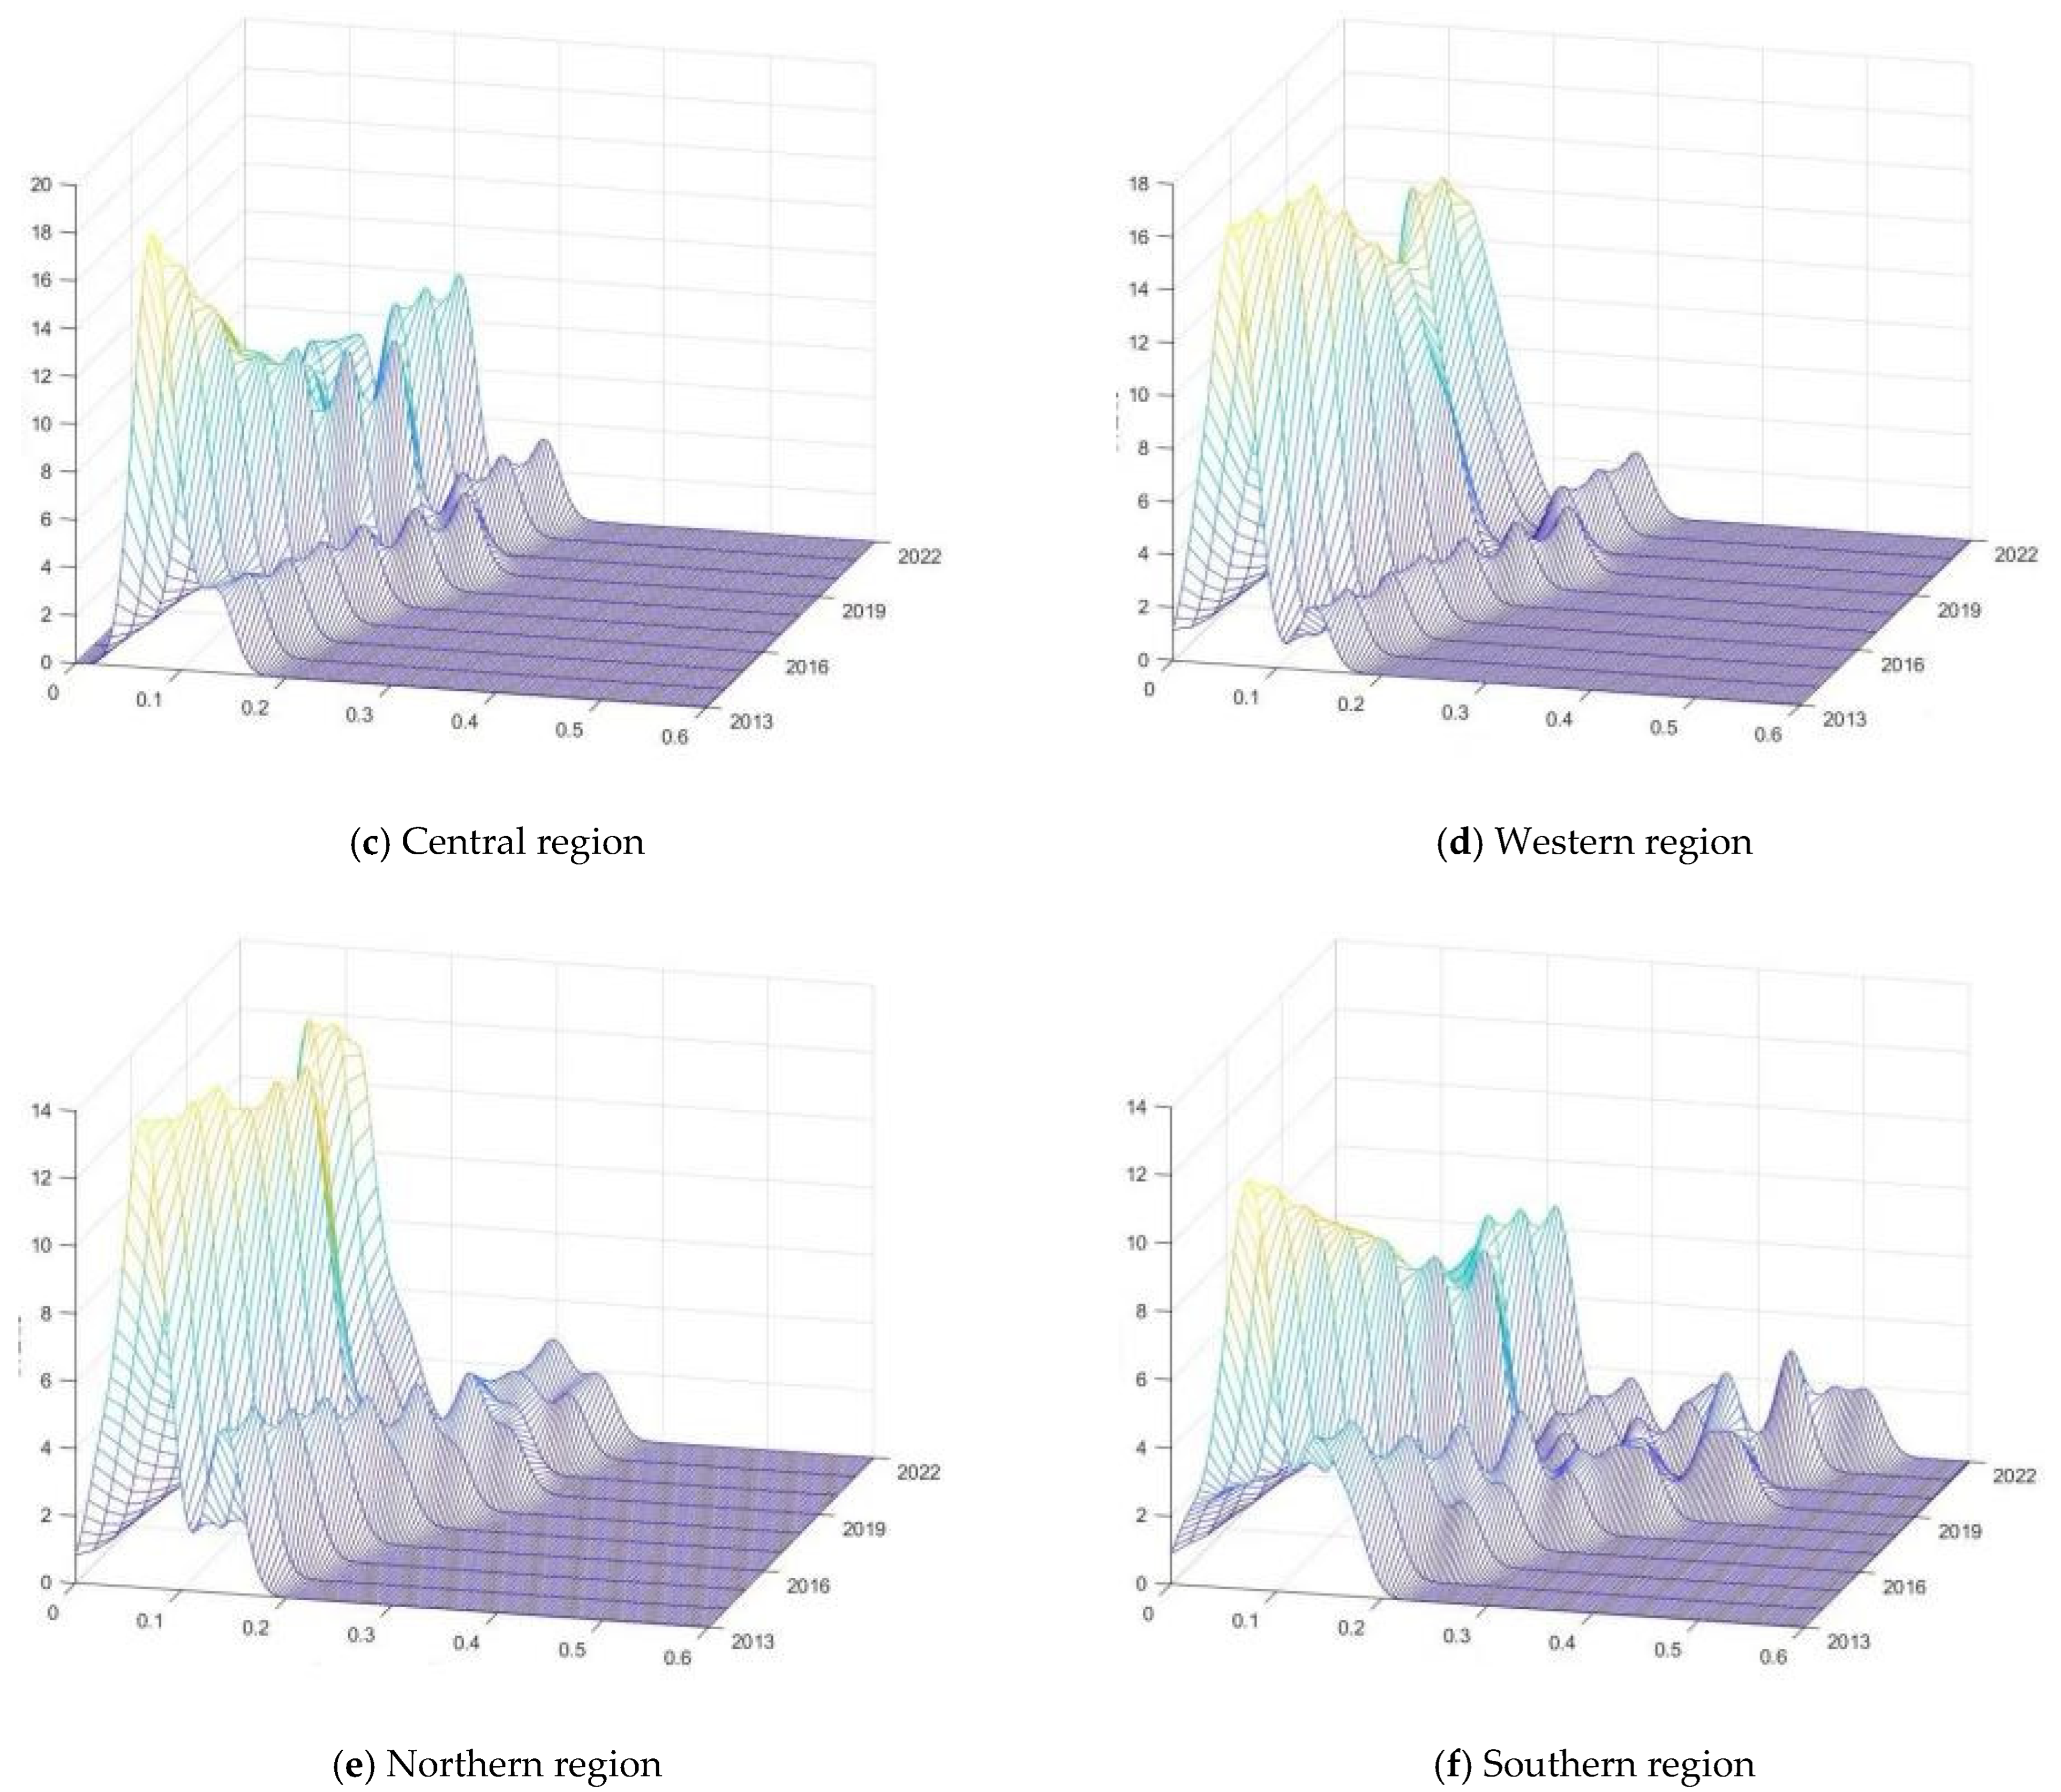
  • Then, this research uses kernel density estimation to analyze the distributional dynamics of digital village growth in China. From the view of distribution dynamics, improving digital rural development levels across the country and the five major regions are accompanied by a trend of distribution becoming more dispersed. A decrease in the kernel density curve’s peak and an increase in its width serve as proof of this. In particular, extensibility is higher nationally and in the northern region, whereas multipolarity is still in the eastern region. On the other hand, there is a tendency toward bipolar to multipolarity nationally and in the other four areas. Regional development inequalities are chiefly ascribed to differences in resource endowments, governmental support, and infrastructure quality. This intensifies the Matthew effect, in which the privileged added more benefits while the underprivileged lagged further behind.
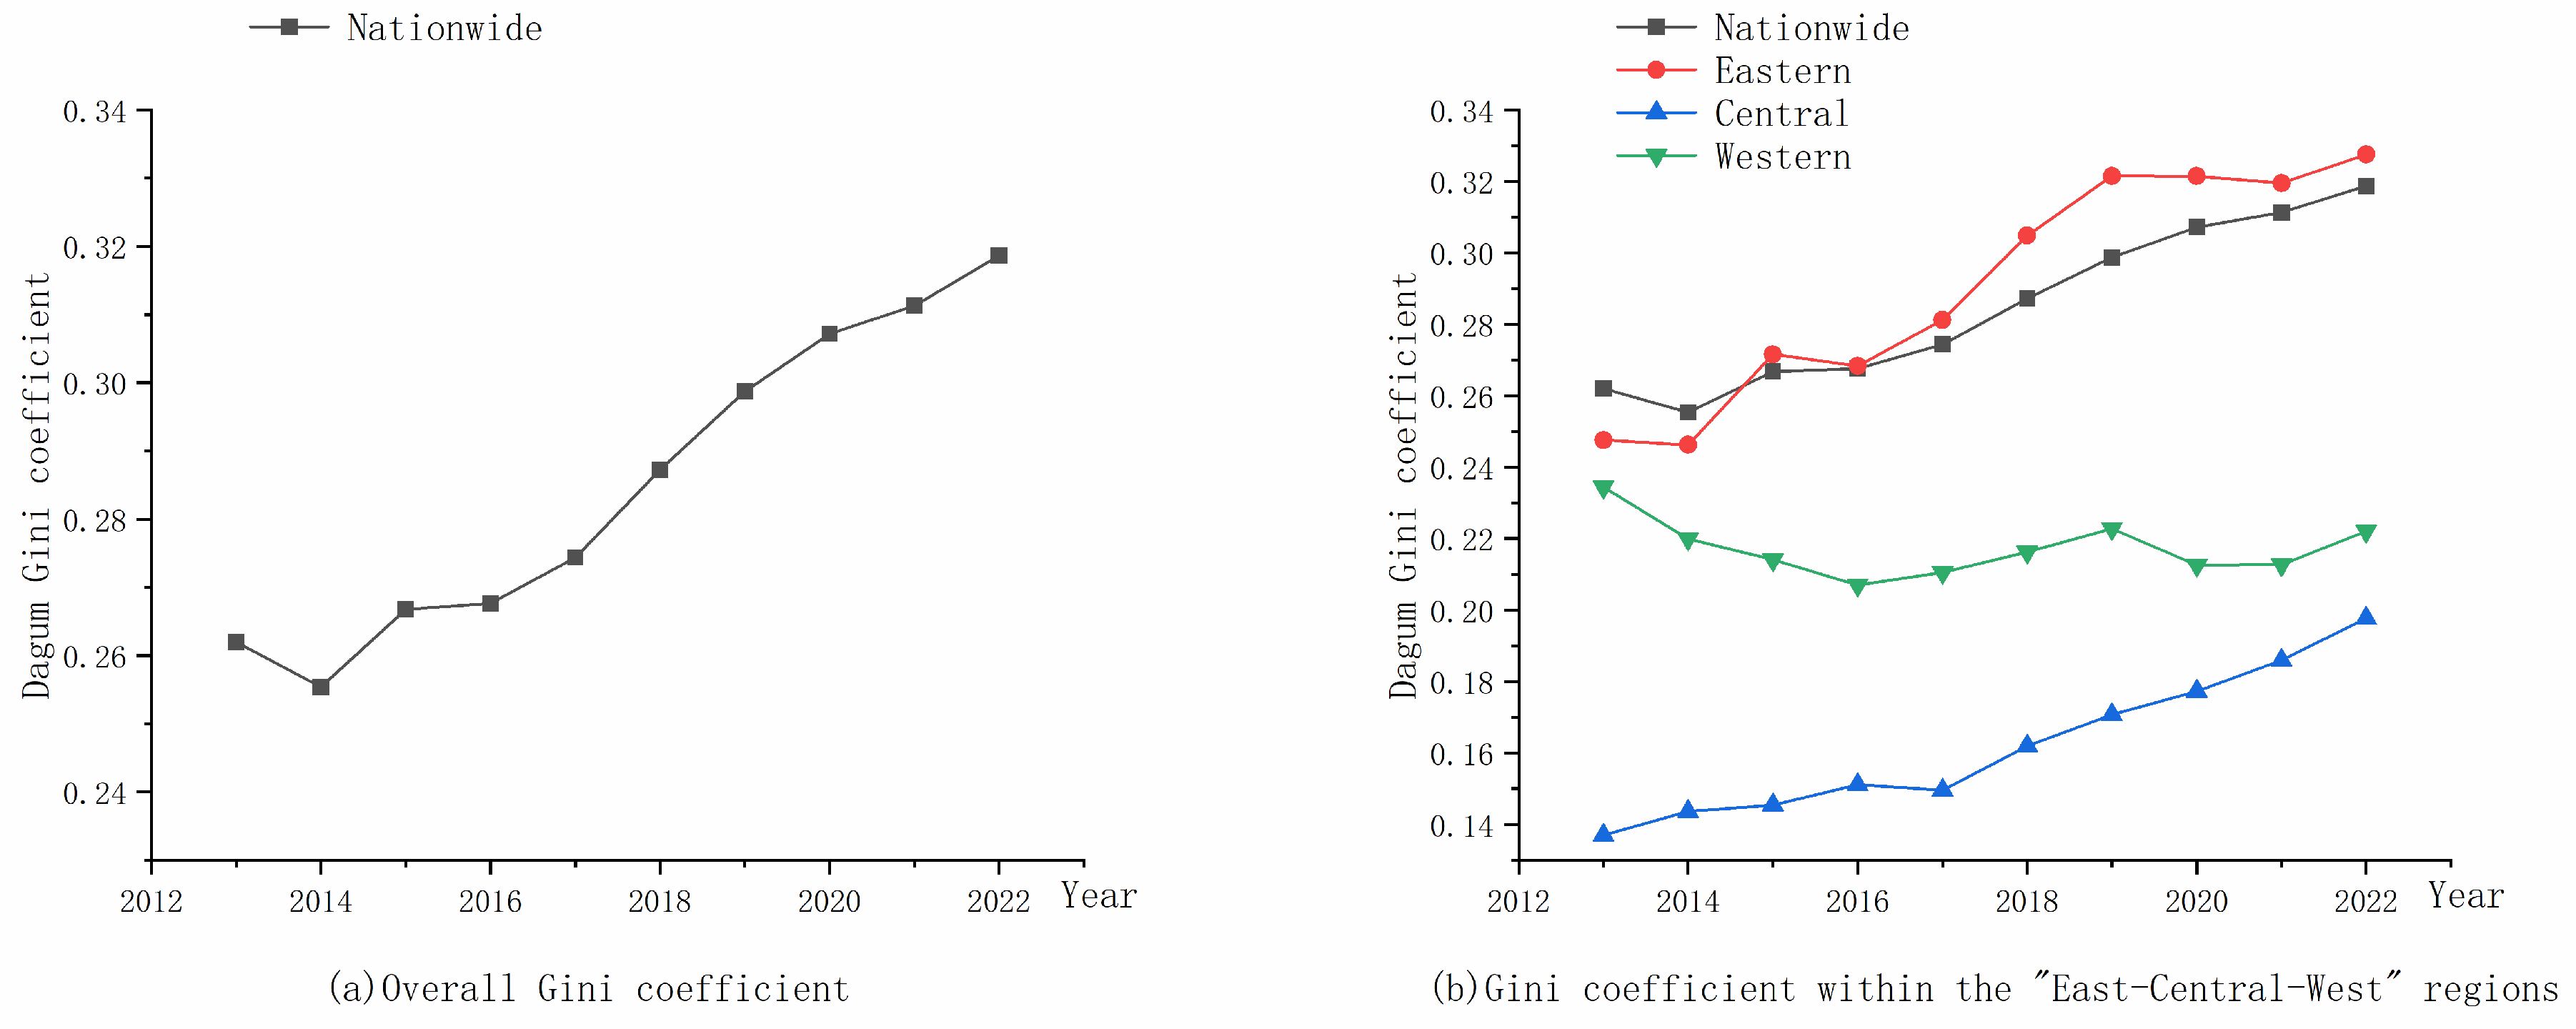
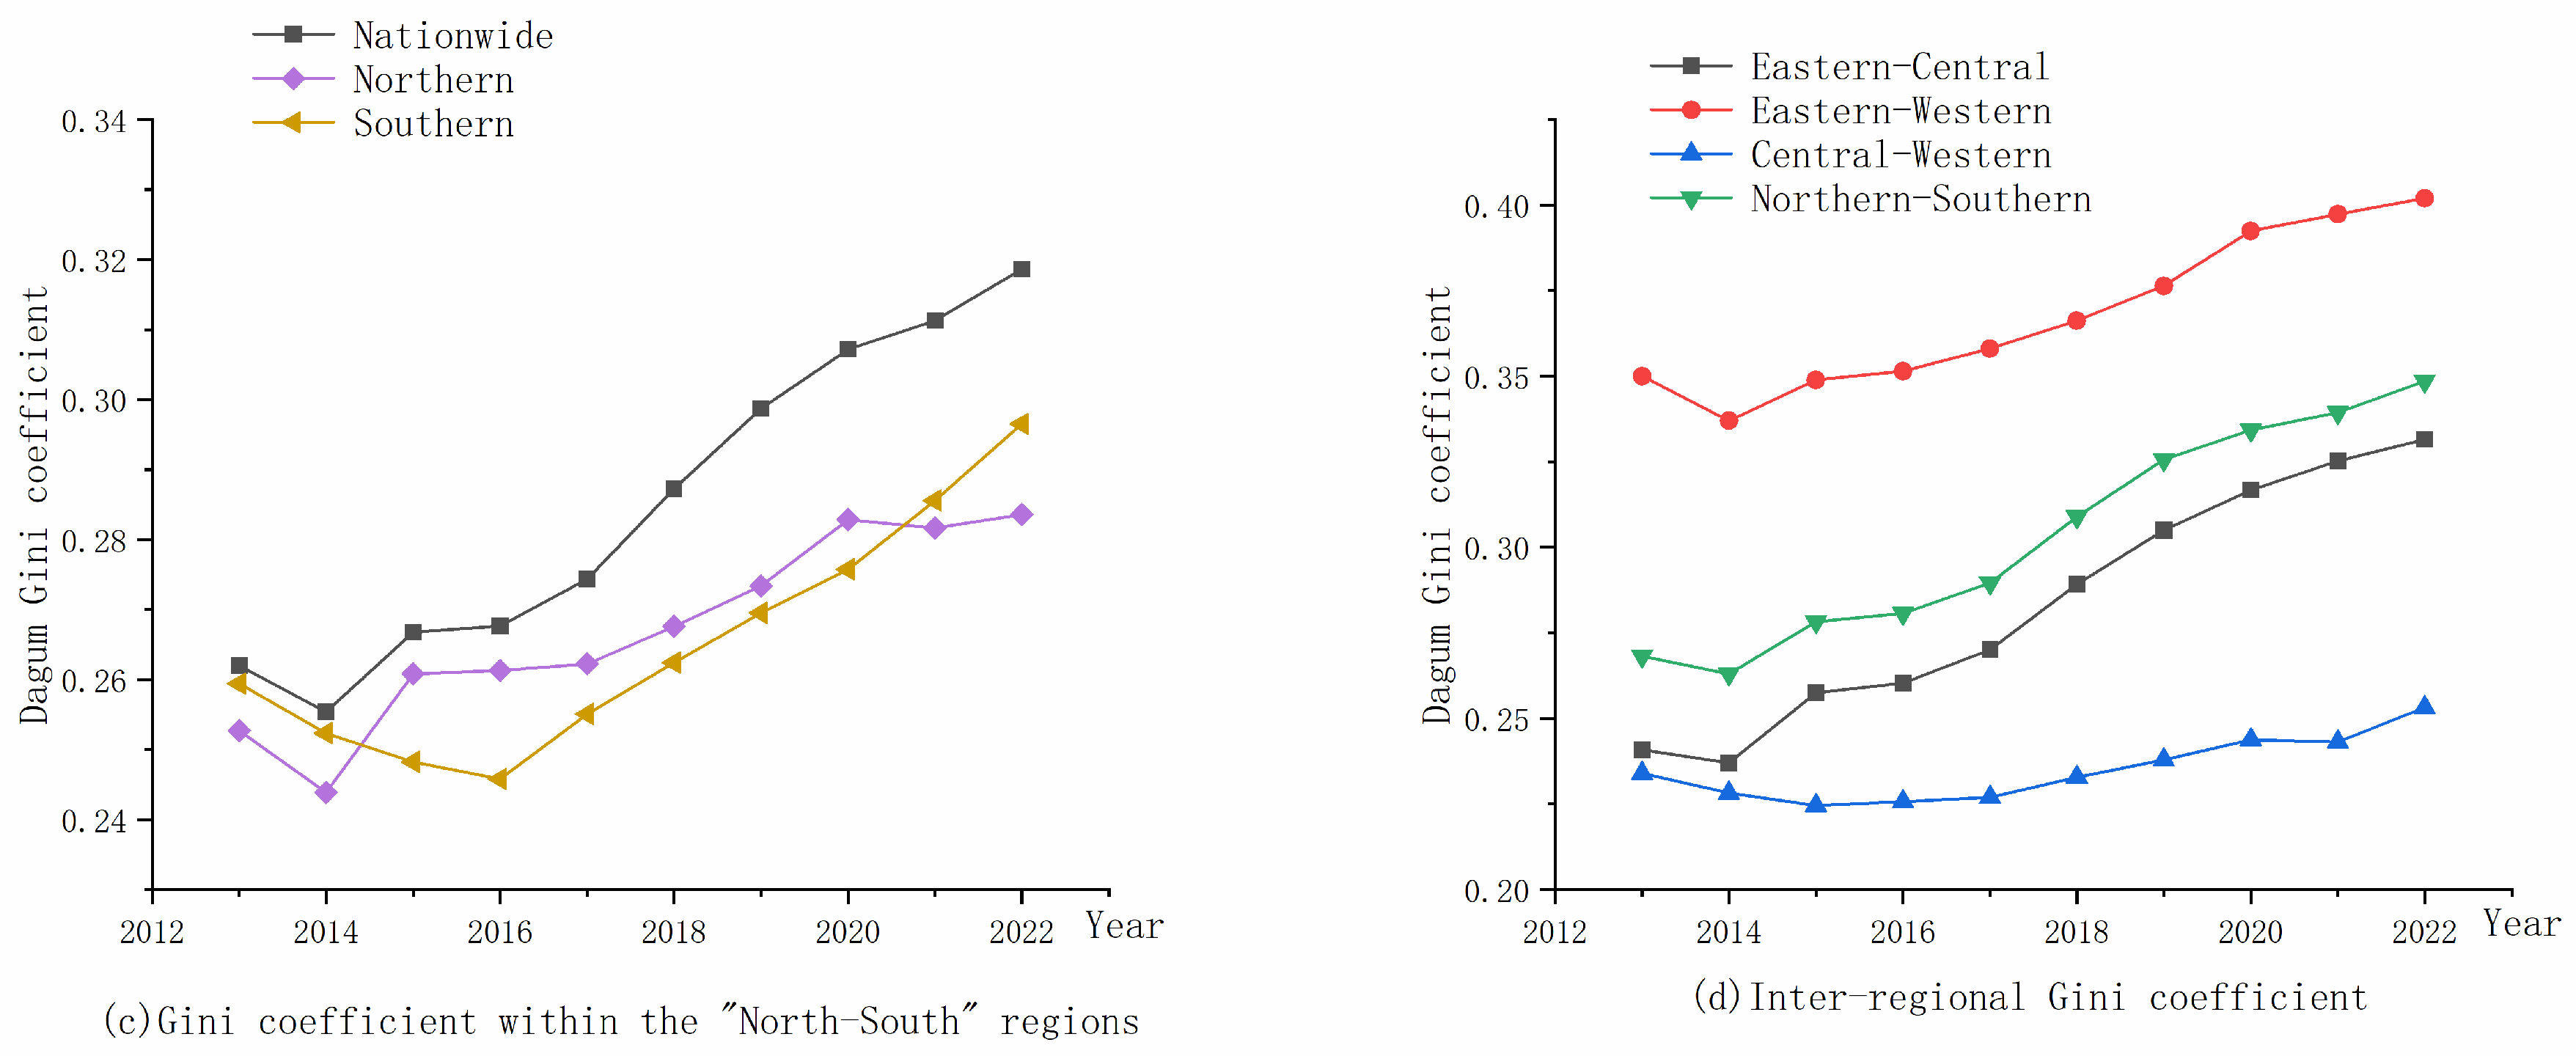
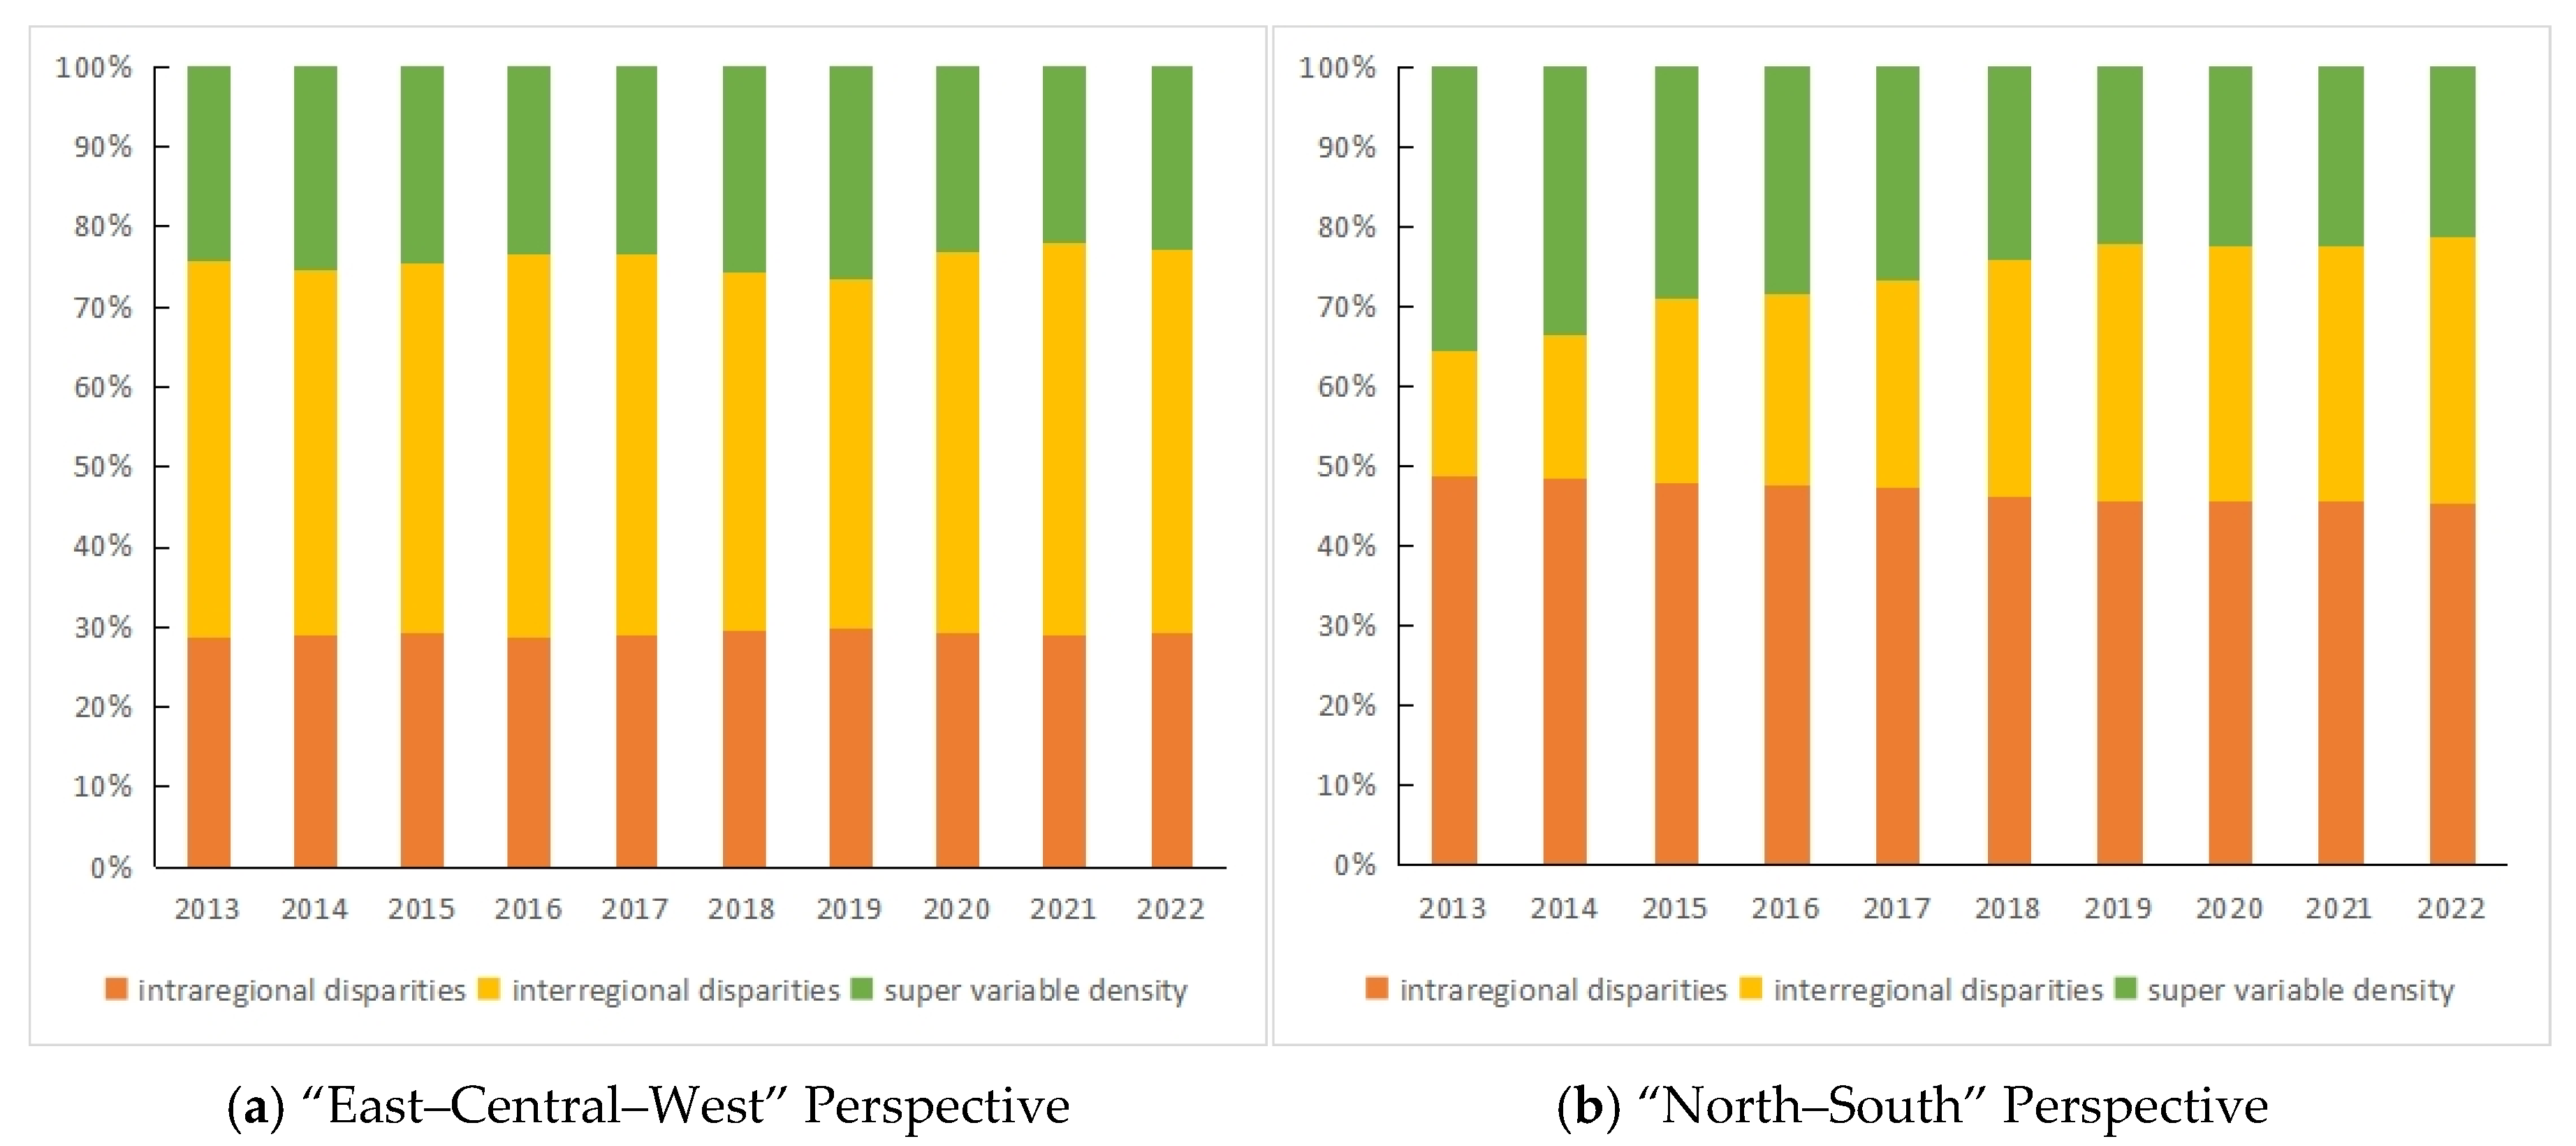
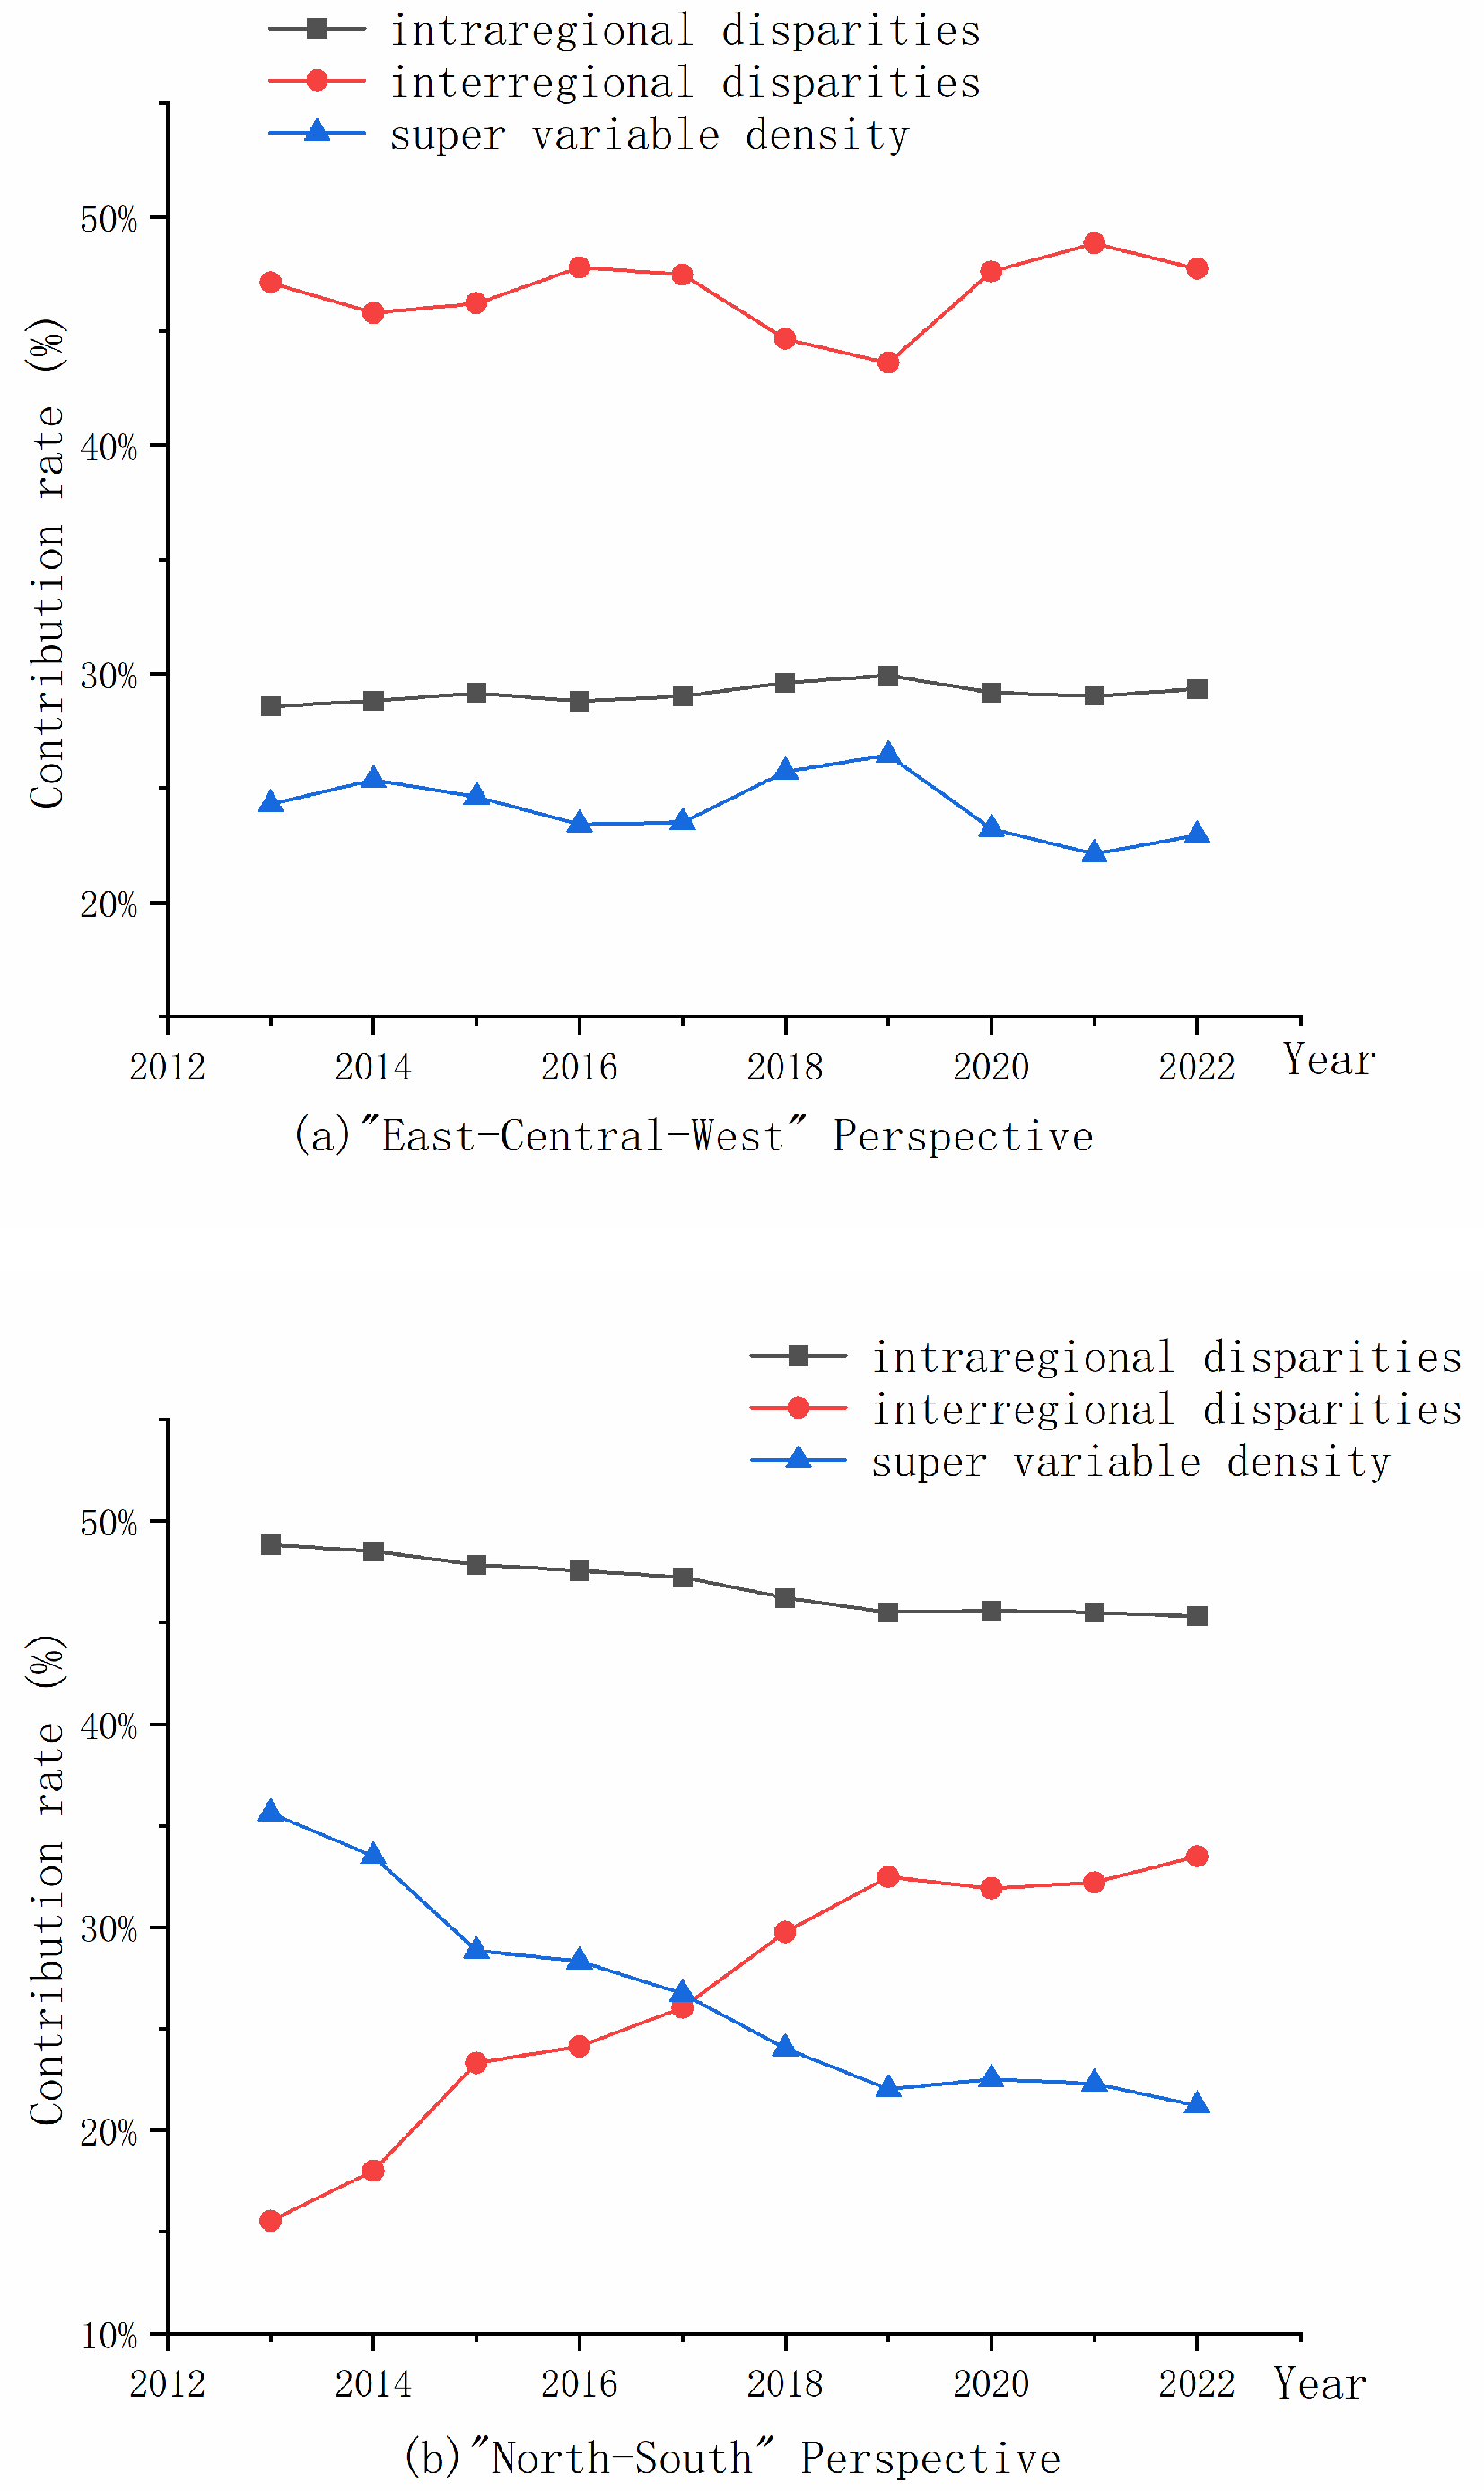
  • This study utilizes the Dagum Gini coefficient and its decomposition method to thoroughly clarify the dynamics of spatial disparities and their origins in the emergence of digital villages in China. The research findings show that the growing imbalance in developing digital rural areas in our country is highlighted by the widening regional differences in the development of digital rural areas. The North–South discrepancies are mainly attributed to intra-regional variances, while the East–West differences are largely due to inter-regional disparities. Disparities are evident both intra-regional and inter-regional to differing extents.
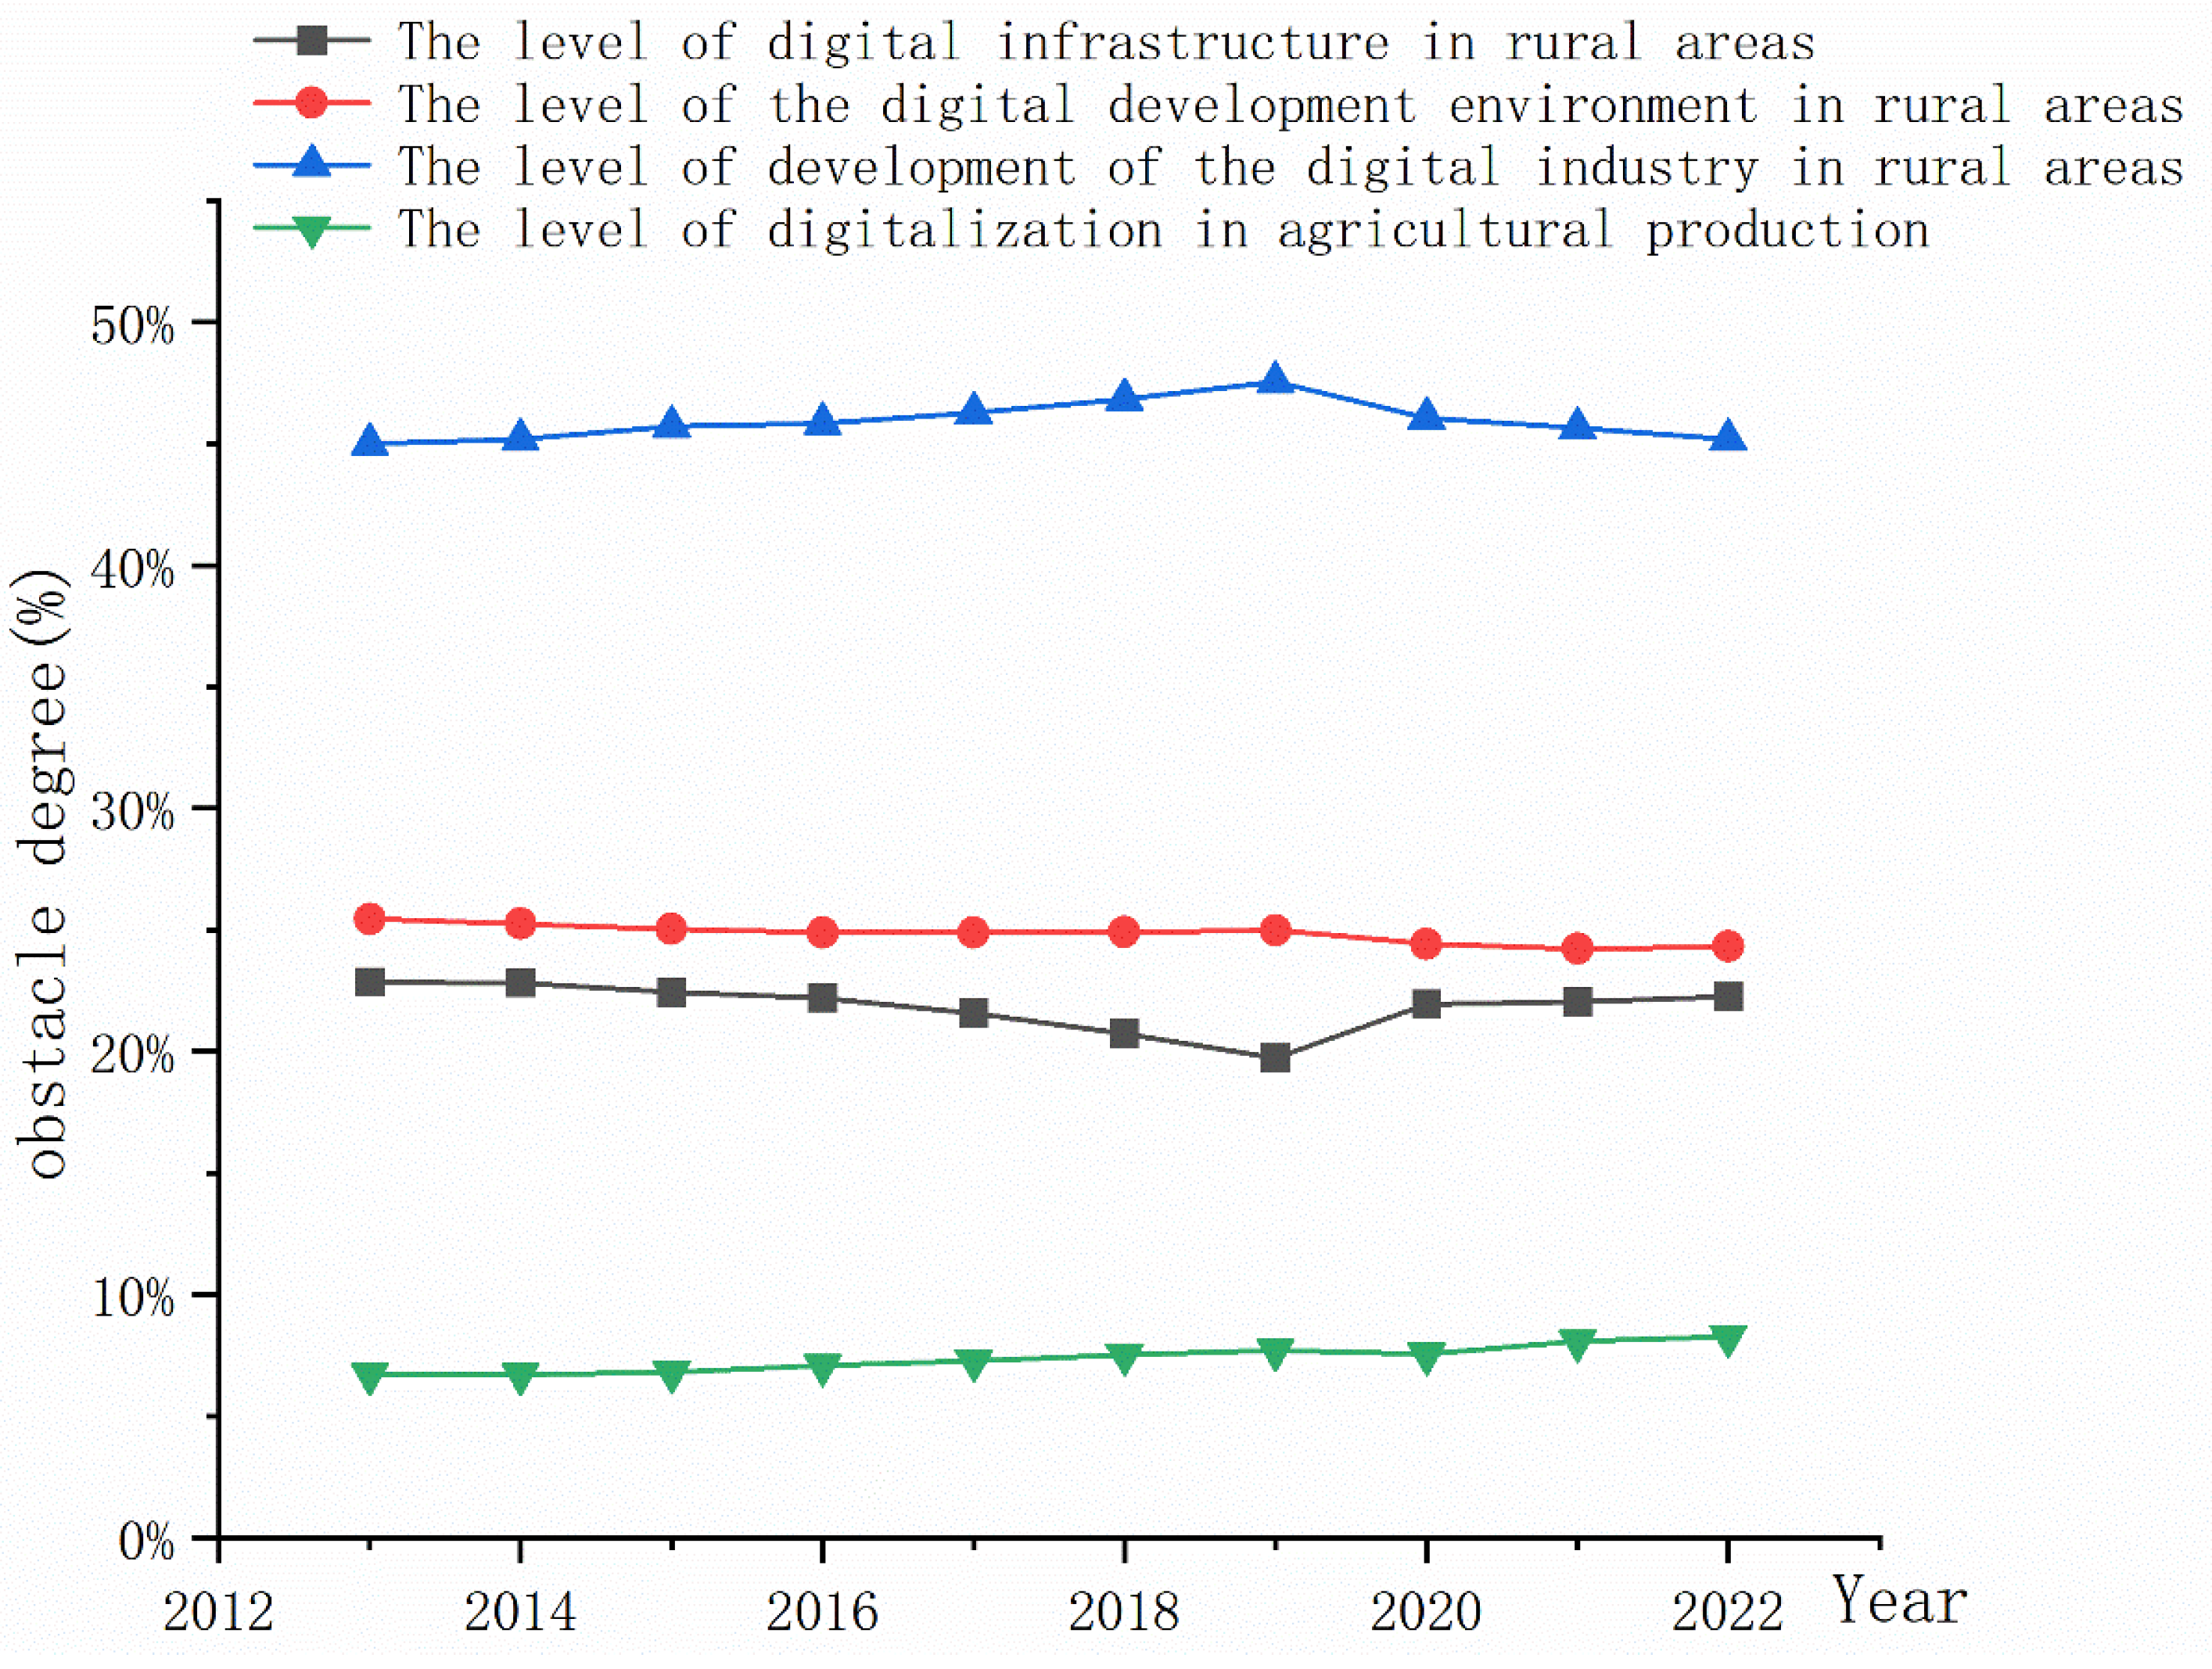
  • This study uses an obstacle degree model to identify the primary barriers to digital village development in China. The analysis of barriers suggests that the primary obstacle affecting the development of digital rural areas in China during the sample period is developing the rural digital industry within the subsystem layer. This obstacle mainly arises from four critical domains: uneven regional e-commerce advancement, inadequate infrastructure in central and western regions, subpar development of agricultural product quality and branding, and a homogeneous structure in e-commerce transactions. From a time series perspective, the swings in the barriers across various subsystem layers are relatively minor, yet their trends display significant differences: the barriers associated with the development of the rural digital industry and the digitalization of agricultural production show an overall upward trend, while the barriers on the rural digital development environment and rural digital infrastructure show a downward trajectory. With identifying barriers at the secondary index level, the number of Taobao villages emerges as the leading obstacle. For the eastern region, the top five causes hindering the development of digital rural areas are as follows: the number of Taobao villages, e-commerce procurement amount, e-commerce sales amount, rural postal and telecommunications service volume, and local fiscal science and technology expenditure. The barrier reasons in other regions align with those in the eastern region, although there is a reversal in the rank of the fourth and fifth causes compared to the eastern region.
The most significant innovation of this paper is the creation of a more extensive evaluation index system for assessing the degree of digital village growth, effectively overcoming the dimensions and practical limits identified in current systems. Also, it examines the developmental status of digital villages in China from the dual perspectives of “East–Central–West” and “North–South”. It addresses the limits of previous analyses focusing solely on the “East–Central–West” dimension.
Many constraints remain. First, this study examines the differences in digital village growth across eastern, central, and western regions, as well as northern and southern regions. However, a more detailed analysis of regional variations and the distinctions among various rural village types within these areas is necessary. Future research should improve the existing regional disparity analysis by further dividing the segmentation of study areas. A deep analysis of the features and distinctions in digital village development among diverse rural village classifications within these regions (e.g., plain villages, mountain villages, forest villages) is advised. Examining the fundamental reasons for these disparities would establish a solid basis for devising specific digital village development policies. Second, although the paper identifies specific reasons contributing to disparities in digital village development, the analysis of the interactions among these causes and the underlying mechanisms is insufficiently thorough. Future research should conduct a comprehensive examination of the contributing elements and mechanisms. The utilization of many research approaches, including econometric models and case studies, is essential for analyzing the interconnections and operational dynamics of elements influencing digital village development.

5. Recommendations

From the preceding results, we may devise some recommendations to improve digital villages in China:
1. Augment digital infrastructure development.
(1) Improve digital infrastructure: Promote building sophisticated infrastructure in rural regions, encompassing 5G networks, fiber optics, and the Internet of Things, to expand digital infrastructure coverage. Improve the development of intelligent logistics networks in rural regions to optimize the e-commerce logistics system.
(2) Encourage the comprehensive integration of digital technologies within agriculture. Hasten the digital transformation of agriculture using intelligent agricultural machinery and precision farming technology. Promote businesses and social capital involvement by government procurement or service outsourcing to improve social engagement.
2. Fostering the advancement of digital industries in rural regions to surmount challenges in the progression of rural e-commerce.
(1) Advancing equitable e-commerce growth and closing the disparity in e-commerce development. It is essential to improve the infrastructure in central and western areas, foster local e-commerce platforms and service firms, and create unique local brands.
(2) Optimizing the structure of e-commerce transactions: Encouraging the varied advancement of rural e-commerce to prevent excessive dependence on a singular platform. Promoting and exploring innovative models, including local e-commerce platforms and community e-commerce, to foster the robust advancement of the local e-commerce ecosystem.
(3) Heightening the development of agricultural product branding: First, reaching a sustainable transition in agricultural output needs stringent regulation of fertilizer and pesticide usage to guarantee product quality. Consumer health needs to be stressed. Second, the meticulous processing and design of agricultural products to set up brands with distinctive qualities should be highlighted. Effective consumer feedback and assessment systems must be set up to increase consumer satisfaction and consistency. Third, to tackle the challenges of subpar agricultural product quality and inadequate branding, it is essential to complete a quality traceability system for agricultural products to bolster their market competitiveness. Concurrently, promoting collaboration between local governments and enterprises to settle regional public brands for improved market recognition is necessary.
(4) Developing rural e-commerce professionals. Creating tailored training programs that address the diverse circumstances and needs of rural e-commerce practitioners. Consistently engaging expert lecturers to deliver specialized training. Enhancing school-enterprise collaboration. Colleges tailored to e-commerce talent development to align with the wants of local e-commerce professionals. Motivating college students to set up enterprises in rural regions. Forming collaborative partnerships between vocational secondary schools and enterprises, creating educational internship facilities, and imposing enduring procedures.
3. Advancing the progress of sustainable digital agriculture.
(1) Improving green agricultural development. The utilization of digital technology for energy conservation and the decrease in emissions in agriculture must be intensified to help the sector become green. Also, advanced agricultural machinery should be advocated for to improve production efficiency and reduce resource waste.
(2) Developing an assessment and evaluation system for green agricultural development and integrating digital technologies into the assessment indicators is essential. The research and development of green agricultural technology and the application of research findings must be enhanced to advance sustainable agricultural development.
4. Heightening the digital governance framework in rural regions.
(1) Improving local governance competencies. The digital governance capacities of local authorities must be fortified, and a digital rural governance framework should be instituted to augment governance efficiency. Collaboration across departments should be improved to optimize resource allocation and ensure the successful execution of digital rural programs. Developing and completing relevant laws and rules for digital rural advancement are essential to developing a conducive policy framework for digital villages.
(2) Advancing the digital transformation of rural government. The promotion of intelligent rural management systems is essential for the digitalization and enhancement of rural government. The involvement of social forces in rural governance improves transparency and participation in governance and should be encouraged.
5. Promoting social participation in digital village development. Using diverse policy instruments can actively engage the enthusiasm of stakeholders [42].
(1) The engagement of enterprises and social capital in digital village construction should be promoted, particularly in the central and western regions. It is important to enable the participation of various societal entities, including research institutions and industry associations, in developing digital villages.
(2) Encouraging the integration of diverse applications within digital villages. The deep integration of digital technologies with sectors such as culture, education, and healthcare should be advanced to improve rural residents’ well-being and sense of fulfillment.
6. Addressing regional disparities and implementing targeted support and collaboration mechanisms.
(1) Implementing distinctive policies. Devising and performing tailored development policies that address regional inequalities in digital village advancement is essential.
Large variations exist in the developmental levels of digital villages across China’s eastern, central, and western regions. To address this disparity, tailored policies must be enacted in four critical domains: infrastructure development, industrial advancement, talent development and technological integration, and policy and financial aid. The eastern region must prioritize the enhancement of network infrastructure, the promotion of industrial integration and advancement, and the attraction of high-caliber people. The central and western regions need improved investment in networks and logistics to stimulate rural e-commerce enterprises’ development and advance the distinctive agriculture digital transformation. The eastern area should direct social capital investment and develop innovative policy instruments for policy and financial support. The central and western regions should augment financial help from the central government and create dedicated subsidy funds. In the northern regions, optimizing network coverage and improving logistical networks is essential. About industrial support, emphasis should be placed on advancing the digital transformation of unique agricultural techniques and improving rural e-commerce. Concurrent initiatives must focus on returning talent to rural regions and strengthening technical cooperation. Financial help should be delivered via fiscal transfer payments, targeted subsidies, tax incentives, and monetary support. In contrast, the southern regions ought to prioritize the enhancement and growth of networks and the development of intelligent agricultural infrastructure. Promoting the convergence of digital and physical economies. The simultaneous recruitment of top-tier talent, the improvement of employee training and education, and the promotion of policy innovation are essential.
(2) Implement mechanisms for collaborative support and cooperation. Progressive provinces in digital village development ought to aid underdeveloped regions, as shown by the alliance of Zhejiang in the east with Gansu in the west. The helping party can share planning, implementation experience, and personnel exchanges for digital village construction, aid the regions in framing digital village development strategies, and provide policy consultation and technical guidance. Promote collaboration between advanced digital technology firms and rural enterprises.
7. Check and evaluate progress to swiftly vary methods. Performing quantitative evaluations and constant monitoring of the advancement and growth stages of digital village construction in various places is an essential responsibility [43]. Due to the intricate and evolving characteristics of digital rural development, it is pressing to impose a comprehensive dynamic surveying and evaluation system. Periodic assessment reports must be distributed to quickly identify concerns and shortages, helping to make strategic adjustments. Additionally, it is essential to improve oversight and analysis across many locations and industries to show a foundation for developing customized strategies.

Author Contributions

Conceptualization, M.L.; methodology, S.H.; formal analysis, M.L. and X.Y.; resources, D.W.; data curation, H.C.; investigation, X.Y.; writing—original draft, X.Y.; writing—review and editing, M.L.; visualization, X.Y.; supervision, M.L.; software, W.Z.; project administration, D.W.; All authors have read and agreed to the published version of the manuscript.

Funding

This research is partially funded by the Hubei Science and Technology Department Project (grant: No. 2019CFB224).

Institutional Review Board Statement

Not applicable.

Informed Consent Statement

Not applicable.

Data Availability Statement

The data generated and analyzed during this research are available from the corresponding author upon reasonable request.

Conflicts of Interest

The authors declare no conflicts of interest.

References

  1. Saleh, N. Digitally Enabled Social Change: Activism in the Internet Age. Perspect. Politics 2012, 10, 514–515. [Google Scholar] [CrossRef]
  2. Adamowicz, M.; Zwolińska-Ligaj, M. The “Smart Village” as a Way to Achieve Sustainable Development in Rural Areas of Poland. Sustainability 2020, 12, 6503. [Google Scholar] [CrossRef]
  3. China Digital Village Development Report. 2022. Available online: https://www.cac.gov.cn/rootimages/uploadimg/1679309718522950/1679309718522950.pdf (accessed on 1 February 2023).
  4. Xi Jinping: Upholding the Great Banner of Socialism with Chinese Characteristics to Unite and Strive for the Comprehensive Construction of a Modern Socialist Country—Report at the 20th National Congress of the Communist Party of China. Available online: https://www.gov.cn/xinwen/2022-10/25/content_5721685.htm (accessed on 25 October 2022).
  5. Zhang, X.; Zhang, Z. How Do Smart Villages Become a Way to Achieve Sustainable Development in Rural Areas? Smart Village Planning and Practices in China. Sustainability 2020, 12, 10510. [Google Scholar] [CrossRef]
  6. Chanak, P.; Banerjee, I. Internet-of-Things-Enabled SmartVillages: An Overview. IEEE Consum. Electron. Mag. 2021, 10, 12–18. [Google Scholar] [CrossRef]
  7. Streimikis, J.; Miao, Z.; Balezentis, T. Creation of climate-smart and energy-efficient agriculture in the European Union: Pathways based on the frontier analysis. Bus. Strategy Environ. 2021, 30, 576–589. [Google Scholar] [CrossRef]
  8. Nam, Y.C. Smart Service and Progressive Strategies of a Smart Village Project in Rural Area-A Case Study of Geumsan-gun. J. Korean Inst. Rural Archit. 2022, 24, 37–44. [Google Scholar] [CrossRef]
  9. García Fernández, C.; Peek, D. Connecting the Smart Village: A Switch towards Smart and Sustainable Rural-Urban Linkages in Spain. Land 2023, 12, 822. [Google Scholar] [CrossRef]
  10. Digital Village Development Strategy Outline. Available online: https://www.gov.cn/zhengce/2019-05/16/content_5392269.htm (accessed on 16 May 2019).
  11. Digital Agriculture and Rural Development Plan (2019–2025). Available online: http://www.moa.gov.cn/gk/ghjh_1/202001/t20200120_6336316.htm (accessed on 20 January 2020).
  12. Digital Village Development Action Plan (2022–2025). Available online: https://www.cac.gov.cn/2022-01/25/c_1644713315749608.htm (accessed on 26 January 2022).
  13. Digital Village Construction Guide-Lines 1.0. Available online: https://www.cac.gov.cn/2021-09/03/c_1632256398120331.htm (accessed on 3 September 2021).
  14. Digital Village Construction Guide-Lines 2.0. Available online: https://www.cac.gov.cn/2024-05/15/c_1717449042791246.htm (accessed on 16 May 2024).
  15. Zhao, W.; Liang, Z.; Li, B. Realizing a Rural Sustainable Development through a Digital Village Construction: Experiences from China. Sustainability 2022, 14, 14199. [Google Scholar] [CrossRef]
  16. Liu, Y.; Dai, Z.; Zhao, X. Unveiling the blueprint for rural digital prosperity: A comparative examination of top 100 digital counties in China. Technol. Forecast. Soc. Change 2024, 208, 123625. [Google Scholar] [CrossRef]
  17. Li, X.; Singh Chandel, R.B.; Xia, X. Analysis on Regional Differences and Spatial Convergence of Digital Village Development Level: Theory and Evidence from China. Agriculture 2022, 12, 164. [Google Scholar] [CrossRef]
  18. Li, Y.; Wen, X. Regional unevenness in the construction of digital villages: A case study of China. PLoS ONE 2023, 18, e0287672. [Google Scholar] [CrossRef] [PubMed]
  19. Cao, X.; Yan, M.; Wen, J. Exploring the Level and Influencing Factors of Digital Village Development in China: Insights and Recommendations. Sustainability 2023, 15, 10423. [Google Scholar] [CrossRef]
  20. Liu, H.; Zhang, Y.; Wang, S.; Zhao, H. Comprehensive evaluation of digital village development in the context of rural revitalization: A case study from Jiangxi Province of China. PLoS ONE 2024, 19, e0303847. [Google Scholar] [CrossRef]
  21. Leong, C.; Pan, S.L.; Newell, S.; Cui, L.L. The Emergence of Self-Organizing E-Commerce Ecosystems in Remote Villages of China: A Tale of Digital Empowerment for Rural Development. Mis Q. 2016, 40, 475–484. [Google Scholar] [CrossRef]
  22. Bielska, A.; Stańczuk-Gałwiaczek, M.; Sobolewska-Mikulska, K.; Mroczkowski, R. Implementation of the smart village concept based on selected spatial patterns–A case study of Mazowieckie Voivodeship in Poland. Land Use Policy 2021, 104, 105366. [Google Scholar] [CrossRef]
  23. Li, W.; Zhang, P.; Zhao, K.X.; Chen, H.; Zhao, S.D. The Evolution Model of and Factors Influencing Digital Villages: Evidence from Guangxi, China. Agriculture 2023, 13, 659. [Google Scholar] [CrossRef]
  24. Liu, Q. Index system establishment and empirical study of digital rural development level: Taking panel data of 18 prefecture-level cities in Henan province from 2014 to 2021 as an example. Southwest China J. Agric. Sci. 2023, 36, 885–896. [Google Scholar]
  25. Xing, Z.; Zhao, S.; Wang, D. Performance and sustainability evaluation of rural digitalization and its driving mechanism: Evidence from Hunan province of China. Front. Environ. Sci. 2023, 11, 22. [Google Scholar] [CrossRef]
  26. Zhang, P.; Li, W.; Zhao, K.; Zhao, Y.; Chen, H.; Zhao, S. The Impact Factors and Management Policy of Digital Village Development: A Case Study of Gansu Province, China. Land 2023, 12, 616. [Google Scholar] [CrossRef]
  27. Zhao, Y.; Li, R. Coupling and Coordination Analysis of Digital Rural Construction from the Perspective of Rural Revitalization: A Case Study from Zhejiang Province of China. Sustainability 2022, 14, 3638. [Google Scholar] [CrossRef]
  28. Lin, H.; Zhao, L.; Hu, Y. Does the Construction of Digital Villages Promote Common Prosperity in Old Revolutionary Base Areas? Chin. Rural. Econ. 2023, 5, 81–102. [Google Scholar]
  29. Liu, Y.; Lai, K. Impact of digital village construction on rural revitalization and development: Based on empirical evidence from 1 804 counties in China. Acta Agric. Zhejiangensis 2024, 36, 1694–1708. [Google Scholar]
  30. Wang, P.; Li, C.; Huang, C.H. The Impact of Digital Village Construction on County-Level Economic Growth and Its Driving Mechanisms: Evidence from China. Agriculture 2023, 13, 1917. [Google Scholar] [CrossRef]
  31. Kirera, L.K. Role of Smart Villages in Preservation of Farmlands and Rural Livelihoods—A Case of Kimunyu Sub-Location, Gatundu South Sub-County, Kiambu County, Kenya. Ph.D. Thesis, University of Nairobi, Nairobi, Kenya, 2023. [Google Scholar]
  32. Atieno, L.V.; Moturi, C.A. Implementation of digital village projects in developing countries-case of kenya. Br. J. Appl. Sci. Technol. 2014, 4, 793–807. [Google Scholar] [CrossRef]
  33. Mei, Y.; Mao, D.; Lu, Y.H.; Chu, W. Effects and mechanisms of rural E-commerce clusters on households’ entrepreneurship behavior in China. Growth Change 2020, 51, 1588–1610. [Google Scholar] [CrossRef]
  34. Benin, S. Impact of Ghana’s agricultural mechanization services center program. Agric. Econ. 2025, 46, 103–117. [Google Scholar] [CrossRef]
  35. Xie, W.S.; Song, D.L.; Bi, Y.F. China’s Digital Rural Construction: Internal Mechanism, Connection Mechanism and Practice Path. J. Suzhou Univ. 2022, 43, 93–103. [Google Scholar]
  36. Deng, X.; Han, Z.; Xie, W.; Wang, G.X.; Fan, Z. Risk evaluation of the grain supply chain in China. Int. J. Logist. Res. Appl. 2024, 83, 102. [Google Scholar] [CrossRef]
  37. Zhao, J.; Ji, G.; Tian, Y.; Chen, Y.L.; Wang, Z. Environmental vulnerability assessment for mainland China based on entropy method. Ecol. Indic. 2018, 91, 410–422. [Google Scholar] [CrossRef]
  38. Guo, X.G. Application of improved entropy method in evaluation of economic result. Syst. Eng. Theory Pract. 1998, 12, 99–103. [Google Scholar]
  39. Cheng, X.; Long, R.; Chen, H.; Li, Q.W. Coupling coordination degree and spatial dynamic evolution of a regional green competitiveness system—A case study from China. Ecol. Indic. 2019, 104, 489–500. [Google Scholar] [CrossRef]
  40. Dagum, C. A New Approach to the Decomposition of the Gini Income Inequality Ratio. In Empirical Economics; Springer: Berlin, Germany, 1997; Volume 22. [Google Scholar]
  41. Wang, Q.C.; He, P.; Li, Y.; Hou, Y.; Jian, Y.I.; Liu, X. Towards a human-centric city emergency response: Modelling activity patterns of ur-ban population. Dev. Built Environ. 2025, 21, 100633. [Google Scholar] [CrossRef]
  42. Wang, Q.-C.; Yu, S.-N.; Chen, Z.-X.; Weng, Y.-W.; Xue, J.; Liu, X. Promoting additive construction in fast-developing areas: An analysis of policies and stakeholder perspectives. Dev. Built Environ. 2023, 16, 100271. [Google Scholar] [CrossRef]
  43. Zhang, H.; Du, K.W.; Jin, B.Y. Research on evaluation of digital rural development readiness under rural revitalization strategy. Xi’an Univ. Financ. Econ. 2020, 33, 51–60. [Google Scholar]
Figure 1. Data source for the four regions in China.
Sustainability 17 04250 g001
Figure 2. Trends in the overall and regional development levels of digital villages in China from 2013 to 2022.
Sustainability 17 04250 g002
Figure 3. The distribution dynamics of digital rural development levels in China and the five regions from 2013 to 2022.
Sustainability 17 04250 g003aSustainability 17 04250 g003b
Figure 4. Gini coefficient of digital rural development levels in China from 2013 to 2022.
Sustainability 17 04250 g004aSustainability 17 04250 g004b
Figure 5. Contribution rates of regional disparities in the development level of digital villages in China from 2013 to 2022.
Sustainability 17 04250 g005
Figure 6. Sources of regional disparities in the development level of digital villages in China from 2013 to 2022.
Sustainability 17 04250 g006
Figure 7. Subsystemic barriers to the development level of digital villages in China from 2013 to 2022.
Sustainability 17 04250 g007
Table 1. Evaluation index system for the development of digital villages in China.
SubsystemsPrimary IndexSecondary IndexUnitData Source or Calculation Formula
The level of digital infrastructure in rural areasThe level of Internet developmentThe number of broadband access users in rural areas
(X1)
Ten thousand peopleChina’s Macroeconomic Database
The average number of computers per 100 households among rural residents (X2)SizeChina’s Macroeconomic Database
The number of mobile Internet users in rural areas (X3)Ten thousand peopleThe number of mobile Internet users × rural population/total population
Digital communication capabilitiesThe average number of mobile phones per 100 households among rural residents (X4)SizeChina’s Macroeconomic Database
Fiber-optic cable length
(X5)
KilometerChina’s Macroeconomic Database
Level of information infrastructure developmentAgricultural meteorological observation workload
(X6)
SizeChina’s Macroeconomic Database
Volume of rural postal and telecommunications services
(X7)
Hundred million yuanTotal volume of postal and telecommunications services × rural population/total population
The level of the digital development environment in rural areasConsumption situations of rural residentsPer capita disposable income of rural residents
(X8)
YuanChina’s Macroeconomic Database
Per capita expenditure on transportation and communication among rural residents
(X9)
YuanChina’s Macroeconomic Database
Per capita healthcare expenditure among rural residents
(X10)
YuanChina’s Macroeconomic Database
Living conditions of rural residentsRural radio program coverage rate
(X11)
%China’s Macroeconomic Database
Rural TV program coverage rate
(X12)
%China’s Macroeconomic Database
Number of village health clinics
(X13)
SizeChina’s Macroeconomic Database
Local government fiscal expendituresLocal government science and technology expenditures
(X14)
Hundred million yuanNational Bureau of Statistics
Local government transportation expenditures
(X15)
Hundred million yuanNational Bureau of Statistics
Local government education expenditures (X16)Hundred million yuanNational Bureau of Statistics
Local government healthcare expenditure (X17)Hundred million yuanNational Bureau of Statistics
The level of development of the digital industry in rural areasRural digital basisNumber of Taobao villages
(X18)
SizeList of Taobao Villages
Proportion of administrative villages with postal services
(X19)
%China’s Macroeconomic Database
Level of digital transactionsE-commerce procurement amount (X20)Hundred million yuanChina’s Macroeconomic Database
E-commerce sales amount
(X21)
Hundred million yuanChina’s Macroeconomic Database
The level of digitalization in agricultural productionDegree of agricultural mechanizationTotal agricultural machinery power/crop planting area
(X22)
Kilowatt hours/hectareChina’s Macroeconomic Database
Effective irrigation rate of farmlandEffective irrigated area/crop planting area
(X23)
Thousand hectaresChina Agricultural and Forestry Database
Degree of electrification in agricultural productionTotal output value of agriculture, forestry, animal husbandry, and fishing/rural electricity consumption
(X24)
Yuan/kilowatt hoursChina Agricultural and Forestry Database
Table 2. Results of the measurement of digital rural development levels in 30 provinces of China from 2013 to 2022.
Province2013201420152016201720182019202020212022
Beijing0.0870.0950.1040.1090.1250.1340.1420.1360.1540.159
Tianjin0.0520.0580.0630.0740.0760.0770.0820.0810.0880.085
Hebei 0.1390.150.1620.1780.2050.2360.2720.2640.290.305
Shanxi0.0750.0790.0870.0920.1020.1110.1220.110.1160.119
Inner Mongolia0.0610.0680.0770.0820.0930.0980.1110.10.1070.107
Liaoning0.0770.0850.0920.1010.1080.1140.1190.1070.1140.116
Jilin0.0610.0640.0710.0750.0830.0920.0990.0880.0880.087
Heilong
jiang
0.0660.070.0780.0850.0990.1070.1170.10.1040.107
Shanghai0.0790.0790.0870.1020.1080.1140.1210.1210.1430.151
Jiangsu0.1530.1670.2050.2260.2580.2970.340.3210.350.357
Zhejiang0.1310.1460.1890.2180.2650.3330.4020.3980.4510.503
Anhui0.0730.0860.1050.1220.1390.1690.1980.1790.1950.207
Fujian0.0880.10.1140.1210.140.1610.190.1810.2010.218
Jiangxi0.0710.0810.0920.0980.1180.1390.1580.1490.1610.169
Shandong0.150.160.1840.2020.2350.2720.3070.2960.3290.34
Henan0.1350.1480.1660.1820.2030.2340.2640.2440.2640.285
Hubei0.0880.1020.1160.1260.140.1660.190.1790.1870.201
Hunan0.0980.1070.1190.130.1520.1780.2030.1840.1940.208
Guangdong0.1730.1870.2430.2640.3070.3640.4330.410.4450.469
Guangxi0.0720.0780.0890.0970.1140.1390.1630.1480.1620.169
Hainan0.0180.0210.0270.030.0380.0430.0520.0510.0580.063
Chongqing0.0480.0560.0650.0720.0810.0920.1040.0980.1090.116
Sichuan0.1350.1490.1720.1840.2060.2380.2690.2450.2620.279
Guizhou0.050.060.0710.0780.0920.110.130.1060.1170.128
Yunnan0.0630.0710.0820.0860.1010.1280.1520.1280.1380.145
Shaanxi0.0760.0830.0910.0980.1110.120.1330.1180.130.143
Gansu0.0530.0560.0650.0710.0810.0990.1090.0950.1030.106
Qinghai0.0260.0340.0390.0440.0460.0520.0580.0580.060.061
Ningxia0.0250.0290.0350.0390.0450.0520.0570.0560.0590.057
Xinjiang0.0550.060.0690.0750.0820.0930.1040.0950.1070.116
Eastern region0.1040.1130.1340.1480.170.1950.2240.2150.2390.252
Central region0.0830.0920.1040.1140.1290.1490.1690.1540.1640.173
Western region0.060.0680.0780.0840.0960.1110.1260.1130.1230.13
Northern region0.0760.0830.0920.10.1130.1260.140.130.1410.146
Southern region0.0890.0990.1180.130.1510.1780.2070.1930.2120.226
National average0.0830.0910.1050.1150.1320.1520.1730.1620.1760.186
Table 3. Key obstacle factors and their degree of impediment in the level of development of digital villages in China from 2013 to 2022.
RegionCategoryIndicator Ranking
12345
Eastern regionBarrier factorsX18X20X21X7X14
Barrier degree26.55%9.31%9.08%7.49%7.30%
Central regionBarrier factorsX18X20X21X14X7
Barrier degree27.11%10.48%9.86%7.70%6.87%
Western regionBarrier factorsX18X20X21X14X7
Barrier degree26.02%10.18%9.61%7.97%6.77%
Northern regionBarrier factorsX18X20X21X14X7
Barrier degree26.38%9.96%9.52%7.97%7.06%
Southern regionBarrier factorsX18X20X21X14X7
Barrier degree26.64%9.93%9.45%7.33%7.06%
Disclaimer/Publisher’s Note: The statements, opinions and data contained in all publications are solely those of the individual author(s) and contributor(s) and not of MDPI and/or the editor(s). MDPI and/or the editor(s) disclaim responsibility for any injury to people or property resulting from any ideas, methods, instructions or products referred to in the content.

