Article

Financial Globalization and Energy Security: Insights from 123 Countries

by
Liyun Liu
1,* and
Simei Zhou
2
1
Business School, Qingdao University of Technology, Qingdao 266520, China
2
School of Economics and Management, China University of Petroleum (East China), Qingdao 266580, China
*
Author to whom correspondence should be addressed.
Sustainability 2025, 17(9), 4248; https://doi.org/10.3390/su17094248
Submission received: 28 March 2025 / Revised: 26 April 2025 / Accepted: 5 May 2025 / Published: 7 May 2025

Abstract

:
In this paper, a panel smooth transition regression model is used to examine the nonlinear effects of financial globalization on energy security. These effects are examined in 123 countries for the period of 2000–2018. Control variables are armed forces, industrialization rate, trade value share, and urbanization rate, and the conversion variable is the financial globalization index in the following year. The results of the financial globalization effects can be obtained from both time and space. The results show that financial globalization has a positive nonlinear effect on energy security. When the logarithm of financial globalization in the previous year exceeds 0.0467, the coefficient between financial globalization and energy security will decrease from 0.0467 to 0.0209. Temporal variation analyses show that the positive effect followed a “decrease, increase, decrease” trend between 2000 and 2018. Spatial variation analyses show that the positive effect is greatest in Oceania and the Americas (with an effect coefficient of 0.0467) and smallest in Europe (with an effect coefficient of 0.0391). According to the results of the regional heterogeneity research, the Organization of the Petroleum Exporting Countries (OPEC) countries see a stronger nonlinear impact of financial globalization on energy security than non-OPEC countries.

1. Introduction

Energy services are fundamental to modern economies and lifestyles, making energy security a crucial priority for nations. The Asia Pacific Energy Research Center has defined energy security as an economy’s ability to ensure a sustainable and timely energy supply while maintaining prices at levels that do not hinder economic performance [1]. From 2000 to 2019, global energy consumption rose steadily alongside economic growth, increasing from 402.08 to 600.90 trillion Btu. However, this surge in energy demand has exacerbated air pollution and climate change [2], posing significant challenges to energy security amid the broader shift toward a low-carbon economy. Furthermore, volatility in global energy markets and prices can destabilize macroeconomic and fiscal conditions. Given these risks, it is important to scientifically evaluate the effect of external factors on energy security by developing robust methods.
Financial globalization influences multiple dimensions of energy security. Previous studies have explored its effects on key variables such as technological advancement, energy consumption, environmental quality, and economic growth [3,4,5,6,7,8,9,10,11]. As financial globalization continues to evolve, its implications for energy security remain a critical area of investigation. Empirical research indicates that financial globalization increases the consumption of both fossil fuels and renewable energy [3,4]. While many studies suggest that financial globalization may exacerbate environmental degradation [6,12,13], others highlight its potential to enhance technological efficiency and improve energy affordability for households [14,15,16].
Financial globalization affects multiple dimensions of energy security. Previous studies have explored its effects on key variables such as technical advancement, energy consumption, environmental quality, and economic growth [3,4,5,6,7,8,9,10,11]. As financial globalization continues to evolve, its implications for energy security remain a critical area of investigation. Empirical research has shown that financial globalization raises the consumption of both fossil energy and renewable energy [3,4]. Many studies suggested that financial globalization can reduce environmental quality [6,12,13], improve technological efficiency, and enhance energy affordability of residents [14,15,16]. Energy security is typically characterized by four key dimensions: availability, affordability, accessibility, and acceptability. Financial globalization exerts diverse effects on each of these dimensions. For instance, it influences affordability through investment flows and price mechanisms while shaping acceptability via the transfer of clean energy technologies. Given these multifaceted interactions, financial globalization likely has a comprehensive impact on energy security—one that warrants further in-depth investigation.
From an empirical perspective, it is necessary to consider that the effect of financial globalization on variables of energy security possibly follows a nonlinear pattern according to the changes of financial globalization itself. Most studies that examined how financial globalization affected factors related to energy security utilized traditional parametric regression models, mainly in the form of linear functions [3,7,13,17,18]. Existing research often adopts an oversimplified approach to energy security, reducing it to mere supply adequacy while neglecting its multidimensional nature. Additionally, many studies employ narrow or incomplete measures of financial globalization. Further methodological limitations include the following: (1) insufficient consideration of geographical boundaries, intermediary variables, and regulatory influences and (2) a reliance on static analytical frameworks that fail to account for potential time-varying dynamics in the relationship between financial globalization and energy security. Halkos and Polemis [19] and Ivanovski et al. [20] pointed out that traditional parametric regression models that are based on the assumption of the mean may generate inaccurate empirical results. Financial globalization may affect energy security indirectly by affecting other factors such as financial development and technological innovation [6,14,15], both of which change over time. In addition, the traditional linear regression model cannot clarify the regime-switching effect financial globalization has on energy security [21]. The panel smooth transition regression (PSTR) model is more flexible than the traditional linear model. The PSTR model cannot only examine linear and nonlinear relationships but also accurately capture the regime-switching, time trend, and regional heterogeneity of the effect.
Regarding the measurement of financial globalization, the KOF Swiss Economic Institute has defined de facto financial globalization as foreign direct investment (FDI), portfolio investment, international debt, international reserves, and international income payments. They have defined de jure financial globalization as investment restrictions, capital account openness, and international investment agreements. However, most studies used de facto and single variables such as FDI and trade openness to represent financial globalization [4,13,22]. This paper employs the financial globalization (de facto) index for enhanced cross-country comparability. Because of the distinctions in energy demand, energy supply structure, and energy dependence between different countries, financial globalization may have heterogeneous effects in energy resource-based countries and other types of countries [23]. Thus, taking on a global perspective, this paper includes 123 countries as a research sample to explore the heterogeneity of this effect.
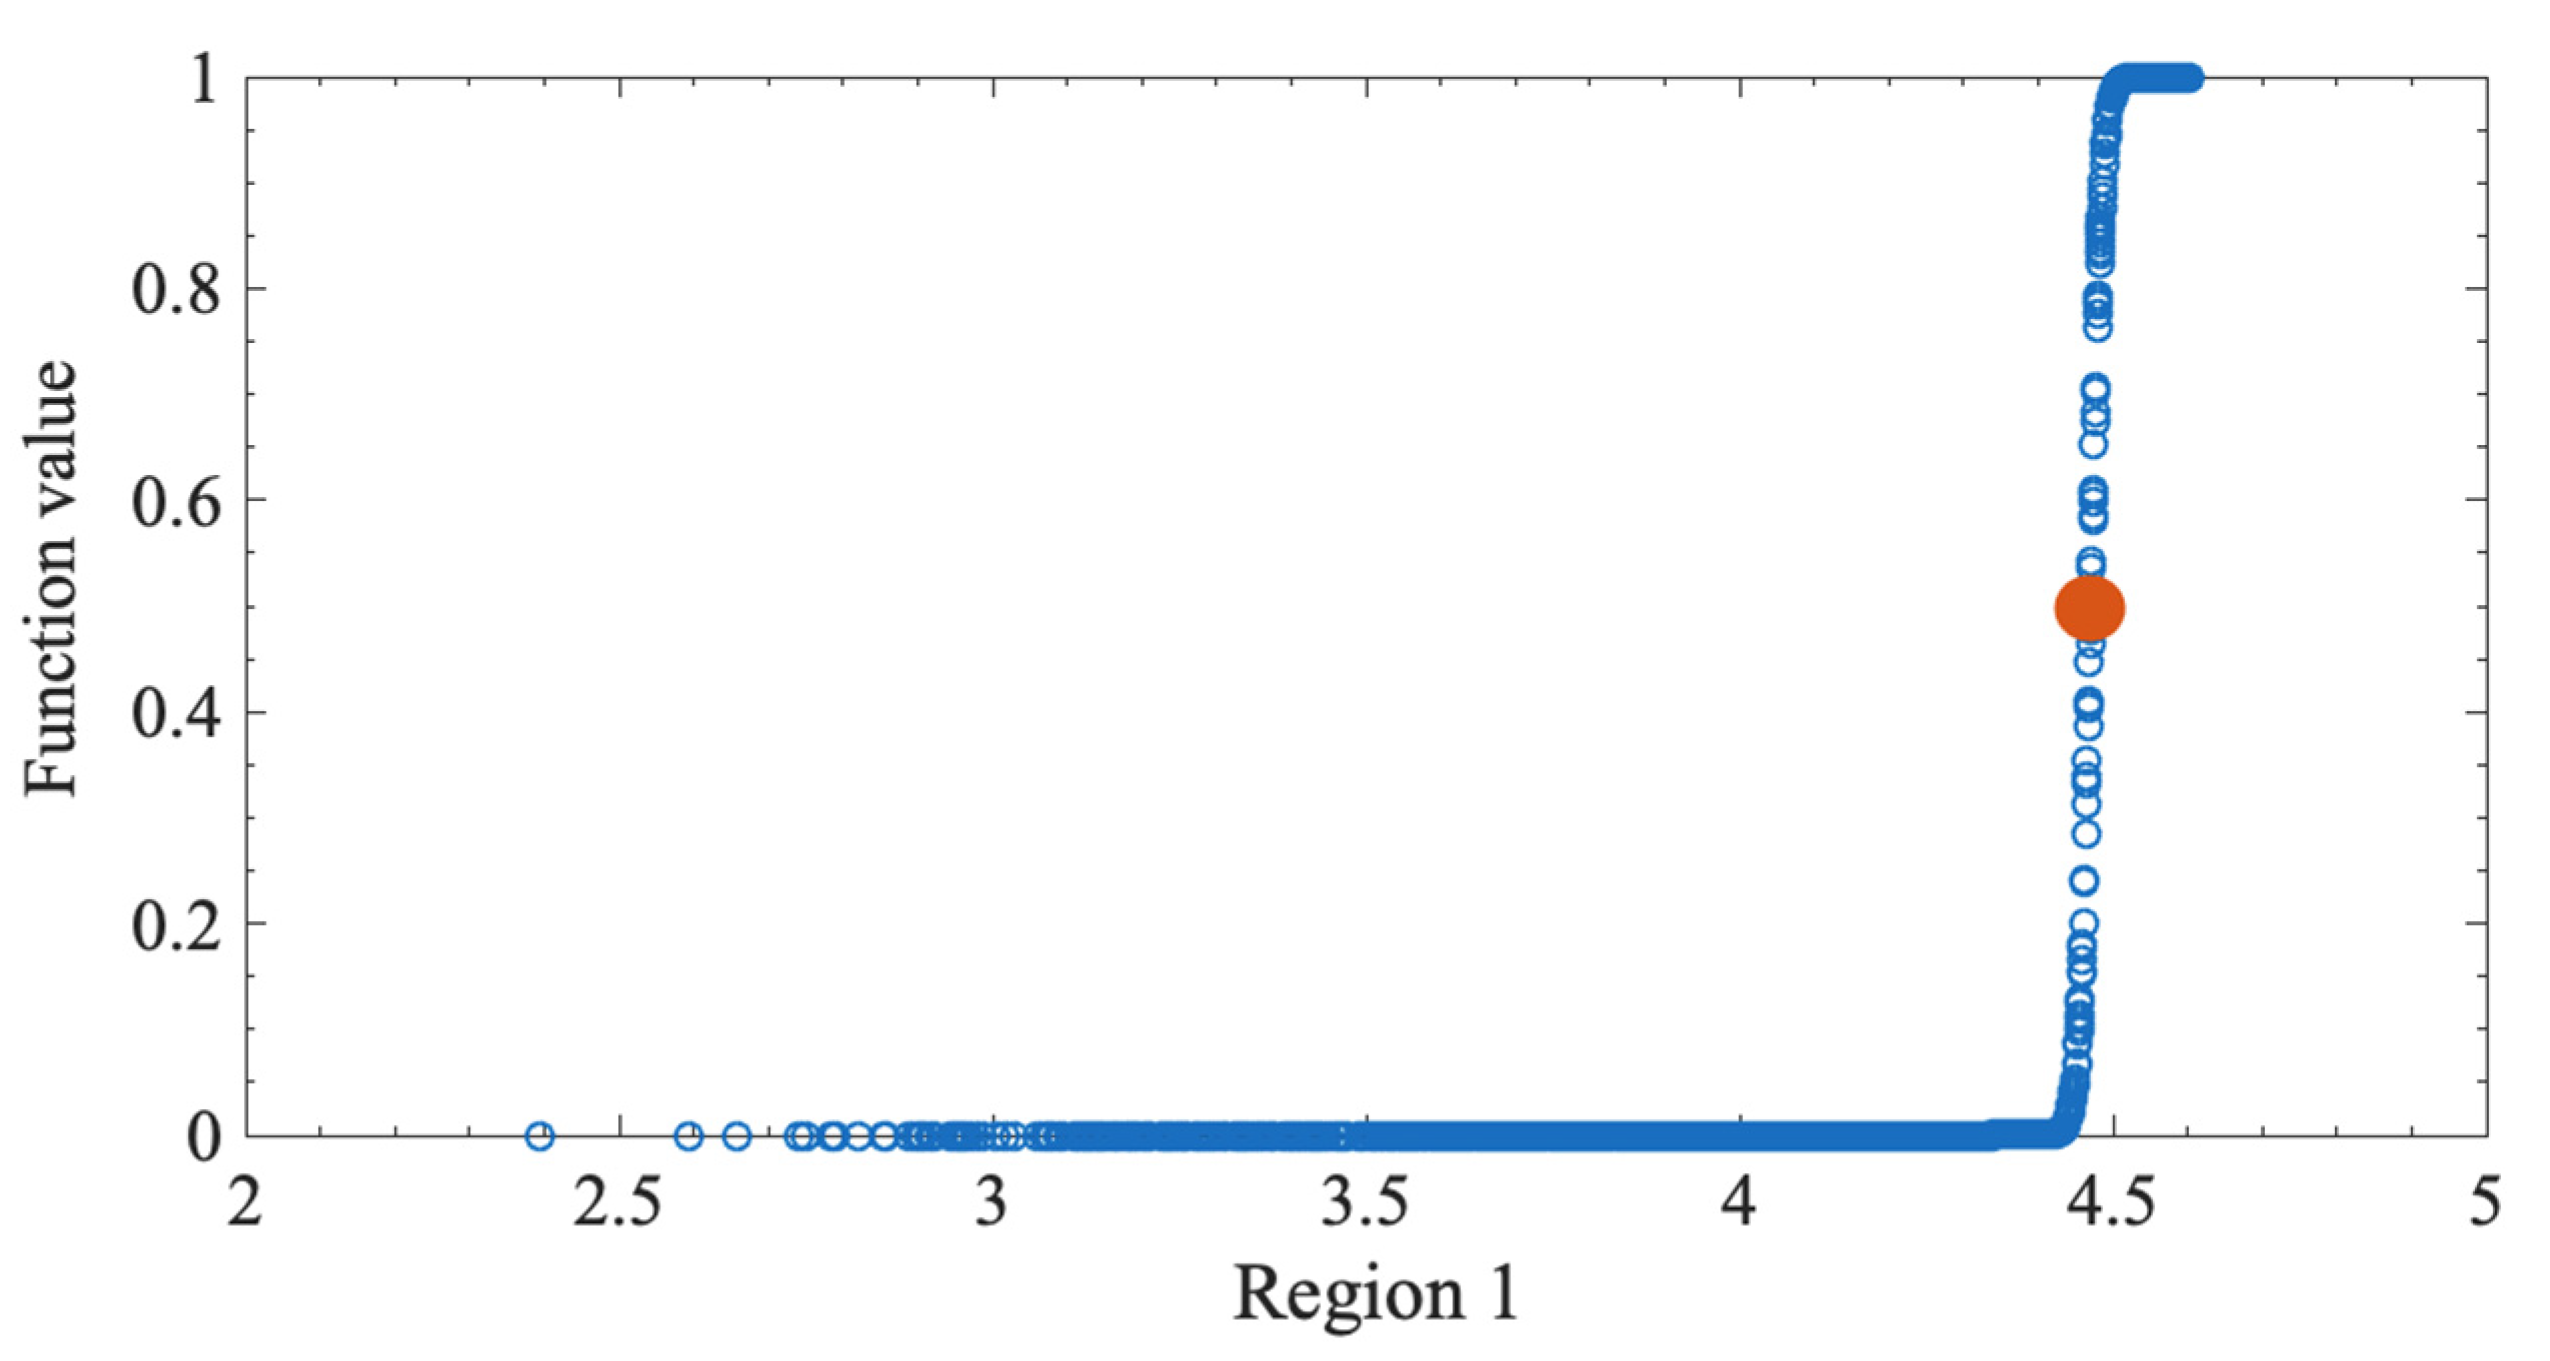
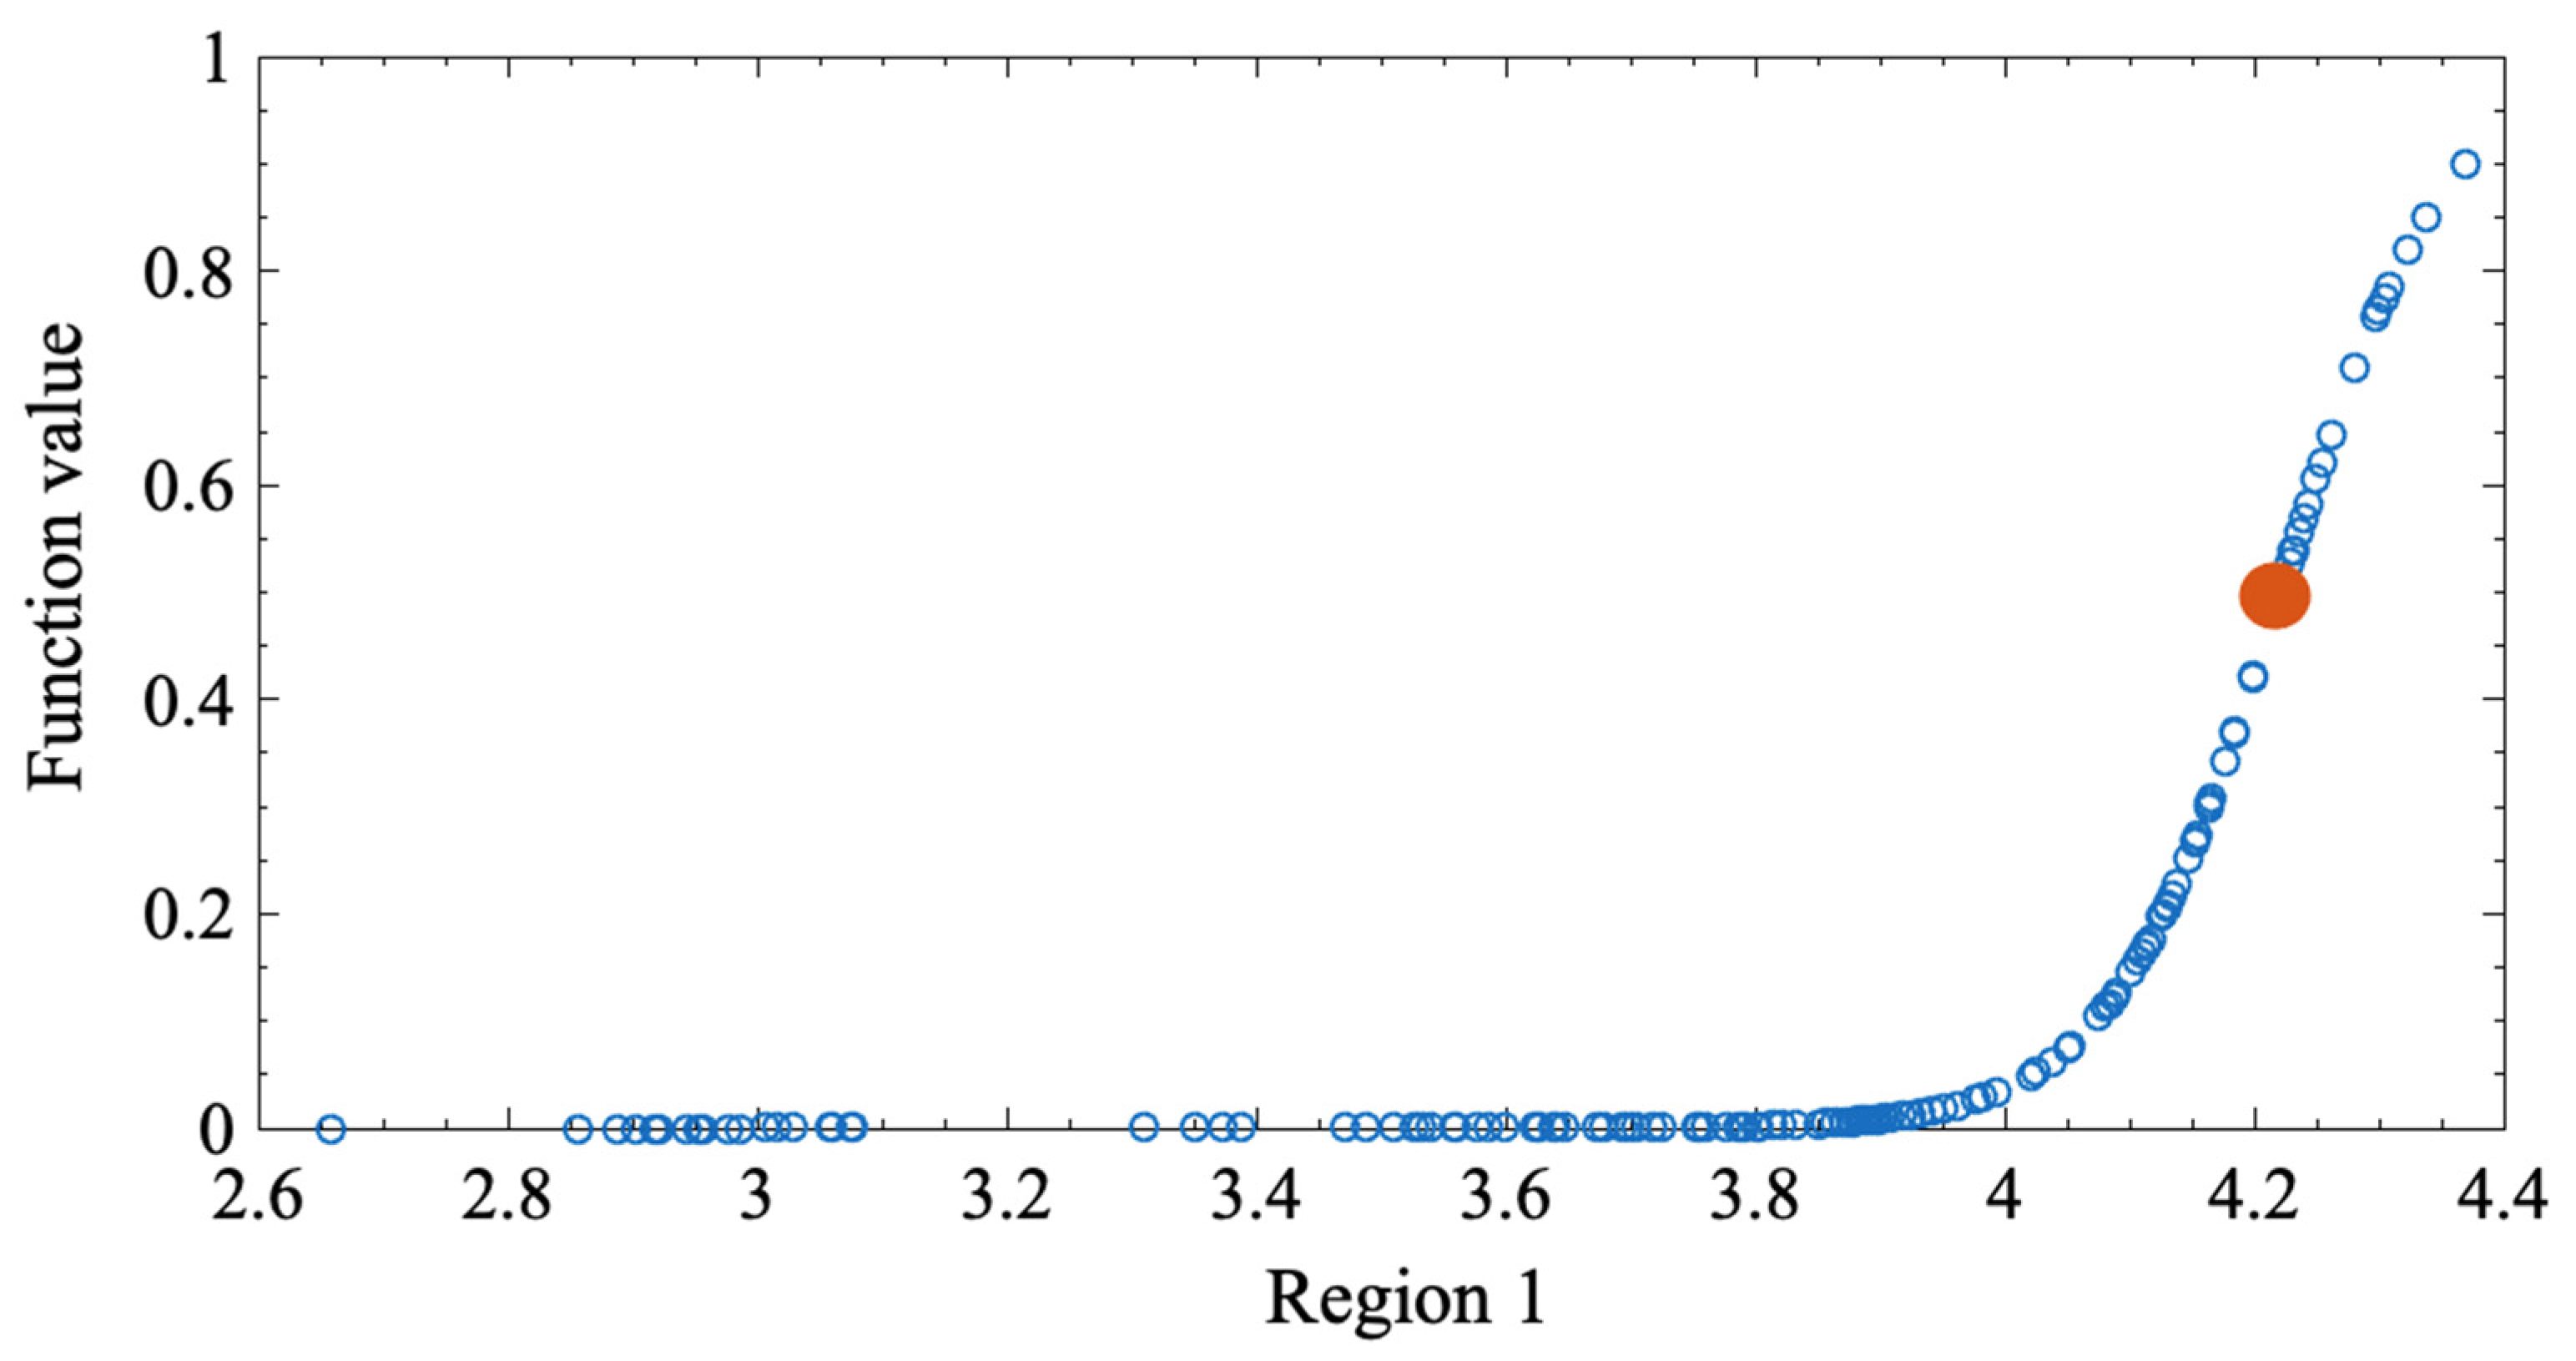
The PSTR model is applied to analyze the nonlinear effect of financial globalization on energy security in 123 countries for the period of 2000–2018. The control variables include armed forces, industrialization rate, trade value share, and urbanization rate, and as the transition variable, the next period financial globalization index is adopted. To explore the financial globalization effects in countries with different energy resource endowments, the effect is estimated for the countries of the Organization of the Petroleum Exporting Countries (OPEC) and non-OPEC countries. The results of this paper can reveal the following issues: Does financial globalization have a nonlinear effect on energy security? In this case, what are the structural features and degree of the nonlinear effect at different levels of financial globalization? What are the spatial and temporal variations of the effect? What is the difference of this effect between OPEC countries and non-OPEC countries?
This study makes two significant contributions to the existing literature. First, it pioneers the use of a comprehensive financial globalization index to examine its relationship with energy security. Unlike prior studies that rely on oversimplified unitary indicators, this approach provides a more holistic and comparable measure, thereby yielding more robust and scientifically sound empirical findings. Second, the analysis adopts a global and nonlinear perspective to assess the linkage between financial globalization and national energy security. By employing the PSTR model, the study captures the dynamic effects of financial globalization on energy security. Furthermore, a comparative regression analysis between OPEC and non-OPEC countries reveals regional heterogeneity tied to energy resource endowments. These findings offer valuable insights for policymakers in countries with similar resource profiles seeking to enhance their energy security strategies.
The rest of this paper is structured as follows: Section 2 reviews the relevant literature about financial globalization and energy security. Section 3 introduces the PSTR model, variables, and data. Section 4 shows and analyzes the empirical result of the effect of financial globalization on energy security. Section 5 summarizes the results and explains the limitations of this paper.

2. Literature Review

Many scholars studied the influencing factors of energy security when issues such as energy price fluctuations and energy supply shortages occurred. Previous studies centered on the impact of financial globalization on various dimensions of energy security, but their relationship was not examined. However, it is widely assumed that energy security can be enhanced with certain measures, such as increasing forest storage and carbon sinks, improving energy transition efficiency, optimizing industrial structure, decreasing energy consumption, enhancing energy utilization efficiency, reducing energy intensity, and improving energy service quality [24,25,26]. Financial globalization is a vital economic factor that affects energy security by impacting energy technology, energy consumption, the environment, and the energy economy. Previous studies hold different views on how financial globalization affects the above four aspects of energy security.

2.1. Financial Globalization and Energy Consumption

The development of financial globalization can promote the global consumption of fossil energy, increasing the consumption of renewable energy. Some studies suggested that there is a weak decoupling connection between financial globalization and energy consumption. Acheampong et al. [3] applied an instrumental variable generalized method based on data from 23 countries and found that economic globalization increased energy consumption under the condition of economic growth. Zhang et al. [4] took total trade, import, and export as indicators of trade openness and found that renewable energy consumption is positively impacted by trade openness in Organization for Economic Cooperation and Development countries. Ghazouani [5] found a time-varying connection between globalization and renewable energy planning in 15 countries based on the local linear dummy variable estimation method. He suggested that increasing trade and FDI can provide technology patent transfer, thus promoting the consumption of renewable energy and technology transformation. Mohammad et al. [27] analyzed the macroeconomic determinants of non-renewable and renewable energy consumption in India, including the roles of international trade, innovative technologies, financial globalization, carbon emissions, financial development, and urbanization.

2.2. Financial Globalization and the Environment

Financial globalization reduces environmental quality by promoting trade activities. However, it has been suggested that technology and management knowledge introduced by financial globalization can improve environmental quality. Meng et al. [12] suggested that the globalization trend increases trade among developing countries, which seriously undermines international efforts to reduce global emissions. Sadip et al. [8] used two multivariate log-transform models and found that while financial globalization contributed to the development of BRICS countries, it reduced their atmospheric quality. Baek [9], Mahalik et al. [13], and Kivyiro and Arminen [17] used linear models and found that carbon dioxide emissions are increased by FDI, which supports the “pollution haven hypothesis”. However, Samuel and Vladimir [28] used a panel regression method and found that greenhouse gas emissions could be improved by FDI in developing countries. Teng et al. [29] examined potential intersections between economic growth and financial globalization on the marine ecosystem of the G-20 countries from 2000. Ozkan et al. [30] analyzed the time-quantile impact of foreign direct investment, financial development, and financial globalization on green growth in BRICS economies.

2.3. Financial Globalization and Energy Technology

It has been suggested that financial globalization promotes technological innovation and improves the innovation and management abilities of enterprises. Bekaert et al. [6] used ordinary least squares and the system generalized method of moment (Syst-GMM) based on data from 95 countries. They found that financial globalization was able to connect local financial markets with the global financial market, providing advanced technology and management experience for local markets. Zheng et al. [14] found that financial globalization improves national technological innovation based on data from 110 countries, using a two-step Syst-GMM. Other studies suggested that the positive effect of financial globalization on technology development is heterogeneous. Through heterogeneity analysis, even if financial resources are significant to innovation, by analyzing industry-level data of 55 countries, Friedrich et al. [7] found that the allocation of limited funds to innovative enterprises in real financial markets may not be effective, especially in emerging economies.

2.4. Financial Globalization and Energy Economy

Financial globalization not only promotes economic development by promoting financial development [15] but also decreases the cost of obtaining energy to improve the affordability of energy for residents. Usman et al. [18] found that financial development and globalization promoted the economic growth of Arctic countries. Shahbaz et al. [10] included financial development, capital, and international trade as key factors of China’s production function; by using an autoregressive distributed lag model bounds testing approach, they explored the connection between energy consumption and economic growth. The results showed that economic growth was positively affected by the above key factors. The growth effects of openness are likely to be significantly improved. Koyama and Krane [16] identified Japan’s FDI for the energy sector in the Middle East as an important way to establish strategic economic relations between Japan and resource-rich countries. In this way, the cost of energy materials in Japan could be reduced. However, it was also found that the positive impact of trade openness on economic development was decided by whether complementary reforms (those that are based on international competitive advantages) were utilized to supplement policies [22].
In summary, there are still several aspects that need to be addressed in the research. First, while many research results on how financial globalization affects energy security have been reported, most studies used a single indicator, such as FDI or trade openness, to explore specific dimensions of energy security, such as energy consumption, the environment, energy economy, and energy technology. The connection between the financial globalization index and the energy security index has not been examined to date. Second, existing research on financial globalization’s influence on energy security sub-dimensions has been geographically limited, typically focusing on individual countries or small samples. This approach overlooks potential heterogeneity—particularly in how financial globalization differentially affects technology adoption and environmental outcomes across nations. A global perspective is urgently needed to address this oversight. Third, the multifaceted and dynamic nature of financial globalization’s impact on energy security dimensions cannot be adequately captured by traditional linear regression models. The direction and magnitude of these effects may evolve alongside financial globalization itself, necessitating nonlinear or threshold-based analytical frameworks.

3. Methodology

3.1. PSTR Model

3.1.1. Model Construction

The PSTR model is a useful method to analyze the nonlinearity issue. It can handle different types of nonlinearities (i.e., sharp or smooth switches between regimes) without requiring any extant information about the structural change of the transition variable. The PSTR model has two advantages: First, the PSTR model permits the variation of parameters across individuals and over time. Second, the PSTR model is highly applicable in cases where endogeneity and nonlinearity affected the data-generating process. The panel transition regression model, which has been constructed by Hansen [31], is the first method that enabled the analysis of the nonlinear relationship between variables in panel data. The panel transition regression model emphasizes that time variation is the regression coefficient of threshold variables on explained variables [31]. The PSTR model can make the regression coefficient change smoothly and set a transition function, which was first proposed by Gonzalez et al. [32].
The PSTR model contains a conversion function and two regimes, as follows:
y i t = u i + β 0 x i t + β 1 x i t g q i t ; γ , c + u i t
where y i t is the dependent variable and u i represents the unit-specific fixed effects; x i t is the independent variable, the value cloud of which changes with both cross section and time; q i t is the threshold variable, and g q i t ; γ , c is a transition function with q i t as the threshold variable, which takes a value of 0 or 1; β 0 and β 1 are regression coefficients that vary with the transition function; and u i t is the error term.
The transition function g q i t ; γ , c uses a logical transition function, as follows:
g q m : γ , c = 1 + exp γ j = 1 m q i t c j 1
where c j = c c 1 , , c m represents the location parameters, and γ is the slope parameter that determines the transition speed of the function.
Gonzalez et al. [32] suggested that by only considering m = 1 and m = 2 , the transition situation of regimes can be accurately reflected. m = 1 indicates that there is only one location parameter and two regimes in the model, including the high regime and the low regime. In the high regime, the transition function is g q i t ; γ , c = 1 and the regression coefficient is β 0 + β 1 . The transition function is g q i t ; γ , c = 0 and the regression coefficient is β 0 . g q i t ; γ , c smoothly transfers q i t between 0 and 1, as well as the regression coefficient approach to c , transferring between β 0 and β 0 + j = 1 r β j . g q i t ; γ , c can be understood as a characteristic function with γ , as follows:
g q i t : γ , c = 1 , q i t > c 1 0 , q i t c 1
where m = 2 indicates that there are two location parameters and three regimes in the model, including high, middle, and low regimes. The value of the transition function ranges between 0 and 1, which is symmetric about c 1 + c 2 2 . The point is located in the middle regime, and its transition function value is minimal. The maximum transition function value is 1 in both the high and low regimes. The model changes to three-regime when γ and m = 2 .
The expression form of the multi-regime model can be obtained as follows:
y i t = u i + β 0 x i t + j = 1 r β j x i t g j q i t j ; γ , c + u i t
where g j q i t j ; γ , c is the transition function, and j is the number of transition functions.

3.1.2. Parameter Estimation Method of the PSTR Model

Step 1: Linearity test
The linear relationship between dependent variables, independent variables, and control variables must be confirmed before the PSTR model is used.
Step 2: Remaining nonlinearity test
The nonlinear test results of model variables indicate that heterogeneity exists in the panel data. To confirm the number of transition functions and carry out error testing, the remaining nonlinearity test must be used.
Step 3: Determining the number of location parameters
The number of nonlinear parts of the model is determined after the above two tests. The number of regimes in the model needs to be further determined.
Step 4: Parameter estimation
For the PSTR model, γ and c in formula (4) should be defined first before using the nonlinear least squares estimation method. The network search method is used for this parameter estimation [31,32].
In this paper, a PSTR model is constructed to study the relationship between financial globalization and energy security, as follows:
L E S I i t = β 1 L F G I i t + β 2 L F G I i t · g q i t 1 ; γ , θ + θ j X j , i t + θ j X j , i t · g q i t 1 ; γ , θ + α i + ε i t
where β 1 and β 2 are the coefficient matrix, X j , i t = A F j , i t , I R j , i t , T V j , i t , U R j , i t are control variables, g q i t 1 ; γ , θ is the transition function, α i is the fixed individual effect, and ε i t is the random error term.

3.2. Variables

3.2.1. Dependent Variable

The dependent variable is energy security indicators (ESI), calculated by combining the methods of global principal component analysis (GPCA) and entropy weight technique for order preference by similarity to an ideal solution (TOPSIS). ESI is composed of the four dimensions of availability, affordability, accessibility, and acceptability. Fifteen indicators are included, which are per capita energy production, net electricity import, self-sufficiency rate, coal import dependence, natural gas import dependence, per capita gross domestic product (GDP), electricity harvesting capacity, proportion of population with access to clean fuels and cooking technology, time required for power, per capita carbon dioxide emissions, proportion of renewable energy generation, forest coverage rate, energy intensity, distribution efficiency, and per capita energy consumption.

3.2.2. Independent Variable and Transition Variable

Financial globalization (FGI) is an independent variable, and the FGI of the following year is a transition variable, in reference to the globalization index of the KOF Swiss Economic Institute. The lagged financial globalization index is employed as the threshold variable for three reasons: First, the time-lagged specification mitigates reverse causality concerns, as current growth dynamics are unlikely to affect past financial integration levels. Second, the gradual diffusion of financial globalization effects aligns with the institutional friction hypothesis documented. Third, this approach captures the hysteresis effect, where threshold behaviors depend on accumulated integration levels rather than contemporaneous shocks. FGI includes FGI (de facto) and FGI (de jure). FGI (de facto) includes foreign direct investment, portfolio investment, international debt, international reserves, and international income allocation, accounting for 26.4%, 16.8%, 28.1%, 1.3%, and 27.3%, respectively. FGI (de jure) includes investment restrictions, capital account openness, and international investment agreements, accounting for 30.6%, 39%, and 30.4%, respectively.
In this paper, FGI (de facto) is used to measure the magnitude of financial globalization, and the reasons are explained as follows. First, FGI (de jure) has been adopted for the empirical analysis, but the empirical results are not significant. Other control variables or transition variables need to be considered for further research on the legal impacts of financial globalization. Second, most studies used de facto indicators to clear the effect of financial globalization on ESI, such as trade openness and FDI [4,9,16,33,34].

3.2.3. Control Variables

In reference to [35,36,37,38], armed forces (AF), industrialization rate (IR), trade value share (TS), and urbanization rate (UR) are selected as control variables.
Armed forces: The number of armed forces as a percentage of the total workforce is used to approximate the military strength of a country. Military strength is the embodiment of overall strength and the fundamental guarantee of a country’s energy security. The armed forces is included as a control variable because military capacity may simultaneously influence both a country’s economic and its political institutions, which can then affect energy security. Jakstas et al. [39] also suggested that military force is a key indicator that affects energy security and gives effective support for counter-risk tasks.
Industrialization rate: The added value of industry as a percentage of GDP is used to reflect the industrialization rate of a country. With the enhancement of the industrialization rate, the ratio of tertiary industry (such as the service industry) increases among all industries, and the industrial structure can be progressively upgraded. Both emissions and energy consumption decrease. As energy-intensive industries convert to knowledge-intensive industries, the economy enters a post-industrial stage and pollution levels fall [40]. But another view is that industrialization processes can increase environmental pollution. The impact of industrialization rate on energy security is multidimensional, which may not only enhance the stability of energy supply but also aggravate the fragility of the energy system. Therefore, the industrialization rate is used as a control variable.
Trade value share: Trade value is the total trade amount of goods and services. The ratio of trade value within GDP is used to represent the share of the trade value. The increase in the share of the trade value is mainly caused by the increasing amount of imports and indicates that the degree of external dependence is enhanced. Energy supply depends on energy imports. The increase in the share of trade value is caused by the rising export value, indicating that the production of commodities and other industrial processes increase environmental pollution in a country. These actions may also increase energy exports and make other countries more dependent on their own energy. The influence of trade structure on energy security is multidimensional, involving the stability of energy supply, price fluctuation, geopolitical risks, and economic resilience.
Urbanization rate: Urbanization rate is the ratio of urban population within the total population. Population density may be increased by the rise of the urbanization rate. This leads to a transfer of economic activities and lifestyle and changes the energy security dimension. Many studies have examined urbanization rates and energy consumption, most of which suggested that increasing urbanization rates raise energy use [41,42].

3.3. Data

3.3.1. Data Sources

The indicators of ESI are obtained from the US Energy Information Administration and the World Bank. The FGI data are obtained from the KOF Swiss Economic Institute. Data on armed forces, industrialization rate, trade value share, and urbanization rates are obtained from the World Development Indicators. Because of the limited availability of data, panel data from 123 countries from 2000 to 2018 are chosen as samples. Table 1 shows the variable types, names, symbols, and utilized calculation methods.

3.3.2. Descriptive Statistics and Correlation Matrix

Table 2 shows the results of descriptive statistics. ESI is relatively balanced between regions, with a standard deviation of 0.1001. However, the standard deviation of FGI is 19.0752, indicating high volatility and implying large differences in FGI levels between countries. The mean value of FGI is 61.1410, indicating a high level of FGI across the world. The standard deviation of the trade value share is 48.2215, indicating that the trade value share varies greatly among countries. The maximum value is 437.3267, which implies that the ratio of trade value to GDP can reach 4.3733 in a single country, indicating that global trade develops rapidly.
Pearson correlation analysis is used to test whether multicollinearity exists among variables. Table 3 shows the results of correlation analysis. The correlation coefficient between each variable is smaller than 0.8. Specifically, UR and ESI are strongly correlated, indicating that ESI can be more guaranteed and energy use is cleaner with the advancement of urbanization. The strong correlation between FGI and ESI indicates that countries with high FGI have more capital to ensure energy use, thus increasing energy reserves.

3.3.3. Unit Root Test

The Levin–Lin–Chu unit root test [43] and the Fisher unit root test are used. Table 4 shows the unit root test results, indicating all variables are stationary variables.

4. Results

4.1. PSTR Model Test

4.1.1. Linearity Tests

Before the PSTR model can be used, it is necessary to conduct a heterogeneity test to determine whether there is a nonlinear relationship between FGI and ESI. Table 5 shows the results of the linearity test of the PSTR model. For FGI, LM, LMF, and LRT, the test results reject the null hypothesis at a 1% significance level, indicating that the panel data are heterogenic. There is a nonlinear relationship between FGI and ESI. Therefore, the PSTR model is reasonably applied to explore the relationship between FGI and ESI.

4.1.2. Remaining Nonlinearity Tests

As Table 6 shows, when the LM, LMF, and LRT tests are at m = 1 , FGI cannot reject the null hypothesis H 0 : r = 1 , which indicates only one transition function exists in the PSTR model. This means that the influence of FGI on ESI has a nonlinear part with the change of FGI in the following year.

4.1.3. Slope and Location Parameters

As Table 7 shows, there is a structural breakpoint between FGI and ESI. The location parameter is 4.4706 and the slope parameter is 136.4752, indicating that there is a high transition rate between different regimes. Figure 1 shows the transition function of the transition variable FGIt−1, which presents an “S” trend. The transition function value approaches 0 when FGIt−1 is lower than 4.4, and its impact on ESI is linear.

4.2. Impacts of Financial Globalization on Energy Security

4.2.1. Basic Results of the Financial Globalization Impact

As Figure 2 shows, both the linear and nonlinear impacts of FGI on ESI are significant at a 1% significance level. The conversion function value approaches 0, and the PSTR model is in a low regime when the FGI is below 4.4706. The elasticity coefficient of FGI to ESI is 0.0467, indicating that FGI has a significant positive impact on ESI. Moreover, an increase of FGI by one unit increases ESI by 0.0467%. When FGI exceeds 4.4706, the PSTR model changes to a high regime. The elasticity coefficient of FGI to ESI is 0.0209, and the addition of one unit of FGI can increase ESI by 0.0209%. In conclusion, FGI can promote ESI for any FGI level, and the positive impact decreases with increasing FGI level.
The main reasons that FGI promotes ESI are as follows: First, the development of FGI is promoted by FDI, international debt, and international income payments. FGI contributes to a country’s economic growth, thereby enhancing the affordability, accessibility, acceptability, and efficiency dimensions of ESI. Countries with higher economic growth have a higher capacity to pay for energy. Amri [44] found that FDI can effectively improve non-renewable energy consumption, thus enhancing acceptability. Zhao et al. [45] found that China’s FDI in energy could enhance national energy security. According to the international debt and income payments, the government has more funds to maintain energy security accessibility. The funds can be invested in renewable energy to facilitate the transition from fossil to renewable energy sources to ensure energy security [11,46]. When the investment and finance market situation improves, domestic enterprises have more funds to invest in technological innovation in pollution control, green technology, and high energy-efficiency technology, which is beneficial for reducing carbon emissions and increasing the acceptability of energy security.
Second, with the further development of FGI, the incentive of both the government and enterprises to invest abroad is higher, which threatens the energy security of the invested country. This restricts the promoting impact of FGI to ESI. However, FGI can give full play to its technology spillover to enhance the capability of energy-related technology research and development in the recipient country when FGI is at a lower level. Meanwhile, to improve both the energy structure and energy efficiency of recipient countries, energy intensity should be reduced [47,48]. Third, facing climate issues such as global warming, governments around the world urgently need to identify pollution and energy poverty problems caused by financial globalization. Reasonable investment policies must be formulated to increase the proportion of green and clean energy and enhance national energy security.

4.2.2. Temporal Variations of the Impact of Financial Globalization

Figure 3 shows the impact of FGI on ESI from 2000 to 2018. FGI has a positive impact on ESI, and this impact follows an increasing, decreasing, and increasing tendency. From 2000 to 2006, the elasticity coefficient decreased from 0.0453 to 0.0432, with a volatility of −0.034%. The reason for this change is that both the proportion of global fossil energy and the growth rate of total energy consumption increased from 2000 to 2004, thus reducing the availability of ESI. From 2006 to 2014, the elasticity coefficient increased from 0.0432 to 0.0441, with a volatility of 0.011%. This was caused by the faster growth rate of renewable energy. Specifically, the elasticity coefficient increased in 2007 because of a surge in the share of renewable energy, and it fluctuated from 2008 to 2010 because of the global economic crisis.
From 2014 to 2018, the elasticity coefficient decreased from 0.0441 to 0.0436, with a volatility of −0.012%. The reason is that the share of electricity generated from coal was almost lower in 2017 than in 1988. The share of electricity generated from non-fossil sources was also low, and the increase in the share of renewables could not offset the decrease in the share of nuclear energy. A further reason is that global energy demand grew by 2.2% in 2017, exceeding the 10-year average level. However, in 2018, the elasticity coefficient decreased further. The first reason is that the USA announced the withdrawal from the Trans-Pacific Partnership Agreement. This withdrawal reduced international trade activity, leading to a decrease in FGI compared with the 2017 level. Second, in 2018, global carbon emissions grew by 2%, which is the highest growth rate in nearly seven years. These developments resulted in the poor performance of the environmental dimension of energy security in 2018.

4.2.3. Spatial Variations of the Impact of Financial Globalization

Figure 4 shows the impact of FGI on ESI for different regions, including Oceania, the Americas, Africa, Asia, and Europe. Oceania and the Americas have the greatest average elasticity coefficients, at 0.0467. The coefficients of Africa and Asia are 0.0463 and 0.0458, respectively. The impact of financial globalization on ESI is relatively small, suggesting that the connection between finance and energy security is not particularly strong. This weaker relationship is especially noticeable in regions like East Asia and South Asia. The impact of FGI is small in European countries, such as Sweden, Norway, and Finland. The average elasticity coefficient in Europe is the lowest, with a value of 0.0391. In certain European countries, ESI is high, but it is coupled with high energy dependence on foreign countries. Europe’s energy supply depends on diversified channels, which reduces the direct impact of fluctuations in a single financial market on energy security. At the same time, European governments directly control energy security through strategic reserves, long-term energy contracts, and regulations, which weakens the short-term impact of financial markets on energy supply. The increase in FGI may further increase the fossil energy imports of these European countries, which affects the improvement of their ESI. At present, energy security issues in Europe mainly focus on the integration of the European internal energy market, the supply security of oil and gas, and the intermittency of renewable energy supply [49,50]. Therefore, FGI has a limited positive impact on ESI in Europe.

4.3. Impacts of the Control Variables on Energy Security

Table 8 shows the parameters of all variables in the PSTR model. First, both linear and nonlinear impacts of AF on ESI are significant at a 1% significance level. The elasticity coefficient of AF to ESI is 0.0067 when the FGI is below 4.4706. The results show that AF has a significant positive impact on ESI, and a one unit increase in AF can increase ESI by 0.0067%. When the FGI exceeds 4.4706, the elasticity coefficient of AF to ESI is −0.0267, and adding one unit of AF can decrease ESI by 0.0267%. When FGI is low, countries invest less in foreign regimes. AF can effectively protect a country’s energy resources from occupation by foreign countries, thus playing a positive role in energy supply. When FGI is high, the defense budget increases, diverting and destroying resources [51]. Furthermore, the military exercises, training, and experiments can increase energy consumption, thus also increasing greenhouse gas emissions [52,53].
Second, both linear and nonlinear impacts of IR on ESI are significant, at significance levels of 10% and 5%, respectively. The elasticity coefficient of IR to ESI is 0.0005 when the FGI remains below 4.4706. The results show that IR has a significant positive impact on ESI, and a one unit increase in IR can increase ESI by 0.0005%. When the FGI exceeds 4.4706, the elasticity coefficient of IR to ESI is 0.0018, and the addition of one unit of IR can increase ESI by 0.0018%. Higher levels of industrialization increase the energy substitution rate [54], thus accelerating the transition from fossil to renewable energy sources. Because of the high dependence of the industrial sector on fossil fuels, which accounts for a high proportion of the global energy consumption, less industrialized economies are slow to replace fossil fuels in their energy transition. In emerging economies, industrialization increases both energy intensity and energy consumption [55,56]. However, higher levels of industrialization can not only reduce energy consumption with advanced technologies but also achieve energy transition at a lower cost and enhance national energy security.
Third, while the linear impact of TS on ESI is not significant, the nonlinear impacts of TS on ESI are significant at 1% significance levels. This result indicates that TS has a significant positive impact on ESI, and a one unit increase in UR can increase ESI by 0.0006%. The increase in TS represents an increase in international trade flows, which enables developing countries to expand rapidly and upgrade their economic development and technology [57]. Moreover, the increase in TS can increase both the affordability of energy for residents and energy efficiency in developing countries. As international trade increases carbon dioxide emissions and reduces the consumption of non-fossil fuels, its positive impact on ESI is small [36].
Fourth, both linear and nonlinear impacts of UR on ESI are significant, with significance levels of 1% and 5%, respectively. The elasticity coefficient of UR to ESI is 0.0039 when the FGI remains below 4.4706. This result shows that UR has a significant positive impact on ESI, and a one unit increase in UR can increase ESI by 0.0039%. When the FGI exceeds 4.4706, the elasticity coefficient of UR to ESI is 0.0048, and a one unit increase in UR can increase ESI by 0.0048%. With improving UR, the rural population is continuously migrating to cities, thus reducing the use of traditional energy sources. This also promotes low-carbon development and a country’s energy security. The urbanization is accompanied by energy consumption and population growth, both of which increase energy intensity [55,58]. However, Su et al. [34] found that urbanization has a positive impact on renewable energy consumption, which can also promote energy security. Financial globalization increases funds available for technological innovation. Technological innovation in urban areas positively impacts the environment and energy efficiency, thus improving energy security [47].

4.4. Results of the Robustness Analysis

In reference to Lahouel et al. [21] as well as Bechir et al. [21], this paper uses Syst-GMM to test the result of the PSTR model. FGIt−1 is a transformation variable in the PSTR model, which is why it is added to the regression model.
ln E S I i t = β 0 + β 1 ln E S I i t 1 + β 2 ln F G I i t + β 3 ln 2 F G I i t + β 4 ln F G I i t 1 + k β k X i t + μ i + ε i t
Two conditions must be satisfied when the Syst-GMM method is used. First, the random error term ε i t has no autocorrelation. Second, there is no correlation between ln E S I i t 1 , ln E S I i t 2 , and u i . The Arellano–Bond test is used to statistically test the first condition, and the 3–5 lag terms of the explained variable ESI and the 3–4 lag terms of IR are selected as instrumental variables. The Hansen test is used to assess the over-recognition of the model and identify the validity of instrumental variables.
Table 9 shows the Syst-GMM model results. First, the results of the AR(1) and AR(2) tests indicate that autocorrelation does not exist in the random error term, satisfying the first condition of the Syst-GMM method. Thus, the Syst-GMM model can be used for parameter estimation. Second, the Hansen test results show that the null hypothesis (i.e., “all instrumental variables are valid”) cannot be rejected at the 10% significance level, indicating that the selected instrumental variables are reasonable and effective. The coefficient of lnFGI is significantly positive at a 5% significance level, indicating that FGI had a positive impact on ESI, which is consistent with the linear impact of the PSTR model. The coefficient of ln2FGI is significantly negative at a 5% significance level, indicating that FGI has a negative effect on ESI, which is consistent with the results of the nonlinear impact of the PSTR model.

4.5. Results of the Heterogeneity Analysis

The economic developments of OPEC countries depend on oil exports. Oil price fluctuations caused by financial globalization impact the domestic financial market and affect the oil export or economic growth in these countries. However, financial globalization also provides more capital for OPEC countries, thus boosting domestic investment and technological growth. The economic developments of non-OPEC countries rely heavily on exports of other goods and services. The economies of these countries are therefore more diversified and have easier access to foreign direct investment, technology transfer, and more competitive product prices. However, financial globalization may increase the oil dependence of non-OPEC countries in a time when oil is in short supply. The financial crisis and currency volatility may be more likely to affect non-OPEC countries. Based on the above analysis, both OPEC and non-OPEC countries are selected as sub-samples for heterogeneity analysis.
Table 10 shows the estimated results for both OPEC and non-OPEC countries. For OPEC countries, the linear and nonlinear impacts of FGI on ESI are significant at a 5% significance level. Figure 5 shows the transition function of the transition variable FGIt−1 in OPEC countries. The value of the conversion function approaches 0, and the PSTR model is in a low regime when the FGI is below 4.2. As shown in Figure 6, the elasticity coefficient of FGI to ESI in a low regime is 0.0435, indicating that FGI exerts a significant positive impact on ESI. This result is similar to the results estimated for the whole sample. When the FGI exceeds 4.2, the elasticity coefficient of FGI to ESI is 0.1379, and a one unit addition of FGI can increase ESI by 0.1379%. With increasing FGI, its positive impact on ESI increases, which differs from the results of the whole sample. This is because the further development of FGI enhances the international competitiveness of OPEC countries, thus reducing the energy intensity to enhance the energy efficiency of OPEC countries [28,59]. The above analyses show that the impact of FCI on ESI is obvious in OPEC countries because of their dependence on oil exports. At the same time, the empirical results also show the impact of FCI on ESI is not obvious in non-OPEC because the economic developments of non-OPEC countries are more diversified and depend on the trade of other goods and services, such as foreign direct investment, technology transfer, and more competitive product prices.
As Figure 7 shows, when the FGI is below 3.2493, the conversion function value approaches 0 and the PSTR model is in a low regime. In the low regime, the impact of financial globalization on energy security is linear, while in other regimes, the impact is nonlinear. As shown in Figure 8, the elasticity coefficients of FGI to ESI in the lower regime are 0.0065 and 0.0105, indicating that FGI has a positive impact on ESI, but this impact is not statistically significant. When the FGI exceeds 3.7754, the PSTR model changes from the lower regime to the highest regime. The elasticity coefficient of FGI to ESI is 0.0453, and the addition of one unit of FGI can increase ESI by 0.0453%. In conclusion, FGI exerts a prominent nonlinear impact on the energy security of non-OPEC countries.
The positive impacts of FGI on ESI in OPEC countries are 0.0435% and 0.1379%, while it is 0.0453% for non-OPEC countries. The positive impact of FGI on ESI in OPEC countries is more significant. The main reason is as follows: Non-OPEC countries face high costs and a low oil production-to-savings ratio as many wells are depleted; these countries produce oil uneconomically [60]. Some of these non-OPEC countries are developing countries whose crude oil production mainly ensures their own oil supply security. Under high financial globalization, non-OPEC countries will face a balance of payments surplus and strong exploitation of oil resources, which can reduce oil exports. According to the BP Statistical Yearbook of World Energy 2021, in 2020, OPEC countries reserved 171.8 billion tons of oil, while non-OPEC countries reserved 72.6 billion tons. OPEC countries outnumber non-OPEC countries more than twofold, which is why OPEC countries can increase oil exports even under high levels of financial globalization. This increases domestic revenue and the affordability of other energy sources, thus reducing their energy intensity.

5. Conclusions

In this paper, the PSTR model is employed to explore the impacts of financial globalization on energy security in 123 countries. A method that combines GPCA and entropy-TOPSIS is used to calculate the energy security index. The FGI (de facto) represents financial globalization. Control variables include armed forces, industrialization rate, trade value share, and urbanization rate. A two-step Syst-GMM estimation approach is used to verify the robustness of the obtained results. The different impacts of financial globalization on energy security between OPEC and non-OPEC countries are also discussed.
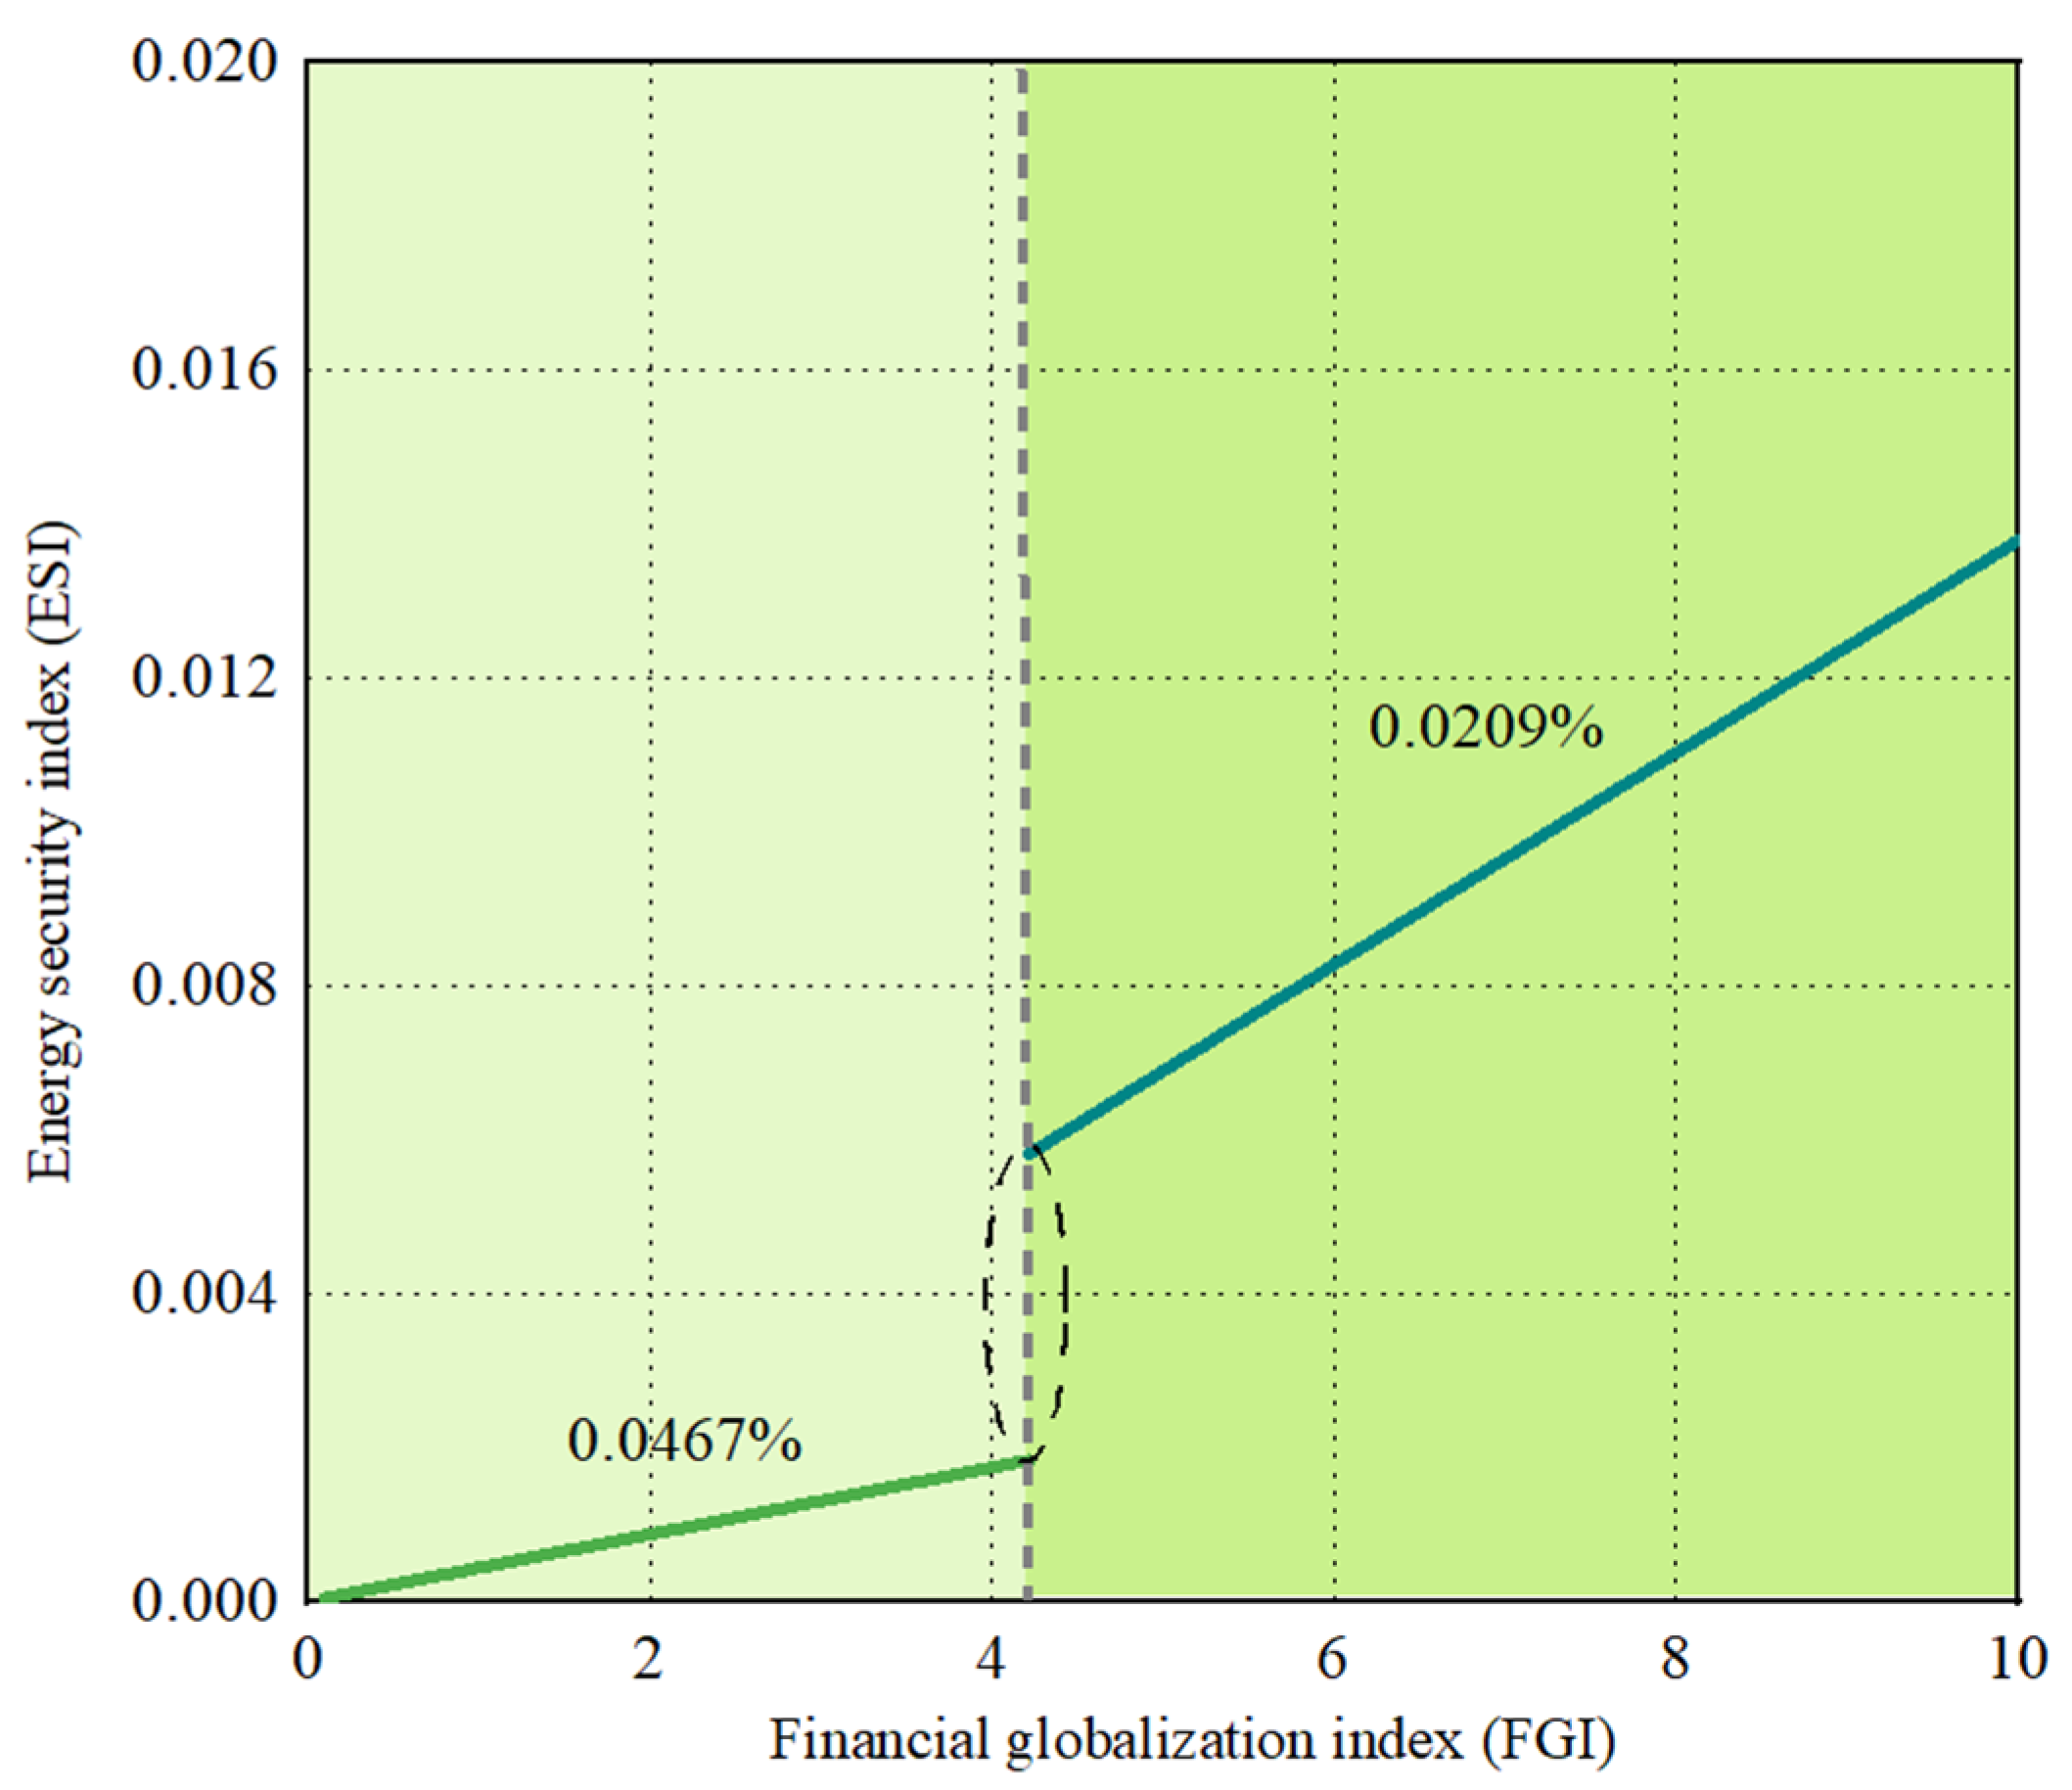
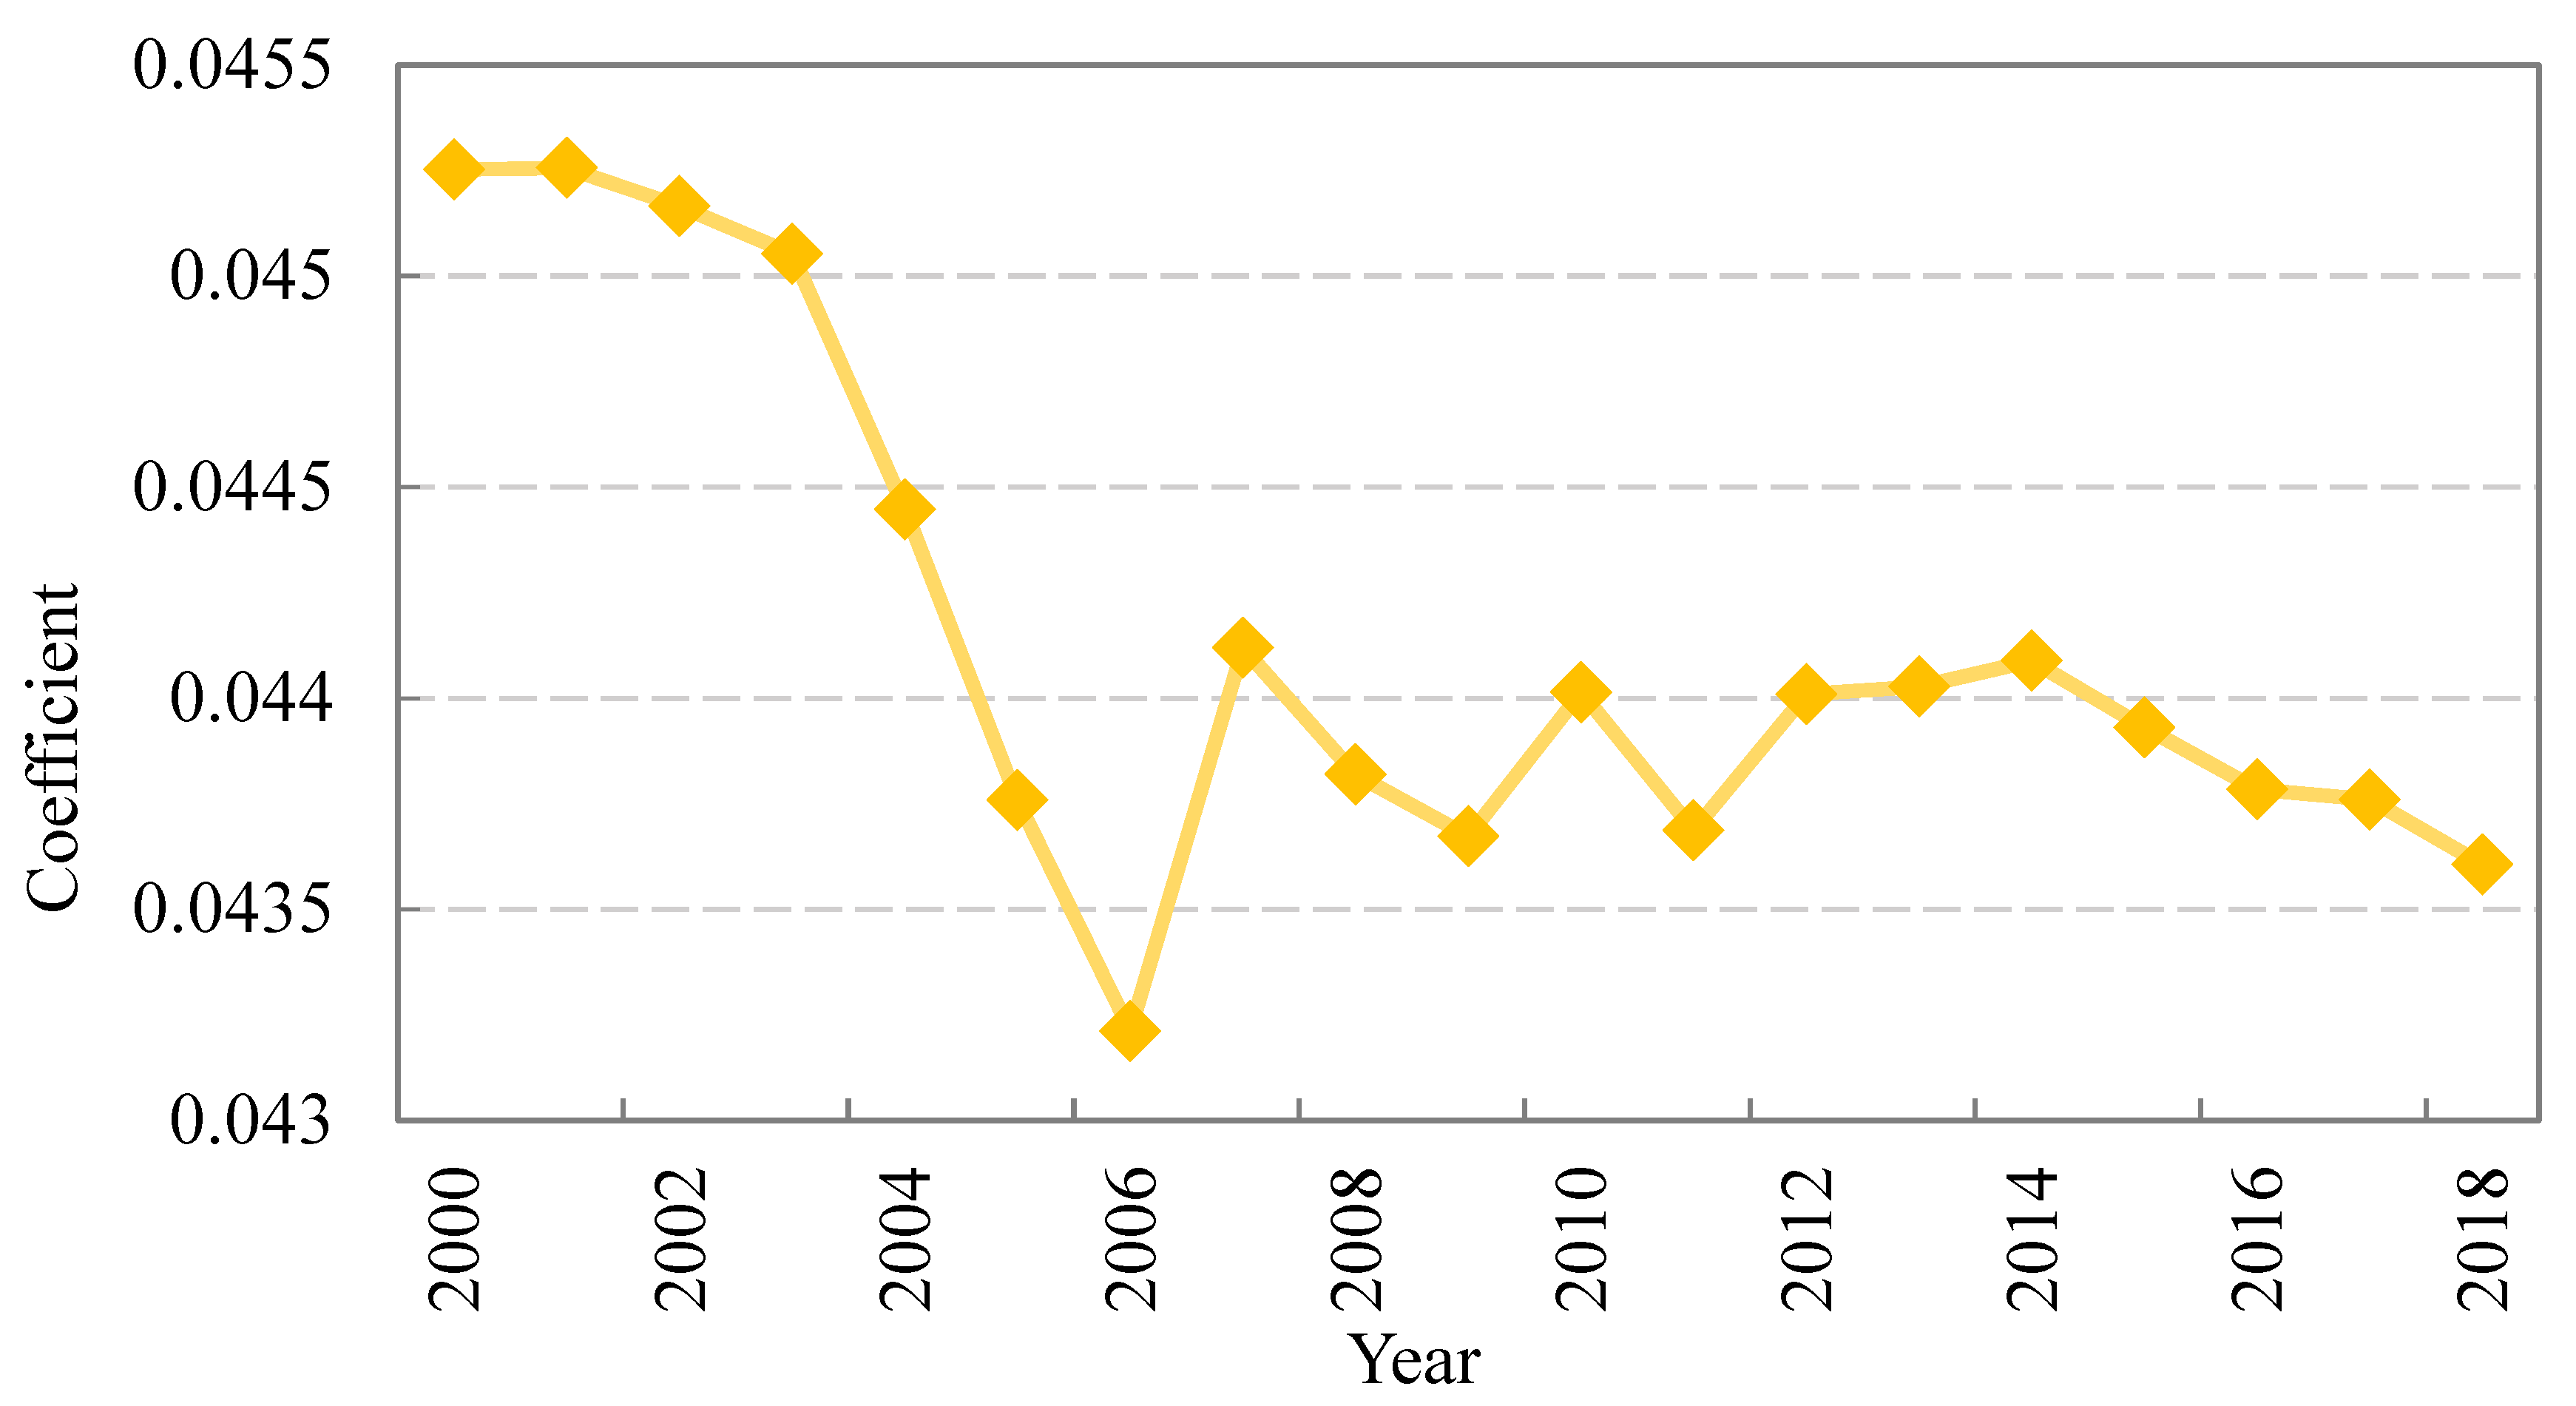
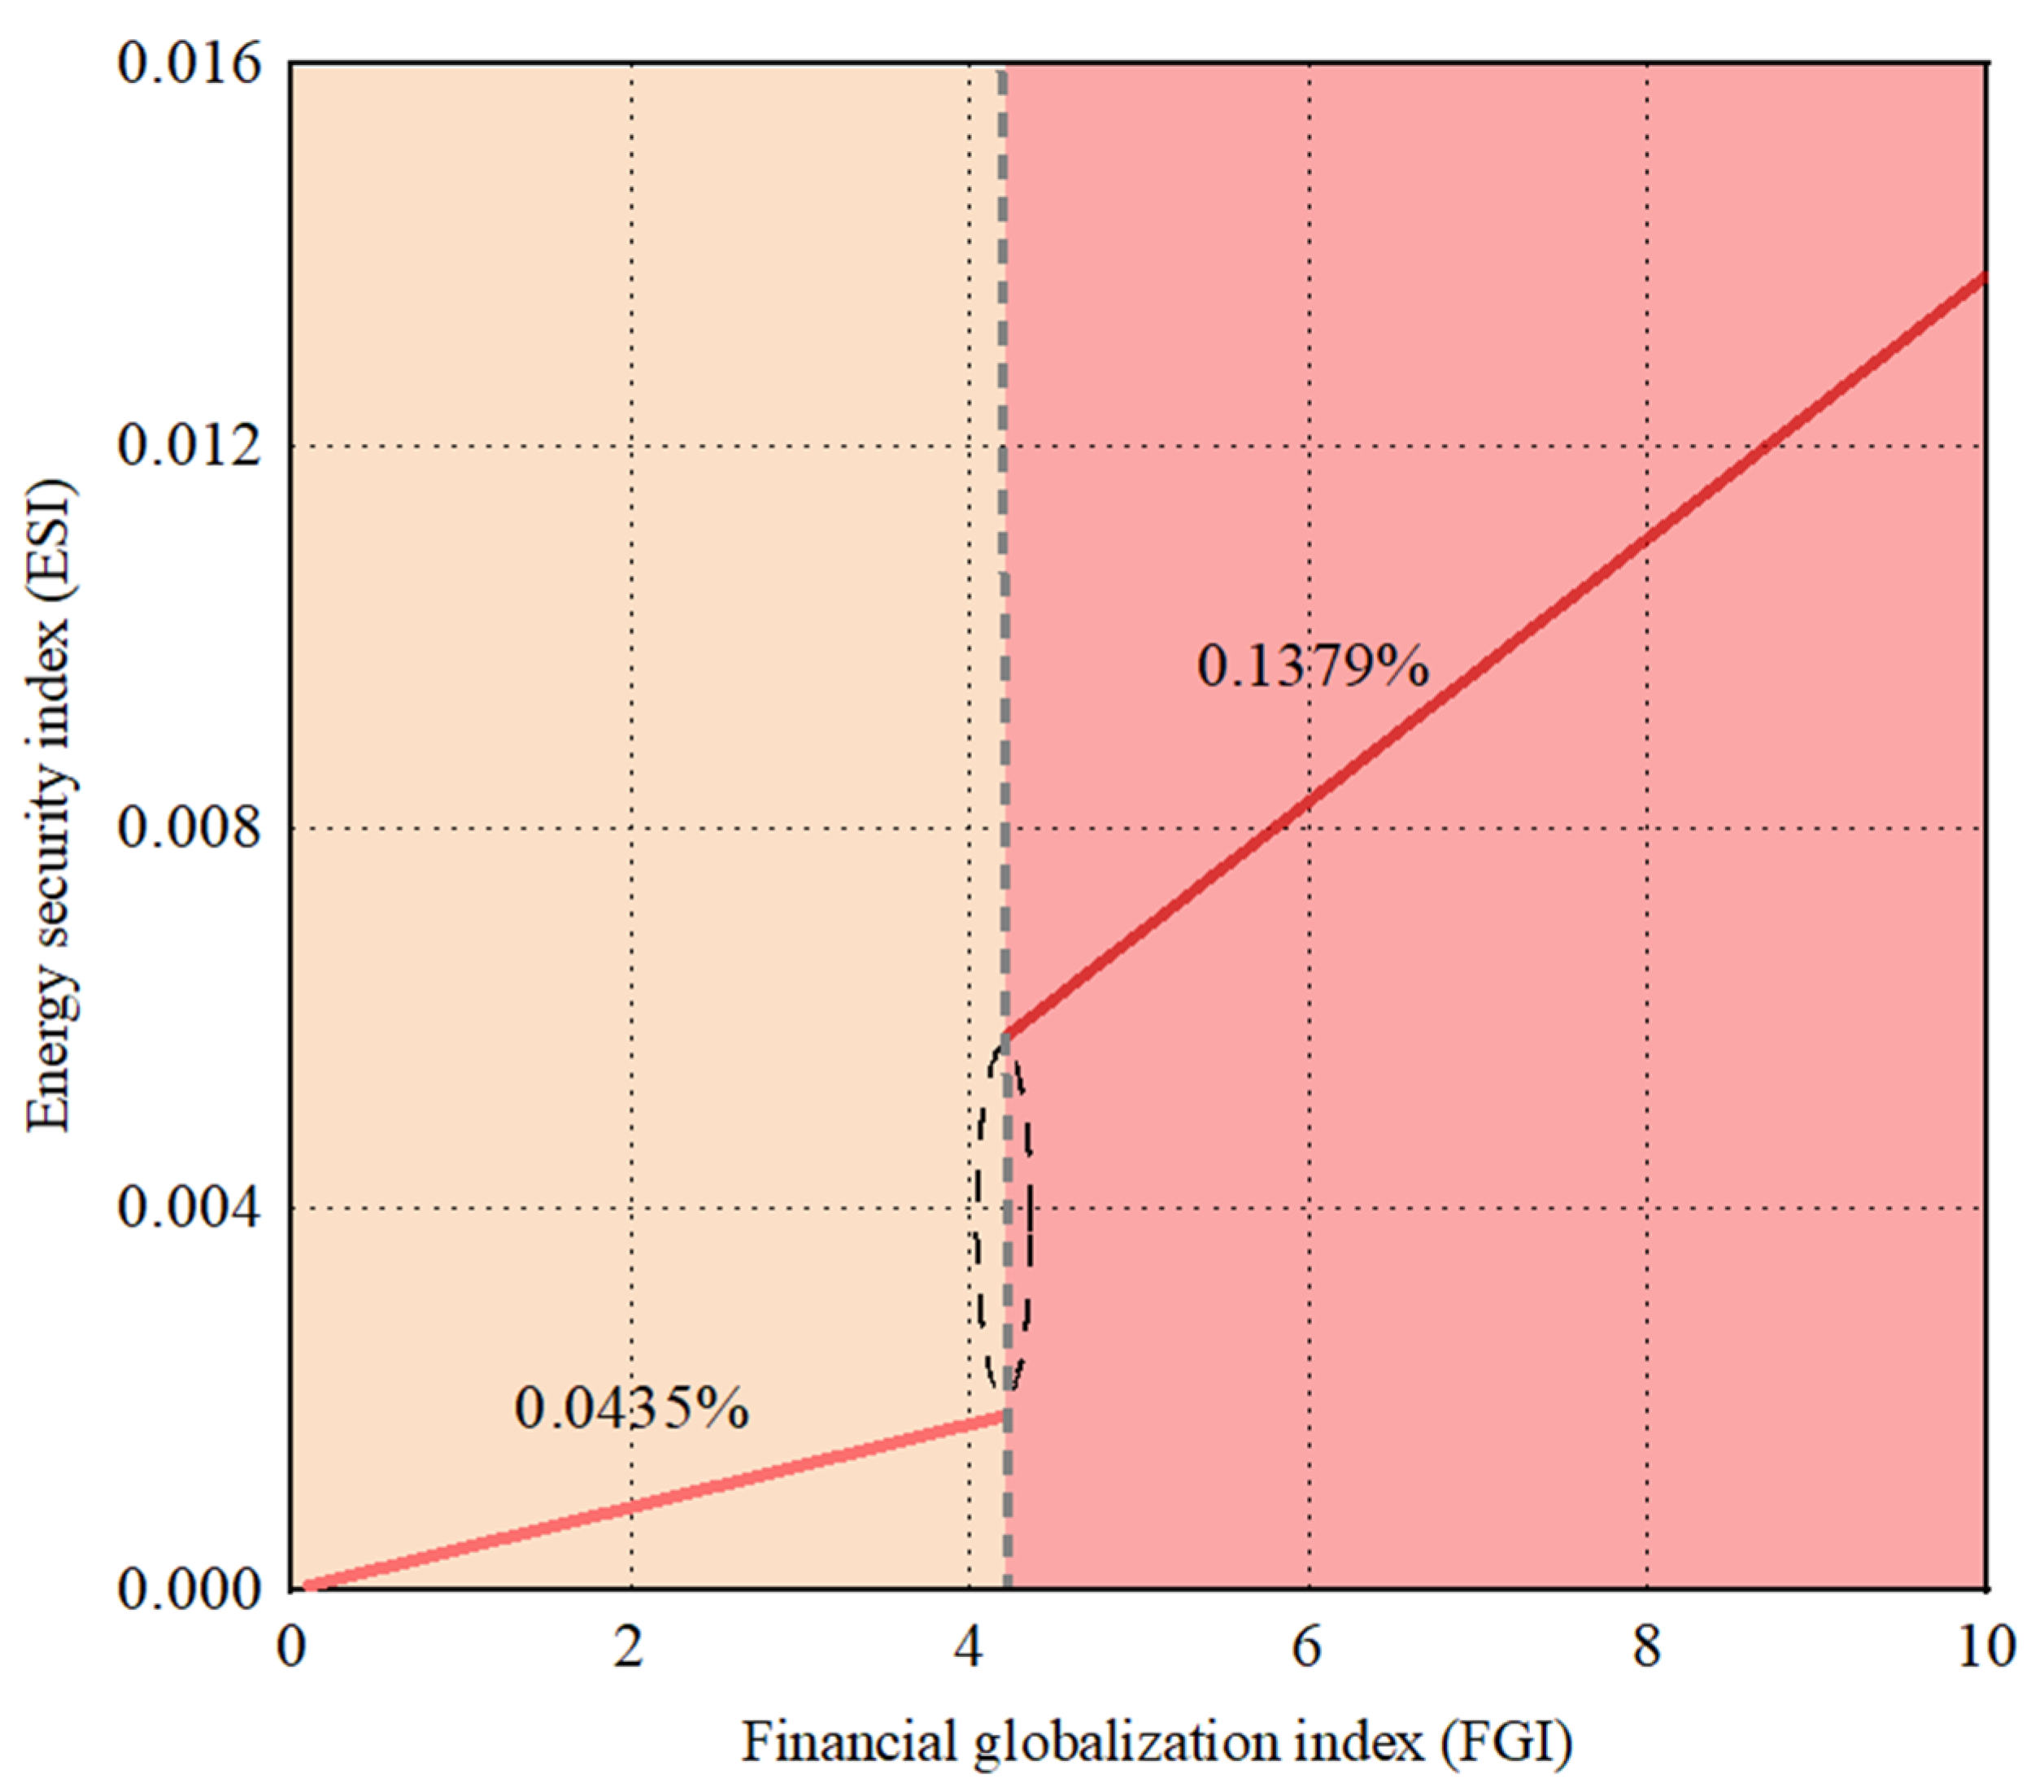
The PSTR model result shows that financial globalization can promote energy security. Both linear and nonlinear impacts are highly significant. If the logarithm of financial globalization in the previous period exceeds 0.0467, the impact coefficient declines from 0.0467 to 0.0209. This decline suggests that the increase in financial globalization can decrease its positive impact on energy security. For the temporal and spatial results, the positive effect follows a “decrease, increase, decrease” trend from 2000 to 2018. Financial globalization has the greatest effect on the energy security of Oceania and the Americas, with an effect coefficient of 0.0467, and the smallest impact in Europe, with an effect coefficient of 0.0391.
In addition, the same linear and nonlinear influence directions are found in the results of Syst-GMM and PSTR models, which proves the robustness of the PSTR model results. Financial globalization exerts significant linear and nonlinear impacts on energy security in OPEC countries, the effect coefficient of which exceeds the global level. However, financial globalization only exerts a linear impact on energy security in non-OPEC countries, and its positive effect is lower than that of OPEC countries. Regarding control variables, armed forces have a negative nonlinear impact on energy security. Other variables, such as industrialization rate, share of trade value, and urbanization rate, have positive linear and nonlinear impacts on energy security.
Based on the above findings, several policy recommendations are proposed to enhance energy security through financial globalization. First, it is suggested to promote financial globalization with targeted policies. Policymakers should encourage cross-border financial flows to enhance energy security, particularly in regions where the effect is most pronounced. However, since the positive impact diminishes beyond a certain threshold, excessive financial globalization should be monitored to avoid over-reliance. Complementary policies should be implemented to sustain long-term benefits. Second, it is essential to strengthen financial integration in OPEC countries. Given that financial globalization exerts a stronger positive influence on energy security in OPEC nations, these countries should capitalize on financial openness by attracting investments in energy infrastructure and diversification. Developing robust financial markets can further facilitate capital inflows for renewable energy and efficiency projects. Third, it is needed to adopt long-term monitoring and adaptive policies. Due to the fluctuating temporal effects of financial globalization on energy security, governments should adopt dynamic policy frameworks. Continuous assessment and timely adjustments will be crucial to maintaining and enhancing energy security gains over time.
The limitations of this paper emerge because financial globalization has a complex effect mechanism on energy security. First, in this paper, the next period FGI is used as a threshold variable. However, the financial globalization effect may also depend on other factors, such as financial development and technological innovation. Future studies can use these variables as threshold variables to further clarify the impact path. Second, financial globalization is part of economic globalization, which has a certain impact on trade activities. According to the theory of trade environmental effects, financial globalization effects mainly include scale effects, structural effects, and technological effects. Future studies can establish empirical models based on these effects. Third, it suggested improving the rationality of model assumptions according to the actual conditions and the development of methodology in the future. Finally, data limitation could also be improved in the future study. For example, if the data limitation could be improved, a more detailed grouping analysis may be achieved for different regions.

Author Contributions

Conceptualization, L.L.; methodology, S.Z.; software, S.Z.; validation, L.L.; formal analysis, S.Z.; investigation, L.L.; resources, L.L.; data curation, S.Z.; writing—original draft preparation, S.Z.; writing—review and editing, L.L.; visualization, S.Z.; supervision, L.L.; project administration, L.L.; funding acquisition, L.L. All authors have read and agreed to the published version of the manuscript.

Funding

The authors gratefully acknowledge the financial support provided by the National Natural Science Foundation of China (72303123).

Institutional Review Board Statement

Not applicable.

Informed Consent Statement

Not applicable.

Data Availability Statement

The data in this paper come from the US Energy Information Administration, the World Bank, the Swiss Economic Institute, and the World Development Indicators.

Conflicts of Interest

The authors declare no conflicts of interest.

References

  1. APERC. A Quest for Energy Security in the 21st Century: Resources and Constraints; Asia Pacific Energy Research Centre: Tokyo, Japan, 2007. [Google Scholar]
  2. Akhmat, G.; Zaman, K.; Shukui, T.; Sajjad, F. Does energy consumption contribute to climate change? Evidence from major regions of the world. Renew. Sustain. Energy Rev. 2014, 36, 123–134. [Google Scholar] [CrossRef]
  3. Acheampong, A.O.; Boateng, E.; Amponsah, M. Revisiting. the economic growth-energy consumption nexus: Does globalization matter? Energy Econ. 2021, 102, 105472. [Google Scholar] [CrossRef]
  4. Zhang, M.M.; Zhang, S.C.; Lee, C.C.; Zhou, D.Q. Effects of trade openness on renewable energy consumption in OECD countries: New insights from panel smooth transition regression modelling. Energy Econ. 2021, 104, 105649. [Google Scholar] [CrossRef]
  5. Ghazouani, T. Dynamic impact of globalization on renewable energy consumption: Non-parametric modelling evidence. Technol. Forecast. Soc. Chang. 2022, 185, 122115. [Google Scholar] [CrossRef]
  6. Bekaert, G.; Harvey, C.R.; Lundblad, C. Does financial liberalization spur growth? J. Financ. Econ. 2005, 7, 3–55. [Google Scholar] [CrossRef]
  7. Friedrich, C.; Schnabel, I.; Zettelmeyer, J. Financial integration and growth—Why is Emerging Europe different? J. Int. Econ. 2013, 89, 522–538. [Google Scholar] [CrossRef]
  8. Sadiq, M.; Shinwari, R.; Usman, M. Linking nuclear energy, human development and carbon emission in BRICS region: Do external debt and financial globalization protect the environment? Nucl. Eng. Technol. 2022, 54, 3299–3309. [Google Scholar] [CrossRef]
  9. Baek, J. A new look at the FDI-income-energy-environment nexus: Dynamic panel data analysis of ASEAN. Energy Policy 2016, 91, 22–27. [Google Scholar] [CrossRef]
  10. Shahbaz, M.; Khan, S.; Tahir, M.I. The dynamic links between energy consumption, economic growth, financial development and trade in China: Fresh evidence from multivariate framework analysis. Energy Econ. 2013, 40, 8–21. [Google Scholar] [CrossRef]
  11. Chang, R.; Kaltani, L.; Loayza, N.V. Openness can be good for growth: The role of policy complementarities. J. Dev. Econ. 2009, 90, 33–49. [Google Scholar] [CrossRef]
  12. Meng, J.; Mi, Z.F.; Guan, D.B. The rise of South-South trade and its effect on global CO2 emissions. Nat. Commun. 2018, 9, 1871. [Google Scholar] [CrossRef] [PubMed]
  13. Mahalik, M.K.; Villanthenkodath, M.A.; Mallick, H. Assessing the effectiveness of total foreign aid and foreign energy aid inflows on environmental quality in India. Energy Policy 2021, 149, 112015. [Google Scholar] [CrossRef]
  14. Zheng, M.B.; Feng, G.F.; Wang, Q.J. Financial globalization and technological innovation: International evidence. Econ. Syst. 2022, 47, 101048. [Google Scholar] [CrossRef]
  15. Aluko, O.A.; Opoku, E.E.O. The financial development impact of financial globalization revisited: A focus on OECD countries. Int. Econ. 2022, 169, 13–29. [Google Scholar] [CrossRef]
  16. Koyama, K.; Krane, J. Energy security through FDI: The legacy of Early Japanese Investment in the Oil Sectors of the Persian Gulf. Resour. Policy 2021, 74, 102165. [Google Scholar] [CrossRef]
  17. Kivyiro, P.; Arminen, H. Carbon dioxide emissions, energy consumption, economic growth, and foreign direct investment: Causality analysis for Sub-Saharan Africa. Energy 2014, 74, 595–606. [Google Scholar] [CrossRef]
  18. Usman, M.; Jahanger, A.; Makhdum, M.S.A. How do financial development, energy consumption, natural resources, and globalization affect Arctic countries’ economic growth and environmental quality? An advanced panel data simulation. Energy 2022, 241, 122515. [Google Scholar] [CrossRef]
  19. Halkos, G.E.; Polemis, M.L. The impact of economic growth on environmental efficiency of the electricity sector: A hybrid window DEA methodology for the USA. J. Environ. Manag. 2018, 211, 334–346. [Google Scholar] [CrossRef]
  20. Ivanovski, K.; Hailemariam, A.; Smyth, R. The effect of renewable and nonrenewable energy consumption on economic growth: Non-parametric evidence. J. Clean. Prod. 2021, 286, 124956. [Google Scholar] [CrossRef]
  21. Lahouel, B.B.; Taleb, L.; Zaied, Y.B.; Managi, S. Business case complexity and environmental sustainability: Nonlinearity and optimality from an efficiency perspective. J. Environ. Manag. 2022, 301, 113870. [Google Scholar] [CrossRef]
  22. Chang, T.H.; Huang, C.M.; Lee, M.C. Threshold effect of the economic growth rate on the renewable energy development from a change in energy price: Evidence from OECD countries. Energy Policy 2009, 37, 5796–5802. [Google Scholar] [CrossRef]
  23. Wang, K.H.; Liu, L.; Li, X.; Oana-Ramona, L. Do oil price shocks drive unemployment? Evidence from Russia and Canada. Energy 2022, 253, 124107. [Google Scholar] [CrossRef]
  24. Lee, C.C.; Wang, C.S. Financial development, technological innovation and energy security: Evidence from Chinese provincial experience. Energy Econ. 2022, 112, 106161. [Google Scholar] [CrossRef]
  25. Trotta, G. Assessing energy efficiency improvements and related energy security and climate benefits in Finland: An ex post multi-sectoral decomposition analysis. Energy Econ. 2020, 86, 104640. [Google Scholar] [CrossRef]
  26. Iyke, B.N.; Tran, V.T.; Narayan, P.K. Can energy security predict energy stock returns? Energy Econ. 2021, 94, 105052. [Google Scholar] [CrossRef]
  27. Mohammad, M.A.; Muntasir, M.; Ozturk, I.; Kurshid, K. Macroeconomic determinants of non-renewable and renewable energy consumption in India: The roles of international trade, innovative technologies, financial globalization, carbon emissions, financial development, and urbanization. Energy 2024, 308, 132939. [Google Scholar]
  28. Samargandi, N. Energy intensity and its determinants in OPEC countries. Energy 2019, 186, 115803. [Google Scholar] [CrossRef]
  29. Teng, F.F.; Usman, M.; Hind, A.; Sun, Y.P. Bridging shores: Leveraging green finance, financial globalization, and human capital for a cleaner environment in G-20 marine ecosystems using the fishing ground capability curve theory. Mar. Policy 2024, 170, 106354. [Google Scholar] [CrossRef]
  30. Ozkan, O.; Irina, A.P.; Destek, M.A.; Daniel, B.-L. Time-quantile impact of foreign direct investment, financial development, and financial globalisation on green growth in BRICS economies. J. Environ. Manag. 2024, 371, 123145. [Google Scholar] [CrossRef]
  31. Hansen, B. Threshold effects in non-dynamic panels: Estimating, testing and inference. J. Econom. 1999, 93, 345–368. [Google Scholar] [CrossRef]
  32. Gonzalez, A.; Terasvirta, T.; Dijk, D. Panel smooth transition regression models. In SSE/EFI Working Paper Series in Economics and Finance; Stockholm School of Economics: Stockholm, Sweden, 2005. [Google Scholar]
  33. Zhang, W.T.; Wang, Z.B.; Adebayo, T.S.; Altuntas, M. Asymmetric linkages between renewable energy consumption, financial integration, and ecological sustainability: Moderating role of technology innovation and urbanization. Renew. Energy 2022, 197, 1233–1243. [Google Scholar] [CrossRef]
  34. Su, M.; Wang, Q.; Li, R.R. Per capita renewable energy consumption in 116 countries: The effects of urbanization, industrialization, GDP, aging, and trade openness. Energy 2022, 254, 124289. [Google Scholar] [CrossRef]
  35. Le, T.H.; Nguyen, C.P. Is energy security a driver for economic growth? Evidence from a global sample. Energy Policy 2019, 129, 436–451. [Google Scholar] [CrossRef]
  36. Ha, L.T.; Thanh, T.T. Global value chains and energy security: Evidence from global sample. Energy Strategy Rev. 2022, 42, 100870. [Google Scholar] [CrossRef]
  37. Ha, L.T. Are digital business and digital public services a driver for better energy security? Evidence from a European sample. Environ. Sci. Pollut. Res. 2022, 29, 27232–27256. [Google Scholar] [CrossRef]
  38. Lee, C.C.; Wang, F. How does digital inclusive finance affect carbon intensity? Econ. Anal. Policy 2022, 75, 174–190. [Google Scholar] [CrossRef]
  39. Jakstas, T. Chapter 5—What does energy security mean? In Energy Transformation Towards Sustainability; Elsevier: Amsterdam, The Netherlands, 2020; pp. 99–112. [Google Scholar]
  40. Shen, J.H.; Zhang, L.; Lee, C.C.; Zhang, J.; Shen, L.L. Towards a dynamic model of the industrial upgrading with global value chains. World Econ. 2021, 44, 2683–2702. [Google Scholar] [CrossRef]
  41. Yang, Y.C.; Liu, J.H.; Lin, Y.Y.; Li, Q.Y. The impact of urbanization on China’s residential energy consumption. Struct. Chang. Econ. Dyn. 2019, 49, 170–182. [Google Scholar] [CrossRef]
  42. Xie, L.Y.; Yan, H.S.; Zhang, S.H.; Wei, C. Does urbanization increase residential energy use? Evidence from the Chinese residential energy consumption survey 2012. China Econ. Rev. 2020, 59, 101374. [Google Scholar] [CrossRef]
  43. Levin, A.; Lin, C.F.; Chu, C. Unit root test in panel data: Asymptotic and finite sample properties. J. Econom. 2002, 108, 1–24. [Google Scholar] [CrossRef]
  44. Amri, F. The relationship amongst energy consumption, foreign direct investment and output in developed and developing Countries. Renew. Sustain. Energy Rev. 2016, 64, 694–702. [Google Scholar] [CrossRef]
  45. Zhao, Y.; Shi, X.P.; Song, F. Has Chinese outward foreign direct investment in energy enhanced China’s energy security? Energy Policy 2020, 146, 111803. [Google Scholar] [CrossRef]
  46. Przychodzen, W.; Przychodzen, J. Determinants of renewable energy production in transition economies: A panel data approach. Energy 2020, 191, 116583. [Google Scholar] [CrossRef]
  47. Zhang, W.Y.; Li, J.N.; Sun, C.W. The impact of OFDI reverse technology spillovers on China’s energy intensity: Analysis of provincial panel data. Energy Econ. 2022, 116, 106400. [Google Scholar] [CrossRef]
  48. Berhe, M.W.; Huang, J.B.; Wedajo, A.D. Effect of China’s technology spillovers on energy intensity in Africa. Chin. J. Popul. Resour. Environ. 2022, 20, 168–176. [Google Scholar] [CrossRef]
  49. Mata Perez, M.E.; Scholten, D.; Smith Stegen, K. The multi-speed energy transition in Europe: Opportunities and challenges for EU energy security. Energy Strategy Rev. 2019, 26, 100415. [Google Scholar] [CrossRef]
  50. Misik, M. The EU needs to improve its external energy security. Energy Policy 2022, 165, 112930. [Google Scholar] [CrossRef]
  51. Bradford, J.H.; Stoner, A.M. The treadmill of destruction and ecological exchange in comparative perspective: A panel study of the biological capacity of nations, 1961–2007. Contemp. J. Anthropol. Sociol. 2014, 4, 87–113. [Google Scholar]
  52. Jorgenson, A.K.; Clark, B.; Kentor, J. Militarization and the Environment: A Panel Study of Carbon Dioxide Emissions and the Ecological Footprints of Nations, 1970–2000. Glob. Environ. Politics 2010, 10, 7–29. [Google Scholar] [CrossRef]
  53. Solarin, S.A.; Al-mulali, U.; Ozturk, I. Determinants of pollution and the role of the military sector: Evidence from a maximum likelihood approach with two structural breaks in the USA. Environ. Sci. Pollut. Res. 2018, 25, 30949–30961. [Google Scholar] [CrossRef]
  54. Andal, E.G. Industrialisation, state-related institutions, and the speed of energy substitution: The case in Europe. Energy 2022, 239, 122274. [Google Scholar] [CrossRef]
  55. Sadorsky, P. Do urbanization and industrialization affect energy intensity in developing countries? Energy Econ. 2013, 37, 52–59. [Google Scholar] [CrossRef]
  56. Sadorsky, P. The Effect of Urbanization and Industrialization on Energy Use in Emerging Economies: Implications for Sustainable Development. Am. J. Econ. Sociol. 2014, 73, 392–409. [Google Scholar] [CrossRef]
  57. Yao, X.; Shah, W.U.H.; Yasmeen, R.; Zhang, Y.Z.; Kamal, M.A.; Khan, A. The impact of trade on energy efficiency in the global value chain: A simultaneous equation approach. Sci. Total Environ. 2021, 765, 142759. [Google Scholar] [CrossRef]
  58. Bakirtas, T.; Akpolat, A.G. The Relationship between Energy Consumption, Urbanization, and Economic Growth in New Emerging-Market Countries. Energy 2018, 147, 110–121. [Google Scholar] [CrossRef]
  59. Adom, P.K.; Kwakwa, P.A. Effects of changing trade structure and technical characteristics of the manufacturing sector on energy intensity in Ghana. Renew. Sustain. Energy Rev. 2014, 35, 475–483. [Google Scholar] [CrossRef]
  60. Gil-Alana, L.A.; Monge, M. Crude Oil Prices and COVID-19: Persistence of the Shock. Energy Res. Lett. 2020, 1, 1–4. [Google Scholar] [CrossRef]
Figure 1. Transition function of the transition variable FGIt−1. Note: The orange dot is the threshold value of FGIt-1.
Sustainability 17 04248 g001
Figure 2. The impact of FGI on ESI.
Sustainability 17 04248 g002
Figure 3. Temporal variations of the impact of FGI on ESI.
Sustainability 17 04248 g003
Figure 4. Spatial variations of the impact of FGI on ESI.
Sustainability 17 04248 g004
Figure 5. Transition function of the transition variable FGIt−1 in OPEC countries. Note: The orange dot is the threshold value of FGIt-1.
Sustainability 17 04248 g005
Figure 6. Impact of FGI on ESI in OPEC countries.
Sustainability 17 04248 g006
Figure 7. Transition function of FGIt−1 in non-OPEC countries. Note: The orange dots are the threshold values of FGIt-1.
Sustainability 17 04248 g007
Figure 8. The impact of FGI on ESI in non-OPEC countries.
Sustainability 17 04248 g008
Table 1. Summary of variables.
Variable TypeVariableSignMethod
Dependent variableEnergy securityESIGPCA and TOPSIS
Independent variableFinancial globalizationFGIFinancial globalization index
Transition variablesFinancial globalizationFGIt−1Financial globalization index
Control variablesArmed forcesAFNumber of armed forces personnel/total workforce
Industrialization rateIRAdded industry value/GDP
Trade value shareTSTrade value/GDP
Urbanization rateURUrban population/total population
Table 2. Results of descriptive statistics.
VariableObservationsMinimumMaximumMeanStd. Dev.
ESI23370.19300.77390.46940.1001
FGI233710.963699.780061.141019.0752
AF23370.000011.96271.36151.4163
IR23374.555984.796027.630910.1718
TS23371.2951437.326782.427648.2215
UR23378.2460100.00059.331621.1015
Table 3. Correlation matrix.
VariableLESILFGIAFIRTSUR
LESI1.0000
LFGI0.6036 ***1.0000
AF0.0940 ***−0.0445 **1.0000
IR0.1728 ***−0.0384 *0.3369 ***1.0000
TS0.3038 ***0.4556 ***0.1760 ***0.0598 ***1.0000
UR0.7287 ***0.5261 ***0.1683 ***0.1815 ***0.2364 ***1.0000
Note: The symbols ***, **, and * denote significance levels of 1%, 5%, and 10%, respectively.
Table 4. The results of unit root tests.
VariableLLCFisher Unit Root Tests
lnESI−11.8448 *** (0.0000)453.8413 *** (0.0000)
lnFGI−100.0000 *** (0.0000)551.9130 *** (0.0000)
AF−45.2227 *** (0.0000)422.7814 *** (0.0000)
IR−16.5165 *** (0.0000)418.4723 *** (0.0000)
TS−24.9819 *** (0.0000)393.4457 *** (0.0000)
UR−2.0437 ** (0.0205)377.4585 *** (0.0000)
Note: The symbols *** and ** denote significance levels of 1% and 5%, respectively. The p-value of the estimator is shown in parentheses.
Table 5. Linearity test result.
Threshold VariableH0: r = 0, H1: r = 1
LMLMFLRT
FGI46.174 *** (0.000)2.955 *** (0.000)46.637 *** (0.000)
Note: The symbols *** denotes significance levels of 1%. The p-value of the estimator is shown in parentheses.
Table 6. The remaining nonlinearity test result of the PSTR model.
Explanatory VariableH0: r = 1, H1: r = 2
LMLMFLRT
FGI7.806 (0.167)1.474 (0.195)7.820 (0.166)
Note: The p-value of the estimator is shown in parentheses.
Table 7. The results of location and slope parameters.
Independent VariableLocation ParameterSlope Parameter
FGI4.4706136.4752
Table 8. The impact of FGI on ESI.
VariablesESI
Linear CoefficientsNonlinear Coefficients
lnFGI0.0467 *** (5.4297)−0.0258 *** (−3.2475)
AF0.0067 *** (4.4156)−0.0334 *** (−8.7053)
IR0.0005 * (1.3452)0.0013 ** (2.0342)
TS0.0001 (0.6112)0.0006 *** (4.5236)
UR0.0039 *** (9.2076)0.0009 ** (2.1597)
θ4.4706
γ136.4752
Note: The symbols ***, **, and * denote significance levels of 1%, 5%, and 10%, respectively. T-statistics of the estimator are shown in parentheses.
Table 9. Estimation results of the Syst-GMM model.
ItemslnESI
lnESIit−10.9847 *** (0.000)
lnFGI0.2057 ** (0.012)
ln2FGI−0.0274 ** (0.011)
L. lnFGI−0.0421 *** (0.000)
F−0.0024 ** (0.016)
IR0.0010 *** (0.000)
TS0.0001 ** (0.011)
UR−0.0002 * (0.030)
_cons−0.2343 (0.115)
N2214
AR(1)−9.00 (0.000)
AR(2)0.52 (0.600)
Hansen122.88 (0.247)
Note: The symbols ***, **, and * denote significance levels of 1%, 5%, and 10%, respectively. The p-value of the estimator is shown in parentheses.
Table 10. Empirical results for OPEC and Non-OPEC countries.
VariablesESI
OPECNon-OPEC
Linear PartNonlinear PartLinear PartNonlinear Part
lnFGI0.0435 ** (2.0210)0.0944 ** (2.8040)0.0065 (0.2642)0.0040 (0.1911)0.0330 *** (4.0244)
AF0.0038 ** (2.4606)0.0250 (0.4527)0.0200 (1.0335)−0.0110 (−0.5643)−0.0061 ** (−2.3643)
IR−0.0011 * (−1.6951)−0.0017 (−0.6104)0.0081 ** (1.9005)−0.0056 * (−1.3336)−0.0030 *** (−3.2224)
TS0.0010 *** (3.5443)−0.0021 ** (−1.8601)−0.0041 *** (−3.4819)0.0041 *** (3.5176)0.0001 (0.8394)
UR−0.0043 *** (−4.2397)−0.0027 * (−1.5000)0.0099 *** (4.3247)−0.0047 ** (−2.1298)−0.0005 ** (−1.9729)
θ4.22073.2493; 3.7754
γ14.8044554.5792; 124.1454
Note: The symbols ***, **, and * denote significance levels of 1%, 5%, and 10%, respectively. T-statistics of the estimator are shown in parentheses.
Disclaimer/Publisher’s Note: The statements, opinions and data contained in all publications are solely those of the individual author(s) and contributor(s) and not of MDPI and/or the editor(s). MDPI and/or the editor(s) disclaim responsibility for any injury to people or property resulting from any ideas, methods, instructions or products referred to in the content.

