
Prioritizing Smart City Themes for Multi-National Enterprises and United Nations Sustainable Development Goals

 , , and
Abstract
1. Introduction
1.1. Link Between Population, Economy, and Emissions
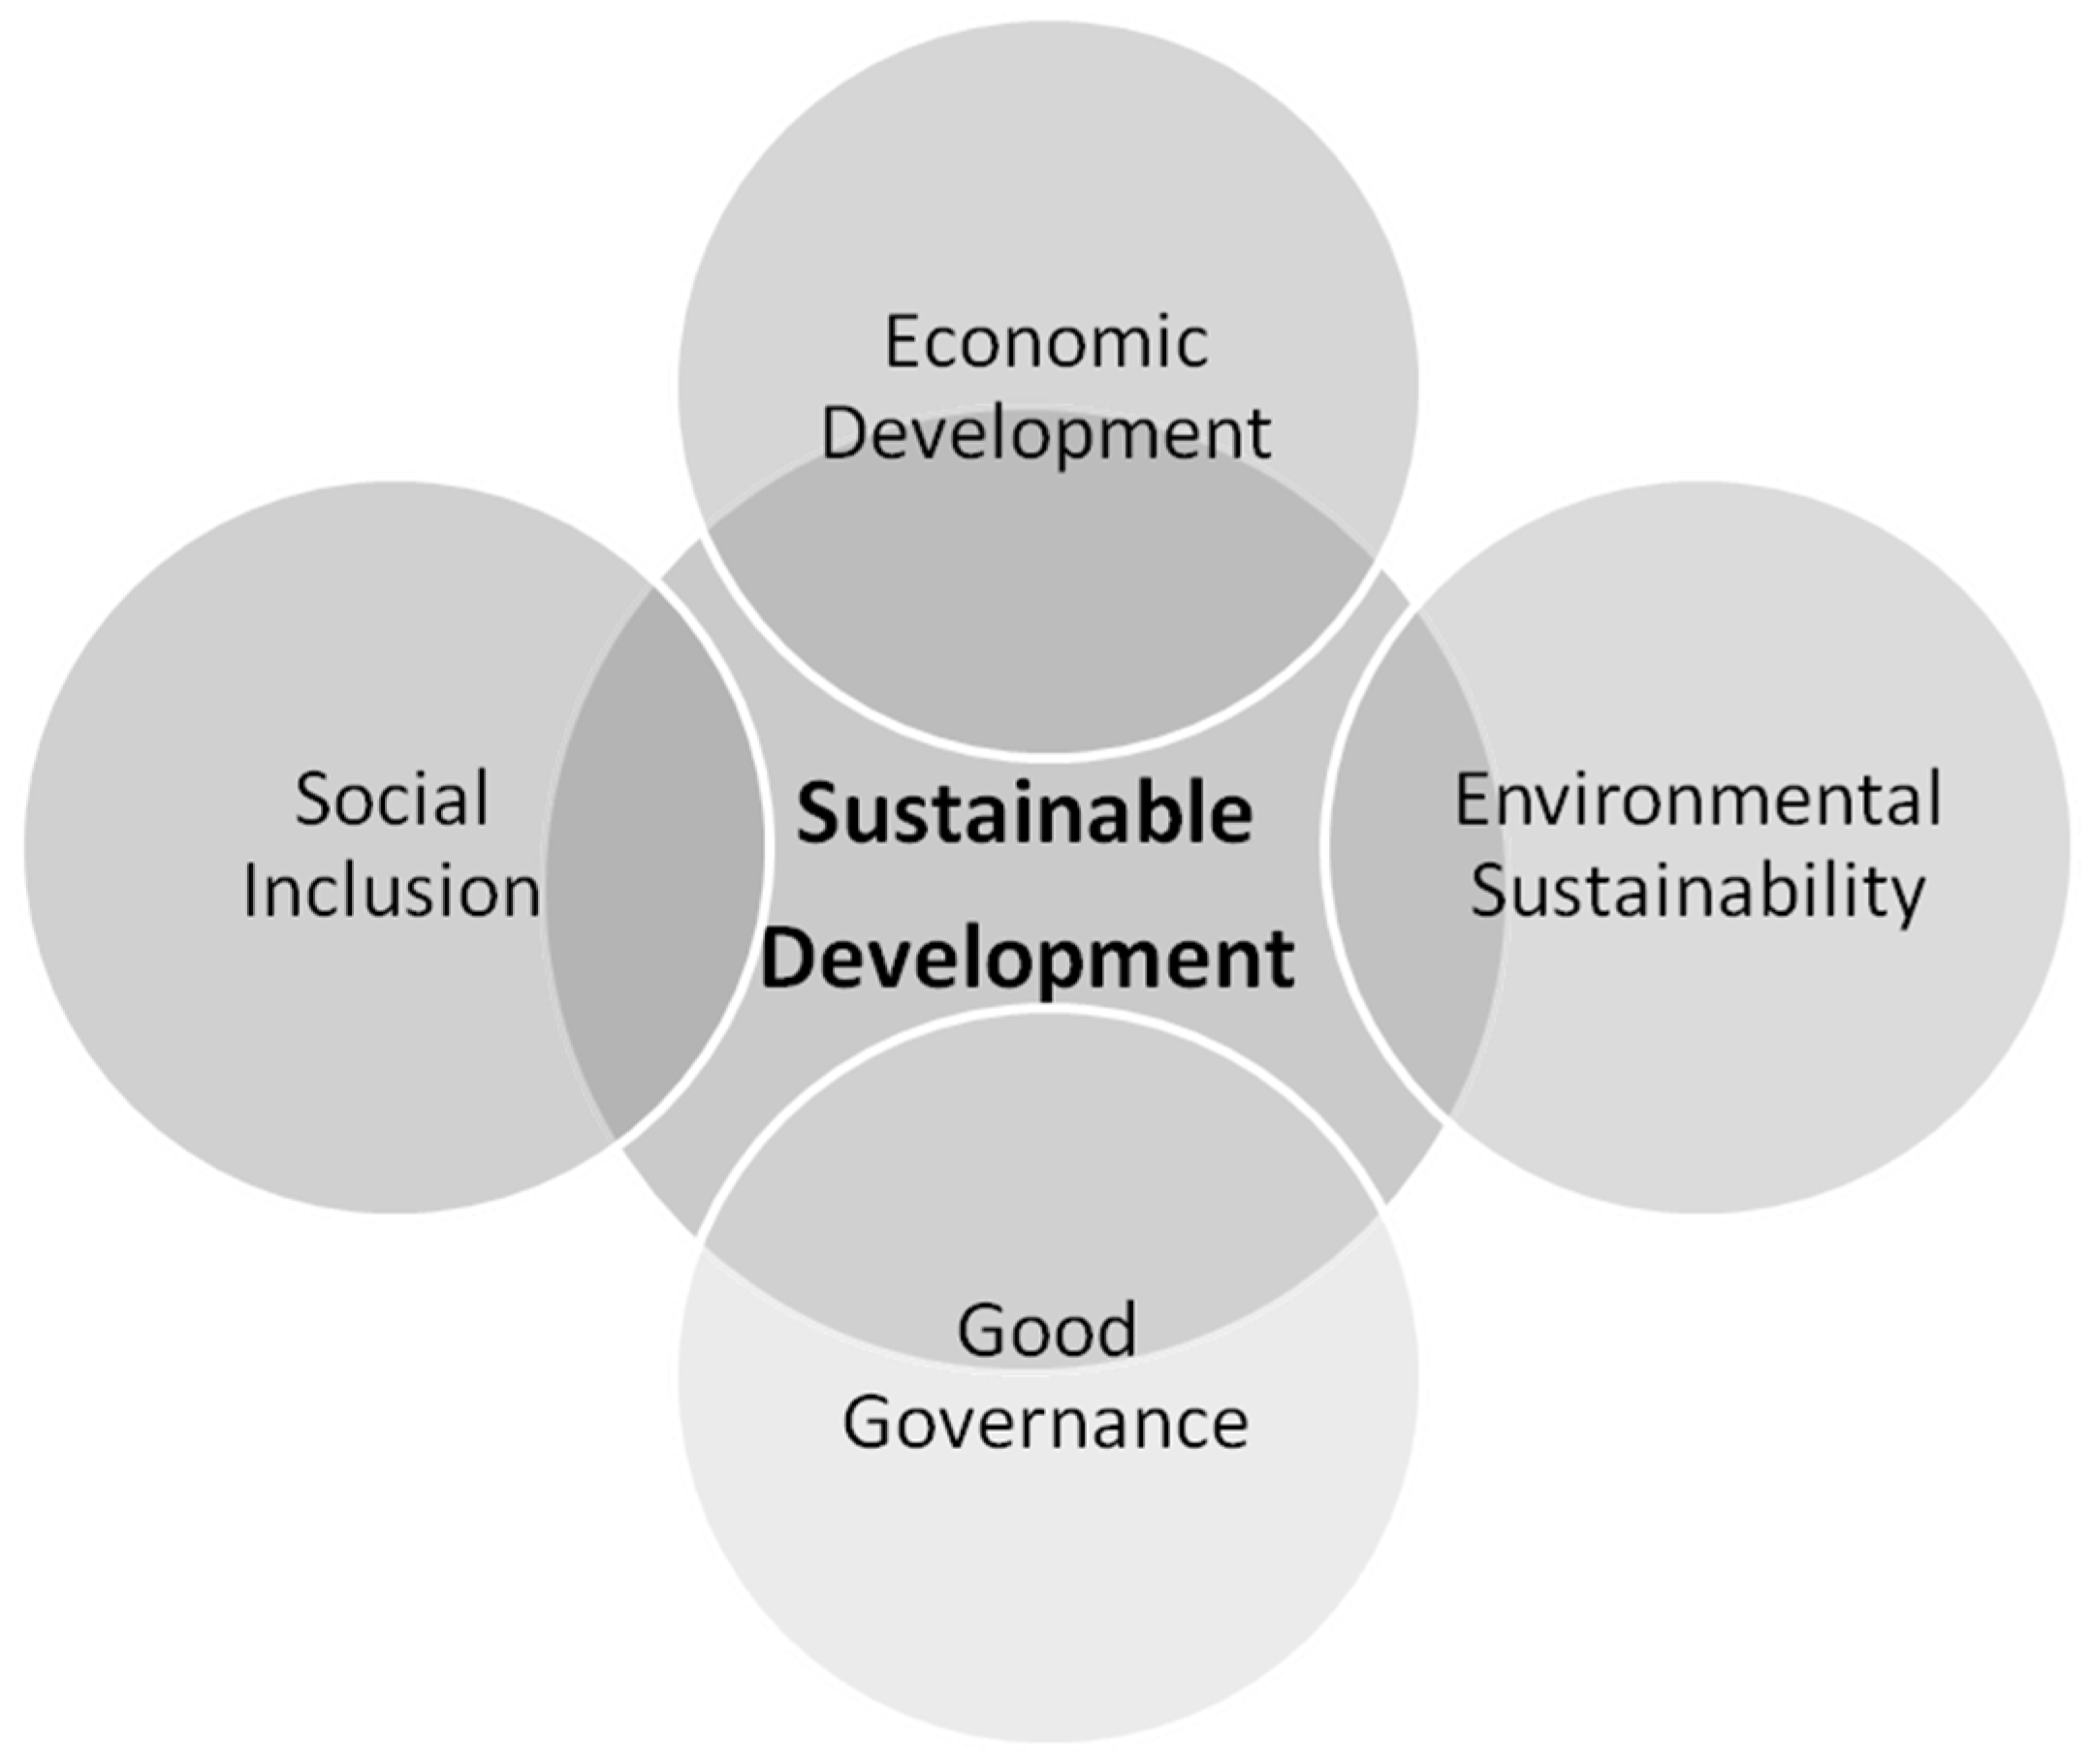
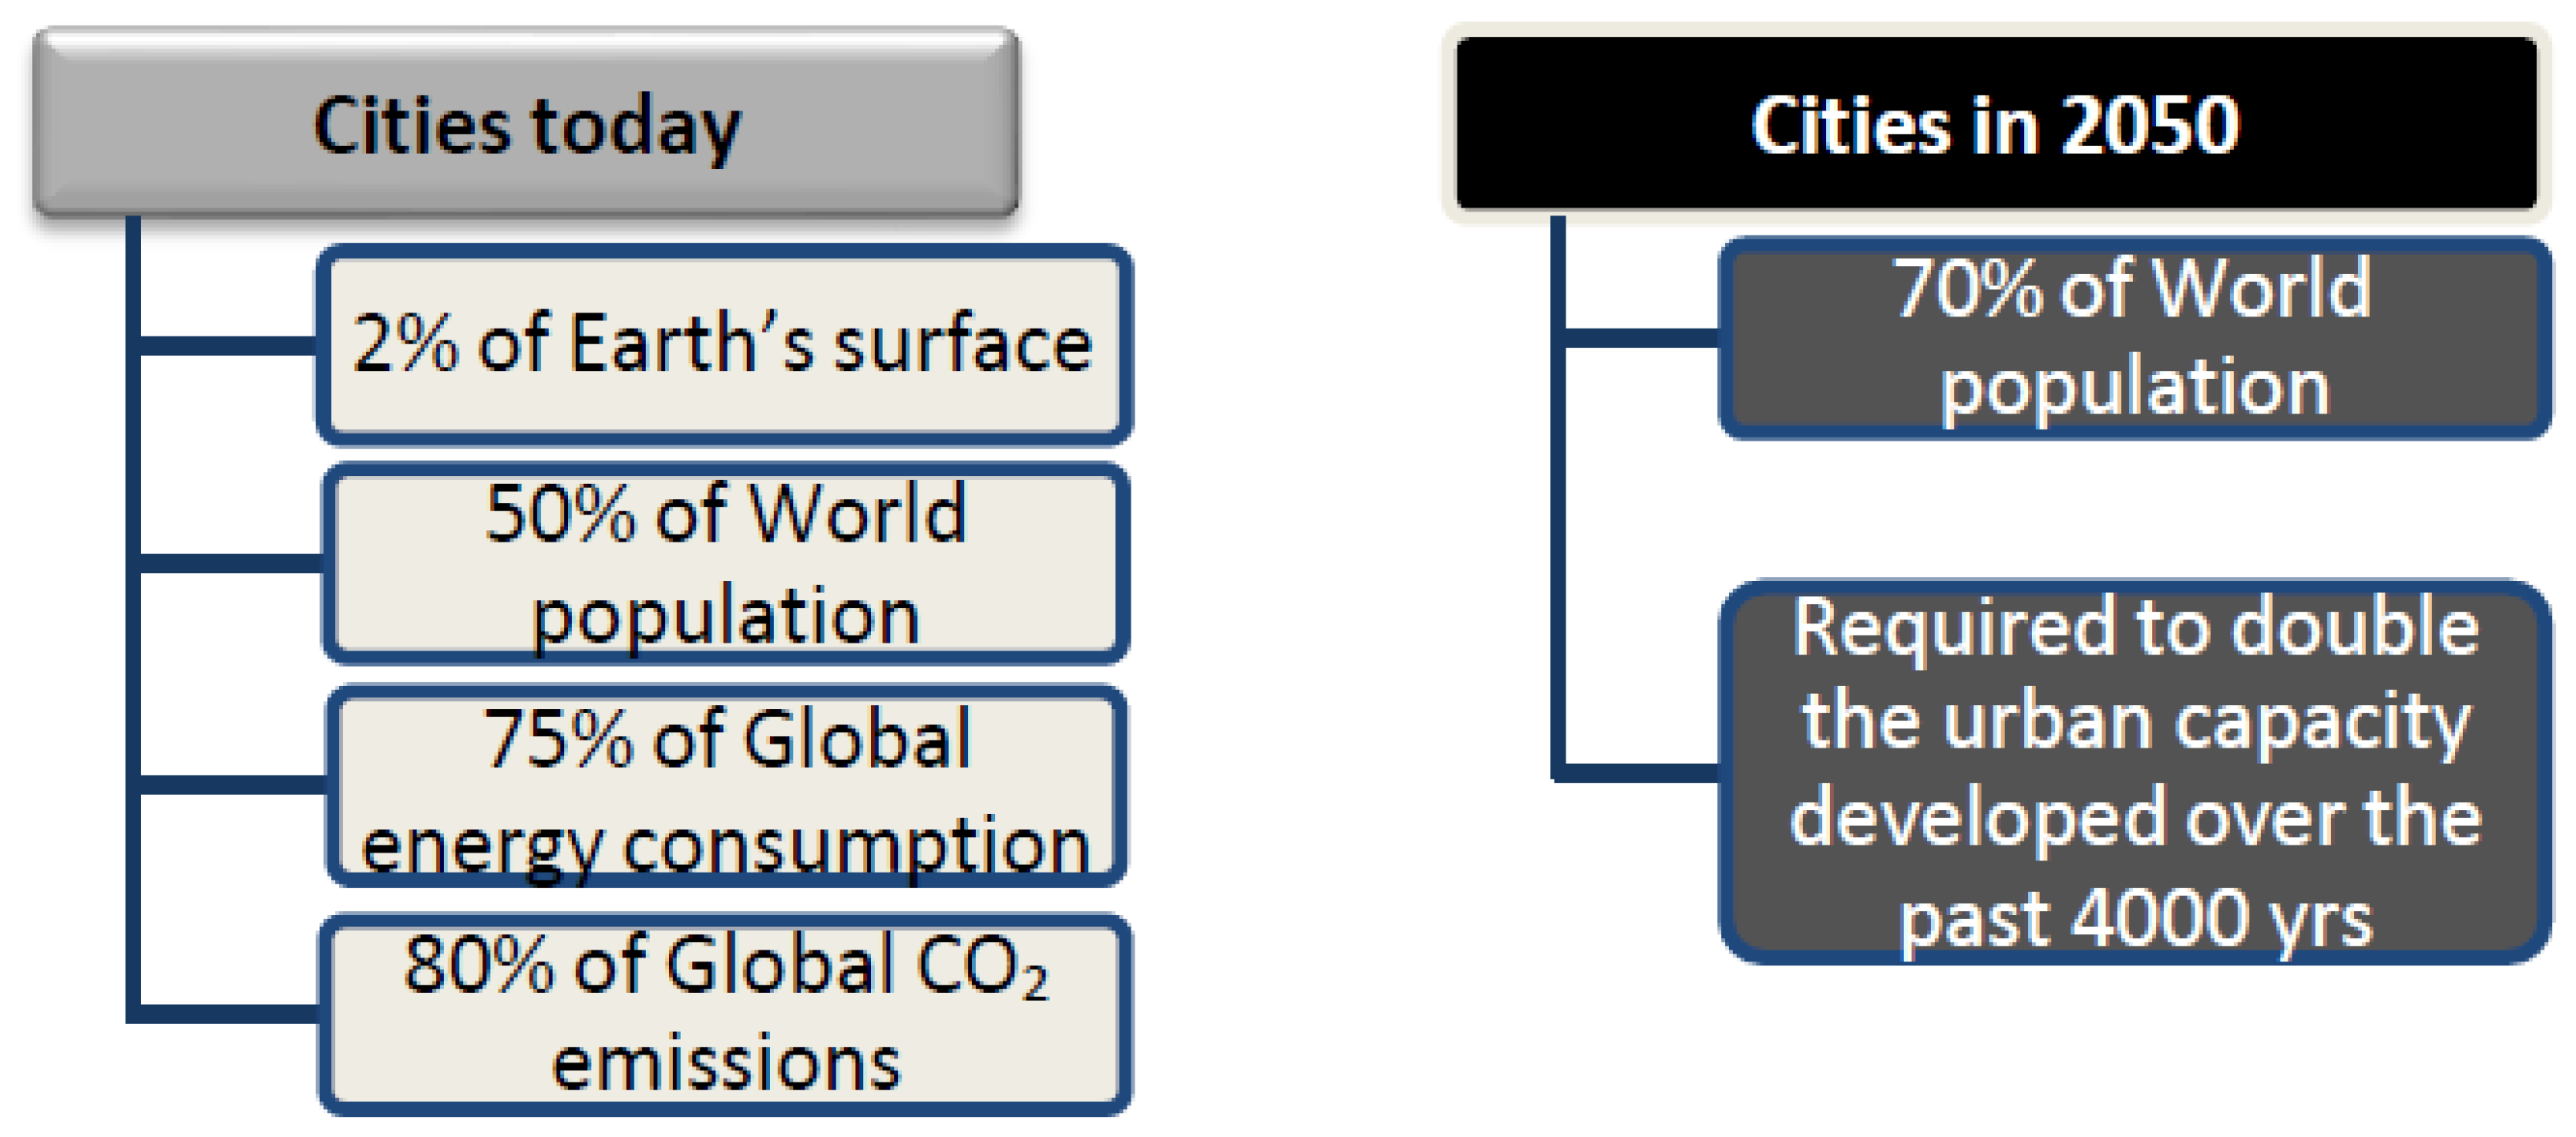
1.2. Role of Cities in Sustainability
2. Literature Review
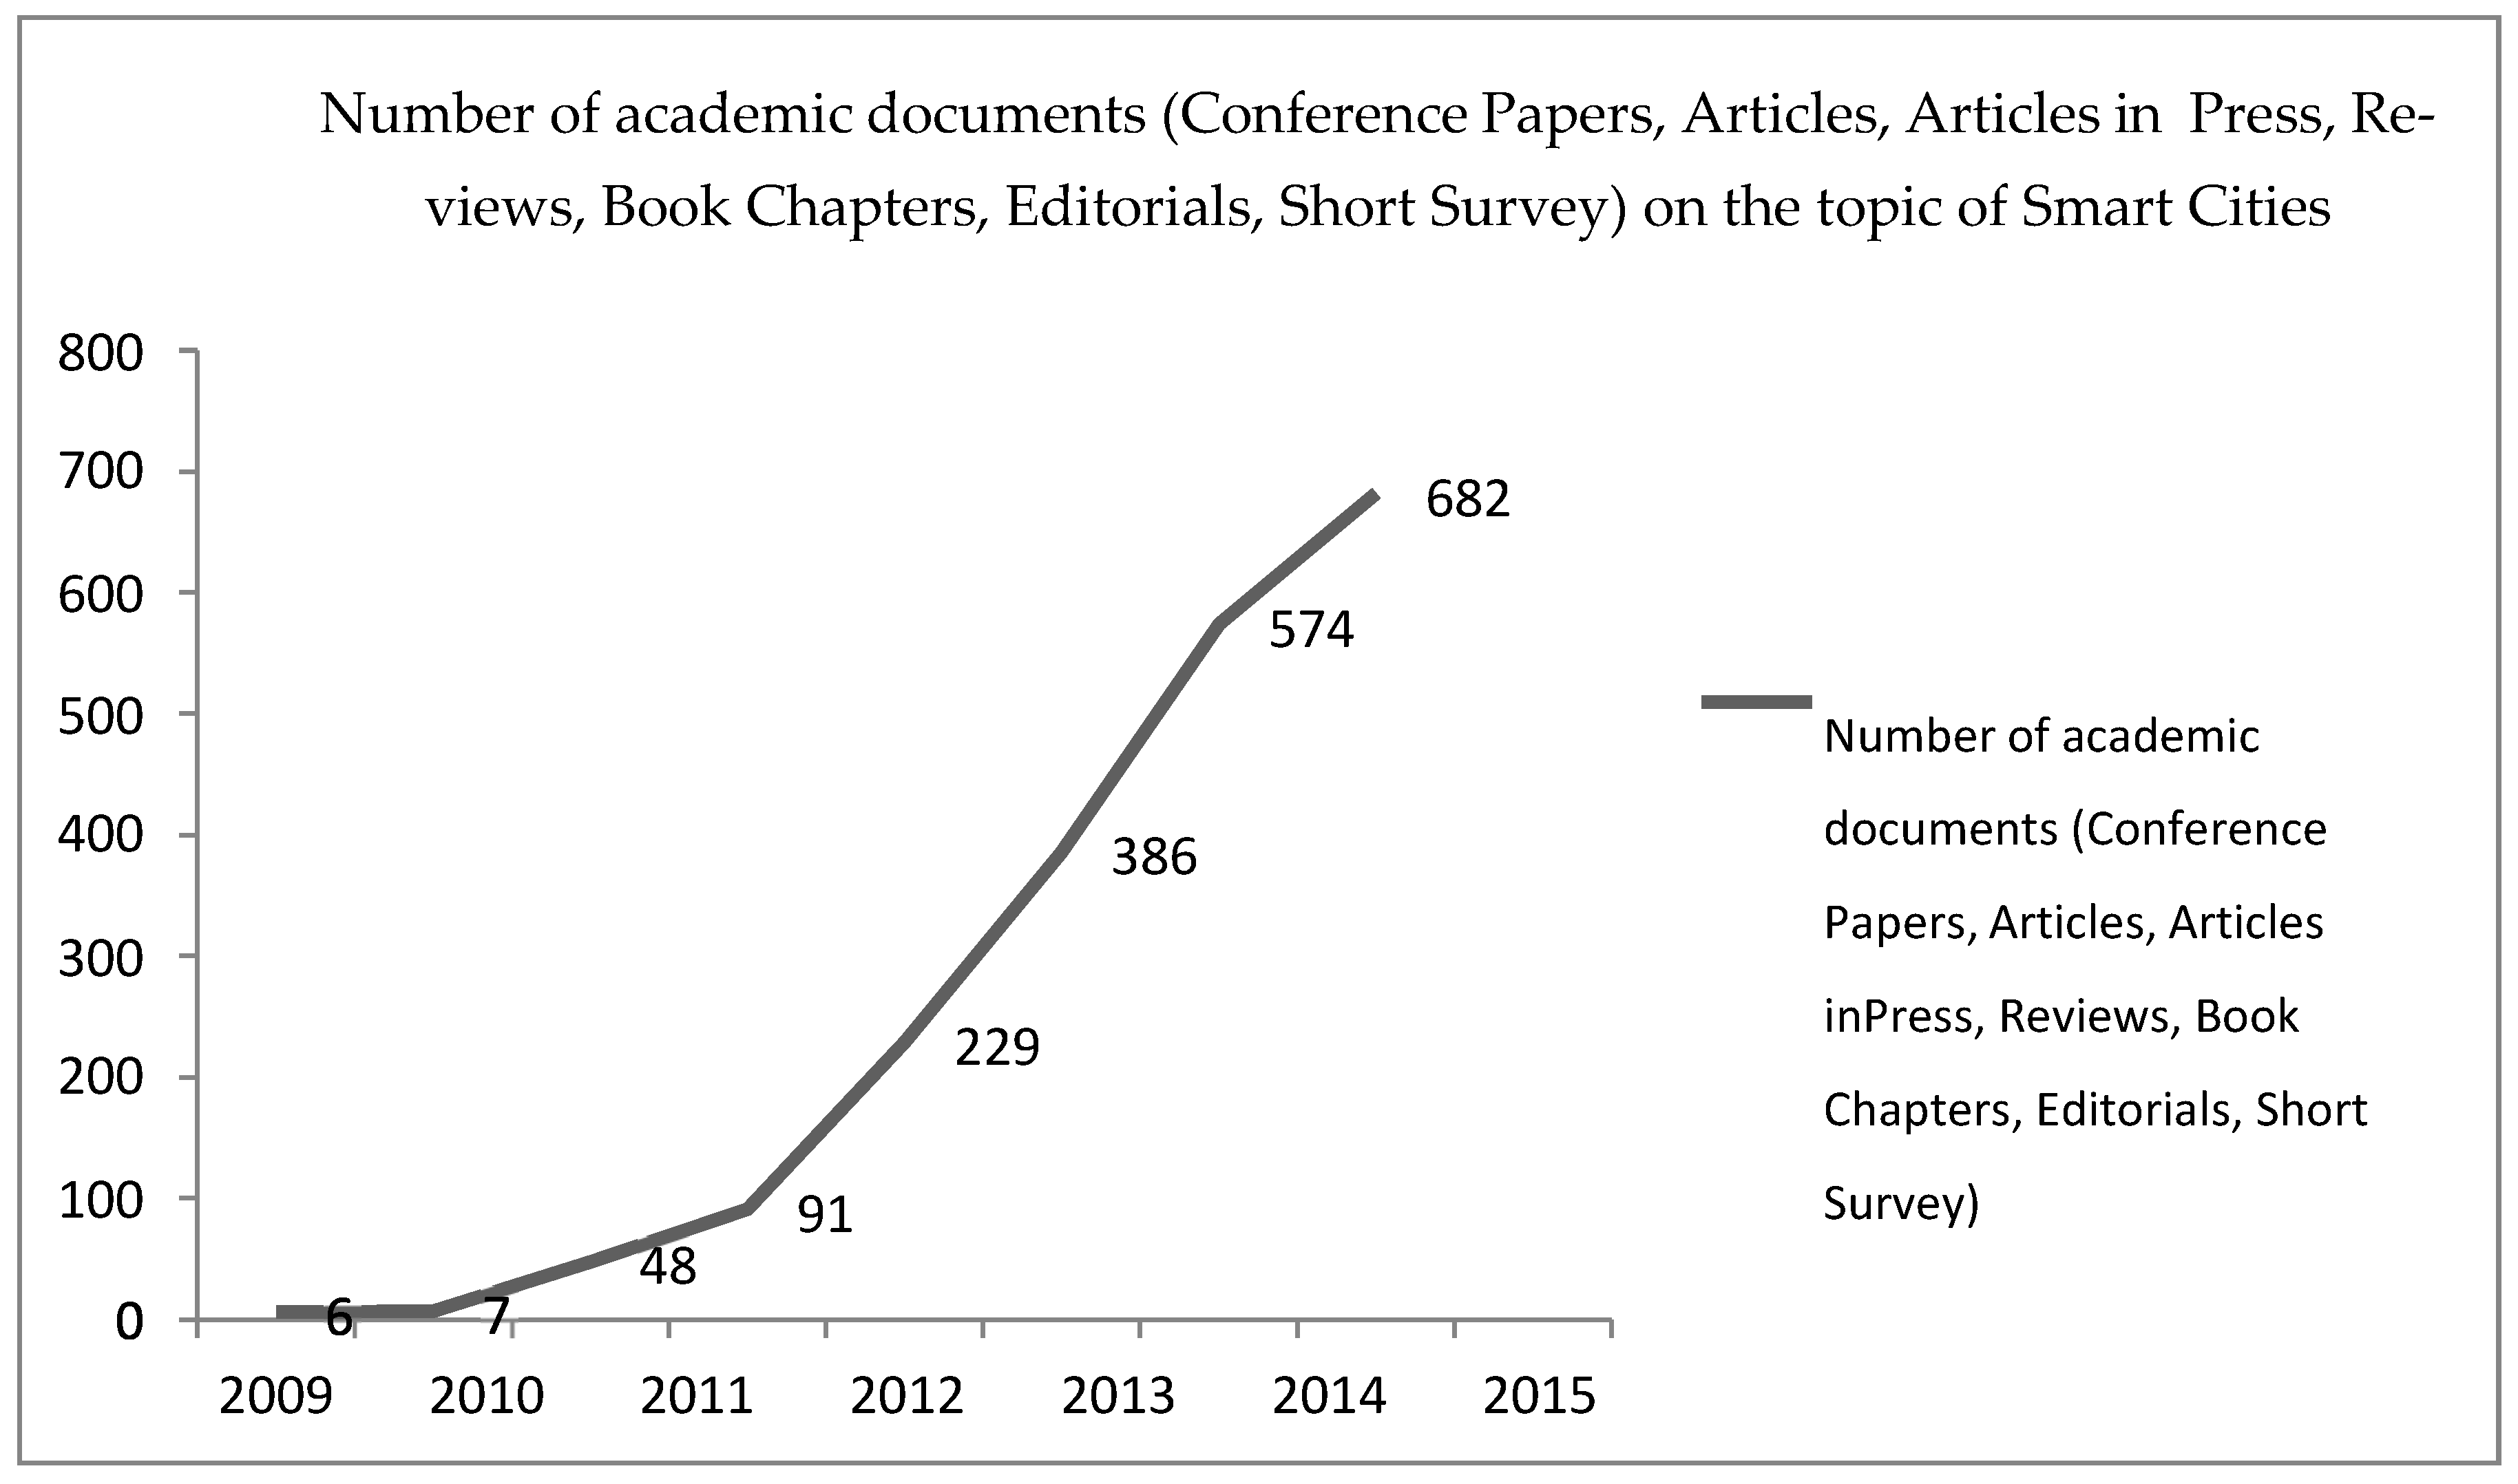
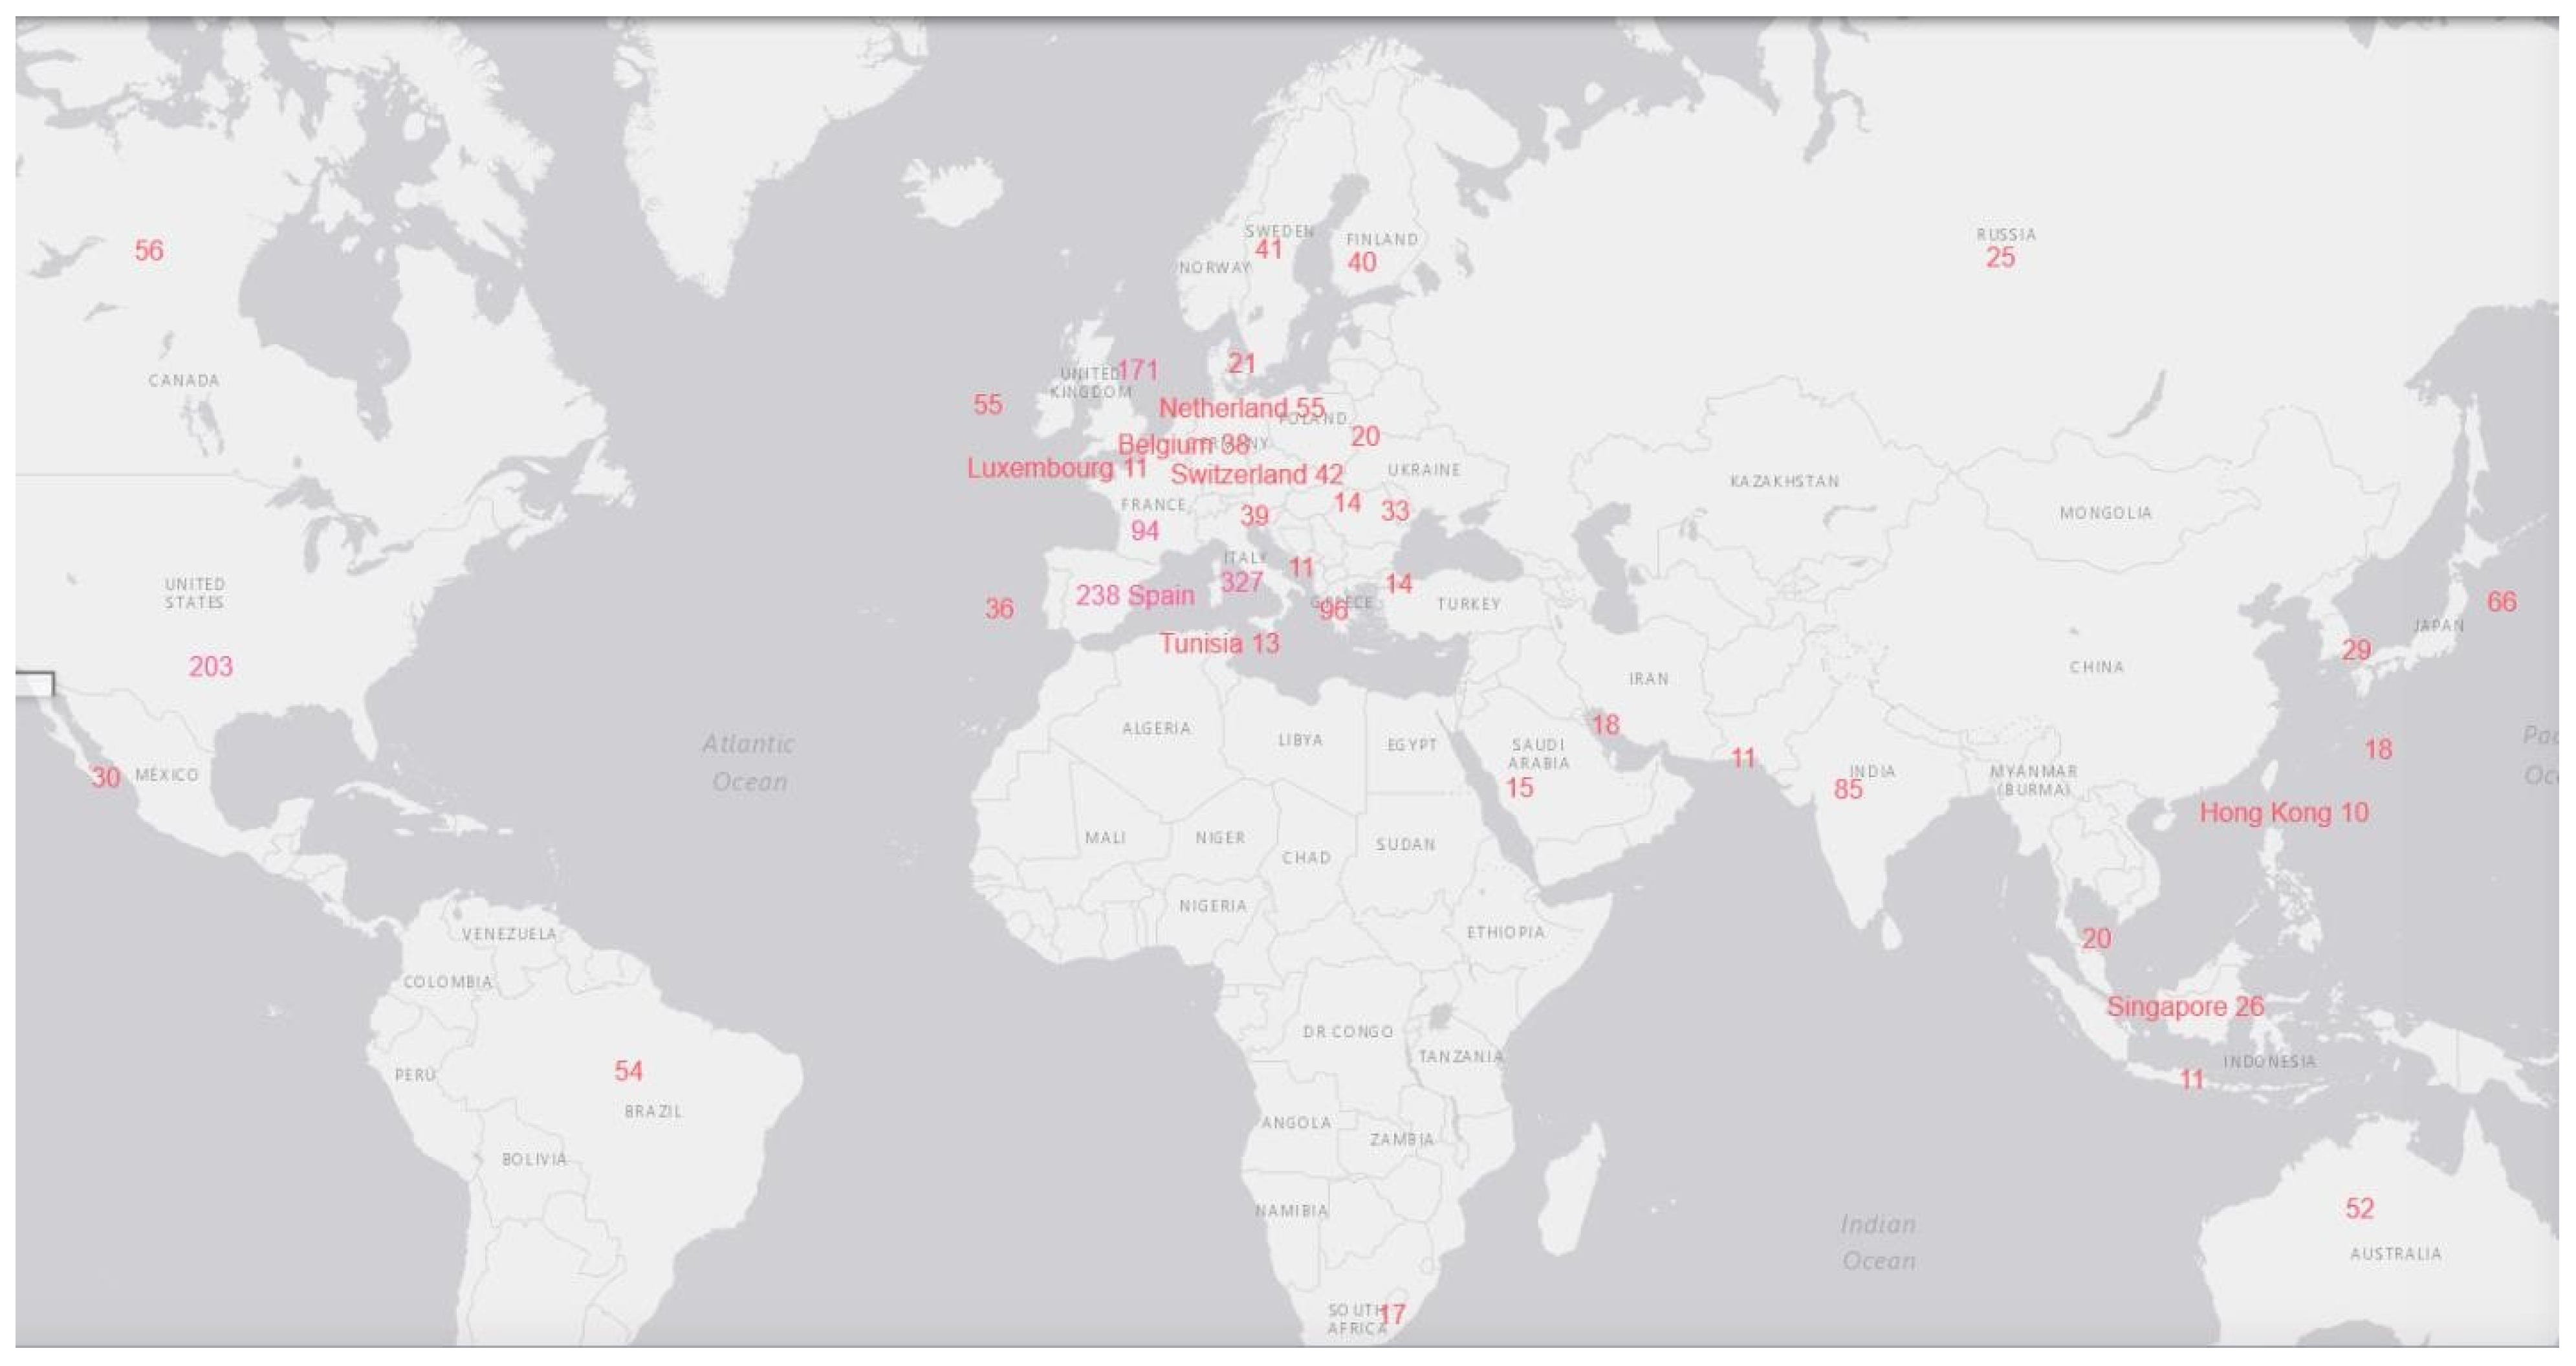
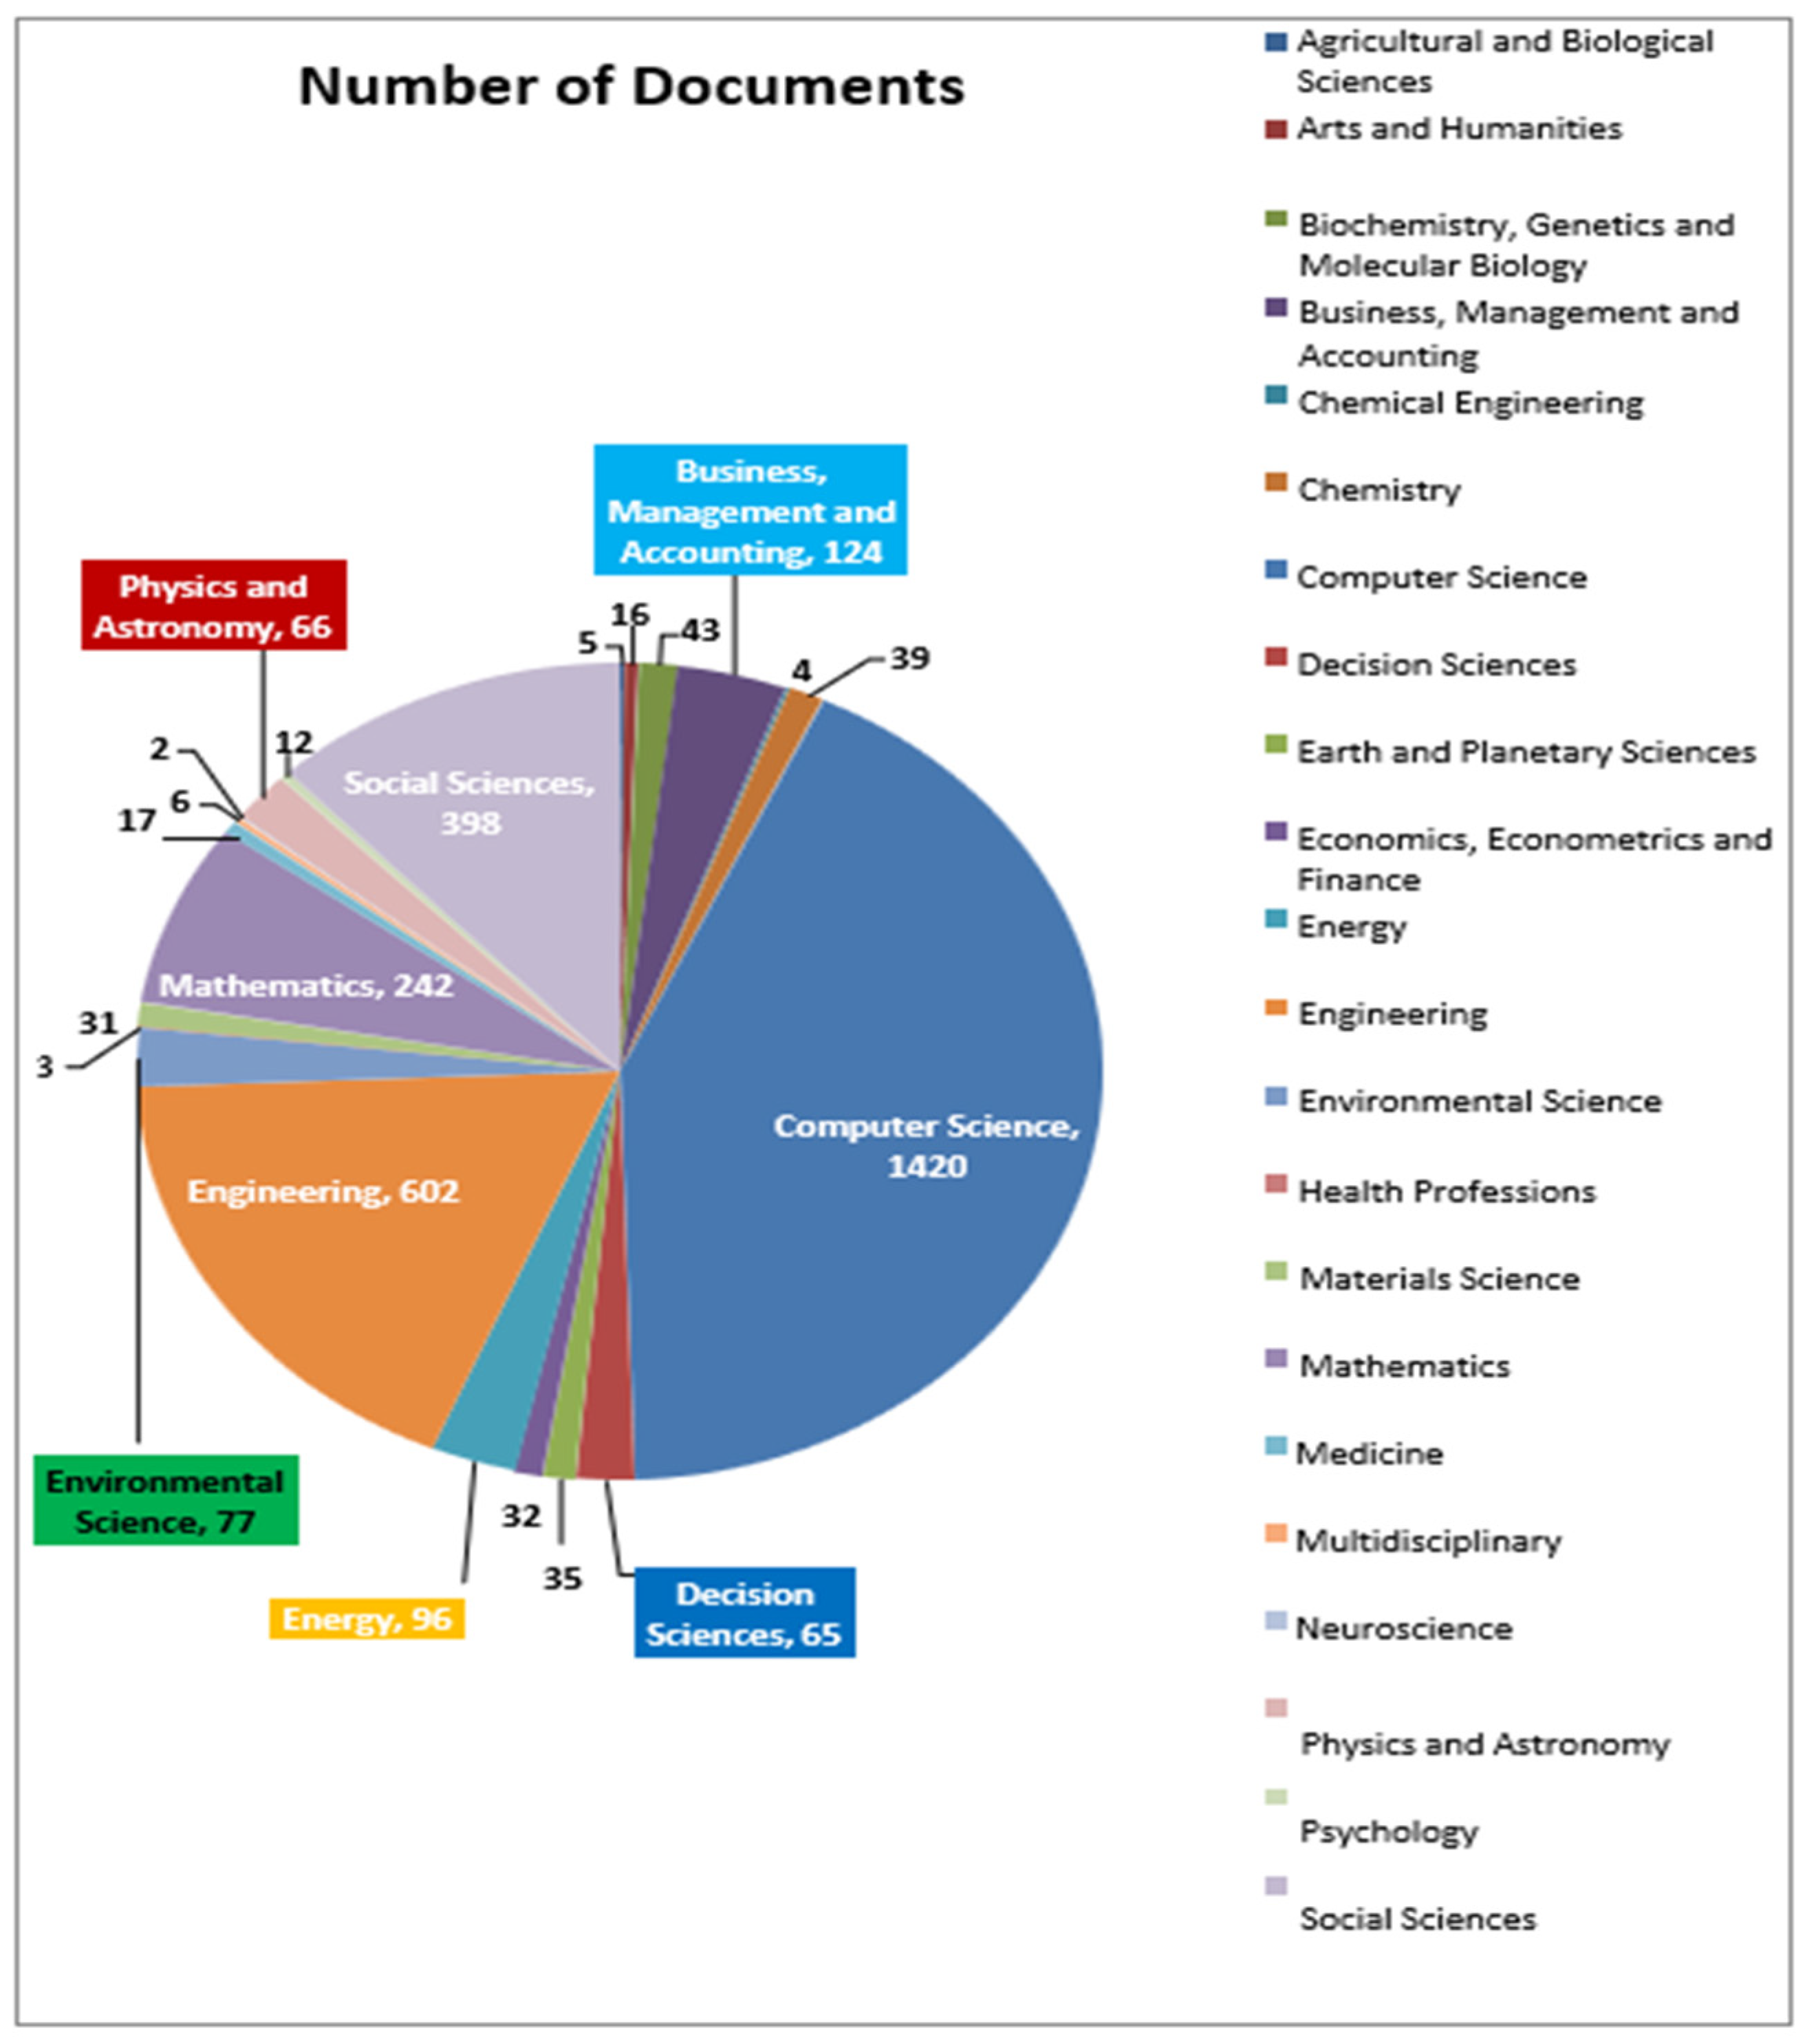
2.1. Systematic Literature Review on Smart Cities
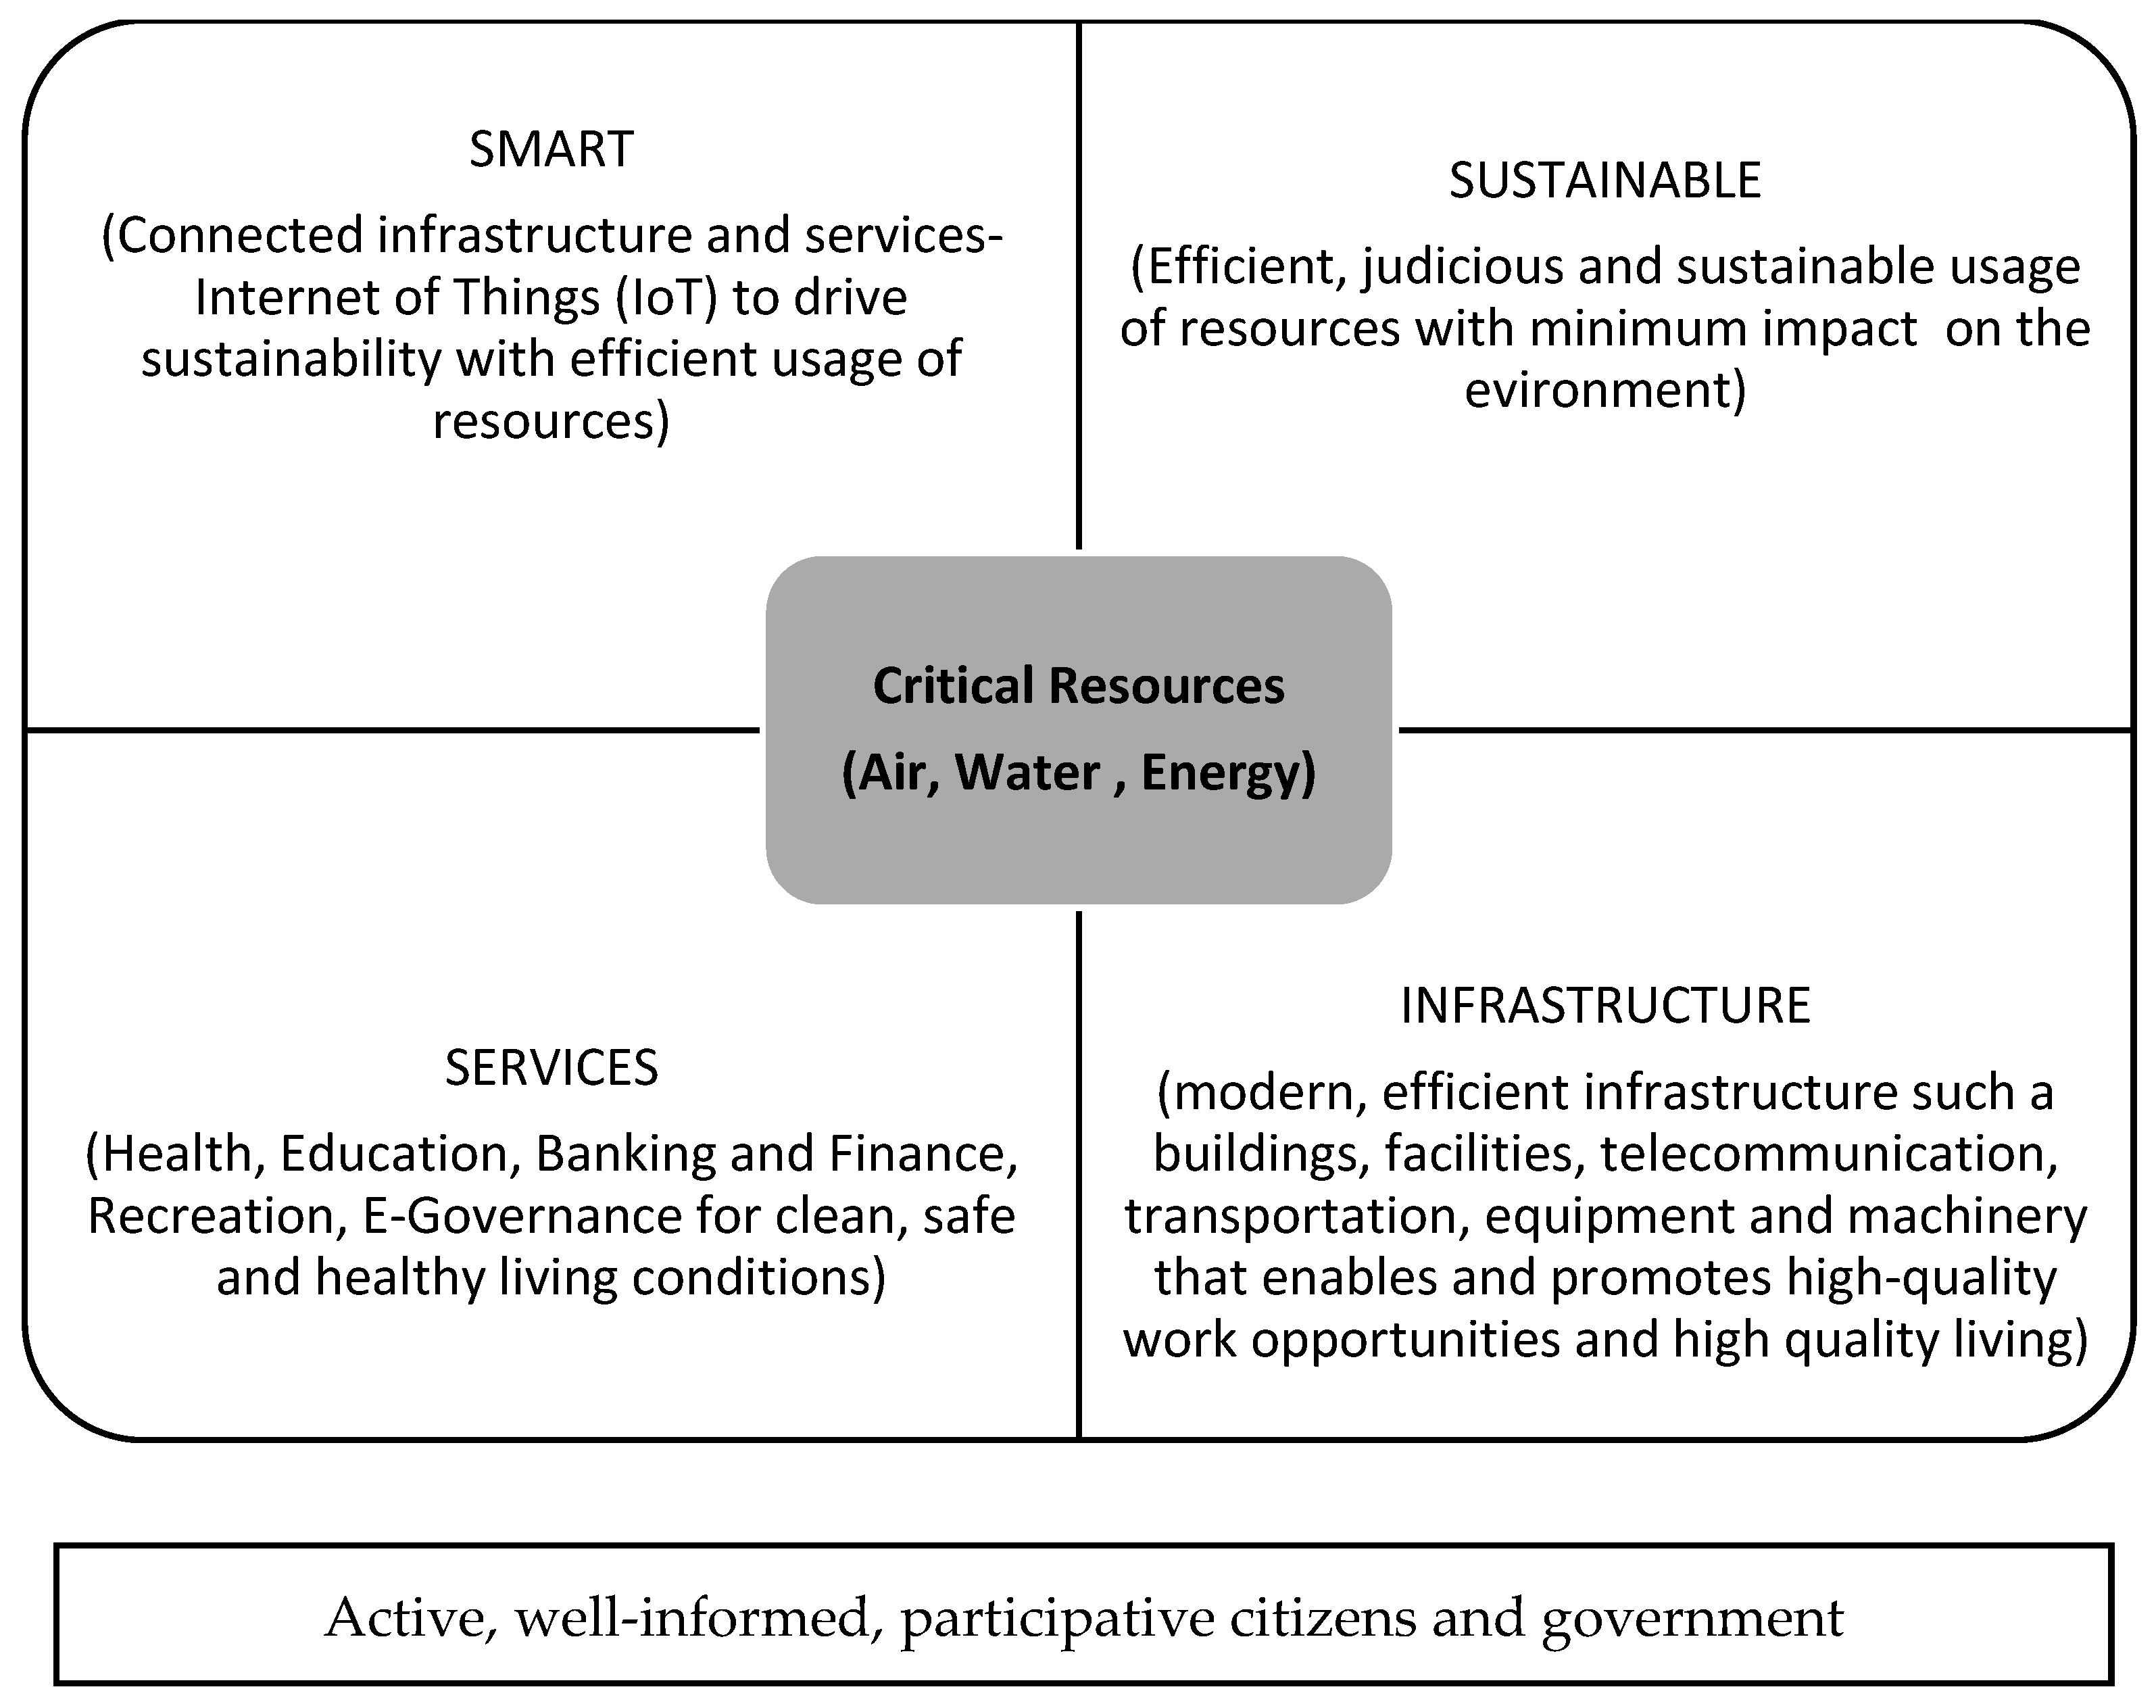
2.2. Definitions and Conceptual Framework of Smart Cities
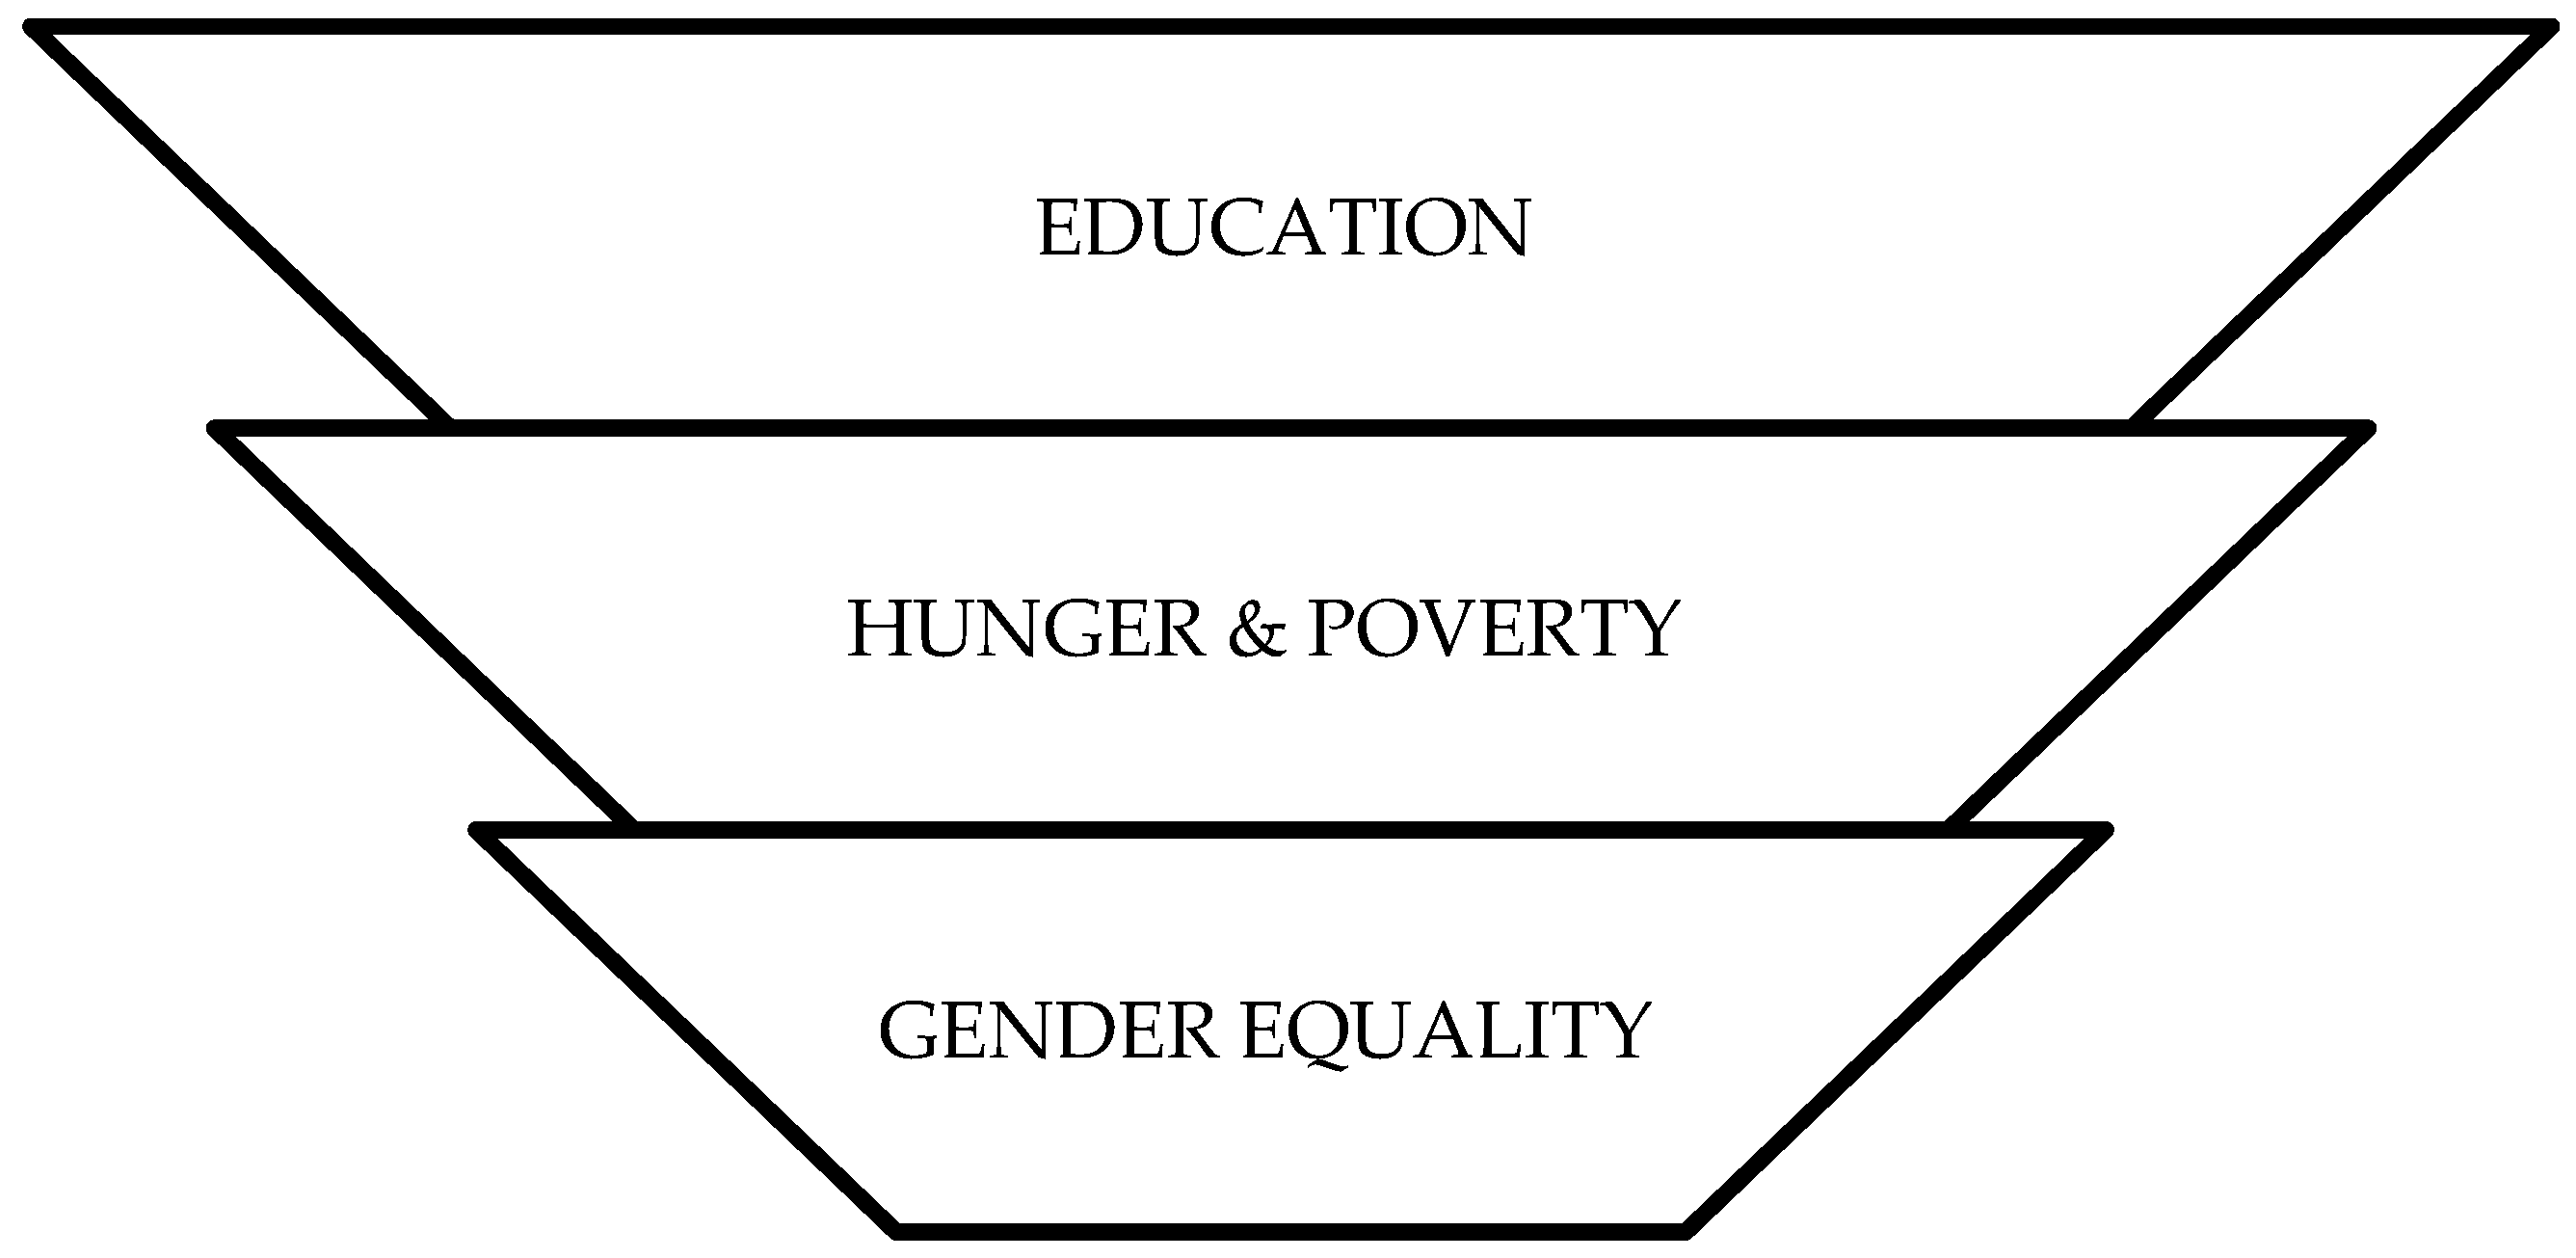
2.3. Role of Cities in Global Sustainability Agendas
- (1)
- Including a formal BWM methodology that reduces the inconsistency of comparison and is appropriate for situations where there is sparse expert opinion.
- (2)
- Clearly connecting prioritized issues to both national policy instruments and SDG sub-indicators, thus operationalizing the global-to-local policy linkage.
2.4. Role of Multinational Enterprises
2.5. Thematic Grouping and Critical Synthesis
- (1)
- Global trends and sustainable development: The difficulties posed by rapid industrialization, climate change, and socioeconomic inequality are highlighted in the early discussions [1,3,7]. These studies gave sustainable development agendas their start, but they did not have any specific guidelines for urban policy or private sector intervention. Although they provided data on global flood costs, they did not provide a structured framework for placing smart city initiatives in order of importance.
- (2)
- Frameworks and directions for action: The SDGs and the Paris Agreement gave us a planned way to deal with these problems [8]. However, these frameworks remained high-level and needed to be translated into city-level strategies that could be implemented. The Paris Agreement emphasized lowering greenhouse gas (GHG) emissions, but it did not explicitly link to specific smart city indicators that were relevant to local contexts.
- (3)
- Urbanization and economic factors: An examination of the economy, population, and emissions revealed that cities play a crucial role in driving economic expansion and greenhouse gas emissions [9,16,18]. Even though World Bank studies emphasized the significance of cities, they did not provide specific strategies for balancing economic growth with environmental sustainability. In addition, this does not take into account the urban poor, who make up more than 45% of the global population and are frequently left out of smart initiatives. Ref. [9] linked smart city themes to climate agreements like the Paris Accord but focused narrowly on carbon emissions, neglecting critical social dimensions such as health and sanitation. For example, [9] analyzed GHG emissions across income groups but omitted discussions on equitable resource distribution in urban contexts.
2.6. Gaps Addressed by This Study
- (1)
- Policy operationalization: The SDGs and climate agreements are recognized as important in the existing literature, but there are no concrete ways to turn these global goals into local smart city priorities. By using BWM to identify and prioritize specific smart city themes aligned with SDG targets and national action plans (such as water and sanitation, wastewater, and health), this study closes this gap.
- (2)
- Context-specific prioritization: Although global trends and economic factors are well documented, a deeper comprehension of localized policy drivers is required. To address this limitation, our study uses expert-driven decision-making to ensure that priorities reflect the city’s unique context and its stakeholders, contrasting global directives with local demands.
- (3)
- Structured decision-making for MNEs: Previous research has acknowledged the role of MNEs in the development of smart cities, but it has not offered a structured framework for their strategic intervention. Our research provides MNEs with a replicable and scalable model for identifying significant domains and areas of opportunity for contributing to the UN SDGs while taking into account resource disparity and equity. This is accomplished by employing the best–worst method (BWM). The BWM framework brings in methodological rigor and reduces subjectivity and enhances consistency, particularly under constraints of limited expert input.
3. Methodology
3.1. Research Motivation and Background
3.2. Research Questions
3.3. Research Objectives
- (1)
- To examine the role of cities in sustainable development, particularly their impact on climate mitigation and adaptation strategies.
- (2)
- To analyze the concept of “Smart Cities”, identifying key thematic areas and performance indicators relevant to sustainability.
- (3)
- To assess the prioritization of various smart city themes, applying a structured multi-criteria decision-making (MCDM) approach.
3.4. Research Scope and Methodology
3.4.1. Primary Data Collection:
3.4.2. Analytical Approach:
- (1)
- Social impact criteria.
- (2)
- Environmental impact criteria.
- (3)
- Economic impact criteria.
- (1)
- The relatively small sample size may limit broader generalizability.
- (2)
- Regional policy variations across smart cities may influence prioritization outcomes.
- (3)
- To improve robustness and cross-regional comparisons, future studies should take into account a larger, more diverse expert panel.
3.5. Best–Worst Multi-Criteria Decision-Making Method
- (1)
- Higher consistency: BWM requires fewer pairwise comparisons, reducing inconsistencies compared to AHP [13].
- (2)
- Improved decision-making efficiency: BWM generates more reliable rankings with fewer subjective biases, which is essential for strategic urban planning.
- (3)
- Better handling of small sample sizes: Given our expert-driven survey (n = 36 municipal officials), BWM is more suitable than statistical methods requiring larger datasets.
- Signifies equal importance/preference/priority.
- Signifies somewhere between equal and moderate importance/preference/priority.
- Signifies moderately more important/preferred/priority.
- Signifies somewhere between moderate and strong importance/preference/priority.
- Signifies strongly more important/preferred/priority.
- Signifies somewhere between strong and very strong importance/preference/priority.
- Signifies very strongly important/preferred/priority.
- Signifies somewhere between very strong and absolute importance/preference/priority.
- Signifies absolutely more important/preferred/priority.
- Min maxj {|wB/wj – αBj|, |wj/wW – αjW|}.
- Subject to: For all j, Ʃj wj = 1 (i.e., sum total of all weights = 1);
- and wj ≥ 0 (i.e., non-negative weights of all criteria).
- |wB/wj − αBj| ≤ ξ and |wj/wW − αjW| ≤ ξ.. Subject to: Ʃj wj = 1;
- and wj ≥ 0.
4. Results
4.1. Profile of the Respondents
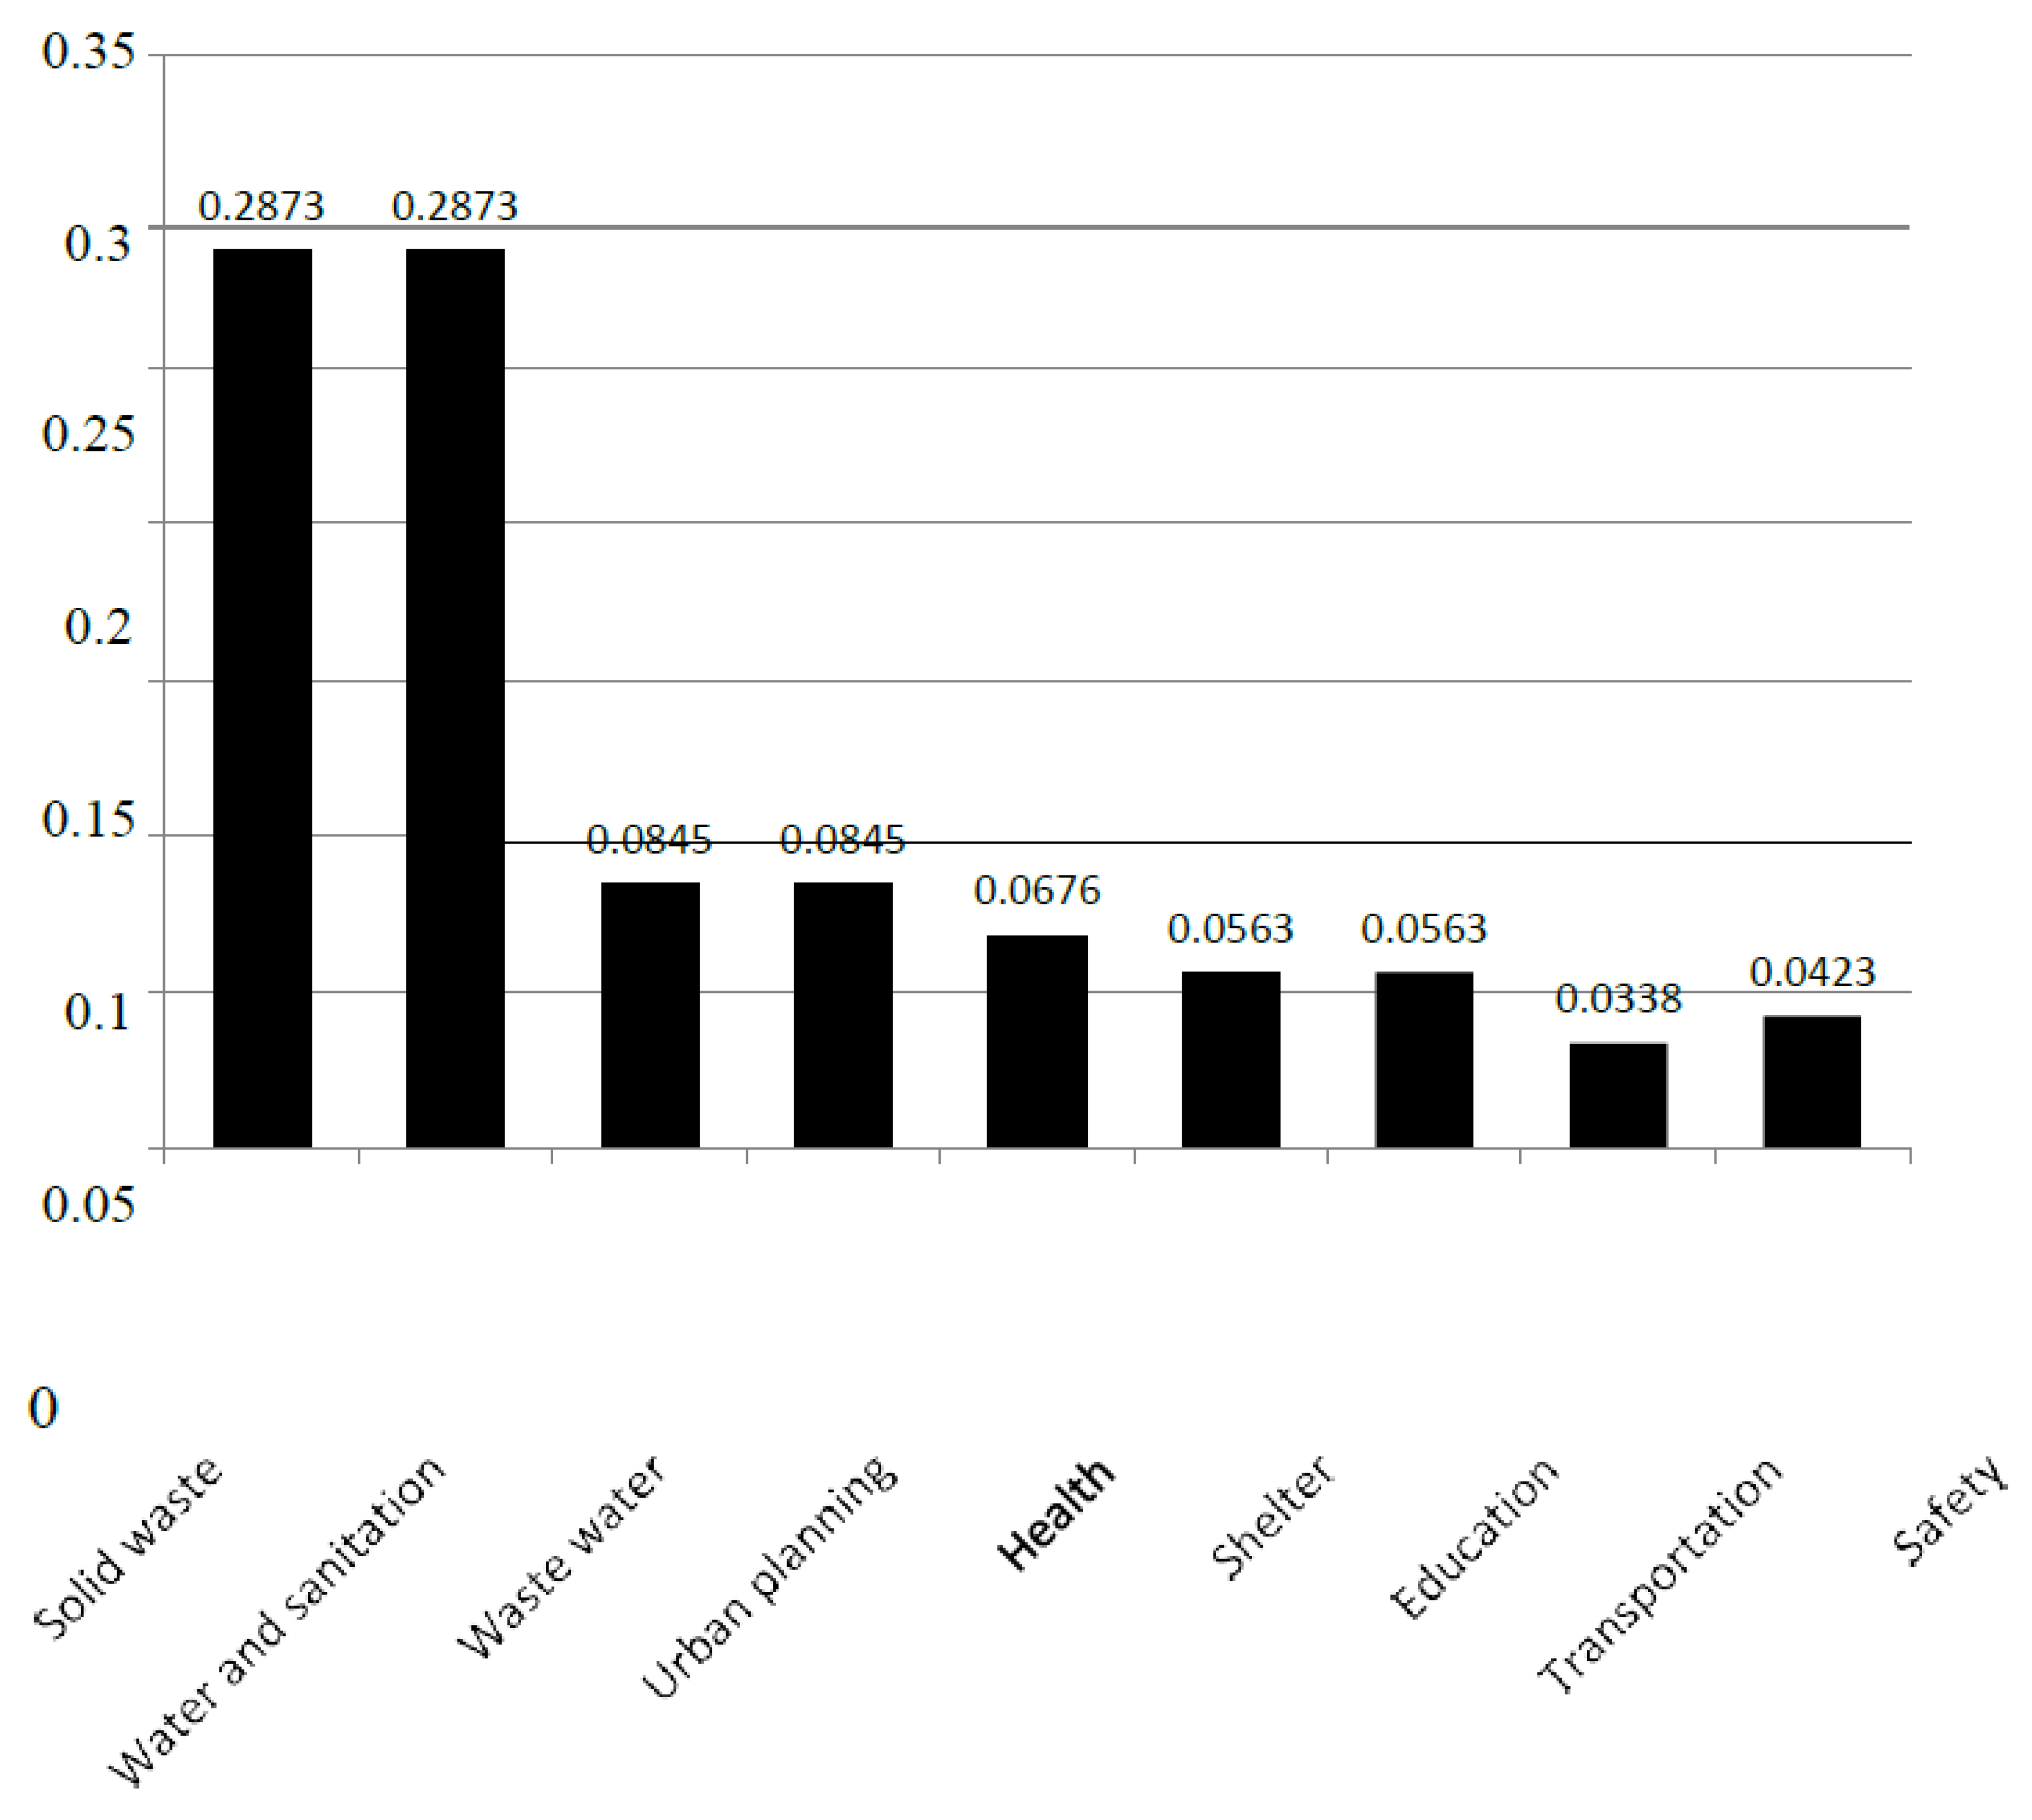
4.2. Analysis
5. Discussion
- Solid waste;
- Sanitation and water;
- Water waste;
- Transportation;
- Health;
- Shelter;
- Education;
- Urban planning;
- Security.
- (1)
- Expert bias and sampling constraints: The municipal officials surveyed may have put their professional focus on infrastructure, the environment, and economics over safety.
- (2)
- Comparative weighting against other indicators: The study’s results indicate that environmental resilience, governance efficiency, and mobility infrastructure were seen as more critical for sustainability impact.
- (3)
- Contextual factors: Some respondents viewed safety as an outcome of broader smart city policies (e.g., public surveillance, law enforcement integration, and digital governance) rather than an independent priority criterion.
6. Conclusions
6.1. Managerial Implications
- -
- António Guterres [44].
6.2. Practical Implications for Smart City Planning and Policy-Making
- (1)
- Strategic policy recommendations: Our prioritization results can guide urban planners and policymakers in allocating resources more effectively to high-impact areas.
- (2)
- MNE contributions to smart cities: The study reinforces the role of multinational enterprises (MNEs) in financing and implementing urban sustainability solutions, aligning with the SDGs.
- (3)
- Future research and policy applications: The findings encourage policymakers to consider regional variations, adaptive urban policies, and cross-sector collaborations to enhance the practical implementation of smart city frameworks.
- (4)
- MNEs can support smart solutions such as IoT-based waste tracking, decentralized water purification systems, and digital health dashboards, thereby operationalizing the SDGs through technology. They can play a vital role in public–private partnerships for water infrastructure and technology transfer programs for waste management. MNEs could collaborate with municipalities to deploy IoT-enabled water quality monitoring systems in Tier-2 cities. Tech firms might establish innovation hubs for frugal waste-to-energy solutions in partnership with local startups.
- (5)
- The high prioritization of themes such as solid waste and water/sanitation also reflects the alignment between local urban planning priorities and international climate targets under the Paris Agreement and SDG 11. This suggests potential synergies in financing, infrastructure development, and MNE involvement for operationalizing global sustainability frameworks at the city level.
6.3. Limitations and Future of the Study
Author Contributions
Funding
Institutional Review Board Statement
Informed Consent Statement
Data Availability Statement
Conflicts of Interest
References
- Sharma, N.; Agrawal, R. Environment Impact Assessment: Theory and Practices in South Asia—A Case of Indian Institute of Technology Roorkee, India (The Oldest Engineering Institute of Asia). In Proceedings of the ICRBS-2017, Roorkee, India, 16–27 December 2017. [Google Scholar]
- Kumar, S. Why Sustainability and Climate Change Is Everyone’s Business. 2014. Available online: https://mail.google.com/mail/u/0/#search/satish+kumar/p2?projector=1 (accessed on 9 March 2016).
- Hansen, J.; Ruedy, R.; Sato, M.; Lo, K. Global surface temperature change. Rev. Geophys. 2010, 48, 1–29. [Google Scholar] [CrossRef]
- Horsley, P.M.; Huang, A.R. The Aging Population and Falls: Consequences and Costs. In Medication-Related Falls in Older People; Adis: Cham, Switzerland, 2016; pp. 7–11. [Google Scholar]
- Hansen, J.; Kharecha, P.; Sato, M.; Masson-Delmotte, V.; Ackerman, F.; Beerling, D.J.; Hearty, P.J.; Hoegh-Guldberg, O.; Hsu, S.-L.; Rockstrom, J.; et al. Assessing “dangerous climate change”: Required reduction of carbon emissions to protect young people, future generations and nature. PLoS ONE 2013, 8, e81648. [Google Scholar] [CrossRef] [PubMed]
- Hallegatte, S.; Green, C.; Nicholls, R.J.; Corfee-Morlot, J. Future flood losses in major coastal cities. Nat. Clim. Change 2013, 3, 802–806. [Google Scholar] [CrossRef]
- Earthian, W. 2014. Available online: https://www.wipro.com/newsroom/press-releases/archives/wipro-launches-4th-edition-of-earthian--sustainability-education/#:~:text=Wipro%20Ltd.%20today%20announced%20the%20launch%20of,sustainability%20education%20program%20in%20schools%20and%20colleges (accessed on 30 November 2015).
- UN Documents Gathering a Body of Global Agreements. Our Common Future, From One Earth to One World. Available online: http://www.un-documents.net/ocf-ov.htm (accessed on 9 March 2016).
- World Bank Group. Word Bank Data 2015. Available online: https://data.worldbank.org/ (accessed on 31 August 2016).
- Guterres, A. A UN of the Future to Effectively Serve All Member States; Letter from the Secretary General to United Nations Member States. Available online: https://www.peacewomen.org/sites/default/files/A%20UN%20Of%20The%20Future%20To%20Effectively%20Serve%20All%20Member%20States.pdf (accessed on 31 May 2017).
- Ragazzo, L. Urban Development and The World Bank: Historical Perspective and Present-Day Programs. Master’s Thesis, Università Ca’Foscari Venezia, Venezia, Italy, 2021. [Google Scholar]
- Kola-Bezka, M.; Kuzel, M. Global Cities and Multinational Enterprises: Integrating the Existing Concepts for Future Research Studies. 2023. Available online: https://repozytorium.umk.pl/handle/item/6977 (accessed on 4 April 2025).
- NASSCOM. Catalyzing Change: Study of CSR Trends in the IT-BPM Sector: 2016–17; NASSCOM: Noida, India, 2017. [Google Scholar]
- Kramers, A.; Höjer, M.; Lövehagen, N.; Wangel, J. Smart sustainable cities–Exploring ICT solutions for reduced energy use in cities. Environ. Model. Softw. 2014, 56, 52–62. [Google Scholar] [CrossRef]
- Brundtland Commission. Report of the World Commission on Environment and Development; United Nations: New York, NY, USA, 1987. [Google Scholar]
- United Nations, Department of Economic and Social Affairs, Population Division (2014). World Urbanization Prospects: The 2014 Revision. Available online: https://esa.un.org/unpd/wup/publications/files/wup2014-report.pdf (accessed on 10 March 2018).
- Galka, M. What Trump and Hillary Spent vs Every General Election Candidate Since 1960. 2016. Available online: https://www.huffpost.com/entry/56-years-of-presidential-campaign-spending-how-2016_b_5820bf9ce4b0334571e09fc1 (accessed on 10 March 2018).
- Central Intelligence Agency (Ed.) The World Factbook 2007; Government Printing Office: Washington, DC, USA, 2007. [Google Scholar]
- Kazmi, A.A.; Vellanki, B.P. EIA Course Study -Civil Engineering Deptt., IIT Roorkee. 2014. [Google Scholar]
- World Bank Group. World Development Indicators 2014; World Bank Publications: Washington, DC, USA, 2014. [Google Scholar]
- Express, F. 13 Crore Population Across 98 Cities Which Is 35% of Urban Population Will Be Covered Under SmartCity Mission. 2015. Available online: https://indianexpress.com/article/business/business-others/plan-to-cover-35-of-urban-india-will-benefit-13-cr-people/ (accessed on 16 August 2016).
- Economy, N.C. Better Growth, Better Climate. The New Climate Economy Report; World Resources Institute (WRI), New Climate Economy: Washington, DC, USA, 2014. [Google Scholar]
- UN. United Nations General Assembly Draft Outcome Document of the United Nations Summit for the Adoption of the Post-2015 Development Agenda. Available online: https://digitallibrary.un.org/record/800852?ln=en&v=pdf (accessed on 25 September 2015).
- Colglazier, W. Sustainable development agenda: 2030. Science 2015, 349, 1048–1050. [Google Scholar] [CrossRef] [PubMed]
- ISO. SmartCities Report. 2014. Available online: http://www.iso.org/iso/smart_cities_report-jtc1.pdf (accessed on 31 August 2016).
- The Hindu. Centre Unveils List of 98 Smart Cities; UP, TN Strike It Rich. Available online: https://www.thehindu.com/news/national/Centre-releases-list-of-98-cities-for-Smart-City-project/article60492135.ece (accessed on 28 August 2015).
- Smart City Council. Definition and Overviews. 2014. Available online: https://smartcitiescouncil.com/ (accessed on 31 August 2016).
- Caragliu, A.; Del Bo, C.; Nijkamp, P. Smart Cities in Europe, Series Research Memoranda 0048; VU University Amsterdam, Faculty of Economics, Business Administration and Econometrics: Amsterdam, The Netherlands, 2009. [Google Scholar]
- URENIO. Intelligent City Platforms. Available online: https://www.urenio.org/ (accessed on 9 March 2016).
- Peris-Ortiz, M.; Bennett, D.; Yábar, D.P.B. (Eds.) Sustainable Smart Cities: Creating Spaces for Technological, Social and Business Development; Springer: Berlin/Heidelberg, Germany, 2016. [Google Scholar]
- Hollands, R.G. Will the real smart city please stand up? Intelligent, progressive or entrepreneurial? City 2008, 12, 303–320. [Google Scholar] [CrossRef]
- Ministry of Housing and Urban Affairs, Government of India. Smart Cities Mission. 2015. Available online: https://urbanschemes.up.in/Home/smart_city_mission (accessed on 3 August 2016).
- SmartCities.gov.in. Available online: http://smartcities.gov.in/ (accessed on 21 September 2016).
- UK Government Department for Business, Innovation and Skills. “Smart Cities–Background Paper” (PDF); UK Government Department for Business, Innovation and Skills: London, UK, 2013. [Google Scholar]
- Government of India–Ministry of Urban Development. “Draft Concept Note on Smart City Scheme” (PDF). Available online: https://smartcities.gov.in/themes/habikon/files/SmartCityGuidelines.pdf (accessed on 31 August 2015).
- Department for Business Innovation and Skills. Smart Cities Background Paper. 2013. Available online: https://assets.publishing.service.gov.uk/government/uploads/system/uploads/attachment_data/file/246019/bis-13-1209-smart-cities-background-paper-digital.pdf (accessed on 30 May 2015).
- Ministry of Urban Development, GOI. “Mission Statement and Guidelines–Smart Cities” (PDF). Available online: http://164.100.161.224/upload/uploadfiles/files/SmartCityGuidelines(1).pdf (accessed on 1 February 2016).
- Smart City–Definition. Available online: https://www.emerald.com/insight/content/doi/10.1108/09504120910935183/full/html (accessed on 31 August 2015).
- Glaeser, E.L.; Berry, C.R. Why Are Smart Places Getting Smarter; Rappaport Institute/Taubman Center Policy Brief: Cambridge, MA, USA, 2006; Volume 2. [Google Scholar]
- McIntyre, J.R.; Ivanaj, S.; Ivanaj, V. (Eds.) Strategies for Sustainable Technologies and Innovations; Edward Elgar Publishing: Cheltenham, UK, 2013. [Google Scholar]
- Dogar, M.I.; Álvarez, G. National Model United Nations. In Proceedings of the NMUN Galapagoc 2024, San Cristóbal Island, Ecuador, 22 November–1 December 2024. [Google Scholar]
- Morteza, A.; Chou, R.A. Distributed Matrix Multiplication: Download Rate, Randomness and Privacy Trade-Offs. In Proceedings of the 2024 60th Annual Allerton Conference on Communication, Control, and Computing, Urbana, IL, USA, 24–27 September 2024; pp. 1–7. [Google Scholar]
- Rezaei, J. Best-worst multi-criteria decision-making method: Some properties and a linear model. Omega 2016, 64, 126–130. [Google Scholar] [CrossRef]
- The World Population Prospects: 2015 Revision. Available online: https://www.un.org/ (accessed on 6 May 2017).


| Sr. No. | City | Country | Continent | Estimated Annual Flood Cost (Billion USD) |
|---|---|---|---|---|
| 1 | Miami | USA | North America | 2.50 |
| 2 | New York | USA | North America | 2.00 |
| 3 | New Orleans | USA | North America | 1.80 |
| 4 | Tampa | USA | North America | 0.85 |
| 5 | Boston | USA | North America | 0.79 |
| 6 | Guayaquil | Ecuador | South America | 3.10 |
| 7 | Abidjan | Cote d’lvoire | Africa | 1.00 |
| 8 | Mumbai | India | Asia | 6.40 |
| 9 | Kolkata | India | Asia | 3.30 |
| 10 | Chennai | India | Asia | 0.93 |
| 11 | Surat | India | Asia | 0.92 |
| 12 | Jakarta | Indonesia | Asia | 1.70 |
| 13 | Ho Chi Minh City | Vietnam | Asia | 1.90 |
| 14 | Bangkok | Thailand | Asia | 0.73 |
| 15 | Guangzhou | China | Asia | 13.20 |
| 16 | Shenzhen | China | Asia | 3.10 |
| 17 | Tianjin | China | Asia | 2.20 |
| 18 | Zhanjiang | China | Asia | 0.89 |
| 19 | Xiamen | China | Asia | 0.72 |
| 20 | Nagoya | Japan | Asia | 0.64 |
| Low-Income Countries USD 1035 or Less GNI/Capita 36 Countries ~0.9 Billion People | Middle-Income Countries USD 1035–12,616 GNI/ Capita 103 Countries ~4.9 Billion People | High-Income Countries USD 12,616 or More GNI/Capita 74 Countries ~1.3 Billion People | |
|---|---|---|---|
| Top 10 most populous, ordered by GNI Per Capita in 2012 Current USD | 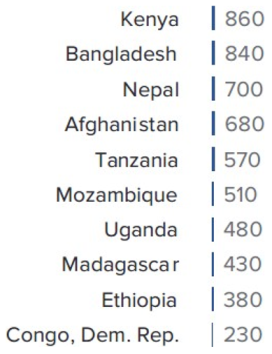 |  | 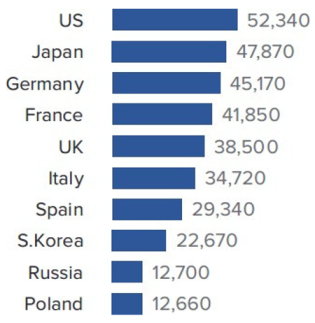 |
| Share of world GDP in 2012 |  | 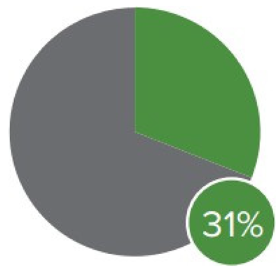 |  |
| Share of world GHG emissions in 2010 excluding LUCF |  | 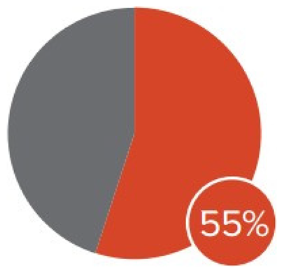 |  |
| Sr. No. | Importance | Source |
|---|---|---|
| 1 |
| [20,22] |
| 2 |
| [16,23] |
| 3 | There is a close resemblance between the population density map and gross domestic product (GDP) density map, indicating that dense human settlements are the predominant centers of economic activity. | [18] |
| 4 |
| [24] |
| 5 | A smart and sustainable city can be understood as one that leverages information and communication technologies (ICT) and related innovations to enhance the quality of life of its residents, streamline urban operations and service delivery, and foster economic competitiveness. At the same time, it remains committed to addressing the long-term needs of both current and future populations across economic, social, environmental, and cultural dimensions. | [25,26,27] |
| 6 | A city is considered ‘smart’ when it strategically integrates investments in human and social capital along with both conventional infrastructure—such as energy and transportation—and advanced digital technologies. This integration supports sustainable economic progress, enhances residents’ quality of life, and promotes responsible natural resource management, all while fostering active citizen participation and collaborative governance. | [28] |
| 7 |
| [29] |
| 8 | There is a significant role of quality of life and sustainability in the creation and management of smart cities. | [30] |
| 9 | Nearly 50% of the global population is concentrated on only about 1% of the Earth’s land surface. | [17] |
| 10 | Real smart cities will have to take much greater risks with technology, devolve power, tackle inequalities, and redefine what they mean by the term smart itself if they want to retain such a lofty title. | [31] |
| 11 | At the United Nations General Assembly in September 2015, Prime Minister Narendra Modi reiterated India’s commitment to achieving the Sustainable Development Goals (SDGs). He emphasized the vision of transforming Indian cities into engines of inclusive growth—smart, sustainable, and livable—by the year 2030. This declaration echoed earlier national goals aimed at eradicating poverty and ensuring universal access to housing and essential urban services within the first half of the decade. | [32,33] |
| 12 | Under India’s Smart City Mission, 130 million Indians, which is about 35% of the urban population of India, spread across 98 cities, shall be covered. | [21] |
| Sr. No. | Concept/Definition of a Smart City | Source |
|---|---|---|
| 1 | The idea of a smart city is dynamic and evolving; it lacks a fixed definition or final destination. Instead, it represents an ongoing journey or set of stages through which cities enhance their livability, resilience, and ability to adapt more effectively to emerging challenges. | [34] |
| 2 | Although one might view a city’s infrastructure and services, reflecting citizens’ aspirations, as a basic requirement for it to be considered “smart”, urban planners strive to enhance the entire urban ecosystem. This holistic approach is framed around four key pillars of development: institutional, physical, social, and economic infrastructure. | [35] |
| 3 |
| [36] |
| 4 | A smart city integrates technology, government, and society to foster several key features: smart economy, smart mobility, smart environment, smart people, smart living, and smart governance. It is a developed urban area that promotes sustainable economic growth and enhances the quality of life by excelling in sectors such as economy, mobility, environment, people, living conditions, and governance. | [37] |
| 5 | A smart city is an advanced urban area that fosters sustainable economic growth and enhances the quality of life by excelling in several key sectors, including the economy, mobility, environment, community, living conditions, and governance. | [38] |
| 6 | A smart city embeds digital technology throughout its functions to improve efficiency and services. It also ensures sustainability in economic activities and job creation, providing opportunities for a diverse range of residents, irrespective of their education, skills, or income levels. | [27] |
| 7 | A smart city is one which offers sustainability in terms of economic activities and employment opportunities to a wide section of its residents, regardless of their level of education, skills, or income level. | [25] |
| 8 | A city is considered ‘smart’ when investments in human and social capital, along with both traditional infrastructure (like electricity and transport) and modern communication technologies (ICT), drive sustainable economic progress and a high quality of life. This is achieved through the wise management of natural resources and active community involvement. | [28] |
| Sr. No. | Indicators | Sr. No. | Indicators |
|---|---|---|---|
| 1 | Water and Sanitation | 10 | Environment |
| 2 | Urban Planning | 11 | Safety |
| 3 | Solid Waste | 12 | Energy |
| 4 | Transportation | 13 | Recreation |
| 5 | Wastewater | 14 | Governance |
| 6 | Shelter | 15 | Economy |
| 7 | Health | 16 | Telecommunication and Innovation |
| 8 | Education | 17 | Fire and Emergency Response |
| 9 | Finance |
| S. No. | Technique | Key Features | Limitations | Advantages of BWM Over This Technique |
|---|---|---|---|---|
| 1. | AHP (Analytic Hierarchy Process) | Widely used; intuitive; based on pairwise comparisons | High number of comparisons; inconsistent judgments | BWM requires fewer comparisons (2n – 3 vs. n(n – 1)/2), yields higher consistency |
| 2. | TOPSIS (Technique for Order of Preference by Similarity to Ideal Solution) | Ranks alternatives based on distance from ideal solution | Requires normalization; sensitive to scale | BWM focuses on deriving reliable weights, does not require complex normalization |
| 3. | ANP (Analytic Network Process) | Considers interdependencies among criteria | Computationally intensive; complex for small samples | BWM is simpler and more practical for problems with fewer experts or limited data |
| 4. | VIKOR (VIseKriterijumska Optimizacija I Kompromisno Resenje) | Compromise solution approach; useful when decision-maker wants trade-offs | Sensitive to weight assignment; requires normalization | BWM derives weights based on actual expert preferences, increasing transparency |
| 5. | ELECTRE | Suitable for outranking problems with qualitative data | Difficult to interpret; complex for large datasets | BWM is more intuitive, transparent, and easier to explain to stakeholders |
| Sr. No. | Designation | Percentage of the Respondents |
|---|---|---|
| 1 | Assistant Executive Engineer | 33% |
| 2 | Assistant Engineer | 11% |
| 3 | Executive Engineer | 33% |
| 4 | Health Officer | 4% |
| 5 | Municipal Engineer | 4% |
| 6 | Sanitary Inspector | 7% |
| 7 | Sanitary Officer | 4% |
| 8 | Superintending Engineer | 4% |
| Sr. No. | Smart City Theme | Average (x) | Z-Score = x − μ σ | Rank |
|---|---|---|---|---|
| 1 | Solid Waste | 87.7778 | 1.6289 | 1 |
| 2 | Water and Sanitation | 87.4444 | 1.5786 | 2 |
| 3 | Wastewater | 83.6296 | 1.0033 | 3 |
| 4 | Urban Planning | 83.1481 | 0.9307 | 4 |
| 5 | Health | 81.8519 | 0.7352 | 5 |
| 6 | Shelter | 80.9630 | 0.6012 | 6 |
| 7 | Education | 80.9259 | 0.5956 | 7 |
| 8 | Transportation | 80.0000 | 0.4559 | 8 |
| 9 | Safety | 78.8889 | 0.2884 | 9 |
| 10 | Environment | 75.7407 | −0.1864 | 10 |
| 11 | Finance | 74.8148 | −0.3260 | 11 |
| 12 | Energy | 74.0741 | −0.4377 | 12 |
| 13 | Governance | 70.963 | −0.9069 | 13 |
| 14 | Telecommunication and Innovation | 70.3704 | −0.9963 | 14 |
| 15 | Recreation | 69.4444 | −1.1359 | 15 |
| 16 | Economy | 66.6667 | −1.5548 | 16 |
| 17 | Fire and Emergency Response | 65.9259 | −1.6665 | 17 |
| Grand Mean (μ) | 76.9766 | |||
| Standard Deviation (σ) | 6.6310 | |||
| People: Social Impact/Development Related Criteria | Planet: Environment Impact/Development Related Criteria |
|---|---|
|
|
| Criteria | Solid Waste | Water and Sanitation | Wastewater | Urban Planning | Health | Shelter | Education | Transportation | Safety |
|---|---|---|---|---|---|---|---|---|---|
| Best Criterion: Solid Waste | 1 | 1 | 4 | 4 | 5 | 6 | 6 | 7 | 8 |
| Criteria | Worst Criteria: Safety |
|---|---|
| Solid waste | 8 |
| Water and sanitation | 7 |
| Wastewater | 4 |
| Urban planning | 4 |
| Health | 3 |
| Shelter | 2 |
| Education | 2 |
| Transportation | 1 |
| Safety | 1 |
| Criteria | Optimal Weights | Ksi* (ξ*) |
|---|---|---|
| Solid waste | 0.2873 | 0.0507 |
| Water and sanitation | 0.2873 | |
| Wastewater | 0.0845 | |
| Urban planning | 0.0845 | |
| Health | 0.0676 | |
| Shelter | 0.0563 | |
| Education | 0.0563 | |
| Transportation | 0.0338 | |
| Safety | 0.0422 |
| Sr. No. | International (ISO 37120:2014) Themes | Core and Supporting Indicators | India (GoI MoUD Smart City Mission) Core Infrastructure Elements |
|---|---|---|---|
| 1. | Water and Sanitation | Percentage of the city population with potable water supply service, percentage of the city population with sustainable access to an improved water source, percentage of the population with access to improved sanitation, percentage of the city’s wastewater receiving secondary treatment, and total domestic water consumption per capita (liters/day). | Adequate water supply (smart solution—smart meters and management, leakage identification, preventive main., water quality monitoring |
| 2. | Wastewater | Percentage of the city population served by wastewater collection, percentage of the city’s wastewater that has received no treatment, percentage of the city’s wastewater receiving primary treatment, percentage of the city’s wastewater receiving secondary treatment, and percentage of the city’s wastewater receiving tertiary treatment. | Wastewater to be treated |
| 3. | Health | Average life expectancy, No. of in-patient hospital beds per 100,000 population, No. of physicians per 100,000 population, under-age-five mortality per 1000 live births, No. of nursing and midwifery personnel per 100,000 population, No. of mental health practitioners per 100,000 population, and suicide rate per 100,000 population. | [43] |
| Smart City Theme | Relevant SDG 11 Target | Indicator/Example |
|---|---|---|
| Solid Waste | 11.6: Reduce environmental impact of cities | Proportion of urban solid waste regularly collected |
| Water and Sanitation | 11.1: Access to basic services | Percentage of the population with safe drinking water and improved sanitation |
| Wastewater | 11.5: Reduce disaster-related losses | Improved drainage and flood-resilient sanitation |
| Urban Planning | 11.3: Inclusive and sustainable urbanization | Urban expansion planning policies |
| Health | 11.7: Access to safe, inclusive spaces | Urban health infrastructure linked to pollution reduction |
Disclaimer/Publisher’s Note: The statements, opinions and data contained in all publications are solely those of the individual author(s) and contributor(s) and not of MDPI and/or the editor(s). MDPI and/or the editor(s) disclaim responsibility for any injury to people or property resulting from any ideas, methods, instructions or products referred to in the content. |
© 2025 by the authors. Licensee MDPI, Basel, Switzerland. This article is an open access article distributed under the terms and conditions of the Creative Commons Attribution (CC BY) license (https://creativecommons.org/licenses/by/4.0/).
Share and Cite
Sharma, N.; Kumar, R.; Vihari, N.S.; Arora, M.; Saini, J.R. Prioritizing Smart City Themes for Multi-National Enterprises and United Nations Sustainable Development Goals. Sustainability 2025, 17, 4251. https://doi.org/10.3390/su17104251
Sharma N, Kumar R, Vihari NS, Arora M, Saini JR. Prioritizing Smart City Themes for Multi-National Enterprises and United Nations Sustainable Development Goals. Sustainability. 2025; 17(10):4251. https://doi.org/10.3390/su17104251
Chicago/Turabian StyleSharma, Neeraj, Rupesh Kumar, Nitin Simha Vihari, Madhu Arora, and Jatinderkumar R. Saini. 2025. "Prioritizing Smart City Themes for Multi-National Enterprises and United Nations Sustainable Development Goals" Sustainability 17, no. 10: 4251. https://doi.org/10.3390/su17104251
APA StyleSharma, N., Kumar, R., Vihari, N. S., Arora, M., & Saini, J. R. (2025). Prioritizing Smart City Themes for Multi-National Enterprises and United Nations Sustainable Development Goals. Sustainability, 17(10), 4251. https://doi.org/10.3390/su17104251