1. Introduction
In recent years, the international call for green and low-carbon development has become increasingly loud, and China has increasingly emphasized the harmonious coexistence between humanity and nature. At the 75th session of the UN General Assembly, China officially put forward the goal of “dual carbon”, which is China’s commitment to protect the environment and safeguard clean earth, and reflects China’s responsibility as a major country in building a community with a shared future for mankind. Carbon neutrality should be incorporated into the socialist modernization strategy [
1].
As a clean and sustainable energy source, renewable energy plays an indispensable role in achieving the “two-carbon” goal and driving economic development. Renewable energy mainly includes wind energy, water energy, solar energy, biomass energy, etc. For example, the construction of power generation windmills on open high mountains and plateaus and hydroelectric power stations on large rivers are all development and utilization methods of renewable energy. The construction of these power generation facilities needs to adapt to local conditions, and most of them need to convert kinetic energy and gravitational potential energy into electric energy with the help of the natural geographical environment to achieve clean and efficient production of energy.
With the improvement of human society’s living standards, the continuous progress of science and technology, and the enhancement of environmental protection awareness, renewable energy, as a green, low-carbon and renewable energy, can not only alleviate the current energy shortage problem but also play a vital role in sustainable development and green development. Therefore, on the road to pursuing the eternal development of human society and a harmonious and sustainable earth home, renewable energy will certainly receive more support and become the core force in the energy supply system in the future. With the rapid development of renewable energy, we applied sustainable energy in various fields, such as the civil engineering and construction industry [
2], automotive transportation [
3,
4], and the manufacturing industry sector [
5].
The China Statistical Yearbook (2023) reported that by 2023, China’s total installed capacity of renewable energy exceeded 1.45 TW (terawatts), accounting for about 35% of the world’s total installed capacity. China’s renewable energy generation (REG) reached 2.7 trillion kilowatt-hours (TWh), accounting for 34 percent of the country’s total power generation and 28 percent of global REG [
6]. Per capita installed renewable energy capacity is about 1.03 kilowatts (kW). Renewable energy generation per capita is about 1914 kilowatt-hours (kWh) [
6].
There are many factors affecting the development of renewable energy, including government policy support [
7,
8,
9], investment environment [
10], techonological progress [
11] and market demand [
12]. In this paper, according to the suggestions of the China Statistics Bureau, China’s inland is divided into four major regions, namely, 10 provinces in the east, 6 provinces in the middle, 11 provinces in the west and 3 provinces in the northeast, among which Tibet Autonomous Region is omitted in the analysis due to incomplete data. In each region, each province’s government policy is different, and the geographical and natural environment is different, which will cause the distribution of renewable energy development levels in the country and the four regions to have a convergence of dynamics. What might be the cause of the differences in development? How can government policies be adjusted and resource allocation be improved to promote renewable energy development in the future? This article is in accordance with this idea of writing.
The purpose of this study is to explore the regional differences, distribution dynamics and convergence of renewable energy development in China and the four major regions and analyze the causes of regional differences so that various regions and provinces can adjust government policies according to local conditions, improve resource allocation, improve the comprehensive development level of renewable energy in the country, face climate change better, ensure energy security and protect the earth ecology.
This paper attempts to use a series of measurement methods to analyze the regional differences, distribution dynamics and convergence of renewable energy development so as to understand the spatial and temporal distribution characteristics and dynamic changes in China’s renewable energy resources. It is helpful to formulate corresponding policies and measures to promote the rational development and utilization of renewable energy.
We must take active measures to vigorously develop clean and renewable energy. These measures can not only improve China’s energy efficiency, ensure energy security and reduce dependence on traditional fossil fuels but also effectively reduce carbon emissions [
13,
14,
15], thereby helping to maintain the ecological balance of the earth. At the 14th meeting of the Standing Committee of the National People’s Congress, China passed the Renewable Energy Law of the People’s Republic of China (2005). With the improvement of the economic level, people are increasingly pursuing the construction of a clean and beautiful earth, and the support for renewable energy is increasing. Therefore, exploring the regional differences, distribution dynamics and convergence of the development level of renewable energy is of great significance for analyzing the influence of different geographical factors on the development of renewable energy, formulating government policies according to local conditions, improving investment in renewable energy, and efficiently realizing the goal of “dual carbon”.
The structure of the study is as follows.
Section 1 introduces the writing background, purpose and practical significance of this article. In
Section 2, the paper summarizes and reviews the previous documents, which are the positive and negative influence factors of renewable energy development, the influence of renewable energy development on carbon emission, the regional differences in China’s renewable energy development and the research method of this article.
Section 3 gives the method and the number of people. The empirical results and analysis are placed in
Section 4. The conclusion is in
Section 5. Finally, we provide some policy suggestions for the development of renewable energy in
Section 6.
2. Literature Review
The development trajectory of renewable energy is shaped by multifaceted determinants, encompassing both enablers and barriers that warrant systematic analysis. Renewable energy also has an impact on carbon emissions. The study of regional differences in the development of renewable energy in China’s four regions is helpful in analyzing the impact of different variable factors on the development of renewable energy in each region so as to promote mutual cooperation and mutual learning among different regions, and thus contribute to the faster and better realization of China’s dual-carbon goal.
2.1. Positive Influencing Factor
Luca (2023) demonstrated a positive feedback mechanism between renewable energy consumption and economic growth, and the causal test results among renewable energy consumption, GDP, trade and total capital formation are significant [
16]. Tan Yunxia et al. (2023) believe that in order to promote the transformation of renewable energy development from “policy-driven” to “market-driven” and enhance market vitality, it is necessary to incorporate “technology diffusion” and “market” into the renewable energy complex system and coordinate the relationship between government, market, technology diffusion and environment [
12]. At different stages of renewable energy development, targeted measures are proposed, and specific development strategies are formulated. Ye et al. (2023) found that China should continue to promote the construction of high-standard farmland and explore suitable construction models for different regions [
17]. And the same is true of renewable energy as a source of energy dependent on natural conditions. Fan Ying and Yi Bowen (2019) believe that the development of renewable energy stems from people’s concerns about the sustainability of economic growth under energy and environmental constraints, and the limited nature of fossil energy, non-renewable energy and the need for economic growth promote people’s development and utilization of renewable energy [
18]. Ma Limei and Huang Chongle (2022) established a bidirectional fixed-effect model and used the panel quantile method to conduct regression and found that in the initial stage of renewable energy development, it was mainly driven by government policies, while in the growth stage and maturity stage, the role of financial development gradually became prominent [
8]. Sadorsky (2009) concluded through empirical analysis that the increase in real per capita income has a statistically significant positive impact on per capita renewable energy consumption. In the long run, per capita renewable energy consumption in emerging economies will increase by about 3.5% for every 1% increase in real per capita income [
19]. Islam et al. (2022) empirically analyzed the dynamic DARDL simulation method and found that urbanization and physical infrastructure negatively affected renewable energy consumption [
9]. However, urbanization and physical infrastructure positively affected non-renewable energy consumption, and the quality of policies and institutions positively affected renewable energy consumption [
9]. He et al. (2022) found that low service quality does not lead to low environmental commitment [
20]. Fang Xingming et al. (2021) found through the empirical test of the bivariate Probit model that socio-economic factors, socio-demographic factors and subjective factors have a significant impact on the consistency of residents’ support for the development of renewable energy [
21]. Apergis and Payne (2011) show, through panel co-integration and error correction model, that there is a long-term relationship between per capita renewable energy consumption, real per capita GDP, per capita carbon dioxide emissions and real oil prices, and energy prices will also affect renewable energy consumption [
22]. Bashir M F et al. (2023) found that nuclear energy impacts energy demand and is the most critical factor in fulfilling environmental commitments under regional and international environmental agreements [
23].
2.2. Negative Influencing Factors
All countries in the world are pursuing the promotion of the development of renewable energy and energy transformation, but renewable energy is facing many obstacles in its development. Sahebi and Toufighi et al. (2023) show that the lack of a standard renewable energy supply chain, entrepreneurial support, incentives/subsidies to encourage renewable energy producers to compete, and lack of government support for sustainable supply chain solutions are important barriers [
24]. Li Qing et al. (2015) found that policy uncertainty would reduce the investment confidence of renewable energy investors and hinder investment in renewable energy development [
25]. The UK Solar Trade Association warns (2015) that aging grids are preventing renewable energy (RE) projects from being connected to the electricity system, threatening the UK’s low-carbon development prospects. Chen Zhuochun (2018) proposed that market failures, such as insufficient investment in the renewable energy market; infrastructure failures, such as lack of core technologies; interaction failures, such as lack of connections between enterprises and universities; and orientation failures, such as lack of vision and planning for sustainable transformation, have become factors leading to the failure of renewable energy technology diffusion practices [
26]. The proliferation of renewable energy technologies is hindered. Naturally, the scale of renewable energy development is limited. Fan Ying and Yi Bowen (2019) believe that the third energy transformation faces two obstacles [
18]. The first obstacle is the system and mechanism of the energy industry, which is a major obstacle unique to China; the second obstacle is the external pricing and incentive mechanism, which is also the same problem encountered by all countries in the energy transformation. Xie et al. (2023) found that SMEs can reduce shutdown risk by strictly managing employee health issues [
27].
2.3. Research on the Impact of Renewable Energy on Carbon Emissions
Yu Shiwei et al. (2022) proposed that renewable energy can achieve the dual-carbon goal by promoting low-carbon energy transformation, low-carbon industrial development and low-carbon technological innovation [
13]. By constructing a model that includes a complementary energy supply from renewable energy and traditional energy, Chen Liangwei et al. (2024) take renewable energy as the energy supply source in the project and find that carbon emissions at both poles have decreased [
14]. Liu Qiuxin (2023) proposed that the construction industry is a major source of carbon emissions, and the innovation of renewable energy is conducive to the development of the green building industry and the reduction in carbon emissions [
15]. Zeng Shihong et al. (2019) proposed that the development of renewable energy is the main way to achieve low-carbon energy transformation, and energy transformation is a key means to achieve the goal of “double carbon” [
28]. Xu Bin et al. (2019) found that clean energy can inhibit carbon emissions in different regions at different stages and produce M-shaped, U-shaped and U-shaped nonlinear impacts on carbon emissions in eastern, central and western regions, respectively [
29]. Yuan Jiahai et al. (2019) Under the new power system, the proportion of non-fossil energy power generation in 2030, 2035 and 2050 will gradually increase, and the power system should achieve nearly zero carbon emissions by 2045 [
30]. Yang Fan et al. (2021) found that non-fossil energy, such as renewable energy, has the characteristics of low carbon, and the proportion of non-fossil energy in power generation has increased [
31]. Of course, the combination of renewable energy and other factors will significantly inhibit carbon emissions [
31]. Liu Xinjian et al. (2024) found that renewable energy power generation technology is very mature in the later stage, and the combination of renewable energy subsidy policy and carbon pricing policy will make non-fossil energy significantly replace traditional fossil energy [
32]. Xu Shichun (2012) found that energy structure was the main inhibiting factor of carbon emission, with a contribution rate of −54.43% [
33]. Jiang Jinhe (2011) mentioned that compared with renewable energy, the use of fossil energy emits a lot of carbon dioxide [
34]. Bashir M F et al. (2023) found that energy transition and banking developments ensure environmental sustainability [
35]. Zhang Z et al. (2024) found that the net carbon emissions from land use in MRYRUA showed a clear upward trend [
36]. Ma B et al. (2023) found that energy transition and renewable energy improve environmental sustainability, while non-renewable energy consumption exacerbates environmental challenges [
37]. Su et al. (2025) found that a relaxing tourism activity positively influences pro-environmental behavior through unthreatened awe and self-enhancement [
38].
2.4. Research on Regional Differences in Renewable Energy Development
Most regional differences, distribution dynamics and convergence studies at home and abroad are based on certain renewable energy sources. Wu Ping and Tan Qiong (2012) used the Malmquist index method to analyze the series data of 24 major grain-producing areas from 2003 to 2009 and found that there were regional differences in the allocation efficiency of farmland water conservancy facilities, among which the northwest and northeast regions were higher than other regions [
39]. Fengnan Chen and Lei Shen (2012) analyzed the regional distribution characteristics of China’s solar photovoltaic industry by using ArcGIS tools based on the solar photovoltaic data of 2009 and found that solar photovoltaic power generation was concentrated in the northwest region (Qinghai as the core) and the North China region (Beijing and Hebei as the core) [
40]. Li Cunbin and Dong Jia (2022) established the DEA-TOPSIS model to measure the wind power performance of 30 provincial-level administrative units in China from 2013 to 2019 and calculated the Molan index value [
41]. The empirical results show that there are regional differences in the wind power performance of all provinces in China [
41]. Yan Qingyou and Tao Jie (2015) selected 30 biomass power generation projects as samples, evaluated them based on the BC2 model and AR model, and found that there were regional differences in biomass energy distribution in China, mainly in the southwest, central and East China [
42]. Nan Shijing et al. (2023) analyzed the provincial panel data on renewable energy in China from 2006 to 2019 by using the Dagum Gini Coefficient and found that the internal differences in the development level of renewable energy in China and the four major regions gradually narrowed, mainly because the differences between regions were more significant [
43]. Through σ convergence and spatial β convergence analysis, they found that the convergence of renewable energy development level is the strongest in the northeast region while the weakest in the western region. In addition to the above-mentioned Dagum Gini coefficient, Kernel density, σ convergence and spatial β convergence analysis methods, which can study regional differences, distribution dynamics and convergence, a few scholars still use factor analysis, cluster analysis and other methods [
43]. Zhang Qiang (2019) used Moran’s I to analyze the spatial correlation of carbon emission efficiency of energy consumption in various provinces [
44]. Zhao Nan et al. (2015) used σ convergence, absolute β and relative β convergence methods to analyze the convergence of energy use efficiency [
45]. Jing Shouwu and Zhang Jie (2018) used σ convergence, absolute β and relative β convergence methods to analyze the convergence of energy and environmental efficiency in China [
46]. Luo Liangqing et al. (2022) studied the convergence of energy intensity in the central, eastern and western regions of China using the absolute β convergence method [
47].
Remark:There are many factors affecting the development of renewable energy, including positive factors and negative factors. By referring to the research results of scholars and teachers, I can expand my understanding of the development of renewable energy. Many scholars and teachers have used wonderful and rich methods to discuss the development of renewable energy in China in detail and in-depth, which is a great reference for my paper. However, most of the articles have analyzed the regional differences and distribution dynamics of wind energy, solar energy, water energy and other energy sources separately [
39,
40,
41,
42]. Firstly, we comprehensively considered the three major renewable energy sources (wind energy, hydropower and solar energy), which is more representative than separately analyzing a single renewable energy source. Secondly, in the article, we divide the provinces of China into four major regions according to the classification method of the National Bureau of Statistics of China, which is more professional. Thirdly, our research will take into account the spatial correlation of renewable energy development among various regions.
In this paper, we used the Dagum Gini coefficient [
48,
49,
50] for intra-region and inter-region differences, and the causes of intra-region and inter-region differences were analyzed. Additionally, we used kernel density to study the dynamic distribution characteristics of national and regional development levels, and the changes in renewable energy development levels in China and the four major regions over time were analyzed. Moreover, we conducted σ convergence analysis [
51], observed the change in σ convergence coefficient, and tested the change in the degree of deviation from the average level of renewable energy development in each region over time. The spatial β convergence analysis was carried out, and the absolute β convergence and conditional β convergence methods were used to test whether the region with a low level of renewable energy development could catch up with the high-level region and narrow the gap between regions.
3. Research Methods and Data Description
3.1. Research Methods
We used the Dagum Gini coefficient to study the regional differences in the development of renewable energy in China. It is different from the ordinary Gini coefficient. It can solve the limitations of the traditional Gini coefficient when it decomposes the sources of income inequality and decomposes the overall inequality into three parts: intra-group differences, inter-group differences and super-variable density differences. We analyzed the spatial correlation of renewable energy development by using Moran’s I. We studied the distribution dynamics of renewable energy development by using kernel density estimation methods. We used the σ convergence to measure whether the dispersion degree of per capita renewable energy power generation decreases over time, directly reflecting the change in absolute differences between regions. In the article, absolute β convergence does not require the control of other conditions, and we analyzed whether all regions tend to the same steady state. The convergence of condition β requires control conditions to study whether each region tends to its own steady state. In addition, when we conducted the convergence of condition β, we carried out and passed the Wald test and LR test.
3.1.1. Gini Coefficient
The Gini coefficient is a measure of inequality, usually used to measure the degree of inequality in the distribution of income, wealth, etc. The Dagum Gini coefficient can divide the difference into three parts: intra-group difference, inter-group net difference and super-variable density, among which the inter-group net difference and super-variable density are collectively referred to as inter-group difference.
The inter-group Gini coefficient is calculated as follows:
where
Gab denotes the Gini coefficient between region “
a” and region “
b”;
yai denotes the per capita REG of Province “
i” in region “
a”; and
ybr denotes the per capita REG of province “
r” in region “
b”;
na and
nb, respectively, represent the number of provinces in region “
a” and region “
b”.
3.1.2. Moran’s I
This paper uses
Moran’s I to analyze the spatial correlation of renewable energy development levels. The expression for
Moran’s I is as follows:
where “
n” is the number of spatial units. Moreover,
yi and
yj represent the renewable energy development level of provinces “
i” and “
j”.
Wij is the 0–1 adjacency matrix, where the adjacency of two provinces is 1, and the non-adjacency is 0. In this paper, Hainan Province and Guangdong Province are adjacent.
3.1.3. Kernel Density Function
a. This paper uses Kernel density to estimate the distribution position and form of renewable energy development levels in different regions. F(y) is the probability density function of renewable energy development level y, and the kernel density function formula is as follows:
where “
m” is the number of observed values in each region or national sample, “
h” is the bandwidth,
yl is the observed value,
y0 is the mean of the observed values and “
K” is the Gaussian kernel function.
3.1.4. Sigma Convergence
Sigma convergence tests whether the development level of renewable energy in various regions deviates from the overall average level and gradually declines over time. The formula for sigma convergence is as follows:
where
σgt represents the coefficient of variation in region “
g” in year “
t”,
Ng represents the number of provinces in region “
g”, and
yigt represents the development level of renewable energy in province “
i” in region “
g” in year “
t”.
3.1.5. Beta Convergence
Beta convergence means that regions with a lower level of renewable energy development have a faster development rate and can catch up with regions with a higher level of renewable energy development so that the gap between regions is gradually narrowed. The beta convergence model is as follows:
where y
i,t+1 and
yi,t represent the renewable energy development level of province “
i” in year
t + 1 and year “
t”, respectively, which represents the growth rate of its renewable energy development level in year
t + 1;
α is the constant term;
β is the convergence coefficient;
Xi,t+1 is a series of control variables affecting the development level of renewable energy;
δ is the coefficient vector of the corresponding control variable.
μi and
ηt represent individual and time fixed effects respectively;
εit are random disturbance terms.
3.2. Variable Selection and Data Source
The selection of variables, symbols and measurement methods are shown in
Table 1 below:
REG data are from the “China Electricity Yearbook” and “China Electricity Statistical Yearbook”. Economic development level, urbanization rate and environmental regulation data are from the National Bureau of Statistics. The data on energy structure and renewable energy infrastructure construction are from the China Electricity Yearbook and the China Electricity Statistical Yearbook. The fossil energy endowment data are from the China Energy Statistical Yearbook.
In this paper, natural logarithm (ln) is taken for per capita REG, REG ratio, installed capacity of renewable energy, per capita GDP, and completed investment in industrial pollution control. The interpolation method is used to make up for individual data missing.
3.3. Descriptive Statistics of Data
This paper is based on the provincial panel data of 30 provincial-level administrative units in China from 2006 to 2021.
Table 2 below shows the basic characteristics of per capita REG, REG ratio, per capita installed renewable energy capacity, per capita GDP, urbanization rate, environmental regulation and per capita coal consumption.
4. Result and Analysis
4.1. Regional Difference and Spatial Correlation
4.1.1. Dagum Gini Coefficient
The Dagum Gini coefficient G consists of an intra-regional Gini coefficient and an interregional Gini coefficient, where the interregional Gini coefficient includes the net difference between groups and the super-variable density.
- a.
Gini coefficient in the region
Table 3 shows the Gini coefficient values in the region. Among them, the average Gini coefficient within the national group is 0.618, and the variation range is 0.569~0.665, which indicates that there are great differences in the development level of renewable energy across the country. As we can see from
Table 3, the national Gini coefficient decreases from 0.665 in 2006 to 0.587 in 2021, with a total decrease of 14.53% and an average annual decline of 1.02%. From the perspective of different regions, the average Gini coefficient of per capita REG in the region is from large to small in the eastern region (0.539), the central region (0.531), the western region (0.438), and the northeast region (0.183).
The variation trend chart of the Gini coefficient in the region built from the data in
Table 3 is shown in
Figure 1 below. During the study period, the Gini coefficient of all regions showed a downward trend, and the decline of all regions decreased in the order of northeast region (62.42%), eastern region (53.18%), central region (40.19%) and western region (27.49%). The Gini coefficient of the western region was the highest unknown from 2017 to 2019, which may be due to the government’s increasing emphasis on clean energy and the geographical and environmental endowment of resources in the western region. We predict that the change in the Gini coefficient within the country and various regional groups will decrease at a slow speed or gradually stabilize in the future.
- b.
Interregional Gini coefficient
Table 4 shows inter-regional Gini coefficients. In the table, the average value of the inter-regional difference coefficient is from large to small: east–west (0.785), west–northeast (0.715), central–west (0.637), east–central (0.623), west–northeast (0.499), east–northeast (0.455), and the Gini coefficient between different regions is larger. It shows that the imbalance of renewable energy development between regions is obvious.
According to the above inter-regional Gini coefficient value in
Table 4, the change trend chart of the inter-regional Gini coefficient is constructed, as shown in
Figure 2 below. According to the curve in the figure, the inter-regional Gini coefficient between the eastern and western regions shows an increase of 4.03%, while the Gini coefficient between other regions shows a downward trend, indicating that the development difference between the eastern and western regions is becoming more and more significant. This may be because the western region has advantages in government support and resource and environmental endowment, while the eastern region is economically developed. Relatively little investment is made in the production of renewable energy, which increases the Gini coefficient. The degree of imbalance between the other regions eventually decreases in the vibration change. From the point of view of the decline, from the largest to the smallest, it was east-–northeast (52.71%), middle–northeast (49.51%), east–middle (33.31%), west–northeast (10.09%), and middle–west (5.98%).
- c.
Proportion of regional difference contribution rate
The intra-group difference contribution rate, inter-group net difference contribution rate and inter-group supervariable density contribution rate are shown in
Table 5. The average contribution rate of intra-group difference, inter-group net difference and inter-group supervariable density were 24.27%, 66.26% and 9.47%, respectively. The supervariable density showed a significant downward trend, from 20.93% in 2006 to 3.06% in 2021, with a decrease rate of 85.36%. The contribution rate of intra-group difference also decreased, from 28.30% in 2006 to 22.70% in 2021, with a decrease of 19.79%. The net difference between groups increased from 50.77% in 2006 to 74.24% in 2021, an increase of 46.22%.
The difference contribution rate is composed of intra-group difference contribution rate and inter-group difference contribution rate. The inter-group difference contribution rate includes the inter-group net difference contribution rate and inter-group supervariable density contribution rate, which fully reflects that regional differences in REG are mainly caused by regional differences, and the inter-group difference contribution rate shows an increasing trend year by year. This also shows that the formulation of relevant government policies based on regional differences is more conducive to promoting the balanced, coordinated and stable development of renewable energy.
There are also differences in REG worldwide. North American and Asian countries such as China and Japan have demonstrated remarkable achievements in renewable energy development, whereas most countries in South America and Africa remain at a relatively low level. Secondly, the imbalance in the development of global renewable energy primarily originates from regional structural differences, and the global gap in per capita renewable energy production is narrowing (Chen, 2025) [
51].
4.1.2. Spatial Correlation—Moran’s I
Table 6 shows that Moran’s I is significantly positive at the significance level of 5% during 2006–2010 and significantly positive at the significance level of 1% during 2011–2021. It shows that there was a relatively significant spatial positive correlation between REG in China from 2006 to 2010 and a very significant spatial positive correlation between 2011 and 2021, and the spatial correlation increases year by year. The reason for the large spatial correlation may be the geographical proximity of the same region with relatively similar resource and environmental endowments. The reason why the spatial correlation is increasing year by year is that at the beginning of the development of renewable energy, different places attach different importance to the production of renewable energy. With the increasing demand for clean and renewable energy, local governments attach more and more importance to the development of renewable energy. The development of renewable energy in different regions and provinces is becoming more and more similar, so the spatial positive correlation increases.
The trend chart of the Moreland index constructed from the data in
Table 6 is shown in
Figure 3, where the line chart reflects the trend of Moran’s I over time, and the bar chart reflects the
p-value corresponding to Moran’s value in each year.
4.2. Distribution Dynamics and Convergence
4.2.1. Distribution Dynamics—Kernel Density Estimation
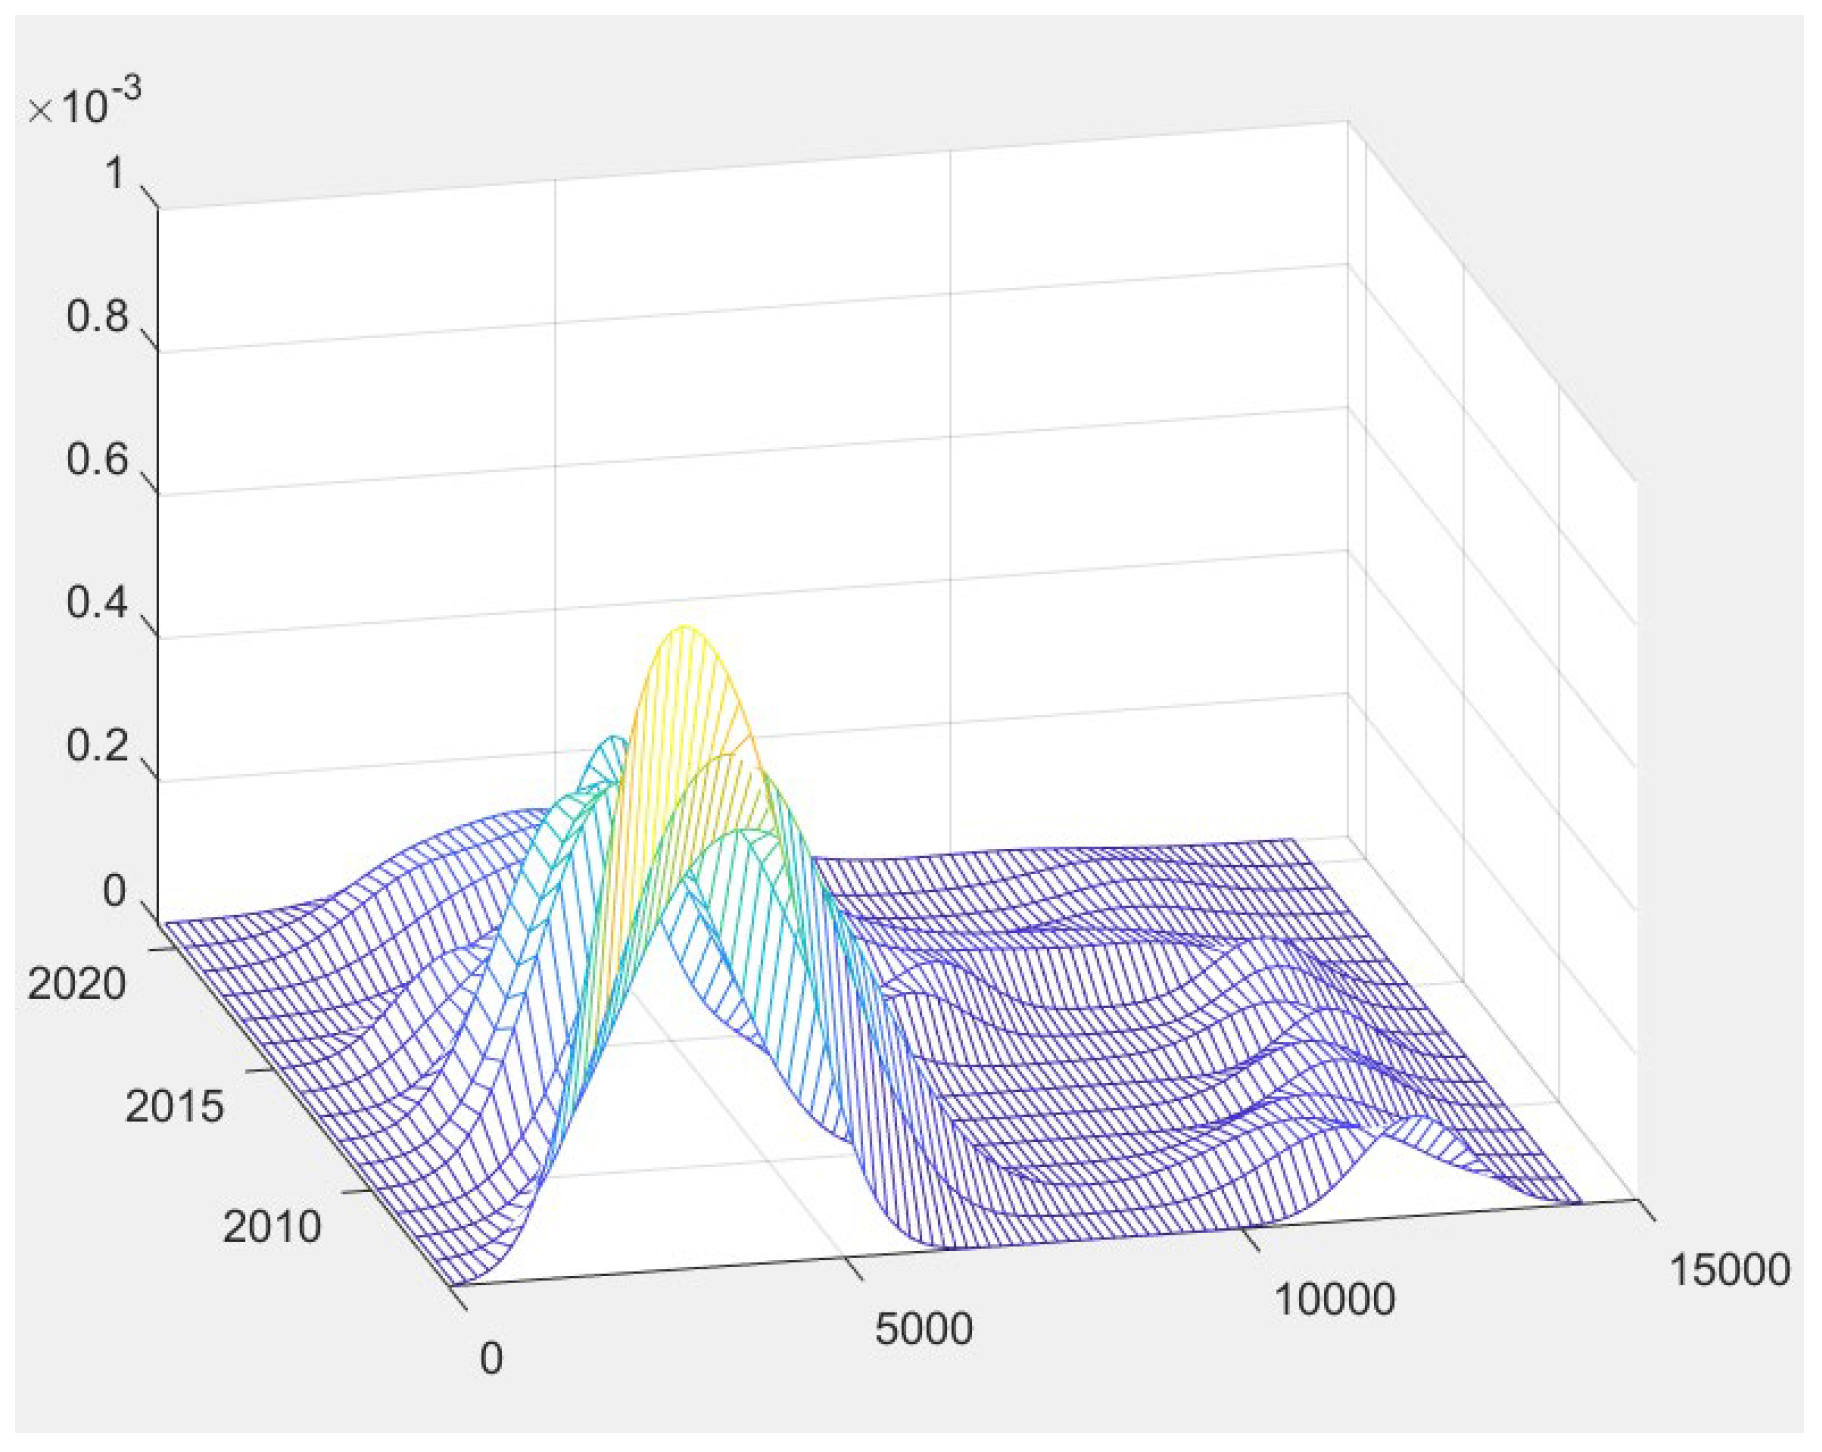
The kernel density estimates for the country, the eastern region, the central region, the western region, and the Northeast region are shown in the figure below, where the x-axis is REG per capita (kWh/person), the y-axis is the year, and the z-axis is the kernel density.
In
Figure 4,
Figure 5,
Figure 6,
Figure 7 and
Figure 8, from the perspective of distribution, the main peak of the national kernel density curve is to the left, indicating that there are relatively many provinces with a low level of renewable energy development. From the distribution pattern, the height of the main peak decreases, which indicates that the concentration of per capita REG in each province at the peak decreases, and there is a certain degree of dispersion. In
Figure 5,
Figure 6 and
Figure 7, at the beginning of the statistical period, the kernel density curves of the eastern region, the central region, and the western region have “one main peak and one side peak”, indicating that spatial polarization exists in these regions. However, at the end of the statistical period, the eastern region and the western region gradually evolve into a single main peak pattern, while the central region has “one main peak and one side peak”, and the height of the side peak decreases. It shows that the spatial polarization phenomenon has a weakening trend. The reasons for the weakening of spatial polarization in the region may be the relatively similar resources and environment in the same region, government policy guidance, and the promotion and exchange of renewable energy development technology. In
Figure 8, the kernel density curve in northeast China is generally unimodal except for individual multi-modal phenomena in 2019, indicating that the development of renewable energy in northeast China is relatively balanced, and the reason for the balanced development may be the similar resource environment and similar government policies in the three northeast provinces.
4.2.2. Sigma Convergence Test and Beta Convergence Test
- a.
Sigma convergence test
Table 7 shows the values of σ convergent coefficient of variation. Nationwide, the coefficient of variation in σ convergence decreased by 12.4% from 2006 to 2008. The σ convergence coefficient increased by 9.2% from 2008 to 2010. From 2010 to 2017, the coefficient decreased by 26.1%; from 2018 to 2020, the coefficient was relatively stable. The coefficient of variation was 1.73 in 2006 and 1.28 in 2021, showing a 26.4% reduction (equivalent to an annualized decrease rate of 1.76 percentage points). This result shows that the degree of national REG deviating from the overall average level decreases year by year, showing σ convergence.
The coefficient of variation in the eastern region was 1.80 in 2006 and 0.64 in 2021, a decrease of 64.3%. The coefficient of variation in the central region was 1.39 in 2006 and 0.76 in 2021, a decrease of 45.3%. The coefficient of variation in the western region was 1.43 in 2006 and 0.82 in 2021, a decrease of 42.9%. The coefficient of variation in Northeast China was 0.66 in 2006 and 0.27 in 2021, a decrease of 60%. During the study period, the variation coefficients of the four regions decreased in the fluctuation. The variation range of the coefficient of variation in the four regions is from large to small in the eastern region, the northeast region, the central region and the western region. The eastern region has the largest change range and the strongest convergence. The possible reason is that the resources and environment of the provinces in the eastern region are relatively similar, and the development level of renewable energy is relatively similar after the development year by year. The northeast region and the central region followed. The western region has the smallest change range and the weakest convergence, which may be due to the fact that some provinces in the west have great advantages in resource endowment, so the development level of renewable energy has been maintained at a high level, far ahead of other provinces, so the convergence in the western region is weak.
- b.
Beta convergence test
According to
Figure 3, there is a significant spatial positive correlation between REG in China. Therefore, this paper uses the spatial β model to analyze whether REG converges over time. Considering that the factors affecting the spatial effect of REG in different regions are different, the LR test and Wald test are adopted in this paper as the basis for selecting spatial Durbin model SDM, spatial lag model SEM and spatial error model SAR.
Table 8 reports the test results of absolute β convergence of REG per capita. It can be seen from the table data that absolute β convergence exists in the whole country, eastern, western and northeastern regions, and the β coefficient is significantly negative at the 0.01 confidence level. It shows that the per capita REG in China’s eastern, western and northeastern regions will gradually converge to a steady state value over time under similar conditions of economic development level, urbanization rate, environmental regulation, energy structure and renewable energy infrastructure construction. The greater the absolute value of the β coefficient, the faster the speed of the steady-state value will be, and the absolute β convergence rate is from fast to slow in the northeast, the west, the whole country and the east. The absolute β coefficient in the central region was not significant.
Table 9 reports the coefficient estimation results of conditional β convergence for per capita REG. By observing the test results in
Table 9, we can see that the eastern, central, western and northeastern regions all pass the Wald test and LR test, and the SDM model is used for absolute β convergence analysis and conditional β convergence analysis for the eastern, central, western and northeastern regions. However, the whole country did not pass the Wald test, so the SEM model was used for convergence analysis.
Considering that absolute β convergence analysis isolated all other relevant factors and was not in line with reality, a series of heterogeneous influencing factors were taken into account to make conditional β convergence analysis.
Table 9 shows the results of the spatial conditional β convergence test.
Firstly, from the perspective of the β coefficient, the national, eastern, central, western and northeast regions are significantly negative at the 0.01 confidence level, indicating that conditional β convergence exists in the country and the four major regions. In other words, under the consideration of such heterogeneous factors as economic development level, urbanization rate, environmental regulation, energy structure and renewable energy infrastructure construction, the development level of renewable energy will converge to a steady state over time, and the convergence speed is from fast to slow in the eastern, northeastern, central, national and western regions.
Secondly, the absolute value of the β coefficient of conditional β convergence is larger than that of the absolute β convergence, so the conditional β convergence tends to a steady state faster than the absolute β convergence.
Finally, the regression coefficient of the national economic development level, per capita installed capacity of renewable energy and the proportion of REG are significantly positive at the confidence level of 0.01, so these factors have a promoting effect on the development of national renewable energy. The proportion of REG in the eastern, central, western and northeast regions has a positive effect. Per capita, the installed capacity of renewable energy has a significant positive effect on Western China. The level of economic development has a significant promoting effect on the central region, and the proportion of completed investment in industrial pollution control has a negative effect on the eastern region, which has a promoting effect on the central region. Urbanization rate has a positive effect on eastern China. The per capita coal consumption has a positive effect on the eastern and western regions.
5. Conclusions
Firstly, based on the panel data of 30 provincial-level administrative units in China from 2006 to 2021, this paper used the Dagum Gini coefficient and its decomposition method to measure intra-regional and inter-regional differences in REG and analyzes the reasons for the differences. We used the kernel density estimation method to analyze the distribution dynamics of REG in China and four regions. Finally, we used the spatial correlation by using Moran’s I, and then we tested the convergence by σ convergence and spatial β convergence. The main conclusions are as follows:
Firstly, the per capita REG in China, the eastern, central and northeastern regions increased in a fluctuating manner, and the western region increased steadily. The average annual growth rate of REG per capita in the four regions increased in the order of central region (9.8%), eastern region (9.98%), western region (13.38%) and Northeast region (16.67%).
Secondly, the Gini coefficient is large in the country, so there is a large overall difference in the development level of domestic renewable energy. The average Gini coefficient in the four regions ranges from small to large in the northeast, western, eastern and central regions. The Gini coefficient in the whole country and all regions showed a downward trend, and the decline range was from small to large in the western, central, eastern and northeast regions. The inter-regional Gini coefficient between eastern and western regions showed an increase, while the inter-regional Gini coefficient showed a downward trend. From the perspective of regional difference contribution rate, inter-group difference is the main source of the overall difference in REG. Intra-group difference and inter-group hypervariable density are small, and the intra-group difference contribution rate decreases year by year while the inter-group difference contribution rate increases year by year.
Thirdly, the main peak of the national kernel density curve is to the left, indicating that the REG is concentrated at a low level. The height of the main peak decreased, indicating that the difference in REG increased. In the eastern region, the central region and the western region, there is “one main peak and one side peak”, and there is a spatial polarization phenomenon, but the height of the side peak is reduced, indicating that the polarization phenomenon is weakened.
Fourthly, from 2006 to 2021, the Moreland index is significantly positive at the significance level of 0.05, indicating that there is a significant spatial positive correlation of REG.
Finally, from the point of view of σ convergence, from 2006 to 2021, the coefficient of σ convergence in China’s eastern, central, western and northeast regions generally decreased, and the decreased amplitude is from small to large in the western, central, northeast and eastern regions, so the REG in the country and the four regions have σ convergence. According to the spatial absolute β convergence regression coefficient, absolute β convergence exists in the whole country, the east, the west and the northeast, and the convergence speed is from fast to slow in the east, the whole country, the west and the northeast. From the regression coefficient of spatial condition β convergence, there is a significant trend of conditional β convergence in China and the four major regions, and the convergence speed is from slow to fast in the western region, the whole country, the central region, the northeast region and the eastern region.
6. Policy Recommendations
The core of China’s regional energy strategy lies in adapting measures to local conditions, adopting classified policies, implementing differentiated layouts and regional coordinated development, which coincides with the research of this article. On the one hand, China is driven by carbon peaking and carbon neutrality. On the other hand, due to energy security and regional balance, China’s energy resources are unevenly distributed (for instance, the West is rich in wind, solar and hydropower, while the East relies on energy input). Therefore, optimizing resource allocation through projects such as “West-to-East Power Transmission” is necessary to reduce external dependence and enhance regional energy self-sufficiency. Based on resource endowments and development needs, China is divided into four major energy strategic regions. The western region serves as a base for renewable energy and the core of energy output. The eastern region promotes the transformation of energy consumption and technological innovation. The central region functions as an energy transmission hub and an industrial upgrading belt. The northeastern region realizes the energy transformation of old industrial bases and the clean heating. The implementation of the regionally differentiated development strategy coincides with the research results of this paper.
From the above conclusions, we propose the following suggestions:
Firstly, based on the REG data of various regions and provinces in previous years, the resources and geographical environment endowment of renewable energy development in various regions and provinces should be explored, and reasonable policies should be formulated, such as providing financial subsidies, loan guarantees and technical guidance to local renewable energy production enterprises, to support local renewable energy industry, so that it can be fully developed. Spatially differentiated policy frameworks that account for regional resource endowments should be implemented, such as establishing preferential feed-in tariffs for hydropower-rich southwestern provinces while prioritizing distributed solar incentives in eastern metropolitan areas. This will further achieve the “double carbon” goal faster and more efficiently and enhance its leading role in the international community.
Secondly, technical exchanges and cooperation among regions and provinces should be strengthened, and technical cooperation and experience exchange in the development of renewable energy should be promoted by holding seminars, establishing technological innovation alliances, and establishing technical cooperation projects. The development of renewable energy is neither coordinated nor balanced, which is a very obvious problem. Through renewable energy development, strong provinces drive the development of renewable energy, while weak provinces—by sharing the success and failure experienced in the development process—can achieve “first rich and then rich”, ultimately moving towards the common prosperity of renewable energy development.
Thirdly, the economy has developed a lot, people’s living standards have been greatly improved, and people’s demand for green and efficient energy is increasing. The government can encourage people’s demand for renewable energy and other new energy and promote the supply by demand so as to invest more funds in the production of renewable energy, increase the research and development of renewable energy and improve the development efficiency of renewable energy.


