3. Results and Discussion
The multigroup moderation analysis was conducted on the full model obtained in the PRAM using the moderators listed in
Table 1. The sections below explain the results of each moderator’s influence on the relationship between the variables with a significant path in the PRAM model. A summary of these results is presented in
Table 2.
3.1. Gender
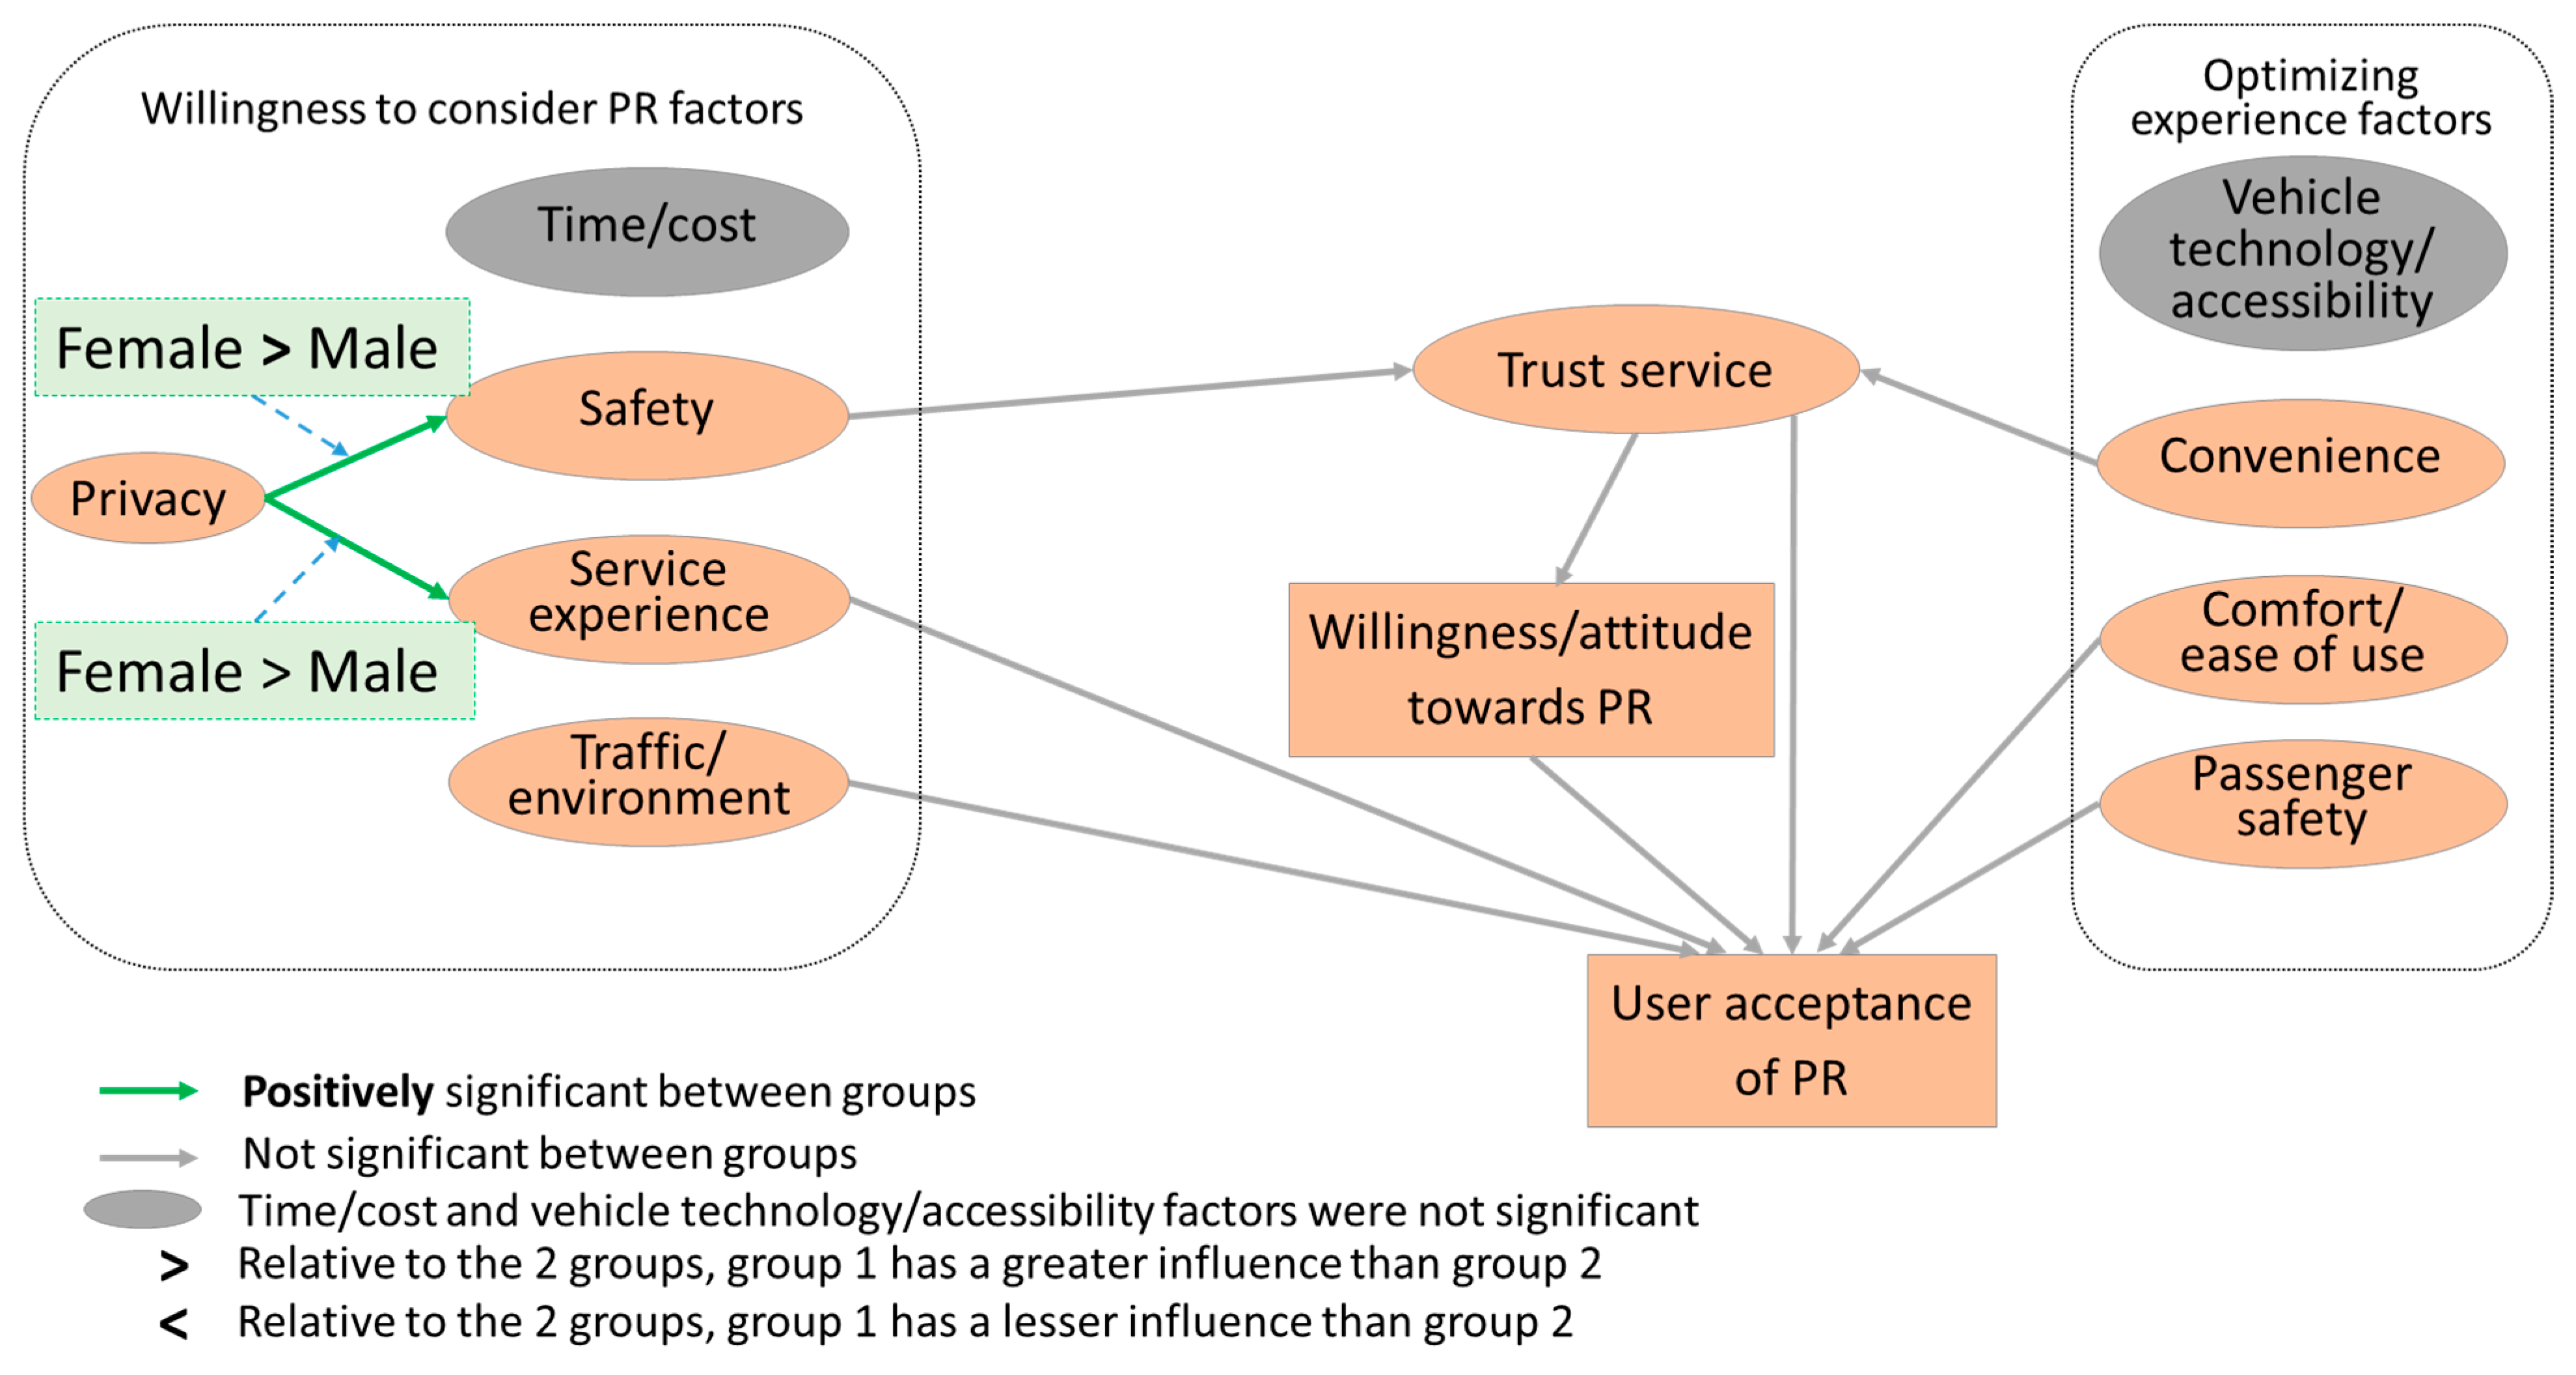
In PRAM, safety was an issue for everyone; as a result, gender was further explored. The
gender moderator consisted of two groups: (1)
male and (2)
female. Using the hierarchal approach of model comparison, first, the unconstrained model and the 11 individual regression paths of constrained models that were significant in PRAM were compared.
Table 3 shows the regression paths that were significantly different from the unconstrained model. The
privacy → safety (∆χ
2 = 4.399,
p < 0.05) and
privacy → service experience (∆χ
2 = 16.609,
p < 0.001) regression paths were significantly different from the unconstrained model, indicating that the moderator,
gender, influenced these two paths.
Next, the group differences using the model comparison were obtained for the two significant regression paths, see
Figure 3.
Privacy had a greater influence on
safety for
females (
β = 1.004) compared to
males (
β = 0.877). Similarly,
privacy had a greater influence on
service experience for
females (
β = 0.608) compared to
males (
β = 0.422).
The moderator gender (males and females) significantly influenced two regression paths: privacy → safety and privacy → service experience. The influence of gender as a moderator significantly differs between privacy and safety, as well as between privacy and service experience. While PRAM demonstrates that privacy has a positive relation with both safety and service experience, these positive relations were stronger for females than males. This suggests that for female participants, an increased sense of privacy notably enhances their perception of safety and their overall service experience. These findings underline the critical role of gender-based preferences, concerning privacy considerations. Further, this suggests the need for tailored strategies that account for these different privacy needs is worth further exploration.
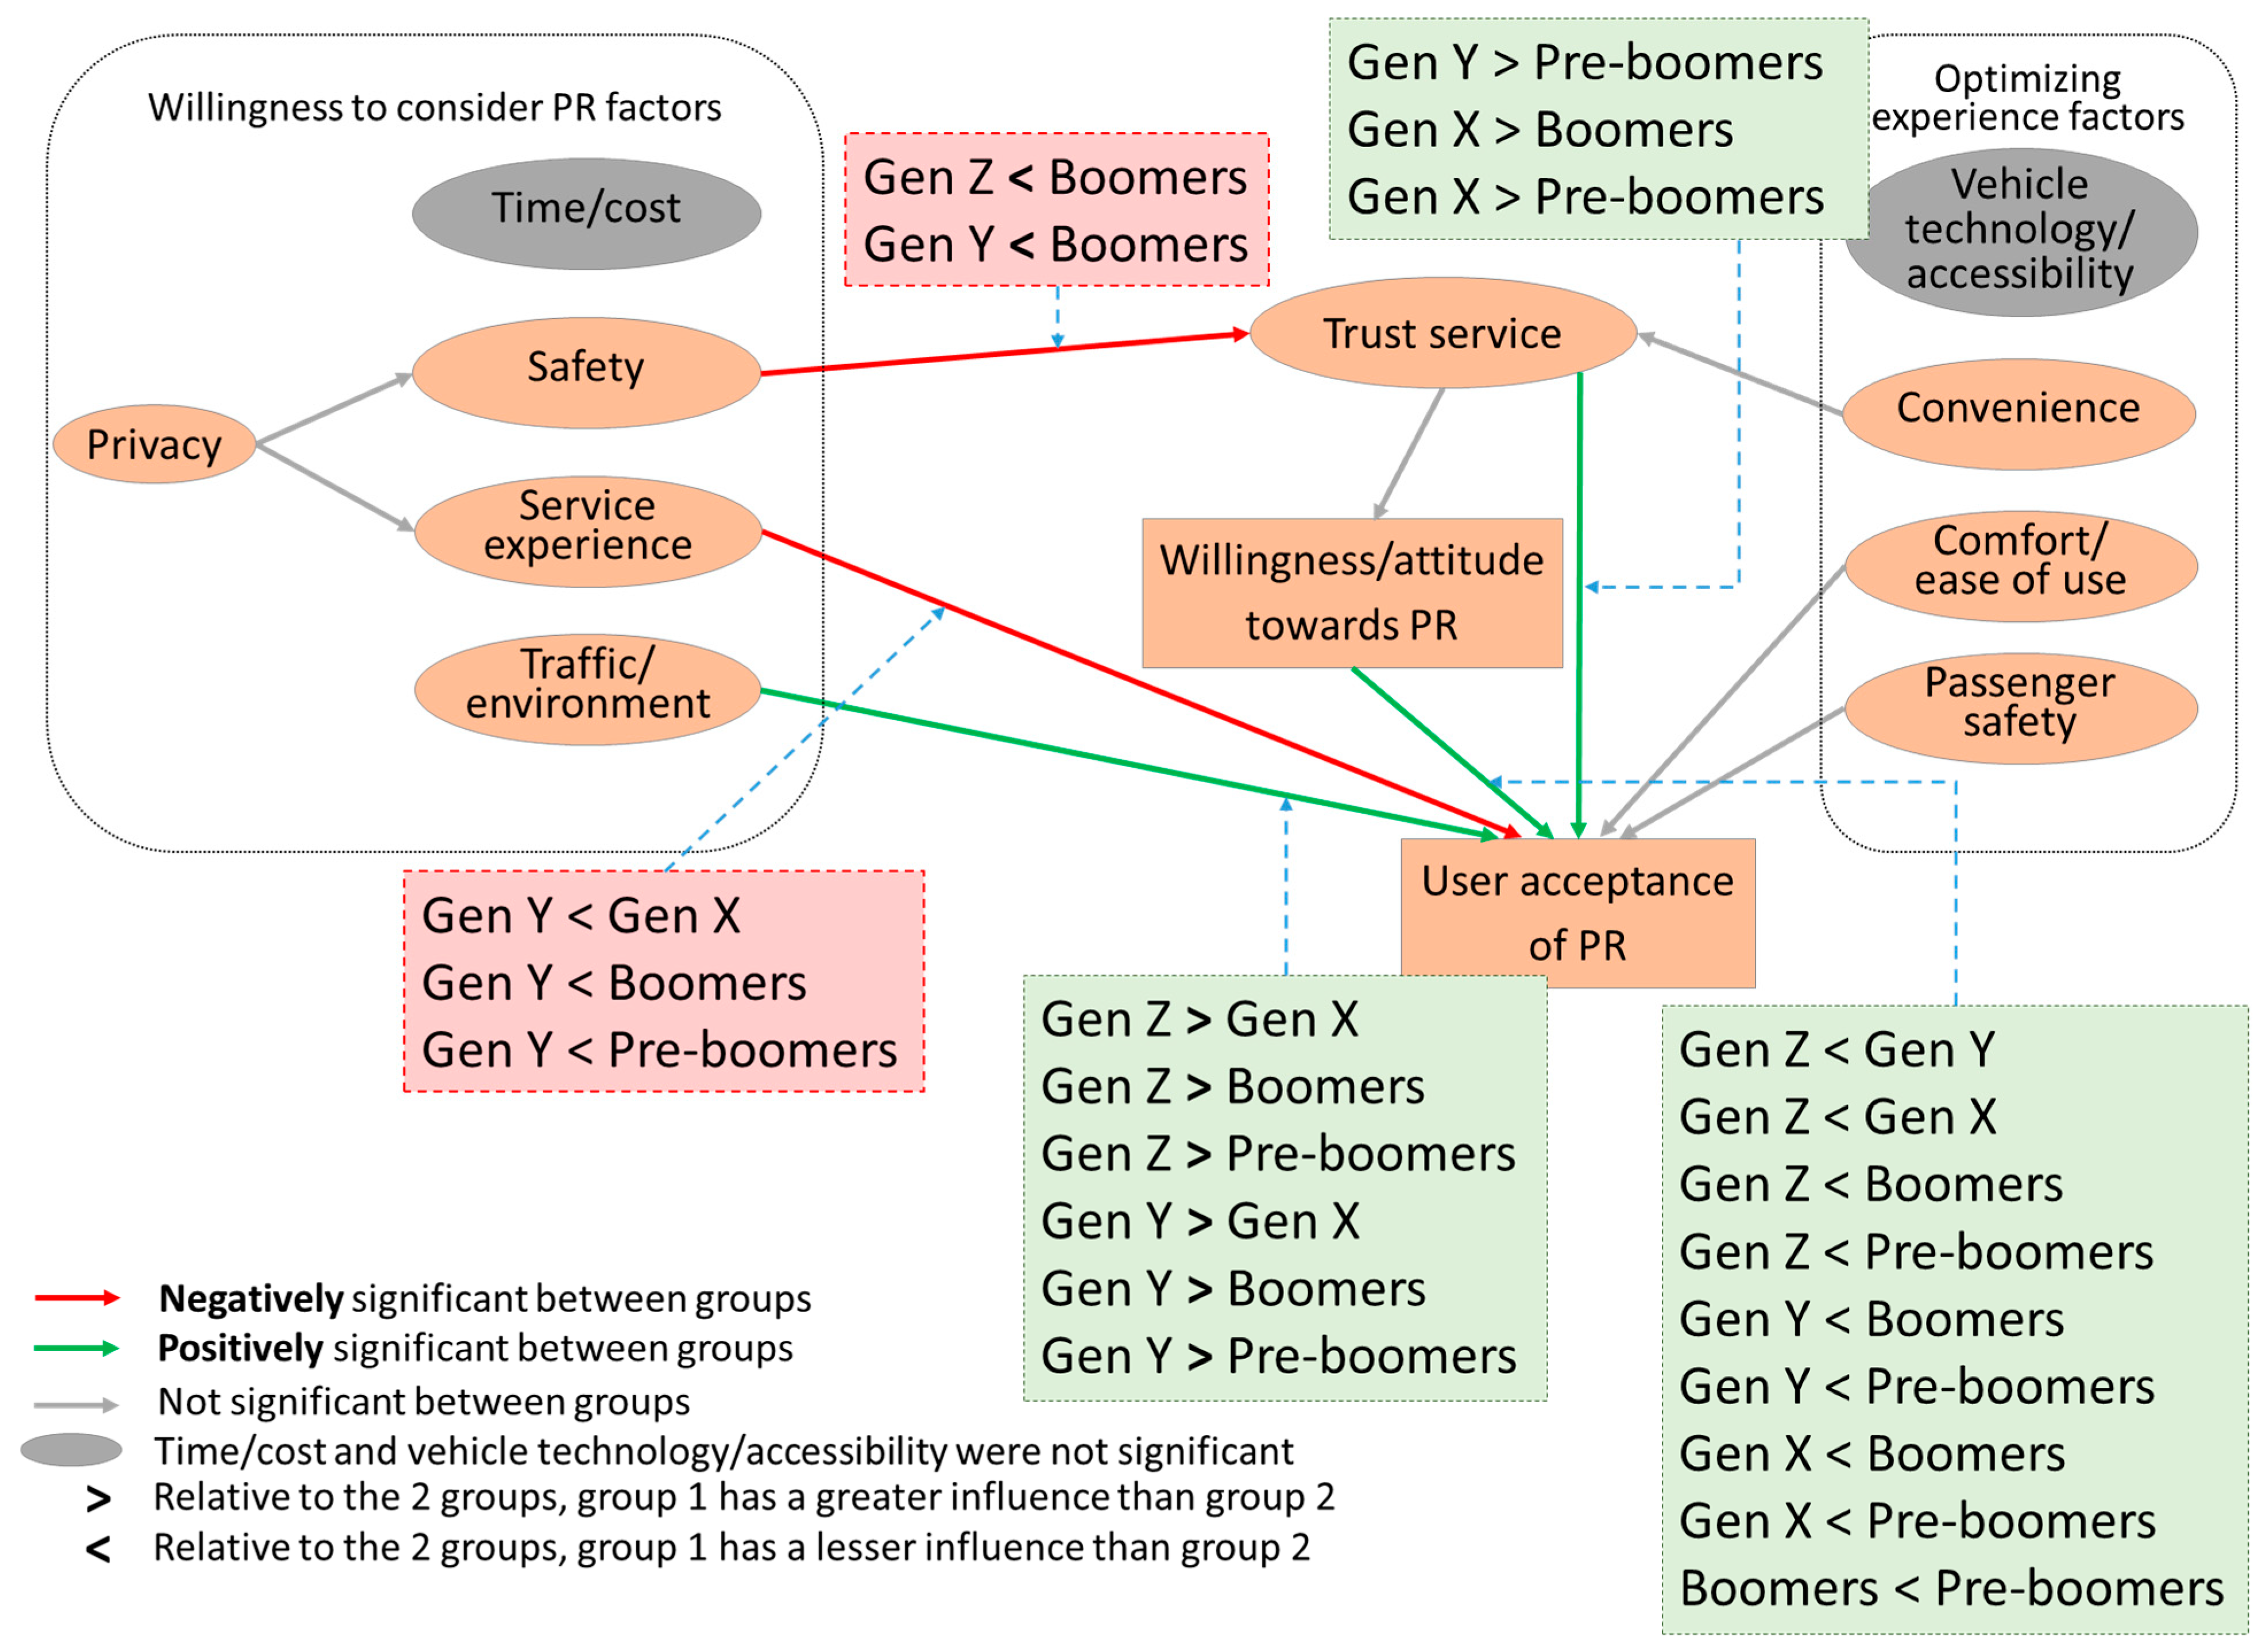
3.2. Generation
The
generation moderator consisted of five groups: (1)
gen Z (<27 years), (2)
gen Y (27–44 years), (3)
gen X (45–56 years), (4)
boomers (57–75 years), and (5)
pre-boomers (>75 years).
Table 4(A) shows the regression paths that were significantly different from the unconstrained model. The
safety → trust service (∆χ
2 = 11.075,
p < 0.05),
service experience → user acceptance of PR (∆χ
2 = 11.356,
p < 0.05),
traffic/environment → user acceptance of PR (∆χ
2 = 15.447,
p < 0.01)
, trust service → user acceptance of PR (∆χ
2 = 14.002,
p < 0.01), and
willingness/attitude towards PR → user acceptance of PR (∆χ
2 = 46.165,
p < 0.001) regression paths were significantly different from the unconstrained model, indicating the moderator,
generation, influenced these five paths.
Next, the group differences were obtained using model comparisons to identify the significant regression paths, as shown in
Table 4(B) and
Figure 4. In comparison to
gen Z (
β = −0.828),
safety had a greater negative influence on
trust service for
boomers (
β = −1.019). Similarly, compared to
gen Y (
β = −0.609),
safety had a greater negative influence on
trust service for
boomers (
β = −1.019).
Service experience had a greater negative influence on
user acceptance of PR for
gen X (
β = 0.009) when compared to
gen Y (
β = −0.198).
Service experience had a greater negative influence on
user acceptance of PR for
boomers (
β = −0.016) when compared to
gen Y (
β = −0.198).
Service experience had a greater negative influence on
user acceptance of PR for
pre-boomers (
β = 0.137) when compared to
gen Y (
β = −0.198).
Traffic/environment had a greater influence on
user acceptance of PR for
gen Z (
β = 0.218) compared to
gen X (
β = −0.014). Similarly,
traffic/environment had a greater influence on
user acceptance of PR for
gen Z (
β = 0.218) compared to
boomers (
β = 0.033).
Traffic/environment had a greater influence on
user acceptance of PR for
gen Z (
β = 0.218) compared to
pre-boomers (
β = 0.06). Similar to
gen Z,
traffic/environment had a greater influence on
user acceptance of PR for
gen Y (
β = 0.136) compared to
gen X (
β = −0.014).
Traffic/environment had a greater influence on
user acceptance of PR for
gen Y (
β = 0.136) compared to
boomers (
β = 0.033).
Traffic/environment had a greater influence on
user acceptance of PR for
gen Y (
β = 0.136) compared to
pre-boomers (
β = 0.06).
Trust service had a greater influence on
user acceptance of PR for
gen Y (
β = 0.312) when compared to
pre-boomers (
β = 0.085).
Gen X (
β = 0.292) had
trust service as a greater influence on
user acceptance of PR when compared to
boomers (
β = 0.264).
Gen X (
β = 0.292) had
trust service as a greater influence on
user acceptance of PR when compared to
pre-boomers (
β = 0.085).
Willingness/attitude towards PR had a greater influence on
user acceptance of PR for
gen Y (
β = 0.35) when compared to
gen Z (
β = 0.221). Similarly,
willingness/attitude towards PR had a greater influence on
user acceptance of PR for
gen X (
β = 0.357) when compared to
gen Z (
β = 0.221).
Willingness/attitude towards PR had a greater influence on
user acceptance of PR for
boomers (
β = 0.416) when compared to
gen Z (
β = 0.221).
Willingness/attitude towards PR had a greater influence on
user acceptance of PR for
pre-boomers (
β = 0.546) when compared to
gen Z (
β = 0.221).
Willingness/attitude towards PR had a greater influence on
user acceptance of PR for
boomers (
β = 0.416) when compared to
gen Y (
β = 0.35).
Willingness/attitude towards PR had a greater influence on
user acceptance of PR for
pre-boomers (
β = 0.546) when compared to
gen Y (
β = 0.35). Similar to
gen Z and
gen Y,
willingness/attitude towards PR had a greater influence on
user acceptance of PR for
boomers (
β = 0.416) when compared to
gen X (
β = 0.357).
Willingness/attitude towards PR had a greater influence on
user acceptance of PR for
pre-boomers (
β = 0.546) when compared to
gen X (
β = 0.357). Lastly,
willingness/attitude towards PR had a greater influence on
user acceptance of PR for
pre-boomers (
β = 0.546) when compared to
boomers (
β = 0.416).
The moderator generation (gen z, gen y, gen x, boomers, and pre-boomers) significantly influenced five regression paths: safety → trust service, service experience → user acceptance of PR, traffic/environment → user acceptance of PR, trust service → user acceptance of PR, and willingness/attitude towards PR → user acceptance of PR. The youngest generation, gen Z was more willing to use PR than the older generations. Out of the five age groups, safety had a larger influence on boomers. Willingness to use PR had a larger influence for boomers and pre-boomers if they consider accepting PR.
Addressing safety concerns is key to gaining the trust of the boomer generation, while enhancing the service experience may be more valuable in attracting users from gen X, boomers, and pre-boomers. For gen Z and gen y users, emphasizing the potential for a positive environmental impact and reduced traffic congestion may be more influential. In terms of trust in PR service, this factor is essential to influence gen Y, gen X, and pre-boomers, suggesting that these generations place higher importance on reliable and high-quality service. The willingness and attitude towards PR are significant across all generations except gen Z, but they appear to hold a more prominent role for boomers and pre-boomers in terms of their acceptance of PR. These findings suggest that addressing the unique concerns and preferences of each generation is important to consider because a “one size fits all” approach will not work. Yet, considering the unique needs of each generation may effectively promote the acceptance and usage of PR.
3.3. Geographic Area
The geographic area moderator consisted of three groups: (1) urban, (2) suburban, and (3) rural. The chi-square model comparison showed no significant differences between the unconstrained model to when the 11 regression paths were constrained individually. Since there was no significant difference between the three groups, the moderator was then grouped into two groups: (1) urban (38%) and (2) suburban or rural (62%) to identify if there were any differences. When examining the two groups, the chi-square model comparison showed no significant difference between the unconstrained model to when the 11 regression paths were constrained individually. Therefore, the findings from the study do not support a different strategy based upon one’s geographic area, and the relationship between the factors was consistent across the three different geographic areas.
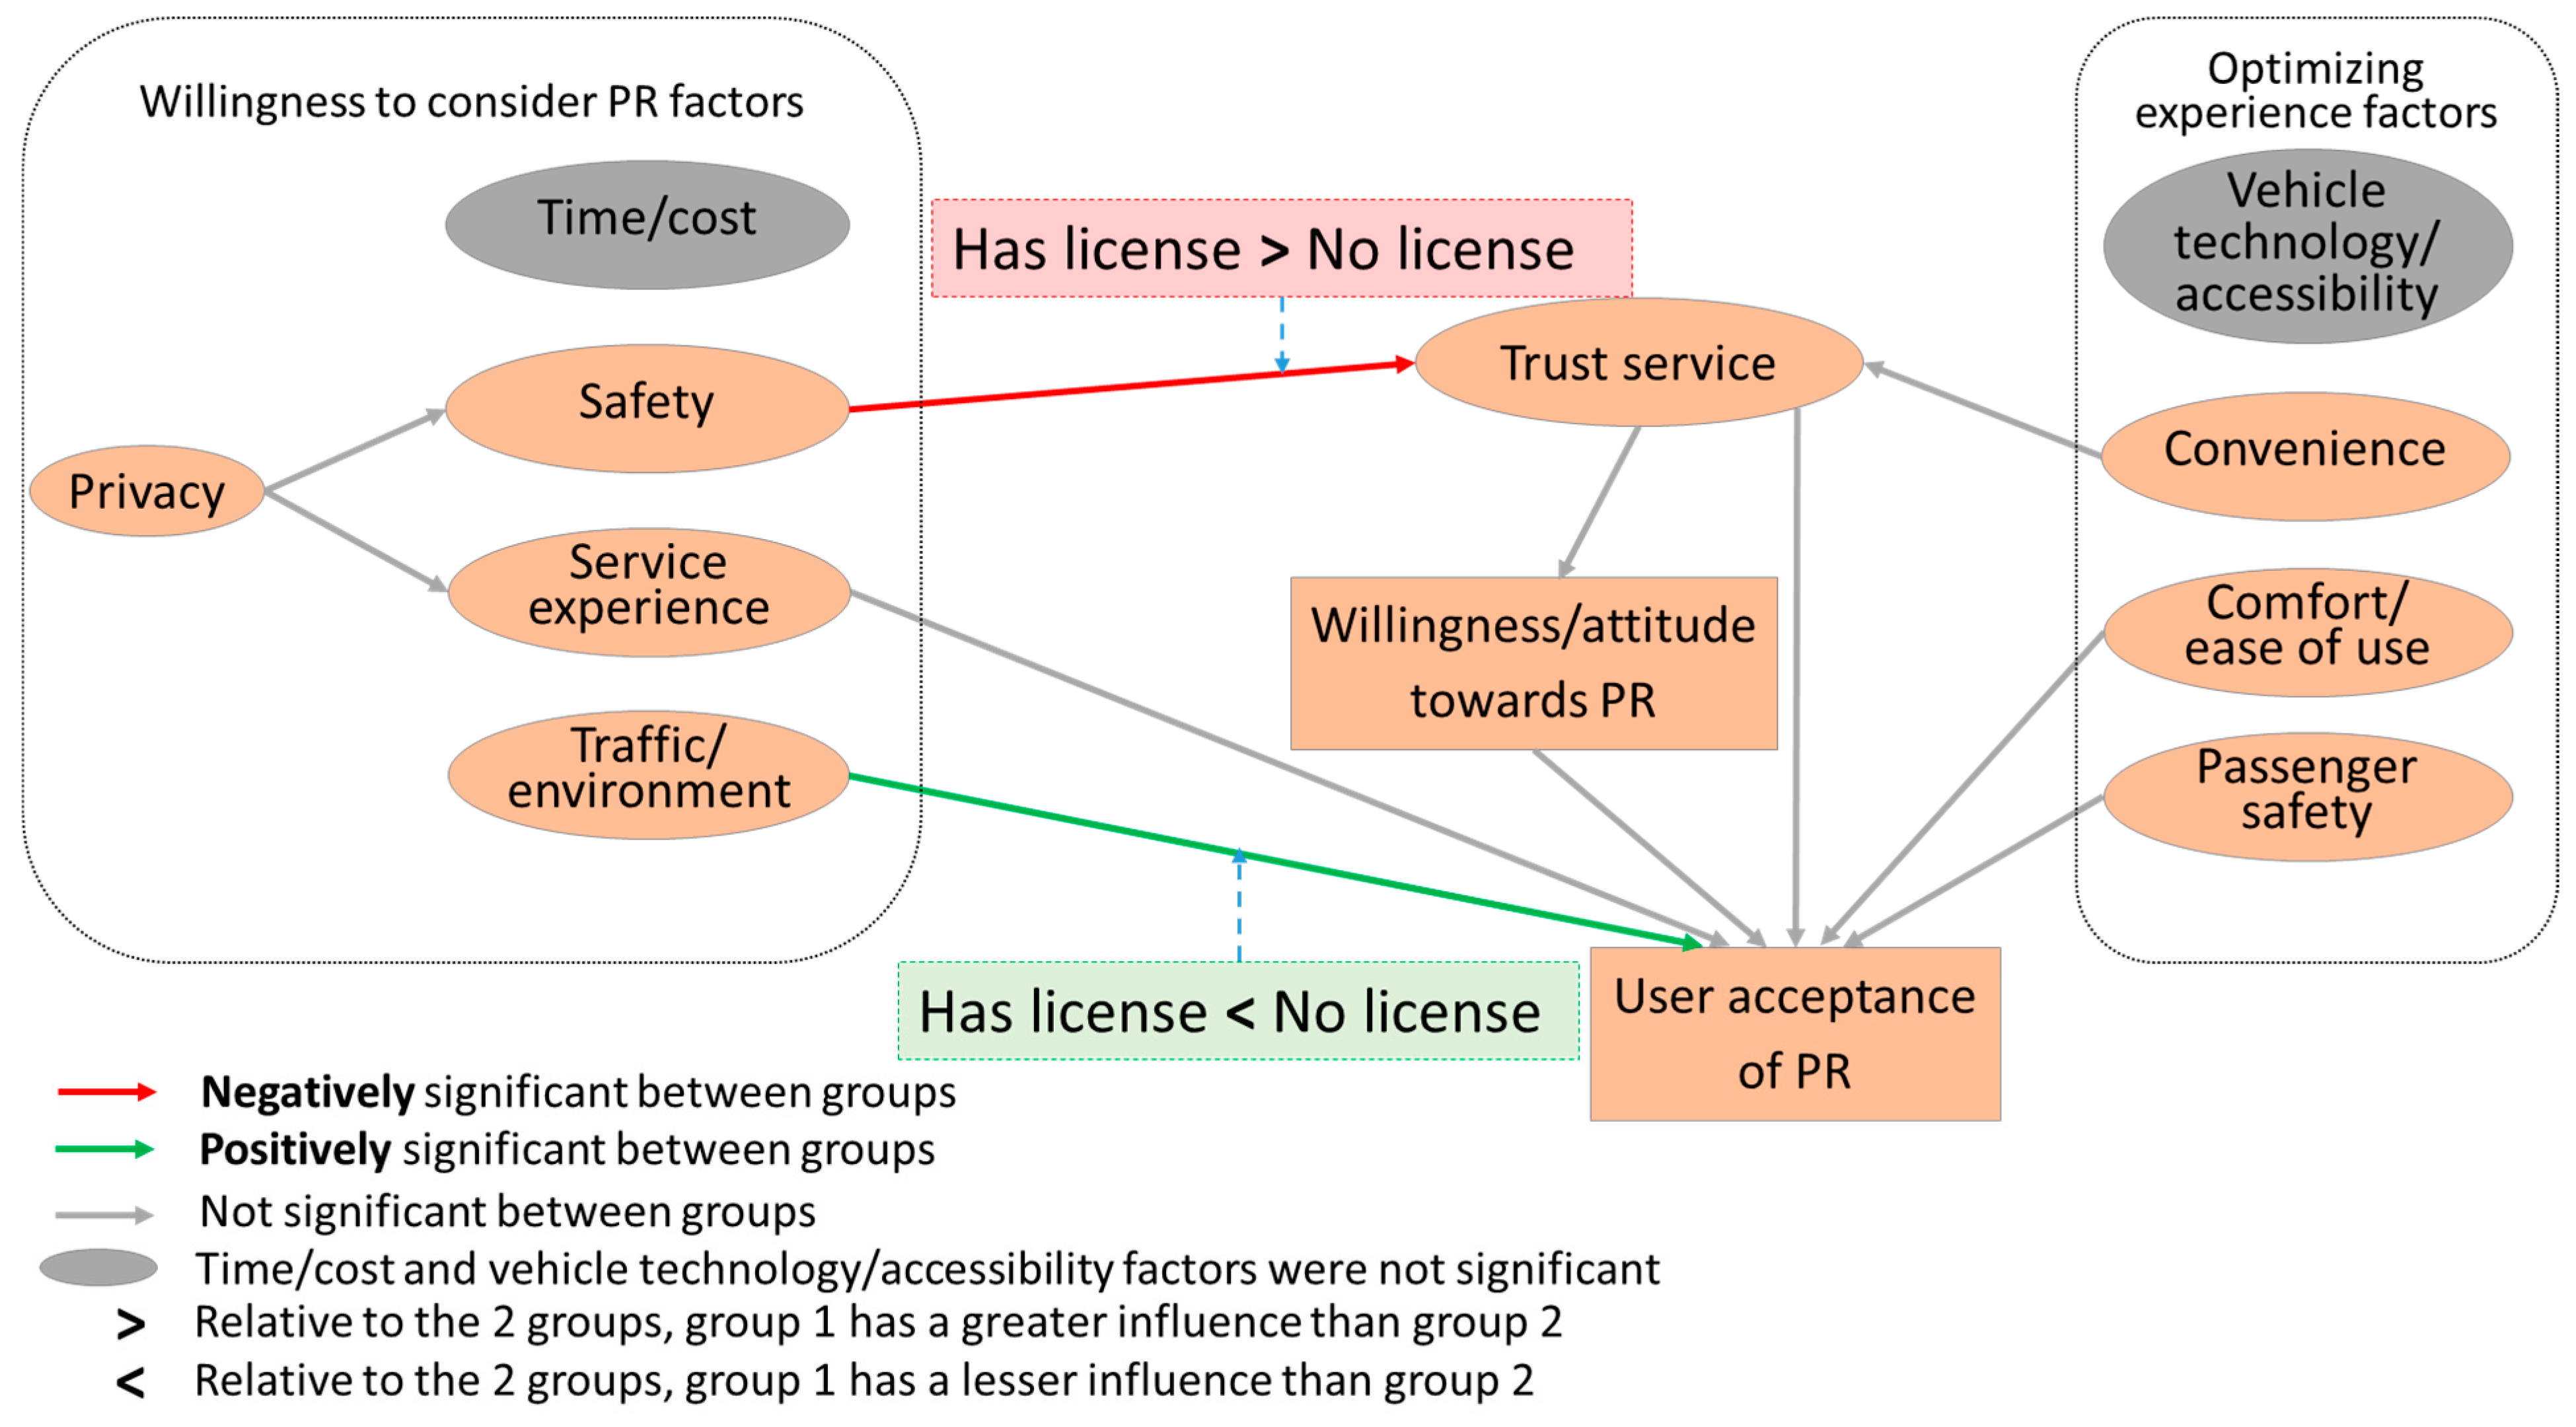
3.4. Driver’s License
The
driver’s license moderator consisted of two groups (1)
has license and (2)
no license.
Table 5 shows the regression paths that were significantly different from the unconstrained model. The
safety → trust service (∆χ
2 = 5.658,
p < 0.05) and
traffic/environment → user acceptance of PR (∆χ
2 = 4.204,
p < 0.05) regression paths were significantly different from the unconstrained model, indicating the moderator,
driver’s license, influenced these two paths.
Next, the group differences using model comparison were obtained for the significant regression paths, see
Figure 5.
Safety had a greater negative influence on
trust service for the
has license (
β = −0.666) group compared to the
no license (
β = −0.626) group. In comparison to the
has license group (
β = 0.043),
traffic/environment had a greater influence on
user acceptance of PR for the
no license (
β = 0.189) group.
These findings suggest differing priorities between individuals possessing a driver’s license and those without. Those with a driver’s license placed a higher emphasis on safety aspects when establishing trust in PR services, which suggests that addressing safety concerns might be particularly effective in increasing PR acceptance among license holders. Individuals without a driver’s license demonstrated a greater sensitivity to traffic and environmental factors in their acceptance of PR services. Therefore, emphasizing the positive impact of PR services on traffic reduction and environmental sustainability may influence this group more effectively.
3.5. Rideshare Experience
The
rideshare experience moderator consisted of two groups: (1)
has rideshare experience and (2)
does not have rideshare experience.
Table 6 shows the regression paths that were significantly different from the unconstrained model. The
privacy → safety (∆χ
2 = 6.982,
p < 0.01),
safety → trust service (∆χ
2 = 4.196,
p < 0.05),
service experience → user acceptance of PR (∆χ
2 = 6.517,
p < 0.05),
trust service → willingness/attitude towards PR (∆χ
2 = 4.713,
p < 0.05), and
willingness/attitude towards PR → user acceptance of PR (∆χ
2 = 12.562,
p < 0.001) regression paths were significantly different from the unconstrained model, indicating the moderator,
rideshare experience, influenced these five paths.
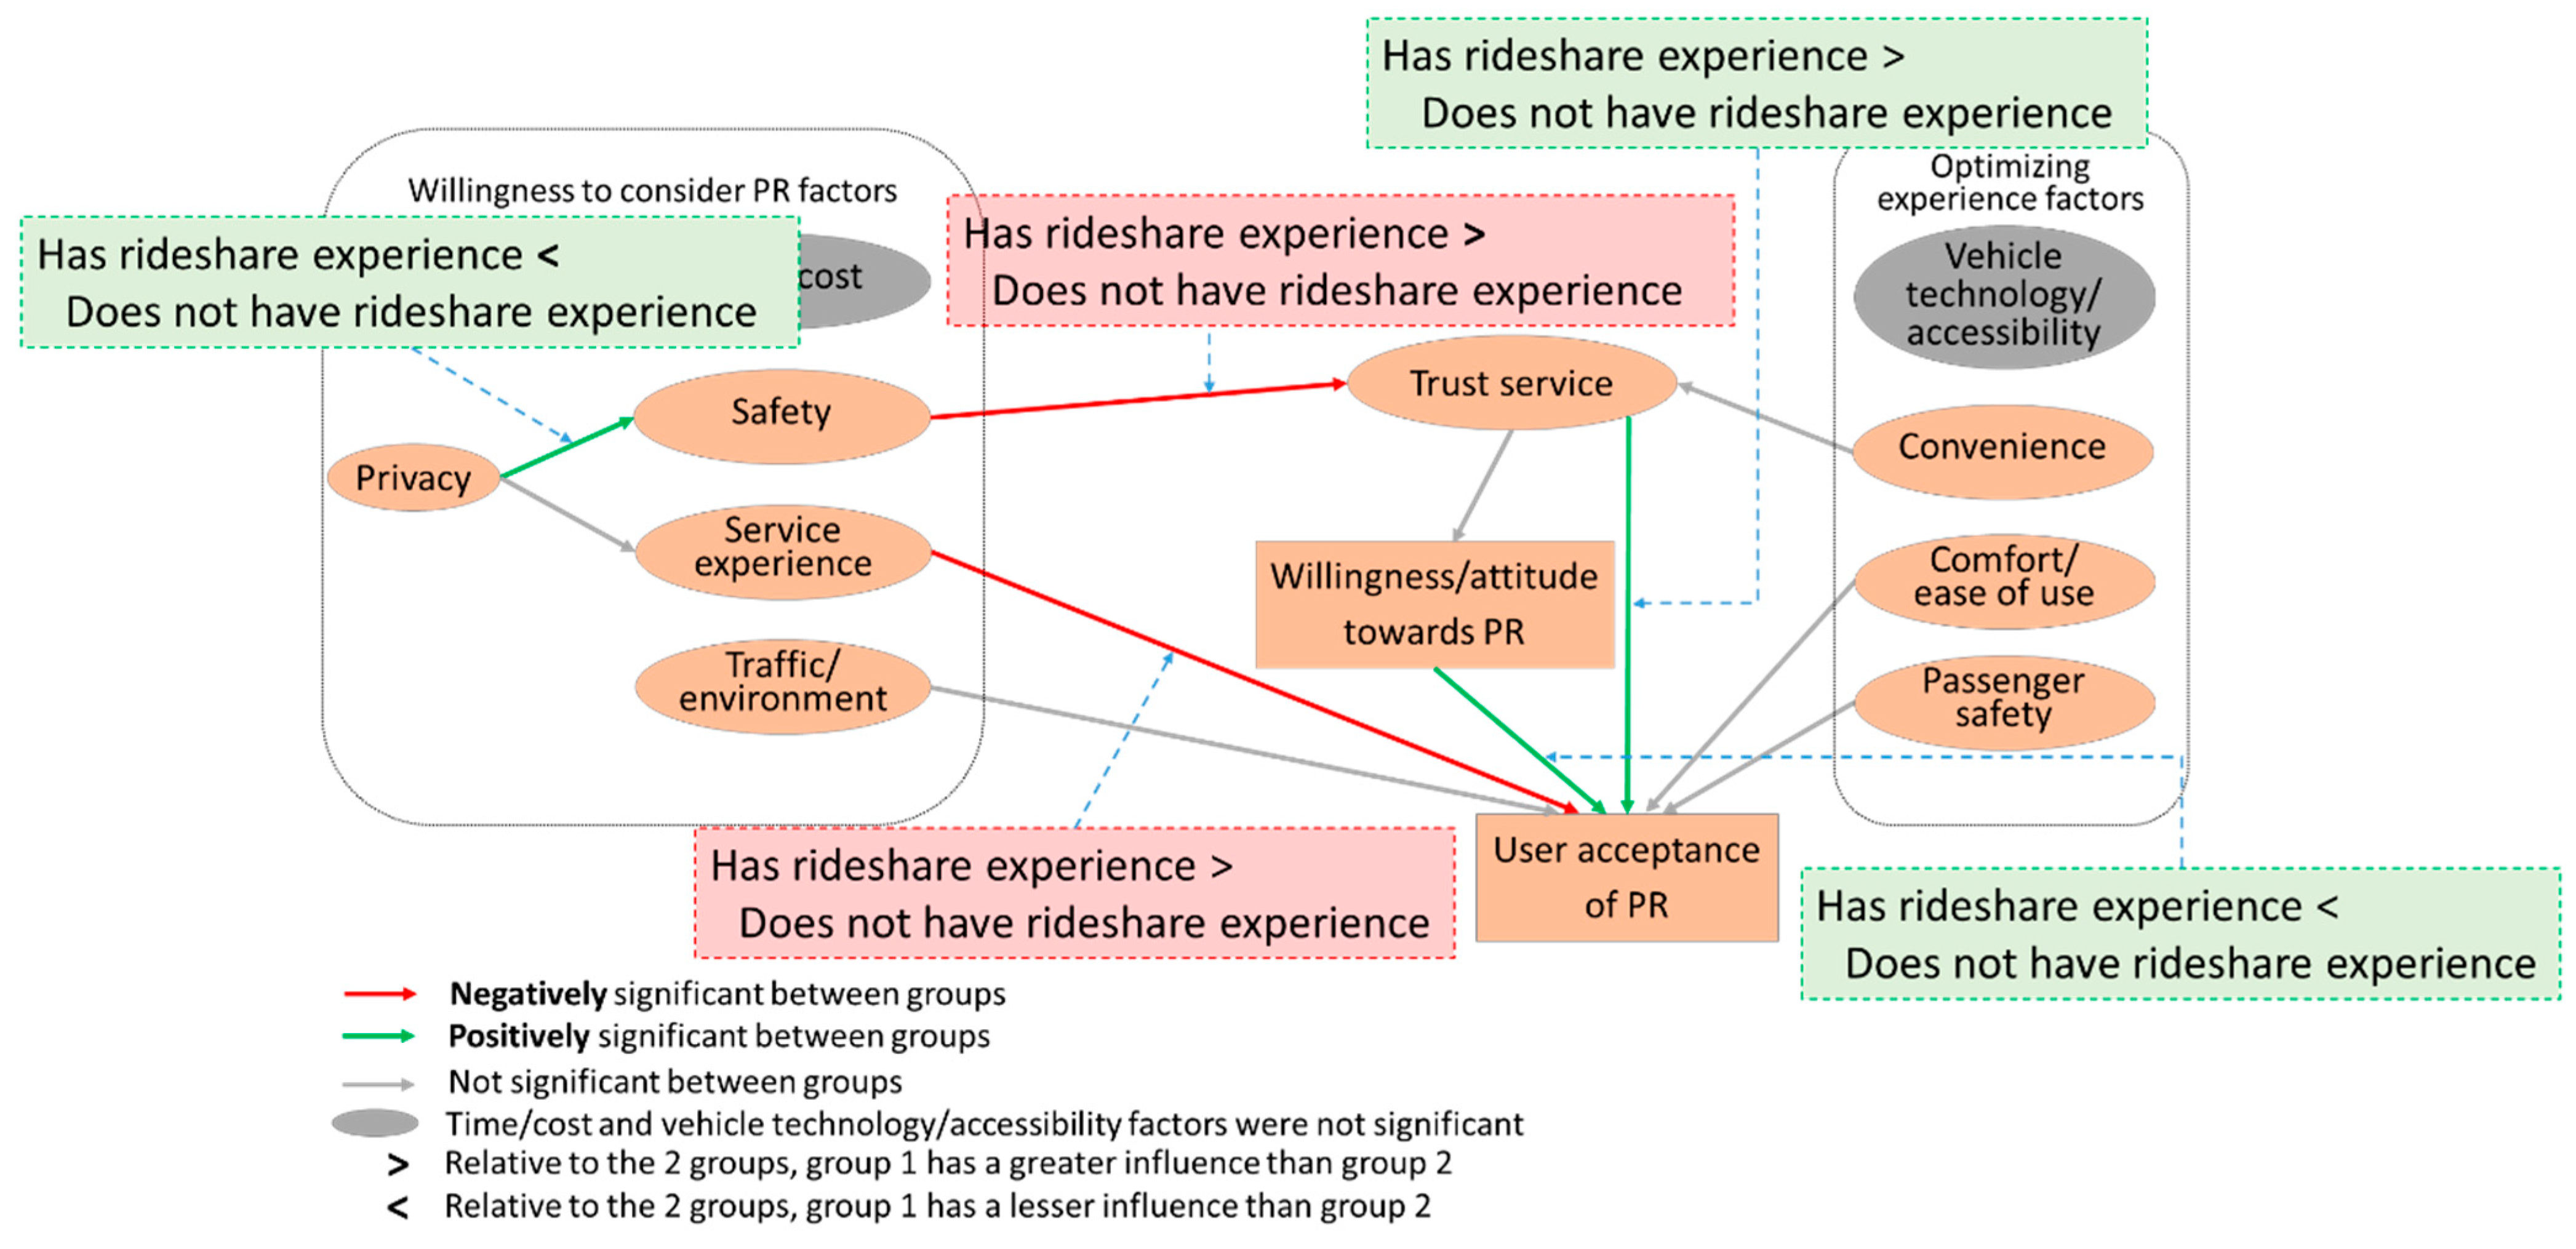
Next, the group differences using model comparison were obtained for the significant regression paths (see
Figure 6). In comparison to the
has rideshare experience (
β = 0.985) group,
privacy had a greater influence on
safety for the
does not have rideshare experience (
β = 0.987) group. In comparison to the
does not have rideshare experience group (
β = −0.596),
safety had a greater negative influence on
trust service for the
has rideshare experience (
β = −0.806) group. In comparison to the
does not have rideshare experience group (
β = −0.003),
service experience had a greater negative influence on
user acceptance of PR for the
has rideshare experience group (
β = −0.123). In comparison to the
does not have rideshare experience group (
β = 0.473),
trust service had a greater influence on
willingness towards PR for the
has rideshare experience (
β = 0.64) group. In comparison to the
has rideshare experience group (
β = 0.315),
willingness towards PR had a greater influence on
user acceptance of PR for the
does not have rideshare experience (
β = 0.351) group.
The influence of different factors on perceptions and behaviors towards PR adoption differs considerably between users with and without previous rideshare experience. For those without prior rideshare experience, privacy appears to be a primary concern that significantly influences their perceptions regarding safety. This implies that in order to attract new users, it may be crucial to proactively address these potential riders’ privacy concerns. For experienced rideshare users, safety concerns have a significant negative impact on trust in PR services, implying that these riders prioritize safety and expect reliable, trustworthy services. The overall service experience is also different between these two groups. Among users with rideshare experience, service experience has a greater negative influence on their acceptance of PR, suggesting that efforts to retain these riders should prioritize improving the overall service experience. Similarly, trust in PR services has a greater positive influence on experienced users’ willingness towards PR, further reinforcing the importance of building and maintaining trust among these riders. The willingness towards PR emerges as an influential factor for users without rideshare experience, with a significant positive influence on their acceptance of PR. This finding shows the importance of effectively promoting the benefits of PR to potential new users in order to positively influence their acceptance of PR services.
3.6. School Completion
The
school completion moderator consisted of four groups: (1)
high school/technical school or less, (2)
some college, (3)
4-year college degree, and (4)
graduate school/advanced degree.
Table 7(A) shows the regression paths that were significantly different from the unconstrained model. The
privacy → service experience (∆χ
2 = 31.169,
p < 0.001) regression path was significantly different from the unconstrained model, indicating the moderator,
school completion, influenced this one path.
Next, the group differences using model comparison were obtained for the significant regression paths, as shown in
Table 7(B) and
Figure 7. In comparison to
high school/technical school or less (
β = 0.543) respondents,
privacy had a lesser influence on
service experience for the
graduate school/advanced degree (
β = 0.369) respondents. In comparison to
some college (
β = 0.598) respondents,
privacy had a lesser influence on
service experience for
graduate school/advanced degree (
β = 0.369) respondents. In comparison to
4-year college degree (
β = 0.691) respondents,
privacy had a lesser influence on
service experience for
graduate school/advanced degree (
β = 0.369) respondents.
Those individuals with higher education levels, specifically those riders with an advanced degree, reported less concerns about privacy when evaluating service experiences related to PR services in comparison to riders with less education. This tendency may imply that those individuals with an advanced degree may have a more comprehensive understanding of privacy policies and security measures associated with PR services, or that they do not have the same biases or concerns as the other riders with less education. Regardless, this divergence in privacy concerns highlights the diverse ways in which different groups approach and interact with PR services and demonstrates the need for varying approaches to address privacy concerns with PR for potential riders with different educational backgrounds rather than a “one size fits all” approach.
3.7. Employment Status
The
employment status moderator consisted of six groups: (1)
employed, (2)
student, (3)
student employed, (4)
seeking employment, (5)
retired, and (6)
unable to work.
Table 8(A) shows the regression paths that were significantly different from the unconstrained model. The
privacy → safety (∆χ
2 = 107.227,
p < 0.001) and
willingness/attitude towards PR → user acceptance of PR (∆χ
2 = 31.523,
p < 0.001) regression paths were significantly different from the unconstrained model, indicating the moderator,
employment status, influenced these two paths.
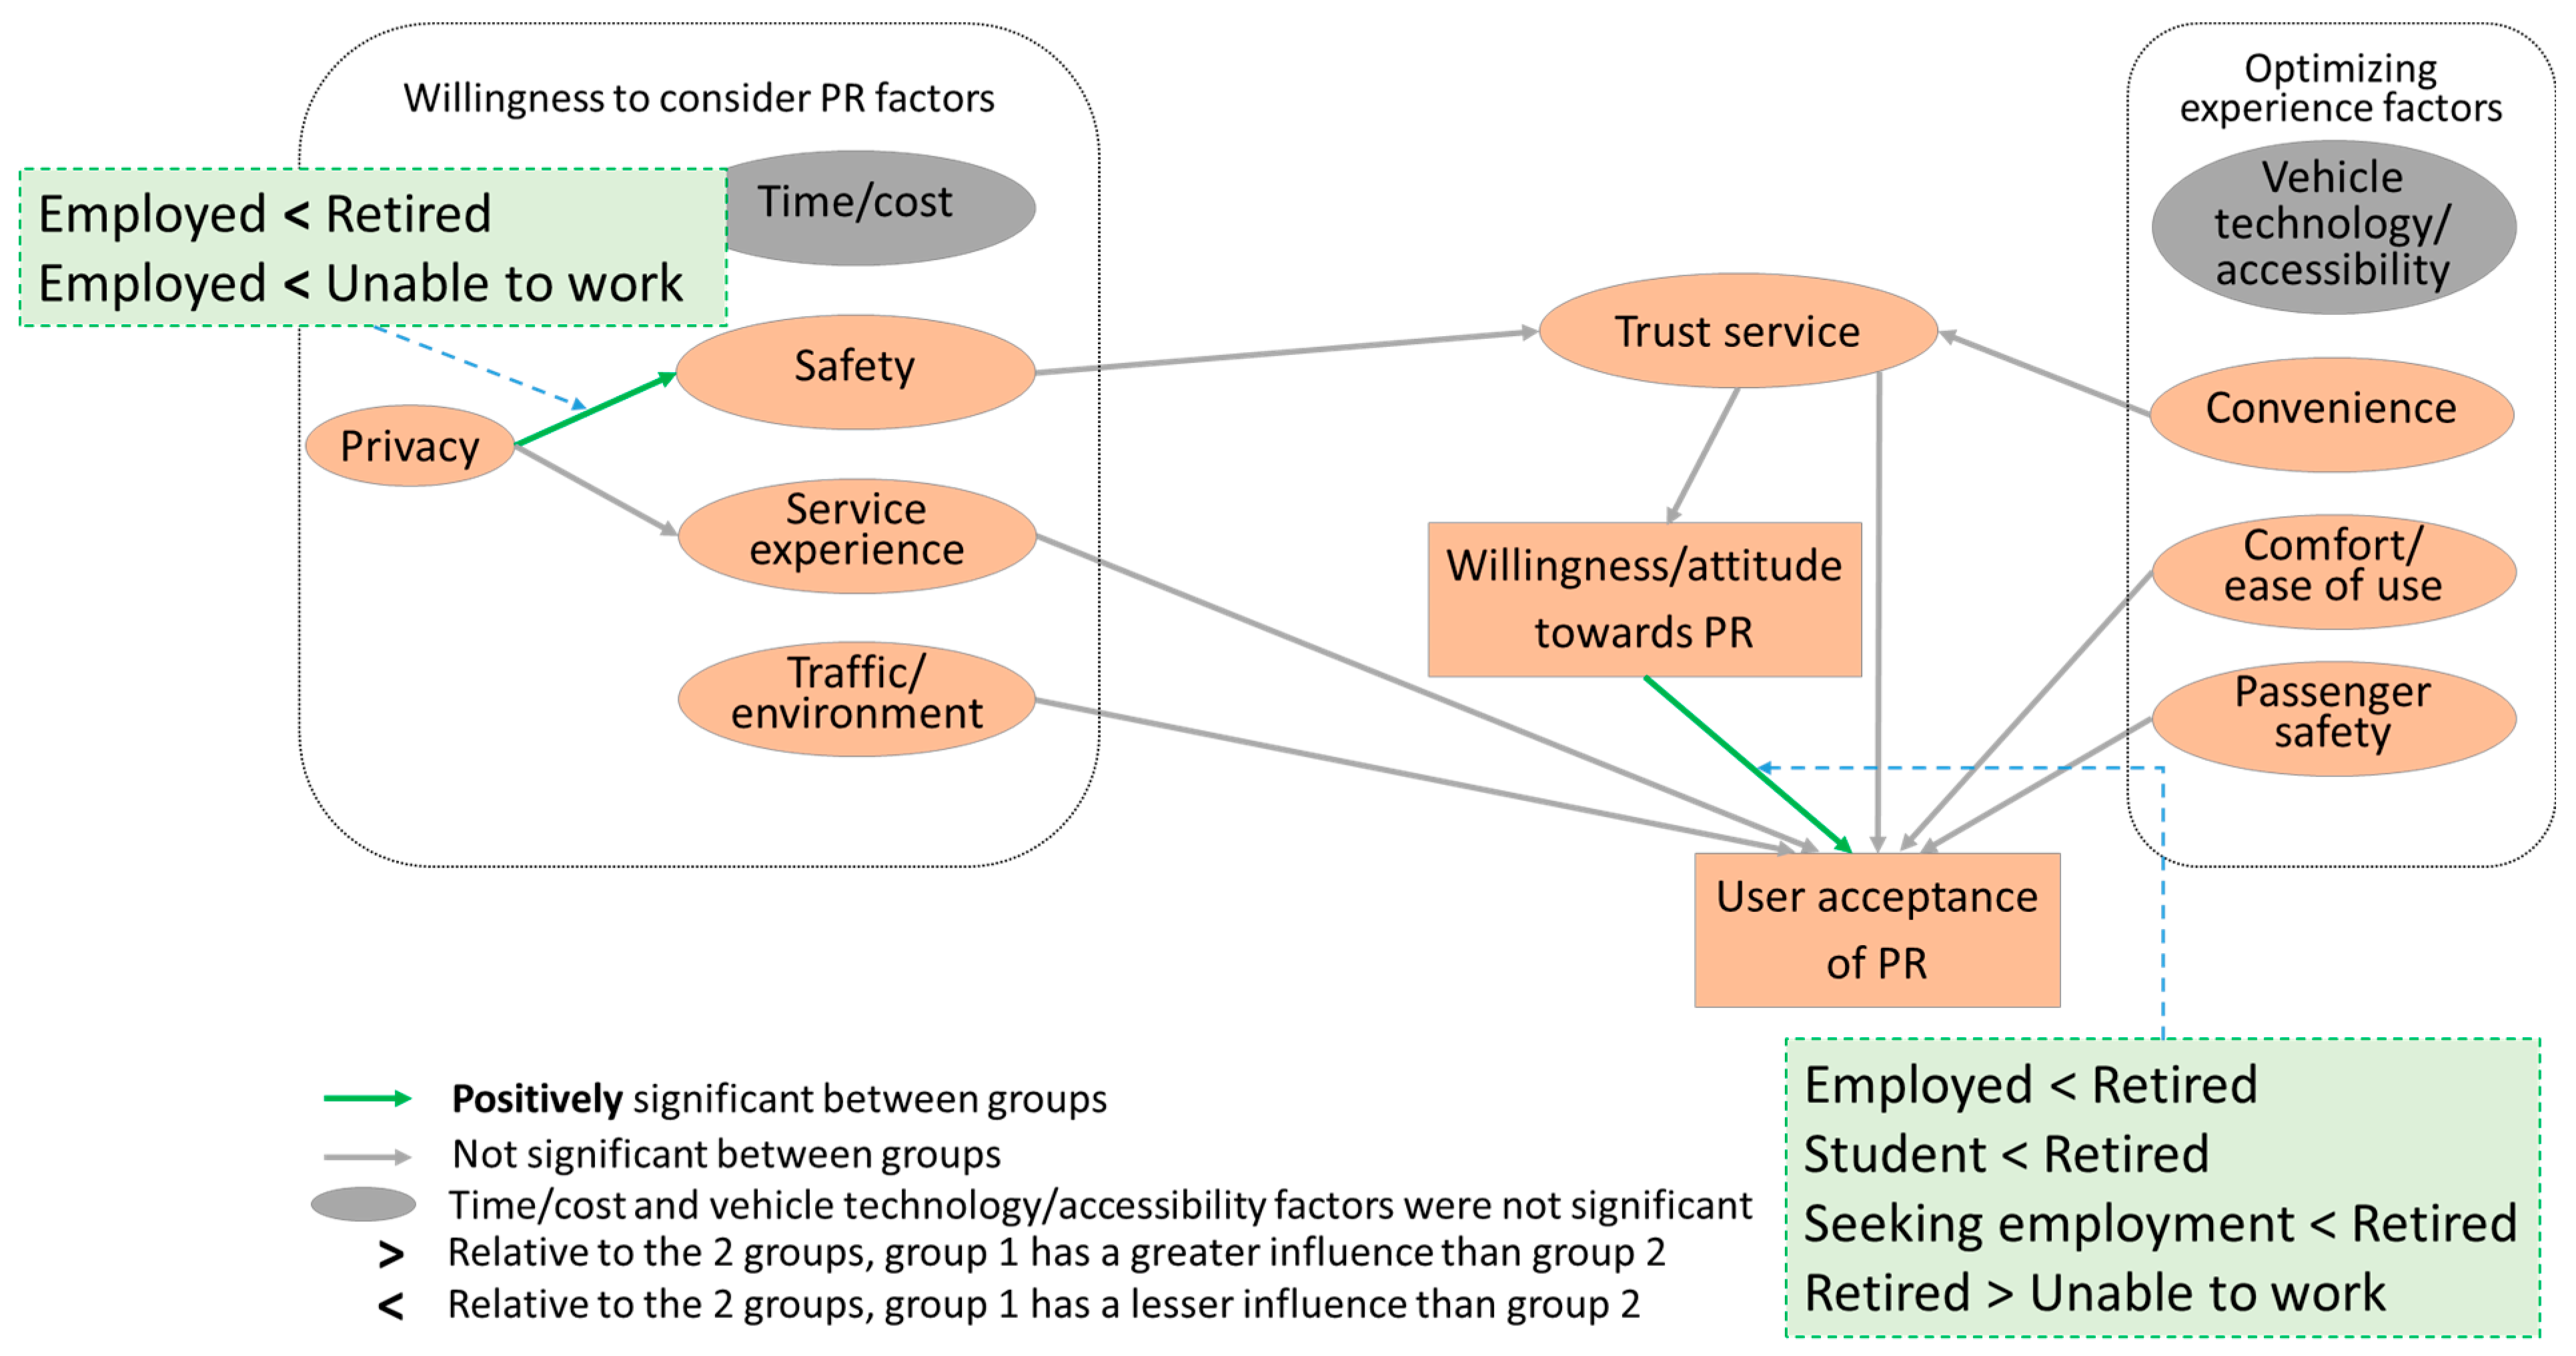
Next, the group differences using the model comparison were obtained for the significant regression paths, as shown in
Table 8(B) and
Figure 8. In comparison to
retired (
β = 1.297),
privacy had a lesser influence on
safety for the
employed (
β = 0.882) group. Similarly, in comparison to
unable to work (
β = 0.922),
privacy had a lesser influence on
safety for the
employed (
β = 0.882) group. In comparison to
employed (
β = 0.34),
willingness/attitude towards PR had a greater influence on
user acceptance of PR for the
retired (
β = 0.454) group. In comparison to
student (
β = 0.269),
willingness/attitude towards PR had a greater influence on
user acceptance of PR for the
retired (
β = 0.454) group. In comparison to
seeking employment (
β = 0.251),
willingness/attitude towards PR had a greater influence on
user acceptance of PR for the
retired (
β = 0.454) group. In comparison to
unable to work respondents (
β = 0.249),
willingness/attitude towards PR had a greater influence on
user acceptance of PR for the
retired (
β = 0.454) group.
When examining the role of employment status in the context of PR services, it was observed that the employed individuals are less concerned about privacy as compared to their retired or unable to work counterparts. This may indicate different priorities, biases, or risk perceptions between these groups. On the other hand, the willingness or positive attitude towards PR services holds a greater influence for the retired group than for employed individuals, students, those seeking employment, and individuals unable to work. This may suggest a potential openness or receptivity to PR services among retired individuals, perhaps due to different lifestyles, fewer time demands, or transportation preferences. Alternatively, retired individuals may face age-related challenges that their younger peers do not and may be open to alternative forms of transportation if they have retired from driving or see peers who are no longer able to drive. Understanding these differences in privacy concerns based upon one’s stage in life and willingness to use PR, based on employment status, may provide valuable insights for targeted service improvements and/or promotional strategies.
3.8. Number of People in the Household
The
number of people in the household moderator consisted of four groups: (1)
one, (2)
two, (3)
three, and (4)
more than three.
Table 9(A) shows the regression paths that were significantly different from the unconstrained model. The
safety → trust service (∆χ
2 = 9.354,
p < 0.05),
trust service → willingness/attitude towards PR (∆χ
2 = 84.601,
p < 0.001)
, trust service → user acceptance of PR (∆χ
2 = 7.962,
p < 0.05), and
willingness/attitude towards PR → user acceptance of PR (∆χ
2 = 14.164,
p < 0.01) regression paths were significantly different from the unconstrained model, indicating the moderator,
number of people in the household, influenced these four paths.
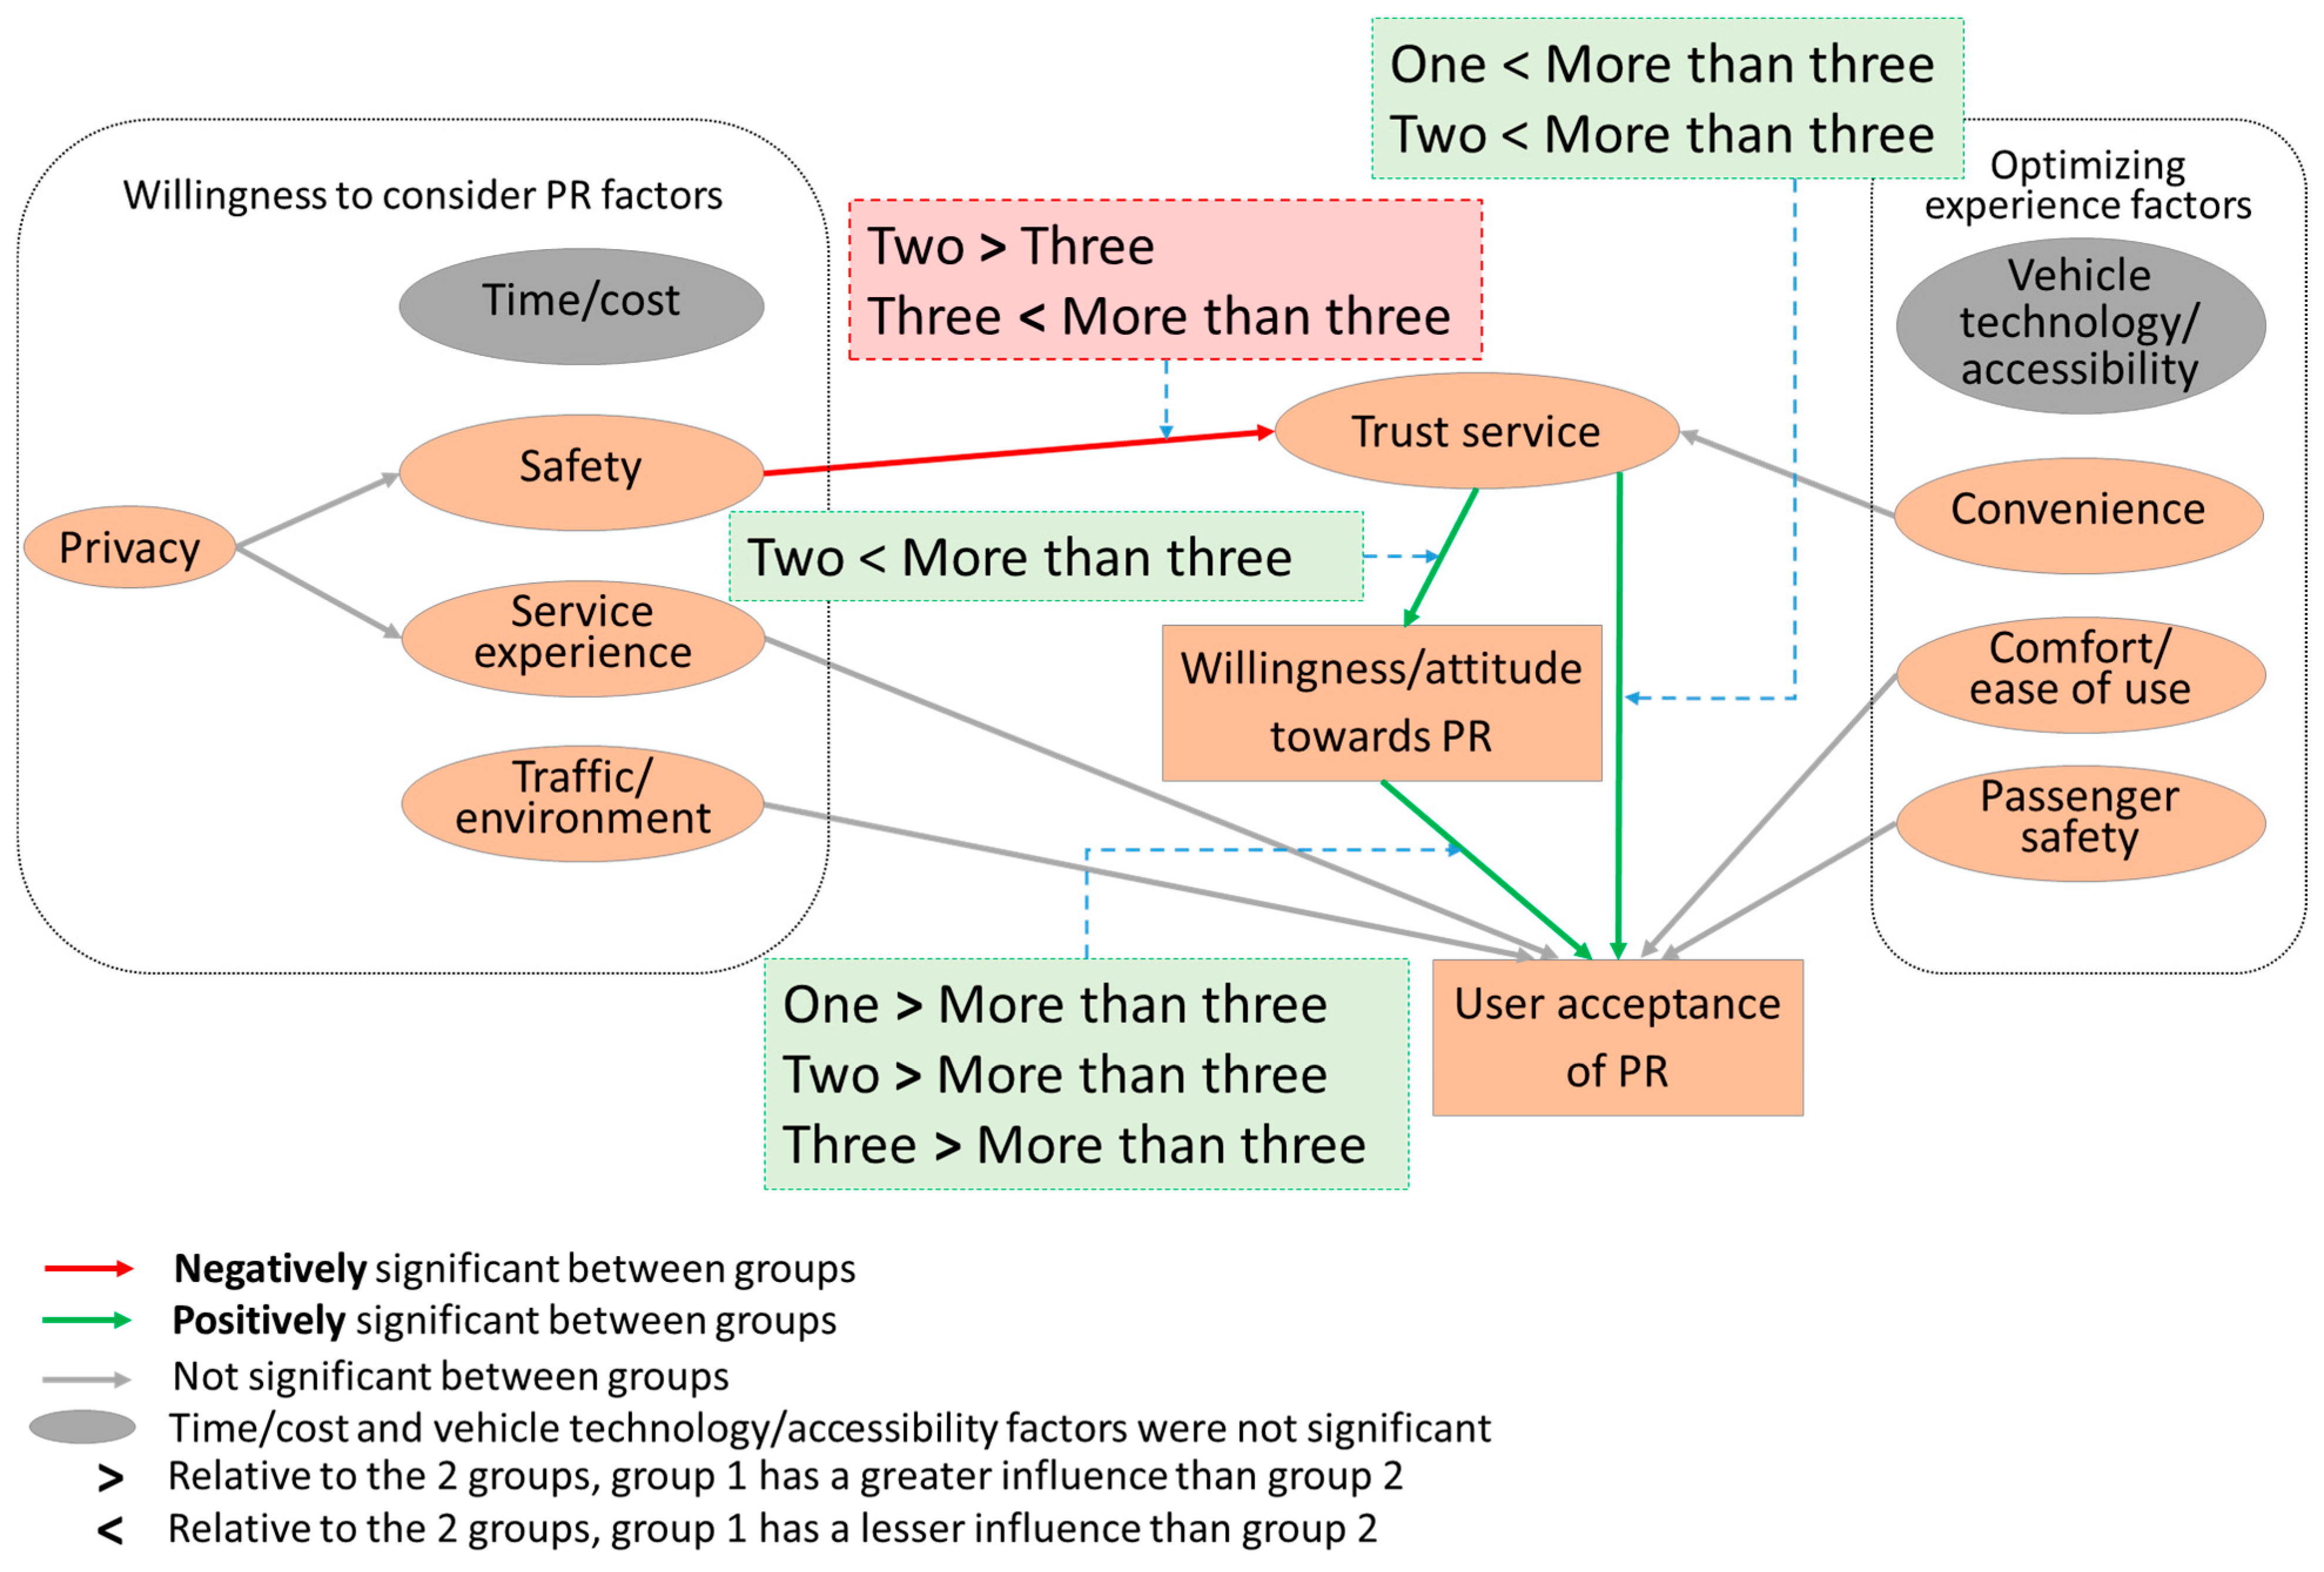
Next, the group differences using model comparison were obtained for the significant regression paths, as shown in
Table 9(B) and
Figure 9. In comparison to
two (
β = −0.733) people in the household,
safety had a lesser negative influence on
trust service for
three (
β = −0.496) people in the household. In comparison to
three (
β = −0.496) people in the household,
safety had a greater negative influence on
trust service for
more than three (
β = −0.839) people in the household. In comparison to
two (
β = 0.597) people in the household,
trust service had a greater influence on
willingness/attitude towards PR for
more than three (
β = 0.602) people in the household. In comparison to
one (
β = 0.251) person in the household,
trust service had a greater influence on
user acceptance of PR for
more than three (
β = 0.349) people in the household. Similarly, in comparison to
two (
β = 0.273) people in the household,
trust service had a greater influence on
user acceptance of PR for
more than three (
β = 0.349) people in the household. In comparison to
one (
β = 0.406) person in the household,
willingness/attitude towards PR had a lesser influence on
user acceptance of PR for
more than three (
β = 0.287) people in the household. In comparison to
two (
β = 0.378) people in the household,
willingness/attitude towards PR had a lesser influence on
user acceptance of PR for
more than three (
β = 0.287) people in the household. In comparison to
three (
β = 0.377) people in the household,
willingness/attitude towards PR had a lesser influence on
user acceptance of PR for
more than three (
β = 0.287) people in the household.
When comparing the impact of various factors across households of different sizes, some important findings were identified. For households with more than three people, the importance of safety has a more pronounced negative effect on trust in PR services compared to those households with two or three members. Similarly, in larger households (more than three people), the influence of trust in the service on their willingness or attitude towards PR is stronger when compared to those households with only two people. This heightened trust also extends to user acceptance of PR, where larger households exhibit a stronger relationship between trust in the service and acceptance of PR, compared to households comprising one or two individuals. When it comes to the impact of willingness or attitude towards PR on its acceptance, households with more than three people show a smaller influence of willingness or attitude towards PR on its acceptance when compared to households with one, two, or three people. These observations suggest that the size of the household may strongly influence a household’s perceptions and acceptance of PR services.
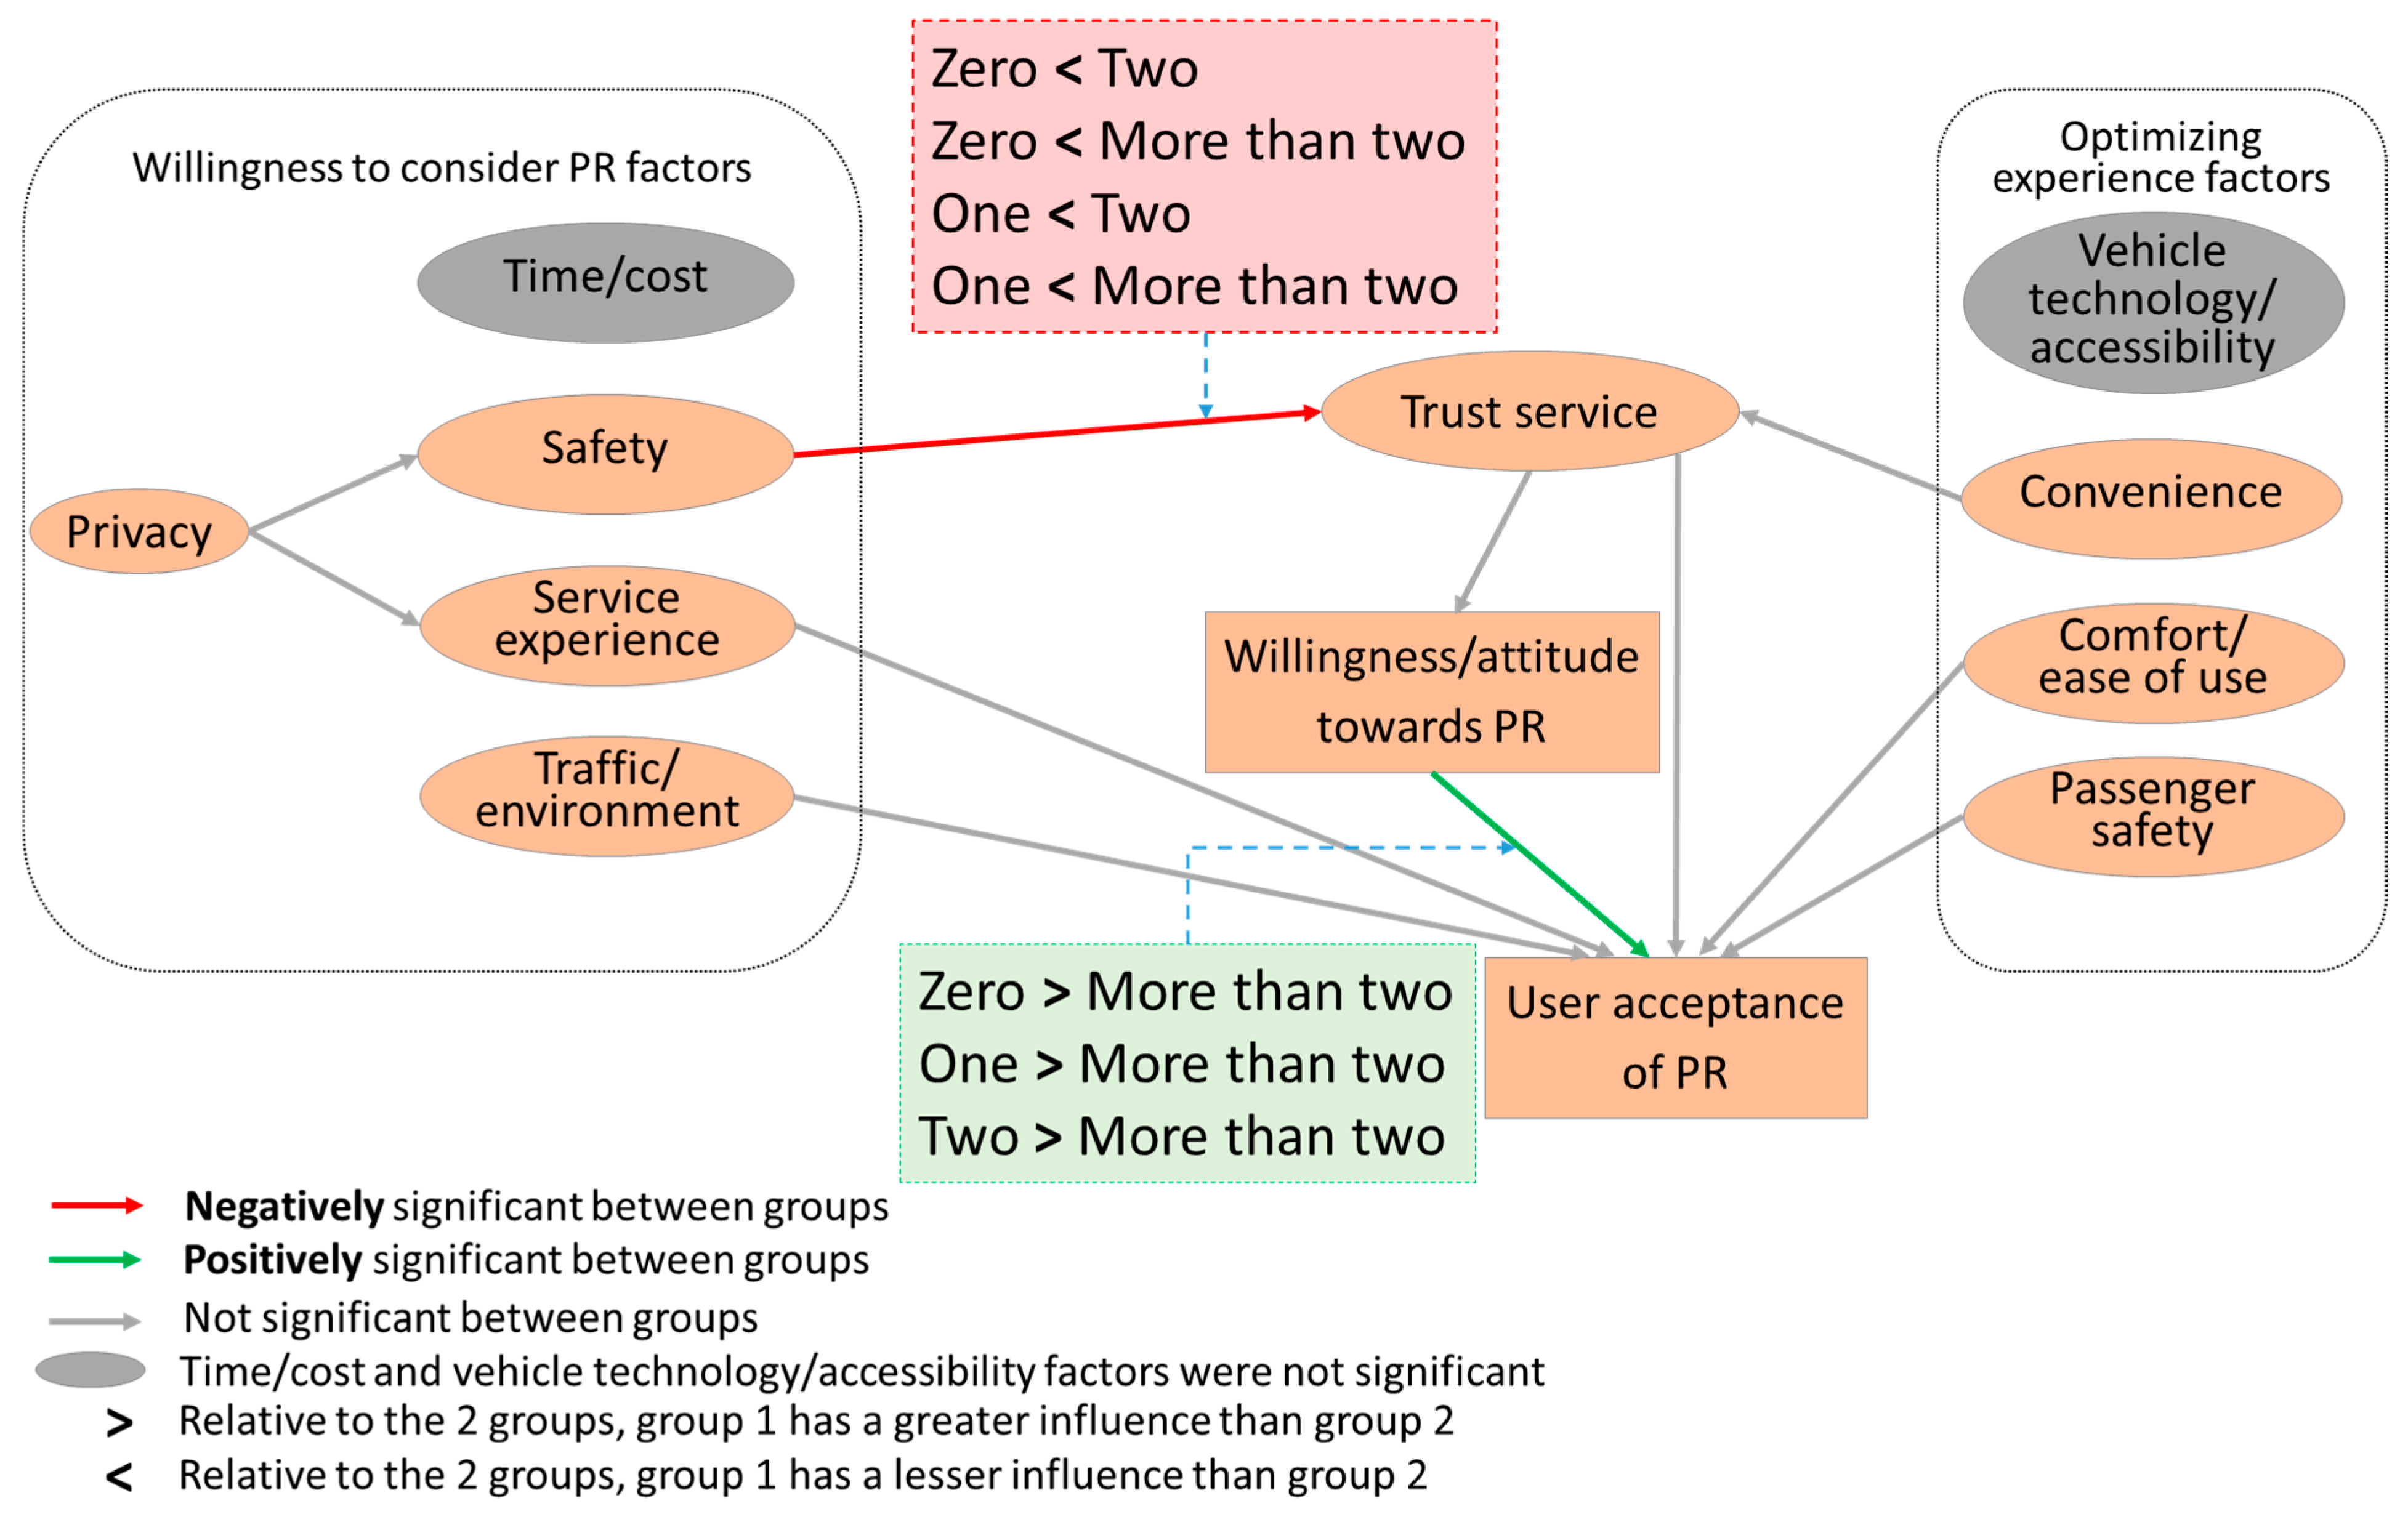
3.9. Number of Children
The
number of children moderator consisted of four groups: (1)
zero, (2)
one, (3)
two, and (4)
more than two.
Table 10(A) shows the regression paths that were significantly different from the unconstrained model. The
traffic/environment → user acceptance of PR (∆χ
2 = 10.636,
p < 0.05),
trust service → willingness/attitude towards PR (∆χ
2 = 10.672,
p < 0.05), and
willingness/attitude towards PR → user acceptance of PR (∆χ
2 = 34.779,
p < 0.001) regression paths were significantly different from the unconstrained model, indicating the moderator
number of children influenced these three paths.
Next, the group differences using model comparison were obtained for the significant regression paths, as shown in
Table 10(B) and
Figure 10. In comparison to
zero (
β = 0.034) children in the household,
traffic/environment had a greater influence on
user acceptance of PR for
two (
β = 0.23) children in the household. Similarly, in comparison to
one (
β = 0.038) child,
traffic/environment had a greater influence on
user acceptance of PR for
two (
β = 0.23) children. In comparison to
zero (
β = 0.578) children,
trust service had a greater influence on
willingness towards PR for a family with
one (
β = 0.636) child. In comparison to
zero (
β = 0.393) children,
willingness towards PR had a lesser influence on
user acceptance of PR for
two (
β = 0.179) children. Similarly, in comparison to
one (
β = 0.345) child,
willingness towards PR had a lesser influence on
user acceptance of PR for
two (
β = 0.179) children in the household.
The analysis of the influence of the number of children in a household on the acceptance and utilization of PR services reveals significant implications. Different family sizes exhibit varying attitudes and priorities when considering PR services. Households with two children place more emphasis on traffic and environmental considerations, while trust in PR service is more prominent for families with one child. Additionally, the willingness to use PR services does not necessarily translate into acceptance for larger families, highlighting the complexity of decision-making processes in these groups. For example, larger families may have specific safety and logistical requirements that are not being met by existing PR services, such as not enough room for multiple car seats. These findings emphasize the need for PR service providers to understand that family size is not just a demographic attribute but a significant factor that influences transportation preferences and requirements, thus necessitating tailored strategies to meet the needs of different family groups.
3.10. Household Annual Income
The
household annual income moderator consisted of six groups: (1)
less than USD 25,000, (2)
USD 25,000 to USD 79,999, (3)
USD 80,000 to USD 149,999, (4)
USD 150,000 to USD 199,999, (5)
USD 200,000 to USD 249,999, and (6)
USD 250,000 or more.
Table 11(A) shows the regression paths that were significantly different from the unconstrained model. The
safety → trust service (∆χ
2 = 25.445,
p < 0.001) and
willingness/attitude towards PR → user acceptance of PR (∆χ
2 = 16.116,
p < 0.01) regression paths were significantly different from the unconstrained model, indicating the moderator,
household annual income, influenced these two paths.
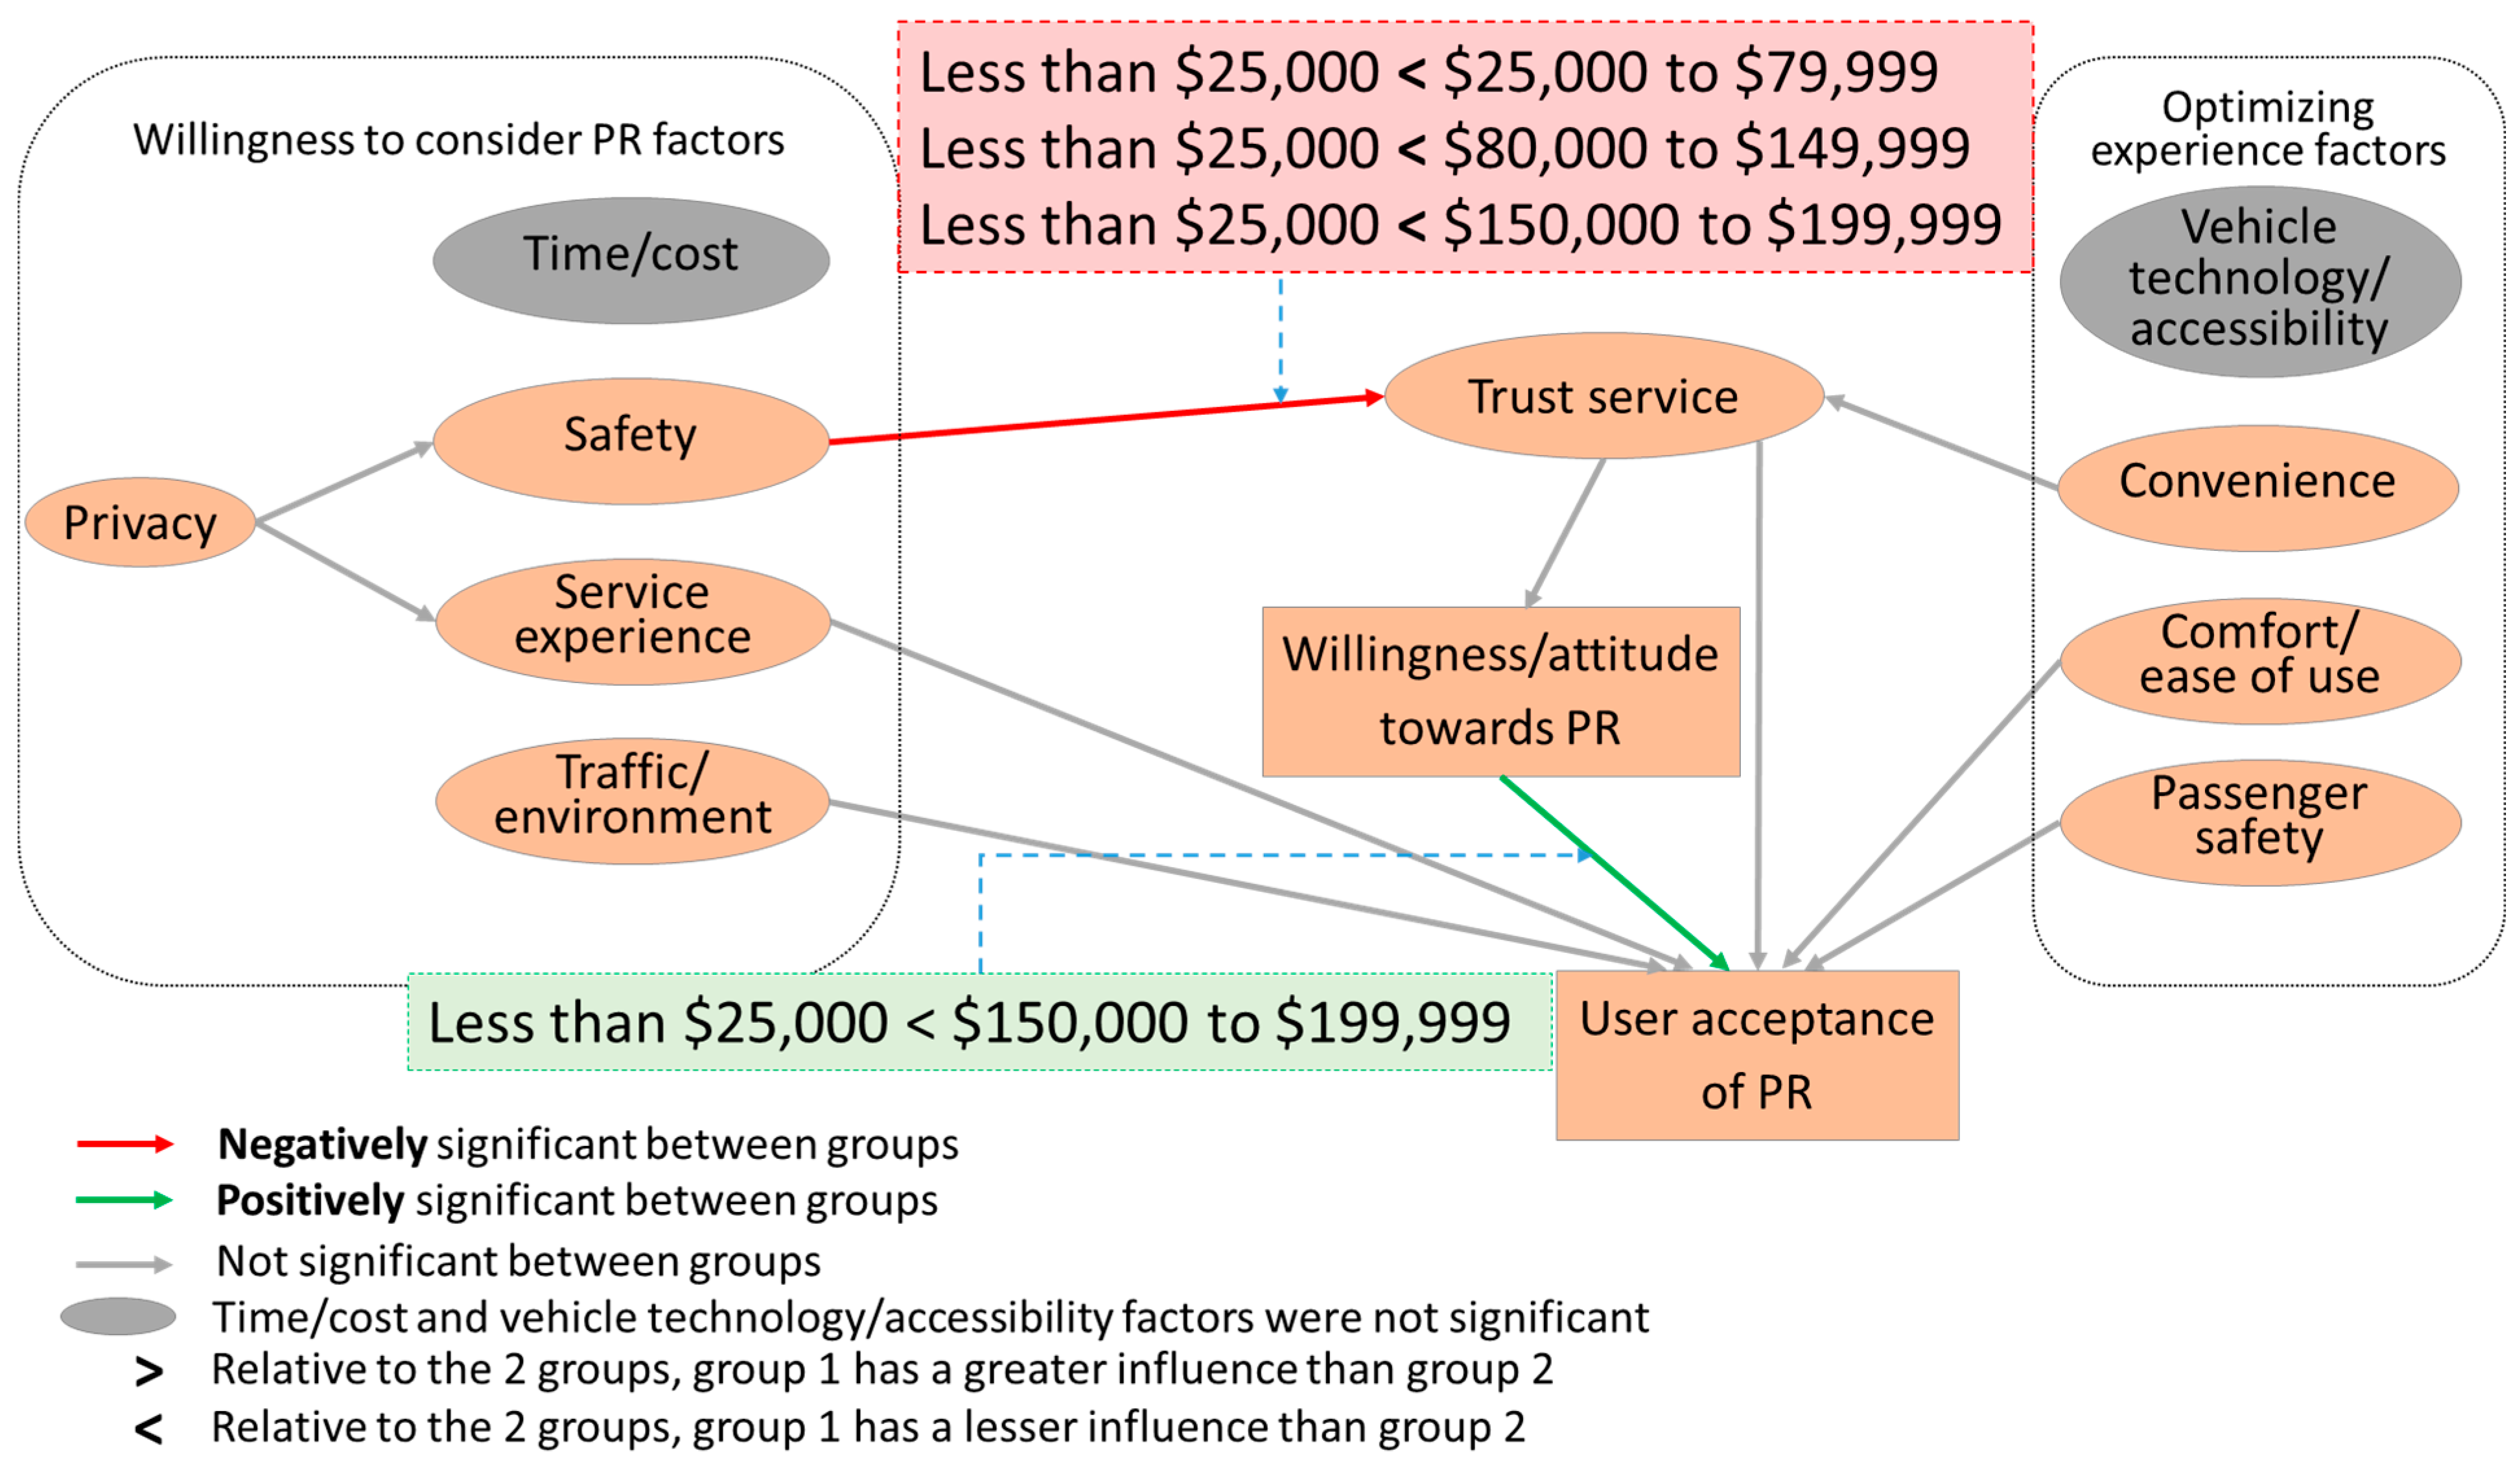
Next, the group differences using model comparison were obtained for the significant regression paths, as shown in
Table 11(B) and
Figure 11. In comparison to the
less than USD 25,000 (
β = −0.716) household annual income,
safety had a greater negative influence on
trust service for the
USD 25,000 to USD 79,999 (
β = −0.798) household annual income. In comparison to the
less than USD 25,000 (
β = −0.716) household annual income,
safety had a greater negative influence on
trust service for the
USD 80,000 to USD 149,999 (
β = −0.788) household annual income. Similarly, in comparison to the
less than USD 25,000 (
β = −0.716) household annual income,
safety had a greater negative influence on
trust service for the
USD 150,000 to USD 199,999 (
β = −0.723) household annual income. In comparison to the
less than USD 25,000 (
β = 0.297) household annual income,
willingness/attitude towards PR had a greater influence on
user acceptance of PR for the
USD 150,000 to USD 199,999 (
β = 0.496) household annual income.
The findings related to household annual income and its influence on the acceptance of PR services highlight variations in different income groups. Specifically, the relationship between safety and trust in PR services is negatively influenced to a greater degree in the income brackets ranging from USD 25k to less than USD 200k when compared to households earning less than USD 25k. Willingness and attitude towards PR have a stronger influence on user acceptance of PR for households earning USD 150k to less than USD 200k. These insights indicate that the perception of safety and the propensity to adopt PR services are not uniform across income levels but are instead influenced by specific financial circumstances. This understanding necessitates that PR providers develop targeted strategies that recognize and respond to the varying attitudes and concerns of users across different income brackets, with particular attention to safety perceptions and the factors that promote willingness to use PR services.
3.11. Number of Vehicles
The
number of vehicles moderator consisted of four groups: (1)
zero, (2)
one, (3)
two, and (4)
more than two.
Table 12(A) shows the regression paths that were significantly different from the unconstrained model. The
safety → trust service (∆χ
2 = 19.100,
p < 0.001) and
willingness/attitude towards PR → user acceptance of PR (∆χ
2 = 15.253,
p < 0.01) regression paths were significantly different from the unconstrained model, indicating the moderator,
number of vehicles, influenced these two paths.
Next, the group differences using model comparison were obtained for the significant regression paths, as shown in
Table 12(B) and
Figure 12.
Safety had a greater negative influence on
trust service for
two (
β = −0.717) vehicles in the household when compared to
zero (
β = −0.467) vehicles. Similarly,
safety had a greater negative influence on
trust service for
two (
β = −0.717) vehicles in the household when compared to
one (
β = −0.591) vehicle.
Safety had a greater negative influence on
trust service for
more than two (
β = −0.893) vehicles in the household when compared to
zero (
β = −0.467) vehicles. Similarly,
safety had a greater negative influence on
trust service for
more than two (
β = −0.893) vehicles in the household when compared to
one (
β = −0.591) vehicle. In comparison to
zero (
β = 0.432),
one (
β = 0.377), and
two (
β = 0.374) vehicles in the household,
willingness/attitude towards PR had a lesser influence on
user acceptance of PR for
more than two (
β = 0.217) vehicles in the household.
The analysis of the number of vehicles as a moderating variable suggests significant variations in how safety and willingness towards PR services impact user acceptance across different groups. Safety has a greater negative impact on trust for households with two or more vehicles than for those with fewer vehicles. Conversely, willingness and attitude towards PR services have a lower influence on user acceptance in households with more than two vehicles. These findings imply that households with more vehicles may have greater concerns about safety, causing a decrease in trust towards PR services. Consequently, PR service providers need to tailor their strategies to enhance user acceptance by focusing on addressing safety concerns, particularly for households with more vehicles. Furthermore, marketing strategies should be more diversified to attract households with various numbers of vehicles, considering the variations in safety and willingness on user acceptance.
3.12. Typical Transport Mode Used to Commute
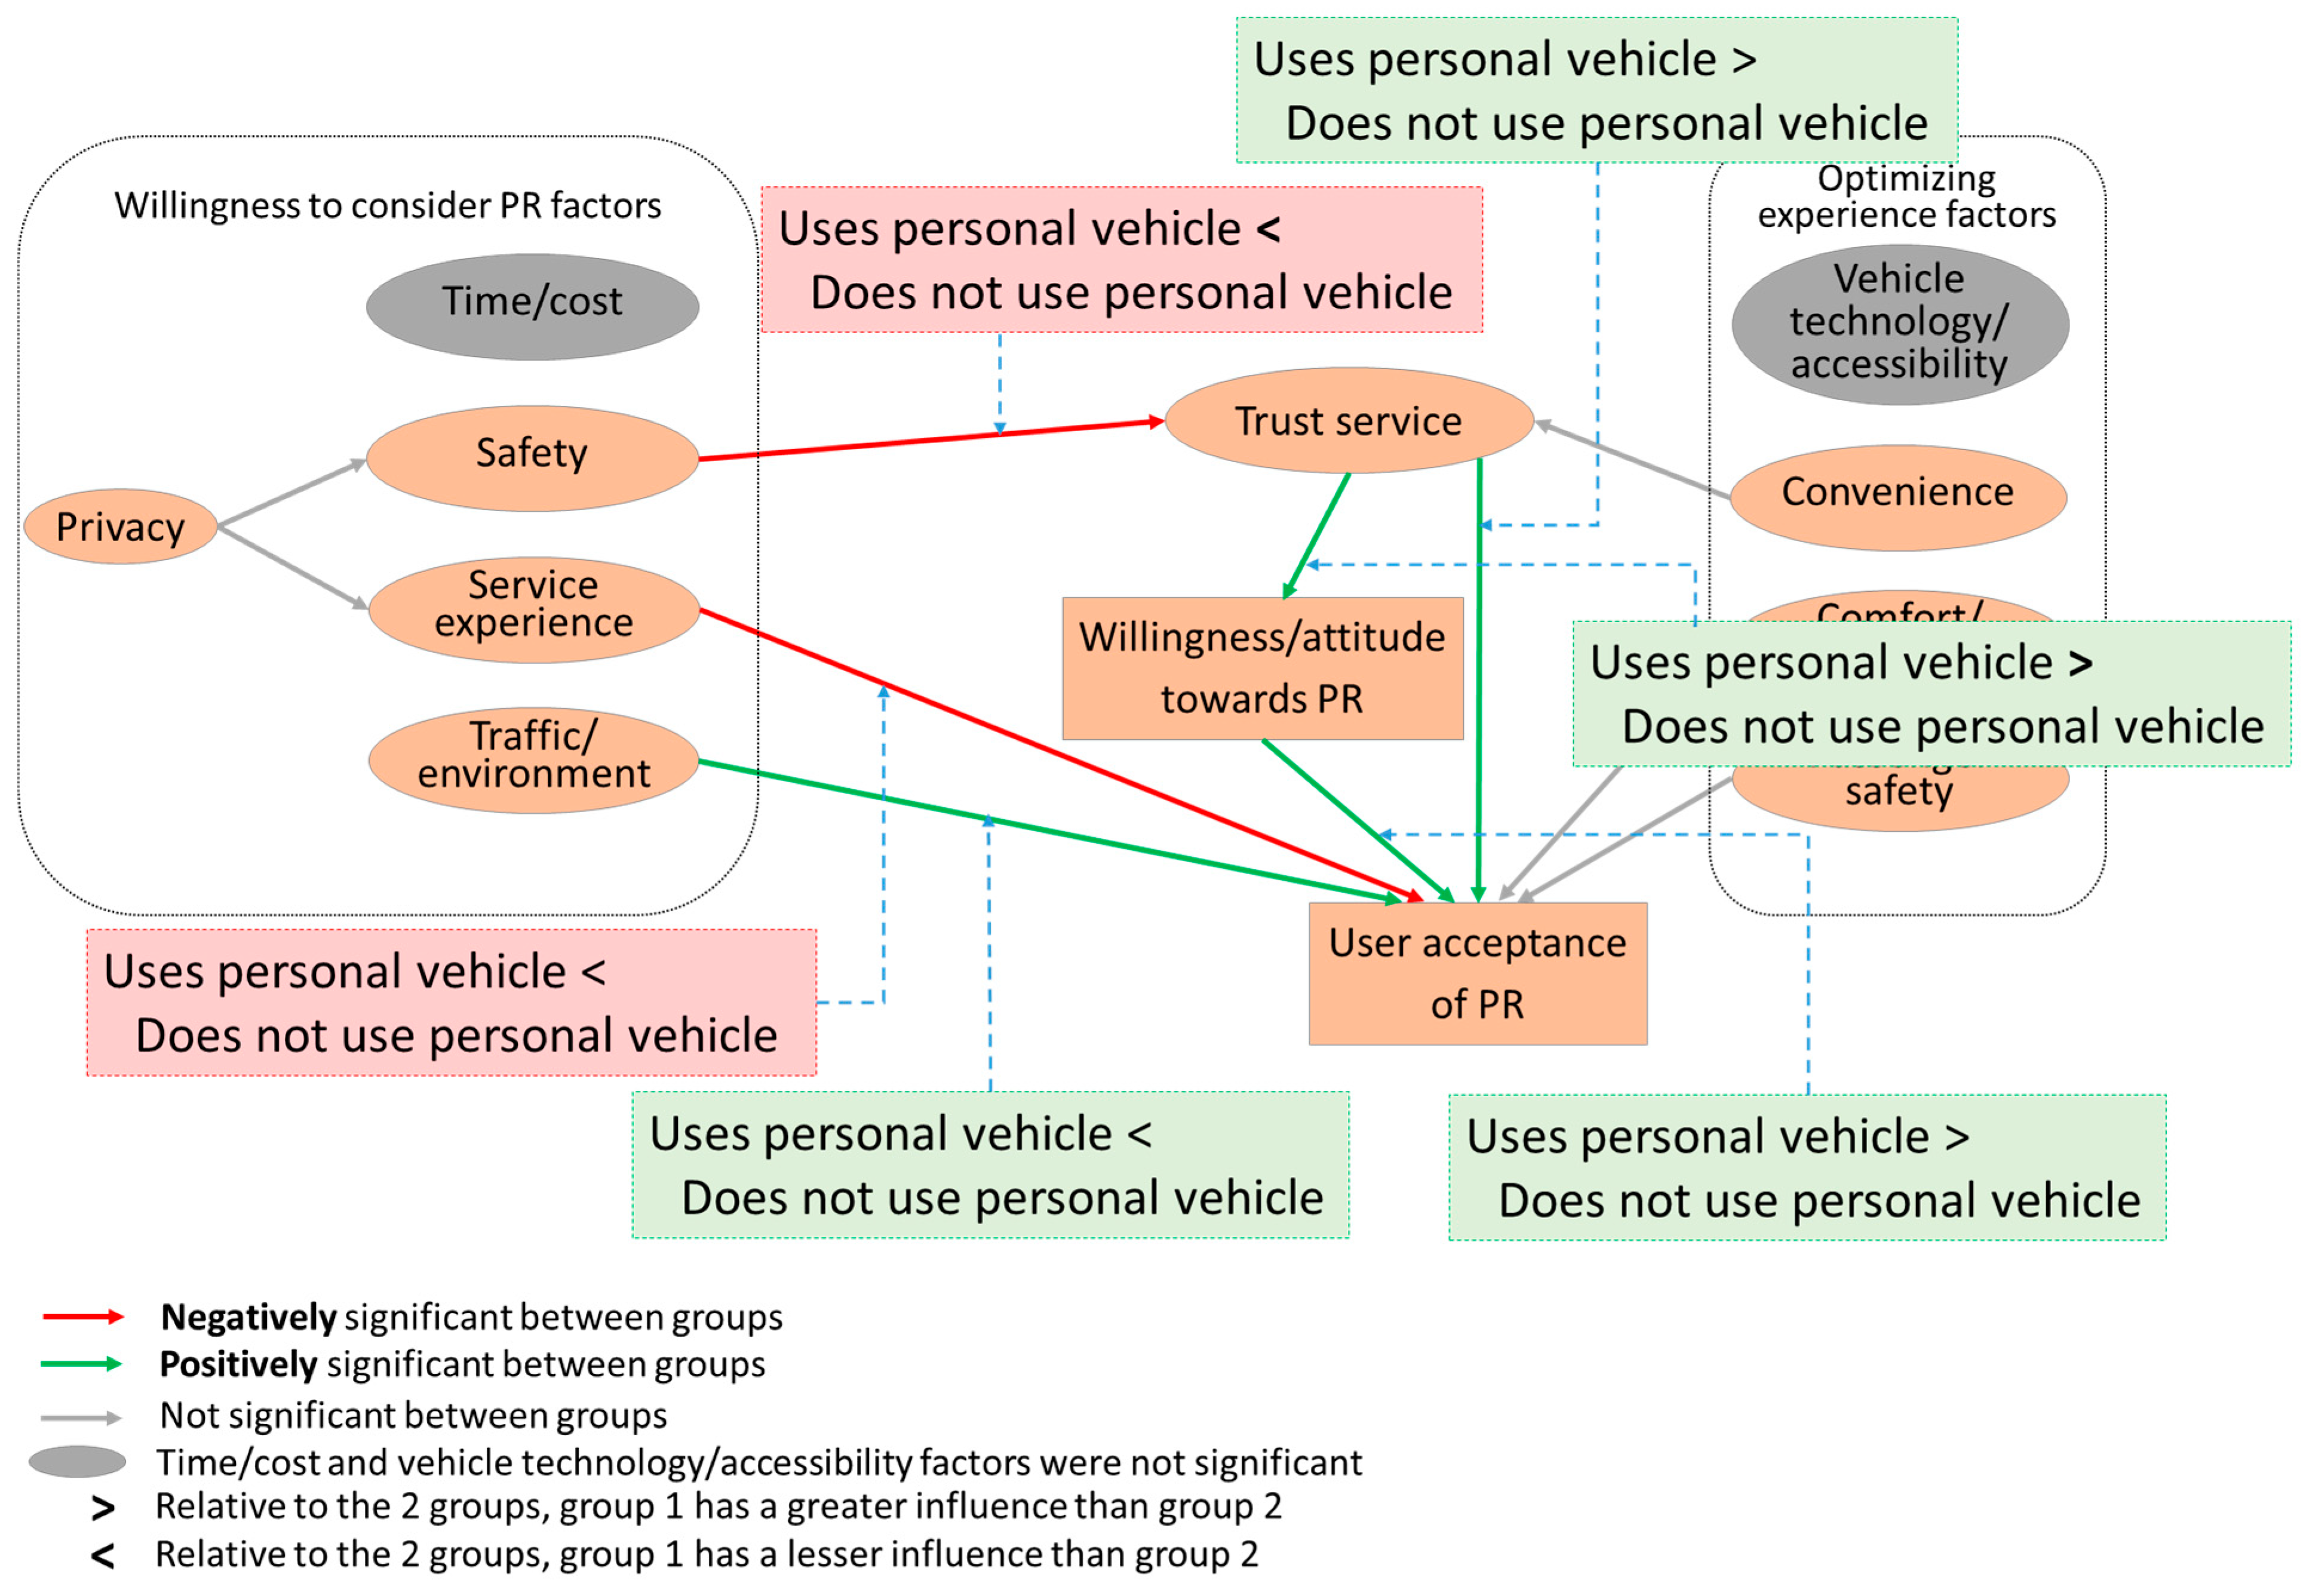
3.12.1. Personal Vehicle
The
personal vehicle moderator consisted of two groups: (1)
uses personal vehicle and (2)
does not use personal vehicle. Table 13 shows the regression paths that were significantly different from the unconstrained model. The
safety → trust service (∆χ
2 = 4.525,
p < 0.05),
service experience → user acceptance of PR (∆χ
2 = 5.591,
p < 0.05),
traffic/environment → user acceptance of PR (∆χ
2 = 4.591,
p < 0.05),
trust service → willingness/attitude towards PR (∆χ
2 = 4.144,
p < 0.05)
, trust service → user acceptance of PR (∆χ
2 = 4.423,
p < 0.05), and
willingness/attitude towards PR → user acceptance of PR (∆χ
2 = 9.584,
p < 0.01) regression paths were significantly different from the unconstrained model, indicating the moderator,
personal vehicle, influenced these six paths.
Next, the group differences using model comparison were obtained for the significant regression paths; see
Figure 13.
Safety had a greater negative influence on
trust service for the
does not use personal vehicle group (
β = −1.283) compared to the
uses personal vehicle group (
β = −0.705).
Service experience had a greater negative influence on
user acceptance of PR for the
does not use personal vehicle group (
β = −0.053) when compared to the group that
uses personal vehicle (
β = −0.018). In comparison to the
uses personal vehicle group (
β = 0.039),
traffic/environment had a greater influence on
user acceptance of PR for the
does not use personal vehicle group (
β = 0.045). In comparison to the
does not use personal vehicle group (
β = 0.474),
trust service had a greater influence on
willingness/attitude towards PR for
uses personal vehicle group (
β = 0.629). In comparison to the
does not use personal vehicle group (
β = 0.244),
trust service had a greater influence on
user acceptance of PR for the
uses personal vehicle (
β = 0.293) group. In comparison to the
does not use personal vehicle group (
β = 0.357),
willingness/attitude towards PR had a greater influence on
user acceptance of PR for the
uses personal vehicle group (
β = 0.379).
The use of personal vehicles appears to strongly influence attitudes and perceptions towards PR services. For individuals who do not typically use personal vehicles, safety has a stronger negative influence on trust in PR services. Additionally, this group gives more weight to their service experience and traffic or environmental conditions in their acceptance of PR services. This suggests that these individuals are more accustomed to the quality of service and environmental impact, possibly because they rely on public or alternative transportation modes more frequently, as these were the highest factor loading items for the service experience factor [
41]. In contrast, for those who do use personal vehicles, trust in PR services plays a more substantial role in shaping their willingness and acceptance towards PR services. This implies a need for strong reliability and trust in any alternative to personal vehicle use for this group. Their willingness or positive attitude towards PR also has more of an influence on their acceptance of PR services, which might suggest that these individuals could be more open to trying PR services if their initial perceptions and attitudes are positive. These variations highlight the importance of understanding the differing needs and priorities of these groups, which could be instrumental in shaping strategies to promote PR acceptance.
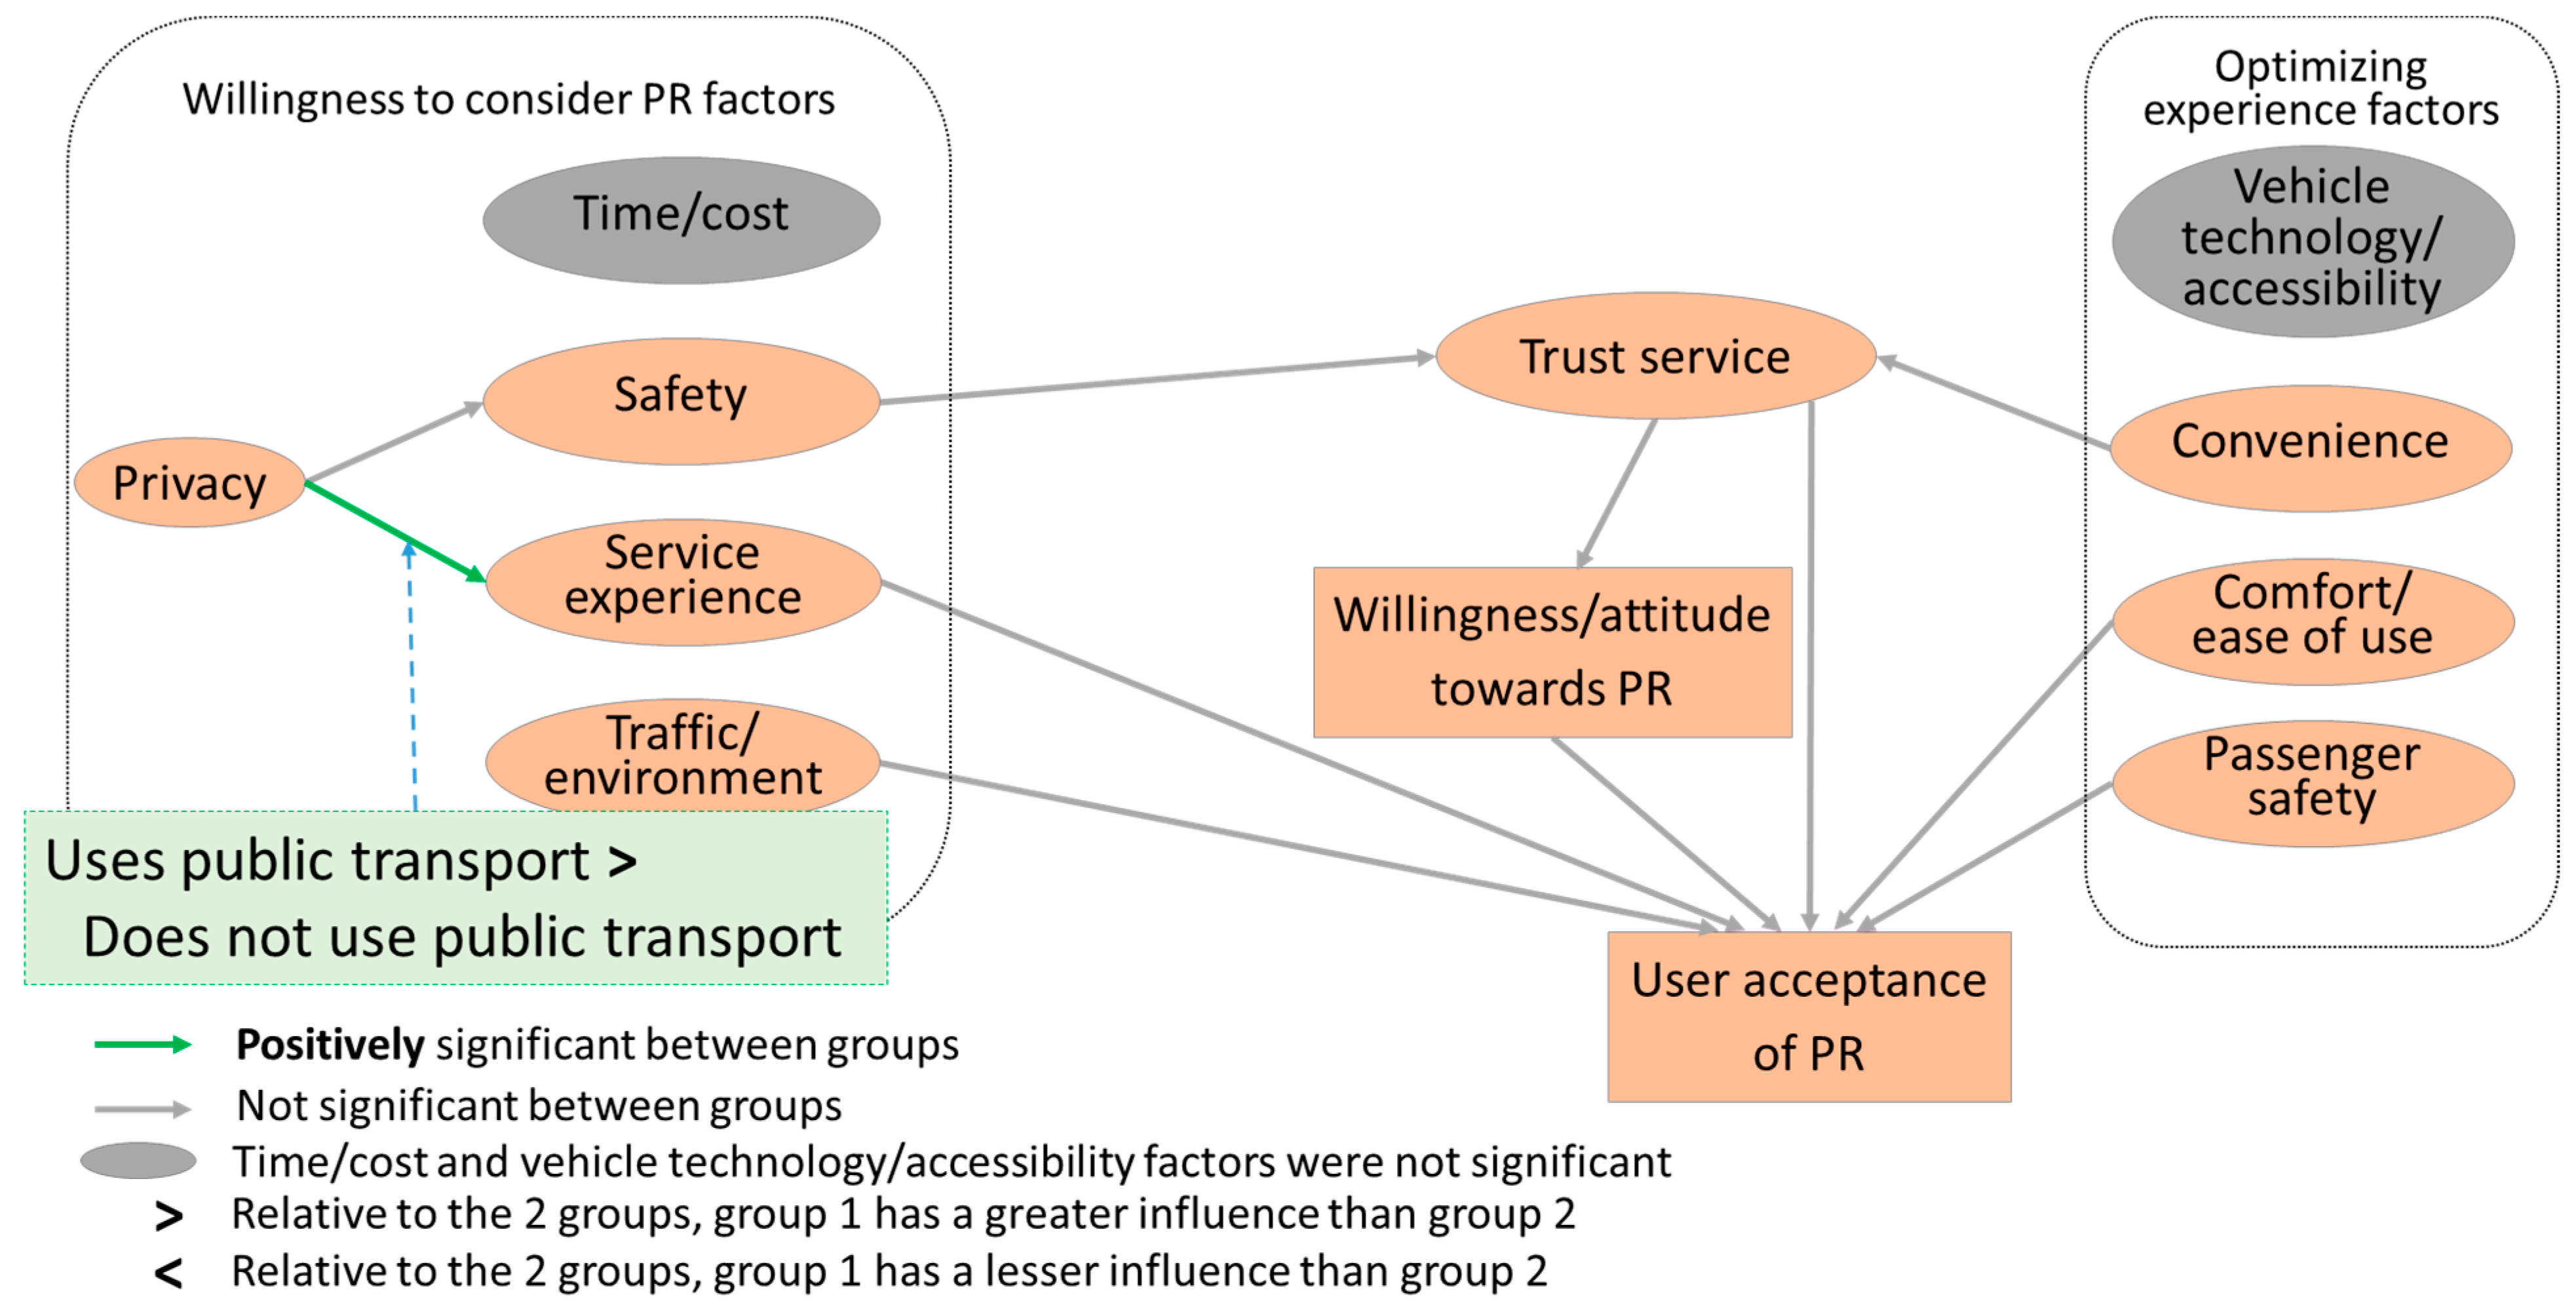
3.12.2. Public Transport
The
public transport moderator consisted of two groups: (1)
uses public transport and (2)
does not use public transport.
Table 14 shows the regression paths that were significantly different from the unconstrained model. The
privacy → service experience (∆χ
2 = 18.015,
p < 0.001) regression path was significantly different from the unconstrained model, indicating the moderator,
public transport, influenced this one path.
Next, the group differences using model comparison were obtained for the significant regression paths; see
Figure 14. In comparison to the
does not use public transport group (
β = 0.504),
privacy had a greater influence on
service experience for the
uses public transport group (
β = 0.654).
For those who frequently use public transportation, privacy emerges as a more prominent concern in their evaluation of the service experience offered by PR services. This indicates that to enhance the service experience and increase acceptance of PR among public transport users, it is important that PR providers prioritize addressing privacy concerns. These findings highlight the need for careful attention to privacy-related aspects of the service experience in order to appeal to public transportation users who are likely to have more experience with shared transportation settings.
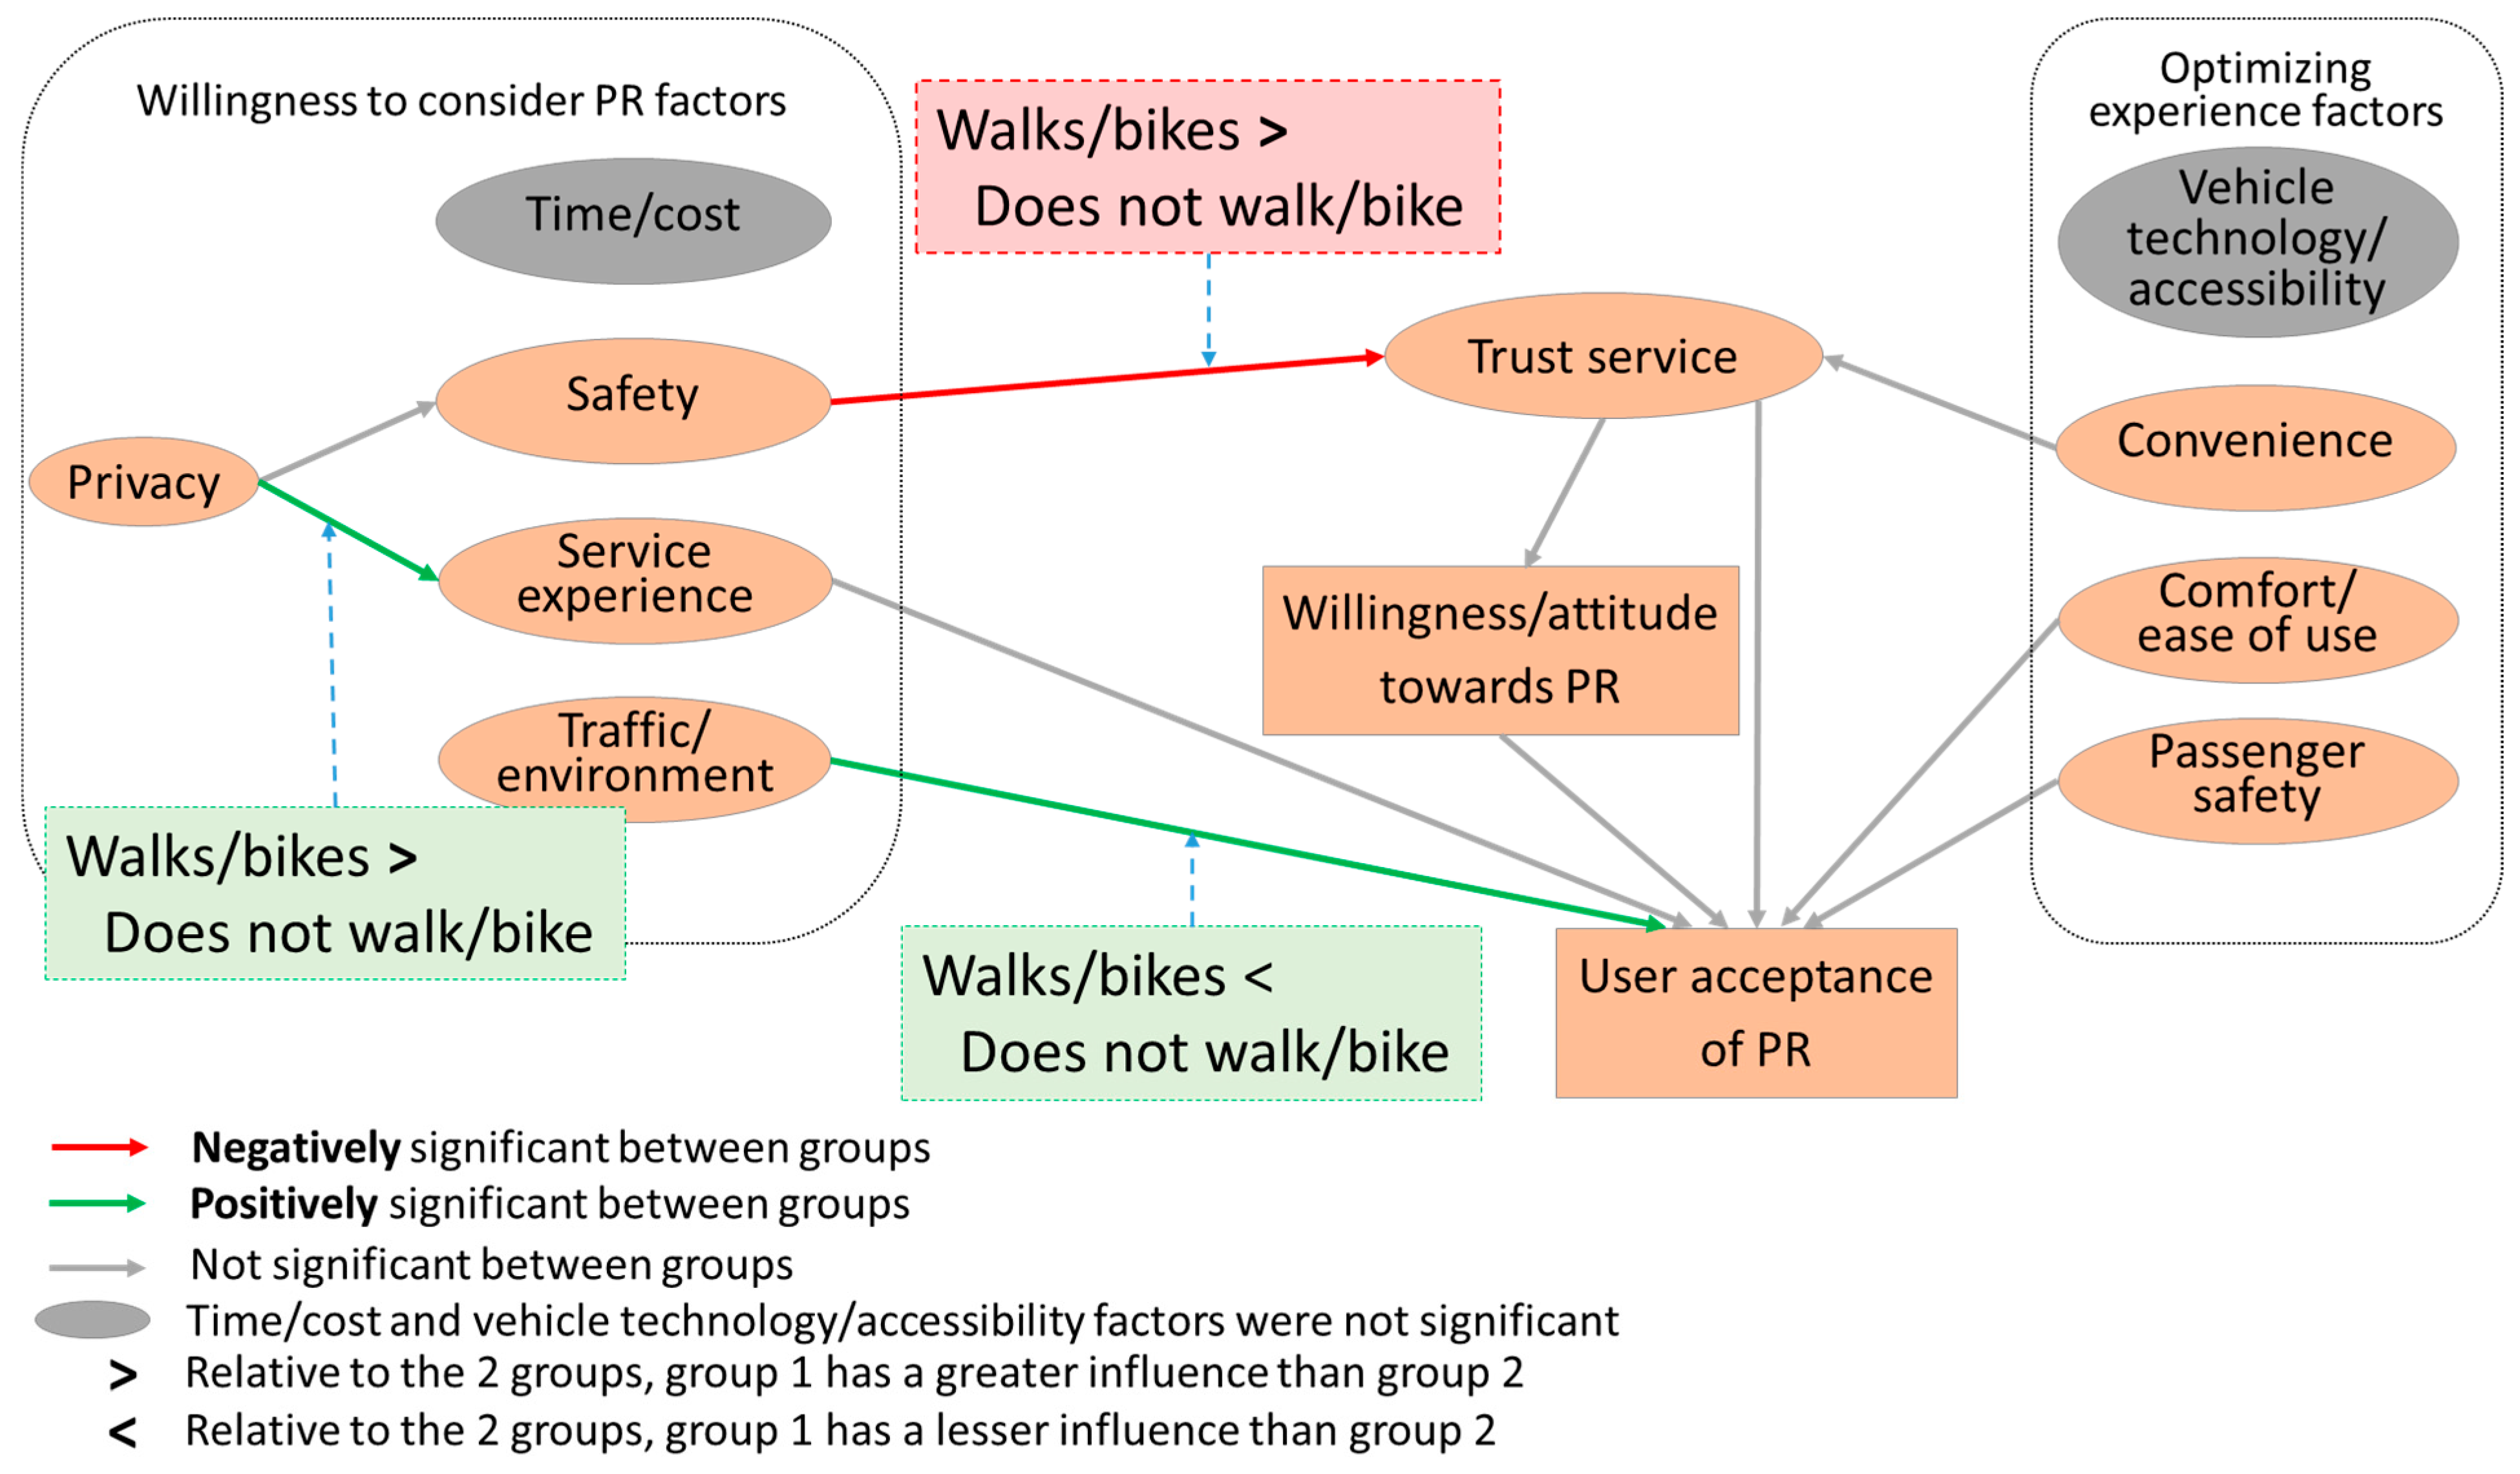
3.12.3. Walk/Bike
The
walk/bike moderator consisted of two groups: (1)
walks/bikes and (2)
does not walk/bike.
Table 15 shows the regression paths that were significantly different from the unconstrained model. The
privacy → service experience (∆χ
2 = 6.292,
p < 0.05),
safety → trust service (∆χ
2 = 8.358,
p < 0.01), and
traffic/environment → user acceptance of PR (∆χ
2 = 6.905,
p < 0.01) regression paths were significantly different from the unconstrained model, indicating the moderator,
walk/bike, influenced these three paths.
Next, the group differences using model comparison were obtained for the significant regression paths; see
Figure 15. In comparison to the
does not walk/bike group (
β = 0.486),
privacy had a greater influence on
service experience for the
walks/bikes group (
β = 0.573).
Safety had a greater negative influence on
trust service for the
walks/bikes group (
β = −0.789) compared to the
does not walk/bike group (
β = −0.571). In comparison to the
walks/bikes group (
β = 0.015),
traffic/environment had a greater influence on
user acceptance of PR for the
does not walk/bike group (
β = 0.106).
For individuals who typically utilize walking or biking as their mode of transportation, privacy plays a crucial role in influencing their service experience with PR services. In other words, the walk/bike user group maintains a higher emphasis on privacy. Moreover, these users also demonstrate heightened sensitivity to safety concerns as it highly influences their trust in PR services in a more substantial manner than for those who do not regularly walk or bike. Those who do not walk or bike are found to give higher importance to traffic and environmental factors when considering the acceptance of PR. This group’s decision to use PR services is more influenced by these factors as compared to individuals who regularly walk or bike. This divergence in influential factors between the two groups highlights how different transport habits can lead to varying priorities and considerations when it comes to adopting PR services.
3.12.4. Telecommute
The telecommute moderator consisted of two groups: (1) used telecommute and (2) does not use telecommute. The chi-square model comparison showed no significant difference between the unconstrained model and when the 11 regression paths were constrained individually.
This finding suggests that the adoption and acceptance of PR services were relatively consistent between those who do and do not telecommute, with similar relationships held across these two distinct groups.
3.12.5. Carpool
The
carpool moderator consisted of two groups: (1)
uses carpool and (2)
does not use carpool. Table 16 shows the regression paths that were significantly different from the unconstrained model. The
privacy → safety (∆χ
2 = 12.349,
p < 0.001),
trust service → willingness/attitude towards PR (∆χ
2 = 6.401,
p < 0.05), and
willingness/attitude towards PR → user acceptance of PR (∆χ
2 = 4.648,
p < 0.05) regression paths were significantly different from the unconstrained model, indicating the moderator,
carpool, influenced these three paths.
Next, the group differences using model comparison were obtained for the significant regression paths; see
Figure 16. In comparison to the
does not use carpool group (
β = 0.951),
privacy had a lesser influence on
safety for the
uses carpool group (
β = 0.881). In comparison to the
does not use carpool group (
β = 0.594),
trust service had a greater influence on
willingness/attitude towards PR for the
uses carpool group (
β = 0.662). In comparison to the
does not use carpool group (
β = 0.361),
willingness/attitude towards PR had a lesser influence on
user acceptance of PR for the
uses carpool group (
β = 0.288).
The influence of certain factors on perceptions and attitudes towards PR services was found to differ between individuals who currently use carpooling and those who do not. Specifically, among individuals who do not use carpooling, privacy was a more substantial factor influencing their safety evaluations compared to those who do use carpooling. This suggests that addressing privacy concerns is a crucial strategy for attracting non-carpool groups to PR services. On the other hand, for carpool users, trust in the service held greater importance on their willingness and attitudes towards PR than it did for non-carpool users, emphasizing the need to build and maintain trust to retain these users. The relationship between willingness and attitudes towards PR and user acceptance of PR was more influential for non-carpool users, with a significant positive influence. This finding shows the importance of effectively promoting the benefits of PR to potential non-carpool users to positively influence their acceptance of PR services.
4. Conclusions, Limitations, and Future Research
4.1. Conclusions
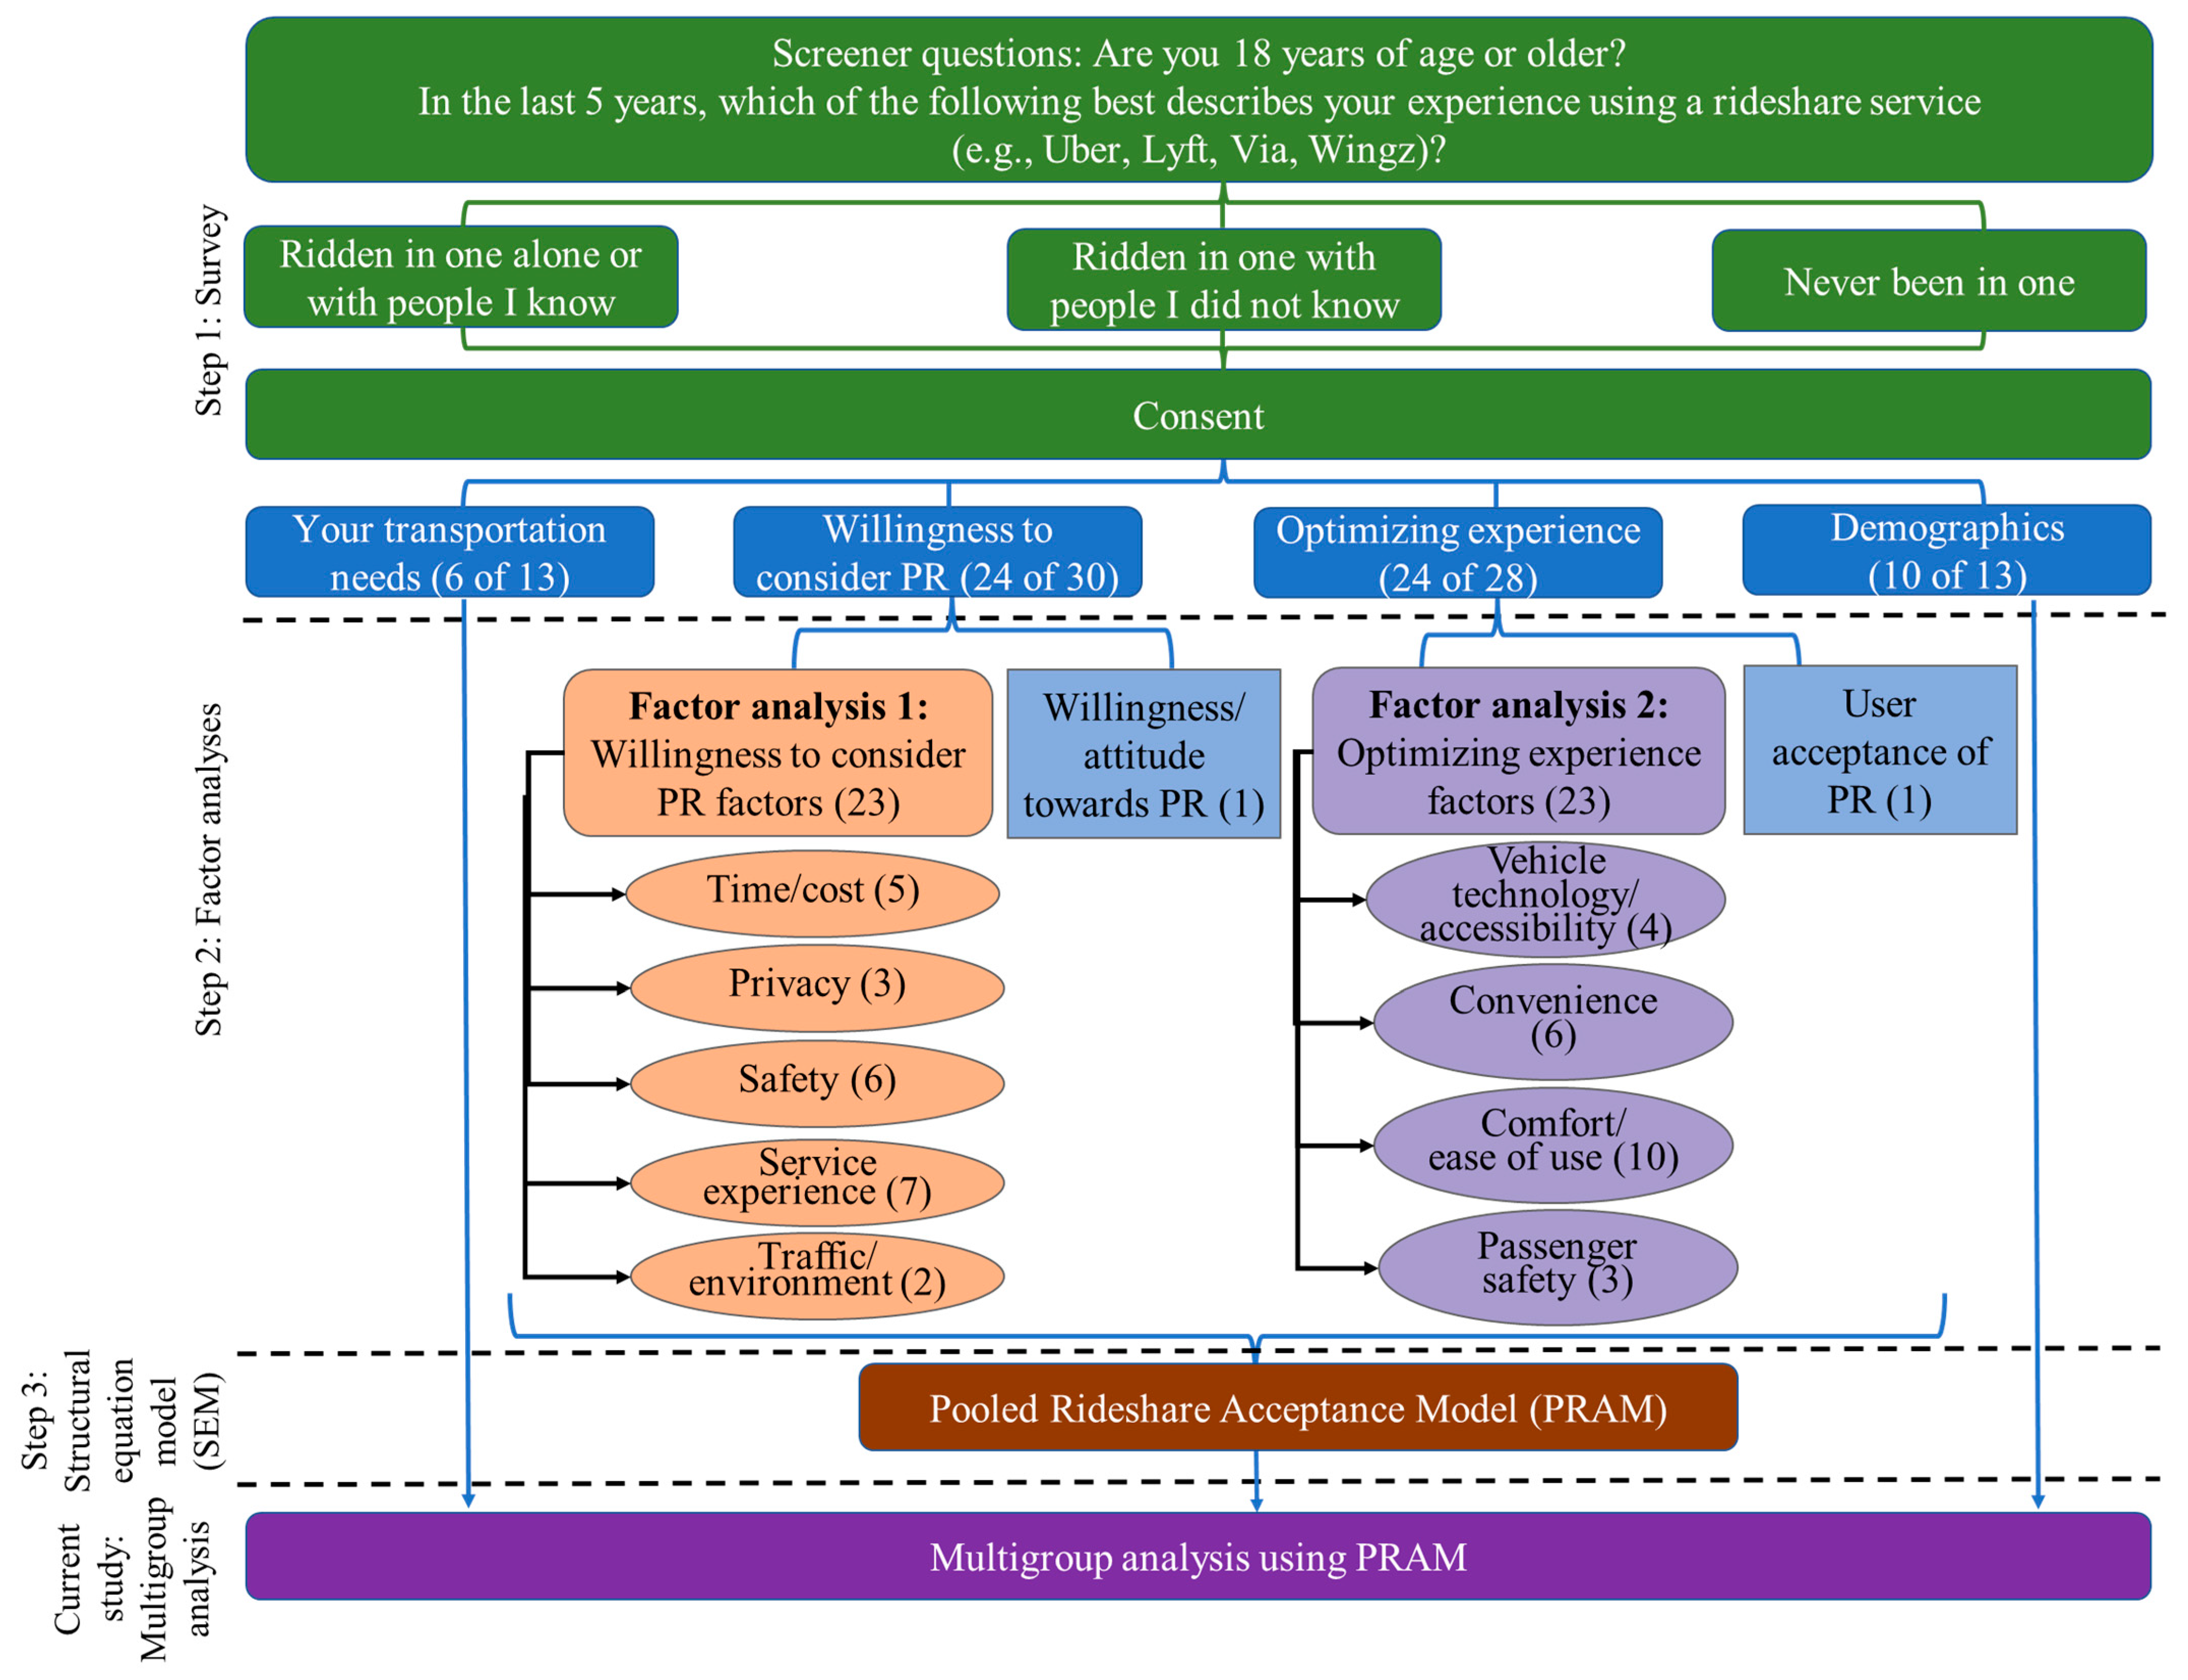
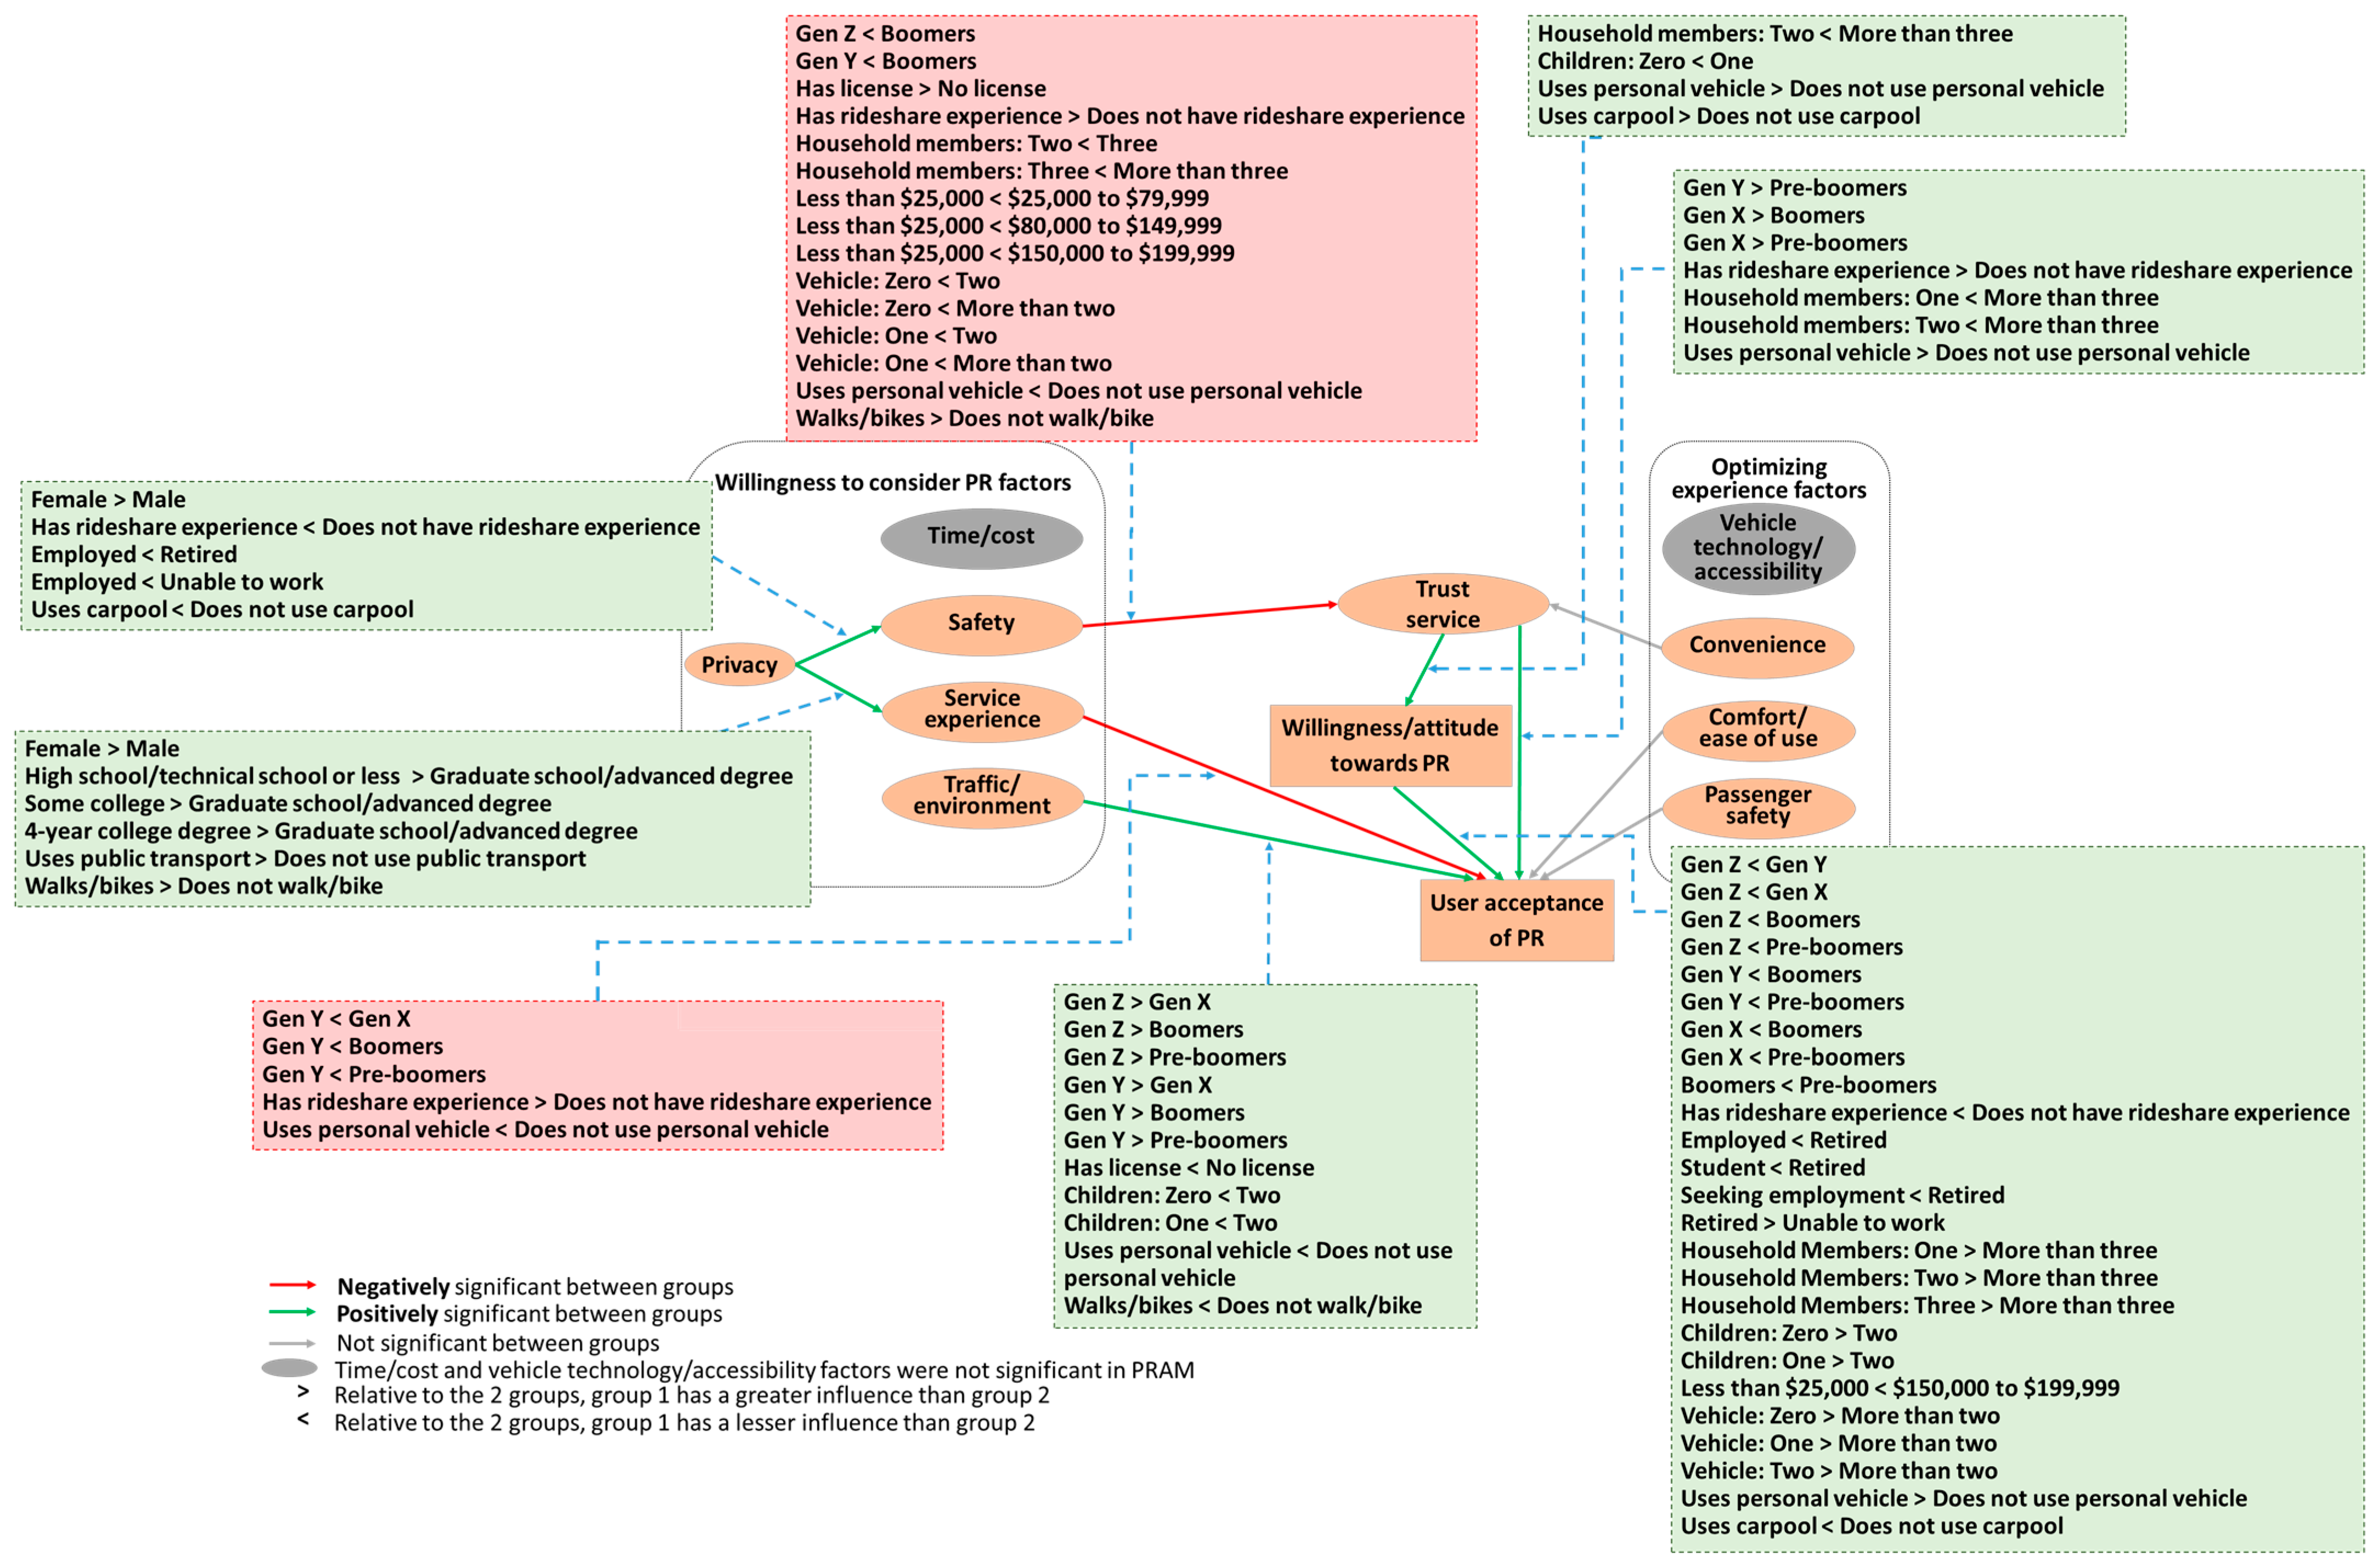
The analysis of our survey data on pooled rideshare (PR) research from a national sample of 5385 individuals began by completing two factor analyses to determine which factors influence users’ decision-making process regarding PR usage. With these factors identified, we developed the Pooled Rideshare Acceptance Model (PRAM), which integrates the factors into a comprehensive framework. The purpose of this exploratory study was to conduct a moderator analysis to explore how different user groups may influence and interact with the identified factors and acceptance of PR, resulting in the Pooled Rideshare Acceptance Model Multigroup Analyses (PRAMMA). This methodical approach allowed us to systematically assess and interpret the complex relationships between user characteristics and their willingness to use PR, ultimately providing a deeper understanding of the factors that drive or deter PR usage.
Figure 17 provides a summary of PRAM and PRAMMA.
The previous literature [
40] presents the development of the Pooled Rideshare Acceptance Model (PRAM), aimed at understanding the barriers and preferences for PR services among a sample of US participants. The PRAM builds upon two independent factor analyses, namely the
willingness to consider PR (including
time/cost,
privacy,
safety,
service experience, and
traffic/environment) and
optimizing the PR experience factors (comprising
vehicle technology/accessibility,
convenience,
comfort/ease of use, and
passenger safety) [
41,
42]. It is important to note that the time and cost variables were thoroughly analyzed in the factor analysis and the development of PRAM [
40,
41,
42]. In the PRAM, the time and cost variables did not directly influence the acceptance of PR; therefore, time and cost are not directly evaluated in PRAMMA. Based on PRAM, the purpose of this study was to analyze the strength of the relationships between variables in the PRAM when moderated by 16 demographic variables individually. The multigroup moderation analyses showed the statistical significance between groups for a given moderator in PRAM. The conclusion of this study provides several insights into various significant moderators in the PRAM, such as
gender,
generation,
driver license,
rideshare experience,
school completion,
employment status,
number of people in the household,
number of children,
household annual income,
number of vehicles, and
typical transport to commute. The 16 individual multigroup analyses explored if it will be beneficial to address the unique concerns or preferences of different user groups, compared to a “one size fits all” approach, which has been used in PRAM analyses. Rather, addressing the distinct needs of different groups may significantly enhance the acceptance and use of PR services.
In the Pooled Rideshare Acceptance Model Multigroup Analysis (PRAMMA), moderators were largely influential in user acceptance of PR, trust in service, and the safety of PR. Safety emerged as a crucial factor, which significantly varied its influence on the trust service for eight moderators; see
Table 3. Interestingly, the convenience, comfort, and passenger safety as predictors were not influenced by the moderators, which suggested that these predictors hold importance across all demographic variables.
Gender emerged as a significant moderator, especially with regard to privacy’s influence on safety and service experience. Female participants were found to place a higher emphasis on privacy, highlighting the importance of gender-based privacy considerations in service provision. For different generations, unique strategies tailored to their priorities will be more effective, given their differing safety concerns, service experience preferences, and environmental impact considerations.
Geographical differences did not appear to influence the relationship between the variables in PRAM significantly. This implies that the relationship between the factors was consistent across three different geographic areas (urban, suburban, and rural). The study also revealed differing priorities between individuals possessing a driver’s license and those without. Individuals who have a driver’s license are more sensitive to safety concerns when it comes to trusting PR services, while those without a driver’s license are more influenced by traffic and environmental factors when accepting PR services. The study also demonstrated significant differences between users with and without rideshare experience. For instance, privacy was a primary concern for those without prior rideshare experience.
Notably, those with higher education levels expressed less concern about privacy, while employed individuals demonstrated a similar trend. Conversely, retired individuals were more welcoming to PR services. This divergence in privacy concerns based on one’s life stage and employment status points to a need for targeted service improvements and promotional strategies. The size of a household also played a major role in shaping perceptions towards PR services. Larger households demonstrated a stronger relationship between trust in the service and acceptance of PR, whereas smaller households placed more emphasis on safety and service reliability. Moreover, families with two children demonstrated a heightened awareness of traffic or environmental issues, emphasizing the need for PR services to consider the specific needs of different household sizes.
Income levels and the number of vehicles owned were also found to influence the acceptance and use of PR services. Higher income households, or those with multiple vehicles, demonstrated heightened safety expectations and a stronger influence of willingness or positive attitudes towards PR acceptance. This again suggests the need for differentiated strategies based on demographic variables.
The study indicated differences based on personal vehicle usage. Non-vehicle users were found to prioritize safety, service experience, and environmental considerations more heavily. Conversely, those who regularly use personal vehicles required a higher level of trust in PR services and were more open to PR services if their initial perceptions were positive. For public transportation users, the focus needs to be on addressing privacy concerns to enhance their service experience and acceptance of PR. Individuals who typically utilize walking or biking as their mode of transportation displayed a higher emphasis on privacy and a heightened sensitivity to safety concerns. Those who do not regularly walk or bike were found to give more importance to traffic and environmental factors in their acceptance of PR. The relationship between various factors and the acceptance of PR services remained consistent between those who telecommute and those who do not. In the case of carpooling, privacy and trust emerged as critical factors influencing their safety evaluations and willingness towards PR, respectively.
In conclusion, the overall findings highlight the significance of demographic variables in shaping perceptions and behaviors towards PR services. It is crucial for service providers to acknowledge these differences and design personalized strategies that address the unique needs and concerns of each group. A “one size fits all” approach does not suffice, and individualized, targeted efforts are necessary to promote widespread PR acceptance and usage.
This multigroup analysis reveals how specific demographic factors may guide policy interventions. For example, safety-enhancing policies may be most impactful when targeted at females, older users, and licensed drivers, while environmental benefit messaging may be best suited for younger users and those without vehicles. Income-sensitive fare structuring may be developed to incentivize use among families and lower-income groups, and privacy-centered design strategies may increase adoption among hesitant users without prior rideshare experience. Segmented insights may be most useful for transportation planners and rideshare companies to allocate resources and maximize PR adoption more efficiently.
4.2. Recommendations to Policymakers and Rideshare Companies
The multigroup analysis strengthens the fundamental importance of key factors including safety, trust, privacy, and convenience. In addition, this research reveals how these key factors’ influence varies across user groups. These insights provide a strong foundation for formulating targeted, demographic-based policy recommendations. The following recommendations are drawn directly from the moderation effects in PRAMMA and are intended to lay the groundwork for tailored strategies that better align with the values, behaviors, and constraints of distinct rider segments:
Safety measures: The study highlights safety as a paramount concern, especially among females, older generations, and licensed drivers. It is recommended that pooled rideshare services invest significantly in safety measures.
Trust: Trust in the service was highlighted as another major concern, influenced by factors like safety and the number of people in the household. Building a strong brand that emphasizes safety, reliability, and customer service can help increase trust.
Privacy considerations: Privacy is of great importance, especially for females and those who are retired or unable to work. Pooled rideshare services should ensure the confidentiality of passenger information, personal space during the ride, etc.
Environmental impact: With younger generations showing greater acceptance of pooled rideshare services, emphasizing the environmental benefits of such services can be effective. Advertising campaigns could highlight reduced emissions and traffic congestion, which may attract more Gen Z and Gen Y users.
Consideration of demographic variables: Policies should be designed keeping in mind the influence of demographic variables like generation, employment status, number of vehicles, household annual income, and number of children, etc.
Affordability: As the study suggests a greater negative influence of safety on trust in the service for families with an annual income of more than USD 25k, pricing strategies should be reviewed. Affordability might be a key factor in influencing user acceptance of pooled rideshare services, so dynamic and competitive pricing strategies may be necessary.
User experience: The study shows that user experience with the service significantly influences their acceptance. Hence, pooled rideshare companies should aim to provide seamless experiences from ride-booking to drop-off, taking into account factors like convenience and comfort.
Addressing the needs of different commuter groups: Different groups of commuters (e.g., those who typically use personal vehicles, public transport, walking/biking, carpooling) have different needs and concerns. Tailoring the service to address these unique requirements, through customized ride options or partnership with public transport services, for example, could enhance user acceptance.
Education and outreach: More efforts should be made to educate the public about the benefits of pooled rideshare services. This includes awareness campaigns about their environmental impact, safety measures, privacy protocols, and convenience.
4.3. Limitations and Future Research
These findings are representative of the exploratory study conducted during the COVID-19 pandemic, and further research would be beneficial to understand the evolving dynamics and attitudes towards PR services, particularly in response to technological changes and the aftermath of the COVID-19 pandemic. Post-pandemic shifts in commuting behavior, remote work adoption, and public health perceptions may have influenced the relative importance of factors such as safety, convenience, and environmental impact. Future research should compare the results in the current manuscript to post-pandemic responses to understand potential temporal shifts in PR acceptance.
Furthermore, extending the PRAMMA to include other potential moderating factors, such as marital status, pet owners, frequent traveler status, can further enrich the understanding of PR adoption. Future research could also explore the potential benefits of applying these findings to other shared mobility services, such as micro-transit, carsharing, and shared autonomous vehicle systems, to assess the generalizability and scalability of the PRAMMA framework.
In the current study, interactions between different moderators were not explored. For instance, there may be correlations between the number of people in a household, the presence of children, and household annual income, as well as between employment status and generational differences. Future research can consider following up with an analysis of these moderators’ interactions within the PRAMMA framework to uncover more complex influences on PR adoption. Additionally, the relatively small sample sizes in some subgroups (e.g., Pre-Boomers at 4.7%) may limit the robustness of the moderation effects for those groups. Future research should aim to increase the representation of under-sampled groups to strengthen the statistical power and further refine the PRAMMA framework. As this is an exploratory study, multiple comparison correction (e.g., Bonferroni) was not applied. Future confirmatory studies may consider applying statistical corrections or even replicate this study with a larger national sample to validate the moderation effects identified. Some moderator effects, such as the gender differences in the privacy → safety path, achieved statistical significance but reflected small practical differences in standardized coefficients. Future research can determine if the small effect has limited practical implications, and future larger subgroup sizes can determine the robustness of moderation effects.
Our participant sample only included a small percentage of individuals who live in rural settings (7.1%). It would be interesting to conduct a study specifically focusing on individuals who live in rural communities to see if rideshare services are available and if they use rideshare services when traveling to cities. Our nationwide sample did not assess cultural differences. Expanding this research to include cross-cultural contexts and an international sample may uncover additional insights important to global PR adoption. Finally, this study can provide a foundation for the development of actionable items for policymakers and TNC companies. Feedback on these actionable items from a national sample will be invaluable, benefiting both rideshare users and service providers.


 ,
, 


