Article

End of Life Management Sustainability of Waste Electrical and Electronic Equipment Generated in Romania

by
Anisoara Enache Talpalaru
,
Daniela Gavrilescu
* and
Carmen Teodosiu
*
Department of Environmental Engineering and Management, “Cristofor Simionescu” Faculty of Chemical, Engineering and Environmental Protection, “Gheorghe Asachi” Technical University of Iasi, 73 Prof. D. Mangeron Blvd., 700050 Iasi, Romania
*
Authors to whom correspondence should be addressed.
Sustainability 2025, 17(9), 4105; https://doi.org/10.3390/su17094105
Submission received: 3 March 2025 / Revised: 27 April 2025 / Accepted: 29 April 2025 / Published: 1 May 2025

Abstract

:
Waste electrical and electronic equipment (WEEE) is a continuously growing concern, with issues arising from intensive resource consumption and the environmental and human impacts being caused by inadequate practices. The purpose of this study is to evaluate the impacts of end-of-life management options generated by Information Technology (IT) and telecommunication equipment in Romania during the period of 2018–2021 from a sustainability point of view, including environmental aspects, such as greenhouse gas emissions (GHG) and energy consumption, economic aspects, considering workforce earnings and revenues collected for the public budget, and social impacts through job creation. To achieve the main objective, a two-step methodology is used, with one step to determine the relevant quantities of WEEE generated by the subcategories of IT and telecommunication equipment, using the European Union’s WEEE Calculation Tool based on two approaches, WEEE reported in Eurostat (Scenario 1) and apparent consumption (Scenario 2), and a second step to evaluate the environmental, economic, and social impacts of the WEEE management system by applying Waste Reduction Model (US EPA WARM). Regarding the six WEEE categories evaluated, in both scenarios, Flat-Panel Displays is the category with the lowest environmental impact and highest economic and social benefits, while, on the opposite side, the Cathode-Ray Tube (CRT) category displays the highest environmental impact and lowest economic and social benefits.

1. Introduction

Electrical and electronic equipment (EEE) encompasses products that have electrical or electronic components, such as circuits, semiconductors, or other electrical elements, and are operating using a power source, which may be either electricity or battery power [1]. Consequently, waste from electrical and electronic equipment (WEEE), also referred to as e-waste, is represented by all items and parts of EEE, and is discarded by the owner without considering reuse [2].
The manufacturing and use of EEE have increased dramatically over the past three decades. Fast technological progress, combined with the expansion of markets in low- and middle-income countries and the frequent introduction of newer, more affordable gadgets, has accelerated product obsolescence. As a result, the world faces a growing challenge with WEEE [3], since the ever-growing amount of discarded electronics poses significant environmental, human health, and resource management issues. For example, approximately 62 million tons of EEE was generated in 2022 worldwide, meaning an average of 7.8 kg per capita, out of which only 22.3% was officially collected and recycled in an environmentally safe manner. Since 2010, the growth in e-waste generation has outpaced formal collection and recycling efforts by a factor of nearly five [1].
WEEE contains hazardous materials such as heavy metals, hazardous organic compounds, persistent organic pollutants (POPs), brominated flame retardants (BFRs), chlorofluorocarbons (CFCs), and hydrochlorofluorocarbons (HCFCs) [4]; it is estimated that every year, 50 tons of mercury and 71 kilotons of BFR plastics are found in undocumented e-waste, polluting the environment and damaging the health of workers exposed to these toxic substances [5].
Although WEEE is considered hazardous waste, it also contains a substantial economic potential [6], as approximately 60 elements can be found in some EEE, such as plastics, precious metals, and rare earth metals that are used for the manufacturing of electric/electronic devices [7]. Often in relation to WEEE management, the term “urban mining” is used, since it contains valuable materials [8], making it a sound option to address sustainable resource management [9]. Worldwide, in 2022, e-waste management generated USD 28 billion worth of secondary raw materials, out of a potential USD 91 billion contained in all the WEEE generated [1], while a significant portion of these materials was lost due to incineration, landfilling, or substandard treatment methods, avoiding the extraction of approximately 900 billion kilograms of ore.
The existence and implementation of e-waste policies are of major importance for effective WEEE management. Policies were adopted in 81 countries (42% of all nations, covering 72% of the global population) in 2023, with 67 of them incorporating Extended Producer Responsibility (EPR) provisions, only 46 countries having collection targets, and just 36 having recycling targets [1].
Considering the variations among WEEE recycling regulations, programs, and enforcement across different countries, comparing the generated and collected amounts of WEEE globally is challenging. Additionally, aside from formally collected and recycled WEEE, informally handled WEEE [1,10,11] is recycled outside of official take-back systems or illegally exported (with the flow being diverted from high-income to low- and middle-income countries), making the quantification of these informal activities presents a great challenge [12].
In order to improve WEEE management, it is necessary to adopt standardized frameworks with harmonized definitions and data collection methods [7]. The European Union (EU) has implemented such a framework through Directive 2012/19/EU, consolidated in 2018, which defines WEEE-related terms and stakeholder responsibilities throughout the product lifecycle [13]. To improve the reuse and recycling of WEEE, the European Union has established a minimum collection rate of 65% and targets for recycling that range between 55% and 80% of the WEEE collected.
Environmentally sound WEEE management is essential for advancing key Sustainable Development Goals (SDGs), including Goal 3 (Good health and well-being), Goal 6 (Clean water and sanitation), Goal 12 (Responsible consumption and production), and Goal 13 (Climate action). Risky actions, such as uncontrolled burning and informal recycling, which pose health risks and pollute air, water, and soil, mean that efforts towards SDGs 3 and 6 are less successful. Closed-loop management enables the recovery of valuable resources and reduces waste, supporting SDG 12, while effective recycling, reuse, and resource recovery from WEEE contribute to reducing emissions, thus promoting SDG 13 [14].
WEEE management practices often neglect circular economy principles, which emphasize designing products for durability, reparability, and recyclability [15]. It is considered that 80% of a product’s environmental impact is determined at the design stage, influenced by factors like material selection, durability, energy efficiency, reparability, and recyclability [16]. Design choices in early stages of development play a crucial role in reducing resource use, waste, and emissions, making eco-design a key focus of the Circular Economy Action Plan. This plan focuses on sectors with intensive resource consumption and significant circularity potential, including electronics and ICT, batteries and vehicles, packaging, plastics, textiles, construction and buildings, and food, water, and nutrients [17].
A sustainable WEEE management system should aim to intercept 100% of e-waste, recover recyclable materials, separate hazardous components, support economic growth, and create jobs, and by reaching these goals, the system can reduce damage to the environment, conserve resources, and contribute to circular economy implementation [2]. In WEEE management, recycling is desired, however, efficient recycling routes are adapted to the complexity of WEEE categories and are selective in terms of metal recovery and reduced environmental impact, such as in the case of printed circuit boards [18,19] and large printed circuit board pieces [20].
The characterization of WEEE management systems has been studied at various scales—continental, national, and regional. In an extensive review of various national WEEE management systems, Shittu et al. [7] identified aspects including the limited global availability of formal systems for collection and treatment, the rapid increase in WEEE generation driven by higher ownership rates and accelerated obsolescence, and the lack of effective regulation and enforcement as key concerns. WEEE design and management were approached by Elia and Gnoni in 2015 [21], who conducted a scientific literature analysis and proposed a three-level taxonomy to classify research studies, as follows: levels 1 and 2 address the core issues in designing and managing WEEE reverse supply chains, focusing on critical areas like collection, recycling, and resource recovery, while level 3 reviews the various tools, methods, and approaches used in assessing WEEE system performance. A review on Material Flow Analysis (MFA) in 115 studies (2010–2022) showed that research is limited in non-OECD countries, and few studies address critical aspects like uncertainty, circular economy integration, and dynamic modeling [22]. An economic analysis of WEEE management reveals that transportation costs play a key role in establishing an efficient and performant WEEE management system at the national level [23].
A sustainability assessment of national WEEE management in Romania, based on a four-level methodology [2] and evaluating seven main categories of indicators, was conducted, while a comparative analysis of three WEEE management scenarios based on the Life Cycle Assessment (LCA) methodology for the municipality of Iasi, Romania [3], revealed that the largest contribution to the total environmental impact was due to the collection stage in all scenarios.
A WEEE collection system using a simulation-based methodology for comparing different alternatives in Italy was evaluated by Elia et al. (2019) [24], and the roles of reverse logistics and closed-loop supply chains in WEEE management were considered to ensure the sustainability of e-waste management systems by facilitating efficient collection, recycling, and resource recovery processes [25].
LCA studies on WEEE management emphasize the significant environmental benefits of WEEE recycling, including the recovery of valuable materials and reduced resource extraction [26]. Reuse practices show environmental benefits for smaller EEE devices, while larger EEE appliances certified in lower-energy-efficiency classes may not yield the same results [27,28]. A comparative LCA study revealed that strong regulatory frameworks, such as those in Europe, promote better environmental outcomes, whereas informal recycling in parts of Asia poses significant risks [29].
Romania’s WEEE management system has potential for improvement through increased WEEE collection and better collection practices [2]. A study analyzing the carbon footprint of WEEE management from 2007 to 2014 in five EU countries, including high-income countries such as Italy, Sweden, and Germany and low- and middle-income countries such as Bulgaria and Romania, found that all countries reduced their WEEE carbon footprints, with Germany achieving the largest reduction, and by 2014 had recycling as the preferred treatment option, achieving rates over 80% across all countries [30].
The main objective of this study is to evaluate the performance of the WEEE management system in Romania for a stream of waste increasing in growth due to new technologies, namely WEEE generated as Information Technology (IT) and telecommunications equipment. To the best of our knowledge, even though it is expected to increase, this WEEE stream has not been studied before, because there is a lack of data available on the generated quantities. Furthermore, the sustainability of the End of Life (EoL) treatment options applied to IT and telecommunications equipment has not been investigated before.
To respond to this research gap, this study proposes an investigation of sustainability by incorporating selected significant environmental aspects, including GHG emissions and energy use, economic impact indicators, including revenues for employees and taxes collectable for the public budget, and the social aspects of creating jobs at WEEE end-management facilities. To achieve this goal, the Waste Reduction Model (WARM) of the United States Environmental Protection Agency (US EPA) methodology was used, a tool developed for organizations and communities to estimate the GHG emissions, energy savings, and environmental impacts of various waste management practices [31]. Since the WARM requires data entries for specifics categories from the IT and telecommunications equipment stream, an intermediary step was carried out, e.g., modeling the data by using the WEEE Calculation Tool, made available by the European Commission in line with implementing Regulation (EU) 2017/699 of 18 April 2017, which makes possible to estimate the WEEE generated based on EEE placed on the market (POM) data [32].
The other objectives of this study can be formulated as follows: the analysis of the material flow of IT and telecommunications equipment waste in six categories (Desktop CPUs, Portable Electronic Devices, Flat-Panel Displays, Electronic Peripherals, and Hard Copy devices) and the evaluation of the sustainability profiles of the above-mentioned categories and their variation in time over a period of 4 years (2018–2021), within the national context of the EU Member State, least performant in WEEE collection and management, namely Romania. The reference period was selected because of the following reasons: 2018 represents the year of the last consolidated version of the EU WEEE Framework Directive, while 2021 is the last year for which reported data have been validated in Eurostat for Romania.

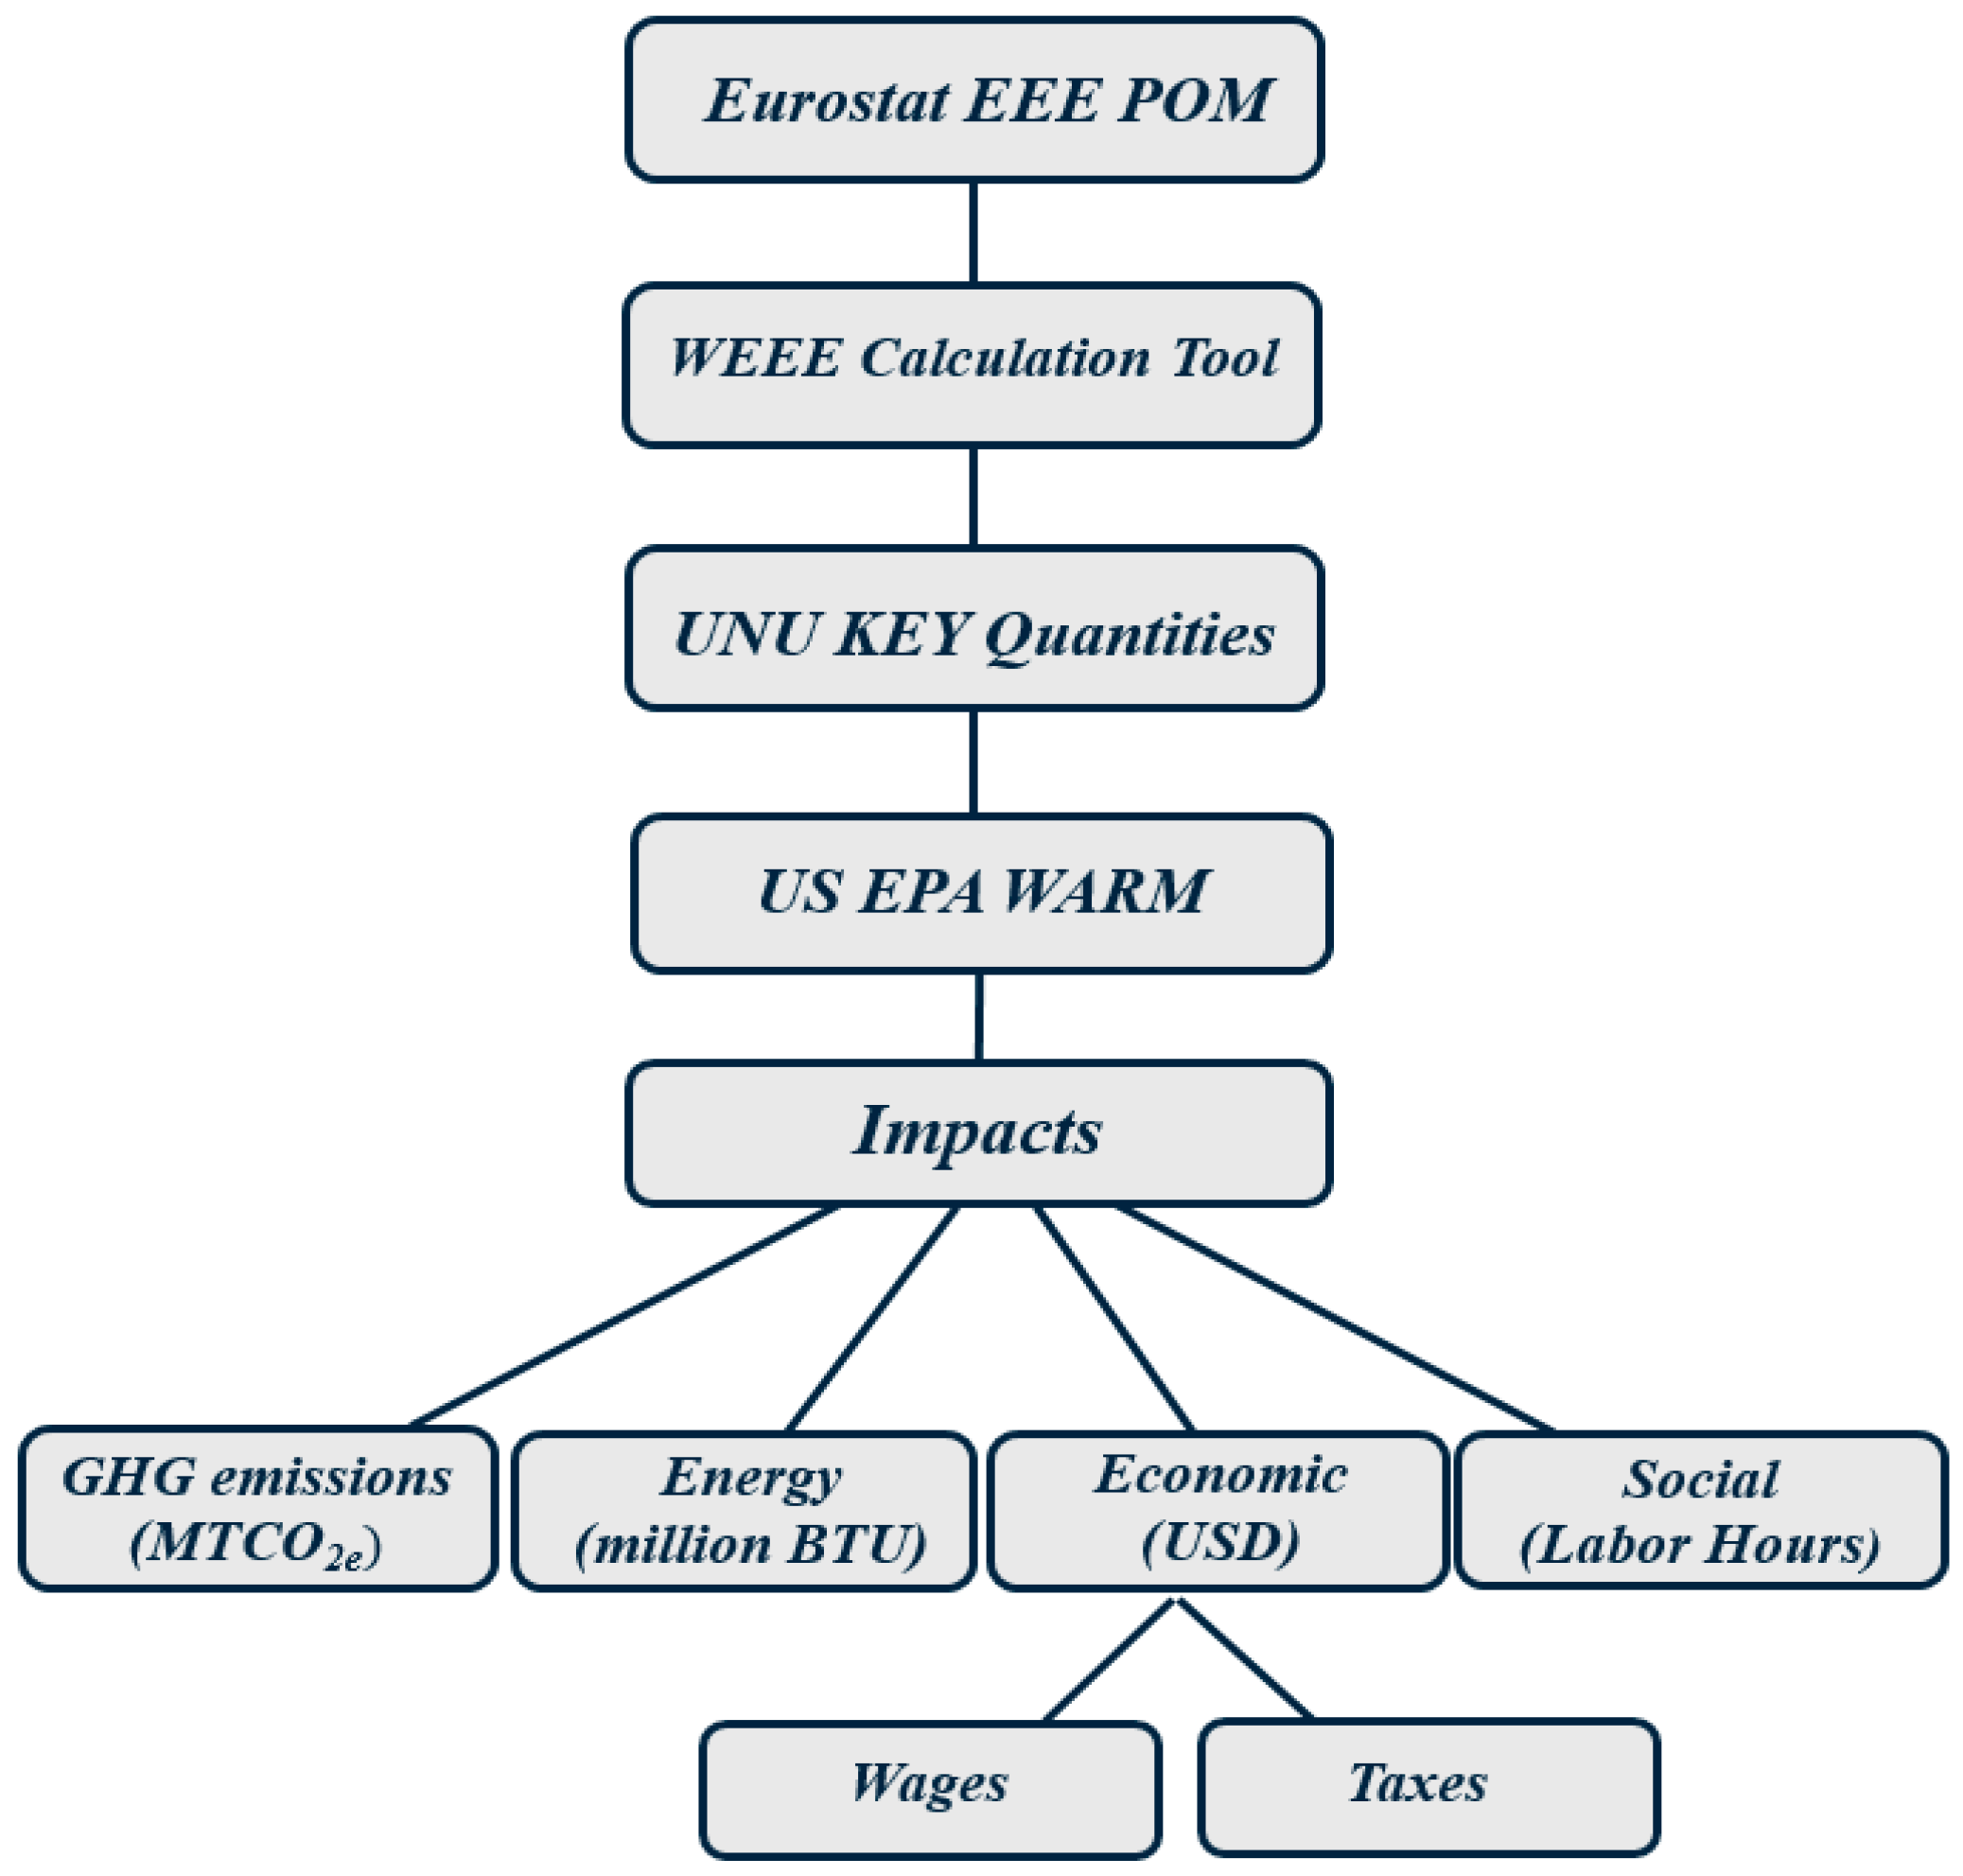
2. Materials and Methods

2.1. Waste Reduction Model (WARM)

The WARM (Waste Reduction Model) methodology of the US Environmental Protection Agency (US EPA) is a tool created to support public and private organizations, municipalities, and stakeholders involved in decision making regarding waste management alternatives. It provides estimates of the GHG emission reductions, energy savings, and economic impacts associated with various waste management practices, such as recycling, composting, anaerobic digestion, incineration, and landfilling. The WARM supports the comparison of management alternatives and facilitates sustainable decision making in materials management in the context of climate change.
The WARM assesses emissions, energy consumption, and economics for a variety of materials commonly found in municipal solid waste and construction and demolition waste, using the following units of measurement: metric tons of carbon dioxide equivalent (MTCO2e), energy units (millions of British Thermal Units—BTU), labor hours, salaries (USD), and Taxes (USD) [31].
The current version of the WARM, version 16, available since December 2023, includes 61 materials and products, classified into the following two main categories: Municipal Solid Waste (MSW) and Construction and Demolition (C&D) Debris. For each material, the WARM provides detailed emission factors, including data on production from virgin and recycled materials, energy requirements, and end-of-life management.
The WARM compares baseline scenarios (current practices) with alternative processes, such as recycling, incineration, and landfilling, to assess GHG emission implications, energy impacts, economic impacts through wages and taxes, and social impacts through the number of labor hours generated during the lifecycle of a material.
Different scenarios can be created by entering data on the amount of waste managed, classified by the type of material and management practice used. The WARM automatically calculates GHG emissions, energy savings, and economic impacts by applying material-specific factors for each management method. In this way, the user has the possibility to adjust critical factors such as landfill gas recovery practices and transport distances to municipal waste (MSW) management facilities.
The WARM US EPA uses a simplified LCA to analyze impacts. Unlike a full LCA, which includes an analysis of health and environmental impacts, the WARM focuses on GHG emissions, carbon stocks, and energy impacts to provide clear and accessible information about climate change. The WARM also simplifies the calculation of emissions from lifecycle stages prior to material disposal, providing a practical tool for decision making.
The WARM calculates emissions impacts starting from the point of waste generation, not raw material extraction, as GHG benefits result from comparing different waste management options. Although it includes emissions from earlier stages, these are only taken into account when the compared methods involve recycling or source reduction, which influence upstream emissions.
Even though there are a series of advantages derived from using the US EPA WARM methodology to analyze non-US national contexts, there are also a series of limitations, as follows: regulatory differences [33]; technological limitations—there is a technological gap as compared to aspects referenced in the WARM [34]; regional environmental specificity [35]; economic constraints [33,36]; and the existence of an informal sector and cultural differences in approaching the waste management problem [36,37].
Starting from 2019, certain types of impacts from IT and telecommunications WEEE can be assessed, namely the following [31]:
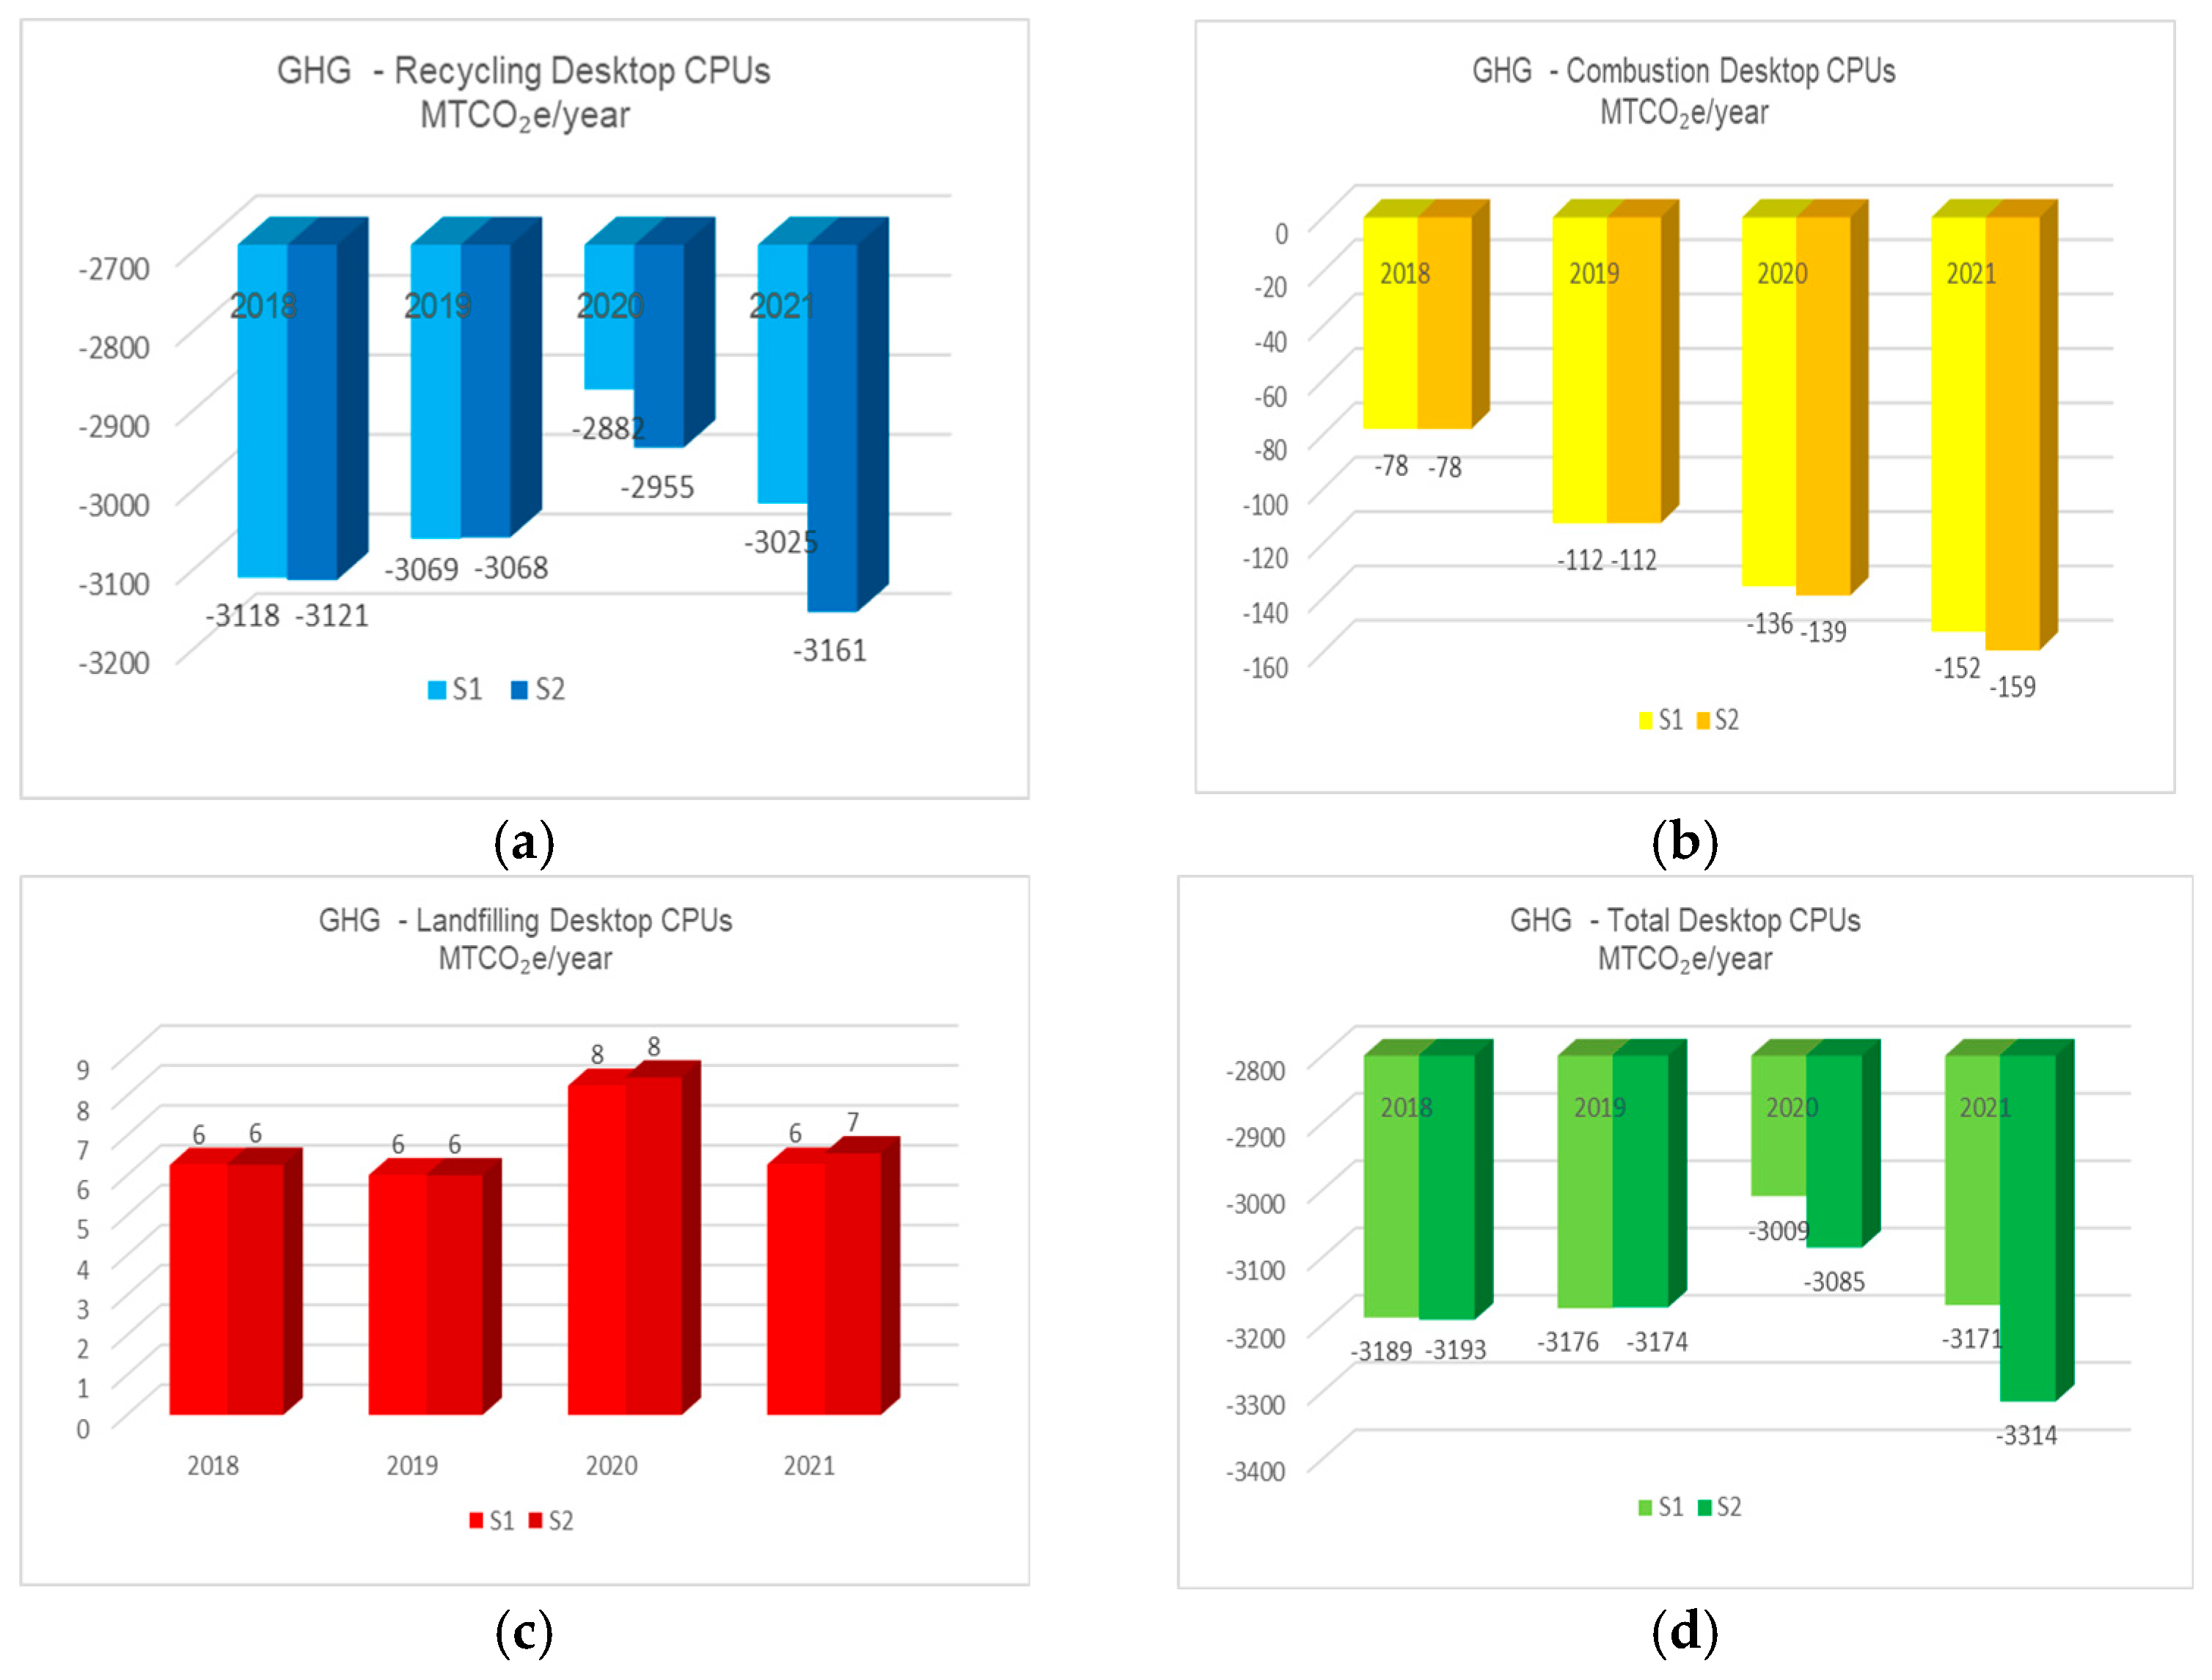
  • Central units (desktop CPUs)—independent central units for desktop computers, excluding monitors and peripherals such as mice or keyboards;
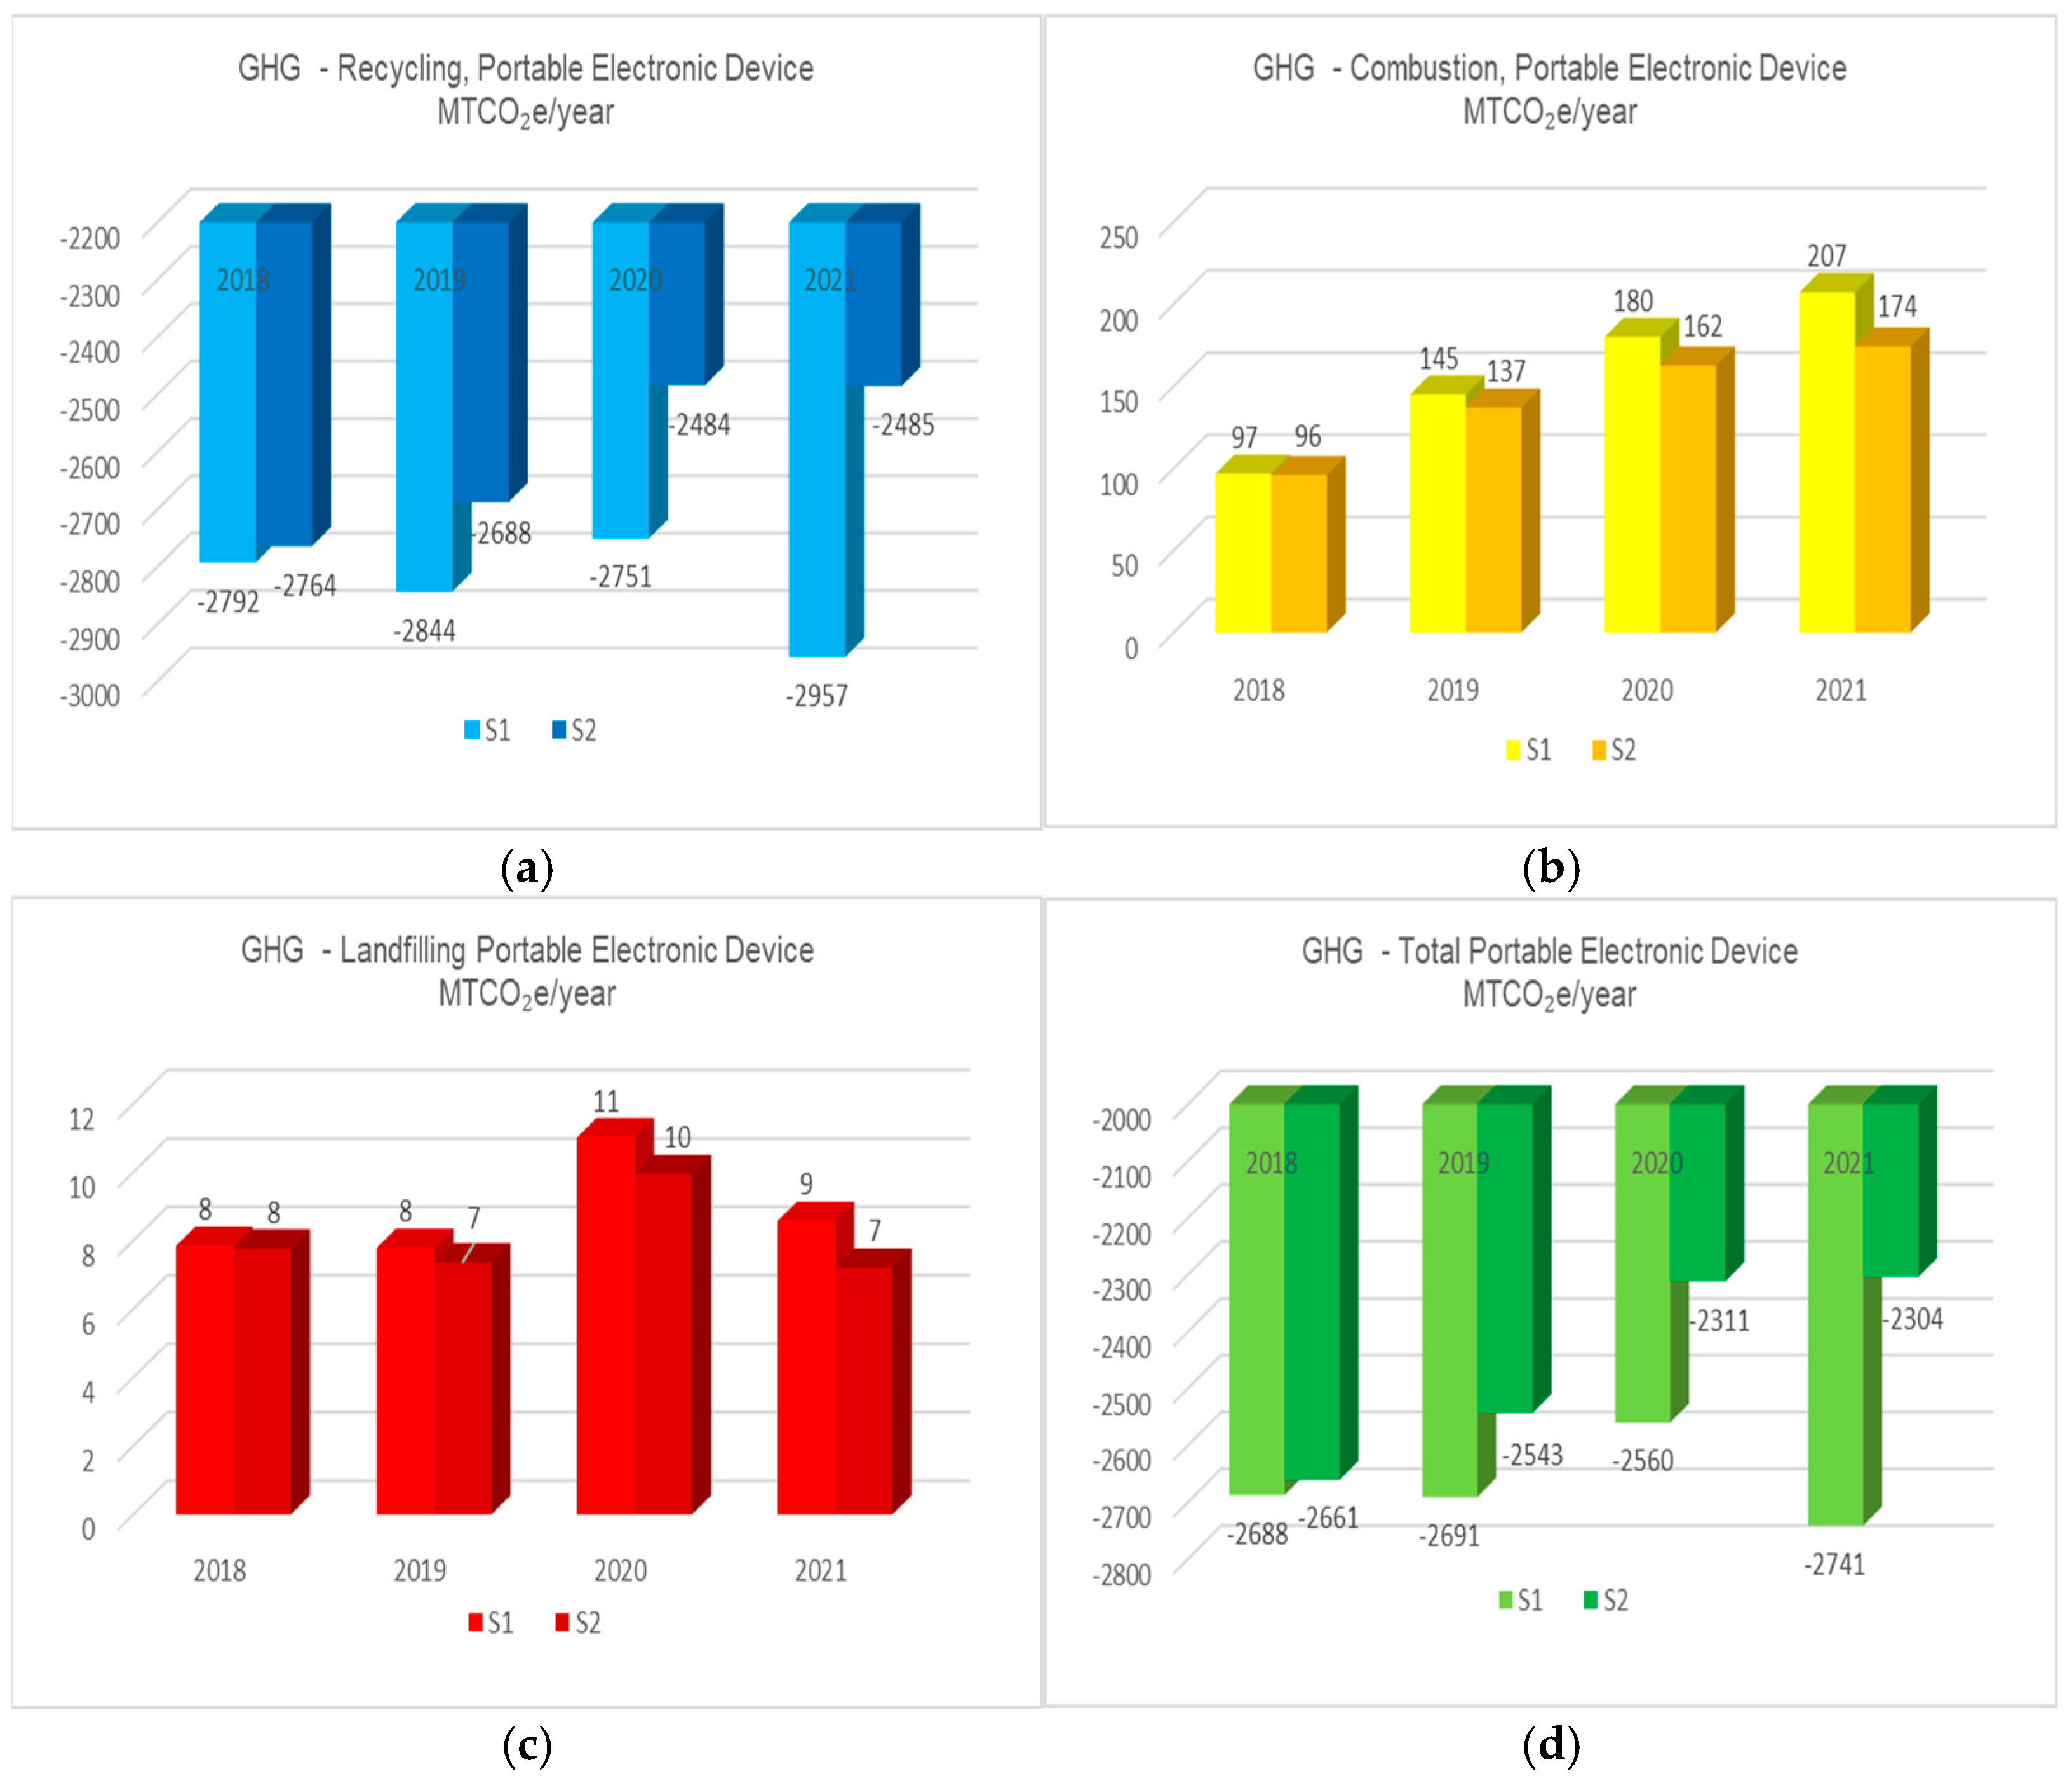
  • Portable electronic devices—laptops, e-readers, tablets, and smart and classic mobile phones;
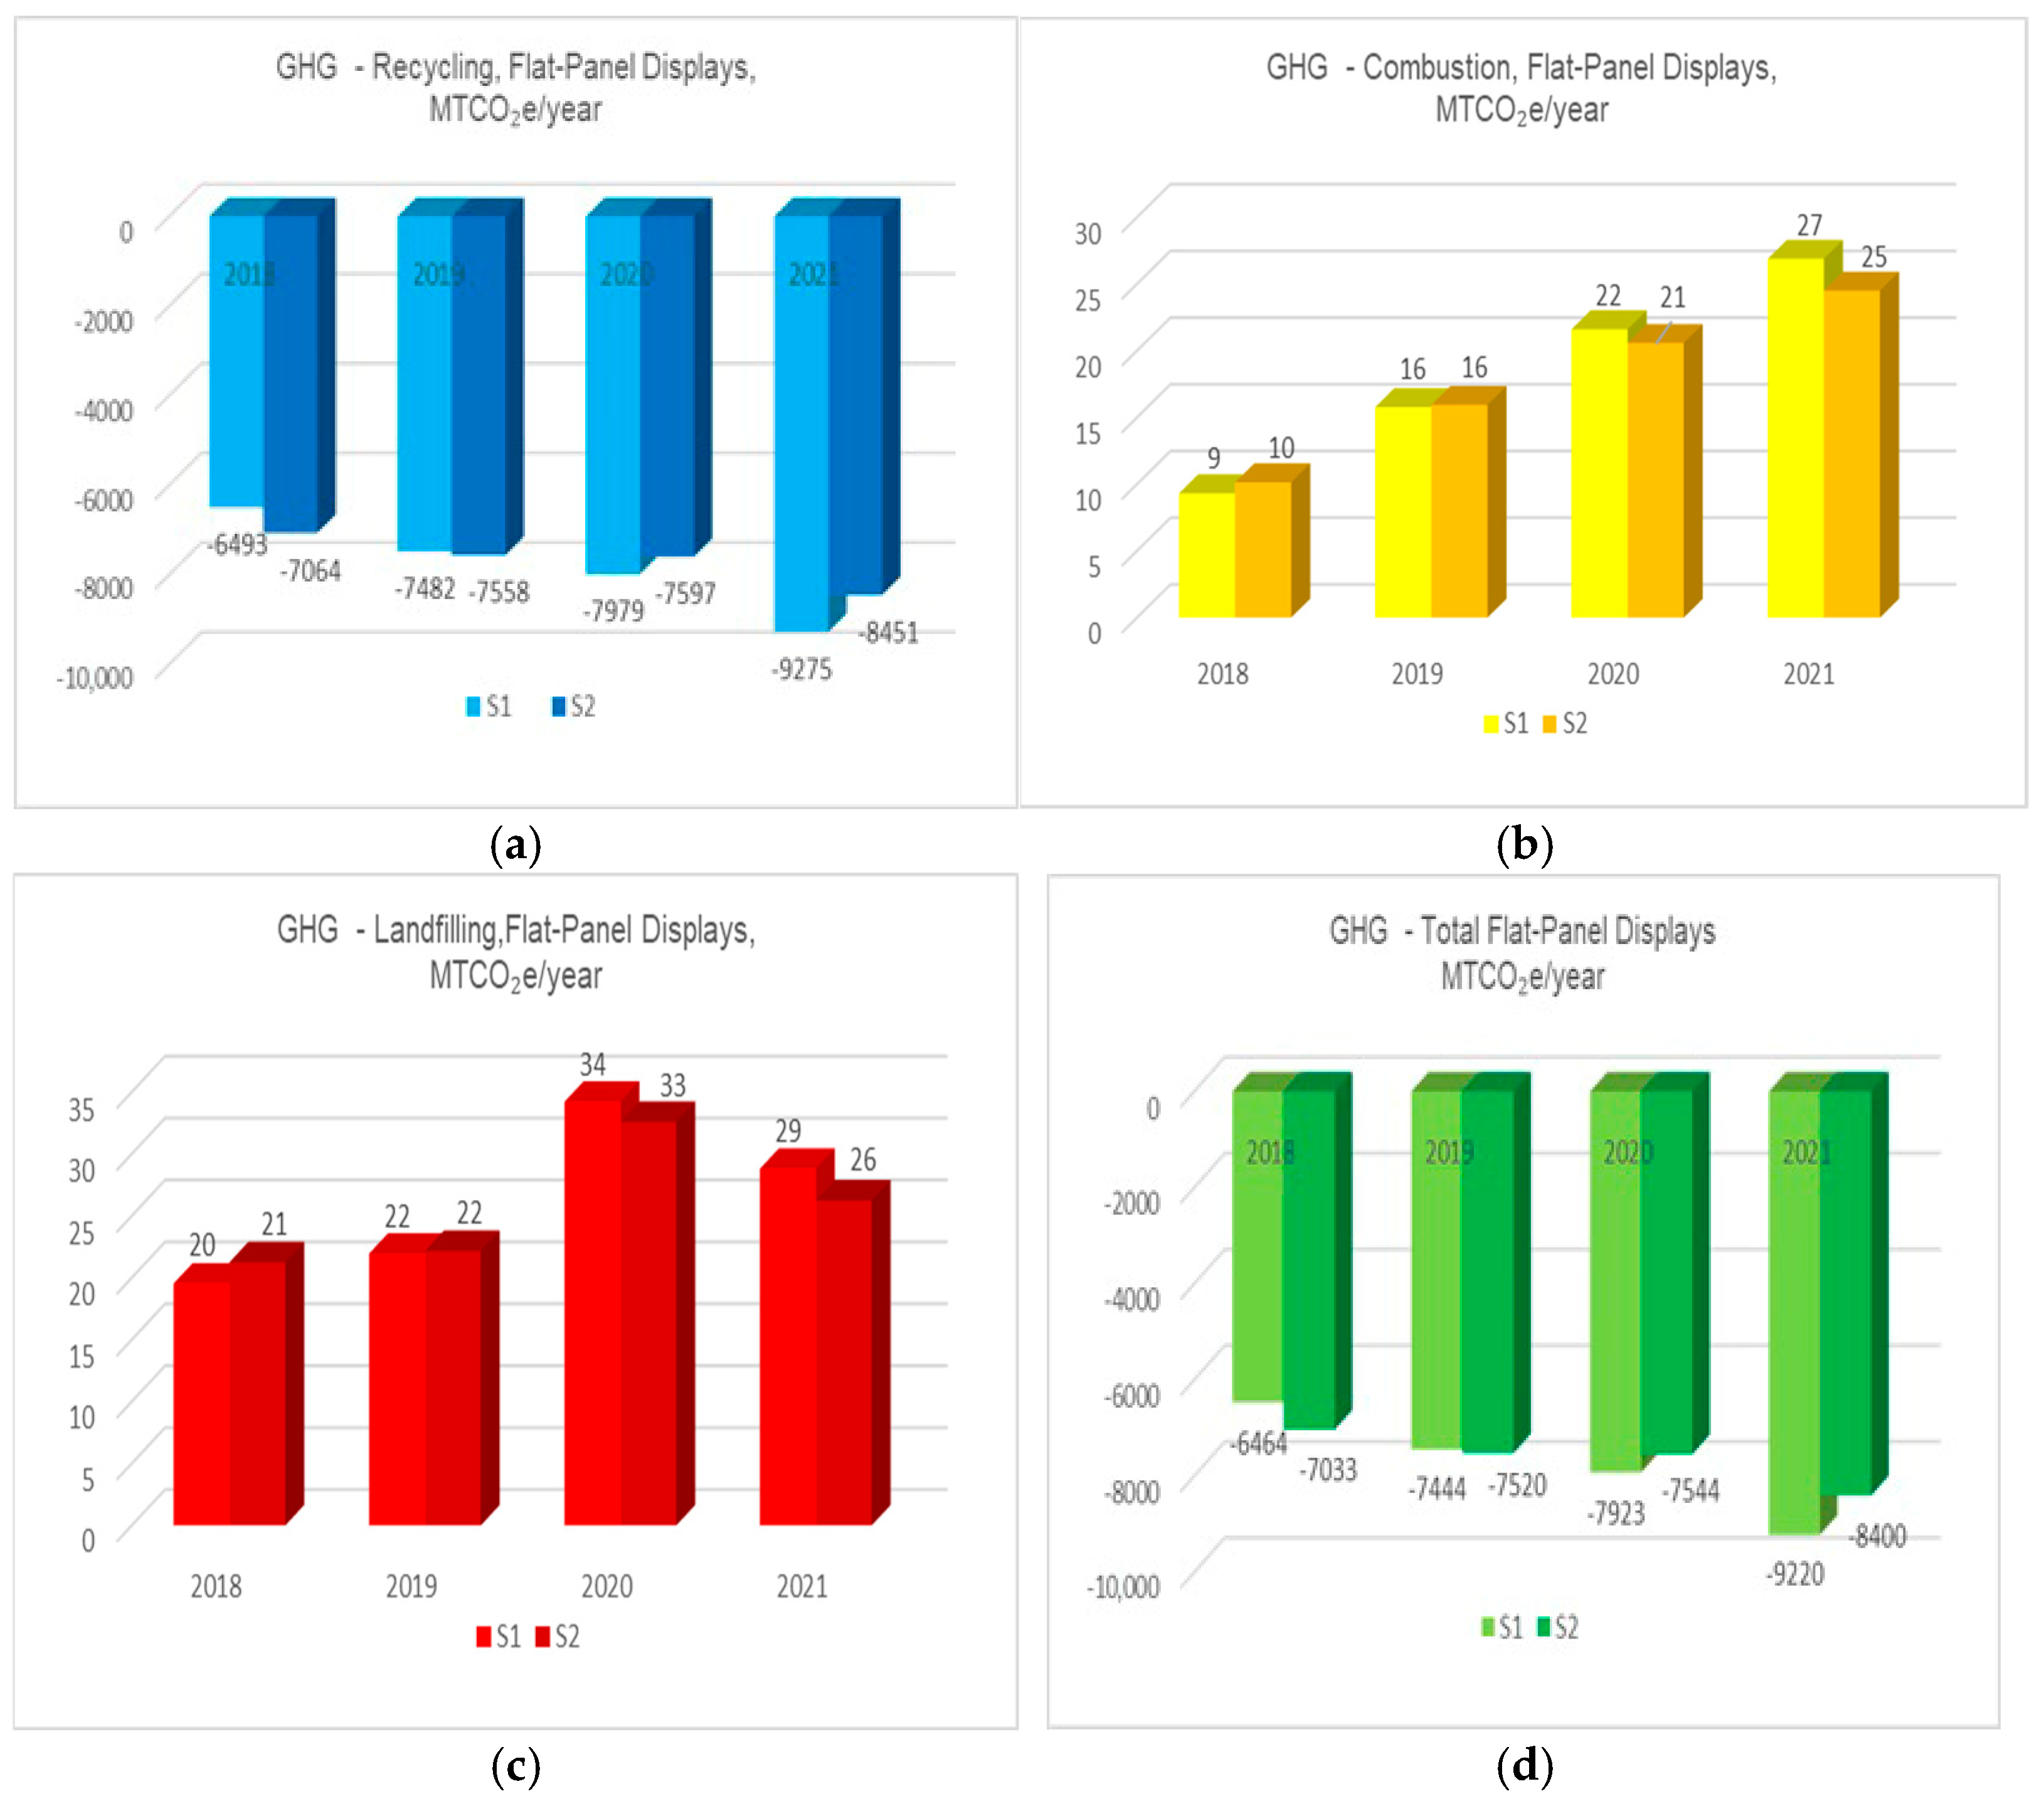
  • Flat-panel displays—light-emitting diode (LED) and liquid-crystal display (LCD) TVs, plasma TVs, and LED/LCD computer monitors;
  • Cathode-ray tube (CRT) screens—CRT televisions and monitors, which, although they are no longer manufactured, still appear in the waste stream;
  • Peripheral equipment—devices used together with other electronics, such as keyboards and mice;
  • Printing equipment—devices for making printed documents, such as printers and multifunction devices;
  • Mixed electronics—a category that includes a combination of electronic devices.
According to the Waste Reduction Model (WARM) Data Quality Assessment Report (2023) [38], data quality results from the material type and management pathway for the general category of Electronics, where IT and telecommunications WEEE is considered to be Medium–High, which is acceptable for this study.
For this study, due to the specifics of electrical and electronic equipment and the availability of data on implemented WEEE reuse, the treatment options for which environmental, economic, and social impacts will be analyzed are recycling, incineration, and landfilling. The emission factors for the GHG assessment of these management options, expressed in metric tons of CO2 equivalent for GHGs used, are described in Table 1. Similarly, the impact factors for energy, wages and taxes, and labor hours are made available by US EPA. All emission/impact factors are based on LCA, covering the material stages from extraction to waste disposal, and are tailored to different management methods while accounting for avoided emissions from recycling and energy recovery. These factors are material-specific and may be customized for regional conditions, such as landfill gas capture and transportation distances. They are updated regularly to ensure that the tool reflects technological advancements and evolving waste management practices, providing reliable insights for sustainability planning.
Starting with the WARM version 15, EPA expanded the assessment of impacts to include economic impacts related to employment (labor hours), wages, and taxes. Economic impacts include both direct effects associated with the transformation of recyclable materials into marketable products and indirect effects such as the collection, sorting, and transportation of materials. The economic benefits of waste management practices such as recycling, composting, and anaerobic digestion can be determined using the WARM. Data from the Recycling Economic Information (REI) study, originally published in 2001 and updated over time using Input–Output (IO) models to measure economic activity, including direct impacts (e.g., the transformation of materials into products) and indirect impacts considering collection, sorting, are transport, are integrated into WARM [31].
A brief overview of the expected environmental and health impacts related to the management of IT and telecommunication WEEE is summarized in Table 2.

2.2. Waste from Electrical and Electronic Equipment Calculation Tool

To be able to use the US EPA WARM, a data inventory on the waste quantities associated with WEEE management scenarios is required. This involves determining the amount of waste managed within a specific timeframe, by material type and management method. Accurate data input ensures reliable comparisons of GHG emissions, energy savings, and economic and social impacts.
Schematically, the methodology used for this paper, with the necessary steps of data collection, modeling, and evaluating impacts, is illustrated in Figure 1.
Before the data input step in the US EPA WARM, another step was performed to determine the generated quantities of specific e-wastes by using the WEEE Calculation Tool (version 1.0/Feb 2025), made available for Member States by the European Commission. The tool was derived from the Implementing Regulation 2017/699 so as to establish a standardized methodology for calculating the weight of EEE placed on the market by each Member State, but also to make available forecasts regarding the generation of WEEE [45], essential for the effective enforcement of WEEE Directive (2012/19/EU), which sets clear targets for the collection, recycling, and recovery of WEEE.
A key aspect of the regulation is the integration of product lifespans into calculations. By taking into account the variability in product lifespans, this methodology provides realistic estimates of EEE becoming wastes, contributing to a clearer understanding of WEEE flows and supporting future waste management planning.
In total, 28 versions of this tool have been created, with the latest version being revised in June 2024 by the United Nations Institution for Training and Research (UNITAR), all based on the same methodology but preloaded with data specific to each Member State regarding the amount of EEE POM in the period of 1980–2018, as well as with data on the lifespans of equipment for the same period [46].
The tool allows for entering data on EEE POM, either gathered through the apparent consumption methodology or data reported on national registers. It calculates the quantities of EEE placed on the market according to the categories defined in Annexes I (EU-6) and III (EU-10) of Directive 2012/19/EU, as well as the amount of WEEE generated. POM data based on the apparent consumption methodology, developed by UNITAR, use Eurostat data from Member States, and are calculated by accounting for imports, exports, and local production. The calculation scripts and documentation are published in open-source format, promoting consistent data reporting across the EU.
The apparent consumption method estimates the weight of EEE introduced on the market of a Member State in a year according to the following equation:
EEE POM(t) = domestic production (t) + imports (t) − exports (t)
WEEE generated in the territory of a Member State, for any year, with the help of the WEEE Calculation Tool, is based on the following:
  • Amount of EEE POM in previous years;
  • The appropriate lifetime of a product, which determines when it becomes waste.
This can be calculated using the following equation (Equation (2)):
W   n = t = t 0 n P O M   t × L p × ( t , n )
where:
W (n)—quantity of WEEE generated for that year n (tons);
POM (t)—quantity of EEE placed on the market in any year t;
t0 = the first year when EEE was placed on the market;
L(p) (t, n)—the discard-based lifespan profile for EEE placed on the market in year t, representing the probability of the equipment being discarded in evaluation year n, expressed as a percentage of total sales in year n. This profile is calculated using a Weibull distribution function, which is characterized by a time-dependent shape and a scale parameter.
Both parameters, shape and scale, are positive, are set for each Member State separately, and are included in the Calculation Tool as default values. The over-unit value of k indicates an increase in the failure rate over time, which reflects the process of the wear and tear of products or the situation of components becoming more susceptible to failure as time goes by, a common phenomenon experienced by electrical and electronic equipment.
The WEEE calculation tool was developed in Microsoft Excel 2013 as an .xlsm spreadsheet in a relatively simple manner, compatible with other Excel versions and operating systems, containing 27 different spreadsheets that are essential for the tool’s operability. Most sheets are hidden by default to prevent accidental changes that could cause calculation errors [47].
Data on the quantities of EEE placed on the market can be entered using the classifications from the EU-6 or EU-10 standard categories, but different national classifications can also be used, in which case, each category within the national clusters must be associated with one or more UNU KEY codes. These are groups of products that share average weights, material compositions, end-of-life characteristics, and comparable lifetime distributions [48].
Considering that, for the purpose of this study, the sustainability of the generated IT and telecommunications WEEE stream was analyzed, the UNU KEYs (10 categories) of related equipment needed to be correlated (Table 3) with the corresponding categories from the USEPA WARM (6 categories).
The methodology proposed can be replicated in any EU Member State that provides data in Eurostat or any other state that records WEEE in one of the 2 manners (quantities placed on market) or the apparent consumption model to obtain the 5-indicator sustainability profile of IT and telecommunication equipment. This approach to WEEE data processing as an input for sustainability analysis has not been reported before.
It can also provide time variations, since the apparent consumption model considers the average time span of each WEEE UNITAR category to give predictions of the WEEE quantities generated. By using the same WEEE quantity reporting system, inter-country comparisons for a certain year may also be possible.

3. Results

WEEE is a key waste stream at the European level due to its rapid growth, content of hazardous materials, and valuable resources that can be recovered. Effective WEEE management supports the circular economy, increases resource efficiency, and ensures access to critical raw materials, strengthening the strategic autonomy of the EU [49].
Data availability on the flow of WEEE generated, components, and their management is limited by the fact that reporting in the Eurostat database is a lengthy process, taking at least 2 years. The latest information on the WEEE flows validated in the Eurostat database is from 2022, and in the case of Romania, it is from 2021 (for 2022, estimated data are currently available).
Another problem encountered is the fact that the national database of the Romanian Environmental Protection Agency provides aggregated information at the WEEE category level, without specifying information about WEEE management for waste subcategories. For instance, in the category of IT equipment and telecommunications, there are no data on the composition of this category or on the subsequent management of the generated waste.

3.1. IT and Telecommunication Equipment Material Flows Using WEEE Calculation Tool

By using the WEEE calculation tool, the user may enter EEE POM according to UNU KEY, but also calculate the WEEE generated according to this classification, which is particularly useful when a more thorough analysis of the evolution of certain components within, for example, a WEEE category is needed, as is the case, for example, for IT and telecommunications equipment, where various types of equipment can be found, each with its own technical characteristics and lifespan.
Two scenarios of waste generation were modeled (as presented in Table 4) at the national Romanian level for IT and telecommunications equipment, based on the lifespan of each category of EEE and the quantities POM in previous years.
The first scenario was built on the reported data of EEE quantities POM in the Eurostat database (Scenario 1—S1), and the second (Scenario 2—S2) on the quantities resulting according to the apparent consumption (AC) methodology, for a 4-year period, 2018–2021. The quantities extracted from the WEEE Calculation Tool by UNU KEY codes were aggregated according to the USEPA WARM categories, and these, in turn, were transformed from the European unit of measure, metric tons, into the American measurement unit, short tons (1 metric ton = 1.1023 short tons).
From the data reported by Romania for WEEE management in Eurostat, the percentages associated with each operation were extracted—recycling, incineration, and landfilling—using an assessment where the difference in quantity between the recovered WEEE and recycled WEEE was subjected to incineration with energy recovery.
As can be observed in Table 3, the CRT Displays category displays the same values for WEEE generation in both scenarios. In the case of Desktop CPUs, the values corresponding to 2018–2019 are insignificantly different, while for 2020 and 2021, the variations are higher, with higher values in the case of Scenario 2. In the case of Portable Electronic Devices, Scenario 1 displays the highest values compared to Scenario 2, which is surprising, as even though Scenario 1 displays an increase in the generated quantities of WEEE, Scenario 2 indicates a decrease in the largest difference between the generated quantities of WEEE in 2021. In the case of Flat-Panel Displays, the increase is significant in both scenarios, and for 2018–2019, the largest WEEE quantities are displayed in the case of Scenario 2, while in 2020 and 2021, the largest values of WEEE quantities are registered in the case of Scenario 1. In Scenario 2 for Electronic Peripherals, the waste generated registers higher values from 2019 to 2021 compared to Scenario 1, while Hard Copy Devices generated as wastes indicates Scenario 1 to have a higher amount of quantities generated compared to Scenario 2 in all years. The pattern of these variations and the differences in both scenarios will also model the sustainability profiles of the WEEE categories.
The quantities modeled in the two scenarios from Table 3 are used as inputs in the USEPA WARM model, according to the share of each treatment type, to assess the environmental, economic, and social impacts of the selected WEEE stream.

3.2. Sustainability of WEEE Management System in Romania Using the US EPA WARM Model

3.2.1. Environmental Impacts

The environmental impacts that can be assessed with the USEPA WARM are as follows:
  • Carbon footprint through GHG emissions, expressed in metric tons of carbon dioxide equivalent (MTCO2e)—the differences in emissions between landfill scenarios and alternatives such as recycling or combustion are estimated;
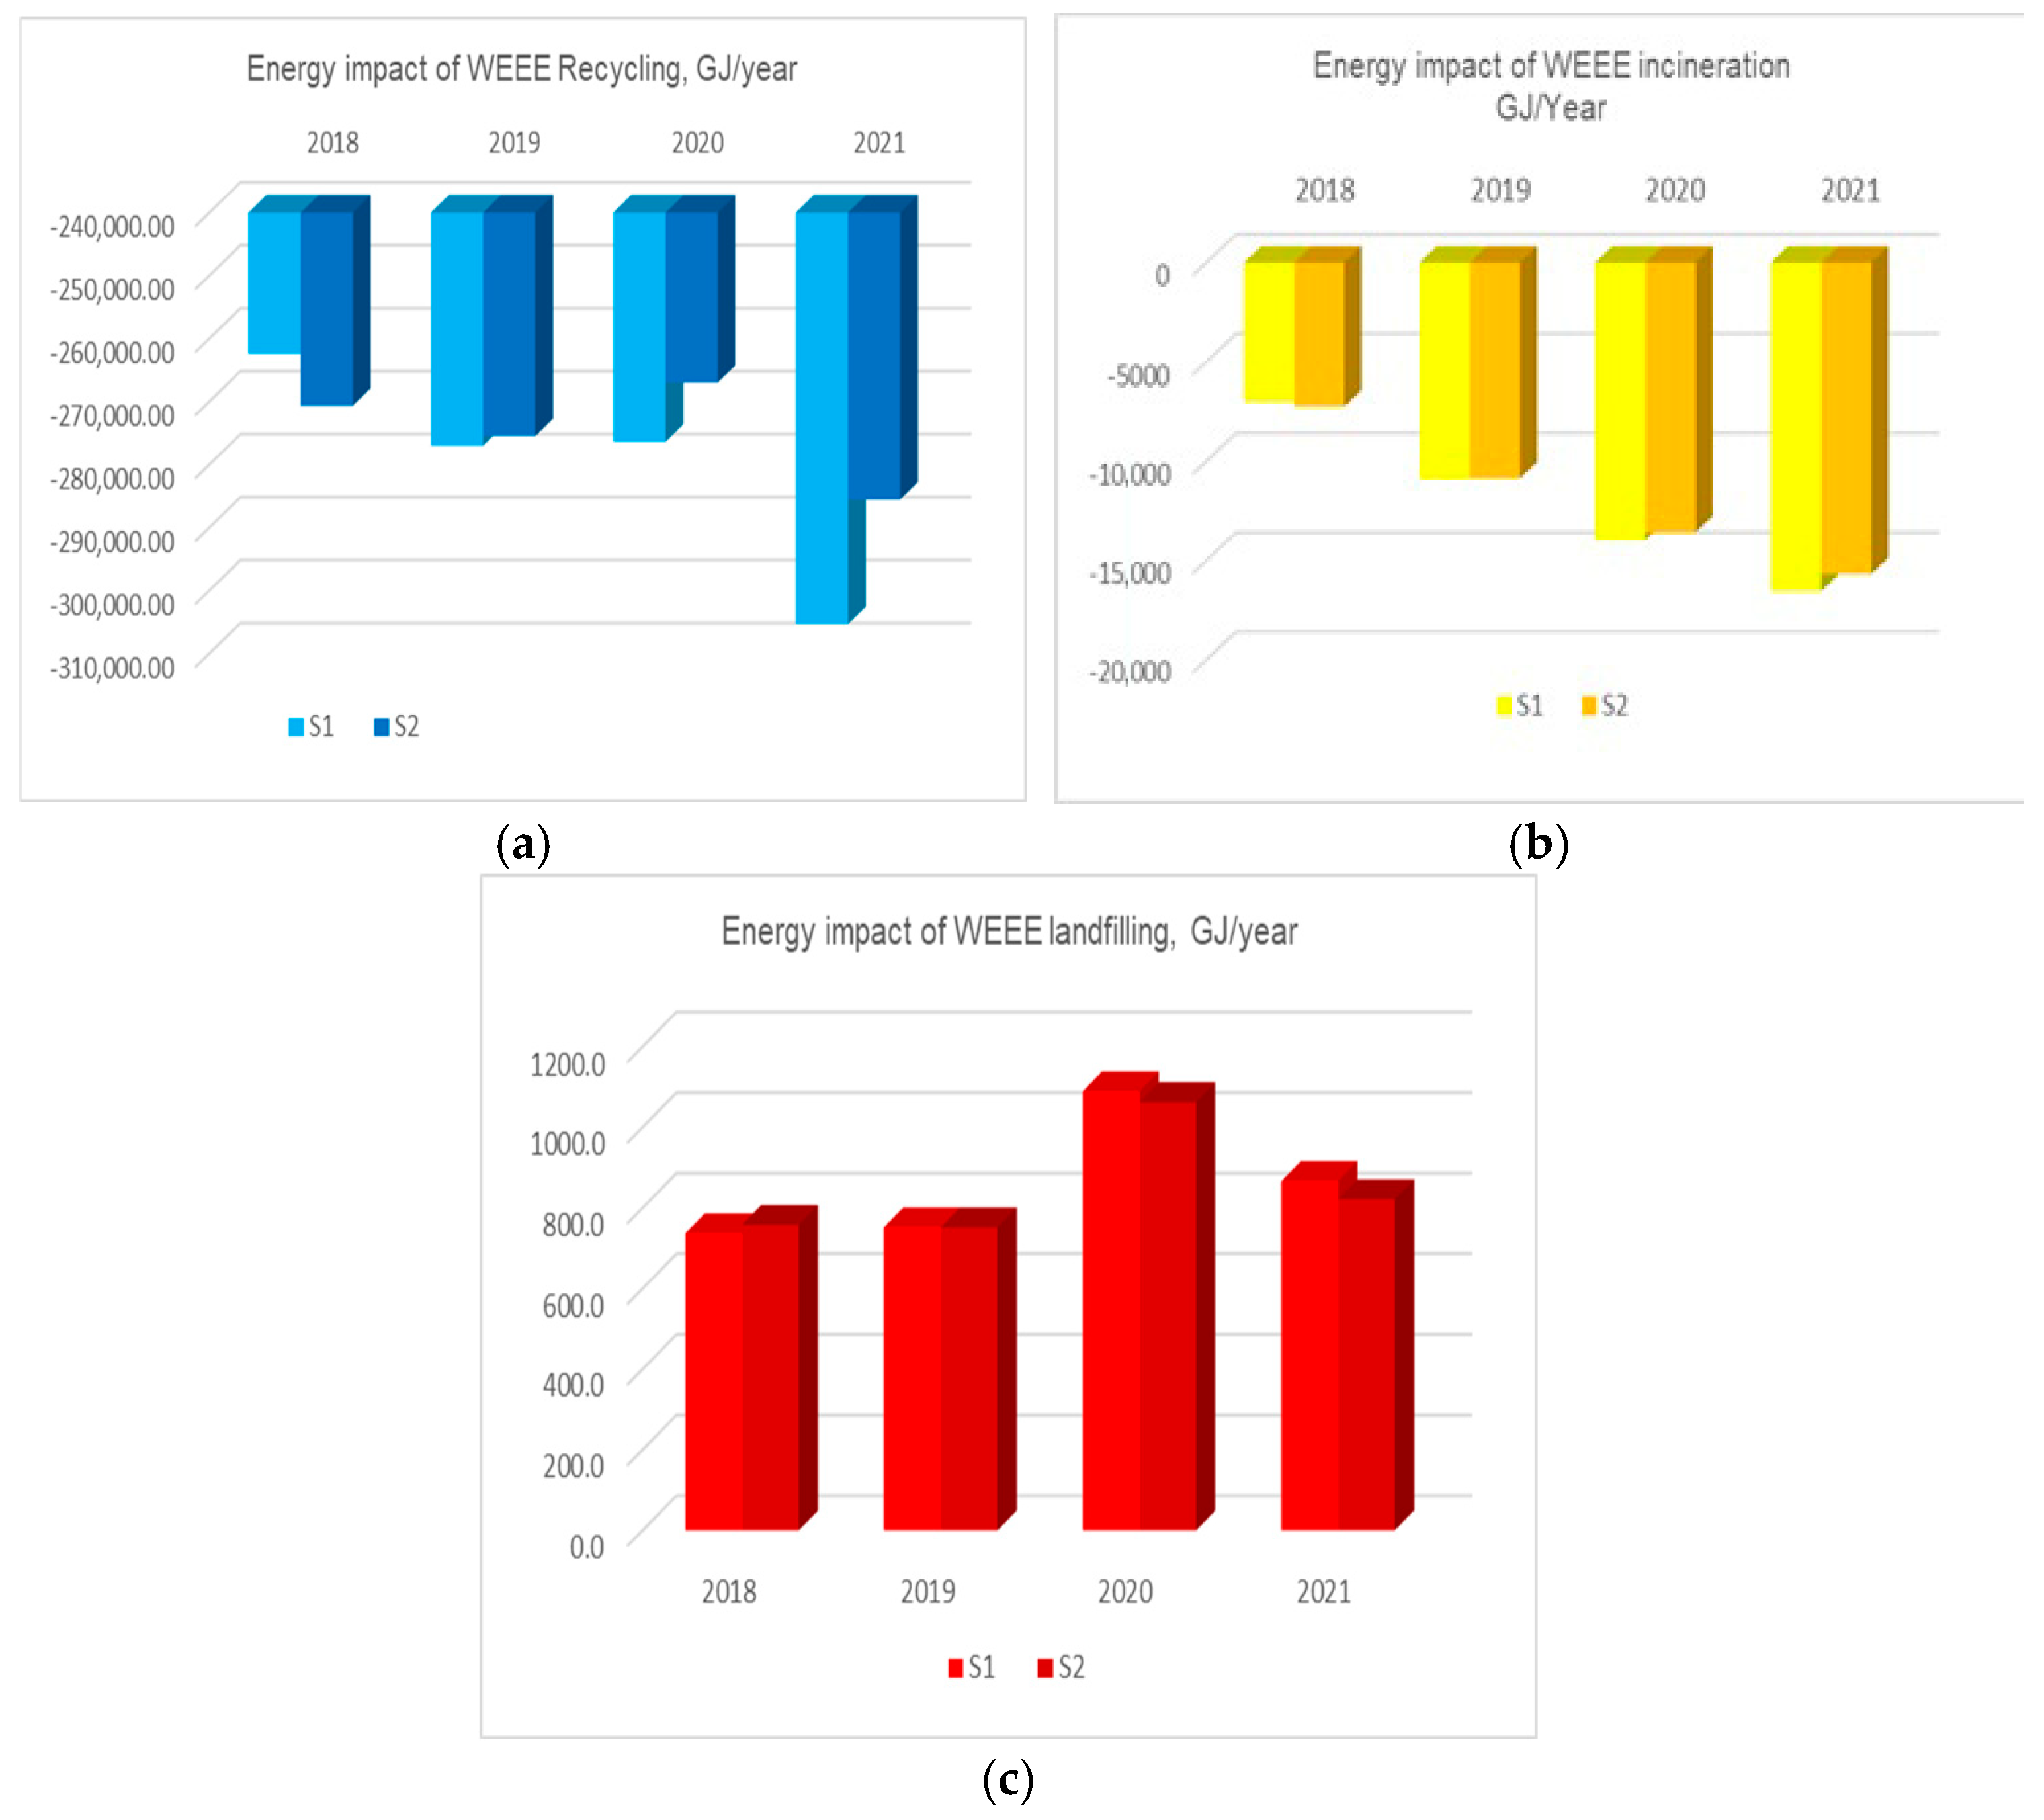
  • Energy savings by recovering materials and reducing the need to produce new products from virgin resources, expressed in millions of BTUs (British Thermal Units).
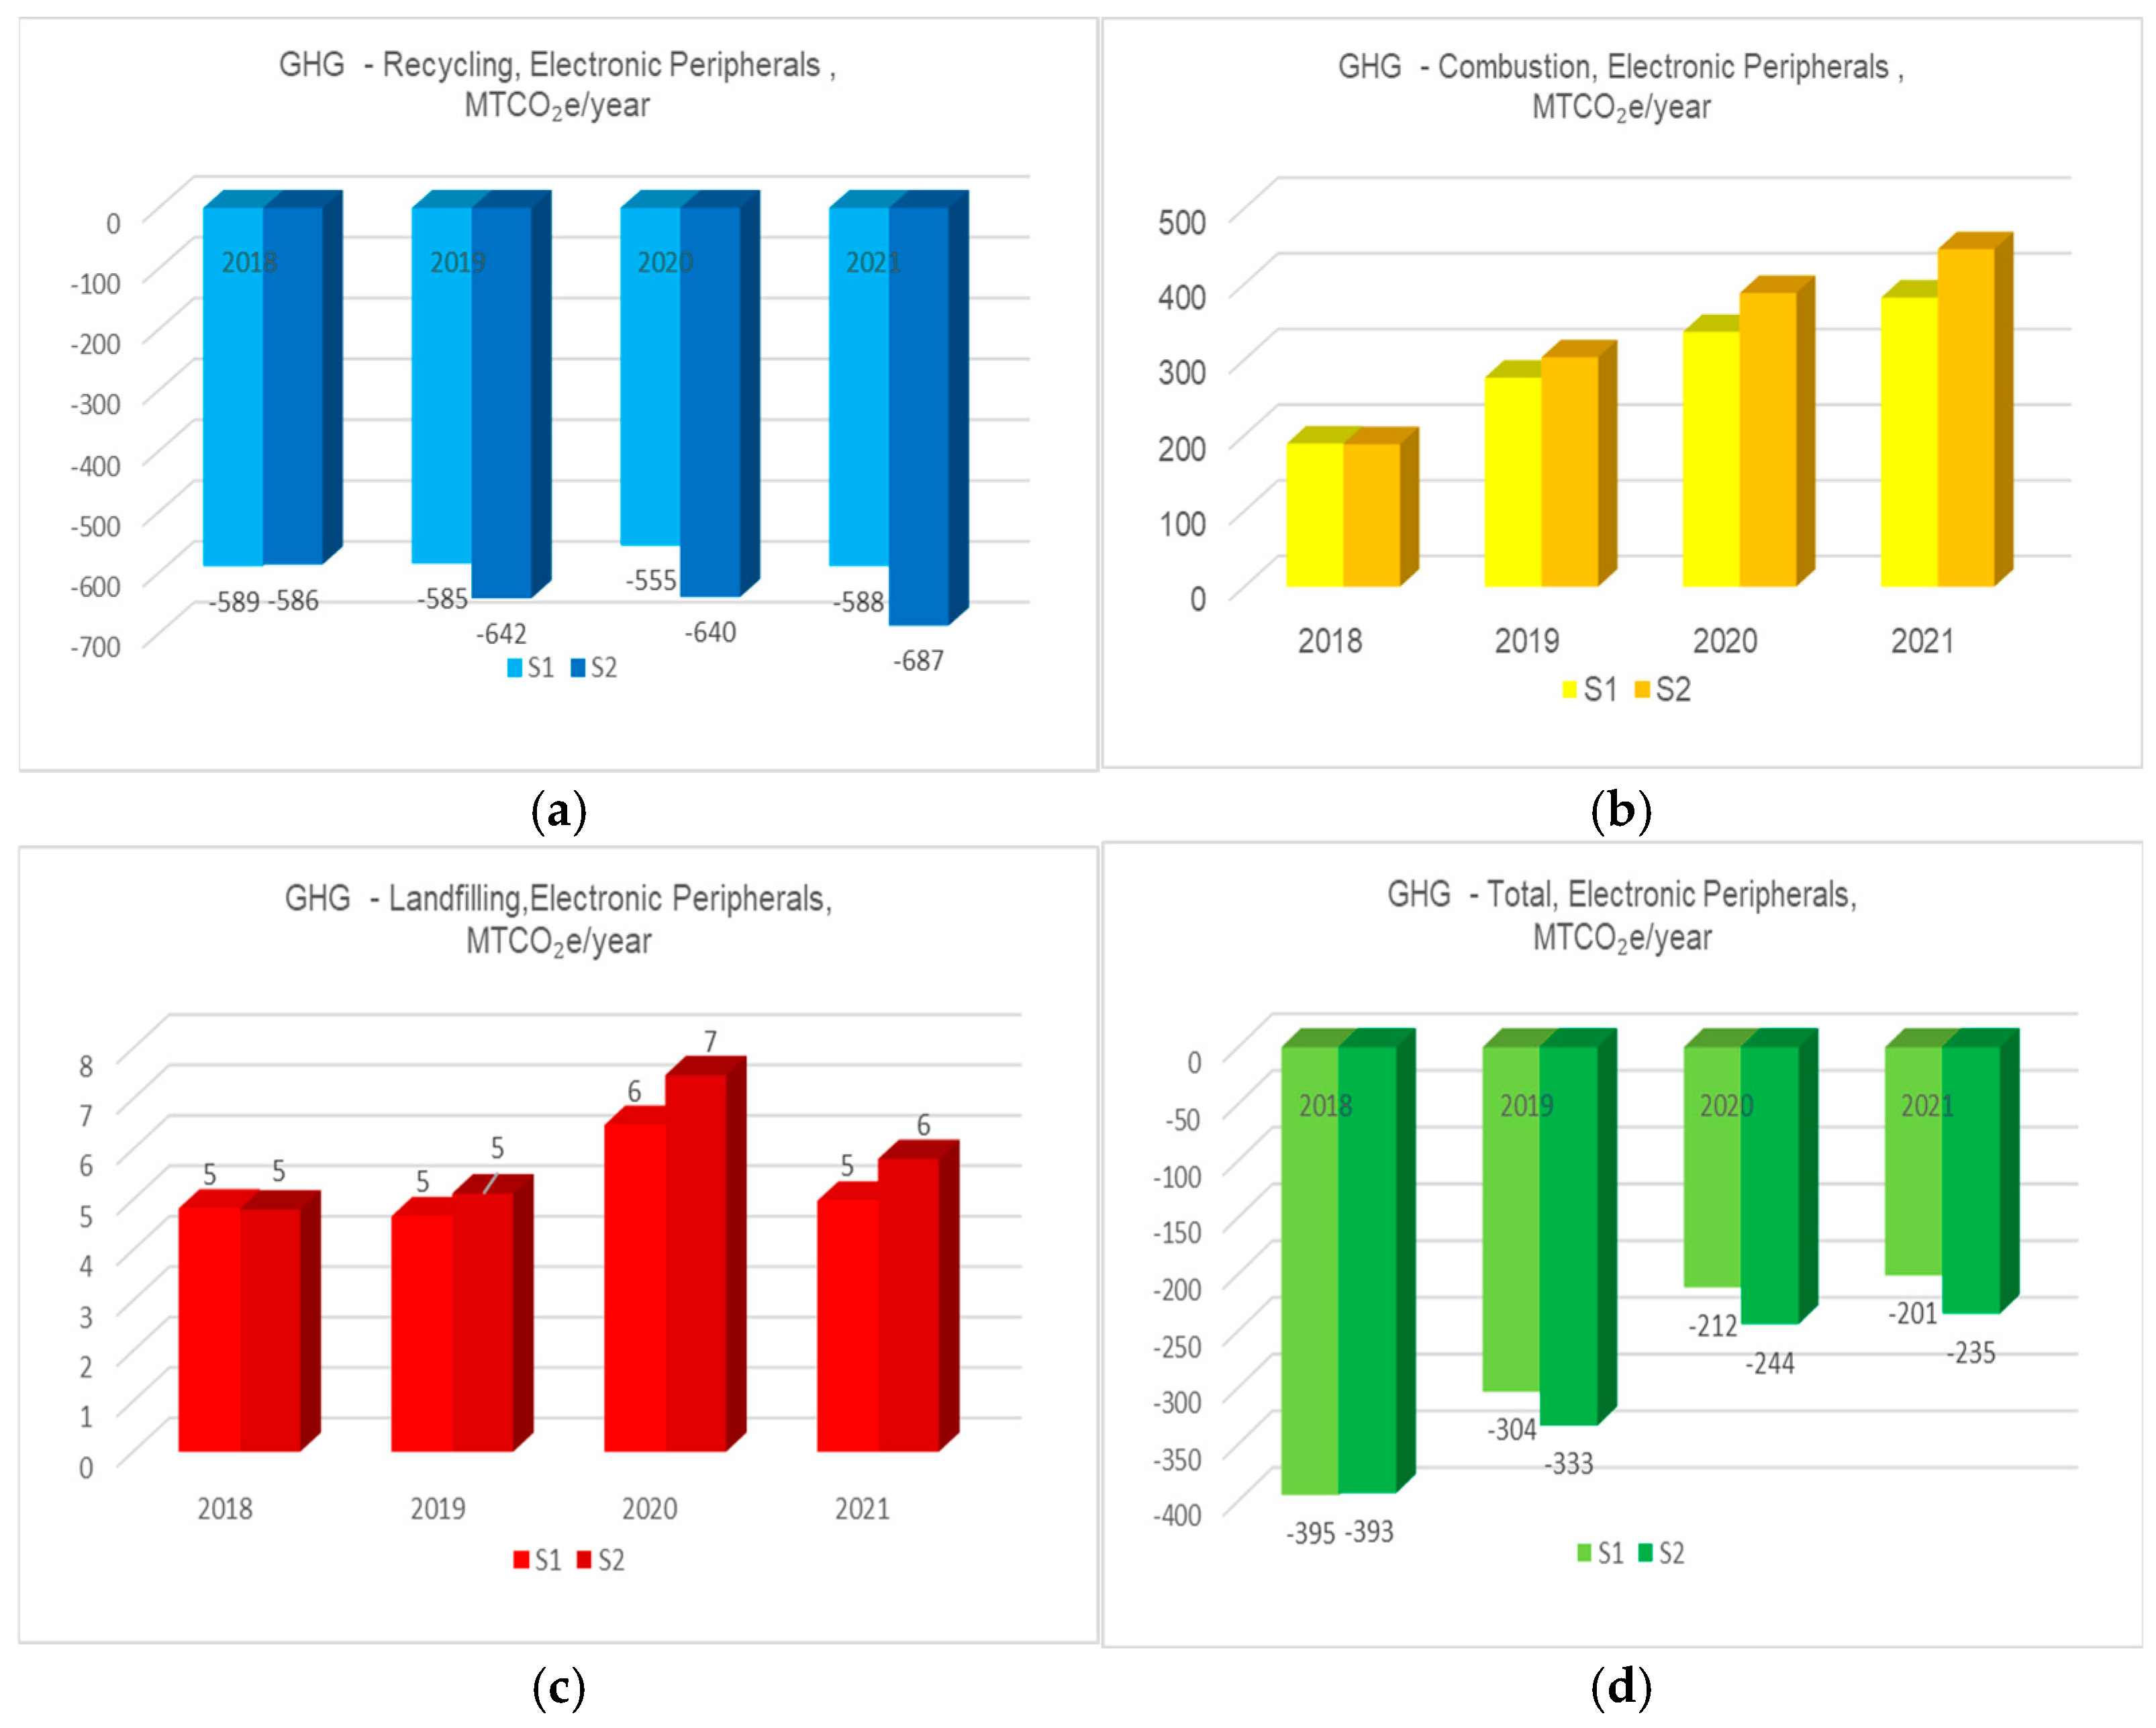
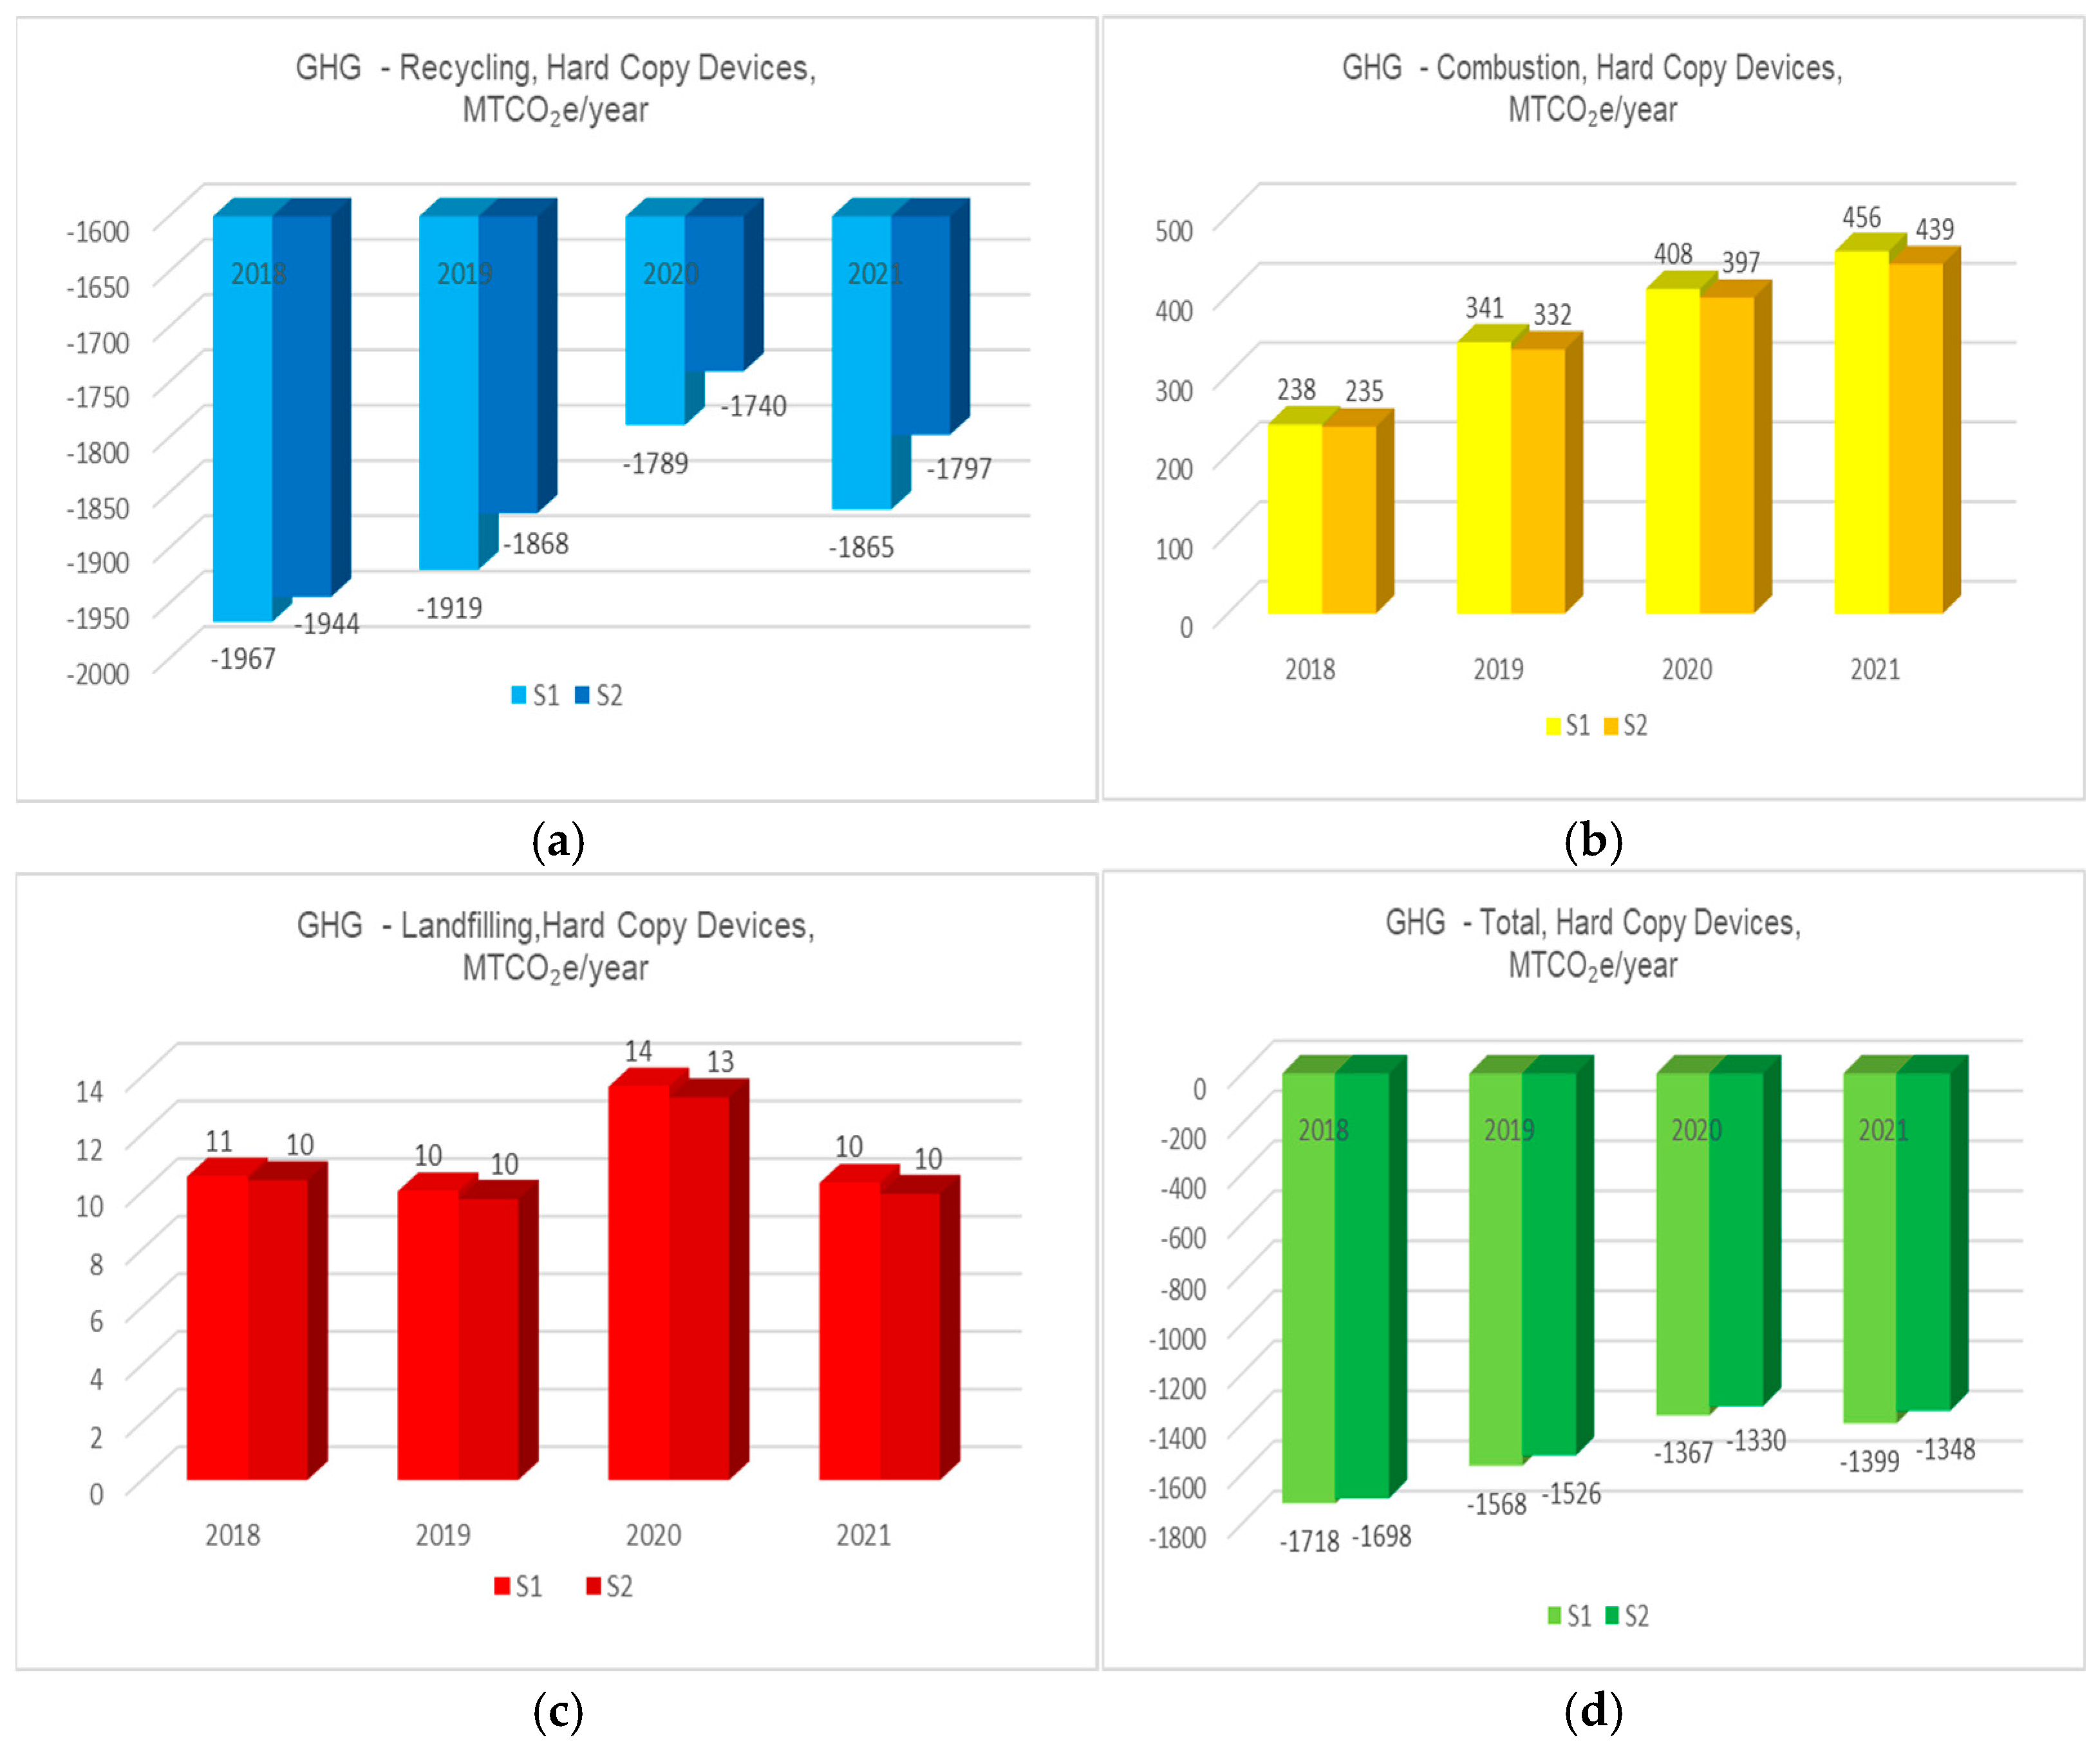
The energy consumption/savings resulting from the operations of recycling, incineration (combustion in US EPA WARM), landfilling, and total usage for the six categories of WEEE were transformed from the USEPA WARM unit of measure—million BTUs—to Giga Joules (GJ) for each year.

Carbon Footprint

The carbon footprint of the end-of-life (EoL) management of Desktop CPUs can be observed in Figure 2.
For the Desktop CPU category, recycling and incineration generated a negative carbon footprint for the 4-year period due to reduced GHG emissions, which brings environmental benefits. The current EoL treatment option mix helps to prevent and offset emissions, emphasizing the importance of sustainable e-waste treatments. For Desktop Units sent to landfills, the carbon footprint had positive values, indicating a negative impact on the environment, with the highest value being in year 2020, at approximately 8 MTCO2e/year, while for the other years, the situation was relatively constant.
The total carbon footprint resulting from recycling, incineration, and landfilling had negative values, representing an environmental benefit resulting from the management of the Desktop CPU category, with the highest savings occurring in 2021 and the lowest in 2020.
The carbon footprint of the EoL management of Portable Electronic Devices is depicted in Figure 3.
Figure 3 indicates that recycling had negative carbon footprint values over the investigated period, with the highest benefit observed in 2021 for the quantities generated according to Eurostat data (Scenario 1= −2957 MTCO2e/year, Figure 3a) and the lowest benefit in 2020. The apparent consumption scenario (Scenario 2), with −2485 MTCO2e/year for recycling (Figure 3a), presents a reduction in GHG emissions and a positive impact on the environment. In both scenarios, combustion and landfilling led to positive carbon footprint values, indicating a negative impact. The highest emissions were recorded in 2021 for incineration and 2020 for landfilling, and while the lowest were recorded in 2018 for both treatment options. Irrespective of the year, the total carbon footprint showed negative values associated with the waste treatment options, with the highest negative values registered for scenario S1.
Flat-Panel Display recycling (presented in Figure 4) was the most appropriate treatment method with the greatest environmental benefits. The carbon footprint showed negative values during the 4 years, with a downward trend, with the most favorable situation being in 2021 (both for Eurostat and apparent consumption data, Scenarios 1 and 2) at −9275 and −8451 MTCO2e/year, respectively, indicating a beneficial circumstance. In terms of incineration and disposal, the highest emissions were recorded in 2021 for combustion and 2020 for landfilling, with the lowest being recorded in 2018 for the case of Portable Electronic Devices. The total carbon footprint showed negative values, with the highest benefits being recorded in 2021 for the quantities generated in the case of S1 and the lowest benefits being recorded in 2018 for both scenarios, reflecting significant reductions in GHG emissions for the general management of this category of WEEE.
For the CRT (Cathode-Ray Tube) Displays category (as depicted in Figure 5), the carbon footprint of the recycling operation had negative values, indicating a significant reduction in GHG emissions between 2018 and 2021. This trend is decreasing due to the fact that lower quantities of this type of waste are generated, given the fact that they have not been produced for almost two decades. In contrast, combustion and landfilling generated positive carbon footprint values, peaking in 2021 for incineration and 2020 for landfill, respectively. The total carbon footprint for the CRT category, resulting from recycling, incineration, and landfill, was negative, with the highest benefit in 2018 and the lowest in 2021. These results underline the essential roles of the recycling and adequate management of e-waste in reducing environmental impacts.
The carbon footprint of managing waste from Electronic Peripherals is depicted in Figure 6.
Recycling generated a negative carbon footprint for the Peripheral Equipment category, indicating savings in GHG emissions. The largest reduction in emissions was seen in 2021 (−686.7 MTCO2e/year, Scenario S2) and the lowest was seen in 2020 (−555.0 MTCO2e/year, scenario S1), reflecting decreasing emissions. Combustion and landfilling led to positive carbon footprint values, indicating a negative impact on the environment, with the highest values in year 2021 for incineration, while landfilling in year 2020 had the highest values. The total carbon footprint for the end-of-life management of Peripheral Equipment was negative, therefore, benefits for the environment can be seen in this case, with the highest emission reductions. Thus, the highest environmental benefits were observed for the year 2018, decreasing for the following years.
The carbon footprint of the management of end-of-life Hard Copy Devices can be observed in Figure 7.
Recycling in the Printing Equipment category had a negative carbon footprint over the years, indicating a reduction in GHG emissions and a positive impact on the environment. The highest benefits can be observed for the year 2018, both for the data based on apparent consumption methodology and on Eurostat (−1966.6 MTCO2e/year and −1944.0 MTCO2e/year), while the lowest benefits were seen for the year 2020. In contrast, incineration and landfill generated a positive carbon footprint, which reflects a negative impact on the environment. The highest emissions can be observed in 2021 for incineration and 2020 for landfilling, while the lowest can be observed in 2018 and 2019, respectively. The total carbon footprint for Hard Copy Devices was negative, with the highest benefit recorded in 2018 and the lowest values in 2020.
The carbon footprints of the six categories of IT and telecommunication waste treated by recycling, incineration, and landfill show that recycling contributes to reducing greenhouse gas (GHG) emissions. In contrast, incineration (except for Desktop CPUs) and landfilling generate emissions, a fact highlighted by positive carbon footprint values. Overall, the total carbon footprints for all six categories and treatment methods show negative values, indicating a general reduction in GHG emissions, with the greatest benefits for 2021 due to the higher amounts that were managed as compared to the other years, both in the apparent consumption scenario and Eurostat scenario. The quantities reported as being introduced but also managed in the Eurostat scenario were higher, even if the recycling rate decreased slightly from 83% for 2018 to 79% in 2021 [50].

Energy Consumption

The US EPA WARM assesses the environmental impact of materials handling by quantifying GHG emissions and energy consumption. Because not all emissions are directly related to energy, WARM provides results in the following two formats: GHG emissions expressed in metric tons of CO2 equivalent and energy impact expressed in British Thermal Units (BTUs).
In the US EPA WARM methodology, energy impact is assessed to measure the savings or energy consumption associated with different waste management methods. This model looks at how recycling, combustion, and landfilling influence energy consumption throughout the lifecycle of materials. The energy consumption (presented in Table 5) resulting from the operations of recycling, incineration, and landfilling for all six categories of WEEE was transformed from the US EPA WARM unit of measure—million BTUs—to Giga Joules (GJ) for each year.
End-of-life management for all forms of treatment for the analyzed WEEE flow generated the highest environmental benefits, considering potential energy savings for treating Flat-Panel Displays in the year 2021 in the Eurostat data scenario (S1). Overall, the total energy impact showed negative values, which indicates that the treatments applied for all categories included in this study have a low energy demand, with the lowest environmental impact being recorded for year 2021, −320,991 GJ/year (Eurostat, Scenario S1) and −300,415 GJ/year (apparent consumption, Scenario S2), and the highest in 2018, −268,715 GJ/year and −277,164 GJ/year, for Scenario 1 and Scenario 2, respectively. While the energy impact factor fluctuated, mainly for recycling across all six categories [31], the quantities treated weighed more in the total energy consumption.
Recycling is the pinnacle of environmentally sound e-waste management if it is properly regulated [51]. The inadequate management of e-waste contributes to climate change through the release of GHG emissions. Practices such as uncontrolled landfilling and the open burning of WEEE, common in lower-income regions, contribute to GHG emissions and accelerate global warming [52]. It can be observed from the results presented above for carbon footprint and energy consumption that taking back materials in productive activities through recycling generates important savings in emissions and less primary resource consumption (as indicated by the energy savings in Figure 8a).
Globally, e-waste recycling is critically low, with only 22.4% recycled in 2022 [1], while in Romania’s case, it is at 48.56% (from waste generated), leading to loss of valuable metals and greater reliance on the energy-intensive extraction of virgin materials. Improving recycling systems can play a crucial role in mitigating climate change by lowering GHG emissions and conserving energy through effective material recovery [52].

3.2.2. Economic Impacts

To assess the economic impact of waste management methods, the US EPA WARM model uses the following two economic parameters [31]:
  • Labor income—wages, employee benefits, and business owner income;
  • Fiscal impact—taxes collected by the government from corporate taxation, population income, and other commercial income.
For all forms of treatment for the analyzed WEEE flow, first of all, it is observed that the highest impact in terms of potential salaries paid to workers involved in WEEE EoL management is for the treatment of Flat-Panel Displays in the year 2021 in the Eurostat data scenario (S1), and the lowest impact is for treating CRT Displays in the same year. Secondly, regarding the impact of wages during the 2018–2021 interval, the year 2021 is the one that reaches the highest point. The minimum value registered for labor income is in 2019, in the case of Scenario 1. The first situation can be explained by the fact that Flat-Panel Displays encompass the largest WEEE category by mass from the analyzed stream. The quantitative fluctuations in waste generation throughout the evaluated period and the general evolution of prices and implicitly wages caused by inflation, but also by factors such as the COVID-19 pandemic and conflicts in some areas of the world (e.g., the war in Ukraine), are arguments for the most pronounced total impact of salaries (presented in Table 6) through all forms of treatment in 2021.
The results for each treatment category in terms of end-of-life treatment methods are presented in Table 7. As can be seen, wages related to recycling operations, which are more complex in terms of manipulations and material transformations in other materials, are better paid than those for incineration or landfilling operations.
In USEPA’s WARM, fiscal impact (taxation) is an important factor in analyzing the contributions of various waste management practices—such as recycling, incineration, and landfilling—to national and local budget revenues.
The main components of fiscal impacts are as follows:
  • Corporate taxes—tax revenues generated by companies involved in end-of-life waste management, influenced by the profitability and volume of activities;
  • Income taxes—tax revenues from employee taxes, with higher contributions from recycling due to higher employment rates;
  • Other business taxes—property, sales, and equipment taxes, which support local revenues and public services.
Table 8 presents the total economic impacts of taxation for each WEEE WARM category (USD).
The highest impact in terms of potential collectable taxes is, again, for Flat-Panel Displays in the Eurostat data scenario in the year 2021, and the lowest impact can be noted for CRT Displays in the year 2018 in the same scenario, a situation that is due mainly to the quantities treated. Regarding the evolution of taxes for the evaluated period, the year 2021 is the one for which revenues to the public budget reach the highest point, while the opposite is the case for the year 2019. Quantitative fluctuations in the generation of waste throughout the evaluated period and the general evolution of prices, wages, and incomes caused by inflation, but also by changes in fiscal policies over time, are arguments for the most pronounced total impacts of taxation through all forms of treatment in 2021. The highest economic impact expressed as taxation is associated with recycling as a WEEE treatment option (Table 9).
The values of the economic impacts presented in this study have not been adjusted to reflect the national currency of Romania (RON). The direct conversion of amounts from US dollars (USD) to RON (RON) is not sufficient, as additional economic factors must be taken into account. Among them are the purchasing power parity (PPP), which assesses the cost of living and purchasing power differences between Romania and the United States, and the particularities of Romania’s tax system. In addition, the differences between the tax systems of the two countries must be assessed, especially with regard to the taxation of wages. These variables significantly influence the economic data interpretation, and their absence can lead to incorrect conclusions. Thus, to obtain a relevant comparison, a more detailed analysis including these additional factors will be required, but for comparison purposes, the comparison between years is valid.

3.2.3. Social Impacts

Employment is one of the three core pillars of social sustainability, along with education and health [53]. Job creation is a key indicator in initiatives like the UN Sustainable Development Goals (SDGs), particularly in Goal 8: Promote sustained, inclusive, and sustainable economic growth, full and productive employment, and decent work for all. Employment is a crucial social aspect because it plays a central role in determining the well-being, stability, and development of individuals and societies, and this is why, in this study, the possible job creation resulting from WEEE management is assessed as a social impact, although it also has an economical dimension.
Employment impacts in the US EPA WARM assesses how different waste management options such as recycling, incineration, and landfilling affect employment and income. These impacts are essential to understand the economic and social benefits of sustainable waste management practices [54].
Recycling and composting create more jobs per ton of waste than incineration or landfilling [55] due to the high labor requirements for activities such as sorting, processing, and handling materials. Table 10 presents the social impacts of various options of WEEE management in terms of working hours.
The number of working hours required for all treatment operations—recycling, incineration, and landfilling—for the entire analyzed period of 2018–2021 gives the social impacts of their creation in the context of WEEE management in the category of IT and telecommunications. Recycling is the most “advantageous” method of treatment, not only for the negative impact (savings) of GHG emissions and the reductions in energy consumption, but also for positive economic impacts through wages and budgetary income and the highest potential for creating jobs that generate social benefits such as reducing unemployment, increasing household income, improving quality of life, stimulating the local economy, developing communities, enhancing the social inclusion of disadvantaged categories, and reducing inequalities.
US EPA’s Recycling Economic Information Report underlines recycling as a key component of the American economy, supporting 681,000 jobs nationwide, jobs that generate USD 37.8 billion in annual salaries and contribute USD 5.5 billion in tax revenue [56]. According to the report, for every thousand tons of recyclables collected and recycled, 1.17 jobs are needed, USD 65,230 is paid in wages, and USD 9420 of tax revenue is collectable for public budgets. Zero Waste programs generate more jobs than landfills and incineration, for instance, recycling creates 9 times more jobs than disposal, composting generates from 2 to 4 times more jobs, and reuse creates up to 30 times more jobs [57], with significant economic contributions. Only a fraction of the waste generated in the US ends up being recycled, less than 25%. This situation is in line with the recycling of global e-waste being at only 22.3% [1]. In Romania’s case, if we look at the WEEE generation prognosis (WEEE Calculation Tool) and actual recycling rate reported in the Eurostat database, about 48% of the waste generated was recycled in 2021, meaning that all the benefits from GHG reduction, energy savings, incomes, jobs, and public budget revenues were, in fact, at half of what they could have been if all WEEE was captured by formal management systems.

4. Conclusions

The main purpose of this study was to evaluate the possible outcomes of a WEEE management system for the IT and telecommunications stream, at the Romanian level, in the years 2018–2021, through the three dimensions of sustainability—environmental, economic, and social aspects—from the perspective of EEE POM and product use cycle.
The methodology comprised the following two steps: one to determine the quantities of WEEE generated for the investigated stream and period using the EU’s WEEE Calculation Tool, and the second to evaluate the environmental impacts resulting from GHG emissions and energy use, the economic impacts generated through labor income and collectable taxes, and the social aspects of job creation by a WEEE management system with the support of the US EPA WARM.
The material flow analysis was formulated under two scenarios, with Scenario 1 based on the WEEE generated and Scenario 2 on the apparent consumption computed in the WEEE Calculation Tool valid for Romania. The results showed that over the investigated period, the largest amount of WEEE generated, also considering their usage lifespan, was composed primarily of Flat-Panel Displays, followed by Hard Copy devices, Portable Electronic Devices, Desktop CPUs, Electronic Peripherals, and ultimately with minimum quantities of CRT Displays. Over 2018–2021, within the IT and telecommunication stream of WEEE, there were some categories that exhibited an increase in quantity pattern, e.g., Flat-Panel Displays, Desktop CPUs, and Electronic Peripherals, while others displayed a decrease in quantity pattern, such as Hard Copy Devices, Portable Electronic Devices, and CRT Displays. However, over time, for the six categories of IT and telecommunications WEEE, the quantities increased starting from 2018, with a maximum in 2021 of 25,458 tons (Scenario 1) and 24,152 tons (Scenario 2), respectively.
Material flows had a direct impact on the calculated sustainability profiles of each IT and telecommunications equipment waste category, together with their EoL treatment options.
Recycling showed the most promising benefits in the environmental impact categories for the considered forms of treatment, also being the predominant treatment with negative carbon footprint (there was a notable exception in the case of Desktop CPUs’ combustion). The minimum environmental impact/maximum environmental benefits were registered in the case of Flat-Panel Displays’ EoL treatment options, with a carbon footprint of −9275 MTCO2e (Scenario 1) and −8451 MTCO2e (Scenario 2) and energy savings of −157,151 GJ (Scenario 1) and −143,185 GJ (Scenario 2) in 2021. Economic impact calculated in labor income reached up to USD 51.48 million with taxes of up to USD 11.84 million in Scenario 1 and USD 48.83 million with taxes of up to USD 11.23 million in Scenario 2, respectively. As long as the recycling of Flat-Panel Displays is the prevalent method to treat this type of waste, the savings in environmental impact will be significant. In the case of CRT Displays, the environmental impact was still negative but closer to 0, at −506 MTCO2e and −8466 GJ, having minimum environmental benefits in 2021, with social and economic benefits of USD 2.51 million in labor income, USD 0.58 million in taxes, and 66.66 working hours.
These findings can be used by decision makers to devise better and more informed policies in the area of WEEE management based on both the materials produced and their average use lifetimes, especially for increasing WEEE streams such as Flat-Panel Displays (as found in this study), putting even more emphasis on material recycling. Corporate strategies may incorporate more recyclable parts or products into the production stage and investments could be directed towards the highest environmental and social benefits.
For the environmental dimension of the sustainability analysis, the results may be directed towards the potential to reduce carbon footprint by putting emphasis on the most suitable waste management strategies and the potential to increase energy savings through implemented or soon to be implemented waste management alternatives. If prevention and reuse measures are envisioned, these will lead to a lower environmental impact. Understanding emissions may enhance reuse and recycling options, as well as product life extensions to achieve the circular economy principle.
In terms of economic aspects, the results show how profitable or costly waste management options are, and could serve as a starting point for modeling how changes to the current practices may impact costs in terms of wages and taxes.
For the social impact aspect, job creation related to waste management options was evaluated in this study, which could serve to analyze how modifications to current practices may impact the number of jobs in the waste management field. Understanding labor inputs in the context of reuse and recycling may optimize reverse logistics.
The scientific value of these results is that they provide sustainability profiles in time and for certain situations related to WEEE flows, composition, and end-of-life treatment options, allowing for an easy comparison of results.
These results could be completed by assessing other reliable data sources for WEEE quantities and composition, by using other methodologies to assess the three components of sustainability, since the WARM is based on the LCA approach and is updated with more similar results when newer predictions tools or national predictions for future waste management policies become available.
Future research directions should be directed towards the following:
(a)
The methodological approach, to overcome some of the current limitations of the US EPA WARM methodologies by either using user-specified emission factors to display a certain local specificity related to IT and telecommunication equipment waste and/or by completing the environmental profiles with complete Life Cycle Assessment results;
(b)
The results themselves by considering (i) the time dimension—a longer time series evaluation either for the already registered period or for time predictions based on the average time span of each piece of IT and telecommunication equipment and (ii) the geographical dimension—by obtaining sustainability profiles of various EU Member States, for example, which would enable intercountry comparisons.

Author Contributions

Conceptualization, A.E.T., D.G., and C.T.; methodology, A.E.T. and D.G.; software, A.E.T. and D.G.; validation, A.E.T. and D.G.; formal analysis, A.E.T. and D.G.; investigation, A.E.T. and D.G.; data curation, A.E.T. and D.G.; writing—original draft preparation, A.E.T.; writing—review and editing, D.G. and C.T.; supervision, C.T. All authors have read and agreed to the published version of the manuscript.

Funding

This research received no external funding.

Institutional Review Board Statement

Not relevant to this study.

Informed Consent Statement

Not applicable.

Data Availability Statement

Data mentioned in this study are available from the first author.

Conflicts of Interest

The authors declare no conflicts of interest.

References

  1. Baldé, C.P.; Kuehr, R.; Yamamoto, T.; McDonald, R.; D’Angelo, E.; Althaf, S.; Bel, G.; Deubzer, O.; Fernandez-Cubillo, E.; Forti, V.; et al. The Global E-Waste Monitor 2024; UNITAR: Bonn, Germany, 2024. [Google Scholar]
  2. Gavrilescu, D.; Enache, A.; Ibănescu, D.; Teodosiu, C.; Fiore, S. Sustainability assessment of waste electric and electronic equipment management systems: Development and validation of the SUSTWEEE methodology. J. Clean. Prod. 2021, 306, 127214. [Google Scholar] [CrossRef]
  3. Ghiga, S.C.; Simion, I.M.; Filote, C.; Roșca, M.; Hlihor, R.M.; Gavrilescu, M. Comparative Analysis of Three WEEE Management Scenarios Based on LCA Methodology: Case Study in the Municipality of Iasi, Romania. Processes 2023, 11, 1305. [Google Scholar] [CrossRef]
  4. Butturi, M.A.; Marinelli, S.; Gamberini, R.; Rimini, B. Ecotoxicity of Plastics from Informal Waste Electric and Electronic Treatment and Recycling. Toxics 2020, 8, 99. [Google Scholar] [CrossRef]
  5. Forti, V.; Baldé, C.P.; Kuehr, R.; Bell, G. The Global E-Waste Monitor 2020; UNU, ViE—SCYCLE: Bonn, Germany, 2020. [Google Scholar]
  6. Brazier, J.; Prasetyo, J. Robotic Solution for the Automation of E-waste Recycling. J. Appl. Sci. Adv. Eng. 2023, 1, 11–17. [Google Scholar] [CrossRef]
  7. Shittu, O.S.; Williams, I.D.; Shaw, P.J. Global E-waste management: Can WEEE Make a difference? A Review of e-waste trends, legislation, Contemporary Issues and Future Challenges. Waste Manag. 2021, 120, 549–563. [Google Scholar] [CrossRef]
  8. Di Maria, F.; Micale, C.; Sordi, A.; Cirulli, G.; Marionni, M. Urban mining: Quality and quantity of recyclable and recoverable material mechanically and physically extractable from residual waste. Waste Manag. 2013, 33, 2594–2599. [Google Scholar] [CrossRef] [PubMed]
  9. Omar, O.S. Urban mining of e-waste management globally: Literature review. Clean. Waste Syst. 2024, 9, 100162. [Google Scholar] [CrossRef]
  10. Pacesila, M.; Ciocoiu, C.N.; Colesca, S.E.; Burcea, S.G. Current Trends in WEEE Management in Romania. Theor. Empir. Res. Urban Manag. 2016, 11, 46–59. [Google Scholar]
  11. Ardi, R.; Leisten, R. Assessing the role of informal sector in WEEE management systems: A System Dynamics approach. Waste Manag. 2016, 57, 3–16. [Google Scholar] [CrossRef]
  12. Kuehr, R. E-waste seen from a global perspective. In Waste Electrical and Electronic Equipment (WEEE) Handbook; Elsevier: Amsterdam, The Netherlands, 2019; pp. 1–16. [Google Scholar]
  13. European Union. WEEE Directive 2012/19/EU. 2012. Available online: http://eur-lex.europa.eu/legal-content/EN/TXT/?uri=CELEX:32012L0019 (accessed on 1 March 2025).
  14. Clarke, C.; Williams, I.D.; Turner, D.A. Evaluating the carbon footprint of WEEE management in the UK. Resour. Conserv. Recycl. 2019, 141, 465–473. [Google Scholar] [CrossRef]
  15. Maia, M.L.; Sousa, S.; Correia-Sá, M.L.; Delerue-Matos, C.; Calhau, C.; Domingues, V.F. Organochlorine pesticides, brominated flame retardants, synthetic musks and polycyclic aromatic hydrocarbons in shrimps. An overview of occurrence and its implication on human exposure. Heliyon 2020, 6, e04870. [Google Scholar] [CrossRef] [PubMed]
  16. Bacian, I.; Briefing Implementation Appraisal on Revision of the Ecodesign Directive. European Parliamentary Research Service, Ex-Post Evaluation Unit PE 699.502. April 2022. Available online: www.europarl.europa.eu/RegData/etudes/BRIE/2022/699502/EPRS_BRI(2022)699502_EN.pdf (accessed on 1 March 2025).
  17. European Union. Circular Economy Action Plan. 2020. Available online: https://eur-lex.europa.eu/legal-content/EN/TXT/?qid=1583933814386&uri=COM:2020:98:FIN (accessed on 1 March 2025).
  18. Vakilchap, F.; Mousavi, S.M. Structural study and metal speciation assessments of waste PCBs and environmental implications: Outlooks for choosing efficient recycling routes. Waste Manag. 2022, 151, 181–194. [Google Scholar] [CrossRef] [PubMed]
  19. Mir, S.; Dhawan, N. A comprehensive review on the recycling of discarded printed circuit boards for resource recovery. Resources. Conserv. Recycl. 2022, 178, 106027. [Google Scholar] [CrossRef]
  20. Jadhav, U.; Hocheng, H. Hydrometallurgical Recovery of Metals from Large Printed Circuit Board Pieces. Sci. Rep. 2015, 5, 14574. [Google Scholar] [CrossRef] [PubMed]
  21. Elia, V.; Gnoni, M. How to design and manage WEEE systems: A multi-level analysis. Int. J. Environ. Waste Manag. 2015, 15, 271. [Google Scholar] [CrossRef]
  22. Azizi, D.D.S.; Hanafiah, M.M.; Woon, K.S. Material Flow Analysis in WEEE Management for Circular Economy: A Content Review on Applications, Limitations, and Future Outlook. Sustainability 2023, 15, 3505. [Google Scholar] [CrossRef]
  23. Achillas, C.; Vlachokostas, C.; Moussiopoulos, N.; Perkoulidis, G.; Banias, G.; Mastropavlos, M. Electronic waste management cost: A scenario-based analysis for Greece. Waste Manag. Res. J. A Sustain. Circ. Econ. 2011, 29, 963–972. [Google Scholar] [CrossRef]
  24. Elia, V.; Gnoni, M.G.; Tornese, F. Designing a sustainable dynamic collection service for WEEE: An economic and environmental analysis through simulation. Waste Manag. Res. 2019, 37, 402–411. [Google Scholar] [CrossRef] [PubMed]
  25. Islam, M.T.; Huda, N. Reverse logistics and closed-loop supply chain of Waste Electrical and Electronic Equipment (WEEE)/E-waste: A comprehensive literature review. Resour. Conserv. Recycl. 2018, 137, 48–75. [Google Scholar] [CrossRef]
  26. Ghisellini, P.; Passaro, R.; Ulgiati, S. Environmental and Social Life Cycle Assessment of Waste Electrical and Electronic Equipment Management in Italy According to EU Directives. Environments 2023, 10, 106. [Google Scholar] [CrossRef]
  27. Zacho, K.O.; Bundgaard, A.M.; Mosgaard, M.A. Constraints and opportunities for integrating preparation for reuse in the Danish WEEE management system. Resour. Conserv. Recycl. 2018, 138, 13–23. [Google Scholar] [CrossRef]
  28. Boldoczki, S.; Thorenz, A.; Tuma, A. The environmental impacts of preparation for reuse: A case study of WEEE reuse in Germany. J. Clean. Prod. 2019, 252, 119736. [Google Scholar] [CrossRef]
  29. Salhofer, S.; Steuer, B.; Ramusch, R.; Beigl, P. WEEE management in Europe and China e a comparison. Waste Manag. 2016, 57, 27–35. [Google Scholar] [CrossRef] [PubMed]
  30. Ibanescu, D.; Cailean, D.; Teodosiu, C.; Fiore, S. Assessment of the waste electrical and electronic equipment management systems profile and sustainability in developed and developing European Union countries. Waste Manag. 2018, 73, 39–53. [Google Scholar] [CrossRef]
  31. U.S. Environmental Protection Agency. Waste Reduction Model (WARM) Version 16: User’s Guide. 2024. Available online: https://www.epa.gov/warm (accessed on 3 March 2025).
  32. European Commission. Manual for the Use of the WEEE Calculation Tool. 2024. Available online: https://ec.europa.eu/environment/pdf/waste/weee/WEEE%20calculation%20tools/WEEE_calculation_tool__manual.pdf (accessed on 1 February 2025).
  33. Petcu, C.; Ifrim, A.; Silvestru, C.; Silvestru, R. Evolution of waste electric and electronic equipment in the EU. Electroteh. Electron. Autom. 2020, 68, 94–100. [Google Scholar] [CrossRef]
  34. Mmereki, D.; Baldwin, A.; Li, B. A comparative analysis of solid waste management in developed, developing and lesser developed countries. Environ. Technol. Rev. 2016, 5, 120–141. [Google Scholar] [CrossRef]
  35. Maalouf, A.; El-Fadel, M. Aggregated and disaggregated data about default emission factors in emissions accounting methods from the waste sector. Data Brief 2018, 21, 568–575. [Google Scholar] [CrossRef] [PubMed]
  36. Mohareb, E.A.; MacLean, H.L.; Kennedy, C.A. Greenhouse gas emissions from waste management—Assessment of quantification methods. J. Air Waste Manag. Assoc. 2011, 61, 480–493. [Google Scholar] [CrossRef]
  37. Herat, S.; Agamuthu, P. E-waste: A problem or an opportunity? Review of issues, challenges and solutions in Asian countries. Waste Manag. Res. 2012, 30, 1113–1129. [Google Scholar] [CrossRef]
  38. Available online: https://www.epa.gov/system/files/documents/2023-12/warm_data_quality_assessment_report_dec_2023.pdf (accessed on 12 April 2025).
  39. Zubiani, E.; Giani, M.; Recanati, F.; Dotelli, G.; Puricelli, S.; Cristiani, C. Environmental impacts of a hydrometallurgical process for electronic waste treatment: A life cycle assessment case study. J. Clean. Prod. 2017, 140, 1204–1216. [Google Scholar] [CrossRef]
  40. Cucchiella, F.; D’Adamo, I.; Koh, S.; Rosa, P. Recycling of weees: An economic assessment of present and future e-waste streams. Renew. Sustain. Energy Rev. 2015, 51, 263–272. [Google Scholar] [CrossRef]
  41. Rocchetti, L.; Vegliò, F.; Kopacek, B.; Beolchini, F. Environmental impact assessment of hydrometallurgical processes for metal recovery from weee residues using a portable prototype plant. Environ. Sci. Technol. 2013, 47, 1581–1588. [Google Scholar] [CrossRef]
  42. Choi, W.H.; Pae, K.P.; Kim, N.S.; Kang, H.Y.; Hwang, Y.W. Feasibility study of closed-loop recycling for plastic generated from waste electrical and electronic equipment (weee) in south korea. Energies 2023, 16, 6358. [Google Scholar] [CrossRef]
  43. Wäger, P.; Hischier, R. Life cycle assessment of post-consumer plastics production from waste electrical and electronic equipment (weee) treatment residues in a central european plastics recycling plant. Sci. Total Environ. 2015, 529, 158–167. [Google Scholar] [CrossRef] [PubMed]
  44. D’Adamo, I.; Rosa, P.; Terzi, S. Challenges in waste electrical and electronic equipment management: A profitability assessment in three european countries. Sustainability 2016, 8, 633. [Google Scholar] [CrossRef]
  45. EC. Implementation of the WEEE Directive. Information About the Implementation of the WEEE Directive, Including Data and Reporting and WEEE Calculation Tools. Available online: https://environment.ec.europa.eu/topics/waste-and-recycling/waste-electrical-and-electronic-equipment-weee/implementation-weee-directive_en (accessed on 15 February 2025).
  46. UNITAR. WEEE Calculation Tool Manual; UNITAR: Bonn, Germany, 2024. [Google Scholar]
  47. Baldé, C.P.; Kuehr, R.; Blumenthal, K.; Fondeur, G.S.; Kern, M.Ș.; Micheli, P.; Magpantay, E.; Huisman, J. E-Waste Statistics Guidelines on Classifications Reporting and Indicators; UNU, IAS—SCYCLE: Bonn, Germany, 2015. [Google Scholar]
  48. EC. Waste from Electrical and Electronic Equipment (WEEE). 2024. Available online: https://environment.ec.europa.eu/topics/waste-and-recycling/waste-electrical-and-electronic-equipment-weee (accessed on 15 March 2025).
  49. Eurostat. Available online: https://ec.europa.eu/eurostat/statistics-explained/index.php?title=Waste_statistics_-_electrical_and_electronic_equipment (accessed on 5 January 2025).
  50. Fawole, A.A.; Orikpete, O.F.; Ehiobu, N.N.; Ewim, D.R.E. Climate change implications of electronic waste: Strategies for sustainable management. Bull. Natl. Res. Cent. 2023, 47, 147. [Google Scholar] [CrossRef]
  51. Maes, T.; Preston-Whyte, F. E-waste it wisely: Lessons from Africa. SN Appl. Sci. 2022, 4, 72. [Google Scholar] [CrossRef]
  52. Rautela, R.; Arya, S.K.; Vishwakarma, S.; Kim, K.H.; Kumar, S. E-waste management and its effects on the environment and human health. Sci. Total Environ. 2021, 773, 145623. [Google Scholar] [CrossRef]
  53. United Nations. Transforming Our World: The 2030 Agenda for Sustainable Development; United Nations: New York, NY, USA, 2015. [Google Scholar]
  54. Environmental Protection Agency (EPA). Advancing Sustainable Materials Management: Facts and Figures; United States Environmental Protection Agency: Washington, DC, USA, 2016. [Google Scholar]
  55. United States Environmental Protection Agency. Recycling Economic Information (REI) Report. 2020. Available online: https://www.epa.gov/smm/recycling-economic-information-rei-report (accessed on 15 March 2025).
  56. Available online: https://ecocycle.org (accessed on 15 March 2025).
  57. Available online: https://usafacts.org/ (accessed on 15 March 2025).
Figure 1. Methodology for determining the environmental, economic, and social impacts with USEPA WARM.
Sustainability 17 04105 g001
Figure 2. GHG emissions from Desktop CPU EoL management, (a) recycling, (b) combustion, (c) landfilling, and (d) total, MTCO2e/year.
Sustainability 17 04105 g002
Figure 3. GHG emissions from EoL management of Portable Electronic Devices, (a) recycling, (b) combustion, (c) landfilling, and (d) total, MTCO2e/year.
Sustainability 17 04105 g003
Figure 4. GHG emissions from EoL management of Flat-Panel Displays, (a) recycling, (b) combustion, (c) landfilling, and (d) total, MTCO2e/year.
Sustainability 17 04105 g004
Figure 5. GHG emissions from EoL Management of CRT Displays, (a) recycling, (b) combustion, (c) landfilling and (d) total, MTCO2e/year.
Sustainability 17 04105 g005
Figure 6. GHG emissions from EoL management of Electronic Peripherals, (a) recycling, (b) combustion, (c) landfilling and (d) total, MTCO2e/year.
Sustainability 17 04105 g006
Figure 7. GHG emissions from EoL management of Hard Copy Devices, (a) recycling, (b) combustion, (c) landfilling and (d) total, MTCO2e/year.
Sustainability 17 04105 g007
Figure 8. Energy impact indicator calculated for the WEEE categories for each end-of-life treatment options, (a) recycling, (b) incineration, and (c) landfilling.
Sustainability 17 04105 g008
Table 1. Emission factors by treatment type for each WEEE category (MTCO2e). Source: https://www.epa.gov/warm (accessed on 3 March 2025).
MaterialRecyclingIncinerationLandfilling
Desktop CPU−1.49−0.660.02
Portable Electronic Device−1.060.650.02
Flat-Panel Displays−0.990.030.02
CRT Displays−0.570.450.02
Electronic Peripherals−0.362.080.02
Hard Copy Devices−0.561.200.02
Table 2. Environmental and health impacts generated by WEEE management operations.
WARM
Category
Treatment MethodEnvironmental ImpactHealth ImpactReferences
Desktop CPUsRecyclingRecovery of metals can reduce resource depletion; however, informal recycling can lead to toxic exposure.Potential exposure to heavy metals (lead and cadmium) during improper recycling.[36,39]
IncinerationCan release harmful emissions (dioxins and furans) and heavy metals into the atmosphere.Respiratory diseases from emission of toxic pollutants and long-term effects from exposure to dioxins.[33,40]
LandfillingRisk of leachate contaminating groundwater with heavy metals and other hazardous substances.Nearby communities may face health risks from contaminated water sources.[41,42]
Portable Electronic DevicesRecyclingReduction in e-waste stream; however, facilities lacking standards may leak harmful materials.Risks to recycling workers from exposure to toxic substances such as mercury and lead.[36,39];
IncinerationReleases greenhouse gases and contaminants, including harmful organics, into the air.Increased rates of cancer and respiratory ailments in surrounding populations due to toxic emissions.[33,43]
LandfillingSimilar risks of leachate pollution and inefficient space utilization leading to future disposal challenges.Contaminated land and water can lead to chronic health issues for nearby residents.[41,42]
Flat-Panel DisplaysRecyclingEffective recovery of materials but improper handling can lead to the release of cadmium and other toxins.Potential health impacts from exposure to toxic heavy metals during dismantling.[33,43]
IncinerationIncineration may create toxic ash and emit harmful gases into the atmosphere.Adverse health effects from inhalation of toxic gases and particles released during incineration.[43,44]
LandfillingHeavy metals in landfill can leach into groundwater over time, posing risks to ecosystems.Long-term exposure risks related to contaminated drinking water or soil.[41,42]
CRT DisplaysRecyclingCRTs contain lead glass; effective recycling can minimize lead release but may still pose risks if mishandled.Significant exposure to lead, which poses severe neurological risks, especially in children.[36,39]
IncinerationHigh probability of releasing arsenic and lead oxides into the environment.Increased incidence of respiratory and developmental health issues from toxic emissions.[33,44]
LandfillingLead leaching into soil and water and potential for hazardous material exposure increases.Risks of heavy metal toxicity among populations near landfills.[40,41]
Electronic PeripheralsRecyclingResource recovery but potentially high emissions of hazardous materials if improperly managed.Exposure to brominated flame retardants and heavy metals during recycling.[39,43]
IncinerationCan produce harmful by-products and ash and risk of dioxin formation from plastics.Dioxin exposure linked to immune, developmental, and reproductive issues.[40,44]
LandfillingInert materials may contribute less to pollution, but hazardous components still pose risks.Potential public health concerns from historical pollution of local water sources.[40,41]
Hard Copy DevicesRecyclingMay help reduce paper waste; however, toner cartridges can release hazardous chemicals into the environment.Health impacts can arise from inhaling or touching toxic substances from toner materials.[36,43]
IncinerationIncinerating plastics can release toxic fumes and may also create ash needing proper disposal.Emissions can lead to acute health effects for nearby populations and chronic issues from pollution.[33,44]
LandfillingLandfill conditions might allow for leaching of toxic substances into surrounding areas.Risks associated with contaminated land and potential impacts on public health.[41,42]
Table 3. IT and telecommunication equipment UNU KEYs of corresponding WARM categories and average lifetime.
UNU-KEY CodeEEE TypeAverage Lifetime (Years)WARM Category
0301Small IT Equipment6.15Electronic Peripherals
0302Desktop PCs10.33Desktop CPU
0303Laptops (incl. tablets)8.76Portable Electronic Devices
0304Printers9.31Hard Copy Device
0305Telecommunication Equipment7.70Portable Electronic Devices
0306Mobile Phones5.62
0308Cathode-Ray Tube Monitors15.94CRT Displays
0309Flat-Display Panel Monitors10.79Flat-Panel Displays
0407Cathode-Ray Tube TVs10.71CRT Displays
0408Flat-Display Panel TVs10.95Flat-Panel Displays
Table 4. WEEE generated for the two scenarios, S1 and S2, 2018–2021, tons/year.
UNU KEY CodesWARM
Category
2018201920202021
S1S2S1S2S1S2S1S2
302Desktop CPU25242527253125302551261625752692
0303 + 0305 + 0306Portable Electronic Devices31653134328531043410307935262963
0309 + 0408Flat-Panel Displays787685699247934110,58410,07811,83310,781
0308 + 0407CRT Displays15021502141114111325132512441244
301Electronic Peripherals19451936196821602005231120452386
304Hard Copy Device42474198423341104224410942354086
Total21,25921,86622,67522,65624,09923,51825,45824,152
Table 5. Total energy impacts—recycling, combustion, and landfilling (GJ/year), 2018–2021.
WARM Category2018201920202021
S1S2S1S2S1S2S1S2
Desktop CPUs−48,295−48,347−48,217−48,195−45,801−46,964−48,300−50,481
Portable Electronic Devices−58,445−57,855−59,725−56,447−57,901−52,280−62,352−52,399
Flat-Panel Displays−106,861−116,269−124,820−126,092−134,548−128,115−157,151−143,185
CRT Displays−10,581−10,581−9827−9827−8635−8635−8466−8466
Electronic Peripherals−13,541−13,477−13,530−14,847−12,881−14,844−13,707−15,994
Hard Copy Device−30,993−30,636−31,024−30,198−29,489−28,689−31,015−29,890
Total−268,715−277,164−287,143−285,605−289,255−279,528−320,991−300,415
Table 6. Total economic impact of WEEE WARM categories expressed as labor income (USD), 2018–2021.
WARM
Category
2018201920202021
S1S2S1S2S1S2S1S2
Desktop CPUs5,362,4285,368,1864,749,1115,277,9014,965,4325,091,5475,207,8265,442,924
Portable Electronic Devices6,725,1006,657,1586,161,848 6,475,2076,637,4965,993,1217,129,5075,991,443
Flat-Panel
Displays
16,732,43318,205,52717,347,77719,485,07120,601,16819,616,31823,928,21521,801,779
CRT
Displays
3,191,3553,191,3552,646,3182,942,3652,578,1122,578,1122,515,1662,515,166
Electronic
Peripherals
4,132,918 4,113,534 3,692,932 4,505,571 3,902,693 4,497,421 4,134,548 4,824,380
Hard Copy Devices9,021,769 8,917,807 7,922,398 8,574,099 8,221,142 7,998,144 8,564,909 8,254,294
Total45,166,002 46,453,567 42,520,385 47,260,214 46,906,042 45,774,662 51,480,171 48,829,986
Table 7. Economic impact expressed as labor income (USD), 2018–2021, per each treatment category.
RecyclingIncinerationLandfillingTotal
YearS1S2S1S2S1S2S1S2
201845,010,80046,293,93942,86044,082112,343115,54545,166,00246,453,567
201942,339,85447,079,74865,93665,912114,595114,55442,520,38547,260,214
202046,656,18145,530,82883,87981,856165,982161,97946,906,04245,774,662
202151,249,49248,611,18398,63493,557132,044125,24751,480,17148,829,986
Table 8. Total economic impact expressed as taxation for each WEEE WARM categories (USD), 2018–2021.
WARM
Category
2018201920202021
S1S2S1S2S1S2S1S2
Desktop CPUs1,232,2731,233,5961,030,4151,213,1351,142,3751,171,3891,197,5171,251,577
Portable Electronic Devices1,545,4111,529,7981,336,9361,488,3371,527,0591,378,8111,639,3991,377,706
Flat-Panel
Displays
3,845,0714,183,5853,763,9474,478,6774,739,6194,513,0395,502,1885,013,223
CRT Displays733,365733,365574,172676,308593,135593,135578,351578,351
Electronic
Peripherals
949,734945,280801,2561,035,613897,8751,034,702950,7211,109,345
Hard Copy
Devices
2,073,1802,049,2901,718,9231,970,7711,891,4021,840,0971,969,4631,898,039
Total10,379,03410,674,9149,225,64810,862,84110,791,46410,531,17311,837,64011,228,241
Table 9. Total economic impact expressed as taxation for each WEEE each treatment category (USD), 2018–2021.
RecyclingIncinerationLandfillingTotal
YearS1S2S1S2S1S2S1S2
201810,321,44010,615,67715,90516,35841,68942,87810,379,03410,674,914
20199,158,65510,795,87124,46824,45942,52542,5109,225,64810,862,841
202010,698,74310,440,68831,12730,37661,59560,10910,791,46410,531,173
202111,752,03711,147,04536,60234,71849,00146,47811,837,64011,228,241
Table 10. Social impact of EoL WEEE treatment options, 2018–2021 (working hours).
WARM
Category
2018201920202021
S1S2S1S2S1S2S1S2
Desktop CPUs142,260142,413 128,533 139,964131,479134,818138,014144,244
Portable Electronic Devices178,411176,609166,769171,716175,753158,691188,941158,781
Flat-Panel
Displays
443,897482,977469,514516,724545,494519,417634,130577,776
CRT Displays84,66484,66471,62271,62268,26568,26566,65566,655
Electronic
Peripherals
109,643109,12899,948119,483103,339119,086109,571127,852
Hard Copy
Devices
239,340236,582214,418227,376217,686211,781226,981218,750
Total1,198,2151,232,3731,150,8051,253,2921,242,0161,212,0591,364,2931,292,060
Disclaimer/Publisher’s Note: The statements, opinions and data contained in all publications are solely those of the individual author(s) and contributor(s) and not of MDPI and/or the editor(s). MDPI and/or the editor(s) disclaim responsibility for any injury to people or property resulting from any ideas, methods, instructions or products referred to in the content.

