
Seasonal Hydropower Storage Dams: Are They Cost-Effective in Providing Reliability for Solar PV?


Abstract
1. Introduction
2. Analytical Framework for the Financial and Economic Analysis of Integration of Solar PV with Hydropower Storage Dams
2.1. Financial Levelized Cost
2.1.1. Hydropower Plant
2.1.2. Solar PV Plant
2.1.3. Integrated System of Solar–Hydropower and Solar–Hydropower–Thermal
2.2. Economic Levelized Cost
3. Case Analysis
3.1. Financial Analysis Results
3.2. Economic Cost
Economic Analysis Results
3.3. Assessing the Impact of the Financial and Economic Cost of Project Finanacing
4. Conclusions and Discussion
Author Contributions
Funding
Institutional Review Board Statement
Informed Consent Statement
Data Availability Statement
Acknowledgments
Conflicts of Interest
Appendix A

| Row No. | Type | Estimated Cost |
|---|---|---|
| Dam costs | ||
| 1 | Dam civil works | 122.45 |
| 2 | Hydro-mechanical equipment | 11.30 |
| 3 | Engineering and supervision | 10.70 |
| 4 | Owner’s costs | 2.70 |
| 5 | Resettlement and land acquisition | 22.50 |
| 6 | Emergency preparedness plan | 0.20 |
| 7 | Environmental management plan | 6.25 |
| 8 | Total capital cost of dam | 176.10 |
| Hydropower plant costs | ||
| 9 | Hydropower plant civil works | 8.60 |
| 10 | Hydropower plant equipment | 40.80 |
| 11 | Engineer and supervisor | 4.00 |
| 12 | Owner’s costs | 1.00 |
| 13 | Total capital cost of hydropower plant | 54.40 |
| 14 | Total capital cost of dam and hydropower plant | 230.50 |
| 15. | Annual operation and maintenance costs—dam and hydropower plant | 2.40 |
| Technical specifications | ||
| 16 | Construction period | 4 years |
| Length of life of dam | 100 years | |
| Length of life of hydropower plant | 30 years | |
| 17 | Operational period | 5–34 years |
| 18 | Liquidation period | Year 35 |
| 19 | Initial installed capacity | 70 MW |
| 20 | Added capacity if integrated with solar for reliability | 25 MW |
| 21 | Expected annual generation in year 5 | 206,403.12 MWh |
| 22 | Capacity factor | 34% |
| Row No. | Type | Estimated Cost |
|---|---|---|
| 1 | Land | 0.35 |
| 2 | Modules | 16.28 |
| 3 | Inverters | 3.38 |
| 4 | Balance of system electrical (interconnection) | 9.11 |
| 5 | Balance of system structural | 6.78 |
| 6 | Civil works | 2.66 |
| 7 | Labor | 8.41 |
| 8 | Soft costs | 0.81 |
| 9 | Other, contingency and margin | 7.85 |
| 10 | Total investment cost (no hydropower plant augmentation) | 55.60 |
| 11 | Cost of additional 24.6 MW of hydropower plant | 20.00 |
| 12 | Total investment cost (hydropower plant augmentation) | 75.60 |
| 13 | Annual total operating cost—solar PV | 0.97 |
| Technical specifications | ||
| 14 | Construction period | 1 year |
| 15 | Operational period | Years 5–34 |
| 16 | Liquidation period | Year 35 |
| 17 | Installed capacity | 50 MW |
| 18 | Total number of modules | 172,753 |
| 19 | Expected annual generation in year 5 | 75,423.60 MWh |
| 20 | Capacity factor | 17.22% |
| 21 | Annual generation degradation | 0.60% |
| Row No. | Type | Estimated Cost |
|---|---|---|
| 1 | Total investment cost of 25 MW thermal plant, 0.7 million USD/MW | USD 17.50 |
| 2 | Annual fixed cost | USD 15,000.00/MW |
| 3 | Variable cost | USD 4.25/MWh |
| 4 | Real cost of HFO inclusive of taxes (average 2010–2020) | USD 571.00/ton |
| Technical specifications | ||
| 5 | Construction period | 1 year |
| 6 | Operational period | Years 5–34 |
| 7 | Liquidation period | Year 35 |
| 8 | Installed capacity | 25 MW |
| 9 | Capacity factor | 10% |
| 10 | Energy content of HFO | 11.11 MWh/ton |
| 11 | Plant efficiency | 43% |
| Item | Conversion Factor |
|---|---|
| Hydropower plant | |
| Capital cost | |
| Residual value | 0.9166 |
| Dam civil works | 0.9166 |
| Dam and hydro-mechanical equipment | 0.9030 |
| Dam engineering and supervision | 1.0660 |
| Dam owner’s costs | 1.0660 |
| Resettlement and land acquisition | 1.0000 |
| Dam emergency preparedness plan | 1.0660 |
| Environmental management plan | 1.0660 |
| Hydropower plant civil works | 0.9166 |
| Hydropower plant equipment | 0.8273 |
| Hydropower plant engineering and supervision | 1.0660 |
| Hydropower plant owner’s costs | 1.0660 |
| Operation and maintenance cost | |
| Annual operation and maintenance cost—dam and hydropower plant | 0.8651 |
| Solar plant | |
| Capital cost | |
| Extra generation cost | 0.8289 |
| Land | 1.0000 |
| Modules | 0.8690 |
| Inverters | 0.8690 |
| Balance of system structural | 0.9166 |
| Balance of system electrical (interconnection) | 0.8690 |
| Civil works | 0.9166 |
| Labor | 0.9200 |
| Soft costs | 0.8941 |
| Other, contingency and margin | 0.8941 |
| Operation and maintenance cost | |
| Spare parts/maintenance CAPEX | 0.8690 |
| Cleaning/washing | 0.8400 |
| Annual plant inspection | 0.8923 |
| Administration | 0.8923 |
| Security | 0.8941 |
| Vegetation management | 0.8941 |
| Inverter maintenance/replacement | 0.8690 |
| Other operations and maintenance | |
| Employees | 0.9200 |
| Environmental/social costs | 0.8941 |
| Insurance | 1.0660 |
| Thermal plantCapital cost | 0.8289 |
| Operation and maintenance cost | |
| Fixed O&M | 0.9200 |
| Variable O&M | 0.9200 |
| Heavy fuel oil | 0.8420 |
References
- Lacerda, J.S.; Van Den Bergh, J.C.J.M. Mismatch of wind power capacity and generation: Causing factors, GHG emissions and potential policy responses. J. Clean. Prod. 2016, 128, 178–189. [Google Scholar] [CrossRef]
- Brown, T.W.; Bischof-Niemz, T.; Blok, K.; Breyer, C.; Lund, H.; Mathiesen, B.V. Response to ‘burden of proof: A comprehensive review of the feasibility of 100% renewable-electricity systems’. Renew. Sustain. Energy Rev. 2018, 92, 834–847. [Google Scholar] [CrossRef]
- Van Kooten, G.C. FELLOWS ADDRESS California dreaming: The economics of renewable energy. Can. J. Agric. Econ. 2017, 65, 19–41. [Google Scholar] [CrossRef]
- Harby, A.; Schäffer, L.E.; Arnesen, F.; Bauhofer, P.; Beckitt, A.; Bockenhauer, S.; Botterud, A.; Christensen, T.S.; Middleton, L.; Nielsen, N.; et al. “Flexible Hydropower Providing Value to Renewable Energy Integration.” White Paper. IEA Hydropower, Annex IX. 2019. Available online: https://www.ieahydro.org/media/51145259/IEAHydroTCP_AnnexIX_White%20Paper_Oct2019.pdf (accessed on 24 April 2025).
- Bélanger, C.; Gagnon, L. Adding wind energy to hydropower. Energy Policy 2002, 30, 1279–1284. [Google Scholar] [CrossRef]
- Korpaas, M.; Holen, A.T.; Hildrum, R. Operation and sizing of energy storage for wind power plants in a market system. Int. J. Electr. Power Energy Syst. 2003, 25, 599–606. [Google Scholar] [CrossRef]
- Bermúdez, J.M.; Ruisánchez, E.; Arenillas, A.; Moreno, A.H.; Menéndez, J.A. New concept for energy storage: Microwave-induced carbon gasification with CO2. Energy Convers. Manag. 2014, 78, 559–564. [Google Scholar] [CrossRef]
- Spyrou, I.D.; Anagnostopoulos, J.S. Design study of a stand-alone desalination system powered by renewable energy sources and a pumped storage unit. Desalination 2010, 257, 137–149. [Google Scholar] [CrossRef]
- Saini, P.; Gidwani, L. Study on energy storage system applications, allocation, and challenges. In Proceedings of the 2020 IEEE International Conference on Power Electronics, Drives and Energy Systems (PEDES), Jaipur, India, 16 December 2020; pp. 1–7. [Google Scholar] [CrossRef]
- Das, P.; Das, B.K.; Mustafi, N.N.; Sakir, M.T. A review on pump-hydro storage for renewable and hybrid energy systems applications. Energy Storage 2021, 3, e223. [Google Scholar] [CrossRef]
- Bahramian, P. Integration of Wind Power into an Electricity System Using Pumped Storage: Economic Challenges and Stakeholder Impacts (No. 1480). Queen’s Economics Department Working Paper. 2022. Available online: https://www.econ.queensu.ca/research/working-papers/1480 (accessed on 25 April 2025).
- Gustavsson, J. Energy Storage Technology Comparison: A Knowledge Guide to Simplify Selection of Energy Storage Technology. 2016. Available online: https://www.diva-portal.org/smash/get/diva2:953046/FULLTEXT01.pdf (accessed on 24 April 2025).
- Canales, F.A.; Beluco, A.; Mendes, C.A.B. A comparative study of a wind hydro hybrid system with water storage capacity: Conventional reservoir or pumped storage plant? J. Energy Storage 2015, 4, 96–105. [Google Scholar] [CrossRef]
- Hunt, J.D.; Byers, E.; Riahi, K.; Langan, S. Comparison between seasonal pumped-storage and conventional reservoir dams from the water, energy, and land nexus perspective. Energy Convers. Manag. 2018, 166, 385–401. [Google Scholar] [CrossRef]
- Yüksel, I. Hydropower for sustainable water and energy development. Renew. Sustain. Energy Rev. 2010, 14, 462–469. [Google Scholar] [CrossRef]
- Hafner, M.; Giacomo, L. (Eds.) The Palgrave Handbook of International Energy Economics; Springer International Publishing: Cham, Switzerland, 2022. [Google Scholar] [CrossRef]
- Nuclear Energy Agency; International Energy Agency; Organization for Economic Co-operation and Development. Projected Costs of Generating Electricity, 2015 ed.; OECD Publishing: Paris, Grance, 2015; ISBN 9789264244436. Available online: https://iea.blob.core.windows.net/assets/c9bae6ac-0f4c-4a4b-8b46-f7d4cca4d53b/ElecCost2015.pdf (accessed on 24 April 2025).
- Volta River Authority. Pwalugu Multipurpose Dam Project, Feasibility Study, Volume A—Main Report, Report N°PW05-C Vol. A.; TRACTEBEL Engineering: Brussels, Belgium, 2016; Available online: https://cri-world.com/vra/vra1/ (accessed on 24 April 2025).
- Awojobi, O.; Jenkins, G.P. Were the hydro dams financed by the World Bank from 1976 to 2005 worthwhile? Energy Policy 2015, 86, 222–232. [Google Scholar] [CrossRef]
- Volta River Authority. Pwalugu Multipurpose Dam Project, 50 MW Solar Hybrid Project, Environmental Impact Assessment Report. November 2020. Available online: https://cri-world.com/vra/vra2/ (accessed on 24 April 2025).
- Bilicic, G.; Scroggins, S. Lazard’s Levelized Cost of Energy Analysis-Version 16.0.Lazard, April 2023. Available online: https://www.lazard.com/media/typdgxmm/lazards-lcoeplus-april-2023.pdf (accessed on 24 April 2025).
- The Ghanaian National Parameters and CSCFs Database. Available online: https://ghana.cri-world.com/ (accessed on 24 April 2025).
- African Energy Chamber. Africa Energy Outlook 2021; African Energy Chamber: Johannesburgm, South Africa, 2020; Available online: https://www.whyafrica.co.za/wp-content/uploads/2020/11/AEC-Outlook-2021.pdf (accessed on 24 April 2025).
- Eberhard, A.; Foster, V.; Briceño-Garmendia, C.; Ouedraogo, F.; Camos, D.; Shkaratan, M. “Underpowered: The State of the Power Sector in Sub-Saharan Africa”, Africa Infrastructure Country Diagnostic, World Bank, Background Paper 6. 2008. Available online: https://openknowledge.worldbank.org/server/api/core/bitstreams/104f8cd2-b127-551d-8724-46de4a913ccb/content (accessed on 24 April 2025).
- Kuo, C.; Jenkins, G.P.; Benjamin Mphahlele, M. The economic opportunity cost of capital in South Africa. S. Afr. J. Econ. 2003, 71, 523–543. [Google Scholar] [CrossRef]
- Jenkins, G.; Kuo, C.Y.; Harberger, A.C. The Economic Opportunity Cost of Capital, Chapter 8. In Cost Benefit Analysis for Investment Decisions, 1st ed.; Kindle Direct Publishing: Seattle, WA, USA, 2019; Available online: https://www.amazon.com/Books-Arnold-C-Harberger/s?rh=n%3A283155%2Cp_27%3AArnold%2BC.%2BHarberger (accessed on 25 April 2025).
- Li, Z.; Chen, H.; Mo, B. Can digital finance promote urban innovation? evidence from China. Borsa Istanb. Rev. 2023, 23, 285–296. [Google Scholar] [CrossRef]


| Row No. | Components of Financial Appraisal | Net Present Value of Energy Generation (MWh) | Net Present Value of Energy Cost (USD) | Levelized Cost @8% (USD/MWh) | Levelized Cost @8% of Incremental Energy (USD/MWh) |
|---|---|---|---|---|---|
| 1 | 2 | 3 | 4 | ||
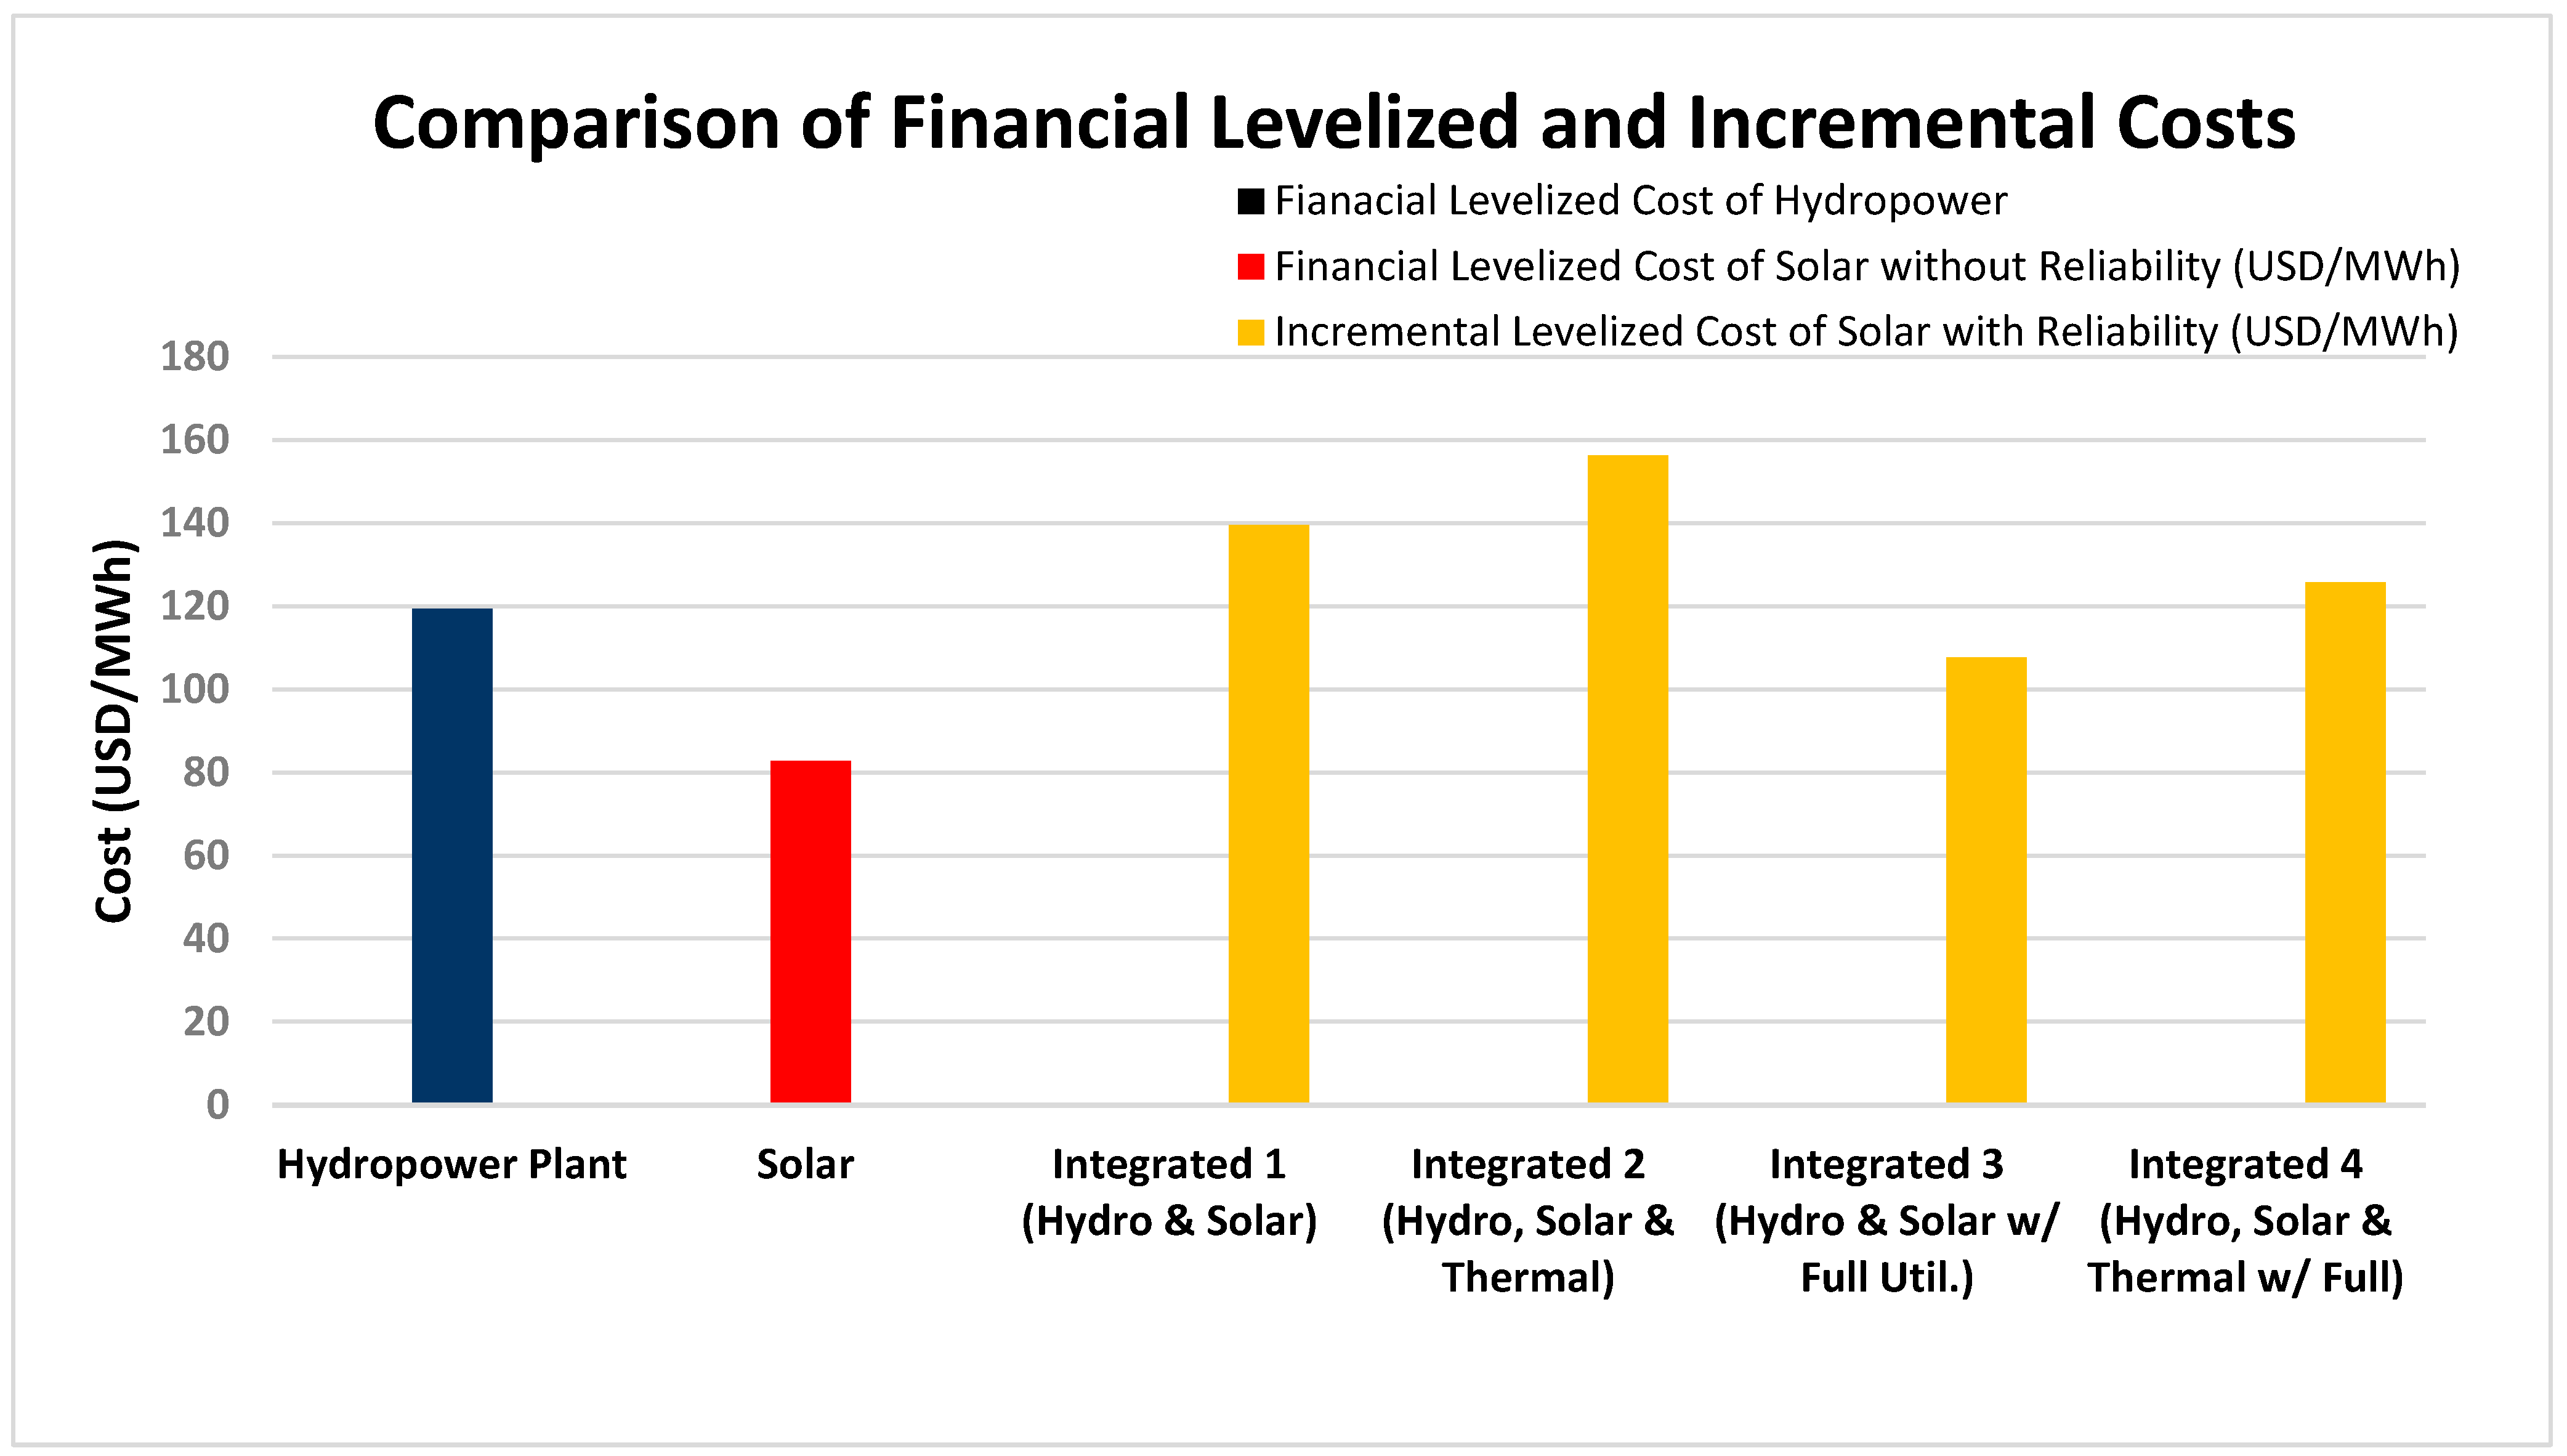
| 1 | Hydropower plant | 1,844,584 | 220.10 | 119.32 | - |
| 2 | Solar | 638,447 | 52.83 | 82.74 | - |
| Off-grid | |||||
| 3 | Integrated 1 (hydro & solar) | 2,337,045 | 288.80 | 123.57 | 139.50 |
| 4 | Integrated 2 (hydro, solar & thermal) | 2,448,117 | 314.39 | 128.42 | 156.23 |
| On-Grid | |||||
| 5 | Integrated 3 (gydro & solar with immediate full utilization of solar-generated electricity) | 2,483,031 | 288.80 | 116.31 | 107.60 |
| 6 | Integrated 4 (hydro, solar & thermal with immediate full utilization of solar-generated electricity) | 2,594,103 | 314.39 | 121.19 | 125.80 |
| Row No. | Components of Financial Appraisal | Net Present Value of Energy Generation (MWh) | Net Present Value of Energy Cost (USD) | Levelized Cost @8% (USD/MWh) | Levelized Cost @8% of Incremental Energy (USD/MWh) |
|---|---|---|---|---|---|
| 1 | 2 | 3 | 4 | ||
| 1 | Hydropower plant | 1,844,584 | 202.25 | 109.65 | - |
| 2 | Solar | 638,447 | 47.12 | 73.80 | - |
| Off-grid | |||||
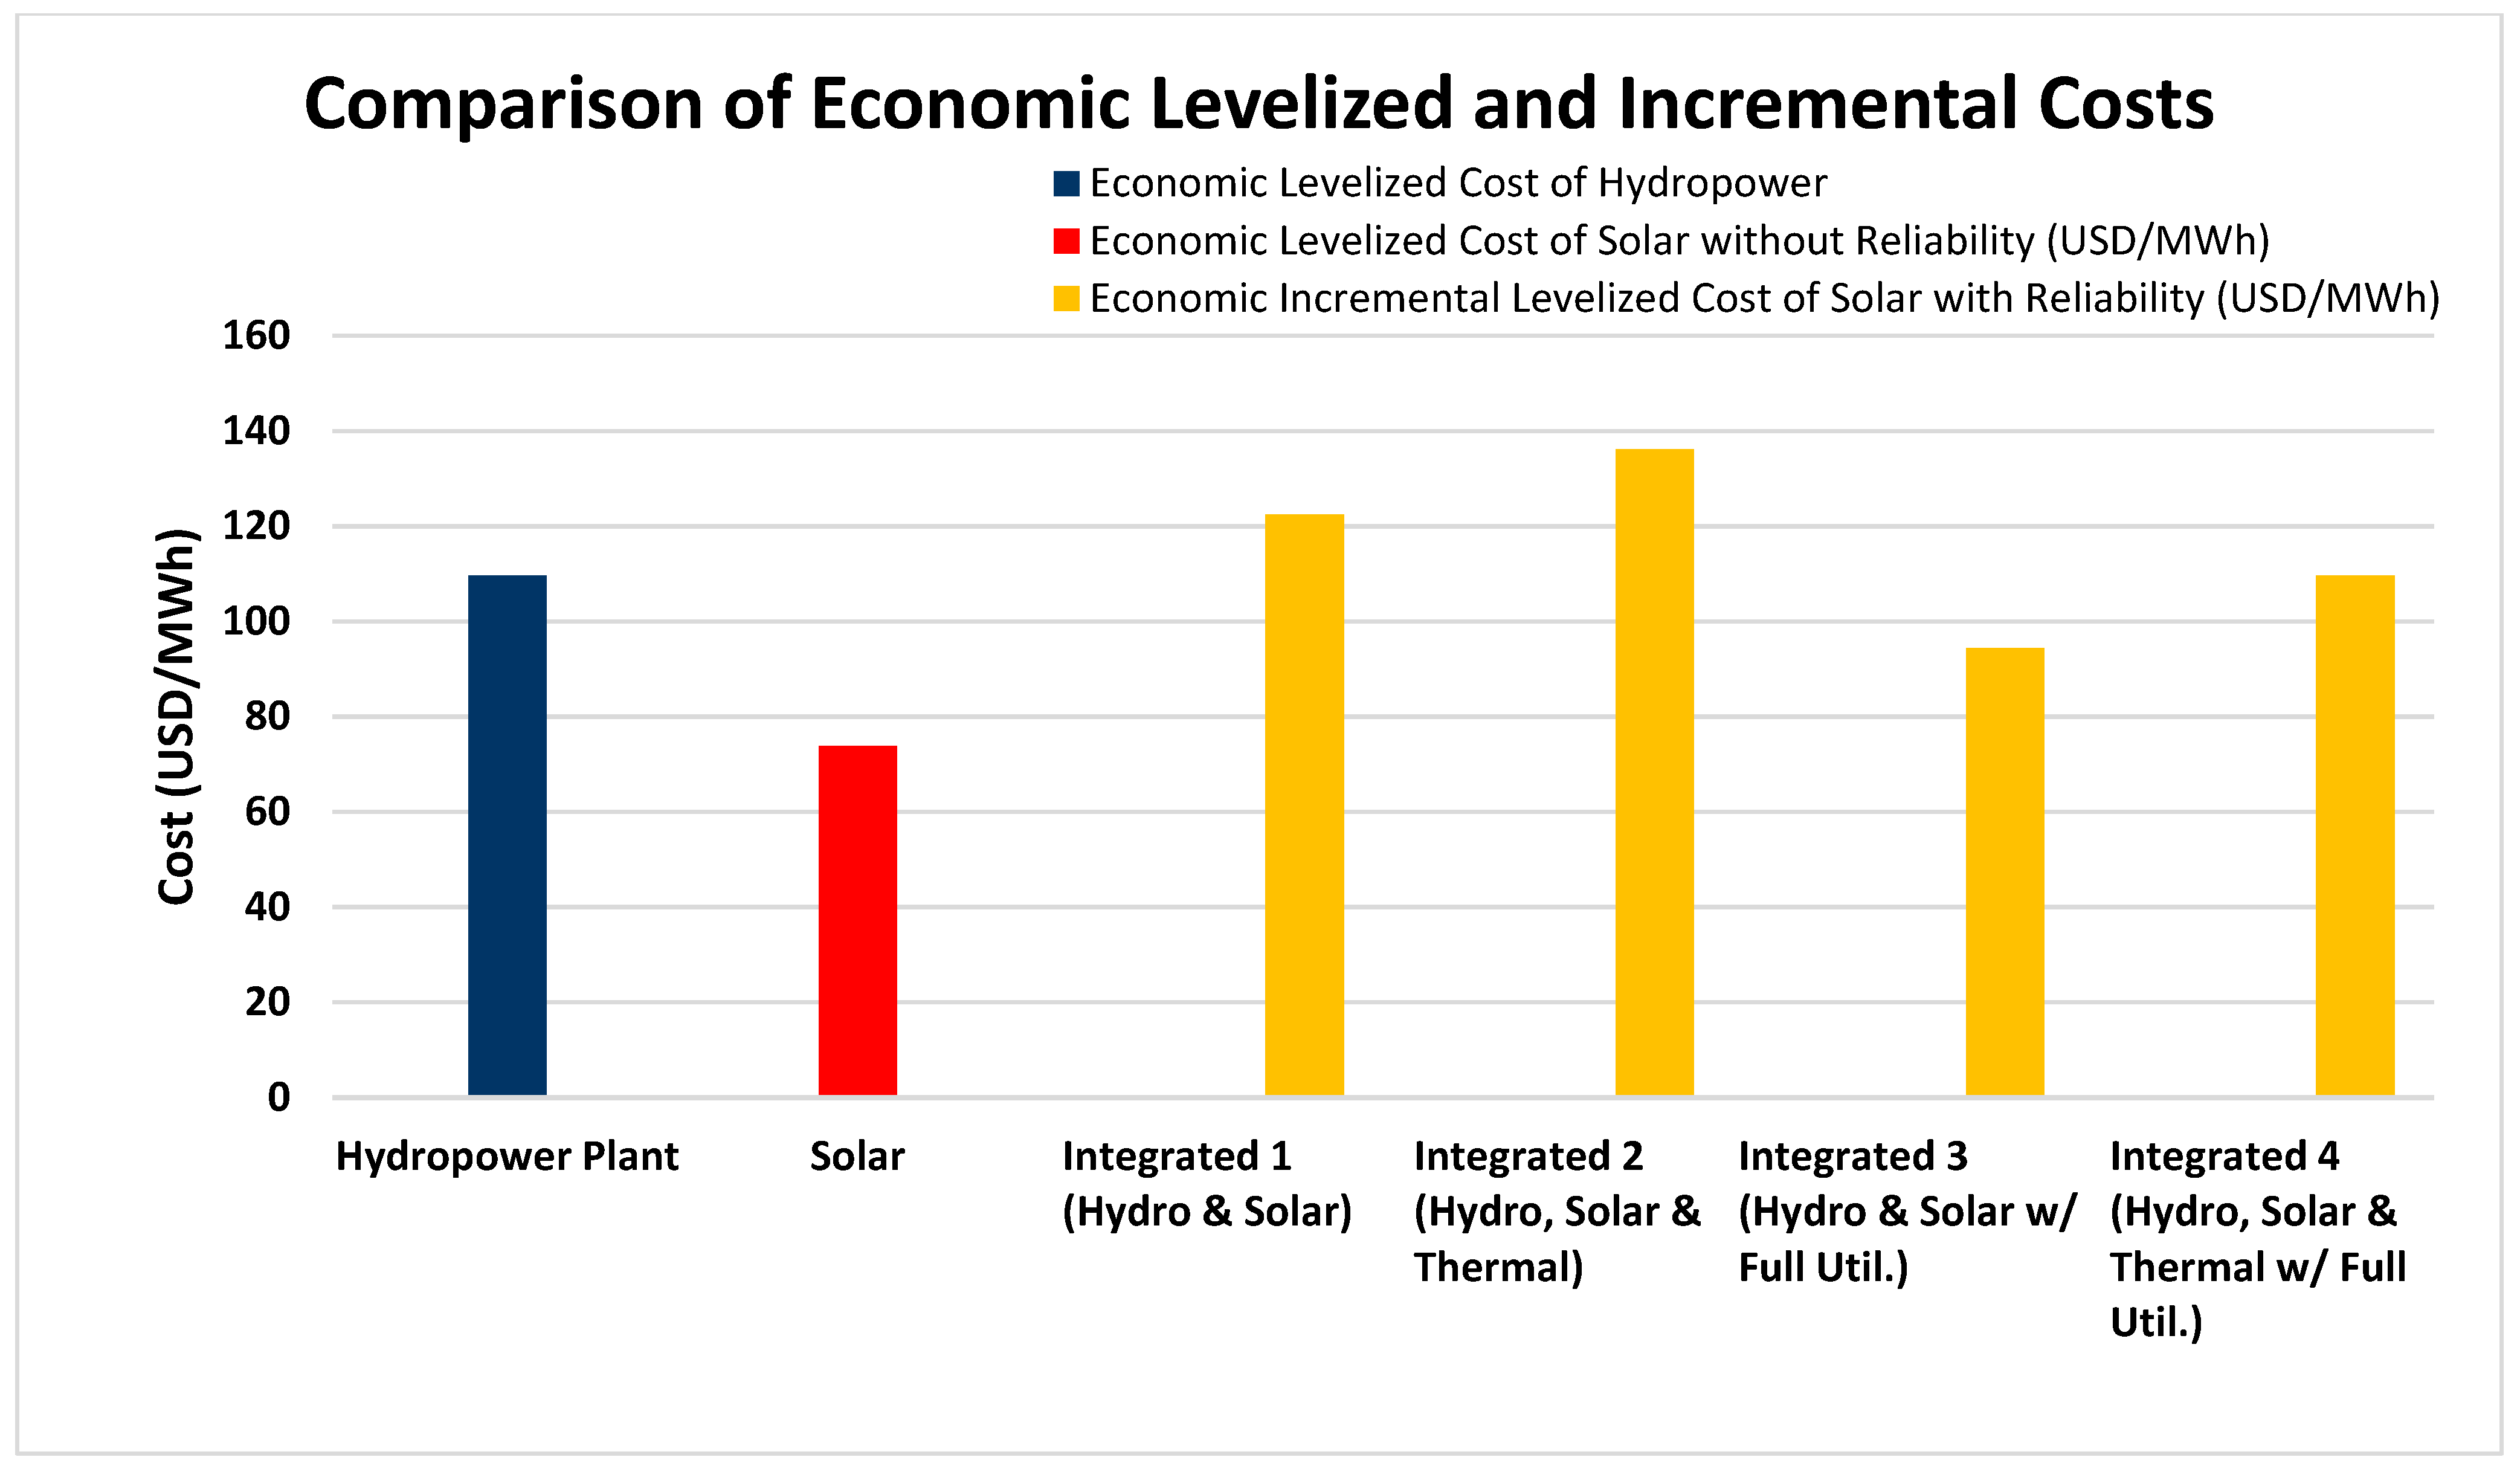
| 3 | Integrated 1 (hydro & solar) | 2,337,045 | 262.53 | 112.33 | 122.40 |
| 4 | Integrated 2 (hydro, solar & thermal) | 2,448,117 | 284.43 | 116.18 | 136.16 |
| On-Grid | |||||
| 5 | Integration 3 (hydro & solar with full utilization of solar generated electricity) | 2,483,031 | 262.52 | 105.73 | 94.41 |
| 6 | Integration 4 (hydro, solar & thermal with full utilization of solar generated electricity) | 2,594,103 | 284.43 | 110.28 | 109.64 |
| Row No. | Levelized Cost @2% ($/MWh) | Levelized Cost @4% ($/MWh) | Levelized Cost @6% ($/MWh) | Levelized Cost @8% ($/MWh) | Levelized Cost @10% ($/MWh) | Levelized Cost @11.50% ($/MWh) | |
|---|---|---|---|---|---|---|---|
| 1 | 2 | 3 | 4 | 5 | 6 | ||
| Financial analysis | |||||||
| 1 | Hydropower plant | 48.67 | 70.21 | 93.73 | 119.32 | 147.02 | 169.18 |
| 2 | Solar plant | 49.46 | 59.46 | 70.62 | 82.74 | 95.60 | 105.62 |
| 3 | Integrated 1 (hydro & solar) | 53.92 | 74.77 | 97.97 | 123.57 | 151.58 | 174.15 |
| 4 | Integrated 2 (hydro, solar & thermal) | 61.49 | 81.41 | 103.70 | 128.42 | 155.60 | 177.57 |
| Economic analysis | |||||||
| 5 | Integrated 1 (hydro & solar) | 48.68 | 67.73 | 88.93 | 112.33 | 137.94 | 158.58 |
| 6 | Integrated 2 (hydro, solar & thermal) | 55.01 | 73.21 | 93.58 | 116.18 | 141.03 | 161.14 |
Disclaimer/Publisher’s Note: The statements, opinions and data contained in all publications are solely those of the individual author(s) and contributor(s) and not of MDPI and/or the editor(s). MDPI and/or the editor(s) disclaim responsibility for any injury to people or property resulting from any ideas, methods, instructions or products referred to in the content. |
© 2025 by the authors. Licensee MDPI, Basel, Switzerland. This article is an open access article distributed under the terms and conditions of the Creative Commons Attribution (CC BY) license (https://creativecommons.org/licenses/by/4.0/).
Share and Cite
Ashitey, J.N.A.; Radmehr, M.; Jenkins, G.P.; Miklyaev, M. Seasonal Hydropower Storage Dams: Are They Cost-Effective in Providing Reliability for Solar PV? Sustainability 2025, 17, 4076. https://doi.org/10.3390/su17094076
Ashitey JNA, Radmehr M, Jenkins GP, Miklyaev M. Seasonal Hydropower Storage Dams: Are They Cost-Effective in Providing Reliability for Solar PV? Sustainability. 2025; 17(9):4076. https://doi.org/10.3390/su17094076
Chicago/Turabian StyleAshitey, Joy N. A., Mehrshad Radmehr, Glenn P. Jenkins, and Mikhail Miklyaev. 2025. "Seasonal Hydropower Storage Dams: Are They Cost-Effective in Providing Reliability for Solar PV?" Sustainability 17, no. 9: 4076. https://doi.org/10.3390/su17094076
APA StyleAshitey, J. N. A., Radmehr, M., Jenkins, G. P., & Miklyaev, M. (2025). Seasonal Hydropower Storage Dams: Are They Cost-Effective in Providing Reliability for Solar PV? Sustainability, 17(9), 4076. https://doi.org/10.3390/su17094076