Abstract
As the climate continues to warm, and municipal leaders look for cost-effective and timely approaches to urban sustainability, one increasingly sought-out approach is the use of tree canopy to cool neighborhoods. Despite widespread efforts to expand tree canopy in cities, an overwhelming body of evidence suggests that urban green space is declining across the U.S., yet little is known about the factors that propel these changes. Understanding the institutional and governance systems can help identify the opportunities for slow consistent declines. Using social network analysis (SNA) metrics, we examined stakeholder roles in power structures and decision-making processes within Portland, Oregon’s urban forest management. Our results reveal a highly decentralized urban forestry network (density = 0.0079), with weak cohesion (5.4%) among 162 stakeholders. Moving forward, while network governance may face obstacles from conflicting interests among community and interagency groups, transforming governance models at all levels will require developing periodic, collaborative urban forestry management plans to address nature-based planning challenges. These planning documents should strongly emphasize not only the prioritization of tree equity-related ordinances but also the optimization of eco-literacy and awareness through virtual reality (VR) technology. As a novel approach, immersive simulations demonstrate practical potential for showcasing urban forestry benefits in network governance outreach and consensus-building.
1. Introduction
Nations and regions are setting ambitious targets for expanding greening efforts with examples such as the “million” and ”trillion tree” campaigns, forests for everyone programs, and anti-desertification efforts [1]. Arguably, nowhere do these greening projects have a greater level of urgency than our urban areas, where the combination of population growth, climate change, and land use policies continues to reduce the available green spaces for residents [2]. Although many municipal leaders are actively developing programs to establish ambitious targets for expanding green spaces, an increasing recognition about the loss of urban tree canopy (UTC) among US cities remains a consistent concern [3,4]. UTC continues to decline across the United States [5,6], and an increasing number of studies suggest that urban areas have reached “peak forests”, in which trees and forests are undergoing a decline after several years of expansion [7,8,9,10,11]. For example, Oklahoma sees the highest annual decrease (−0.92%/year) or losing nearly 1% of its urban canopy every year. The District of Columbia (−0.44%/year), Rhode Island (−0.40%/year), Georgia (−0.37%/year), and Oregon (−0.38%/year) also show statistically significant trends [3]. Specifically, at the city level, Portland, Oregon experienced a continuous decrease in UTC coverage, declining from 30.7% in 2015 to 29.8% in 2020 (https://www.portland.gov/ (accessed on 16 April 2025).These concerns are compounded by a recognition that urban neighborhoods contain a highly inequitable mix of green spaces with some containing little to no tree canopy, while others have extensive forests. These patterns have also been recently attributed to historically disinvestment and other systemic processes leading to ongoing losses today [8,12].
While planting efforts to expand urban forests, even within historically disinvested areas of cities, may offer a means to achieve greater equity in UTC, an overlooked dimension of urban forest management is the need to examine the role of governance systems in improving conservation efforts [12,13,14,15]. Previous studies have found that socio-environmental factors, which include governance structures and stewardship patterns, are capable of influencing the volume of UTC [16,17,18]. Roman et al. and Hilbert et al. revealed that the decision-making processes of urban forest management can significantly affect the distribution of UTC in cities [18,19]. Potential governance factors include the execution of such ordinances as monoculture planting practices, and a lack of collaboration among relevant stakeholders. The lack of coordination on tree maintenance across government agencies, community-based organizations, and local residents also accounts for low tree canopy [20]. Still other case studies point to declining UTC due to a lack of public participation or resistance from low-income and communities of residents of color due to the lack of trust, historical trauma, and other government actions that have disproportionately impacted marginalized people [21]. These and other studies point to the role of traditional power hierarchies within public agencies that contribute to the decline of tree canopies, exacerbating social inequalities, with poignant examples in Milwaukee (WI) that illustrate a lack of canopy cover in marginalized neighborhoods [22], and in Los Angeles (CA) where green spaces represent hostile or unwelcome spaces for communities of color [23].
We build on these earlier studies by arguing that the continued loss of urban forests is likely due to a lack of understanding about the governance factors that underpin existing decision-making efforts. A lack of systematic assessment of governance structures may, we posit, account for the lack of transparency and explicit identification of the factors that propel some forms of urban conservation, which can contribute to declining UTC. By assessing forest loss using a lens of urban forest governance, we can better understand and articulate the mechanisms that affect the presence, conservation, and loss of urban forests. We make this argument for several reasons. First, our current understanding of urban forest management in the US consists of government agencies leading the charge, coordinating and directing efforts that determine the fate of trees and green spaces. In this process, public agencies are expected to engage with members of their own professional staff (i.e., urban forestry), and at times, though infrequently with planning, public works, and environmental sustainability organizations [24]. Such hierarchical structures can lead to a lack of communication, transparency, and bias in decision-making processes, which may be for reasons that do not benefit urban forestry conservation interests.
Second, public agencies in the US have limited capacity to conserve, manage, and expand urban forests for reasons such as conflicting priorities for urban development and a lack of close collaboration between relevant government departments, private practitioners, and community groups [25]. The conflicts that urban forest managers face when negotiating between development and gray infrastructure (e.g., roads, sewers, utilities, etc.) have relatively limited documentation or evidence, yet extensive efforts have gone into understanding urban development and plan-making processes [26]. Perhaps due to the consistent lack of funding for urban forestry programs, such systematic descriptions about negotiating conflicts and processes have had little attention in the literature. The recent expansion of funding to urban forestry organizations, notably through the US Federal government passing the 2022 Inflation Reduction Act, has brought light to this woefully understudied area within forestry [27].
Finally, governance processes for urban forest management are often driven by legislative or policy priorities that focus on tree preservation, emphasize tree permits or licenses, diversity of species, and other administrative or biological factors. The overall lack of behavioral norms, rules, and standard practices is largely undocumented yet arguably plays a pivotal role in guiding conservation outcomes [28]. If at all, human relationships with urban forests appear in the form of neighborhood tree stewardship programs that advocate for and plant new trees with volunteering opportunities. The lack of understanding of the behavioral norms and standards of practice within urban forestry programs propels a need to further examine the ways in which decisions are made, along with the potential for integrating legislative or policy decisions within a framework of existing governance practices [29].
For these reasons, this study aims to make explicit the underlying factors that can help to explicate the governance processes for urban forest conversation. In this context, governance processes refer to the efforts to coordinate human actions toward achieving urban forest management goals [30]. A group of stakeholders, often referred to as a network, manages its governance through institutional and economic frameworks that engage relevant parties, establish norms of practice—including the creation of rules and policies—and enable its effective functioning. Institutional frameworks are sets of formal and informal guidelines that shape human interactions, choices, and behaviors [31]. They include stakeholder organizations (actors in governance such as private organizations, community-based groups, academic institutions, etc.), legislative laws and regulations, and behavioral norms. By applying these existing understanding of governance processes to urban forest management, we can better situate the current state of the field and provide a framework for advancing urban conservation opportunities.
Since governance processes and networks are frequently neglected in the realm of urban forestry management [32], some background can be helpful to ensure that the terminology and their application are consistent throughout the present study. Governance networks usually represent governance structures because they visually and conceptually map the relationships, roles, and power dynamics within a system [30]. They reveal how the structure functions in practice, enabling a better understanding of the processes, challenges, and opportunities for improvements in relation to UTC outcomes. The apparent focus on the decrease in tree canopy, we argue, may obscure the fact that institutions and individuals have a direct effect on the urban forest. Prior studies have recognized the significance of social networks as a key factor in situations where diverse parties collaborate effectively to address issues related to the depletion and inefficiency of natural resources [33,34]. In the studies by Campbell et. al. and Sekulova et al., analyzing stakeholder networks reveals how social structures, shaped by the relationships among participants, can either support or hinder tree equity initiatives in urban and community forest management [24,35]. In another study, Konijnendijk et al. analyzed urban forest governance by examining past and present governance arrangements and models, including the actors and alliances involved (e.g., through social network analysis), and identifying the nodes of power, resources, and information that drive decision-making [36].
Nevertheless, there is a dearth of empirical research that utilizes quantitative methods to analyze network characteristics in the context of network governance within urban forestry management. The application of tools such as a social network analysis (SNA) allows for a characterization of governance networks by investigating the stakeholders involved and explicitly reveals their relational structure and knowledge [37]. SNA employs numbers and visuals to illustrate how people or groups interact in such complex systems as networks of urban forestry stakeholder organizations [38,39,40]. Using a field survey, we conducted a social network analysis (SNA) to address the following research questions: To what extent do existing management hierarchies of power present the ability for broad collaboration across the network? Does the urban forestry social network lean more towards a decentralized or centralized form? What are potential “bottlenecks” or constraints in the collaborative potential for regional urban forestry stakeholders? We note that although the study is specific to the City of Portland (a mid-sized city in the Pacific Northwest (USA)), our broader aim is to contribute to the systematic assessment of urban forestry programs. As such, this approach aims to understand the stakeholders’ driving decisions and the potential leverage points that can support decisions.
2. Materials and Methods
2.1. Case Study
The city of Portland is located at latitude 45°31′23.0304” N and longitude 122°40′35.3388” W, encompassing approximately 133.45 square miles of land [41]. Portland’s estimated population is 648,097 [42]. The inhabitants comprise 72.1% who are white alone, 5.9% are black or African American alone, 1.0% are American Indian and Alaska Native alone, 8.4% are Asian alone, 0.6% are Native Hawaiian and other Pacific Islanders alone, 9.2% are two or more races, and 10.3% are Hispanic or Latino [43]. For the following reasons, Portland is a promising case study for understanding the importance of urban forest governance: First, the city of Portland is taking proactive measures to oversee its tree canopy and has set a target to increase UTC to 33% by 2035 [44]. Second, as of the writing of this paper, the city is under contract with a consultant to develop a new urban forest management plan (UFMP). The results of this process will enable baseline comparisons to understand how explicitly equity-centered and innovative approaches broaden governance processes. Finally, by developing a case study of a single location, we are better equipped to describe common management practices, negotiation of tradeoffs among stakeholders, fostering of shared knowledge, and facilitation of information exchange as integral parts of governing the planting and management of urban trees.
2.2. Social Network Analysis
Essential to the SNA process is identifying the potential and specific stakeholders who are likely to be involved with urban forestry within the study region. To achieve this, we conducted a thorough online desktop search to identify the urban forestry stakeholder organizations operating within the city of Portland. We accomplished this objective by searching the internet for the keywords “urban forestry”, “stakeholders”, and “Portland, Oregon” to locate all pertinent entities needed for conducting the SNA that serves as the primary method for this study. After accessing the official websites of the urban forestry stakeholder organizations, we gathered information on 155 entities, which we then categorized based on their sector and compiled their names, along with contact information, into a Microsoft Excel document. We adopted a snowball approach and sent the stakeholder inventories to experts for a comprehensive review [45]. These individuals are locally engaged and seasoned urban forestry professionals with extensive field experience and networks. They helped to identify and include an additional 20 organizations that were missing from the original internet search. This was an important step toward survey development, instrument testing, and survey administration. The expert reviewers provided valuable feedback that ensured the accuracy of the data, culminating in reliable research findings (see also Figure 1) [45].
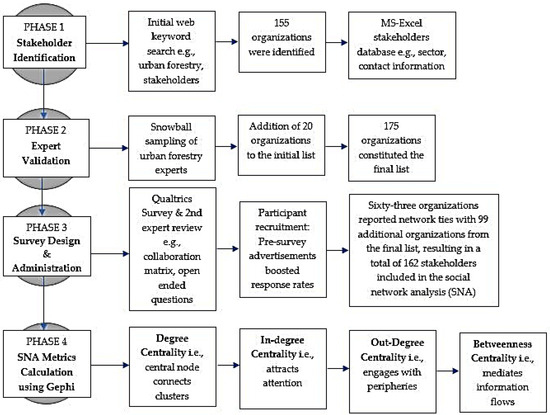
Figure 1.
SNA methodology flowchart. Source: authors’ representation.
To develop and administer the survey instrument, we utilized Qualtrics XM software (version 2024), which allows for creating an online questionnaire lasting approximately 15 min. The questionnaire aimed to gather information from potential stakeholder organizations regarding their social network connections with similar organizations and consists of three (3) sections [46]. The first section includes background information, such as the title of the respondent, stakeholder category by sector, organizational roles, and connection activities with other actors. We used the second section to gather valuable insights on the sociographic patterns among the city’s urban forestry stakeholders. This question focused on understanding collaboration and knowledge-sharing dynamics. The matrix scale is as follows: 1: I am not aware of this stakeholder, and we do not collaborate with them; 2: I am aware of this stakeholder, and my organization does not have any collaboration with them; 3: My organization rarely collaborates with this stakeholder; 4: My organization occasionally collaborates with this stakeholder; 5: My organization often collaborates with this stakeholder; and 6: My organization always collaborates with this stakeholder. We only took into account modes of collaboration within matrix positions 3 through 6 (see Appendix B for the survey questionnaire).
The third section of the survey consists of open-ended questions designed to identify the stakeholders that play a significant role in determining the future of urban forestry within the city. The survey was included with other relevant materials as part of the Human Subjects Review process. The specific materials are project overview and pre-screening, exemption certification, investigator assurance, recruitment materials (fliers, emails, and ads), and a consent form. The Human Research Protection Program (HRPP# 238290-18) granted approval on 3rd January, 2024.
After completing these chronological steps, the survey instrument underwent an expert review to determine its viability. One week prior to launching the survey, we sent a preemptive letter to the target audience—urban forestry stakeholders—that aimed to generate publicity and improve the response rate for the survey [47]. Between February 2024 and April 2024, we distributed the online questionnaire to 175 urban forestry stakeholder organizations. Initially, we planned to close the survey after a month from the publication date, but due to slow responses, we extended the survey for another month. We sent several post-distribution reminders to increase responses.
Sixty-three organizations completed the survey, and they established connections with an additional 99 organizations from the pool of 175 organizations invited to the online survey (see Appendix A, Table A1, Table A2, Table A3 and Table A4). After identifying and selecting only those organizations that were part of the urban forestry network, we arrived at a complete list of stakeholders consisting of 162 individual groups (39% overall response rate). The distribution of the response rate consisted of public organizations/government agencies (n = 17; 10.5%), private organizations (n = 68; 42%), community-based organizations (n = 65; 40.1%), and academic communities (n = 12; 7.4%).
2.3. Data Analysis
We analyzed the survey results using Gephi software (version 0.10.1). The software is open-source and used for network analysis, cartographic analysis, and visualization (www.gephi.org (accessed on 6 June 2024). According to Tabassum et al., SNA employs sociograms and graph theory to examine and visualize social interactions [48]. We depicted the urban forestry stakeholder organizations as SNA nodes or vertices (Table 1). The relationships among these organizations, referred to as “edges” or “ties”, will illustrate their connections [49,50]. To analyze the roles of stakeholder organizations within a network, we assessed the degree of centralities. In Figure 2, weighted edges, which indicate the level of collaboration and connection between organizations, are often present in many networks [49]. These measures provided insights into the significance and influence of the participating organizations.

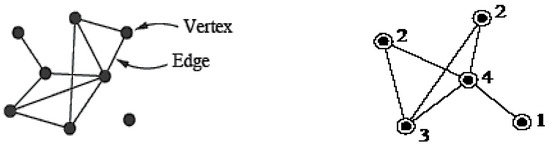
Table 1.
The SNA metrics are as follows.
Table 1.
The SNA metrics are as follows.
| SNA Term/Metric | Interpretation |
|---|---|
| Centrality | A collection of metrics that assess the level of interconnection between organizations in a network. |
| Network centralization | The values fall between 0 and 1, with higher values suggesting a network that is under more central control, distinguished by a few stakeholder organizations who have strong interconnections. |
| Network density | This metric ranges from 0 to 1, where a higher density signifies a network that is closely knit, enabling a smoother exchange of information and resources among the stakeholder organizations involved [51]. |
| Degree centrality | These values can be compared to those of other stakeholder organizations in the network, where higher values indicate a greater number of connections and a more influential position within the network. |
| In-degree centrality | The number of links directed toward a particular stakeholder organization in a network. These values can be compared to those of other stakeholder organizations in the network, with a higher in-degree centrality indicating greater popularity [52]. |
| Out-degree centrality | A higher out-degree centrality indicates a greater level of engagement or interaction with stakeholder organizations in the network. |
| Betweenness centrality | Stakeholder organizations who have a higher betweenness centrality play a crucial role in connecting different stakeholder organizations within a network. |
Figure 2.
Weighted edges in SNA; the numbers on the edges indicate the degree centrality of each vertex in the network [53]. Note: the connections between these organizations are “edges”.
3. Results
3.1. Network Analysis
The SNA established a total of 162 vertices and 1401 edges, representing the urban forestry stakeholder organizations in Portland and their connections, respectively (Figure 3). We investigated network density, degree centrality, in-degree centrality, out-degree centrality, and betweenness centrality. These SNA metrics helped to address the specific research questions that revolve around the collaboration levels among stakeholders and to define the governance structures within the network.
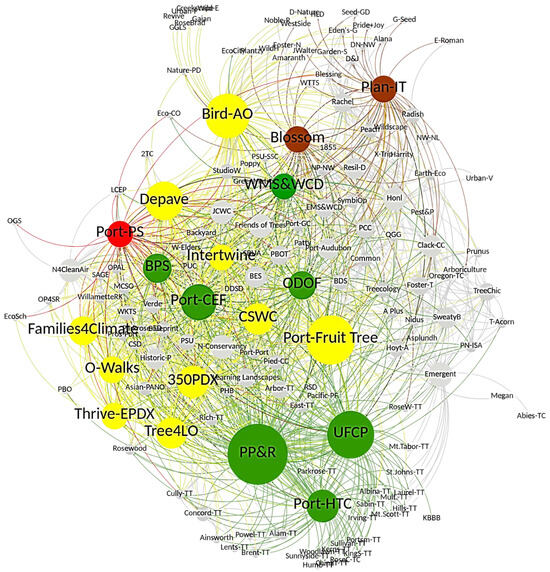
Figure 3.
2024 Portland Urban Forestry Network: Top 20 stakeholders by connectivity, sized by degree centrality. Colors denote sector (gov’t = green, private = brown, CBOs = yellow, academia = red, other = gray).
Network density determines a network’s cohesiveness by quantifying its level of interconnectedness [52]. A high-density value indicates that the network is more interconnected, while a low-density value signifies a less connected or sparse network [54]. In a dense network, information circulates more efficiently and rapidly compared to a sparse one [51]. In this study, our results show a low network density value of 0.054, indicating very low cohesiveness within the network. Exercising power in a low-density network suggests an overall lack of information flow and resource sharing across the respondents and can therefore constrain collaborative governance processes [55].
In contrast, the network exhibited a centralization score of 0.0079, signifying a low level of centralization (Figure 3). This centralized nature is characterized by a relatively equal distribution of connections across stakeholder organizations. Such decentralization points to highly distributed communications, influences that can be radiated across network partners, and the potential for collaborative responsibilities. With a low level of centralization in this network, stakeholders can hold power and influence with specific roles and duties. Hence, a combination of individual initiative and collaborative mechanisms can carry out such natural resource governance processes as decision-making and implementation efforts [56]. Consequently, a decentralized network can supersede traditional chain-of-command governance structures and, if enabled with information and power sharing, can transcend statutory ownership of urban resources, management authorities, and funding sources [57]. Our findings indicate that the decentralized network structures might give more governance options and a variety of collaborative possibilities for different urban forestry stakeholder groups.
3.2. Degree Centralities
Degree centrality measures the number of links held by each node, reflecting the level of network cohesion at the individual actor level [50]. Based on their degree-centrality SNA metric values, a few organizations exhibited the highest-ranking degree centrality: Portland Parks and Recreation (PP&R), Portland Fruit Tree Project (Port-Fruit Tree), Urban Forestry Commission Portland (UFCP), Bird Alliance of Oregon (Bird-AO), Depave, and Portland Clean Energy Fund (Port-CEF) (Table 2). The organizations with a high level of degree centrality may depend less on other stakeholders because they have multiple means to satisfy their needs and achieve their goals, giving them an advantage in network governance [55]. Our results indicate that these six organizations have greater connections across the network than any other surveyed stakeholders (Figure 3). For instance, PP&R is known for their neighborhood stewardship summer programs, periodic yard-tree giveaways, newsletter publications on urban forestry topics, and other outreach events to build action-driven relationships with other members of the network. Perhaps through these communication channels and partnerships, PP&R has established an outsized level of degree centrality within this network.
Table 2.
The urban forestry stakeholder organizations were ranked based on various SNA metric values, utilizing acronyms to ensure clear presentation.
Similarly, the Port-Fruit Tree’s shared harvest programs usually have interactions with community-based organizations regarding the equitable distribution of fresh fruits to improve wellbeing and food security in Portland neighborhoods. Their outreach efforts and engagement with private and non-profit stakeholders gives them connection to a proportionally larger number of surveyed organizations. The activities of other organizations, such as Depave, enables connections through collectively removing impervious pavements to create room for a greener infrastructure. Such depaving activities, by design, require a collaborative and highly engaging effort, which is consistent with the results of the level of degree centrality. Overall, urban forestry stakeholders with high degrees of centrality—measured as generally, in-degree, and out-degree—are more likely to possess greater access to information and influence others within the network [50].
In-degree centrality is the quantity of connections directed toward a particular node [58]. Conversely, out-degree centrality refers to the quantity of connections originating from a node and directed toward other nodes. The results indicate that other stakeholder organizations within the network actively seek out PP&R, Friends of Trees, Port-Fruit Tree, and The Blueprint Foundation (Blueprint) due to their notable presence and perceived legitimate authority. On the other hand, the network’s stakeholder organizations (Bird-AO, PP&R, UFCP, Port-Fruit Tree, and Depave) have shown a high level of outreach through their external relationships. The higher in-degree and out-degree SNA values of PP&R and Port-Fruit Tree may reflect their ability to mobilize actions to promote a functional urban forest in Portland. They hold prominent and influential positions in network governance.
Finally, a measure of betweenness centrality quantifies the frequency with which a node serves as a connector on the most direct route between two distinct nodes in a network [59,60]. Organizations with higher measures of betweenness centrality are positioned as intermediaries among other organizations; they can boost information exchange and impact relationships among various stakeholders in the network [57]. Our study revealed the roles of PP&R (1627.932), Blossom (986.486), Port-Fruit Tree (828.487), and UFCP (747.798) in strategically positioning themselves as link bridges for other stakeholder organizations that lack reciprocal connections within the network (see Table 2 below and Appendix C). Betweenness centrality also measures a stakeholder’s capacity to exert influence on others. Generally, organizations with higher centrality values are critical in connecting different stakeholders within a network. These organizations are perceived to have inherent abilities to engage with and support neighborhood tree teams organized by private landowners (emerging stakeholders) in thriving and fulfilling their commitments to serve the urban forest.
Landowners and property developers are key players in urban forest governance, as illustrated in Figure 4. Shakeel and Conway’s study reveals that landowners’ perceptions of trees vary significantly—while some value them for environmental and aesthetic benefits, others view them as nuisances. In property development decisions, landowners exercise partial adjudication authority regarding tree preservation or new plantings. Portland’s practice shows that most property owners consult city arborists or landscape architects to ensure appropriate tree selection and placement. The city particularly prioritizes protecting heritage trees due to their cultural significance for Indigenous communities [61].
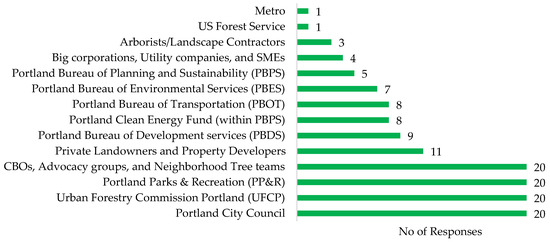
Figure 4.
Stakeholders that play significant roles in determining the future of urban forestry within the city of Portland. (The number of responses represents an exact count of respondents who mentioned each stakeholder in the survey.)
As part of the SNA, we also provided respondents with the opportunity to answer several open-ended queries that aimed to pinpoint key stakeholders involved in influencing the trajectory of urban forestry. We solicited responses to questions such as, “Who do you think plays an important role in determining the future of urban forestry in Portland?” which solicited opinions that identify specific entities that may have strongly influenced the governance processes in relation to urban forest management. The quantity of mentions of a specific stakeholder reflects their perceived role in driving the local decision-making efforts (Figure 4). Of note is that despite the similar number of sectoral respondents from public and non-profit organizations, respondents noted that the top three most important influences in determining the future of the urban forest are within the public sector (i.e., City Council, Urban Forestry Commission, and PP&R). Of note is that only two of these entities have regulatory authority (City Council and PP&R), and that the other is a voluntary advisory group. A fourth grouping—a combination of several non-profits—are perceived as equally persuasive and important in urban forest management. These groups include 350PDX, Friends of Trees, Bird Alliance of Oregon, and others.
4. Discussion
4.1. Main Insights from Social Network Analysis (SNA)
Our analysis of social network governance reveals a “management tension” in which the majority of stakeholder organizations involved in urban forestry management have weak and limited cohesive connections, yet a few organizations arguably play an outsized role in driving the future of Portland’s urban forest. The management tension–illustrated by limited cohesiveness and a few central organizations–indicates a lack of robust collaboration among the sectors represented in this sample. Similar studies on network governance of organizations have characterized low-density and loosely connected networks [60,62] as consisting of many individual organizations performing their planning and management functions in solitude [63]. For instance, Carmichael and McDonough’s study found that community-based organizations often make sole decisions about which tree species to plant and how to care for them, which can lead to less active involvement in decision-making by other sectors, residents, and groups [64]. In the present study, the results suggest that public agencies are highly influential in making decisions about and assessing the consequences of action or inaction on the urban forest, and that other stakeholders across multiple sectors play a relatively insignificant role in influencing the quality of the urban forest.
Organizations that have a greater level of in-degree and out-degree centrality may rely less on other stakeholders because they may have the capacity and knowledge to meet their requirements and accomplish their objectives, which makes them less dependent on the broader network of urban forestry stakeholders [65]. In the case of Portland’s public sector, they have a concentration of connections—represented through the different measures of centrality—and can create systems that also reduce power sharing within the network. Information flows in these highly centralized organizations can remain sequestered, and decisions about the extent to which all relevant stakeholders have equal access can rely on a small group of individuals within the public sector [66]. Our results suggest that within this network only a few organizations represent the highest degree of power and influence: PP&R, Port-Fruit Tree, Friends of Trees, and Bird-AO (see Table 2 and Appendix C). Three of the four top organizations are non-profits who are highly engaged with local efforts to govern the urban forest. Their network positions offer them the opportunity to engage and help neighborhood tree teams (and other emerging stakeholders) thrive better in their efforts to achieve equitable urban forest goals in Portland (betweenness centrality).
An important note is that PP&R currently holds the responsibility of managing forestry planning initiatives and supervising the enforcement of the municipal code that governs the management of urban trees (i.e., Title 11 Trees). This tree code serves to address the quality of the urban forest through establishing the rules and regulations for the actions that can be taken to safeguard the existing trees, while also identifying specific directions for the process of expanding the urban forest [8]. While the centrality of PP&R is not entirely surprising given their administrative responsibilities, the opportunities to create greater levels of connections across nodes, thereby facilitating broader information flows and network cohesions, remain to be seen. For example, while PP&R is responsible for enforcing the tree code, other agencies in the city also play a role in supporting programs and policies to facilitate the planting of new trees and the management of existing ones, with coordination among different city bureaus, including the Bureau of Development Services, Clean Energy Fund, Bureau of Transportation, Bureau of Environmental Services, Bureau of Planning and Sustainability, and the regional government, Metro. The extent to which other city bureaus are brought into the decision-making efforts remains unclear, and similarly, the low network cohesion suggests that city agencies are limiting the involvement of other non-public entities in governance processes.
In this type of network, the majority of stakeholders function autonomously or with limited interaction with others. However, the choices or behaviors of a small number of key stakeholders can significantly influence the whole network governance. This results in a network where power and influence are centralized in a few entities in an otherwise decentralized system and suggests that outside of the public sector, other stakeholders play a relatively limited role in the governance of Portland’s urban forest. One way to achieve continuous urban forest expansion, despite their drastic decline, is to shift from the traditional top-down model of network governance to a genuine partnership among government agencies, private organizations, community-based groups, and academic institutions that support research and development [67]. Doing so will require the public sector to expand power-sharing opportunities, allowing other stakeholders to play a much larger role in making decisions about the governance of the urban forest. Whether such collective efforts are plausible in an environment with declining UTC may be based largely in creating a collective vision of an urban forest that goes beyond public sector codes, regulations, and perspectives.
Another stakeholder of note that plays an active role in the management of the urban forest is the private landowner. Nearly 60% of the land in the study area is privately owned, which makes landowners, property developers, and their associated service organizations key players in urban forest management. Private landowners’ views on trees vary widely [68], and they rely largely on private landscaping companies or arborists to provide support to their existing trees. Our research findings suggest that a few private organizations, including Blossom, Plan-it Earth Design (Plan-IT), and Honl Tree Care (Honl) are currently among the most well-recognized private tree contractors within the network, positioning them as well-connected urban forestry stakeholders in the study location (Table 2). While these private organizations are recognized by survey respondents, their level of centrality remains relatively limited, despite the large role they may play in supporting landowners and other organizations.
Several scholars suggest that good network governance consists of a high-density, decentralized structure that supports cross-organizational and multi-institutional decision-making processes, including planning, putting policies into action, and managing urban forests in a way that adapts to new conditions [46]. In Portland, an example of this collaborative effort is the “Connecting Canopies or Canopy Action Planning” initiative, a partnership launched in 2022 by local groups from different sectors to promote an equitable distribution and expansion of Portland’s urban forest (see https://www.portland.gov/trees/ (accessed on 11 December 2024) The Nature Conservancy in Oregon (TNC), the Urban Greenspaces Institute (UGI), the Blueprint Foundation, and the Sustaining Urban Places Research Lab (SUPR Lab) at Portland State University championed this initiative, which recognizes the importance of a highly connected network that spans sectors. Similarly, creating more cluster partnership arrangements can potentially increase equitable urban forest canopies in Portland and other regions.
Social networks across multiple stakeholders can enhance collaborative governance processes by facilitating the generation, acquisition, and dissemination of various forms of knowledge and information related to the systems under management [68,69,70]. They can also make it easier to obtain important resources for good governance [53,71,72] and encourage everyone to follow the same rules, which makes people more likely to take part in monitoring and enforcement efforts [33,73]. However, there are bottlenecks or constraints in the collaborative potential for regional urban forestry stakeholders. For instance, Driscoll et al.’s study in 30 cities in the Portland and Vancouver metropolitan regions revealed that inadequate funding, limited political backing, interagency conflicts about green infrastructure placement, and low public engagement due limited environmental education are barriers to expanding urban forestry programs, despite strong support from diverse stakeholder groups [74].
4.2. SNA Limitations
It is important to note that the present study aimed to explicitly map the governance network for one city and, as such, has several limitations. First, establishing the network for a highly decentralized and often inconspicuous set of stakeholders provided challenges and required the use of references and snowball sampling. While we expect that the stakeholders represented in this sample reflect the majority of those involved in urban forestry within the case city, we expect that some may have also been left out inadvertently. Second, despite implementing preemptive measures and providing a wide survey window (2 months) from publication to closure, participant survey completion rates were less than 40%, which represents a relatively low response given expectations of the SNA.
In subsequent SNA research, triangulation survey responses with additional outreach using interviews and focus groups could offer valuable and additional perspectives [51,68]. Finally, determining the boundary of a wide network poses a frequent challenge in SNA because respondents often straddle multiple categories within the network. For instance, in our study, some urban forestry stakeholders are both public agency staff members and actively involved volunteers in various community-based organizations, yet the SNA required the categorization of respondents into one sectoral category. The lack of accounting for the dual role can introduce conflicting interests that may affect the accuracy of survey responses, though we also note that a relatively limited number of respondents may be impacted by the dual role.
4.3. Future Network Governance Directions
While this study offers significant insights into urban forest governance networks, there are two key limitations to keep in mind for future research. First, while recognizing private landowners as key actors, the research does not adequately take into account: (i.) the specific avenues through which they participate in governance, (ii.) the institutional or socioeconomic barriers they face, or (iii.) their changing relationships with public agencies and NGOs. Additional research on these dimensions could provide actionable strategies for enhancing landowner engagement. Second, the study does not examine the in-depth impact of external macro-factors—e.g., shifts in environmental regulation, economic fluctuations, or meteorological catastrophes—on governance resilience and stakeholder behavior. Future research should include these uncertainties in network models, potentially through scenario modeling, to investigate their systemic implications and improve adaptive governance strategies.
5. Conclusions and Recommendations
This study draws attention to the important role of urban forests in improving environmental quality and sustainability in the face of a rapid urban forest decrease in the United States and across the globe. The city of Portland, Oregon, serves as a case study to explore the complex network governance of urban forestry, involving multiple stakeholders such as public agencies, private organizations, community-based organizations, and academic communities. Using social network analysis (SNA), this study identified and surveyed 162 urban forestry stakeholder organizations to describe the level of degree centrality, in-degree and out-degree centrality, and betweenness centrality. The network revealed a low density (5.4%), indicating weak connections, but also a high decentralization (0.0079), suggesting a concentration of power and influence within the urban forestry governance in the study region. Overall, a small number of powerful groups dominate a loosely knit social network governance system, and the concentration raises concerns about difficulties in power-sharing and cooperation among the stakeholders.
Specifically, Portland Parks and Recreation (PP&R) emerged as the leading figure in the network, holding the highest degree of centrality and reflecting its extensive connections, power, and influence among relevant stakeholders. Other significant stakeholder organizations include the Portland Fruit Tree Project, Urban Forestry Commission Portland (UFCP), the Portland Clean Energy Fund (PCEF), Depave, Friends of Trees, Families for Climate, Blossom, Honl Tree Care, and Thrive East PDX. These organizations demonstrated high levels of engagement, acting as key facilitators within the network. For advancing an effective governance model, the low density and limited connections in the existing network structure may require these stakeholders—as the most influential actors in the network—to champion a greater level of coherence across the network while expanding governance roles for those sectors that can support canopy targets and general urban forestry goals.
Shifting to a more decentralized and cooperative approach is crucial to overcoming the obstacles presented by the existing governance architecture. This change may entail the adoption of hybrid governance models [32], which promote wider stakeholder participation and context-sensitive decision-making, such as the polycentric, landscape, and mosaic governance models [75] Portland can enhance its urban forestry management and foster more equitable and sustainable outcomes by fostering genuine collaborations among government agencies, private organizations, community groups, and academic institutions. One encouraging example of such cooperative initiatives is the “Connecting Canopies” program, which highlights the potential of network governance to promote positive change in urban forest conservation and extension.
Effective urban forestry management in Portland and other U.S. cities relies heavily on strong collaboration and knowledge-sharing capabilities of among diverse stakeholders. Moving forward, while network governance may face obstacles from conflicting interests among community and interagency stakeholders, transforming governance models at all levels will require developing periodic, collaborative urban forestry management plans to address nature-based planning challenges. These planning documents should strongly emphasize not only the prioritization of tree equity-related regulations but also the optimization of community eco-literacy and awareness through emerging AI technologies such as virtual reality (VR). Immersive simulations demonstrate practical potential for showcasing urban forestry benefits in network governance outreach and consensus-building.
The valuable insights from this study highlight the importance of a highly decentralized governance pattern and a closely connected network to achieve sustainable urban forestry outcomes. By leveraging the strengths of this type of network governance, the city can better address climate stressors, promote a healthier urban ecosystem, and ensure equitable urban forest distribution. Climate change is increasing the incidence and intensity of North America’s heat and flood extremes [76] and the contribution of urban forests is more critical now than ever. Urban forests represent an effective and economical means of sustaining the environmental quality of communities—improving air and water quality directly, moderating temperatures, and bolstering residents’ well-being [77,78]. As municipal managers recognize the value of urban forests, innovative stakeholder outreach and robust governance structures become essential. By the embracement of these frameworks, communities can fully leverage the benefits of newly and existing planted trees in attaining long-term resilience as climate challenges intensify.
Author Contributions
Conceptualization, V.S.; Data curation, Q.O.T.; Formal analysis, Q.O.T.; Funding acquisition, V.S.; Investigation, Q.O.T. and V.S.; Methodology, Q.O.T. and V.S.; Project administration, Q.O.T. and V.S.; Resources, Q.O.T.; Software, Q.O.T.; Supervision, V.S.; Validation, Q.O.T.; Visualization, Q.O.T.; Writing—original draft, Q.O.T.; Writing—review and editing, V.S. and Q.O.T. All authors have read and agreed to the published version of the manuscript.
Funding
This study is funded in part through the National Science Foundation (NSF), Grant number 2010014.
Institutional Review Board Statement
The study was conducted in accordance with Portland State University Institutional Review Board (IRB) guidelines, and the protocol was approved by the HRPP Ethics Committee (approval #238290-18) on 3 January 2024.
Informed Consent Statement
The authors obtained written informed consent from all human participants prior to study enrollment, with signed documentation retained in accordance with IRB requirements.
Data Availability Statement
The raw data supporting the conclusions of this article will be made available by the authors on request.
Acknowledgments
The authors would like to thank Brittany Oxford (Community Assistance Forester, Oregon Department of Forestry), Roman Lara (Research Ecologist, USDA Forest Service), and Stremple Nancy (National UCF Specialist, USDA Forest Service) for their expert input on the survey design. Furthermore, we gratefully acknowledge the peer reviewers for their insightful feedback, which has enhanced the rigor and accessibility of this work.
Conflicts of Interest
The authors declare no conflicts of interest.
Appendix A
Table A1.
List of government agencies invited to participate in the online survey and considered in the social network analysis (SNA).
Table A1.
List of government agencies invited to participate in the online survey and considered in the social network analysis (SNA).
| No. | Stakeholder Organizations | Acronyms on SNA Charts |
|---|---|---|
| 1 | Both BES and Parks (Learning Landscapes) | Learning Landscapes |
| 2 | East Multnomah Soil and Water Conservation District | EMS&WCD |
| 3 | Green Metro | GreenMetro |
| 4 | Multnomah County Sustainability Office | MCSO |
| 5 | Oregon Department of Forestry | ODOF |
| 6 | Port of Portland | Port-Port |
| 7 | Portland Bureau of Development Services (BDS) | BDS |
| 8 | Portland Bureau of Environmental Services (BES) | BES |
| 9 | Portland Bureau of Planning and Sustainability (BPS) | BPS |
| 10 | Portland Bureau of Transportation (PBOT) | PBOT |
| 11 | Portland Clean Energy Fund (within BPS) | Port-CEF |
| 12 | Portland Heritage Tree Committee | Port-HTC |
| 13 | Portland Housing Bureau (PHB) | PHB |
| 14 | Portland Parks and Recreation | PP&R |
| 15 | Prosper Portland, Economic Development Department | Pros-Port |
| 16 | Urban Forestry Commission Portland | UFCP |
| 17 | West Multnomah Soil & Water Conservation District | WMS&WCD |
Table A2.
List of private organizations invited to participate in the online survey and considered in the social network analysis (SNA).
Table A2.
List of private organizations invited to participate in the online survey and considered in the social network analysis (SNA).
| No. | Stakeholder Organizations | Acronyms on SNA Charts |
|---|---|---|
| 1 | 1855 Plants LLC | 1855 |
| 2 | A Plus Tree | A Plus |
| 3 | Abies Tree Care | Abies-TC |
| 4 | Alana Chau Landscape Design | Alana |
| 5 | Amaranth Organic Gardening | Amaranth |
| 6 | Arboriculture Int’l LLC | Arboriculture |
| 7 | Asplundh Vegetation | Asplundh |
| 8 | Backyard Habitat | Backyard |
| 9 | Blessing Landscape | Blessing |
| 10 | Blossom | Blossom |
| 11 | Common Sense Gardens | Common |
| 12 | Creekscape Design | Creekscape |
| 13 | Design Nature Northwest LLC | DN-NW |
| 14 | Design with Nature | D-Nature |
| 15 | D & J Landscape Contractors | D&J |
| 16 | Earth Ecology LLC | Earth-Eco |
| 17 | Ecocity Landscape LLC | EcoCity |
| 18 | Eden’s Gate Landscape Design | Eden’s-G |
| 19 | Elemental Romanticism | E-Roman |
| 20 | Emergent Tree Works | Emergent |
| 21 | Foster Nativescapes | Foster-N |
| 22 | Foster Trees LLC | Foster-T |
| 23 | Gaian Garden LLC | Gaian |
| 24 | Garden Stories | Garden-S |
| 25 | Green green Landscape Studio | GGLS |
| 26 | Habitat Landscape Design LLC | HLD |
| 27 | Harrity Trees | Harrity |
| 28 | Honl Tree Care | Honl |
| 29 | Jwalter Landscape | JWalter |
| 30 | Megan Torrance Landscape | Megan |
| 31 | Native Plantscapes NW LLC | NP-NW |
| 32 | Nature Play Designs | Nature-PD |
| 33 | Nidus Consulting | Nidus |
| 34 | Noble Root | Noble-R |
| 35 | Northwest Native Landscapes LLC | NW-NL |
| 36 | Oregon Tree Care | Oregon-TC |
| 37 | Pacific Power Foundation | Pacific-PF |
| 38 | Patty Freeman Design | Patty |
| 39 | Peach Landscape Designs | Peach |
| 40 | Pest & Pollinator LLC | Pest&P |
| 41 | Plan-it Earth Design | Plan-IT |
| 42 | Plantzy Gardens and Designs | Plantzy |
| 43 | Poppy & Finch | Poppy |
| 44 | Pride+Joy Landscapes | Pride+Joy |
| 45 | Portland General Electric | Port-GC |
| 46 | Prunus | Prunus |
| 47 | Queen Green Gardens LLC | QGG |
| 48 | Rachel’s Landscape Design | Rachel |
| 49 | Radish Gardens | Radish |
| 50 | Resilience Design | Resil-D |
| 51 | Revive Garden PDX | Revive |
| 52 | Rose Brady Keane Landscape Arch. | RoseBrad |
| 53 | Seed Garden Designs | Seed-GD |
| 54 | Studio Wild Landscape Arch. LLC | StudioW |
| 55 | Sweaty Betty Tree Care | SweatyB |
| 56 | SymbiOp Landscaping | SymbiOp |
| 57 | The Green Seed | G-Seed |
| 58 | The Tree Chic | TreeChic |
| 59 | Treecology Inc. | Treecology |
| 60 | Triple Acorn Tree | T-Acorn |
| 61 | Urban Fern Gardening LLC | Urban-F |
| 62 | Urban Village Designs LLC | Urban-V |
| 63 | WestSide Goat Girl, LLC | WestSide |
| 64 | Wild Elder Gardening, LLC | Wild-E |
| 65 | Wild Habitat Contracting, LLC | WildH |
| 66 | Wildscape Gardens, LLC | Wildscape |
| 67 | Wind Thin Tree Service | WTTS |
| 68 | X-Trip, Inc. | X-Trip |
Table A3.
List of community-based organizations invited to participate in the online survey and considered in the social network analysis (SNA).
Table A3.
List of community-based organizations invited to participate in the online survey and considered in the social network analysis (SNA).
| No. | Stakeholder Organizations | Acronyms on SNA Charts |
|---|---|---|
| 1 | 350PDX | 350PDX |
| 2 | Ainsworth Linear Arboretum | Ainsworth |
| 3 | Alameda Beaumont-Wilshire Tree Team | Alam-TT |
| 4 | Albina Tree Team (Boise/Eliot) | Albina-TT |
| 5 | Arbor Lodge Tree Team | Arbor-TT |
| 6 | Asian Pacific American Network of Oregon | Asian-PANO |
| 7 | Bird Alliance of Oregon | Bird-AO |
| 8 | Brentwood-Darlington Tree Team | Brent-TT |
| 9 | Columbia Slough Watershed Council | CSWC |
| 10 | Concordia Tree Team | Concord-TT |
| 11 | Cully Tree Team | Cully-TT |
| 12 | Depave | Depave |
| 13 | Eastmoreland Tree Team | East-TT |
| 14 | Families for Climate | Families4Climate |
| 15 | Friends of Trees | Friends of Trees |
| 16 | Hillsdale Tree Team | Hills-TT |
| 17 | Historic Parkrose | Historic-P |
| 18 | Hoyt Arboretum | Hoyt-A |
| 19 | Humboldt Tree Team | Humb-TT |
| 20 | Irvington Tree Team | Irving-TT |
| 21 | Johnson Creek Watershed Council | JCWC |
| 22 | Kenton Bark and Branch Brigade | KBBB |
| 23 | Kerns Tree Team | Kerns-TT |
| 24 | King-Sabin Tree Team | KingS-TT |
| 25 | Laurelhurst Tree Team | Laurel-TT |
| 26 | Lents/Brentwood-Darlington Tree Team | Lents-TT |
| 27 | Lower Columbia Estuary Partnership | LCEP |
| 28 | Mt Scott-Arleta Tree Team | Mt.Scott-TT |
| 29 | Mt Tabor Tree Team | Mt.Tabor-TT |
| 30 | Multnomah Tree Team | Mult.-TT |
| 31 | Neighbors for clean air | N4CleanAir |
| 32 | Old Town-Chinatown Tree Geeks | ChinaT-TT |
| 33 | OPAL Environmental Justice Oregon | OPAL |
| 34 | Oregon Physicians for Social Responsibility | OP4SR |
| 35 | Oregon Walks | O-Walks |
| 36 | Pacific Northwest ISA | PN-ISA |
| 37 | Parkrose Heights Tree Team | Parkrose-TT |
| 38 | Participatory Budgeting Oregon | PBO |
| 39 | Piedmont Canopy Crew | Pied-CC |
| 40 | Portland Audubon | Port-Audubon |
| 41 | Portland Fruit Tree Project | Port-Fruit Tree |
| 42 | Portsmouth Team | Portsm-TT |
| 43 | Powelhurst-Gilbert Team | Powel-TT |
| 44 | Richmond Team | Rich-TT |
| 45 | Rose City Park Tree Coalition | RoseC-TC |
| 46 | Roseway Team | RoseW-TT |
| 47 | Rosewood Initiative | Rosewood |
| 48 | Sabin Team | Sabin-TT |
| 49 | SAGE | SAGE |
| 50 | St. Johns Team | St.Johns-TT |
| 51 | Small Business Utility Advocates | SBUA |
| 52 | Sullivan’s Gulch Team | Sullivan-TT |
| 53 | Sunnyside Team | Sunnyside-TT |
| 54 | The Blueprint Foundation | Blueprint |
| 55 | The Intertwine Alliance | Intertwine |
| 56 | The Nature conservancy of Oregon | N-Conservancy |
| 57 | The Oregon Public Utility Commission (PUC) | PUC |
| 58 | Thrive East PDX | Thrive-EPDX |
| 59 | Through the Trees Collective | 2TC |
| 60 | Trees for Life Oregon | Tree4LO |
| 61 | Verde | Verde |
| 62 | We Keep Trees Standing | WKTS |
| 63 | Willamette Riverkeeper | WillametteRK |
| 64 | Wisdom of the Elders | W-Elders |
| 65 | Woodlawn Tree Team | Woodlawn-TT |
Table A4.
List of academic communities invited to participate in the online survey and considered in the social network analysis (SNA).
Table A4.
List of academic communities invited to participate in the online survey and considered in the social network analysis (SNA).
| No. | Stakeholder Organizations | Acronyms on SNA Charts |
|---|---|---|
| 1 | Centennial School District | CSD |
| 2 | Clackamas Community College | Clack-CC |
| 3 | David Douglas School District | DDSD |
| 4 | Ecology in Classrooms & Outdoors | Eco-CO |
| 5 | Ecoschool Network | EcoSch |
| 6 | Oregon Green Schools (OGS) | OGS |
| 7 | Parkrose School District | Parkrose-SD |
| 8 | Portland Community College | PCC |
| 9 | Portland Public Schools | Port-PS |
| 10 | Portland State University | PSU |
| 11 | PSU Student Sustainability Centre | PSU-SSC |
| 12 | Reynolds School District | RSD |
Appendix B
The social network analysis (SNA) questionnaire.
Section A: Background Information (This section helps to know the organization name, size, various roles, and the connections that exist among stakeholders in urban forestry in the City of Portland.)
Q1. Please provide the name of the organization you are representing. Your name is not required.
Q2. Title of the respondent?
Q3. Which of the following urban forestry stakeholder categories does your organization belong to? a. government agency (public organization); b. private organization; c. community-based organization (CBO); d. academic community.
Q4. What is the size of the urban forestry unit in your organization? a. 0–100 persons b. from 101 to 1000 persons; c. from 1001 and above.
Q5. Identify the role(s) your organization plays in urban forestry in the City of Portland. (Select all that apply.) The areas of focus include tree planting, maintenance, advocacy, compliance and enforcement, financing, research, and education.
Q6. In what ways does your organization interact with others on urban forestry issues? (Select all that apply.) a. Facilitates networking; b. Exchanges information or knowledge, such as maintenance techniques; c. Shares resources, such as compost and technology transfer; d. Provides consulting services and training; e. Conducts research; f. Engages the community; g. Other activities.
Section B: Connection Information This section provides insights and gives a better understanding of the sociographic patterns that exist among stakeholders in urban forestry within the City of Portland.
Q7. We are requesting that you select one response for every organization on the list. In the next section, there is also an opportunity to cite other organizations that are missing from this list. Collaboration/knowledge sharing (public organizations): Please provide a response for all the entries on the list. We will interpret any response as “I am not aware of this stakeholder.” The scale is interpreted as follows:
1: I am not aware of this stakeholder, and we do not collaborate with them; 2: I am aware of this stakeholder, and my organization does not have any collaboration with them; 3: My organization rarely collaborates with this stakeholder; 4: My organization occasionally collaborates with this stakeholder; 5: My organization often collaborates with this stakeholder; 6: My organization always collaborates with this stakeholder.
Q8. Power Structure (open-ended): Who do you think plays an important role in determining the future of urban forestry in Portland?
Section C: Additional Information (open-ended)
Q9. Please list any organizations (up to 10) and their sector (public, private, and community-based) that you see missing from this list of stakeholders in urban forestry within the City of Portland.
Q10. What motivates you to engage with Portland’s urban forestry?
Appendix C
Table A5.
The urban forestry stakeholder organizations were ranked based on various SNA metric values, utilizing acronyms to ensure clear presentation.
Table A5.
The urban forestry stakeholder organizations were ranked based on various SNA metric values, utilizing acronyms to ensure clear presentation.
| Rank Order | Degree Centrality | In-Degree Centrality | Out-Degree Centrality | Betweenness Centrality |
|---|---|---|---|---|
| 1 | PP&R (120) | PP&R, Friends of Trees (40) | Bird-AO (85) | PP&R (1627.932) |
| 2 | Port-Fruit Tree (95) | BES (34) | PP&R (80) | Blossom (986.486) |
| 3 | UFCP (91) | Port-Fruit Tree (33) | UFCP (66) | Port-Fruit Tree (828.487) |
| 4 | Bird-AO (85) | PBOT (30) | Port-Fruit Tree (62) | UFCP (747.798) |
| 5 | Depave (72) | EMS&WCD (29) | Port-HTC (59) | Honl (642.481) |
| 6 | Port-CEF (66) | CSWC, Learning Landscapes (28) | Depave (50) | PCC (641.279) |
| 7 | Port-HTC (59) | UFCP (25) | Port-CEF (43) | Plan-IT (629.885) |
| 8 | 350PDX (58) | Port-PS, Verde Hoyt-A (24) | Plan-IT, Blossom (40) | Depave (357.485) |
| 9 | CSWC, Tree4LO (56) | Port-CEF, BPS, PSU (23) | Families4Climate (38) | Clack-CC (229.172) |
| 10 | BPS, Families4Climate (51) | Depave (22) | Emergent (37) | CSWC (225.080) |
| 11 | ODOF (49) | PCC, BDS (21) | Tree4LO (36) | WMS&WCD (210.471) |
| 12 | Thrive-EPDX, O-Walks, Plan-IT (46) | Tree4LO, ODOF (20) | Thrive-EPDX (34) | Resil-D (201.275) |
| 13 | Port-PS, Blossom (45) | JCWC, W-Elders, Asian-PANO (18) | 350PDX, O-Walks (33) | Port-PS (187.457) |
| 14 | Intertwine, WMS&WCD (44) | Clack-CC, Port-GC SymbiOp (17) | ODOF (29) | Port-CEF (179.992) |
| 15 | Emergent (41) | Intertwine, N-Conservancy, Honl, MCSO (16) | CSWC, BPS, Intertwine (28) | 350PDX (163.099) |
| 16 | Friends of Trees, N-Conservancy (40) | Families4Climate, O-Walks, PN-ISA (13) | Rachel (27) | Foster-T (148.774) |
| 17 | JCWC (39) | Thrive-EPDX (12) | Historic-P (25) | Radish (148.659) |
| 18 | Honl, N4CleanAir (38) | Pros-Port, Metro (11) | WMS&WCD, N-Conservancy (24) | TreeChic (126.101) |
| 19 | Clack-CC (36) | Arbor-TT, OPAL, Nidus, Arboriculture (10) | Honl (22) | BPS (118.143) |
| 20 | BES (34) | N4CleanAir, Parkrose-SD, LCEP, Cully-TT, Prunus (9) | Port-PS (21) | Emergent (110.006) |
References
- Grimmett, R.; Zarin, D.; Baldwin-Cantello, W. Trillion Trees: Forest Protection and High Quality Restoration for People, Nature, and Climate. Impact Report. 2024. Available online: https://trilliontrees.org/wp-content/uploads/2025/03/TT-Impact-Report-2024.pdf (accessed on 11 April 2025).
- Oikonomaki, E.; Papadaki, I.; Kakderi, C. Promoting Green Transformations through Smart Engagement: An Assessment of 100 Citizen-Led Urban Greening Projects. Land 2024, 13, 556. [Google Scholar] [CrossRef]
- Nowak, D.J.; Greenfield, E.J. Declining Urban and Community Tree Cover in the United States. Urban For. Urban Green. 2018, 32, 32–55. [Google Scholar] [CrossRef]
- Sustainable Urban Forest Guide, Davey Institute. 2016. Available online: https://vibrantcitieslab.com/resources/tree-canopy-goals-for-us-cities/ (accessed on 11 August 2024).
- Nowak, D.J.; Greenfield, E.J. US Urban Forest Statistics, Values, and Projections. J. For. 2018, 116, 164–177. [Google Scholar] [CrossRef]
- Chuang, W.-C.; Boone, C.G.; Locke, D.H.; Grove, J.M.; Whitmer, A.; Buckley, G.; Zhang, S. Tree Canopy Change and Neighborhood Stability: A Comparative Analysis of Washington, D.C. and Baltimore, MD. Urban For. Urban Green. 2017, 27, 363–372. [Google Scholar] [CrossRef]
- Rocha, P.I.D.O.; Dantas, A.P.X.; Santos, C.A.G.; Da Silva, R.M. Assessing Urban Forest Decline and Predicting Future Expansion: A Spatial Analysis and Modeling Approach in João Pessoa City, Brazil. Model. Earth Syst. Environ. 2024, 10, 3923–3940. [Google Scholar] [CrossRef]
- Ock, Y.; Shandas, V.; Ribeiro, F.; Young, N. Drivers of Tree Canopy Loss in a Mid-Sized Growing City: Case Study in Portland, OR (USA). Sustainability 2024, 16, 1803. [Google Scholar] [CrossRef]
- Hanson, H.I.; Olsson, J.A. Uptake and Use of Biodiversity Offsetting in Urban Planning—The Case of Sweden. Urban For. Urban Green. 2023, 80, 127841. [Google Scholar] [CrossRef]
- Jombo, S.; Adelabu, S. Evaluating Landsat-8, Landsat-9 and Sentinel-2 Imageries in Land Use and Land Cover (LULC) Classification in a Heterogeneous Urban Area. GeoJournal 2023, 88, 377–399. [Google Scholar] [CrossRef]
- Kukkonen, M.O.; Khamis, M.; Muhammad, M.J.; Käyhkö, N.; Luoto, M. Modeling Direct Above-Ground Carbon Loss Due to Urban Expansion in Zanzibar City Region, Tanzania. Land Use Policy 2022, 112, 105810. [Google Scholar] [CrossRef]
- Nardone, A.; Casey, J.A.; Morello-Frosch, R.; Mujahid, M.; Balmes, J.R.; Thakur, N. Associations between Historical Residential Redlining and Current Age-Adjusted Asthma Emergency Department-Visit Rates across Eight Cities of California: An Ecological Study. Lancet Planet. Health 2020, 4, e24–e31. [Google Scholar] [CrossRef]
- Locke, D.H.; Hall, B.; Grove, J.M.; Pickett, S.T.A.; Ogden, L.A.; Aoki, C.; Boone, C.G.; O’Neil-Dunne, J.P.M. Residential Housing Segregation and Urban Tree Canopy in 37 US Cities. NPJ Urban Sustain 2021, 1, 1–9. [Google Scholar] [CrossRef]
- Hoffman, J.S.; Shandas, V.; Pendleton, N. The Effects of Historical Housing Policies on Resident Exposure to Intra-Urban Heat: A Study of 108 US Urban Areas. Climate 2020, 8, 12. [Google Scholar] [CrossRef]
- Watkins, S.L.; Gerrish, E. The Relationship between Urban Forests and Race: A Meta-Analysis. J. Environ. Manag. 2018, 209, 152–168. [Google Scholar] [CrossRef] [PubMed]
- Schwarz, K.; Berland, A.; Herrmann, D.L. Green, but Not Just? Rethinking Environmental Justice Indicators in Shrinking Cities. Sustain. Cities Soc. 2018, 41, 816–821. [Google Scholar] [CrossRef]
- Fahey, R.T.; Casali, M. Distribution of Forest Ecosystems over Two Centuries in a Highly Urbanized Landscape. Landsc. Urban Plan. 2017, 164, 13–24. [Google Scholar] [CrossRef]
- Roman, L.A.; Pearsall, H.; Eisenman, T.S.; Conway, T.M.; Fahey, R.T.; Landry, S.; Vogt, J.; van Doorn, N.S.; Grove, J.M.; Locke, D.H.; et al. Human and Biophysical Legacies Shape Contemporary Urban Forests: A Literature Synthesis. Urban For. Urban Green. 2018, 31, 157–168. [Google Scholar] [CrossRef]
- Hilbert, D.; Roman, L.; Koeser, A.K.; Vogt, J.; Doorn, N.S.V. Urban Tree Mortality: A Literature Review. Arboric. Urban For. 2018, 45, 167–200. [Google Scholar] [CrossRef]
- Breger, B.S.; Eisenman, T.S.; Kremer, M.E.; Roman, L.A.; Martin, D.G.; Rogan, J. Urban Tree Survival and Stewardship in a State-Managed Planting Initiative: A Case Study in Holyoke, Massachusetts. Urban For. Urban Green. 2019, 43, 126382. [Google Scholar] [CrossRef]
- Riedman, E.; Roman, L.A.; Pearsall, H.; Maslin, M.; Ifill, T.; Dentice, D. Why Don’t People Plant Trees? Uncovering Barriers to Participation in Urban Tree Planting Initiatives. Urban For. Urban Green. 2022, 73, 127597. [Google Scholar] [CrossRef]
- Heynen, N.; Perkins, H.A.; Roy, P. The Political Ecology of Uneven Urban Green Space: The Impact of Political Economy on Race and Ethnicity in Producing Environmental Inequality in Milwaukee. Urban Aff. Rev. 2006, 42, 3–25. [Google Scholar] [CrossRef]
- Byrne, J. When Green Is White: The Cultural Politics of Race, Nature and Social Exclusion in a Los Angeles Urban National Park. Geoforum 2012, 43, 595–611. [Google Scholar] [CrossRef]
- Campbell, L.K.; Gabriel, N. Power in Urban Social-Ecological Systems: Processes and Practices of Governance and Marginalization. Urban For. Urban Green. 2016, 19, 253–254. [Google Scholar] [CrossRef]
- Ernstson, H.; Barthel, S.; Andersson, E.; Borgström, S. Scale-Crossing Brokers and Network Governance of Urban Ecosystem Services: The Case of Stockholm. Ecol. Soc. 2010, 15. [Google Scholar] [CrossRef]
- Cadaval, S.; Clarke, M.; Dinkins, L.; Klein, R.W.; Roberts, J.W.; Yang, Q. Why Can’t We All Just Get Along? Conflict and Collaboration in Urban Forest Management. Arboric. Urban For. (AUF) 2024, 50, 346–364. [Google Scholar] [CrossRef]
- USDA. Biden-Harris Administration Announces Historic Funding to Expand Access to Trees and Green Spaces in Disadvantaged Urban Communities. 2023. Available online: https://www.usda.gov/media/press-releases/2023/04/12/biden-harris-administration-announces-historic-funding-expand (accessed on 14 April 2024).
- Spike, E.; Spike, J.P. Ethical Principles for Ecology and Environmental Ethics: What Ecology Can Learn about Applied Ethics from Biomedical Ethics. Earth Steward. 2024, 1, e70000. [Google Scholar] [CrossRef]
- Andersson, E.; Kronenberg, J.; Cvejić, R.; Elmqvist, T.; Pintar, M. Integrating Green Infrastructure Ecosystem Services into Real Economies. Cph. Univ. Cph. 2015, 53. [Google Scholar]
- Lawrence, A.; De Vreese, R.; Johnston, M.; Konijnendijk van den Bosch, C.C.; Sanesi, G. Urban Forest Governance: Towards a Framework for Comparing Approaches. Urban For. Urban Green. 2013, 12, 464–473. [Google Scholar] [CrossRef]
- Biernacka, M.; Kronenberg, J. Classification of Institutional Barriers Affecting the Availability, Accessibility and Attractiveness of Urban Green Spaces. Urban For. Urban Green. 2018, 36, 22–33. [Google Scholar] [CrossRef]
- Ordóñez, C.; Threlfall, C.G.; Kendal, D.; Hochuli, D.F.; Davern, M.; Fuller, R.A.; van der Ree, R.; Livesley, S.J. Urban Forest Governance and Decision-Making: A Systematic Review and Synthesis of the Perspectives of Municipal Managers. Landsc. Urban Plan. 2019, 189, 166–180. [Google Scholar] [CrossRef]
- Scholz, J.T.; Wang, C. Cooptation or Transformation? Local Policy Networks and Federal Regulatory Enforcement. Am. J. Political Sci. 2006, 50, 81–97. [Google Scholar] [CrossRef]
- Olsson, P.; Folke, C.; Hughes, T.P. Navigating the Transition to Ecosystem-Based Management of the Great Barrier Reef, Australia. Proc. Natl. Acad. Sci. USA 2008, 105, 9489–9494. [Google Scholar] [CrossRef] [PubMed]
- Sekulova, F.; Anguelovski, I.; Kiss, B.; Kotsila, P.; Baró, F.; Palgan, Y.; Connolly, J. The Governance of Nature-Based Solutions in the City at the Intersection of Justice and Equity. Cities 2021, 112, 103136. [Google Scholar] [CrossRef]
- Konijnendijk, C.C.; Nesbitt, L.; Wirtz, Z. Urban Forest Governance in the Face of Pulse Disturbances—Canadian Experiences. Arboric. Urban For. (AUF) 2021, 47, 267–283. [Google Scholar] [CrossRef]
- Otte, E.; Rousseau, R. Social Network Analysis: A Powerful Strategy, Also for the Information Sciences. J. Inf. Sci. 2002, 28, 441–453. [Google Scholar] [CrossRef]
- Corlew, L.K.; Keener, V.; Finucane, M.; Brewington, L.; Nunn-Crichton, R. Using Social Network Analysis to Assess Communications and Develop Networking Tools among Climate Change Professionals across the Pacific Islands Region. Psychosoc. Interv. 2015, 24, 133–146. [Google Scholar] [CrossRef]
- Knoke, D.; Yang, S. Social Network Analysis; SAGE Publications, Inc.: Thousand Oaks, CA, USA, 2008. [Google Scholar] [CrossRef]
- Newman, M. Networks; Oxford University Press: Oxford, UK, 2010. [Google Scholar] [CrossRef]
- Multnomah County. Commissioner District Look-Up. Available online: https://multco.maps.arcgis.com/apps/webappviewer (accessed on 11 July 2024).
- Certified Population Estimates. 2023. Available online: www.pdx.edu/population-research/population-estimate-reports (accessed on 15 November 2024).
- US Census. In Quick Facts; US Census: Portland City, OR, USA, 2022. Available online: https://www.census.gov/ (accessed on 2 August 2024).
- Wiewel, W.; Kafoury, D. The Portland Plan; Bureau of Planning and Sustainability, City of Portland: Portland, OR, USA, 2012. Available online: https://www.portland.gov/bps/planning/documents/portland-plan/download (accessed on 14 August 2024).
- Ahmed, S.K. How to Choose a Sampling Technique and Determine Sample Size for Research: A Simplified Guide for Researchers. Oral Oncol. Rep. 2024, 12, 100662. [Google Scholar] [CrossRef]
- Agneessens, F.; Labianca, G. Collecting Survey-Based Social Network Information in Work Organizations. Soc. Netw. 2022, 68, 31–47. [Google Scholar] [CrossRef]
- Dillman, D.A.; Smyth, J.D.; Christian, L.M. Internet, Phone, Mail, and Mixed-Mode Surveys: The Tailored Design Method, 4th ed.; Wiley: Hoboken, NJ, USA, 2014. [Google Scholar]
- Tabassum, S.; Pereira, F.S.F.; Fernandes, S.; Gama, J. Social Network Analysis: An Overview. WIREs Data Min Knowl 2018, 8, e1256. [Google Scholar] [CrossRef]
- Newman, M.E.J. Analysis of Weighted Networks. Phys. Rev. E 2004, 70, 056131. [Google Scholar] [CrossRef]
- Zedan, S.; Miller, W. Using Social Network Analysis to Identify Stakeholders’ Influence on Energy Efficiency of Housing. Int. J. Eng. Bus. Manag. 2017, 9, 184797901771262. [Google Scholar] [CrossRef]
- Mosleh, L.; Yore, M.; Wells, W.; Eisenman, D.P.; Schwarz, K. A Social Network Analysis of Cross-Organizational Engagement for Urban Heat Resilience in Los Angeles County, California. Urban Clim. 2024, 53, 101797. [Google Scholar] [CrossRef]
- McCann, H.; Fünfgeld, H.; Brown, J.; Wylie, R. Social Networks and Disaster Resilience: An Introduction; Report Prepared for the Enhancing Networks for Resilience Project; Southern Grampians Glenelg Primary Care Partnership: Hamilton, VIC, Australia, 2016; Available online: https://sggpcp.com/wp-content/uploads/2015/11/Social-Networks-and-Disaster-Resilience.-An-introduction..pdf (accessed on 24 April 2024).
- Newman, M.E.J.; Leicht, E.A. Mixture Models and Exploratory Analysis in Networks. Proc. Natl. Acad. Sci. USA 2007, 104, 9564–9569. [Google Scholar] [CrossRef]
- Bhattacharya, S.; Sinha, S.; Dey, P.; Saha, A.; Chowdhury, C.; Roy, S. Chapter 5—Online Social-Network Sensing Models. In Computational Intelligence Applications for Text and Sentiment Data Analysis; Das, D., Kolya, A.K., Basu, A., Sarkar, S., Eds.; Hybrid Computational Intelligence for Pattern Analysis and Understanding; Academic Press: Cambridge, MA, USA, 2023; pp. 113–140. [Google Scholar] [CrossRef]
- Hanneman, R.; Riddle, M. Chapter 10: Centrality and power. In Introduction to Social Network Methods; Research Gate, University of California: Oakland, CA, USA, 2005. [Google Scholar]
- Lockwood, M. Good Governance for Terrestrial Protected Areas: A Framework, Principles and Performance Outcomes. J. Environ. Manag. 2010, 91, 754–766. [Google Scholar] [CrossRef]
- Eagles, P.F.J. Governance Models for Parks, Recreation, and Tourism. In Transforming Parks and Protected Areas; Routledge: London, UK, 2007; Available online: https://www.taylorfrancis.com/chapters/edit/10.4324/9780203961902-9/governance-models-parks-recreation-tourism-paul-eagles (accessed on 24 April 2024).
- Abbassinia, M.; Kalatpour, O.; Motamedzade, M.; Soltanian, A.; Mohammadfam, I.; Ganjipour, M.; Khodabandehloo, L. Social network analysis approach to analysis of emergency management team performance. Iran Occup. Health 2021, 18, 89–101. [Google Scholar] [CrossRef]
- Kim, J.; Hastak, M. Social Network Analysis: Characteristics of Online Social Networks after a Disaster. Int. J. Inf. Manag. 2018, 38, 86–96. [Google Scholar] [CrossRef]
- Chen, C.; Matzdorf, B.; Zhen, L.; Schröter, B. Social-Network Analysis of Local Governance Models for China’s Eco-Compensation Program. Ecosyst. Serv. 2020, 45, 101191. [Google Scholar] [CrossRef]
- Shakeel, T.; Conway, T.M. Individual Households and Their Trees: Fine-Scale Characteristics Shaping Urban Forests. Urban For. Urban Green. 2014, 13, 136–144. [Google Scholar] [CrossRef]
- Abbasi, A.; Kapucu, N. A Longitudinal Study of Evolving Networks in Response to Natural Disaster. Comput. Math. Organ. Theory 2016, 22, 47–70. [Google Scholar] [CrossRef]
- Scott, J. Social Network Analysis: A Handbook, 2nd ed.; SAGE Publications: London, UK; Thousands Oaks, CA, USA, 2000. [Google Scholar]
- Es’haghi, S.R.; Rezaei, A.; Karimi, H.; Ataei, P. Institutional Analysis of Organizations Active in the Restoration of Lake Urmia: The Application of the Social Network Analysis Approach. Hydrol. Sci. J. 2022, 67, 328–341. [Google Scholar] [CrossRef]
- Carmichael, C.E.; McDonough, M.H. The Trouble with Trees? Social and Political Dynamics of Street Tree-Planting Efforts in Detroit, Michigan, USA. Urban For. Urban Green. 2018, 31, 221–229. [Google Scholar] [CrossRef]
- Berahmand, K.; Bouyer, A.; Samadi, N. A New Local and Multidimensional Ranking Measure to Detect Spreaders in Social Networks. Computing 2019, 101, 1711–1733. [Google Scholar] [CrossRef]
- Muñoz-Erickson, T.A.; Campbell, L.K.; Childers, D.L.; Grove, J.M.; Iwaniec, D.M.; Pickett, S.T.A.; Romolini, M.; Svendsen, E.S. Demystifying Governance and Its Role for Transitions in Urban Social–Ecological Systems. Ecosphere 2016, 7, e01564. [Google Scholar] [CrossRef]
- Crona, B.; Bodin, Ö. WHAT You Know Is WHO You Know?—Communication Patterns among Resource Users as a Prerequisite for Co-Management. Ecol. Soc. 2006, 11, 7. [Google Scholar] [CrossRef]
- Isaac, M.E.; Erickson, B.H.; Quashie-Sam, S.J.; Timmer, V.R. Transfer of Knowledge on Agroforestry Management Practices: The Structure of Farmer Advice Networks. Ecol. Soc. 2007, 12, art32. [Google Scholar] [CrossRef]
- Schusler, T.; Pfeffer, M. Social Learning for Collaborative Natural Resource Management. Soc. Nat. Resour. 2003, 16, 309–326. [Google Scholar] [CrossRef]
- Carlsson, C.; Hyvönen, K.; Repo, P.; Walden, P. Asynchronous Adoption Patterns of Mobile Services. In Proceedings of the 38th Annual Hawaii International Conference on System Sciences, Big Island, HI, USA, 6 January 2005. [Google Scholar] [CrossRef]
- Carlsson, L.; Sandström, A. Network Governance of the Commons. Int. J. Commons 2008, 2, 33–54. [Google Scholar] [CrossRef]
- Dietz, T.; Ostrom, E.; Stern, P.C. The Struggle to Govern the Commons. Science 2003, 302, 1907–1912. [Google Scholar] [CrossRef] [PubMed]
- Driscoll, A.N.; Ries, P.D.; Tilt, J.H.; Ganio, L.M. Needs and Barriers to Expanding Urban Forestry Programs: An Assessment of Community Officials and Program Managers in the Portland—Vancouver Metropolitan Region. Urban For. Urban Green. 2015, 14, 48–55. [Google Scholar] [CrossRef]
- Buijs, A.E.; Mattijssen, T.J.; Van der Jagt, A.P.; Ambrose-Oji, B.; Andersson, E.; Elands, B.H.; Steen Møller, M. Active Citizenship for Urban Green Infrastructure: Fostering the Diversity and Dynamics of Citizen Contributions Through Mosaic Governance. Curr. Opin. Environ. Sustain. 2016, 22, 1–6. [Google Scholar] [CrossRef]
- Knight, T.; Price, S.; Bowler, D.; Hookway, A.; King, S.; Konno, K.; Richter, R.L. How Effective Is ‘Greening’ of Urban Areas in Reducing Human Exposure to Ground-Level Ozone Concentrations, UV Exposure and the ‘Urban Heat Island Effect’? An Updated Systematic Review. Environ. Evid. 2021, 10, 12. [Google Scholar] [CrossRef]
- Tamaskani Esfehankalateh, A.; Ngarambe, J.; Yun, G.Y. Influence of Tree Canopy Coverage and Leaf Area Density on Urban Heat Island Mitigation. Sustainability 2021, 13, 7496. [Google Scholar] [CrossRef]
- Intergovernmental Panel on Climate Change (IPCC). Climate Change 2021—The Physical Science Basis: Working Group I Contribution to the Sixth Assessment Report of the Intergovernmental Panel on Climate Change, 1st ed.; Cambridge University Press: Cambridge, UK, 2023. [Google Scholar] [CrossRef]
Disclaimer/Publisher’s Note: The statements, opinions and data contained in all publications are solely those of the individual author(s) and contributor(s) and not of MDPI and/or the editor(s). MDPI and/or the editor(s) disclaim responsibility for any injury to people or property resulting from any ideas, methods, instructions or products referred to in the content. |
© 2025 by the authors. Licensee MDPI, Basel, Switzerland. This article is an open access article distributed under the terms and conditions of the Creative Commons Attribution (CC BY) license (https://creativecommons.org/licenses/by/4.0/).