
The Influencing Mechanism and Spatial Effect of the Digital Economy on Agricultural Carbon Emissions


Abstract
1. Introduction
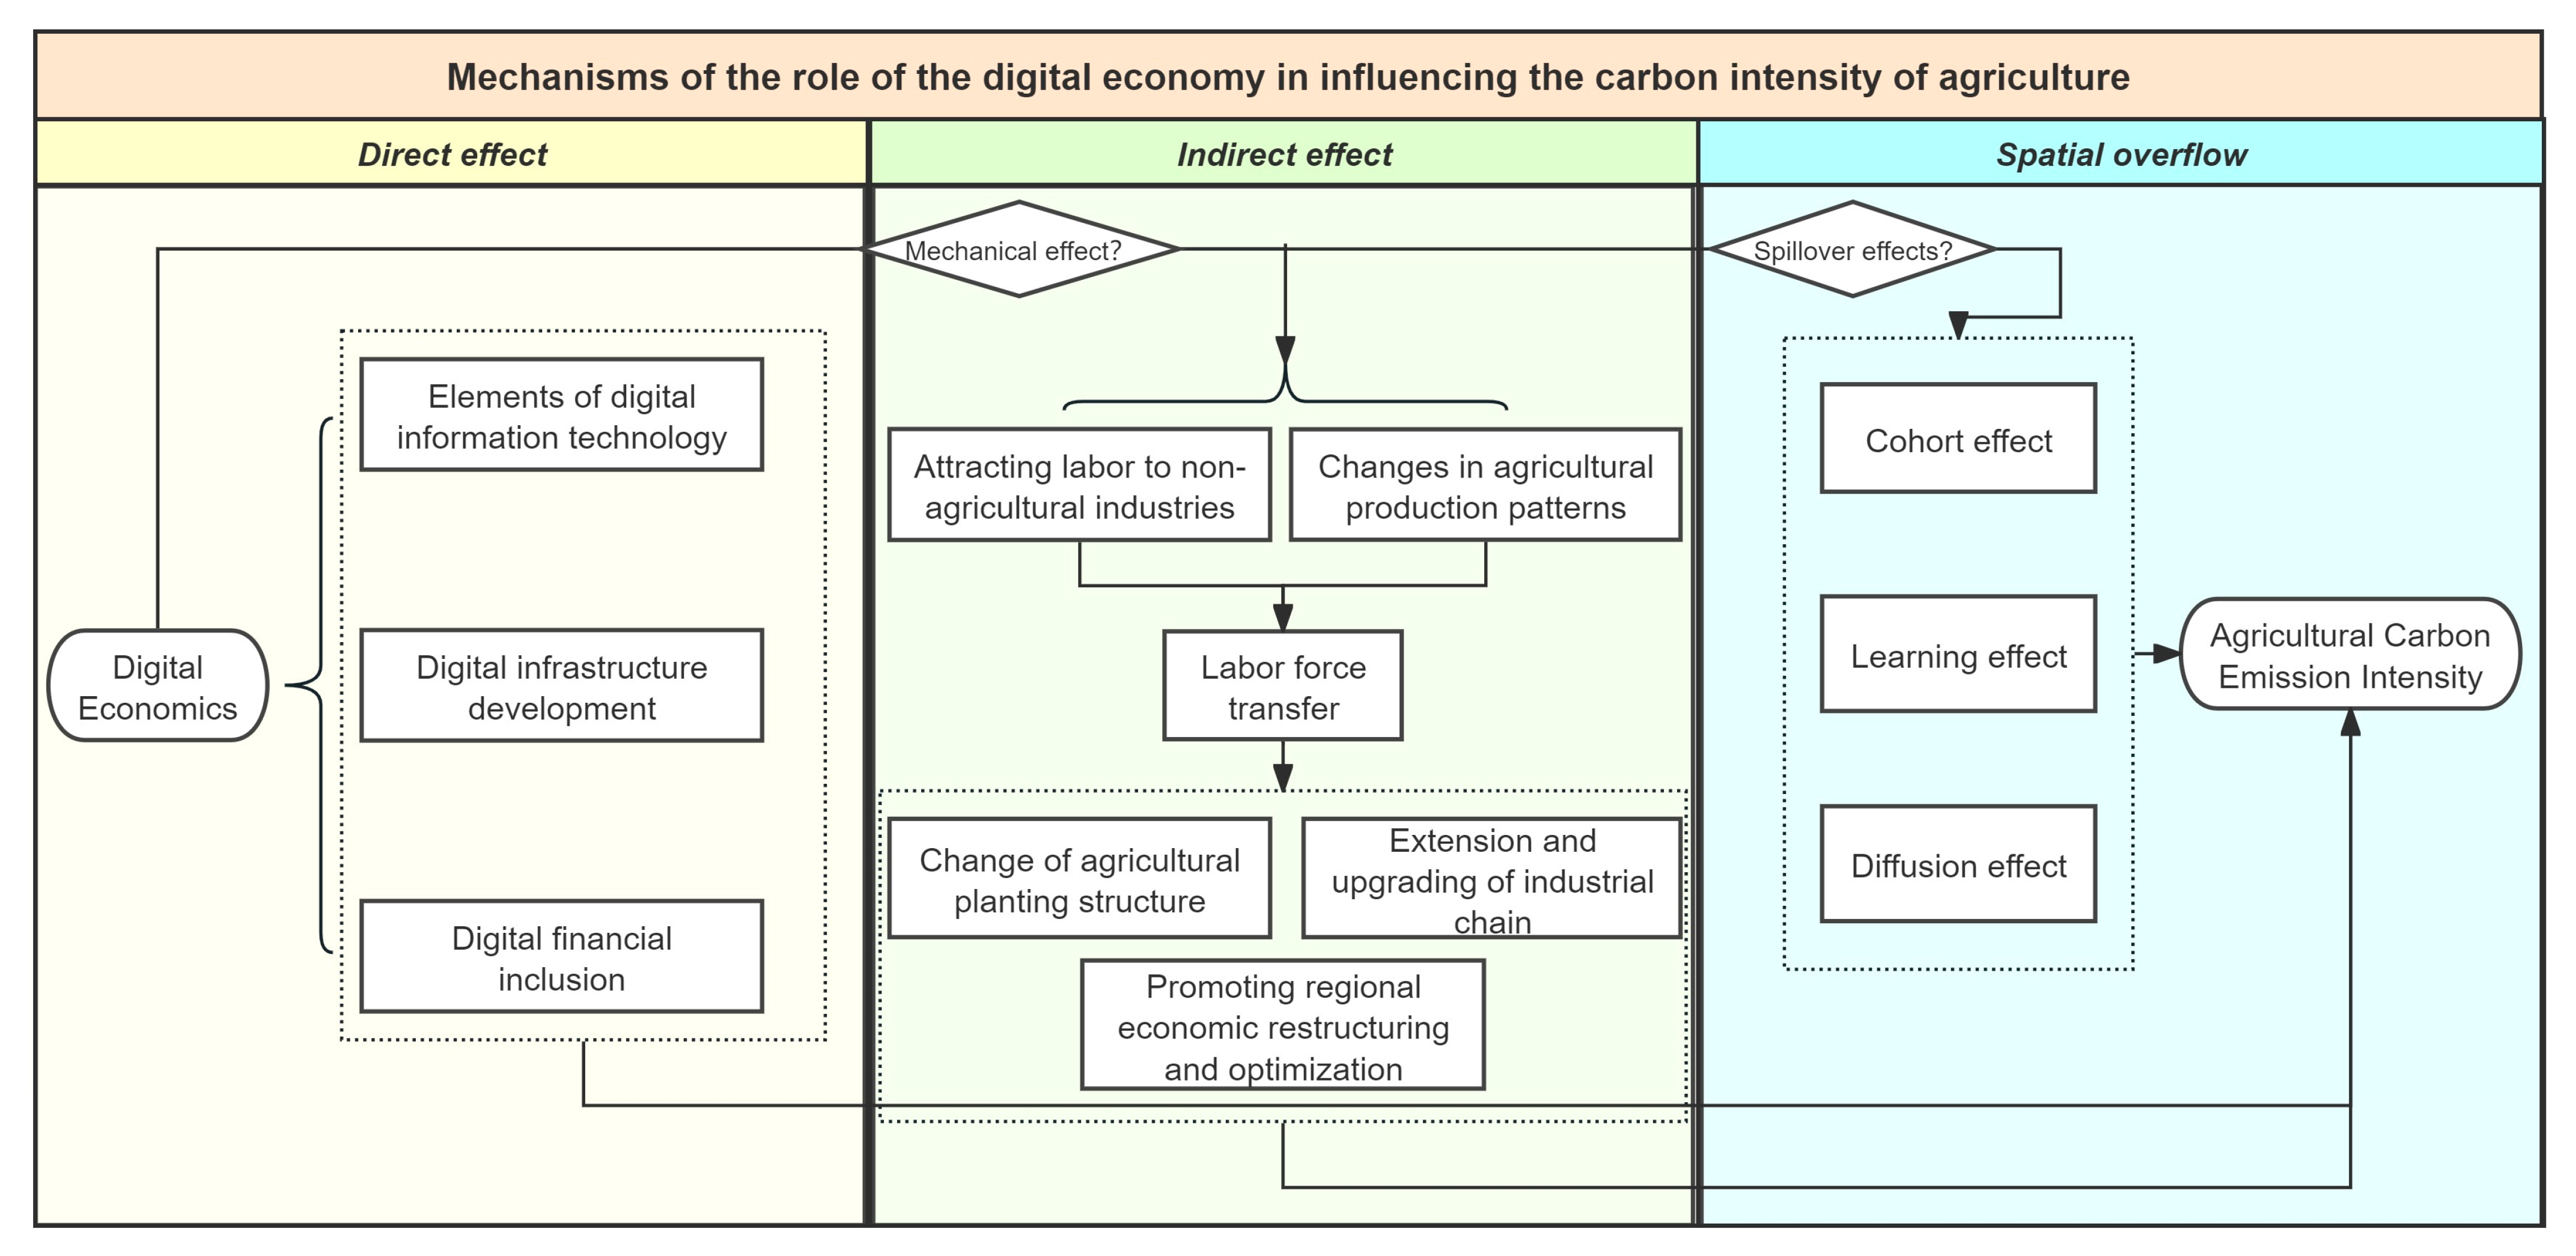
2. Theoretical Analysis and Research Hypotheses
3. Research Design
3.1. Variable Selection and Measurement
3.1.1. Dependent Variable: Agricultural Carbon Emission Intensity (Aci)

| Carbon Sources | Carbon Emission Coefficients | Reference Sources |
|---|---|---|
| Agricultural diesel | 0.59 kg/kg | IPCC2013 |
| Agricultural fertilizers | 0.89 kg/kg | Oak Ridge National Laboratory, Oak Ridge, TN, USA |
| Pesticides | 4.93 kg/kg | Oak Ridge National Laboratory, Oak Ridge, TN, USA |
| Agricultural film | 5.18 kg/kg | Institute of Resources, Ecology and Environment of Agriculture, Nanjing Agricultural University, Nanjing, China |
| Agricultural irrigation | 266.48 kg/hm2 | Duan Huaping et al. [46] |
| Plowing | 312.60 kg/km2 | Li Bo et al. [44] |
3.1.2. Core Explanatory Variable: Digital Economy Development Level (Digl)
3.1.3. Mediating Variable: Labor Transfer (It)
3.1.4. Control Variables
3.1.5. Other Variables
3.2. Model Construction
3.2.1. Baseline Model
3.2.2. Mediating Effect Model
3.2.3. Lagged Model
3.2.4. Spatial Econometric Model
3.3. Data Sources and Statistical Description
4. Research Results and Analysis
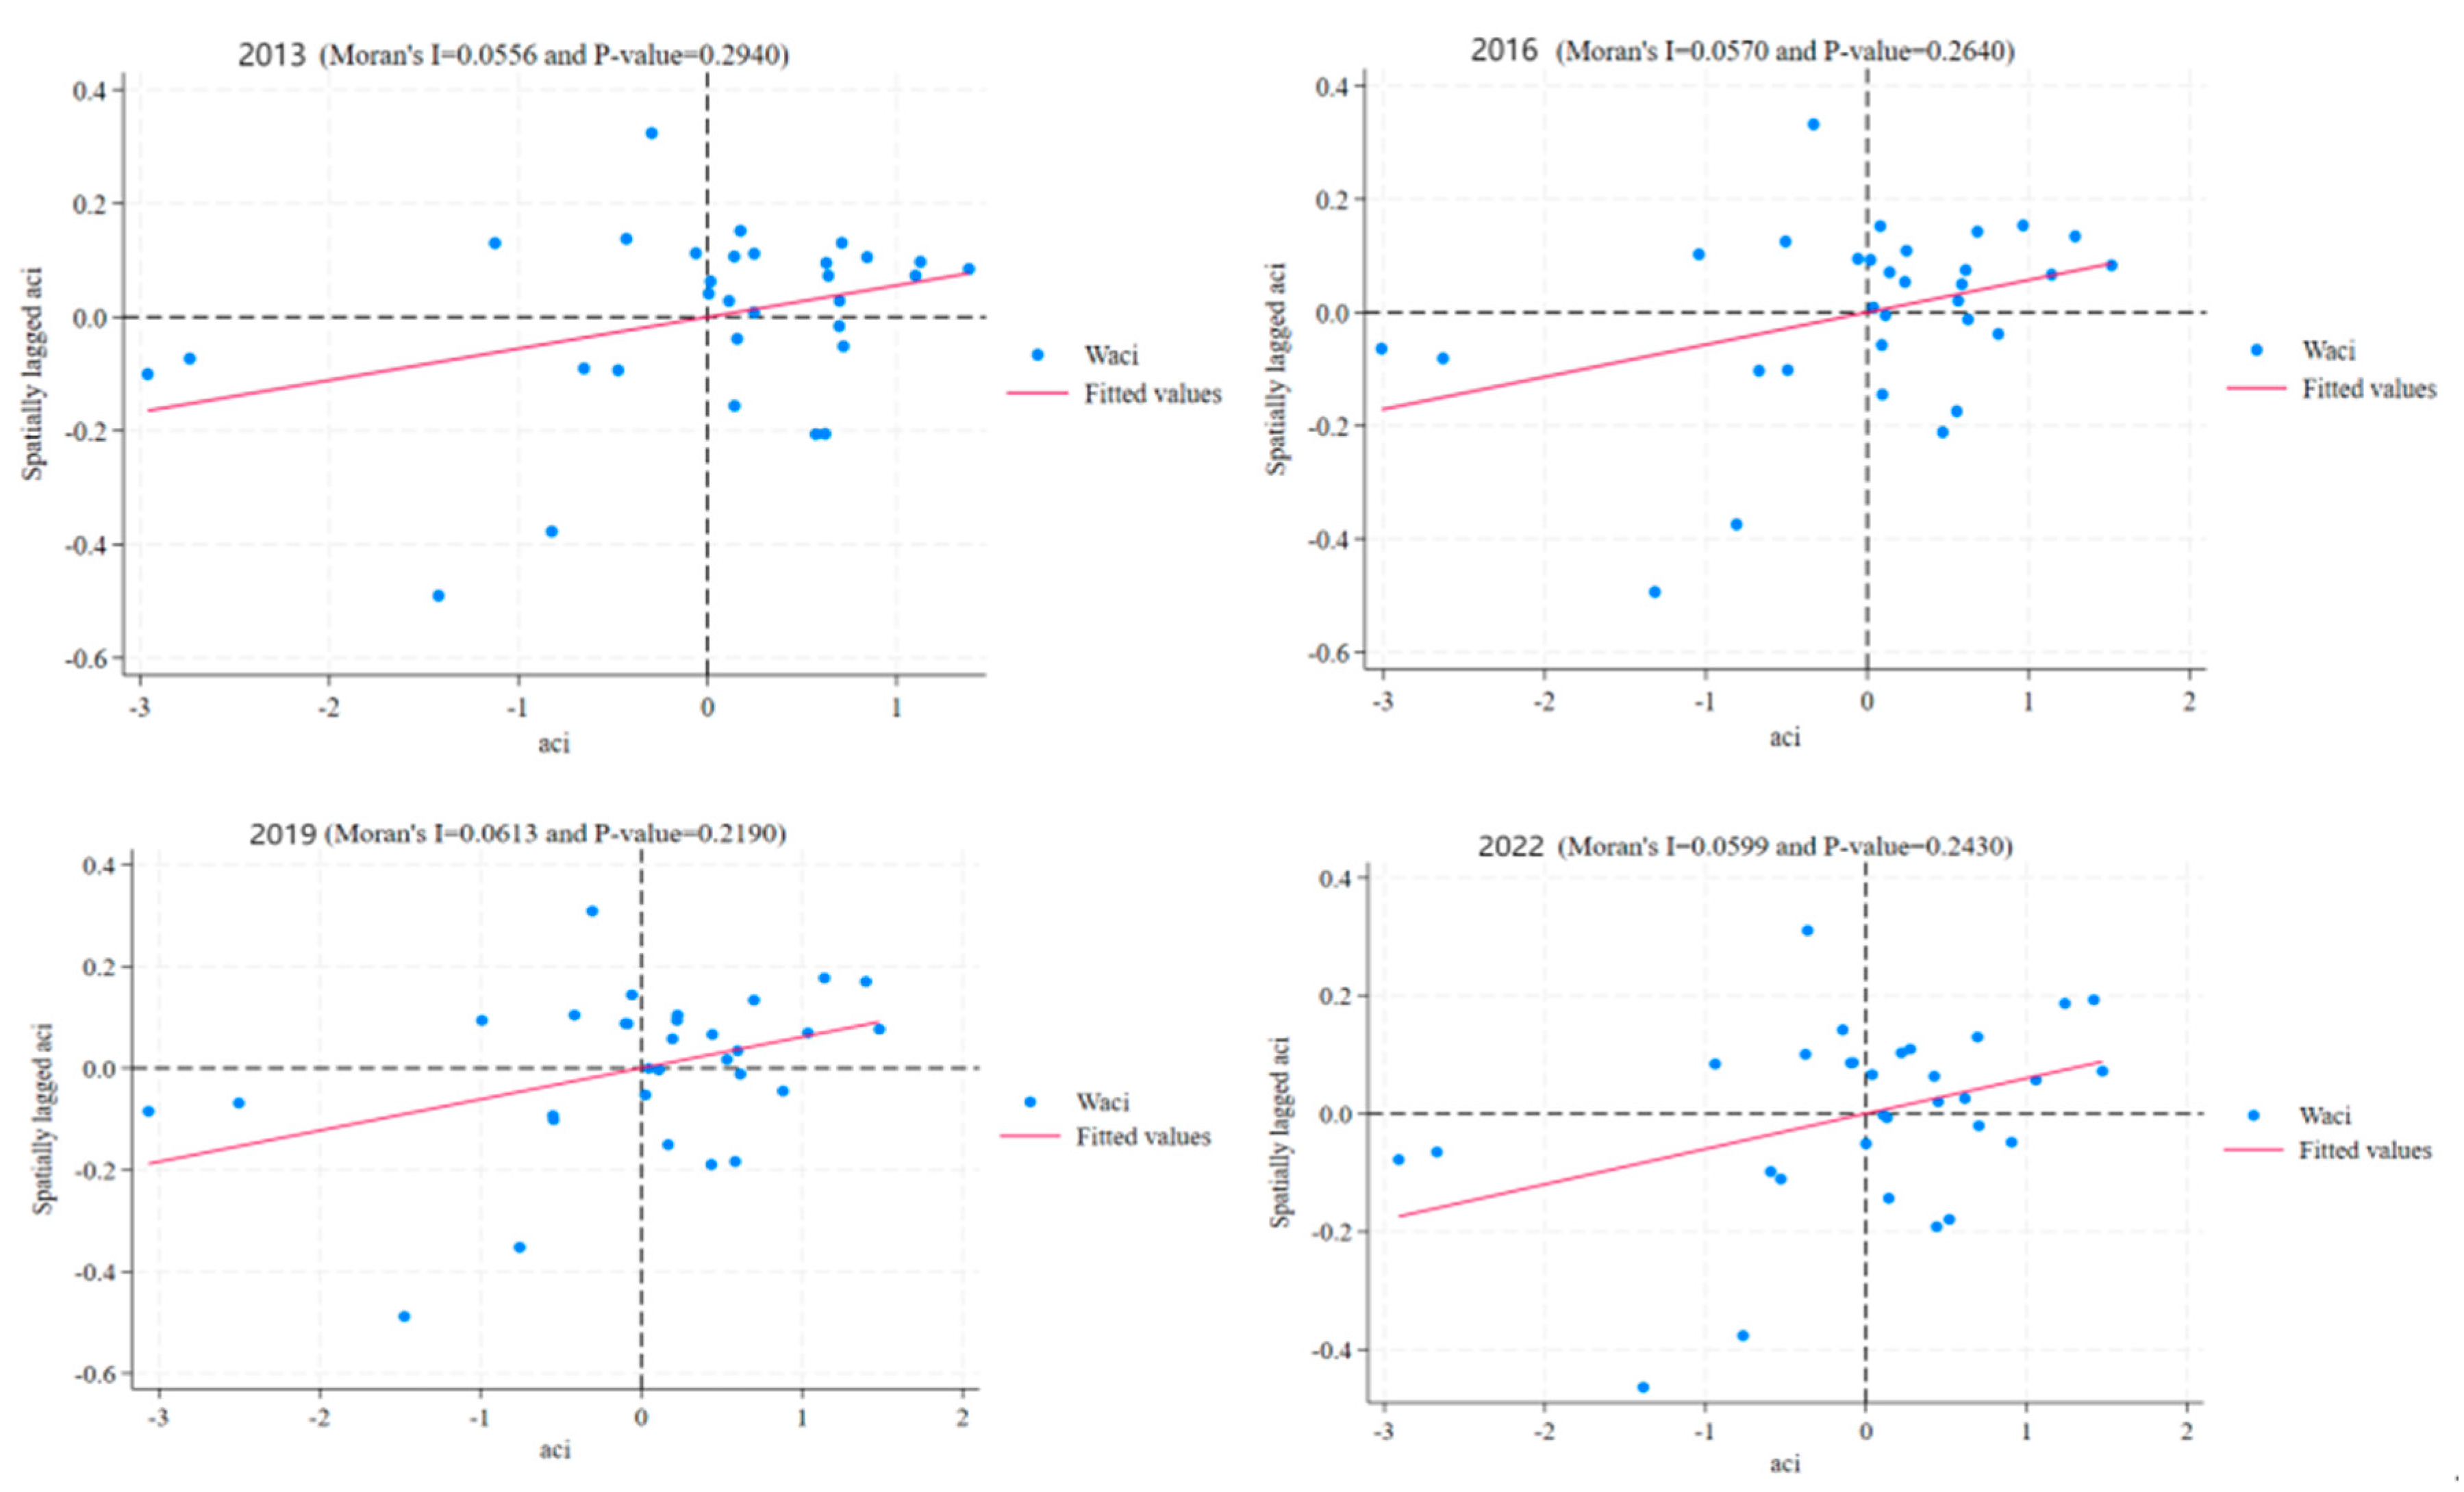
4.1. Analysis of Trends in Agricultural Carbon Emissions in Time and Space
4.2. Analysis of Baseline Regression
4.3. Robustness Test
4.3.1. Replacement of Dependent Variables
4.3.2. Add Control Variables
4.3.3. Endogeneity Test
4.3.4. Extension of the Time Window
4.4. Instrumental Variable Method
4.5. Mediating Effect Test
4.6. Spatial Spillover Effect Analysis
4.6.1. Spatial Effect Decomposition
4.6.2. Robustness Tests
4.6.3. Heterogeneity Analysis
5. Research Conclusions and Suggestions
Author Contributions
Funding
Institutional Review Board Statement
Informed Consent Statement
Data Availability Statement
Conflicts of Interest
References
- Ke, S.; Wu, Y.; Cui, H.; Lu, X. The mechanisms and spatial-temporal effects of farmland spatial transition on agricultural carbon emission: Based on 2018 counties in China. Environ. Sci. Pollut. Res. Int. 2023, 30, 107716–107732. [Google Scholar] [CrossRef] [PubMed]
- Yang, N.; Sun, X.; Qi, Q. Impact of factor quality improvement on agricultural carbon emissions: Evidence from China’s high-standard farmland. Front. Environ. Sci. 2022, 10, 989684. [Google Scholar] [CrossRef]
- Wang, L.; Vo, X.V.; Shahbaz, M.; Ak, A. Globalization and carbon emissions: Is there any role of agriculture value-added, financial development, and natural resource rent in the aftermath of COP21? J. Environ. Manag. 2020, 268, 110712. [Google Scholar] [CrossRef] [PubMed]
- Tian, H.; Guan, H. Study on the impact of the digital economy on carbon emissions from grain production: Empirical evidence from 108 prefecture-level cities in the Yangtze River Economic Belt. China Agric. Resour. Reg. Plan. 2023, 8, 145–157. [Google Scholar]
- Zhao, L.; Rao, X.; Lin, Q. Study of the impact of digitization on the carbon emission intensity of agricultural production in China. Sci. Total Environ. 2023, 903, 166544. [Google Scholar] [CrossRef] [PubMed]
- Zhao, X.; Ma, X.; Chen, B.; Shang, Y.; Song, M. Challenges toward carbon neutrality in China: Strategies and countermeasures. Resour. Conserv. Recycl. 2022, 176, 105959. [Google Scholar] [CrossRef]
- Zheng, J.; Wang, X. Can mobile information communication technologies (ICTs) promote the development of renewables?—Evidence from seven countries. Energy Policy 2021, 149, 112041. [Google Scholar] [CrossRef]
- Zhao, Z.; Zhao, Y.; Shi, X.; Zheng, L.; Fan, S.; Zuo, S. Green innovation and carbon emission performance: The role of digital economy. Energy Policy 2024, 195, 114344. [Google Scholar] [CrossRef]
- Jin, S.; Lin, Y.; Niu, K. Driving agricultural green transformation through low carbon: Characteristics of agricultural carbon emissions in China and their reduction pathways. Reform 2021, 5, 29–37. [Google Scholar]
- Huan, H.; Wang, L.; Zhang, Y. Regional differences, convergence characteristics, and carbon peaking prediction of agricultural carbon emissions in China. Environ. Pollut. 2025, 366, 125477. [Google Scholar] [CrossRef]
- West, T.O.; Post, W.M. Soil organic carbon sequestration rates by tillage and crop rotation: A global data analysis. Soil Sci. Soc. Am. J. 2002, 66, 1930–1946. [Google Scholar] [CrossRef]
- Johnson, J.M.F.; Franzluebbers, A.J.; Weyers, S.L.; Reicosky, D.C. Agricultural opportunities to mitigate greenhouse gas emissions. Environ. Pollut. 2007, 150, 107–124. [Google Scholar] [CrossRef] [PubMed]
- Huang, X.; Wu, X.; Guo, X.; Shen, Y. Agricultural carbon emissions in China: Measurement, spatiotemporal evolution, and influencing factors analysis. Front. Environ. Sci. 2024, 12, 1488047. [Google Scholar] [CrossRef]
- Tian, Y.; Liao, H. Research on the impact and mechanism of the digital economy on agricultural carbon emissions. Reform 2024, 9, 84–99. [Google Scholar]
- Xie, T.; Huang, Z.; Tan, T.; Chen, Y. Forecasting China’s agricultural carbon emissions: A comparative study based on deep learning models. Ecol. Inform. 2024, 82, 102661. [Google Scholar] [CrossRef]
- Wu, D.; Zhang, Z.; Liu, D.; Zhang, L.; Li, M.; Khan, M.I.; Li, T.; Cui, S. Calculation and analysis of agricultural carbon emission efficiency considering water-energy-food pressure: Modeling and application. Sci. Total Environ. 2024, 907, 167819. [Google Scholar] [CrossRef]
- Li, C.; Jia, J.; Wu, F.; Zuo, L.; Cui, X. County-level intensity of carbon emissions from crop farming in China during 2000–2019. Sci. Data 2024, 11, 457. [Google Scholar] [CrossRef]
- Guo, Y.; Chen, M. Re-measurement of agricultural carbon emission rates: Drivers, regional differences and dynamic evolution. PLoS ONE 2024, 19, e0308496. [Google Scholar] [CrossRef]
- Tian, C.; Chen, Y. Measurement of inter-provincial agricultural carbon emissions in China and evaluation of low-carbon levels—Based on the application of derived indicators and the TOPSIS method. J. Nat. Resour. 2021, 36, 395–410. [Google Scholar]
- Tian, Y.; Yin, M. Recalculating China’s agricultural carbon emissions: Current status, dynamic evolution, and spatial spillover effects. Chin. Rural Econ. 2022, 3, 104–127. [Google Scholar]
- Li, B.; Gao, Y. Impact and transmission mechanism of digital economy on agricultural energy carbon emission reduction. Int. Rev. Econ. Financ. 2024, 95, 103457. [Google Scholar] [CrossRef]
- Zhang, J.; Li, J.; Ye, D.; Sun, C. The impact of digital economy of resource-based city on carbon emissions trading by blockchain technology. Comput. Intell. Neurosci. 2022, 2022, 6366061. [Google Scholar] [CrossRef] [PubMed]
- Zhang, W.; Liu, X.; Wang, D.; Zhou, J. Digital economy and carbon emission performance: Evidence at China’s city level. Energy Policy 2022, 165, 112927. [Google Scholar] [CrossRef]
- Alam, I.; Lu, S.; Sarfraz, M.; Mohsin, M. The interplay of green technology and energy consumption: A study of China’s carbon neutrality and sustainable digital economy. Energies 2023, 16, 6184. [Google Scholar] [CrossRef]
- Chunfang, Y.; Xing, J.; Changming, C.; Shiou, L.; Obuobi, B.; Yifeng, Z. Digital economy empowers sustainable agriculture: Implications for farmers’ adoption of ecological agricultural technologies. Ecol. Indic. 2024, 159, 111723. [Google Scholar]
- Zhang, Y.F.; Ji, M.X.; Zheng, X.Z. Digital economy, agricultural technology innovation, and agricultural green total factor productivity. Sage Open 2023, 13, 21582440231194388. [Google Scholar] [CrossRef]
- Liu, J.; Feng, X.; Liu, J.; Yamaka, W. Digital Economy and Industrial Structure Transformation: Mechanisms for High-Quality Development in China’s Agriculture and Rural Areas. Agriculture 2024, 14, 1769. [Google Scholar] [CrossRef]
- Ye, L. Digital economy and high-quality agricultural development. Int. Rev. Econ. Financ. 2025, 99, 104028. [Google Scholar] [CrossRef]
- Niu, X.; Ma, Z.; Ma, W.; Yang, J.; Mao, T. The spatial spillover effects and equity of carbon emissions of digital economy in China. J. Clean. Prod. 2024, 434, 139885. [Google Scholar] [CrossRef]
- Cheng, Y.; Zhang, Y.; Wang, J.; Jiang, J. The impact of the urban digital economy on China’s carbon intensity: Spatial spillover and mediating effect. Resour. Conserv. Recycl. 2023, 189, 106762. [Google Scholar] [CrossRef]
- Tian, Y.; Cai, Y.; Zhang, H. The impact of the digital economy on agricultural carbon emission efficiency: An examination based on threshold effects and spatial spillover effects. Agrotech. Econ. 2024, 11, 89–107. [Google Scholar]
- Jin, M.; Feng, Y.; Wang, S.; Chen, N.; Cao, F. Can the development of the rural digital economy reduce agricultural carbon emissions? A spatiotemporal empirical study based on China’s provinces. Sci. Total Environ. 2024, 939, 173437. [Google Scholar] [CrossRef] [PubMed]
- Li, Y.; Yang, X.; Ran, Q.; Wu, H.; Irfan, M.; Ahmad, M. Energy structure, digital economy, and carbon emissions: Evidence from China. Environ. Sci. Pollut. Res. 2021, 28, 64606–64629. [Google Scholar] [CrossRef]
- Wu, R.; Hua, X.; Peng, L.; Liao, Y.; Yuan, Y. Nonlinear Effect of Digital Economy on Carbon Emission Intensity—Based on Dynamic Panel Threshold Model. Front. Environ. Sci. 2022, 109, 43177. [Google Scholar]
- Chen, Y.; Li, M.; Su, K.; Li, X. Spatial-temporal characteristics of the driving factors of agricultural carbon emissions: Empirical evidence from Fujian, China. Energies 2019, 12, 3102. [Google Scholar] [CrossRef]
- Yang, X.; Jia, Z.; Yang, Z.; Yuan, X. The effects of technological factors on carbon emissions from various sectors in China—A spatial perspective. J. Clean. Prod. 2021, 301, 126949. [Google Scholar] [CrossRef]
- Yang, X.; Jia, Z.; Yang, Z.; Yuan, X. Analysis of regional agricultural carbon emission efficiency and influencing factors: Case study of Hubei Province in China. PLoS ONE 2022, 17, e266172. [Google Scholar]
- Wang, P.; Li, C.; Huang, C. The impact of digital village construction on county-level economic growth and its driving mechanisms: Evidence from China. Agriculture 2023, 13, 1917. [Google Scholar] [CrossRef]
- Chen, X.; Li, Y.; Song, L.; Wang, Y. Theoretical framework and research outlook of the digital economy. Manag. World 2022, 38, 208–224+13–16. [Google Scholar]
- Chen, M.; Wang, X.; Zhang, Z. How can the digital economy reduce carbon emissions? Empirical evidence from China. PLoS ONE 2024, 19, e0303582. [Google Scholar] [CrossRef]
- Lewis, W.A. Economic development with unlimited supplies of labour. Manch. Sch. 1954, 22, 139–191. [Google Scholar] [CrossRef]
- Jin, S.; Ren, Z. The impact of rural digitalization on agricultural green total factor productivity. Reform 2022, 12, 102–118. [Google Scholar]
- He, Y.; Cheng, X.; Wang, F. A study on the regional spillover effects of agricultural carbon emissions from the perspective of technology diffusion. Agrotech. Econ. 2022, 4, 132–144. [Google Scholar]
- Li, B.; Zhou, Q.; Yue, H. An empirical examination of the impact of digital village development on industrial prosperity. Stat. Decis. 2022, 17, 5–10. [Google Scholar]
- Ding, B.; Zhao, Y.; Deng, J. Measurement, decoupling characteristics, and driving factors of carbon emissions in China’s crop cultivation. China Agric. Resour. Reg. Plan. 2022, 43, 1–11. [Google Scholar]
- Duan, H.; Zhang, Y.; Zhao, J.; Bian, X. Carbon footprint analysis of China’s farmland ecosystem. J. Soil Water Conserv. 2011, 25, 203–208. [Google Scholar]
- Min, J.; Hu, H. Estimation of greenhouse gas emissions from agricultural production in China. China Popul. Resour. Environ. 2012, 7, 21–27. [Google Scholar]
- Yao, C.; Qian, S.; Li, Z.; Liang, L. Measurement and spatiotemporal evolution mechanism of inter-provincial livestock carbon emissions in China. Resour. Sci. 2017, 39, 698–712. [Google Scholar]
- Liu, Y.; Xu, S. Research on the impact of digital economy development on agricultural carbon emissions in China. China Agric. Resour. Reg. Plan. 2024, 1–11. Available online: http://kns.cnki.net/kcms/detail/11.3513.s.20240710.1901.002.html (accessed on 22 April 2025).
- Zhao, T.; Zhang, Z.; Liang, S. The digital economy, entrepreneurial activity, and high-quality development: Empirical evidence from Chinese cities. Manag. World 2020, 36, 65–76. [Google Scholar]
- Dai, X.; Zhang, Z.; Gan, W.; Fan, D. Can Digital Economy Facilitate Household Clean Cooking Fuel Transition? Empirical Evidence from China. Sustainability 2025, 17, 288. [Google Scholar] [CrossRef]
- Zhu, W. Digital finance, capital misallocation and corporate innovation. Int. Rev. Econ. Financ. 2024, 96, 103696. [Google Scholar] [CrossRef]
- Li, X.; Li, N.; Xie, Y. Digital economy, manufacturing agglomeration, and carbon productivity. J. Zhongnan Univ. Econ. Law 2022, 6, 131–145. [Google Scholar]
- Peng, H.; Zhang, Z. Empowering rural industrial revitalization through digital economy: Effect test and mechanism analysis. Rural. Financ. Res. 2023, 5, 44–56. [Google Scholar]
- Pu, Y.; Wu, Y. Economic growth, industrial structure, and labor transfer. Quant. Tech. Econ. 2005, 9. Available online: https://kns.cnki.net/kcms2/article/abstract?v=N5Mfx_KcSpK6bQA37fs62ONuJEe39l95sCzuiJC-4L_F68tMNIxG4GgMuJGFIQsSBp8-R9YH4ze1dqT7vuPoqpBDhdW5VnCLVbNRArUnp2nU6S7hIIrf5c5oZ7uNGAfCiyy6UVEQfveQmVkCaMZM-qYuccRCEjsLh77g5rkEtMfqDo0JxTKm1A==&uniplatform=NZKPT&language=CHS (accessed on 22 April 2025).
- Li, G. Research on the impact mechanism and heterogeneity of rural labor transfer on grain production. J. Sichuan Agric. Univ. 2022, 5, 792–798. [Google Scholar]
- Tian, Y.; Lin, Z. Coupling and coordination of agricultural carbon emission efficiency and economic growth in Chinese provinces. China Popul. Resour. Environ. 2022, 4, 13–22. [Google Scholar]
- Zhang, Z.; Hua, C.; Ayyamperumal, R.; Wang, M.; Wang, S. The impact of specialization and large-scale operation on the application of pesticides and chemical fertilizers: A spatial panel data analysis in China. Environ. Impact Assess. Rev. 2024, 106, 107496. [Google Scholar] [CrossRef]
- Liu, H.; Song, Y. Financial development and carbon emissions in China since the recent world financial crisis: Evidence from a spatial-temporal analysis and a spatial Durbin model. Sci. Total Environ. 2020, 715, 136771. [Google Scholar] [CrossRef]
- Huang, X.; Yang, F.; Lu, Q. Urbanization, spatial spillover effects, and agricultural carbon emissions: An empirical analysis based on provincial panel data from 2007–2019. East China Econ. Manag. 2022, 4, 107–133. [Google Scholar]
- Zhang, Z.; Shi, K.; Gao, Y.; Feng, Y. How does environmental regulation promote green technology innovation in enterprises? A policy simulation approach with an evolutionary game. J. Environ. Plan. Manag. 2025, 68, 979–1008. [Google Scholar] [CrossRef]
- Zhang, Y.; Feng, M.; Fang, Z.; Yi, F.; Liu, Z. Impact of Digital Village Construction on Agricultural Carbon Emissions: Evidence from Mainland China. Int. J. Environ. Res. Public Health 2023, 20, 4189. [Google Scholar] [CrossRef] [PubMed]
- Chu, E.M.; Xiao, W.C. Theoretical Mechanism and Policy Research on Educational Equity Empowering Common Wealth—An Empirical Analysis Based on Chinese Provincial Panel Data. J. Soc. Sci. Hunan Norm. Univ. 2023, 6, 60–73. [Google Scholar] [CrossRef]
- Huang, X.L.; Du, Q.H.; Liao, R.F. 2011 A new species of the genus Lepidoptera (Coleoptera, Staphylinidae) from China. Study on the relationship between the development of digital economy, upgrading of agricultural industry structure and agricultural carbon emission. China Agric. Inf. 2023, 3, 84–94. [Google Scholar]
- Jiang, T. Sensitivity analysis in causal inference empirical research. Soc. Sci. Guangdong 2023, 5, 36–50. [Google Scholar]
- You, Z.; Feng, Z.; Yang, Y. China 1km terrain undulation dataset. J. Glob. Change Data Discov. (Chin. Engl. Ed.) 2018, 2, 151–155. [Google Scholar]
- Tian, Y.; He, Y. Has rural labor transfer promoted agricultural carbon emission reduction?—A panel data test based on 30 provinces. J. China Univ. Geosci. (Soc. Sci. Ed.) 2023, 5, 61–73. [Google Scholar]
- Qin, Z.; Pan, Y.; Ding, Z. Multi-scenario prediction and emission reduction path simulation of agricultural carbon emissions in the Yangtze River Economic Belt. Resour. Environ. Yangtze Basin 2024, 1–21. Available online: https://kns.cnki.net/kcms2/article/abstract?v=N5Mfx_KcSpJBl6qABckG0s7wvGSz_WJa2oaWBHo0yzkgqSAOvF9AprUioR1JkMkvjoxYrUe5Dx-gkxAjKx4sr-99vvFC2B8hfJoAo9cpZmZBTMWxMYT7emqJWBJ9xjLO3FqDfE7ct0Yca3xBJKpDuXDT1AtbUUdhYTEt-k50NV-6T5L9E3f2LQ==&uniplatform=NZKPT&language=CHS (accessed on 22 April 2025).
- Qiao, J.; Tai, D.; Qiu, Y. Mechanisms and effects of empowering agricultural carbon emission reduction with new agricultural productive forces. Contemp. Econ. Manag. 2024, 12, 42–55. [Google Scholar]
- Chen, Z.W.; Tang, C.; Liu, B.; Liu, P.; Zhang, X. Can socialized services reduce agricultural carbon emissions in the context of appropriate scale land management? Front. Environ. Sci. 2022, 10, 1039760. [Google Scholar] [CrossRef]
- Liu, L.; Qu, J.; Gao, F.; Maraseni, T.N.; Wang, S.; Aryal, S.; Zhang, Z.; Wu, R. Land use carbon emissions or sink: Research characteristics, hotspots and future perspectives. Land 2024, 13, 279. [Google Scholar] [CrossRef]
- Jiang, Y.; Xiao, Y.; Zhang, Z.; Zhao, S. How does central-local interaction affect local environmental governance? Insights from the transformation of central environmental protection inspection in China. Environ. Res. 2024, 243, 117668. [Google Scholar] [CrossRef]

| Target Layer | Criterion Layer | Indicator Layer | Nature |
|---|---|---|---|
| Digital Economy Development Indicator System | Digital Infrastructure | Network broadband coverage rate in administrative villages (%) | Positive |
| Proportion of administrative villages with postal services (%) | Positive | ||
| Number of broadband access ports (unit: 10,000) | Positive | ||
| Length of optical cable lines (unit: 10,000 km) | Positive | ||
| Level of digitalization in inclusive finance | Positive | ||
| Digital Development Capabilities | Number of agricultural meteorological experiment service stations | Positive | |
| Taobao Villages | Positive | ||
| E-commerce sales (unit: 100 million yuan) | Positive | ||
| Rural electricity consumption (unit: 100 million kWh) | Positive | ||
| Digital Industrial Services | Number of broadband users in rural areas (unit: 10,000 households) | Positive | |
| Number of computer users per 100 households nationwide | Positive | ||
| Number of mobile phone users per 100 households nationwide | Positive | ||
| Per capita transportation and communication expenses in rural areas | Positive |
| Variable Type | Variable Name | Sample Size | Average | Standard Deviation | Minimum | Maximum |
|---|---|---|---|---|---|---|
| Dependent Variable | Agricultural Carbon Emission Intensity | 310 | −4.506 | 1.010 | −8.002 | −2.815 |
| Agricultural Carbon Emissions | 310 | 5.354 | 1.141 | 2.543 | 6.093 | |
| Core Independent Variable | Level of Digital Economic Development | 310 | −1.986 | 0.697 | −4.011 | −0.232 |
| Mechanism Variable | Labor Transfer | 310 | 0.383 | 0.125 | 0.0795 | 0.642 |
| Independent Variables | Internal Industrial Structure of Agriculture | 310 | 0.141 | 0.0826 | 0.004 | 0.437 |
| Level of Agricultural Economic Development | 310 | 3.503 | 1.811 | 0.821 | 10.760 | |
| Level of Fiscal Support for Agriculture | 310 | 0.315 | 0.403 | 0.071 | 2.091 | |
| Labor Productivity | 310 | 1.246 | 0.613 | 0.337 | 3.581 | |
| Urbanization Rate | 310 | −0.525 | 0.211 | −1.428 | −0.110 | |
| Level of Environmental Regulation | 310 | 0.013 | 0.009 | 0.003 | 0.094 | |
| Other Variables | Education Level | 310 | 7.722 | 0.828 | 3.804 | 9.915 |
| Aci | Aci | Aci | Lt | |
|---|---|---|---|---|
| (1) | (2) | (3) | (4) | |
| Digl | −0.183 *** | −0.159 *** | −0.125 *** | −0.046 *** |
| (0.050) | (0.045) | (0.041) | (0.014) | |
| Ais | 0.580 | 0.538 | 0.264 ** | |
| (0.592) | (0.564) | (0.125) | ||
| Agdp | −0.037 *** | −0.042 *** | −0.031 *** | |
| (0.009) | (0.010) | (0.004) | ||
| Asup | −0.193 *** | −0.229 *** | −0.057 *** | |
| (0.053) | (0.057) | (0.016) | ||
| Wp | 0.155 *** | 0.163 *** | 0.054 *** | |
| (0.043) | (0.043) | (0.012) | ||
| Ic | −0.376 ** | −0.268 *** | ||
| (0.186) | (0.060) | |||
| Er | −0.697 | 0.567 ** | ||
| (0.581) | (0.237) | |||
| _cons | −4.868 *** | −4.905 *** | −5.000 *** | 0.165 *** |
| (0.099) | (0.137) | (0.154) | (0.037) | |
| N | 310 | 310 | 310 | 310 |
| R2 | 0.074 | 0.326 | 0.344 | 0.403 |
| YearFE | YES | YES | YES | YES |
| IDFE | YES | YES | YES | YES |
| Ac (1) | Act (2) | Aci (3) | Aci (4) | Digl (5) | Aci (6) | |
|---|---|---|---|---|---|---|
| Digl | −0.063 ** (0.030) | −0.141 *** (0.060) | −0.147 *** (0.040) | −0.270 ** (−2.315) | ||
| Digl(t−1) | −0.072 ** (0.031) | |||||
| Edu | −0.621 *** (0.190) | |||||
| Instrumental Variable | 0.000 *** (4.153) | |||||
| Kleibergen-Paaprk LM Statistic | 4.344 ** | |||||
| Cragg–Donald Wald F Statistic | 140.206 (17.246) | |||||
| Control | Control | Control | Control | Control | Control | Control |
| YearFE | Control | Control | Control | Control | Control | Control |
| IDFE | Control | Control | Control | Control | Control | Control |
| N | 310 | 310 | 310 | 279 | 310 | 310 |
| R2 | 0.803 | 0.803 | 0.372 | 0.783 | 0.876 |
| Year | Morans’I | p-Value | Z-Statistic | Year | Morans’I | p-Value | Z-Statistic |
|---|---|---|---|---|---|---|---|
| 2013 | 0.056 | 0.007 | 2.688 | 2018 | 0.063 | 0.004 | 2.892 |
| 2014 | 0.055 | 0.008 | 2.661 | 2019 | 0.061 | 0.004 | 2.855 |
| 2015 | 0.057 | 0.006 | 2.727 | 2020 | 0.062 | 0.004 | 2.861 |
| 2016 | 0.057 | 0.006 | 2.726 | 2021 | 0.061 | 0.004 | 2.842 |
| 2017 | 0.059 | 0.005 | 2.778 | 2022 | 0.060 | 0.005 | 2.803 |
| Test | Statistic | Test | Statistic |
|---|---|---|---|
| LM (error) test | 20.128 *** | LR(sdm sar) test | 63.880 *** |
| Robust LM (error) test | 19.807 *** | Wald (sdm sar) test | 68.070 *** |
| LM (lag) test | 0.322 | LR(sdm sem) test | 73.050 *** |
| Robust LM (lag) test | 0.001 | Wald (sdm sem) test | 80.560 *** |
| Joint significance test | Ind (73.850 ***) | Time (992.380 ***) |
| SDM (1) | SEM (2) | SAR (3) | ||||
|---|---|---|---|---|---|---|
| Digl | −0.071 ** | (0.031) | −0.099 *** | (0.035) | −0.105 *** | (0.032) |
| Ais | −0.124 | (0.392) | 0.514 | (0.378) | 0.452 | (0.377) |
| Agdp | −0.024 *** | (0.008) | −0.039 *** | (0.007) | −0.037 *** | (0.007) |
| Asup | −0.240 *** | (0.039) | −0.220 *** | (0.036) | −0.228 *** | (0.036) |
| Wp | 0.180 *** | (0.029) | 0.159 *** | (0.028) | 0.151 *** | (0.028) |
| Ic | −0.264 * | (0.147) | −0.304 ** | (0.143) | −0.371 *** | (0.134) |
| Er | −0.830 | (0.523) | −0.696 | (0.548) | −0.759 | (0.544) |
| W × Digl | −0.963 *** | (0.194) | ||||
| W × Ais | −4.481 | (3.007) | ||||
| W × Agdp | −0.057 | (0.053) | ||||
| W × Asup | −0.361 | (0.269) | ||||
| W × Wp | 0.561 ** | (0.234) | ||||
| W × Ic | −2.879 *** | (0.889) | ||||
| W × Er | −1.095 | (3.553) | ||||
| Spatial rho | 0.368 ** | (0.163) | 0.584 *** | (0.118) | ||
| Spatial lambda | 0.440 *** | (0.160) | ||||
| Variance sigma2_e | 0.003 *** | (0.001) | 0.004 *** | (0.001) | 0.004 *** | (0.001) |
| N | 310 | 310 | 310 | |||
| R2 | 0.126 | 0.749 | 0.717 | |||
| Province Fixed Effects | Control | Control | Control | |||
| Time Effects | Control | Control | Control | |||
| Variable | Direct Effect | Indirect Effect | Gross Effect | |||
|---|---|---|---|---|---|---|
| Coefficient | T Value | Coefficient | T Value | Coefficient | T Value | |
| Digl | −0.105 ** | (0.043) | −1.809 * | (1.041) | −1.914 * | (1.072) |
| Ais | −0.339 | (0.437) | −8.860 | (7.711) | −9.199 | (8.025) |
| Agdp | −0.025 *** | (0.008) | −0.119 | (0.113) | −0.144 | (0.115) |
| Asup | −0.248 *** | (0.046) | −0.702 | (0.598) | −0.950 | (0.627) |
| Wp | 0.198 *** | (0.040) | 1.151 | (0.730) | 1.349 * | (0.752) |
| Ic | −0.348 ** | (0.148) | −4.880 *** | (1.856) | −5.227 *** | (1.909) |
| Er | −0.843 | (0.590) | −1.523 | (6.657) | −2.366 | (6.974) |
| SDM (1) | SDM (2) | |||
|---|---|---|---|---|
| Digl | −0.0717 ** | (0.0341) | −0.0518 * | (0.0293) |
| Ais | −0.106 | (0.397) | −0.1830 | (0.329) |
| Agdp | −0.0283 *** | (0.00771) | −0.0124 * | (0.00744) |
| Asup | −0.291 *** | (0.0481) | −0.182 *** | (0.0346) |
| Wp | 0.148 *** | (0.0300) | 0.100 *** | (0.0288) |
| Ic | −0.299 | (0.190) | −0.487 *** | (0.144) |
| Er | −0.424 | (0.549) | −1.054 ** | (0.470) |
| W × Digl | −0.725 *** | (0.197) | −0.347 *** | (0.0738) |
| W × Ais | −4.458 | (2.894) | −3.892 *** | (0.909) |
| W × Agdp | −0.0838 | (0.0523) | −0.0655 *** | (0.0204) |
| W × Asup | −0.575 ** | (0.272) | −0.0831 | (0.0882) |
| W × Wp | 0.523 ** | (0.228) | 0.268 *** | (0.0778) |
| W × Ic | −3.984 *** | (0.971) | −0.443 | (0.370) |
| W × Er | 0.609 | (3.404) | −0.444 | (1.088) |
| Spatial rho | 0.350 ** | (0.166) | 0.482 *** | (0.0782) |
| Spatial lambda | ||||
| Variance sigma2_e | 0.00311 *** | (0.000261) | 0.00275 *** | (0.000226) |
| N | 290 | 310 | ||
| R2 | 0.328 | 0.237 | ||
| Province Fixed Effects | Control | Control | ||
| Time Effects | Control | Control | ||
| SDM Steep | SDM Flat | SDM High Output Value | SDM Low Output Value | |||||
|---|---|---|---|---|---|---|---|---|
| Digl | −0.155 *** | (0.0332) | −0.0889 ** | (0.0413) | −0.344 *** | (0.0487) | −0.108 *** | (0.0395) |
| Ais | −0.510 | (0.497) | 2.709 *** | (0.641) | 3.115 *** | (0.471) | −0.849 | (0.542) |
| Agdp | −0.000428 | (0.0241) | −0.0192 ** | (0.00795) | −0.00680 | (0.0124) | −0.0441 *** | (0.0101) |
| Asup | 0.0243 | (0.0550) | −0.243 *** | (0.0502) | 2.026 *** | (0.447) | −0.270 *** | (0.0469) |
| Wp | 0.000513 | (0.0582) | −0.0383 | (0.0433) | 0.110** | (0.0449) | 0.137 *** | (0.0363) |
| Lc | −1.133 *** | (0.170) | 1.060 *** | (0.264) | 0.409 | (0.286) | −0.241 | (0.202) |
| Er | 0.228 | (0.426) | −2.143 ** | (1.093) | −2.546** | (1.269) | −0.709 | (0.601) |
| W × Digl | −0.310 | (0.205) | −0.573 *** | (0.208) | −1.546*** | (0.264) | −0.386 * | (0.214) |
| W × Ais | −2.963 | (2.374) | 6.174 ** | (3.111) | −0.532 | (4.315) | −9.585 *** | (3.639) |
| W × Agdp | 0.233 ** | (0.106) | −0.162 *** | (0.0571) | 0.118 | (0.0761) | −0.120 ** | (0.0476) |
| W × Asup | 0.903 * | (0.501) | −0.455 ** | (0.204) | 7.217** | (2.874) | −0.720 *** | (0.236) |
| W × Wp | −1.123 *** | (0.264) | 0.246 | (0.193) | 0.577 | (0.398) | −0.275 | (0.278) |
| W × Lc | −2.636 ** | (1.141) | 2.423 | (1.845) | −1.040 | (1.510) | −1.290 | (0.903) |
| W × Er | 0.763 | (1.741) | −3.327 | (5.118) | −1.169 | (6.779) | 1.363 | (3.116) |
| Spatial rho | −0.661 ** | (0.295) | 0.404 *** | (0.152) | −0.350 | (0.308) | 0.232 | (0.185) |
| Spatial lambda | ||||||||
| Variance sigma2_e | 0.00113 *** | (0.000150) | 0.00266 *** | (0.000280) | 0.000643 *** | (0.0000914) | 0.00373 *** | (0.000364) |
| N | 120 | 190 | 100 | 210 | ||||
| R2 | 0.190 | 0.212 | 0.023 | 0.305 | ||||
| Province Fixed Effects | Control | Control | Control | Control | ||||
| Time Effects | Control | Control | Control | Control | ||||
Disclaimer/Publisher’s Note: The statements, opinions and data contained in all publications are solely those of the individual author(s) and contributor(s) and not of MDPI and/or the editor(s). MDPI and/or the editor(s) disclaim responsibility for any injury to people or property resulting from any ideas, methods, instructions or products referred to in the content. |
© 2025 by the authors. Licensee MDPI, Basel, Switzerland. This article is an open access article distributed under the terms and conditions of the Creative Commons Attribution (CC BY) license (https://creativecommons.org/licenses/by/4.0/).
Share and Cite
Yang, S.; Qiu, S.; Cao, J.; Zhang, Z. The Influencing Mechanism and Spatial Effect of the Digital Economy on Agricultural Carbon Emissions. Sustainability 2025, 17, 3877. https://doi.org/10.3390/su17093877
Yang S, Qiu S, Cao J, Zhang Z. The Influencing Mechanism and Spatial Effect of the Digital Economy on Agricultural Carbon Emissions. Sustainability. 2025; 17(9):3877. https://doi.org/10.3390/su17093877
Chicago/Turabian StyleYang, Suchang, Shi Qiu, Jiawei Cao, and Zhenhua Zhang. 2025. "The Influencing Mechanism and Spatial Effect of the Digital Economy on Agricultural Carbon Emissions" Sustainability 17, no. 9: 3877. https://doi.org/10.3390/su17093877
APA StyleYang, S., Qiu, S., Cao, J., & Zhang, Z. (2025). The Influencing Mechanism and Spatial Effect of the Digital Economy on Agricultural Carbon Emissions. Sustainability, 17(9), 3877. https://doi.org/10.3390/su17093877