Article

Shadows of Uncertainty: Unraveling the Impact of Economic Policy Uncertainty on Tourism-Driven Energy Consumption in Macau

School of Liberal Arts, Macau University of Science and Technology, Taipa 999078, Macau
*
Author to whom correspondence should be addressed.
Sustainability 2025, 17(8), 3716; https://doi.org/10.3390/su17083716
Submission received: 11 March 2025 / Revised: 11 April 2025 / Accepted: 17 April 2025 / Published: 20 April 2025
(This article belongs to the Section Economic and Business Aspects of Sustainability)

Abstract

:
This research analyzes the influence of economic policy uncertainty (EPU) on energy consumption driven by tourism in Macau, employing a structural vector autoregression (SVAR) model with sign restrictions. The SVAR model facilitates the identification of EPU shocks by imposing sign restrictions on impulse responses, providing a nuanced understanding of the dynamic effects of uncertainty. Employing quarterly data from the first quarter of 2002 to the fourth quarter of 2024, the findings demonstrate that EPU shocks result in sustained reductions in GDP, hotel occupancy rates, and energy usage. Our analysis highlights the significant role of Mainland China’s policy uncertainty in influencing Macau’s economy, emphasizing the vulnerability of tourism-dependent economies to policy-induced variations. The novelty of this research lies in its integrated framework, exploring the interconnectedness of EPU, tourism, and energy consumption, thus filling a gap in the existing literature. Additionally, this study contributes to sustainability research by exploring how energy consumption in tourism-dependent economies is intricately linked to policy uncertainty and how sustainable energy management strategies can help mitigate the adverse impacts of these uncertainties. Our findings provide key insights for policymakers aiming to enhance economic resilience and sustainability, underscoring the importance of reducing uncertainty through transparent policies and economic diversification.

1. Introduction

Tourism is significantly vulnerable to uncertainty from multiple sources. Natural disasters and unforeseen events can profoundly disrupt tourist influx [1]; the emergence of infectious diseases, such as COVID-19 and SARS, affects travel choices by amplifying perceptions of risk and safety apprehensions [2]. Security threats, including terrorism, crime, and corruption, not only deter inbound tourism but also limit outbound travel to impacted locations [3]. Additionally, financial and economic crises, despite their varying impacts, typically inhibit outbound travel from nations facing economic instability [4]. The tourism business heavily relies on a solid institutional structure, encompassing a comprehensive array of rules, laws, regulations, customs, and processes. Conversely, risk, uncertainty, and instability at a destination undermine the institutional framework essential for tourism, resulting in diminished investments, business interruptions, decreased visitor arrivals, and prolonged economic losses.
The late 1990s and early 2000s experienced a phase of notable political and economic stability, commonly termed the “Great Moderation”. Nonetheless, the past twenty years have been characterized by increasing uncertainty and volatility, influenced by occurrences like the global financial crisis, the COVID-19 epidemic, and, more recently, geopolitical tensions, including Russia’s invasion of Ukraine. These disruptions have transformed economic and regulatory frameworks, heightening uncertainty for enterprises, governments, and individuals. As economic uncertainty increasingly prevails, authorities face mounting pressure to adjust and execute responsive strategies. A significant corpus of research has investigated the effects of uncertainty shocks on business cycles [5,6,7,8]. Nonetheless, despite the growing interest in economic policy uncertainty (EPU), its effects on tourism-dependent economies remain relatively underexamined, with only a limited number of studies offering comprehensive evaluations [9,10,11].
EPU can have profound effects on energy consumption, particularly in tourism-dependent economies. Energy demand in such economies is often directly linked to fluctuations in tourist arrivals, which are sensitive to policy uncertainties. However, while previous studies have explored the impact of EPU on energy consumption [12,13,14] and tourism individually, few studies have examined how EPU, tourism, and energy consumption interact within a single, integrated framework. This tripartite relationship remains underexplored in the literature. Macau, a heavily tourism-dependent economy, is significantly susceptible to economic volatility and policy uncertainties stemming from Mainland China, Hong Kong, and its own local regulations, all of which affect its tourism sector and overall economy (Mainland China and Hong Kong are the largest sources of visitors to Macau). Energy consumption associated with tourism represents a substantial fraction of the city’s overall energy usage, propelled by hotels, casinos, entertainment venues, and transportation. (Macau’s energy consumption hit a record high in 2023, rising 9.1% from the previous year due to economic recovery and rising temperatures, with nearly 90% of its electricity imported from Mainland China. Source: https://www.macaubusiness.com/macau-energy-consumption-hits-record-high-in-2023-over-heatwave-economic-recovery/ (accessed on 1 March 2025).) During times of increased economic policy uncertainty (EPU)—including Mainland China’s anti-corruption campaigns, COVID-19 travel restrictions, and geopolitical tensions—tourist arrivals vary, affecting tourism income and energy demand. Our study aims to fill the gap by simultaneously analyzing the interconnected impacts of EPU, tourism, and energy consumption, offering a more holistic view of the dynamics at play (conceptual framework shown in Figure 1). By better understanding these interconnected dynamics, this research provides essential insights into how tourism-driven economies can build resilience and enhance sustainability in energy consumption amidst uncertainty.
To achieve this, we employ a structural vector autoregression (SVAR) model with a sign restriction identification approach [15] to identify EPU shocks. Using a tailored set of EPU indices specific to Macau’s policy environment, we integrate tourism and energy data to quantify the impact of uncertainty shocks. The key contributions of this paper are threefold: first, it bridges the gap between economic policy uncertainty and tourism-driven energy consumption, an area lacking comprehensive study; second, it distinguishes between temporary and persistent EPU shocks using an SVAR model with sign restrictions, providing a nuanced understanding of their differential effects; third, it offers actionable insights for policymakers on enhancing economic resilience and sustainability in tourism-dependent regions. The remainder of this paper is organized as follows: Section 2 reviews the existing literature relevant to this study. Section 3 details the methodological framework, including data sources, model specification, and empirical findings. Section 4 discusses the implications of these results for policymaking in Macau and analogous economies. Finally, Section 5 concludes with key insights and final remarks.

2. Literature Review

2.1. Economic Policy Uncertainty and Its Macroeconomic Effects

Economic policy uncertainty (EPU) significantly influences business cycles by affecting investment behavior, consumer spending, and overall economic activity [16,17,18,19,20]. Heightened policy uncertainty often leads businesses and households to delay major financial decisions, which in turn restricts investment, slows job growth, and weakens economic activity in large economies [6,21]. This phenomenon among enterprises aligns with the real options theory, which posits that postponing investment decisions is more beneficial in uncertain circumstances, particularly when it leads to substantial costs [22,23]. Businesses tend to delay hiring, investments, and expansions during sudden increases in policy uncertainty, slowing economic activity [24,25,26]. Similarly, consumers cut discretionary spending due to concerns over job or income stability [27,28,29]. These concurrent reactions intensify the adverse impacts of EPU on aggregate demand by inducing economic downturns.
Meanwhile, EPU significantly influences financial markets [30,31], international trade [32,33,34], and the efficacy of government policies [35,36]. Research indicates that investors demand higher risk premiums to compensate for ambiguous policy alterations, often resulting in stock market volatility [6]. These market fluctuations may impede economic growth by complicating access to external capital for enterprises [37,38]. Globally, policy uncertainty hinders trade flows as enterprises hesitate to engage in cross-border commerce due to concerns about trade agreements, tariffs, or regulations that may alter [7]. Moreover, due to the unpredictable responses of enterprises and consumers to fiscal stimuli or regulatory changes, policymakers may have challenges in executing successful economic interventions under heightened uncertainty [39]. Jurado, Ludvigson, and Ng [8] differentiate between short-term and long-term uncertainty, noting that while short-term uncertainty shocks might lead to immediate economic contractions, enduring uncertainty may threaten long-term economic growth. Recent geopolitical developments such as Brexit, the trade conflicts between the United States and China, and Russia’s incursion into Ukraine serve as poignant reminders of how persistent uncertainty may alter supply chains and transform the dynamics of the global economy. These examples illustrate the significance of understanding the broader macroeconomic effects of EPU, particularly its impact on business cycles, monetary and fiscal policy, and global financial stability.

2.2. Economic Policy Uncertainty and Energy Consumption

Economic policy uncertainty (EPU) significantly affects energy consumption by impacting both the supply and demand facets of energy markets [40]. Energy consumption fluctuates due to businesses and households postponing spending decisions amid rising uncertainty [41,42]. Theoretical frameworks suggest that enterprises uncertain about policy are likely to defer capital-intensive initiatives, including enhancements to energy-efficient systems and investments in energy infrastructure [43]. This reluctance results in reduced energy use across sectors such as manufacturing, construction, and transportation. Empirical research substantiates this trend, indicating that EPU decreases industrial energy consumption in countries such as the US [44] and China [45]. Moreover, investors perceive legal ambiguities and potential policy reversals as impediments to endorsing clean energy transitions, thus dissuading long-term spending in renewable energy initiatives and carbon mitigation efforts [46]. Consequently, dependence on conventional energy infrastructure is reinforced, significantly impeding the shift to sustainable energy sources.
Uncertainty influences residential energy consumption trends by altering customer behavior. During periods of elevated economic policy uncertainty (EPU), individuals curtail discretionary expenditures, including fuel, heating, and electricity prices, by using precautionary savings measures [47]. A study by Benito [48] indicates that household energy-related consumption varies due to economic uncertainty, particularly in response to job insecurity and income instability. Energy demand is intricately connected to the efficacy of the transportation, entertainment, and hospitality sectors in economies that are strongly dependent on tourism, such as Macau. Energy consumption in hotels, casinos, and other tourism-related facilities is directly diminished when tourism experiences a sudden decline due to uncertainties stemming from global crises, regulatory alterations, or geopolitical instability. The COVID-19 pandemic and the 2008 global financial crisis exemplify how interruptions in tourism led to significant declines in energy consumption, as travel restrictions and economic recessions diminished both domestic and international visitor numbers [49]. Moreover, energy markets exhibit volatility stemming from unforeseen alterations in governmental energy policies, including modifications to tax incentives, subsidies, and carbon regulations, affecting both producers and consumers. Comprehending the interplay between economic policy uncertainty (EPU) and energy consumption is crucial for policymakers aiming to achieve a balance between economic stability and energy sustainability. The subsequent sections will analyze how Macau’s vulnerabilities and policy challenges are influenced by broader economic and energy-related dynamics, particularly in economies that are strongly dependent on tourism.

2.3. Uncertainty in Tourism-Dependent Economies

Tourism-dependent economies are especially vulnerable to economic policy uncertainty (EPU) since they rely heavily on foreign demand, discretionary spending, and global mobility. Destinations that rely primarily on tourism, like Macau, are more susceptible to economic shocks due to uncertainties impacting tourist behavior compared to industrial or service-based economies, which typically possess more diversified growth sources [50]. Travelers frequently defer or annul their arrangements when policy uncertainty escalates, whether due to economic crises, regulatory modifications, or geopolitical conflicts. This leads to substantial declines in tourism revenue. For instance, the COVID-19 pandemic caused a drastic drop in visitor numbers, with hotel occupancy rates plummeting to less than 10% in early 2020 due to strict travel restrictions and heightened global uncertainty. The pandemic also severely impacted the tourism sector’s energy consumption, with around a 15% drop in electricity usage in 2020 compared to previous years (as shown in Figure 2). Comparable results were observed during China’s 2014–2016 anti-corruption campaign, which deterred high-spending tourists and diminished casino revenues by instigating confusion regarding the gaming industry. As a result, the real GDP in Macau dropped by more than 30%, as illustrated in Figure 2. The studies by Akdag et al. [51] and Kuok, Ko,o and Lim [11] illustrate that fluctuations in economic policy uncertainty (EPU) adversely affect the demand for international travel, impacting the retail, hospitality, and transportation sectors. Enterprises in the tourism industry incur substantial fixed expenditures; hence, even transient declines in visitor numbers can lead to considerable financial distress, employment reductions, and diminished economic productivity.
EPU influences energy consumption patterns and long-term investments in tourism infrastructure, as well as short-term economic challenges. To remain competitive, tourism destinations such as Macau must continue to invest in hotels, casinos, entertainment facilities, and transportation networks. Investors exhibit hesitance to finance new projects during elevated uncertainty, thereby postponing expansions in the hotel sector and enhancements in energy efficiency [52]. Shang et al. [53] assert that heightened uncertainty diminishes foreign direct investment (FDI) in tourism-dependent countries, hence constraining opportunities for development and modernization. Moreover, due to the substantial consumption of fuel, water, and electricity by hotels, casinos, and transit systems, fluctuations in tourism activity are closely linked to alterations in energy usage. Energy usage in various sectors diminishes when uncertainty reduces tourist arrivals, leading to ineffective energy infrastructure planning. Fluctuations in economic policy uncertainty (EPU) in Macau, whether induced by alterations in Chinese rules or shifts in the global economy, can significantly affect energy demand, complicating the efforts of energy suppliers and regulators to maintain stable supply levels. A multifaceted strategy is needed to address these vulnerabilities, including more effective policy communication, economic diversification, and sustainable energy planning. The relationship between energy consumption, tourism, and EPU emphasizes the necessity of proactive measures to improve economic resilience in areas that rely heavily on tourism. The data sources and methodology used to measure the effect of EPU on Macau’s energy and tourism industries will be described in the following section.
Figure 2. Economic policy uncertainty (EPU) indices in Mainland China, Hong Kong, and Macau. Source: Huang and Luk [16], Luk et al. [54], and Luk [55].
Sustainability 17 03716 g002

3. Methodology and Empirical Results

3.1. Methodology

The structural vector autoregression (SVAR) model is utilized to examine the dynamic relationships between economic policy uncertainty (EPU) and tourism-related energy consumption in Macau. In contrast to conventional VAR models, SVAR integrates economic theory to identify structural shocks, facilitating the isolation of orthogonal disturbances with distinct economic interpretations. The identification method employed is sign restrictions, which offer a flexible identification strategy by placing directional limits on impulse responses, thus circumventing the inflexible causal assumptions characteristic of recursive approaches [7,54]. This methodology is especially appropriate for analyzing EPU shocks because theoretical assumptions inform anticipated reactions. The structural form of the VAR model can be expressed as follows:
B 0 y t = i = 1 P B i y t i + u t
where y t is an n × 1 vector of endogenous variables; B 0 is an n × n matrix of coefficients that captures the contemporaneous relationships among the variables; B i s (for i = 1 , ,   P ) represent matrices of lag coefficients associated with each of the P lags in the system. The term u t denotes an n × 1 vector of white noise disturbances, where E u t u t = Σ u is an n × n diagonal matrix normalized to I n . To derive the reduced form representation, we multiply both sides of the SVAR representation (1) by B 0 1 :
y t = i = 1 P A i y t i + ν t
where A i = B 0 1 B i and ν t = B 0 1 u t . The estimated coefficients A i s and the variance–covariance matrix E ν t ν t are utilized to identify all the B i s, with the key challenge being the initial identification of B 0 . A well-known identification issue in this context is that the estimated covariance matrix E ν t ν t contains at most n n + 1 / 2 unique elements, whereas n 2 unique elements are required to fully identify B 0 . To ensure exact identification, it is necessary to impose n n 1 / 2 restrictions on B 0 .
Building on the studies of Faust [56], Uhlig [57], and Canova and De Nicolo [58], sign restrictions are employed to enhance the flexibility in configuring the VAR model’s response to shocks. This methodology considers the connections between reduced-form shocks ( ν t ) and structural shocks ( u t ), facilitating a more flexible identification process. Moreover, sign restrictions offer a versatile framework for assumptions concerning the timing of variables’ responses to shocks, rendering them an efficient instrument for finding uncertainty shocks [7]. In accordance with Sims et al. [59] and Bloom [6], the VAR models were estimated using log-levels with nonstationary variables. Four lags were employed in the models based on the quarterly data.
The sign restriction framework considers two distinct scenarios. The first is the baseline scenario in which the signs of all variable responses are constrained to follow specific predetermined directions. For example, the uncertainty shock is assumed to increase the EPU index while simultaneously decreasing the GDP, hotel occupancy rates, and the consumption of water, electricity, and gas, as shown in Table 1. This sign arrangement aligns with intuitive reasoning, ensures a structured interpretation of the EPU shock within the model, and is consistent with the existing literature on the consequences of uncertainty shocks [60,61]. The second is the agnostic scenario, which introduces greater flexibility by not imposing sign restrictions on the three energy consumption variables [57]. This allows for a more open-ended analysis, capturing potential variations in how energy consumption reacts to different economic shocks without predefining their directional impact [62]. By comparing both scenarios, the robustness of the model’s findings can be assessed more comprehensively.
Additionally, we conducted an SVAR with sign restrictions to analyze the persistent effects of uncertainty shocks, recognizing that such shocks may last longer if driven by structural changes or major policy shifts (China’s anti-corruption policy, the COVID-19 pandemic, etc.). Following Redl [63], we imposed sign restrictions on the duration of the positive response of the EPU index to uncertainty shock while maintaining restrictions on other variables, as outlined in Table 1. Specifically, we varied the duration for which the EPU index remains positive, testing intervals of one quarter, two years (eight quarters), and four years (sixteen quarters). To evaluate how uncertainty shocks propagate across variables, we used impulse response functions (IRFs), which are a powerful tool in econometrics used to illustrate how a variable evolves over time in response to unexpected changes—referred to as shocks—in itself or in related variables within a dynamic model. In the context of this study, IRFs help to track the dynamic response of key economic indicators, such as the GDP, hotel occupancy rates, and energy consumption, when subject to economic policy uncertainty (EPU) shocks.

3.2. Data

This study employs quarterly data from Macau, covering the period from the first quarter of 2002 to the fourth quarter of 2024. The variables include economic policy uncertainty indices for Mainland China, Hong Kong, and Macau, sourced from the studies by Huang and Luk [16] and Luk, Cheng, Ng, and Wong [54], where the derivation steps are provided in Appendix A. The key tourism indicator of hotel occupancy rates is incorporated to reflect Macau’s tourism–gaming sector. Additionally, GDP and energy consumption data for water, electricity, and gas are included to capture overall economic activity and energy demand. Except for the uncertainty indices, all other data were obtained from Macau’s Statistics and Census Service (DSEC), a comprehensive database providing reliable economic, demographic, and social statistics for authoritative analysis.
Economic theory posits that uncertainty significantly influences the real economy. In a groundbreaking study, Baker, Bloom, and Davis [5] (hereafter called BBD) developed economic policy uncertainty (EPU) indices for key global economies by analyzing the content of newspaper articles. BBD created an EPU index for China using the South China Morning Post to bypass mainland media censorship. However, this approach has limitations: it may not fully capture China’s policy uncertainty, relies on a single newspaper’s editorial choices, lacks expected macroeconomic correlations, and cannot support higher-frequency or category-specific indices [16]. To address these limitations, we utilize the EPU index developed by Huang and Luk [16], which draws from ten mainland Chinese newspapers, ensuring broader coverage and more timely measurement of uncertainty. For the EPU index in Hong Kong, we follow the method used by Luk, Cheng, Ng and Wong [54], which utilizes data from ten major local Chinese news media in Hong Kong. For Macau, we rely on [55], which derives the index from four Macau-based newspapers.
Figure 2 illustrates the trends of the three EPU indices from Q1 2000 to Q4 2024. The indices have been normalized for easier comparison. There is a general positive correlation between them, with some events causing a notable impact across all three indices, while others affect only one index with little to no effect on the others. The strongest bilateral correlation is between the EPU indices of Mainland China and Hong Kong (0.751), while the weakest correlation is between the EPU indices of Hong Kong and Macau (0.408), with the correlation between Mainland China and Macau’s EPU indices falling in between (0.475). Common events impacting all three EPU indices include the SARS outbreak in 2003, the bankruptcy of the Lehman Brothers in 2008, the change in the RMB fixing mechanism in 2015, and the outbreak of COVID-19 in 2020, among others. Meanwhile, some events are specific to individual regions, such as the 2015 introduction of the “circuit breaker” mechanism in Mainland China, the 2017 Hong Kong chief executive election, and the 2014 gambling industry reforms in Macau.
Figure 3 presents the remaining time series utilized in the VAR model, including the real GDP (in millions of MOP), hotel occupancy rate (%), and energy consumption for water (thousand m3), electricity (million kWh), and gas (tonnes). Both the real GDP and hotel occupancy rates exhibit substantial volatility, with a general trend of strong positive growth. However, three significant periods of sustained decline are evident: the 2008–2009 Global Financial Crisis, the 2014–2016 Chinese Government Anti-Corruption Campaign, and the 2020–2022 COVID-19 pandemic. Energy consumption for water and electricity follows a consistent upward trajectory, closely mirroring the expansion of Macau’s tourism–gaming industry, until the COVID-19 pandemic caused a notable disruption. In contrast, gas consumption follows an inverted V-shaped pattern, suggesting a shift in energy sources since 2016, where fuel oil consumption decreased significantly as Macau transitioned towards greater use of electricity. Additionally, energy efficiency improvements and the shutdown of fuel oil power plants further diminished the role of gas in the energy mix [62]. The data underscore the profound impact of the pandemic on Macau’s previously robust tourism sector.

3.3. Empirical Results
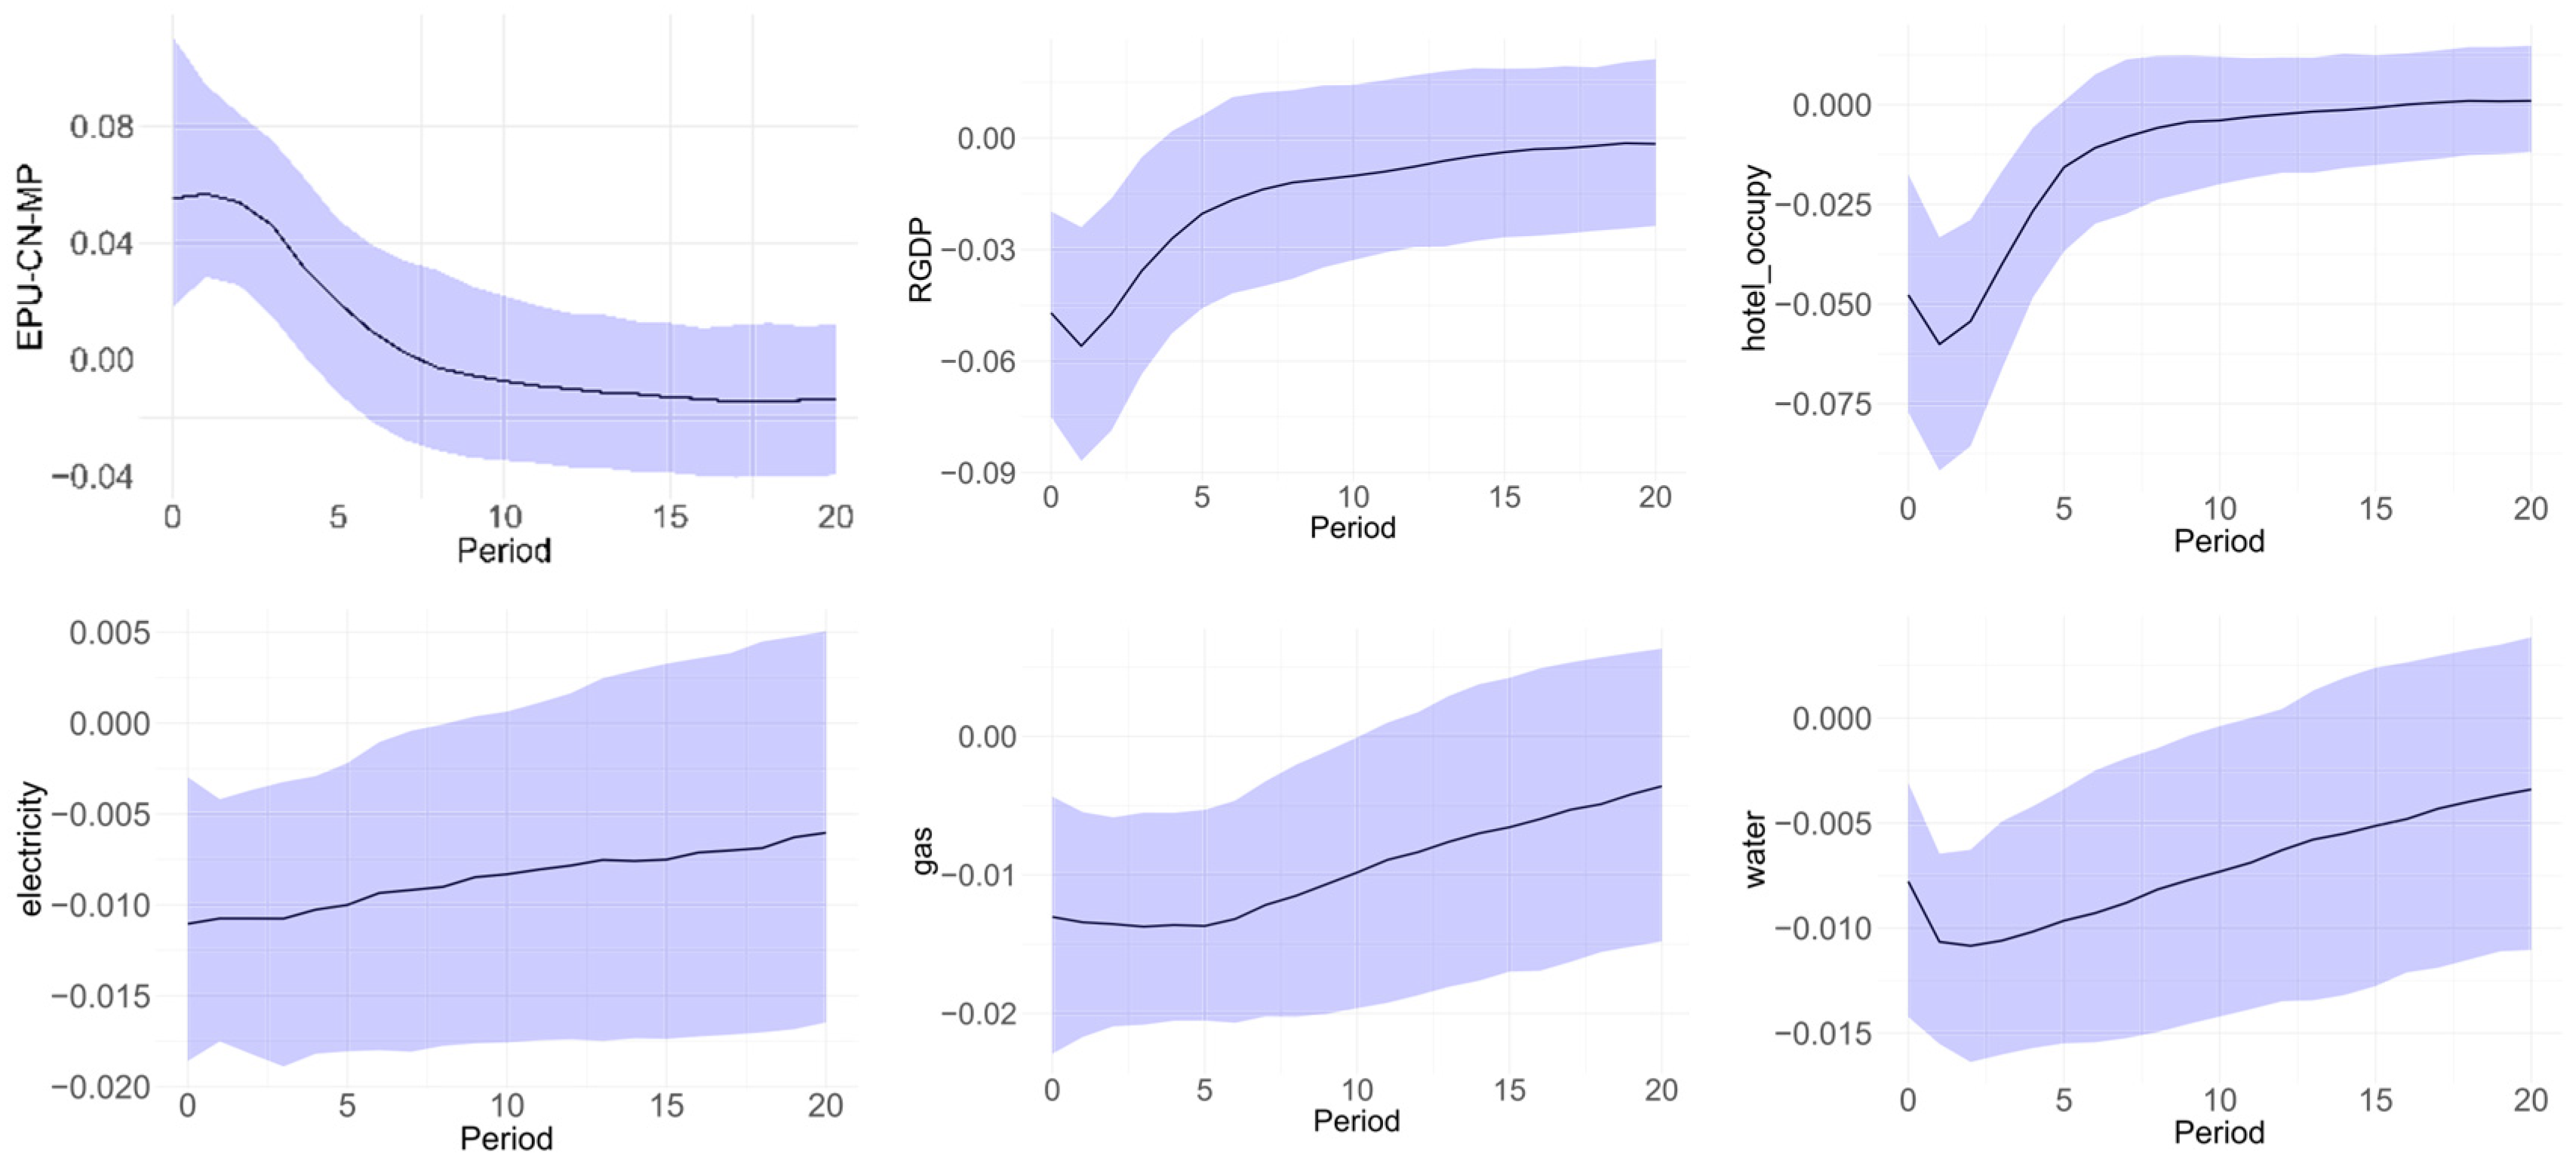
3.3.1. Baseline

In the baseline scenario, sign restrictions are applied to all variable responses, as detailed in Table 1. Figure 4 presents the impulse response functions (IRFs) for each variable following a shock of one standard deviation (S.D.) to the three economic policy uncertainty (EPU) indices. Specifically, panel (a) depicts the IRFs for Mainland China’s EPU, panel (b) corresponds to Hong Kong’s EPU, and panel (c) represents Macau’s EPU.
The results in all three panels reveal that a rise in EPU negatively impacts key indicators in Macau, leading to declines in the real GDP, hotel occupancy, and energy consumption, including electricity, gas, and water. These adverse effects are both statistically significant and persistent, highlighting the vulnerability of tourism-dependent economies to policy uncertainty. Furthermore, the results reveal that EPU shocks in Mainland China last longer than those in Hong Kong and Macau. This persistence is probably driven by China’s structural complexity, extensive regulatory changes, and gradual approach to economic reforms, which prolong uncertainty [64]. In contrast, Hong Kong and Macau benefit from more market-driven, transparent, and predictable policy environments, resulting in shorter-lived uncertainty. Notably, Macau’s real GDP exhibits the most prolonged response to its own EPU shocks, suggesting that domestic policy uncertainty has the most enduring impact on its economy. A similar pattern is observed in hotel occupancy, suggesting that potential tourists to Macau are more influenced by local conditions than by the economic policy uncertainty in their country of origin. For energy consumption, the effects of EPU shocks on water and electricity follow a similar pattern, with Macau’s own uncertainty having the most persistent impact. However, gas consumption deviates from this trend, as EPU shocks from Hong Kong appear to have the longest-lasting effect, highlighting potential differences in energy demand dynamics across sectors.
These findings emphasize the profound influence of economic policy uncertainty on tourism destinations like Macau. As uncertainty rises, businesses and travelers become more cautious in their spending, leading to declines in tourism revenue, hotel demand, and overall economic activity. This downturn also affects energy consumption, as reduced tourism activity lowers the demand for water, electricity, and gas in hotels, entertainment venues, and other tourism-related sectors. The prolonged significance of these effects highlights the vulnerability of tourism-dependent economies to external shocks, emphasizing the need for strategic policies to enhance resilience. Proactive measures, such as clear policy communication, economic diversification, and sustainable energy management, can help mitigate uncertainty’s impact and ensure the long-term stability of tourism-dependent destinations.

3.3.2. Results with an “Agnostic” Approach

In addition to the baseline scenario, we also estimated an SVAR model that differs by not imposing sign restrictions on all variables, as shown in Figure 5. We decided to leave the responses of the hotel occupancy rate and unrestricted energy consumption that follow an “agnostic” approach [7,63]. The results indicate that the main conclusions from the baseline model generally remain valid, even when some key variables are left unrestricted. While the negative effects across most variables remain statistically significant, their duration is also slightly longer compared to the baseline case. This implies that the sign restrictions in the baseline model do not fundamentally change the core findings. Therefore, even without imposing constraints on certain variables, the overall influence of uncertainty shocks on key variables remains intact, with responses continuing to be statistically significant. This strengthens the reliability of the results, suggesting that the observed effects reflect genuine patterns in the data rather than being a consequence of imposed restrictions.

3.3.3. Persistent Uncertainty Shock

Sign restrictions provide a flexible approach to analyzing prolonged macroeconomic uncertainty. While uncertainty shocks are often seen as short-term disruptions leading to economic slowdowns, certain large-scale structural changes or policy shifts can create sustained uncertainty, altering economic behavior. Events like the COVID-19 pandemic introduced lasting uncertainty by disrupting labor markets, supply chains, and consumer confidence. Similarly, major policy shifts during the Trump administration led to prolonged uncertainty in trade, regulation, and international relations. Unlike temporary shocks, persistent uncertainty influences businesses to delay investments, households to adjust spending, and financial markets to experience prolonged volatility. These prolonged effects can reshape long-term economic expectations, requiring policymakers to implement strategies that stabilize markets and promote economic resilience. Understanding behavioral responses to sustained uncertainty is essential for designing effective policies that mitigate negative impacts and support sustainable growth in an unpredictable global environment.
To address this question, we implement sign restrictions that specifically control the duration of uncertainty’s positive response to an uncertainty shock while maintaining fixed sign restrictions on other variables. This approach enables the identification of a distinct shock from the temporary case analyzed earlier, offering a framework to uncover potential delayed response patterns [65]. This analysis follows the baseline identification for the EPU indices, adjusting the constraint on how long these indices must remain positive, ranging from one quarter to sixteen quarters. This variation allows us to assess the relative impact of different levels of persistence.
Figure 6 presents the IRFs of hotel occupancy and electricity consumption to a persistent positive EPU shock for one quarter, eight quarters, and sixteen quarters. The analysis focuses on the impact of EPU shocks in Mainland China, as the responses observed for Hong Kong and Macau are largely similar. The results indicate that while the peak impact remains similar across cases, the persistence of the response corresponds to the duration of the EPU shock. For instance, the IRFs of hotel occupancy return to zero after four quarters, eight quarters, and more than twenty quarters, corresponding to one-quarter, eight-quarter, and sixteen-quarter persistence of EPU shock from Mainland China, respectively. All other variables with all EPU shocks follow a similar pattern. Our findings align with the imperfect information hypothesis (see Bloom [6]) as they reveal a comparable initial impact but a more pronounced long-term effect compared to temporary shocks. This concept underscores how uncertainty hampers economic activity, prompting individuals to adopt a “wait-and-see” approach. According to this theory, while both temporary and persistent shocks may have comparable short-term effects, prolonged uncertainty leads to stronger long-term economic consequences. Bloom [6] demonstrated that uncertainty shocks can trigger boom–bust cycles, with persistent shocks eliciting a response similar to that of temporary shocks—essentially behaving as if a more intense temporary shock had taken place. Our analysis of persistent uncertainty shocks in Macau, using the methodological framework established by Redl [66], yields comparable findings, reinforcing this pattern in a different economic context.

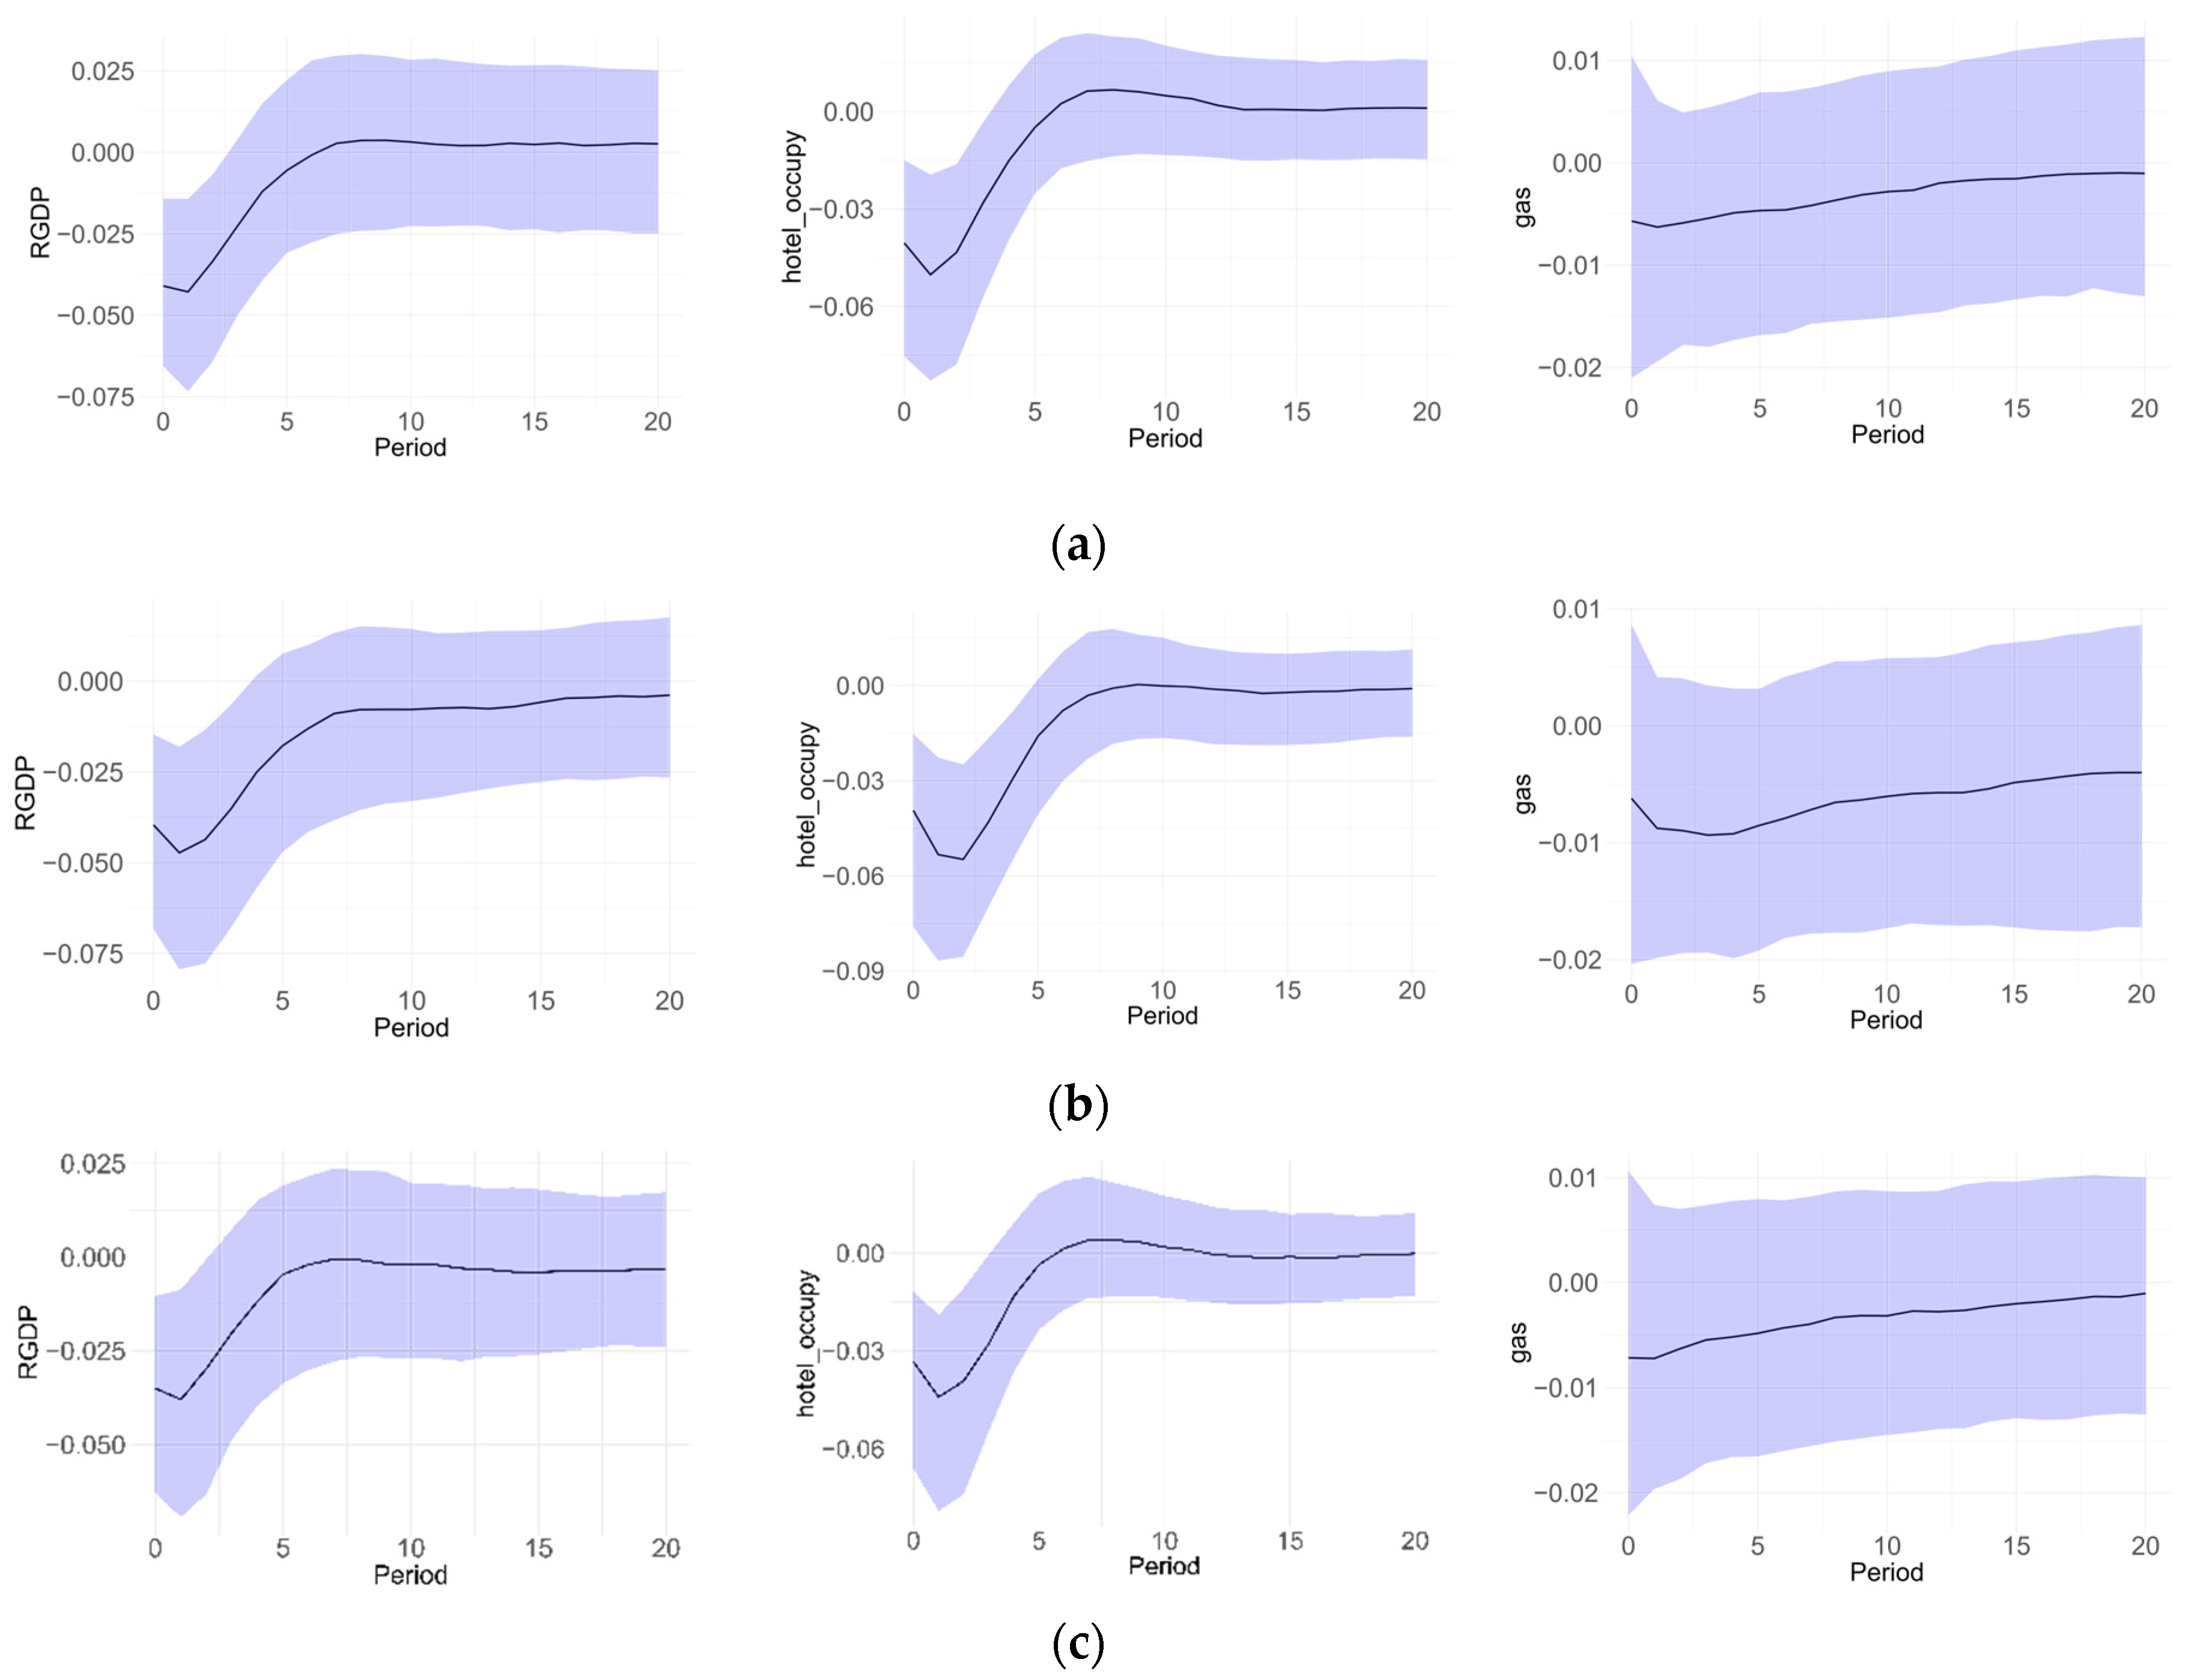
3.3.4. Robustness Check

Alternative Uncertainty Measure

As a robustness check, we firstly use an alternative economic policy uncertainty (EPU) index of Mainland China developed by Davis, Liu, and Sheng [67], as depicted in Appendix A. Figure 7 depicts the IRFs using this different EPU index. We observe that the general patterns of response for the variables remain consistent with the baseline model. However, the effects of the alternative EPU measure are more persistent compared to the baseline model. Specifically, the response of energy consumption, particularly electricity usage, shows a more prolonged decline, suggesting that the alternative EPU index captures longer-lasting uncertainty shocks. Overall, these findings confirm the robustness of the results while highlighting that the alternative EPU measure leads to more enduring disruptions in energy consumption.

Uncertainty Shock Before the COVID-19 Pandemic

In the second robustness check, we exclude the COVID-19 pandemic period from our baseline sample to analyze the differences in the effects of EPU shocks with and without the pandemic. This approach allows us to assess whether the pandemic influenced the magnitude, duration, or overall impact of economic policy uncertainty shocks. By comparing these two scenarios, we aim to determine how the heightened uncertainty during the pandemic altered economic responses. Figure 8 presents the IRFs for both samples, revealing notable distinctions between them. The findings indicate that when the pandemic period is included, EPU shocks have a greater impact on all observed variables. This suggests that the COVID-19 crisis intensified the effects of policy uncertainty, possibly due to the compounded economic instability and heightened risk aversion during this time. These results highlight the significant role that external crises play in amplifying the effects of uncertainty shocks on economic activity.

4. Discussion

The results demonstrate that economic policy uncertainty substantially affects Macau’s tourism-related energy usage. Our findings indicate that uncertainty shocks exert enduring effects on Macau’s GDP, hotel occupancy rates, and energy consumption. These findings corroborate earlier research regarding the extensive economic ramifications of uncertainty shocks, substantiating the premise that heightened unpredictability in economic policy results in diminished investment, postponed expenditure, and decreased overall economic activity [5,6].
For many small open economies, the dynamics observed in Macau can serve as a cautionary tale. As globalization deepens and policy uncertainty rises across borders, tourism-dependent economies face mounting challenges [11]. These economies often lack the diversified industrial base that could help buffer the impact of external shocks. Therefore, the adverse effects of EPU on tourism-related activities, and by extension, energy consumption, can be profound, especially in the short term when tourism demand contracts. The long-term implications are also significant, as sustained uncertainty may deter investment in infrastructure, including energy-efficient technologies, further compounding economic instability.

4.1. Policy Implications for Tourism-Driven Small Open Economies

The significant adverse effect of economic policy uncertainty (EPU) on tourism-dependent countries highlights the industry’s susceptibility to external disturbances. To mitigate the risks associated with EPU, policymakers in small open economies should adopt a multifaceted approach that enhances resilience and promotes sustainability. First, economic diversification is crucial. Overreliance on tourism can expose economies to extreme volatility in times of policy uncertainty. Diversification can provide a cushion against external economic shocks [50]. Second, transparent and predictable policy frameworks are essential for reducing the negative impacts of uncertainty. Clear communication of economic and regulatory policies can help build confidence among investors and tourists, thereby stabilizing both energy demand and economic activity [68]. Third, international collaboration on issues like climate change and policy uncertainty can further strengthen resilience. By aligning with global sustainability initiatives, small open economies can better manage the compounded risks posed by both economic and environmental uncertainties. For example, participating in international frameworks for climate adaptation and sustainable tourism can provide both financial and technical support to mitigate the adverse effects of uncertainty.

4.2. Policy Implications for Energy Consumption

Our analysis indicates that oscillations in tourism activity, driven by uncertainty, result in significant alterations in energy consumption patterns. The significant reductions in energy consumption after substantial EPU shocks indicate that tourism-dependent economies necessitate adaptive energy strategies to sustain stability amid instability. Policymakers ought to contemplate strategies including the following: First, they can enhance energy efficiency. Investment in energy-efficient infrastructure can help mitigate the impact of sudden declines in energy demand, ensuring more sustainable operations. Second, they can diversify energy sources. A balanced energy mix, including renewables, can reduce dependence on tourism-related energy consumption, making the sector more resilient to economic shocks. Third, they can improve policy transparency. Clear and predictable policy communication can help reduce uncertainty and its negative effects on investor confidence, tourism demand, and energy consumption.

4.3. Modeling Limitations

While the SVAR model with sign restrictions is a robust tool for identifying dynamic relationships, it can introduce a certain degree of subjectivity in specifying the response patterns as the sign restrictions are based on theoretical assumptions that may not fully capture the complexity of real-world dynamics [69]. Moreover, our analysis depends on the availability of high-quality data, particularly for the EPU indices, which are derived from media content analysis. While we have made efforts to use comprehensive indices that account for multiple sources, there remains the challenge that these indices may not fully capture all dimensions of policy uncertainty. Lastly, the impact of global economic events (e.g., geopolitical crises and pandemics) introduces another challenge, as their effects may vary greatly across different periods and are not always fully captured by standard indices or available data.

4.4. Expanding the Research Agenda

Beyond these policy considerations, future research should explore the broader interplay between economic policy uncertainty and environmental risks, such as climate change. Understanding how environmental uncertainty intersects with economic shocks could offer valuable insights for small economies that must navigate both economic and ecological challenges. Additionally, incorporating more dynamic predictive models, such as those using machine learning techniques, could provide more accurate forecasts of EPU’s effects on tourism and energy consumption, helping policymakers craft more adaptive strategies.
In summary, while the results of this study are context-specific to Macau, the broader implications are relevant to many small open economies globally. The recommendations outlined here—economic diversification, transparent policies, sustainable energy practices, and international cooperation—offer a comprehensive framework for mitigating the impact of economic uncertainty. By adopting these strategies, policymakers can strengthen the resilience of their economies and reduce their vulnerability to future uncertainty shocks.

5. Conclusions

This study elucidates the substantial influence of economic policy uncertainty on the energy consumption generated by tourism in Macau. Our empirical study reveals that EPU shocks result in sustained reductions in GDP, hotel occupancy rates, and energy demand, with the consequences being especially significant when the uncertainty stems from Mainland China. These findings emphasize Macau’s economic reliance on external policies and show the larger weaknesses of economies dependent on tourism.
To address these difficulties, governments must emphasize economic diversification, effective policy communication, and sustainable energy planning. By implementing targeted measures—such as improving energy efficiency, advancing renewable energy, and stabilizing tourism investments—Macau can enhance its resilience against future uncertainty shocks. In light of the rising economic and geopolitical uncertainties globally, proactive policy measures will be crucial for maintaining long-term stability in tourism-dependent countries.
Our findings enhance the comprehension of the interplay between economic policy uncertainty, tourism, and energy consumption, providing essential insights for researchers, policymakers, and industry stakeholders aiming to navigate the complexities of a progressively uncertain global environment. Looking ahead, future research could expand upon this study by integrating climate change risk into the analysis. Understanding how environmental policy uncertainty interacts with EPU could provide valuable insights into how tourism-driven energy consumption might be further affected by evolving global sustainability challenges [70]. Additionally, applying machine learning techniques to forecast the impacts of EPU on tourism and energy consumption could yield more dynamic, predictive models, allowing policymakers to better prepare for and respond to future uncertainty shocks [71].

Author Contributions

Conceptualization, H.Z. and M.T.; methodology, H.Z. and M.T.; software, M.T.; validation, H.Z. and M.T.; formal analysis, H.Z.; investigation, H.Z. and M.T.; data curation, H.Z. and M.T.; writing—original draft preparation, H.Z.; writing—review and editing, H.Z. and M.T.; visualization, H.Z. and M.T.; supervision, H.Z. All authors have read and agreed to the published version of the manuscript.

Funding

This research received no external funding.

Institutional Review Board Statement

Not applicable.

Informed Consent Statement

Not applicable.

Data Availability Statement

All data were obtained from public sources, like the Statistics and Census Service of Macau (DSEC), and from Huang and Luk [16], Luk et al. [54], and Luk [55].

Conflicts of Interest

We declare that we have no competing financial interests or personal relationships that could have appeared to influence the work reported in this study.

Appendix A

Appendix A.1. The Construction of Economic Policy Uncertainty (EPU) Indices

The specific steps in constructing the index, based on the methodology of Baker, Bloom, and Davis [5], are outlined as follows:
(1)
Counting: For each month t and each newspaper i , the number of articles containing relevant uncertainty-related terms is counted. This count is then scaled by the total number of articles in the same newspaper and month that meet specific criteria. The resulting value is referred to as the monthly scaled EPU count for each newspaper, denoted as E P U _ r a w i t .
(2)
Standardization: For each newspaper i , the sample standard deviation of E P U _ r a w i t is calculated using data prior to December 2024. Each monthly scaled count for the newspaper i is then standardized by dividing it by the computed standard deviation. This gives the standardized value for each newspaper and month, expressed as follows:
s t a n d a r d i z e d   E P U _ r a w i t = E P U _ r a w i t s t d . E P U _ r a w i t
(3)
Aggregation: For each month t , the standardized values across all newspapers i N are averaged. This provides the aggregated monthly EPU count for the period, represented as follows:
a g g r e g a t e d   E P U _ r a w i t = N 1 i N s t a n d a r d i z e d   E P U _ r a w i t
(4)
Normalization: The aggregated monthly index is then normalized to have a mean of 100 for the period from January 2002 to December 2024. This ensures consistency over time, and the resulting EPU index can then be converted into a quarterly index for further analysis, as used in the paper.

Appendix A.2. Alternative Economic Policy Uncertainty (EPU) Index in Mainland China

Figure A1. Alternative economic policy uncertainty (EPU) indices in Mainland China. Source: Davis, Liu, and Sheng [67].
Sustainability 17 03716 g0a1

References

  1. Rosselló, J.; Becken, S.; Santana-Gallego, M. The Effects of Natural Disasters on International Tourism: A Global Analysis. Tour. Manag. 2020, 79, 104080. [Google Scholar] [CrossRef]
  2. Mertzanis, C.; Papastathopoulos, A. Epidemiological Susceptibility Risk and Tourist Flows around the World. Ann. Tour. Res. 2021, 86, 103095. [Google Scholar] [CrossRef]
  3. Fourie, J.; Rosselló-Nadal, J.; Santana-Gallego, M. Fatal Attraction: How Security Threats Hurt Tourism. J. Travel Res. 2019, 59, 209–219. [Google Scholar] [CrossRef]
  4. Khalid, U.; Okafor, L.E.; Shafiullah, M. The Effects of Economic and Financial Crises on International Tourist Flows: A Cross-Country Analysis. J. Travel Res. 2019, 59, 315–334. [Google Scholar] [CrossRef]
  5. Baker, S.R.; Bloom, N.; Davis, S.J. Measuring Economic Policy Uncertainty. Q. J. Econ. 2016, 131, 1593–1636. [Google Scholar] [CrossRef]
  6. Bloom, N. The Impact of Uncertainty Shocks. Econometrica 2009, 77, 623–685. [Google Scholar]
  7. Caldara, D.; Fuentes-Albero, C.; Gilchrist, S.; Zakrajšek, E. The Macroeconomic Impact of Financial and Uncertainty Shocks. Eur. Econ. Rev. 2016, 88, 185–207. [Google Scholar] [CrossRef]
  8. Jurado, K.; Ludvigson, S.C.; Ng, S. Measuring Uncertainty. Am. Econ. Rev. 2015, 105, 1177–1216. [Google Scholar] [CrossRef]
  9. Duro, J.A.; Osório, A.; Perez-Laborda, A. Modeling Uncertainty in Tourism Markets. Ann. Tour. Res. 2024, 107, 103795. [Google Scholar] [CrossRef]
  10. Hailemariam, A.; Ivanovski, K. The Effect of Economic Policy Uncertainty on Us Tourism Net Exports. Tour. Econ. 2021, 28, 2219–2227. [Google Scholar] [CrossRef]
  11. Kuok, R.U.K.; Koo, T.T.; Lim, C. Economic Policy Uncertainty and International Tourism Demand: A Global Vector Autoregressive Approach. J. Travel Res. 2022, 62, 540–562. [Google Scholar] [CrossRef]
  12. Adams, S.; Adedoyin, F.; Olaniran, E.; Bekun, F.V. Energy consumption, economic policy uncertainty and carbon emissions; causality evidence from resource rich economies. Econ. Anal. Policy 2020, 68, 179–190. [Google Scholar] [CrossRef]
  13. Adedoyin, F.F.; Zakari, A. Energy Consumption, Economic Expansion, and Co2 Emission in the Uk: The Role of Economic Policy Uncertainty. Sci. Total Environ. 2020, 738, 140014. [Google Scholar] [CrossRef]
  14. Wang, Q.; Xiao, K.; Lu, Z. Does Economic Policy Uncertainty Affect CO2 Emissions? Empirical Evidence from the United States. Sustainability 2020, 12, 9108. [Google Scholar] [CrossRef]
  15. Fry, R.; Pagan, A. Sign Restrictions in Structural Vector Autoregressions: A Critical Review. J. Econ. Lit. 2011, 49, 938–960. [Google Scholar] [CrossRef]
  16. Huang, Y.; Luk, P. Measuring Economic Policy Uncertainty in China. China Econ. Rev. 2020, 59, 101367. [Google Scholar] [CrossRef]
  17. Anzuini, A.; Rossi, L.; Tommasino, P. Fiscal Policy Uncertainty and the Business Cycle: Time Series Evidence from Italy. J. Macroecon. 2020, 65, 103238. [Google Scholar] [CrossRef]
  18. Adjei, A.N.K.; Tweneboah, G.; Junior, P.O. Interdependence of Economic Policy Uncertainty and Business Cycles in Selected Emerging Market Economies. J. Financ. Econ. Policy 2022, 14, 601–632. [Google Scholar] [CrossRef]
  19. Popp, A.; Zhang, F. A Note on International Spillovers of Economic Policy Uncertainty across Business Cycles: Evidence from Oecd Countries. Macroecon. Dyn. 2023, 28, 99–111. [Google Scholar] [CrossRef]
  20. Dejuan-Bitria, D.; Ghirelli, C. Economic Policy Uncertainty and Investment in Spain. SERIEs 2021, 12, 351–388. [Google Scholar] [CrossRef]
  21. Bernanke, B.S. Irreversibility, Uncertainty, and Cyclical Investment. Q. J. Econ. 1983, 98, 85–106. [Google Scholar] [CrossRef]
  22. McDonald, R.; Siegel, D. The Value of Waiting to Invest. Q. J. Econ. 1986, 101, 707–727. [Google Scholar] [CrossRef]
  23. Ingersoll, J.E., Jr.; Ross, S.A. Waiting to Invest: Investment and Uncertainty. J. Bus. 1992, 65, 1–29. [Google Scholar] [CrossRef]
  24. Meng, X.; Guo, H.; Li, J. Economic Policy Uncertainty and Corporate Investment: Evidence from China. Econ. Change Restruct. 2023, 56, 4491–4529. [Google Scholar] [CrossRef]
  25. Dreyer, C.; Schulz, O. Policy Uncertainty and Corporate Investment: Public Versus Private Firms. Rev. Manag. Sci. 2022, 17, 1863–1898. [Google Scholar] [CrossRef]
  26. Akron, S.; Demir, E.; Díez-Esteban, J.M.; García-Gómez, C.D. Economic Policy Uncertainty and Corporate Investment: Evidence from the U.S. Hospitality Industry. Tour. Manag. 2020, 77, 104019. [Google Scholar] [CrossRef]
  27. Wu, W.; Zhao, J. Economic Policy Uncertainty and Household Consumption: Evidence from Chinese Households. J. Asian Econ. 2022, 79, 101436. [Google Scholar] [CrossRef]
  28. Gu, Y.; Jiang, G.; Liang, X. The Transmission Mechanism Analysis of the Impact of Economic Policy Uncertainty on Household Consumption. Int. Stud. Econ. 2022, 17, 371–393. [Google Scholar] [CrossRef]
  29. Coibion, O.; Georgarakos, D.; Gorodnichenko, Y.; Kenny, G.; Weber, M. The Effect of Macroeconomic Uncertainty on Household Spending. Am. Econ. Rev. 2024, 114, 645–677. [Google Scholar] [CrossRef]
  30. Phan, D.H.B.; Iyke, B.N.; Sharma, S.S.; Affandi, Y. Economic Policy Uncertainty and Financial Stability–Is There a Relation? Econ. Model. 2021, 94, 1018–1029. [Google Scholar] [CrossRef]
  31. Aman, A.; Anwar, S.; Khan, M.A.; Haddad, H.; Al-Ramahi, N.M.; Khan, M.A. Economic Policy Uncertainty and Financial System Efficiency. Heliyon 2024, 10, e31384. [Google Scholar] [CrossRef]
  32. Carballo, J.; Handley, K.; Limão, N. Economic and Policy Uncertainty: Aggregate Export Dynamics and the Value of Agreements. J. Int. Econ. 2022, 139, 1036601. [Google Scholar] [CrossRef]
  33. Yayi, C.L. Economic Policy Uncertainty and Trade: Does Export Sophistication Matter? Appl. Econ. 2023, 56, 169–185. [Google Scholar] [CrossRef]
  34. Caldara, D.; Iacoviello, M.; Molligo, P.; Prestipino, A.; Raffo, A. The Economic Effects of Trade Policy Uncertainty. J. Monet. Econ. 2020, 109, 38–59. [Google Scholar] [CrossRef]
  35. Wang, C.-W.; Lee, C.-C.; Chen, M.-C. The Effects of Economic Policy Uncertainty and Country Governance on Banks’ Liquidity Creation: International Evidence. Pac. -Basin Financ. J. 2022, 71, 101708. [Google Scholar] [CrossRef]
  36. Ali, K.; Hongbing, H.; Liew, C.Y.; Jianguo, D. Governance Perspective and the Effect of Economic Policy Uncertainty on Financial Stability: Evidence from Developed and Developing Economies. Econ. Change Restruct. 2023, 56, 1971–2002. [Google Scholar] [CrossRef]
  37. Ma, H.; Hao, D. Economic Policy Uncertainty, Financial Development, and Financial Constraints: Evidence from China. Int. Rev. Econ. Financ. 2022, 79, 368–386. [Google Scholar] [CrossRef]
  38. Yang, J.Y. Policy Uncertainty and Substitution between External Financing and Internal Funds: International Evidence. Res. Int. Bus. Financ. 2023, 66, 102083. [Google Scholar] [CrossRef]
  39. Lu, J.; Lv, L.; Wang, Y.; Zhu, Y. The Real Effect of Monetary Policy under Uncertainty: Evidence from the Change in Corporate Financing Purposes. J. Bank. Financ. 2025, 172, 107381. [Google Scholar] [CrossRef]
  40. Wang, X.; Li, J.; Ren, X.; Bu, R.; Jawadi, F. Economic Policy Uncertainty and Dynamic Correlations in Energy Markets: Assessment and Solutions. Energy Econ. 2023, 117, 106475. [Google Scholar] [CrossRef]
  41. Liu, R.; He, L.; Liang, X.; Yang, X.; Xia, Y. Is There Any Difference in the Impact of Economic Policy Uncertainty on the Investment of Traditional and Renewable Energy Enterprises?—A Comparative Study Based on Regulatory Effects. J. Clean. Prod. 2020, 255, 120102. [Google Scholar] [CrossRef]
  42. Alberini, A.; Ščasný, M.; Czajkowski, M.; Bigano, A. Volatile Energy Markets, Consumers and Energy Price Expectations. Energy Econ. 2023, 126, 107039. [Google Scholar] [CrossRef]
  43. Klayme, T.; Gokmenoglu, K.K.; Rustamov, B. Economic Policy Uncertainty, Covid-19 and Corporate Investment: Evidence from the Gold Mining Industry. Resour. Policy 2023, 85, 103787. [Google Scholar] [CrossRef]
  44. Shafiullah, M.; Miah, M.D.; Alam, M.S.; Atif, M. Does Economic Policy Uncertainty Affect Renewable Energy Consumption? Renew. Energy 2021, 179, 1500–1521. [Google Scholar] [CrossRef]
  45. Jiao, Y.; Xiao, X.; Bao, X. Economic Policy Uncertainty, Geopolitical Risks, Energy Output and Ecological Footprint—Empirical Evidence from China. Energy Rep. 2022, 8, 324–334. [Google Scholar] [CrossRef]
  46. Zhang, M.; Abbasi, K.R.; Inuwa, N.; Sinisi, C.I.; Alvarado, R.; Ozturk, I. Does Economic Policy Uncertainty, Energy Transition and Ecological Innovation Affect Environmental Degradation in the United States? Econ. Res. -Ekon. Istraživanja 2023, 36, 2177698. [Google Scholar] [CrossRef]
  47. Jens, C.E.; Page, T.B. Uncertainty, Precautionary Saving, and Investment: Evidence from Prescheduled Election Cycles. Financ. Manag. 2024, 53, 431–470. [Google Scholar] [CrossRef]
  48. Benito, A. Does Job Insecurity Affect Household Consumption? Oxf. Econ. Pap. 2006, 58, 157–181. [Google Scholar] [CrossRef]
  49. Jiang, P.; Van Fan, Y.; Klemeš, J.J. Impacts of Covid-19 on Energy Demand and Consumption: Challenges, Lessons and Emerging Opportunities. Appl. Energy 2021, 285, 116441. [Google Scholar] [CrossRef]
  50. Gu, X.; Sheng, L.; Lei, C. Specialization or Diversification: A Theoretical Analysis for Tourist Cities. Cities 2022, 122, 103517. [Google Scholar] [CrossRef]
  51. Akdağ, S.; Kılıç, İ.; Gürlek, M.; Alola, A.A. Does Economic Policy Uncertainty Drive Outbound Tourism Expenditures in 20 Selected Destinations? Qual. Quant. 2022, 57, 4327–4337. [Google Scholar] [CrossRef] [PubMed]
  52. Demir, E.; Gozgor, G.; Paramati, S.R. To What Extend Economic Uncertainty Effects Tourism Investments? Evidence from Oecd and Non-Oecd Economies. Tour. Manag. Perspect. 2020, 36, 100758. [Google Scholar] [CrossRef]
  53. Shang, Y.; Yang, Q.; Pu, Y. Role of Foreign Direct Investment and Political Openness in Boosting the Eco-Tourism Sector for Achieving Sustainability. Humanit. Soc. Sci. Commun. 2024, 11, 72. [Google Scholar] [CrossRef]
  54. Luk, P.; Cheng, M.; Ng, P.; Wong, K. Economic Policy Uncertainty Spillovers in Small Open Economies: The Case of Hong Kong. Pac. Econ. Rev. 2020, 25, 21–46. [Google Scholar] [CrossRef]
  55. Luk, P. Economic Policy Uncertainty Index for Macao. Macao Monet. Res. Bull. 2019, 50, 75–88. [Google Scholar]
  56. Faust, J. The Robustness of Identified Var Conclusions About Money. Carnegie-Rochester Conf. Ser. Public Policy 1998, 49, 207–244. [Google Scholar] [CrossRef]
  57. Uhlig, H. What Are the Effects of Monetary Policy on Output? Results from an Agnostic Identification Procedure. J. Monet. Econ. 2005, 52, 381–419. [Google Scholar] [CrossRef]
  58. Canova, F.; De Nicoló, G. Monetary Disturbances Matter for Business Fluctuations in the G-7. J. Monet. Econ. 2002, 49, 1131–1159. [Google Scholar] [CrossRef]
  59. Sims, C.A.; Stock, J.H.; Watson, M.W. Inference in Linear Time Series Models with Some Unit Roots. Econometrica 1990, 58, 113–144. [Google Scholar] [CrossRef]
  60. Hailemariam, A.; Dzhumashev, R. The Impact of Pandemic-Induced Uncertainty Shock on Tourism Demand. Curr. Issues Tour. 2022, 26, 2575–2581. [Google Scholar] [CrossRef]
  61. Wang, Y.; Kong, D. Economic Policy Uncertainty and the Energy Stock Market: Evidence from China. Energy Res. Lett. 2022, 3, 28171. [Google Scholar] [CrossRef]
  62. Cai, K.; Sun, C.; Wang, H.; Song, Q.; Wang, C.; Wang, P. The Potential Challenge for the Effective Ghg Emissions Mitigation of Urban Energy Consumption: A Case Study of Macau. Environ. Impact Assess. Rev. 2022, 93, 106717. [Google Scholar] [CrossRef]
  63. Redl, C. Uncertainty Matters: Evidence from Close Elections. J. Int. Econ. 2020, 124, 103296. [Google Scholar] [CrossRef]
  64. Solarin, S.A.; Gil-Alana, L.A. The Persistence of Economic Policy Uncertainty: Evidence of Long Range Dependence. Phys. A: Stat. Mech. Its Appl. 2021, 568, 125698. [Google Scholar] [CrossRef]
  65. Albert, J.-F.; Gómez-Fernández, N. The Impact of Economic and Policy Uncertainty Shocks in Spain. J. Econ. Policy Reform 2020, 24, 270–291. [Google Scholar] [CrossRef]
  66. Redl, C. The Impact of Uncertainty Shocks in the United Kingdom. In Bank of England Staff Working Paper No. 695; Bank of England: London, UK, 2017. [Google Scholar]
  67. Davis, S.J.; Liu, D.; Sheng, X.S. Economic Policy Uncertainty in China since 1949: The View from Mainland Newspapers. Fourth Annu. IMF-Atlanta Fed Res. Workshop China’s Econ. Atlanta 2019, 19, 1–37. [Google Scholar]
  68. Rholes, R.; Petersen, L. Should Central Banks Communicate Uncertainty in Their Projections? J. Econ. Behav. Organ. 2021, 183, 320–341. [Google Scholar] [CrossRef]
  69. Wolf, C.K. What Can We Learn from Sign-Restricted Vars? AEA Pap. Proc. 2022, 112, 471–475. [Google Scholar] [CrossRef]
  70. Zhou, X.; Xing, S.; Xu, J.; Tian, J.; Niu, A.; Lin, C. Impacts of Climate Change Risk and Economic Policy Uncertainty on Carbon Prices: Configuration Analysis from a Complex System Perspective. J Environ. Manag. 2025, 373, 123622. [Google Scholar] [CrossRef]
  71. Azqueta-Gavaldón, A.; Hirschbühl, D.; Onorante, L.; Saiz, L. Sources of Economic Policy Uncertainty in the Euro Area. Eur. Econ. Rev. 2023, 152, 104373. [Google Scholar] [CrossRef]
Figure 1. Conceptual framework: theoretical linkages of EPU, tourism, and energy consumption.
Sustainability 17 03716 g001
Figure 3. The time series employed in the VAR model. Source: Statistics and Census Service of Macau (DSEC).
Sustainability 17 03716 g003
Figure 4. Impulse responses to a one-standard-deviation structural shock in the baseline model. Note: The solid line represents the posterior median at each horizon, and the shaded area indicates the 68th posterior probability region of the estimated impulse responses. Panel (a) represents baseline impulse response functions (IRFs) to EPU shock from Mainland China. Panel (b) represents baseline impulse response functions (IRFs) to EPU shock from Hong Kong. Panel (c) represents baseline impulse response functions (IRFs) to EPU shock from Macau.
Sustainability 17 03716 g004aSustainability 17 03716 g004b
Figure 5. Impulse responses to a one-standard-deviation structural shock in the agnostic model. Note: The solid line represents the posterior median at each horizon, and the shaded area indicates the 68th posterior probability region of the estimated impulse responses. (a) Agnostic impulse response functions (IRFs) to EPU shock from China. (b) Agnostic impulse response functions (IRFs) to EPU shock from Hong Kong. (c) Agnostic impulse response functions (IRFs) to EPU shock from Macau.
Sustainability 17 03716 g005
Figure 6. Impulse responses of hotel occupancy and electricity consumption to a one-standard-deviation EPU shock in Mainland China with various levels of persistence (1-quarter, 8-quarter, and 16-quarter). Note: The solid line represents the posterior median at each horizon, and the shaded area indicates the 68th posterior probability region of the estimated impulse responses.
Sustainability 17 03716 g006
Figure 7. Impulse responses with the alternative measure of Mainland China’s economic policy uncertainty index. Note: The solid line represents the posterior median at each horizon, and the shaded area indicates the 68th posterior probability region of the estimated impulse responses.
Sustainability 17 03716 g007
Figure 8. Impulse responses of the real GDP, hotel occupancy and electricity consumption to a one-standard-deviation EPU shock in the pre-COVID-19 pandemic sample. Note: The solid line represents the posterior median at each horizon, and the shaded area indicates the 68th posterior probability region of the estimated impulse responses. (a) Impulse response functions (IRFs) to EPU shock from China (pre-COVID-19 sample). (b) Impulse response functions (IRFs) to EPU shock from Hong Kong (pre-COVID-19 sample). (c) Impulse response functions (IRFs) to EPU shock from Hong Kong (pre-COVID-19 sample).
Sustainability 17 03716 g008
Table 1. Sign restrictions in the SVAR model.
ModelBaseline ModelAgnostic Model
Variables
Uncertainty indices++
Gross domestic product
Hotel occupancy rate
Energy consumption: WaterNA
ElectricityNA
GasNA
Note: The “+” and “−” signs represent positive and negative restrictions on the IRFs in response to the EPU shock, while “NA” indicates the absence of any sign restrictions.
Disclaimer/Publisher’s Note: The statements, opinions and data contained in all publications are solely those of the individual author(s) and contributor(s) and not of MDPI and/or the editor(s). MDPI and/or the editor(s) disclaim responsibility for any injury to people or property resulting from any ideas, methods, instructions or products referred to in the content.

