Article

The Influence of “Industry–City–Innovation” Functional Mixing on the Innovative Development of Sci-Tech Parks Under the Background of Urbanization

School of Architecture and Urban Planning, Anhui Jianzhu University, Hefei 230601, China
*
Author to whom correspondence should be addressed.
Sustainability 2025, 17(8), 3715; https://doi.org/10.3390/su17083715
Submission received: 11 March 2025 / Revised: 5 April 2025 / Accepted: 11 April 2025 / Published: 20 April 2025

Abstract

The development of sci-tech parks (STPs), as the spatial carrier of urbanization and the growth pole of the innovation economy, cannot be separated from the integration of the three key elements of “industry”, “city”, and “innovation”. This study selects the Hangzhou West Hi-Tech Corridor, which represents the forefront of development practice of China’s STPs and which is a high-quality model with highly integrated “industry–city–innovation” functions, as a case. By using multi-source data, such as geographic information and the point of interest (POI), and research methods, such as the Shannon entropy index and quadratic curve regression, this study examines the influence of “industry–city–innovation” functional mixing on the innovative development of STPs, and explores the optimal mixing degree interval. The results show that the mixing of “industry–city–innovation” functions can promote the STPs’ innovative development, to a certain extent, in the spatial design of urban planning. However, higher mixing is not always better, and excessively high mixing may inhibit innovative development. The optimal functional mixing degree conducive to the STPs’ innovative development is in the range of 0.14 to 0.16. This study is an effective application of the “industry¬–city–innovation” integration theory, provides a constant source of power for urban innovative development, and acts as a reference for future new cities and STPs.

1. Introduction

Since the 21st century, with the acceleration of globalization and the integration of the world economy, the core competitiveness between countries and regions has increasingly been reflected in the competition for independent innovation and technological strength. By supporting high-tech enterprises and fostering innovation ecosystems, they seek to bolster national competitiveness [1]. China is undergoing a critical phase of innovation-driven transformation. Since the 18th National Congress of the Communist Party of China introduced the innovation-driven development strategy, innovation has become the leading force driving progress. Implementing various strategies and plans has set even higher expectations for the country’s future of urban construction and development. As essential spatial carriers of urbanization, sci-tech parks (STPs) have become innovation growth poles that support the development of a modern economic system [2].
Technological innovation is a key driving force behind the urbanization process [3]. Innovation is not limited to breakthroughs in technology; structural changes in the economy also have a profound impact on industrial development, thereby promoting the expansion and functional upgrading of cities [4]. As urbanization continues, large-scale infrastructure construction, the improvement of public service systems, and the comprehensive coverage of transportation networks provide a favorable space for innovation to thrive [5]. This ecosystem not only enhances the city’s overall competitiveness but also plays a crucial role in the industrial layout, public service infrastructure development, talent attraction, and urban functional planning [6,7,8]. Innovation is not only the driving force behind economic growth but also an indispensable strategic support for the development of future cities, determining the potential and vitality of sustainable urban growth. STPs are considered to be key drivers of innovative economic activities and are important tools for countries and regions to achieve sustainable development [9]. The integration of the three key functions of “industry”, “city”, and “innovation” has become more prominent in driving the development of new cities, which is in line with current trends. For instance, Silicon Valley, London’s Tech City, Tokyo’s Innovation Hub, Waterloo Innovation Park, and Munich Technology Park are all representative examples of the integration of “industry”, “city”, and “innovation”. These regions leverage top-tier research institutions, supportive government policies, efficient urban infrastructure, and strong venture capital ecosystems to attract high-tech industries, such as artificial intelligence, clean energy, life sciences, and robotics. Through collaborations between universities, incubators, and enterprises, they demonstrate how technological innovation and urban development can reinforce each other, creating dynamic ecosystems that promote the growth of STPs and new urban forms. These practical examples further illustrate how the combination of “industry”, “city”, and “innovation” can significantly promote the development of STPs and new cities.
STPs are a new form of industrial park that emerged during the innovation-driven era. Their development can be traced back to the origins of traditional industrial parks [10]. With the advancement of urbanization and industrial upgrading, traditional industrial parks have gradually transformed into STPs [11]. These parks not only drive industrial development but also serve as extensions of urban functions, providing innovation vitality and economic growth momentum. However, traditional industrial parks often focus on a single industrial function, isolated from other urban functions, while neglecting the living needs of employees and the development of innovation ecosystems. Although this model facilitated the development of manufacturing industries, the fragmented functional layout has become inadequate to meet the demands of modern technology enterprises and innovative talent for efficient and integrated spaces in the evolving global innovation landscape. “Industry”, “city”, and “innovation” are the three key factors driving the innovative development of STPs [12]. Their organic spatial mixing enables optimized resource allocation, enhances the parks’ overall vitality, and improves spatial utilization.
Against the backdrop of urbanization transformation and innovation-driven development, this study focuses on the effective mixing of “industry–city–innovation” functions to better promote the innovative development of STPs. It addresses the practical needs arising in the transition from traditional industrial parks to STPs. Previous research has primarily explored the following three aspects: the origins and evolutionary trends of STPs, studies related to the mixing of “industry–city–innovation” functions, and the factors influencing the innovative development of STPs [13,14,15].
A large body of literature indicates that the development of STPs can be traced back to industrial parks [16,17,18]. With the advancement of urbanization and the transformation and upgrading of industries, these parks have gradually evolved into STPs. Industrial parks originated in industrialized countries in the late 19th century. They were designed to manage and promote industrial development. They served as spatial carriers for industry and hubs for enterprise aggregation [19]. Early industrial parks were characterized by labor-intensive operations, remote locations, single-function designs, and centralized layouts, focusing primarily on meeting basic production requirements with limited consideration for living facilities. With the acceleration of urbanization and continuous technological advancements, such as cloud computing, big data, and artificial intelligence, industrial parks gradually evolved into STPs. The world’s first STP was established by Stanford University in the 1950s, laying the foundation for the development of Silicon Valley [20]. This inspired developed countries and regions to experiment with establishing STPs characterized by technology-driven economic growth. Prominent examples include Cambridge Science Park in the UK, Boston Route 128 in the US, and Tsukuba Science City in Japan. China’s industrial park development began in the 1980s and is closely aligned with the urbanization process. Early practices often drew from Western models. Since the reform and opening up, China’s coastal cities have gradually established economic and technological development zones, marking the start of developing industrial parks across the country. In 1985, the Shenzhen Shekou Industrial Zone became China’s first industrial park pilot, sparking a nationwide wave of park development [21]. By the 1990s, scientific and technological innovations had significantly improved productivity, leading to the emergence of STPs [22]. Notable examples include Beijing Zhongguancun Science Park and Shanghai Zhangjiang High-Tech Park [23]. As capital- and technology-intensive industries flourished, enterprises’ demands for parks evolved. These demands manifested in multifunctional designs incorporating science and technology R&D, business offices, residential areas, and public service facilities, forming an integrated “industry–city–innovation” development model dominated by technological talent [24]. As hubs for high-tech enterprises, science, and innovation, the parks serve as critical spatial carriers for regional economic development and play a pivotal role in national scientific and technological innovation and industrial transformation. They are instrumental in fostering innovation and accelerating the transfer of knowledge.
The development of STPs is inseparable from the mix of the three key elements of “industry–city–innovation” and the various functional spaces surrounding the park. Research on functional mixing can be traced back to Howard’s “Garden City” concept in 1898, which advocated for the construction of new towns near major cities to decentralize population and industries. This concept gave rise to theories such as “satellite cities” and “organic evacuation” [25]. In 1933, the Athens Charter introduced the theory of functional zoning, proposing that urban functions—residence, work, reinnovation, and transportation—should be rationally allocated to ensure efficient operation [26]. With the acceleration of suburbanization, the construction of industrial new towns around megacities surged. However, this zoning model disrupted the organic connections within traditional communities [27]. In the 1950s, the “Central Business District” (CBD) model emerged. While this model concentrated activities during the day, parks often lost vitality at night, creating “dead city” phenomena [28]. In 1961, Jane Jacobs introduced the concept of mixed-use development [29], further promoted by the Charter of Machu Picchu, advocating comprehensive and flexible planning. Ideas such as the “compact city”, “new urbanism”, and “smart growth” also advanced the concept of functional mixing [30]. George B. Dantzig proposed the concept of the “compact city”, emphasizing high-density development, mixed land use, and efficient public transportation to achieve sustainable urban development [31]. Peter Calthorpe advanced the “new urbanism” philosophy, advocating for a people-centered urban vision that integrated compact development, mixed-use functionality, and public spaces with transit-oriented development (TOD) [32]. In response to the challenges of urban sprawl, the American Planning Association (APA) introduced “smart growth”, aiming to promote sustainable urban development through optimized land use, controlled unplanned expansion, ecological protection, and improved quality of life [33].
The current widespread use of functional mixing in the development of new cities and the construction of STPs further promotes economic growth, improves supporting living facilities, and drives high-quality development of innovation. James F. Moore’s innovation ecosystem theory advocates that science and innovation parks should build an ecological network encompassing enterprises, universities, governments, etc., to achieve knowledge flow and resource complementarity through functional integration [34]. The Finnish government-proposed “living lab” model treats urban spaces as “living labs”, promoting industry–city integration through collaborative development among residents, enterprises, and governments [35]. Geyer proposed that functional mixing plays a key role in the design and operation of STPs. It helps to improve the resource utilization efficiency, reduce the operational costs, and enhance the STPs’ attractiveness and competitiveness [36]. Zhou Yinan, by analyzing the influence of functional mixing on innovative areas, concluded that functional mixing can promote the efficient coordination and development between regions, optimize spatial layouts, and make life and work more convenient and efficient for the people using these spaces [37].
Previous studies on functional mixing have focused primarily on measuring the functional mixing degree, identifying mixing types, and examining mixing at various scales. Regarding the mixing degree measurement, Momeni et al. used metrics such as the Simpson index, Shannon entropy index, and entropy index to assess diversity [38]. Motieyan applied reachability analysis to calculate the distances between different functions [39], while Zhou Xinggang evaluated whether different functions were complementary or exclusionary, as well as their overall compatibility [40]. Deng Pingzhi identified mixed types by integrating POI data with road networks [41], and Maino Fukui classified types based on the functional categories outlined in local urban planning laws [42]. Most research on functional mixing at different scales has focused on single-function micro-scales, such as block spaces [43], commercial spaces [44], and residential spaces [45]. At the urban scale, proportions are commonly studied across buildings, blocks, regions, and cities [46]. Hu Qiyu noted that macro-scale and meso-scale research on composite spaces remains underexplored. He emphasized that studying functional mixing at these scales is crucial for urban development [47]. While most scholars maintain a positive view of functional mixing and have explored measures, types, and scales, more gaps are required. For example, further quantitative studies are needed on the mixing types and their proportions. Moreover, limited attention has been given to studying the innovation and development of STPs from the perspective of the mixing of “industry–city–innovation” functions.
STPs are not only important spatial carriers of urbanization but also platforms that drive regional innovation economies and industrial transformation. The development of STPs is influenced by a variety of factors and conditions. From an external perspective, key factors include national policies, market environment, financial support, and industry–university research collaboration. For instance, Wu Yongchao analyzed the combination of university knowledge resources and superior market innovation resources, identifying the key factors that promote the innovation and the development of STPs [48]. Wu Yue examined STP development from the following two perspectives: the job–residence correlation and university innovation [49,50]. From an internal perspective, spatial distribution, supporting facilities, and functional zoning are significant influencing factors. Zhou Jingjing explored the composite design of infrastructure and public spaces in STPs from a micro-perspective [51]. Similarly, Weng Xiaohai identified the following six critical factors affecting STP development: the ability to share park resources, the park scale, the financing capacity, financial and legal policy services, administrative capabilities, and the level of park facility construction [52]. Some scholars have integrated both internal and external perspectives. For example, Zhong Yueshi analyzed STPs by considering the park dimensions, location, participants across different scales, and temporal factors [53]. Currently, most studies focus on analyzing the factors influencing the innovation and development of STPs from policy, economic, and market perspectives, with limited attention given to spatial planning dimensions. This gap highlights the need to further explore how spatial planning can impact the innovative development of STPs.
In summary, the shortcomings of previous studies regarding the influence of the mixing of “industry–city–innovation” functions on the innovative development of STPs are as follows:
  • The development of STPs has evolved from a focus on single industrial functions to the mix of comprehensive urban functions. While “industry”, “city”, and “innovation” are recognized as the three key elements driving the innovative development of STPs, most of the existing research emphasizes the dual-element mixing of industry and city. Relatively little attention has been given to the mixing of “industry–city–innovation” functions and its influence on the innovative development of STPs.
  • Previous studies generally support the concept of functional mixing. However, more quantitative research is needed on critical aspects such as the mixing types, quantities, and degrees.
  • The factors influencing the innovative development of STPs are predominantly analyzed from the perspectives of policy management, the market economy, and industry types. However, more research needs to focus on spatial planning, particularly the mixing of external spatial functions surrounding the STPs.
This study is conducted against urban transformation and innovation-driven development, addressing the practical need to shift from traditional industrial park models to STPs. It focuses on how the mixing of "industry–city–innovation” functions can be optimized to better support the innovative development of STPs. Previous research primarily focused on the origin and evolution of STPs, the mixing of “industry–city–innovation” functions, and the factors influencing the innovative development of STPs.
The Hangzhou West Hi-Tech Corridor (hereinafter referred to as “the Corridor”) serves as the central platform for Zhejiang Province’s innovation-driven strategy and a key hub for Hangzhou’s innovation resources. It represents the forefront of innovative development within China’s STPs. The Corridor brings together a variety of STPs, including the Alibaba Headquarters Park, Hai Chuang Park, and Dream Town, as well as world-class innovation platforms such as Zhejiang University, Westlake University, Zhejiang Laboratory, Alibaba Damo Academy, and the Supergravity Laboratory. It also incorporates local cultural heritage, such as “Cangqian Town” in Old Yuhang, and boasts exceptional natural conditions like the Xixi National Wetland, alongside comprehensive urban infrastructure and residential services. The Corridor is a distinctive research model for the active innovation and entrepreneurship ecosystem, characterized by a high degree of mixing of “industry–city–innovation” functions.
This study actively responds to the problems caused by the blind and rapid expansion of cities, and solves the contradiction between the space of STPs and the new demands of innovative enterprises and technological innovation talents. It takes the Corridor as a case, exploring the influence of the mixing of “industry–city–innovation” functions on the innovative development of STPs within the context of innovation-driven and urbanization transformation. The study summarizes the latest experiences in the integration of “industry–city–innovation” functions in China’s STPs, providing valuable insights for the future planning, design, and construction of such parks. This research holds theoretical value for supporting the strategies of new urbanization and innovation-driven development.
This paper focuses on the Corridor as the research subject, using multi-source data, such as geographic information and the POI, along with research methods like the Shannon entropy index and quadratic curve regression, to examine the influence of the mixing of “industry–city–innovation” functions on the innovative development of STPs. The study explores how the mixing of “industry–city–innovation” functions can better facilitate the innovative development of STPs. This research addresses the development trend of STPs moving towards the mixing of “industry–city–innovation” during urbanization. It seeks to resolve the contradiction between the single-function design around STPs and the disproportionate demand for science and innovation talents. Additionally, it enriches the theoretical body of research on mixing STPs and “industry–city–innovation”, while providing valuable references for the practical development of future urban parks.

2. Study Area, Data, and Methods
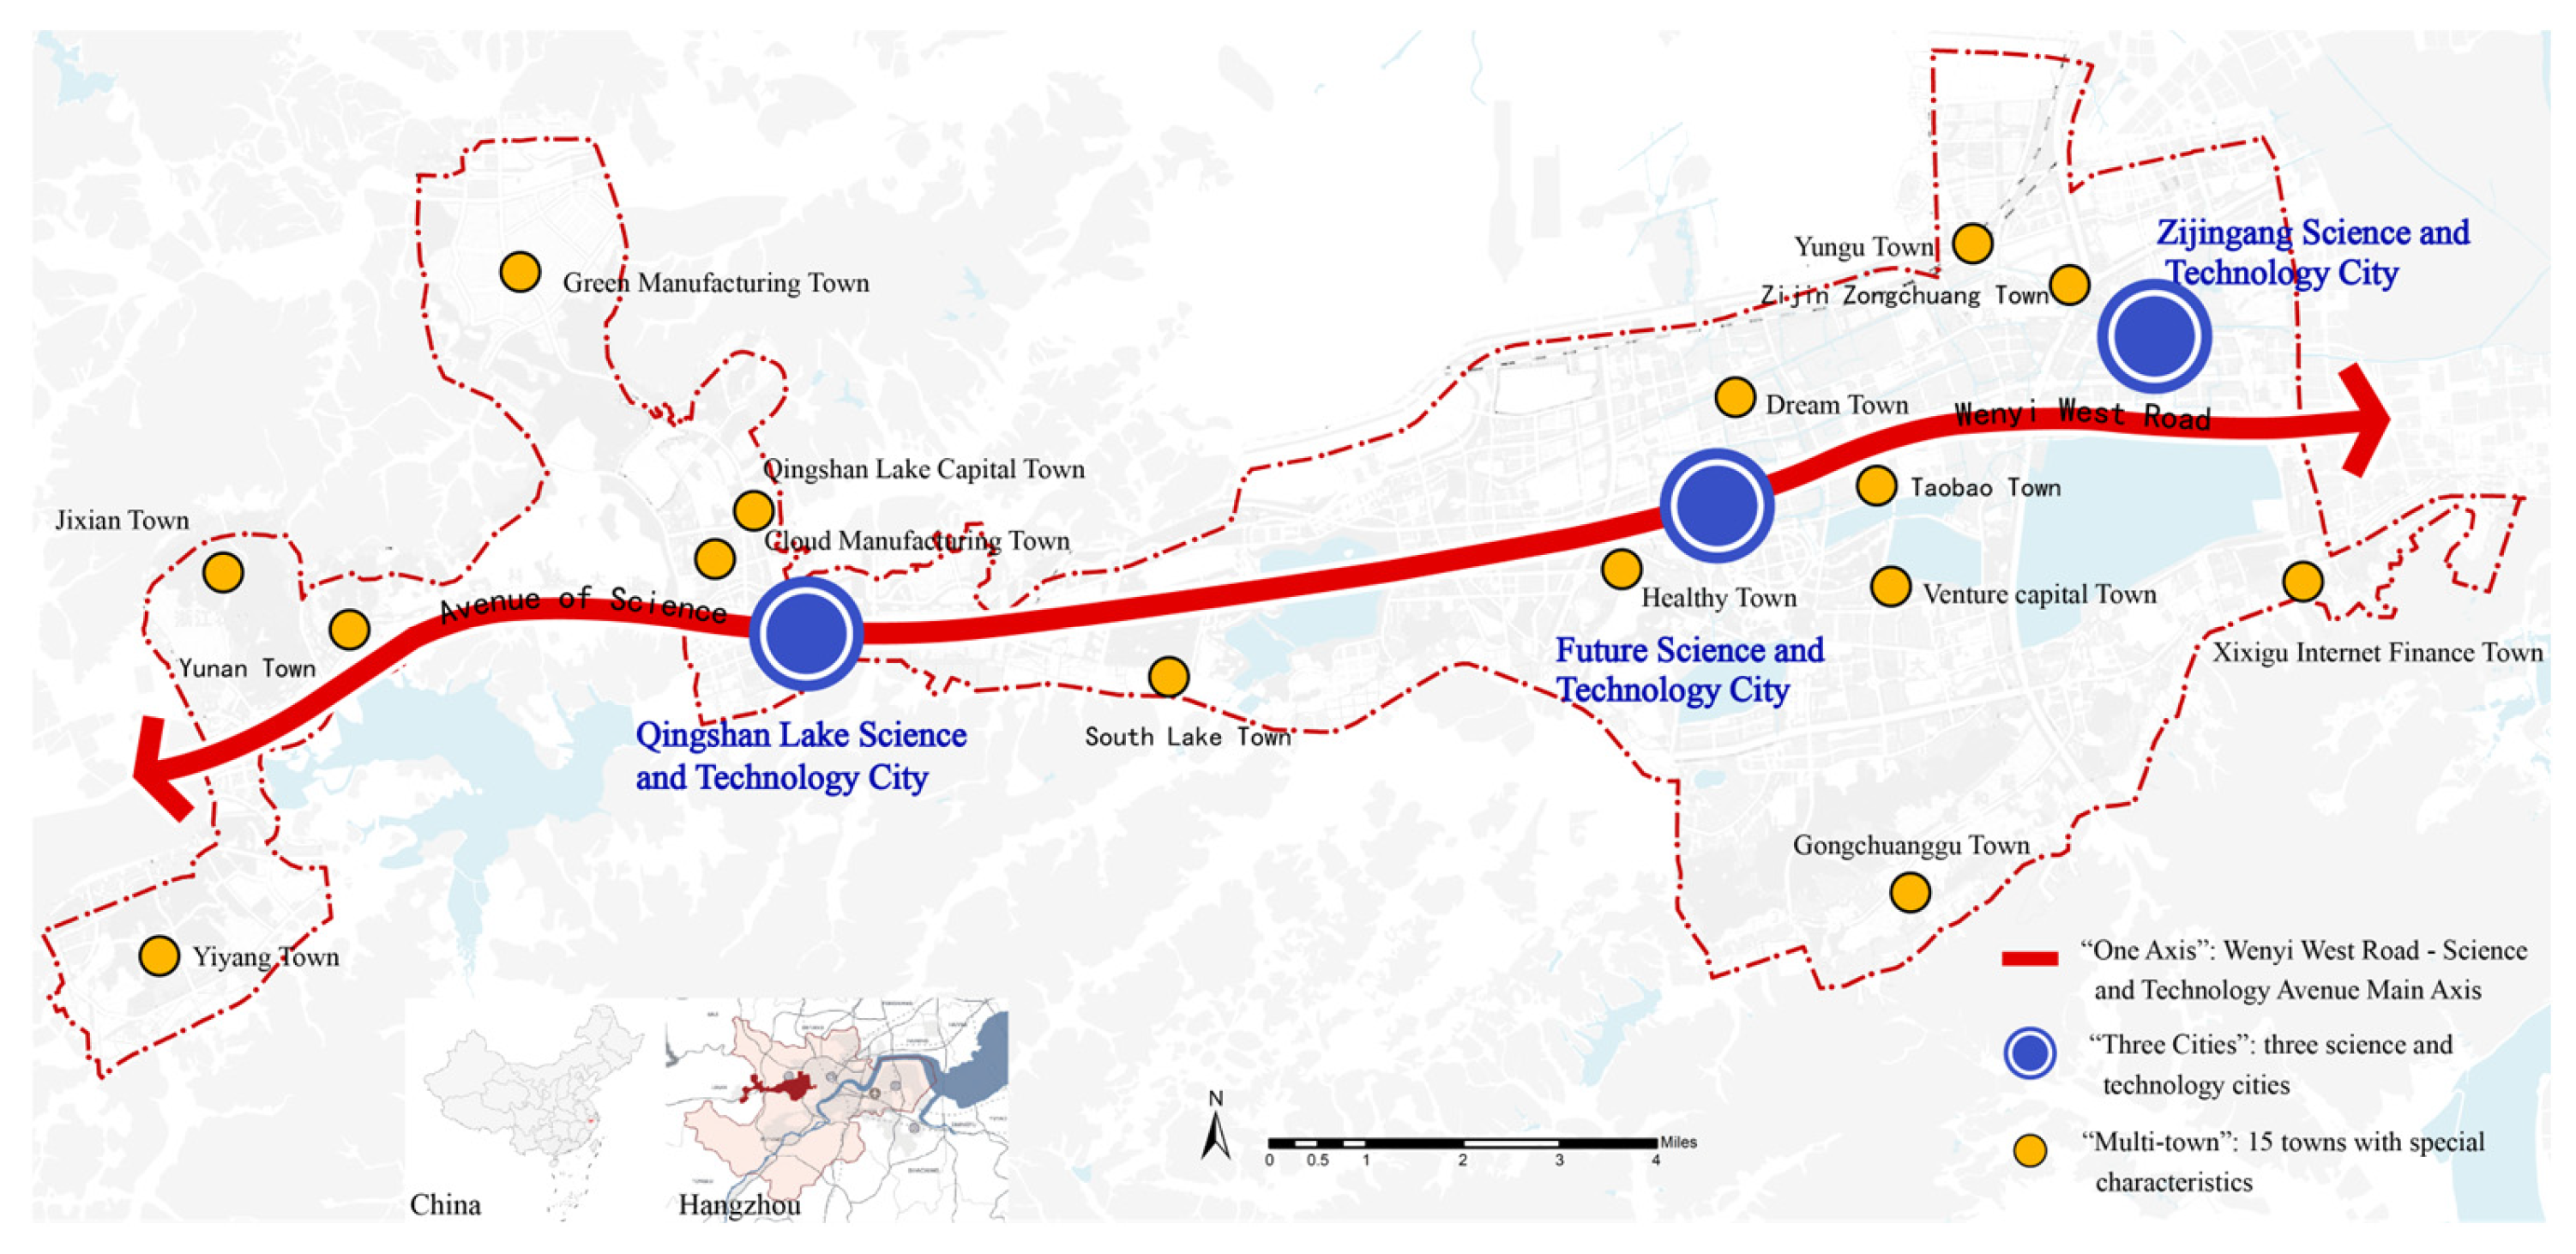
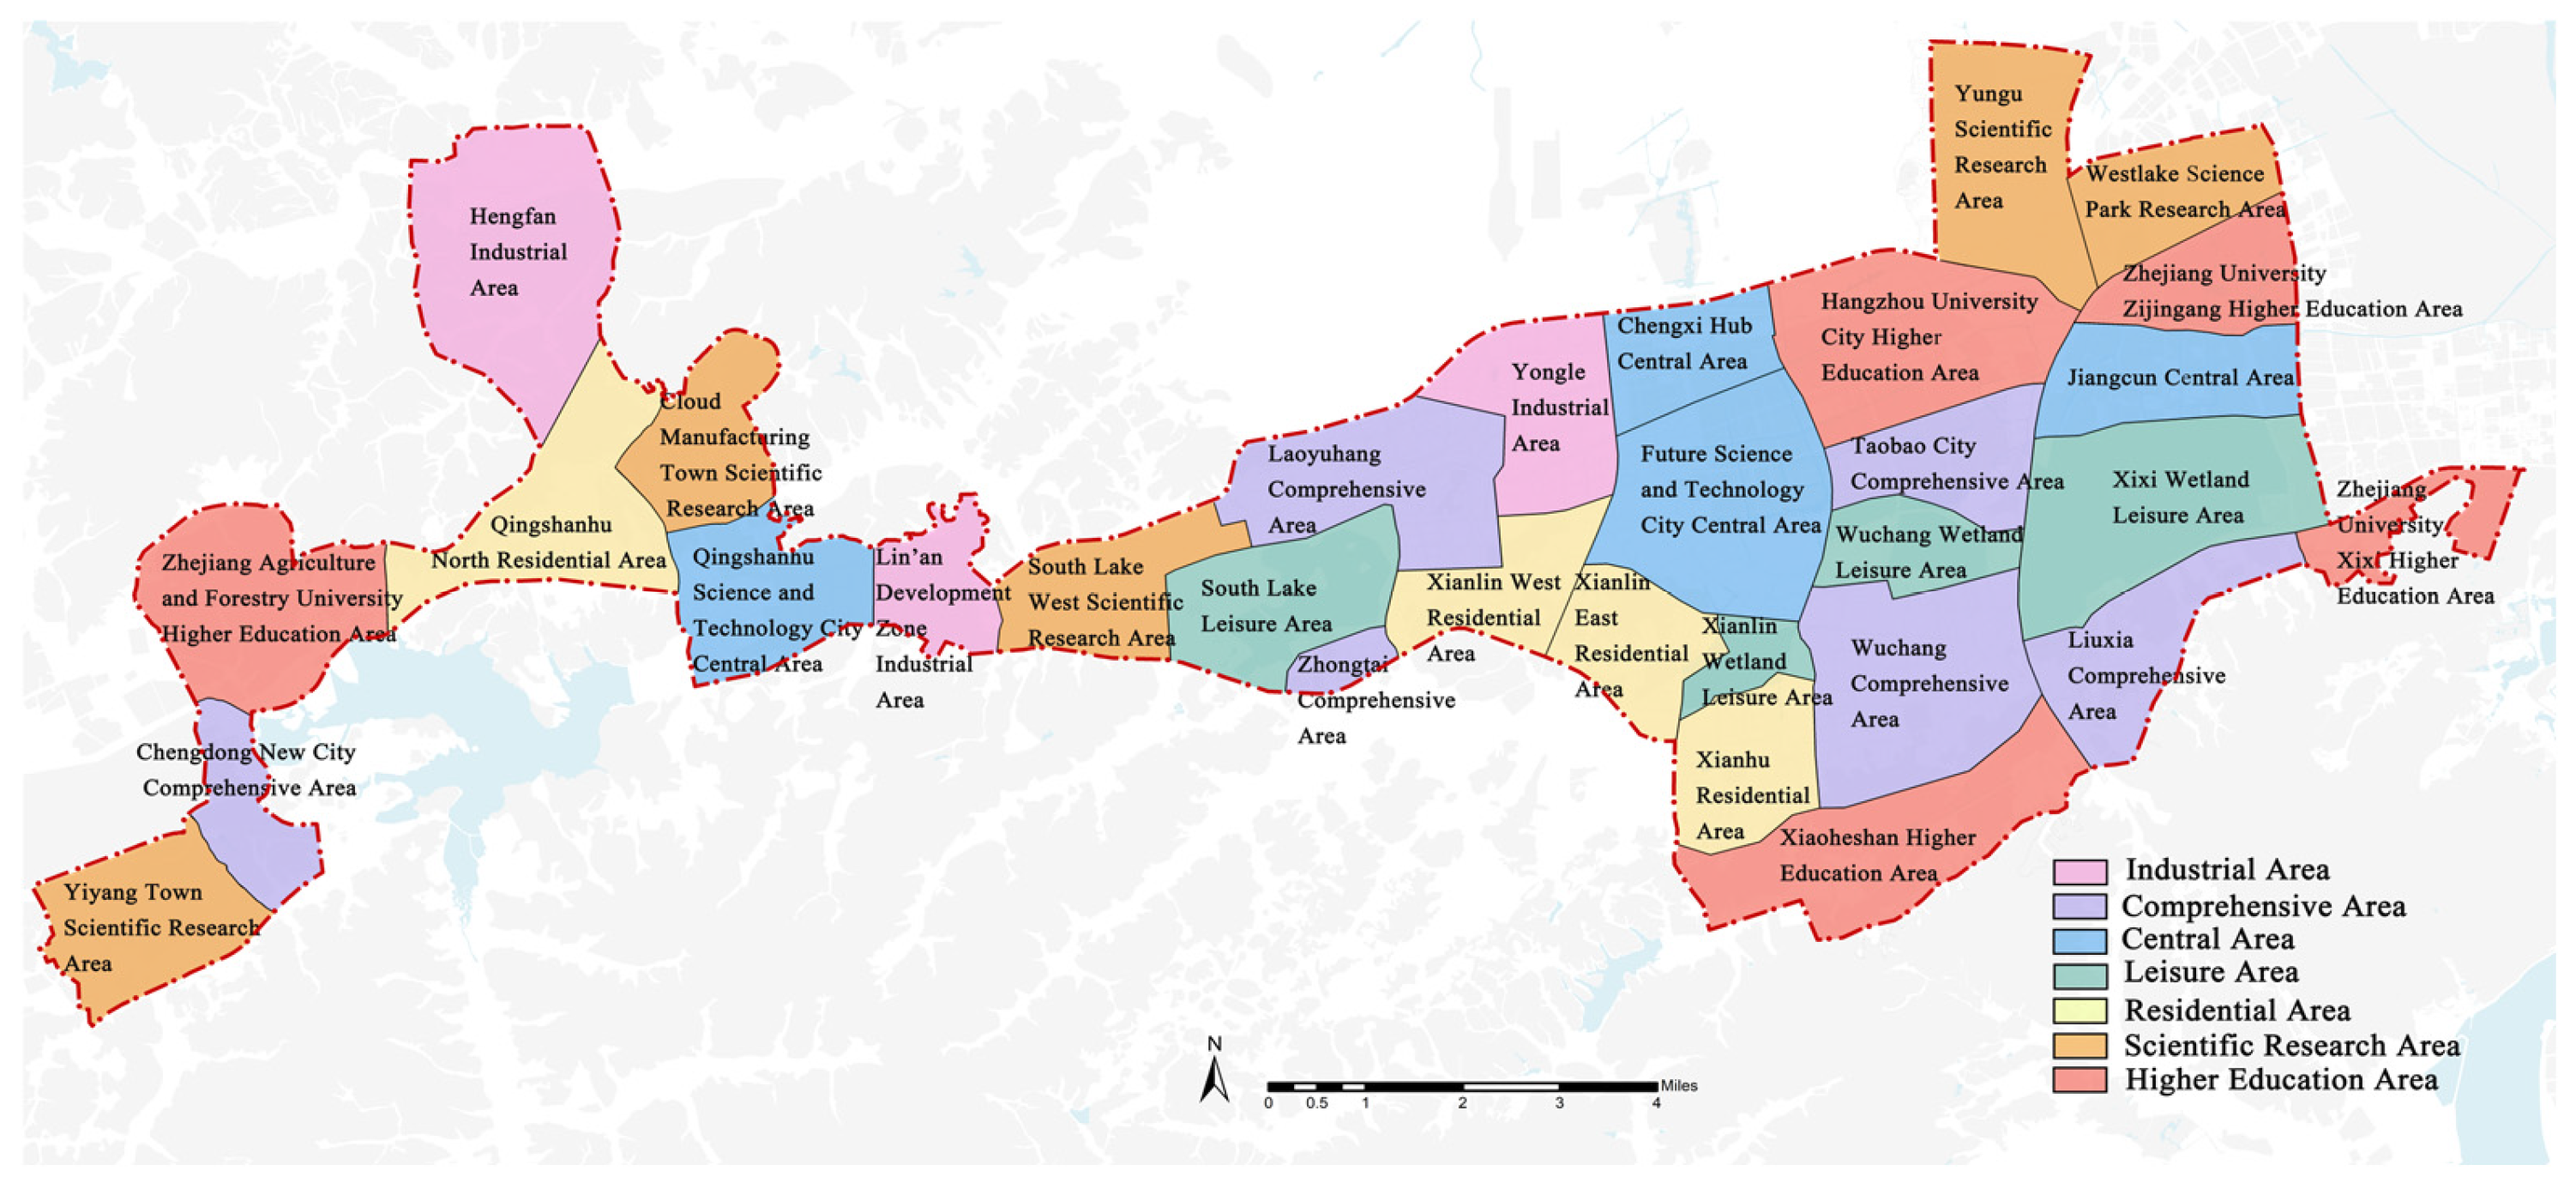
2.1. Study Area

In 2016, Zhejiang Province first proposed the strategic plan for the construction of the Hangzhou West Science and Innovation Corridor. In 2021, the “Hangzhou West Science and Innovation Corridor National Land Space Planning (2021–2035)” was compiled and approved. The Corridor is positioned as an “innovation source for the world, leading the future, serving the nation, and driving the province”, with the goal of becoming a globally leading information economy and innovation center, a core area for the national science center, and a pilot zone for future industries in the Yangtze River Delta region. The Corridor, situated in the western region of Hangzhou, Zhejiang Province, serves as a key platform for Zhejiang’s science and technology innovation strategy. It exemplifies the latest trend in the mixing of “industry–city–innovation” functions within the innovative development of STPs in China. The Corridor, by integrating research, industry, ecology, and policy resources, is gradually transforming from an “innovation corridor” to a “new urban center”, becoming a core engine driving high-quality development in Zhejiang and even across the country. At the same time, the Corridor hosts many different types of STPs, providing a rich sample for this research.
The Corridor spans Xihu District, Yuhang District, and Lin’an District, extending from Zhejiang University’s Zijingang Campus in the east to Zhejiang A&F University in the west. It covers approximately 33 square kilometers, with a total planned area of about 224 square kilometers. The Corridor encompasses 3 major science cities—Zijingang Science City, Future Sci-Tech City, and Qingshanhu Sci-Tech City—as well as 15 characteristic towns, forming a spatial layout described as “One belt, three cities and more towns” (see Figure 1). It plans 31 functional clusters across the following 7 types: central, research, higher education, industrial, residential, comprehensive, and leisure (see Figure 2). Each area is designed with diverse functions and shared facilities to foster innovation clustering, creating a high-quality spatial carrier for the mixing of “industry–city–innovation” functions and the innovative development of STPs. The Corridor is a hub for high-tech industries, research and education, and modern services, hosting various STPs such as the Alibaba Headquarters Park. It also features world-class innovation platforms like Zhejiang University and Zhejiang Laboratory, cultural landmarks such as “Cangqian Town” in Old Yuhang, the exceptional natural environment of Xixi National Wetland, and comprehensive urban services, including residential areas. These elements collectively contribute to its success. As a model for innovation-driven urban development, the Corridor demonstrates highly mixed “industry–city–innovation” functions, fostering a dynamic environment for innovation and entrepreneurship.

2.2. Data Source

2.2.1. “Industry–City–Innovation” POI Mixing Data

This study explores the influence of functional mixing on the innovative development of STPs from the perspective of “industry–city–innovation”. It focuses on the following three main research categories: “industry”, “city”, and “innovation”, and further categorizes them based on definitions provided by other scholars [54,55,56].This study references the National Land and Space Survey, Planning, and Use Control Classification Guidelines for Land and Sea Use (Trial) [57] and incorporates the specific characteristics of the study area to classify the land into 3 major categories, 17 subcategories, and several smaller categories. To ensure the rationality of the functional classification and the depth of the analysis, the “industry” function POI types are determined based on the number of enterprises included in each park. Ultimately, 17 subcategories are selected as the functional POI mixing types for the “industry–city–innovation” functions, which are the basis for calculating the functional mixing degree (see Table 1). The specific steps for acquiring the various types of POIs are as follows:
Step 1: Refer to the “AMap POI Classification and Coding Table” to select the classification codes and clarify the specific requirements.
Step 2: Set the data acquisition format. Acquire the data in text format, which include attributes like name, type, and latitude and longitude coordinates.
Step 3: Use the latitude and longitude coordinates of these data to perform spatial visualization projection in the ArcGIS platform.
Table 1. “Industry¬¬–city–innovation” functional POI classification.
CategoryPOI TypeExplanation
Industry” functionheadquarters parkHeadquarters buildings, headquarters office parks, visitor centers, etc.
science incubatorIndustrial parks, incubators, innovation parks, innovation and entrepreneurship bases, etc.
town of special characterVarious types of science and innovation industry-led special towns, etc.
business officeOffice buildings, offices, etc.
R&D Intelligence ParkPilot plant, test base, etc.
traditional industrial parksTraditional industrial parks, warehouses, transport facilities, etc.
City” functionliving areaResidential neighborhoods, villas, peasant houses, etc.
commercial nodeShopping centers, supermarkets, retail outlets, etc.
Greensboro PlazaParks, squares, places of interest, zoological and botanical gardens, etc.
educational facilityKindergartens, primary schools, secondary schools, etc.
medical facilityHospitals, clinics, emergency centers, pharmacies, etc.
transport facilitiesMetro stations, bus stops, shared bike parking spots, etc.
administrative bodyInstitutions, government agencies, offices, etc.
Innovation” functioncolleges and universitiesUniversities, colleges, private colleges, etc.
labsVarious laboratories at the national, provincial, ministerial, and local levels
research instituteResearch institutes, institutes, research centers, etc.
R&D centerR&D bases, R&D and pilot bases, technology development centers, etc.

2.2.2. Data on Innovative Development of STPs

The improvement of innovation capabilities, the accumulation of human resources, the continuous growth of asset levels, and economic benefits are the key indicators for evaluating the innovative development of technology-based SMEs. According to the National Standards for the Recognition and Classification of Technology-Based Enterprises (2019), intellectual property and the ability to commercialize scientific and technological achievements are critical metrics for assessing a company’s innovation capabilities. Scholars frequently use patent application data, particularly the status of invention and utility model patent applications, as a criterion for evaluating technological innovation [58]. Shanwei Li’s identification of government support, enterprise investment, and the transformation of scientific and technological achievements act as indicators affecting the innovation development of STPs [59]. Michael E. Araki found that policy support, industry–university cooperation, and capital accumulation are core factors influencing the development of STPs [60]. Shoufu Lin discovered that R&D investment, personnel density, and the number of intellectual property rights can impact the performance of STPs [61]. The China Enterprise Classification Standards (2011) categorize enterprises based on employee numbers, total assets, and revenue. This study collected data from 16,504 technology-based companies within the STPs of the Corridor, utilizing the national enterprise credit information platform “Tianyancha” and “Qichacha”, which provided access to business registration details and other corporate information (see Table 2). Tianyancha and Qichacha are leading Chinese platforms offering comprehensive corporate data, aggregating official records and web-scraped information to help users analyze company backgrounds, risks, and relationships. Regarding the acquisition of development indicators for science and technology innovation enterprises, the specific steps are as follows:
Step 1: Collect all enterprise names within the scope of each STP.
Step 2: Enter the enterprise name into the search bar, locate the relevant indicators, and collect them one by one. For multi-year data, retrieve them year by year.
Step 3: Copy the obtained content into an Excel spreadsheet by year. For multi-year data, calculate the averages, totals, medians, etc., by the indicator type to eliminate data errors and ensure the accuracy of the results.
Table 2. Development indicators of science and technology enterprises.
CategoryDependent
Variables
IndicatorExplanation
Enterprise scaleY1Number of employeesTotal number of employees in the science and technology enterprises
Financial performanceY2Registered capitalTotal amount of capital contribution actually paid by the shareholders of the science and technology enterprises
Y3Total sales revenueTotal revenue from all goods or services sold by the science and technology enterprises
Y4Total tax paymentTotal amount of taxes actually paid by the science and technology enterprises
Innovation capacityY5Number of intellectual propertiesTotal number of intellectual innovations of the enterprises, such as software copyrights, copyrights of works, patents, etc., as well as logos, names, etc., used in commerce
Y6Number of patentsNumber of patents in science and technology start-ups
Y7Total innovation contentThe total number of invention patents, invention patent authorizations, utility model patents, software copyrights, and design patents

2.3. Research Method

This study first employs the Shannon entropy index method to calculate the “industry–city–innovation” functional mixing degree. Subsequently, the quadratic curve regression method is applied, with the “industry–city–innovation” functional POI mixing degree as the independent variable X and the three main categories of the seven innovative development indicators of STPs as the dependent variable Y. Regression analysis is conducted for each indicator to explore the correlation between X and Y. Finally, based on the regression results, the vertex coordinates of various development indicators are determined, and the set intersection method is applied to identify the functional mixing interval that significantly influences the innovation development of these STPs (see Figure 3).

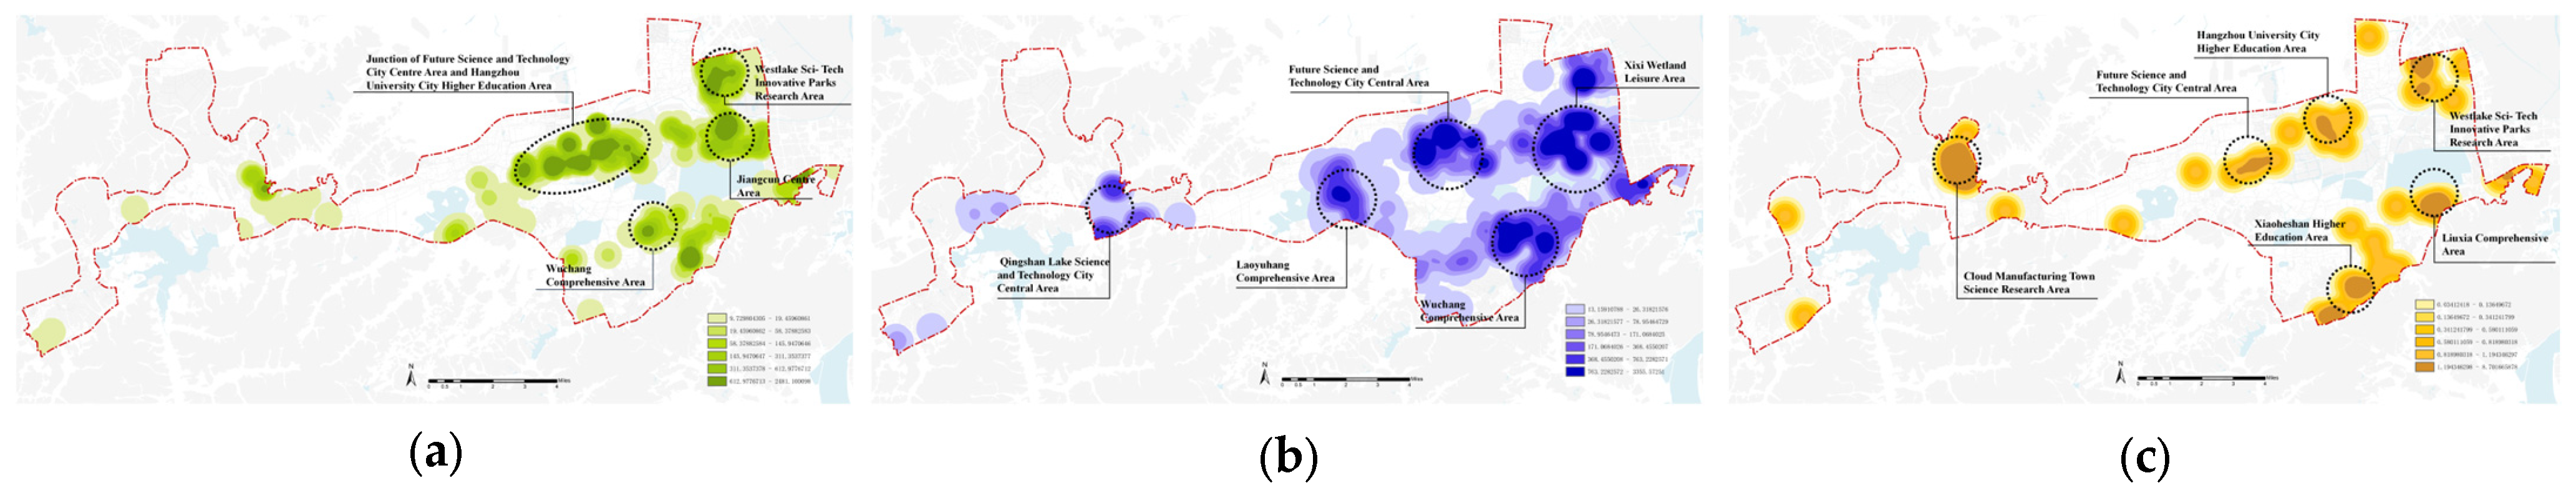
2.3.1. Kernel Density Estimation

Kernel Density Estimation (KDE) was first proposed by Murray Rosenblatt in 1956 and was further developed and refined by Emanuel Parzen in 1962 [62]. This method is widely used in the fields of spatial analysis and statistical analysis, primarily for estimating the probability density distribution of data. Common application scenarios include crime hotspot analysis, ecological and environmental studies, and urban functional layout research.
Building on the concept of “industry–city–innovation”, this study classifies POIs by considering the three components’ functional positioning, geographical location, target audience, and development model. ArcGIS is then employed to analyze the spatial distribution characteristics of the three types of POIs within the overall space of the Corridor.

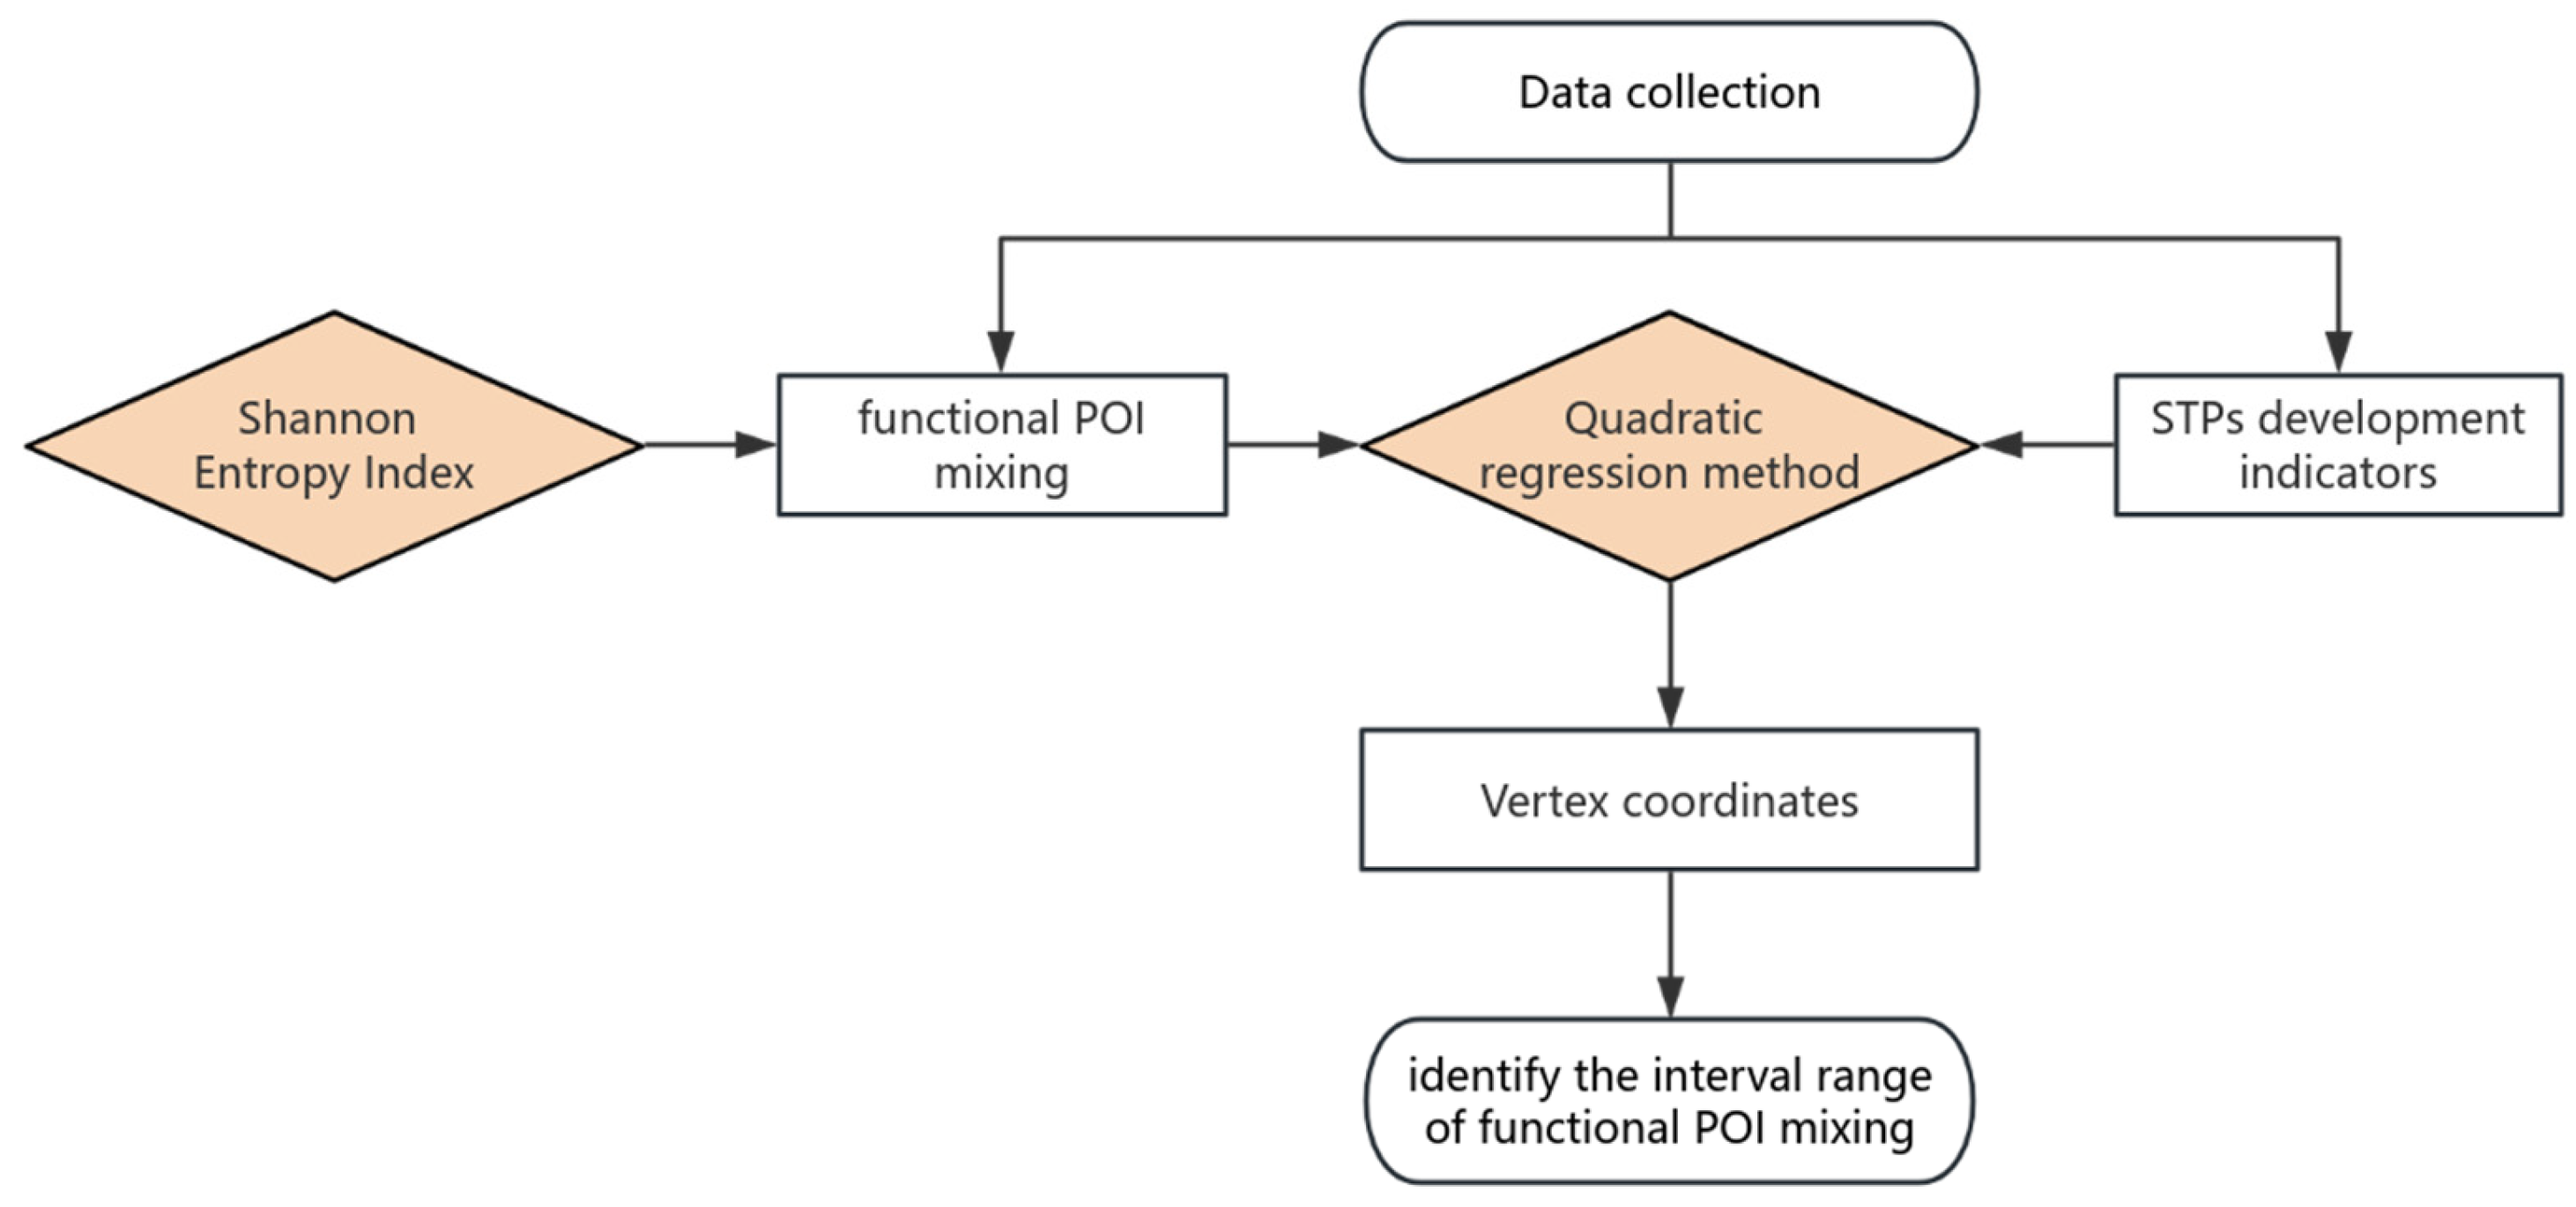
2.3.2. Shannon Entropy Index

The Shannon entropy index method is one of the most commonly used approaches for measuring the functional POI mixing degree [63]. Originally proposed by Claude Shannon in 1948 as part of information theory [64], this method estimates the uncertainty of random elements within a given event [65]. The greater the uncertainty of the variables, the higher the entropy and, consequently, the greater the amount of information required. This concept was later adapted by Dimas et al. [66] in the fields of urban planning and land-use studies to quantify the functional mixing degree. The specific formula used in this study is shown in Equation (1), as follows:
H ( x ) = i = 1 s p i l o g 2 p i
In Equation (1), H ( x ) represents the functional mixing degree within unit x, where x denotes the total number of functional types identified after the POI classification, and P i indicates the percentage of functional types in the region. The calculated value of the functional mixing degree ranges between 0 and 1. The value of 0 signifies that the region’s functions are completely homogeneous, meaning that only one functional type exists. Conversely, a value of 1 indicates that the region’s functions are entirely heterogeneous, with all functional types equally represented.
In this study, the Shannon entropy index was applied to measure the POI distribution of the following three functional elements: “industry”, “city”, and “innovation”. According to Equation (1), if only a single functional type exists within the sample range, the functional POI mixing degree value is 0. Conversely, if the proportions of the three functional types are equal, each accounting for 1/3, the functional POI mixing degree value reaches 0.48. Thus, in this study, the functional POI mixing degree range for “industry–city–innovation” is defined as [0, 0.48].

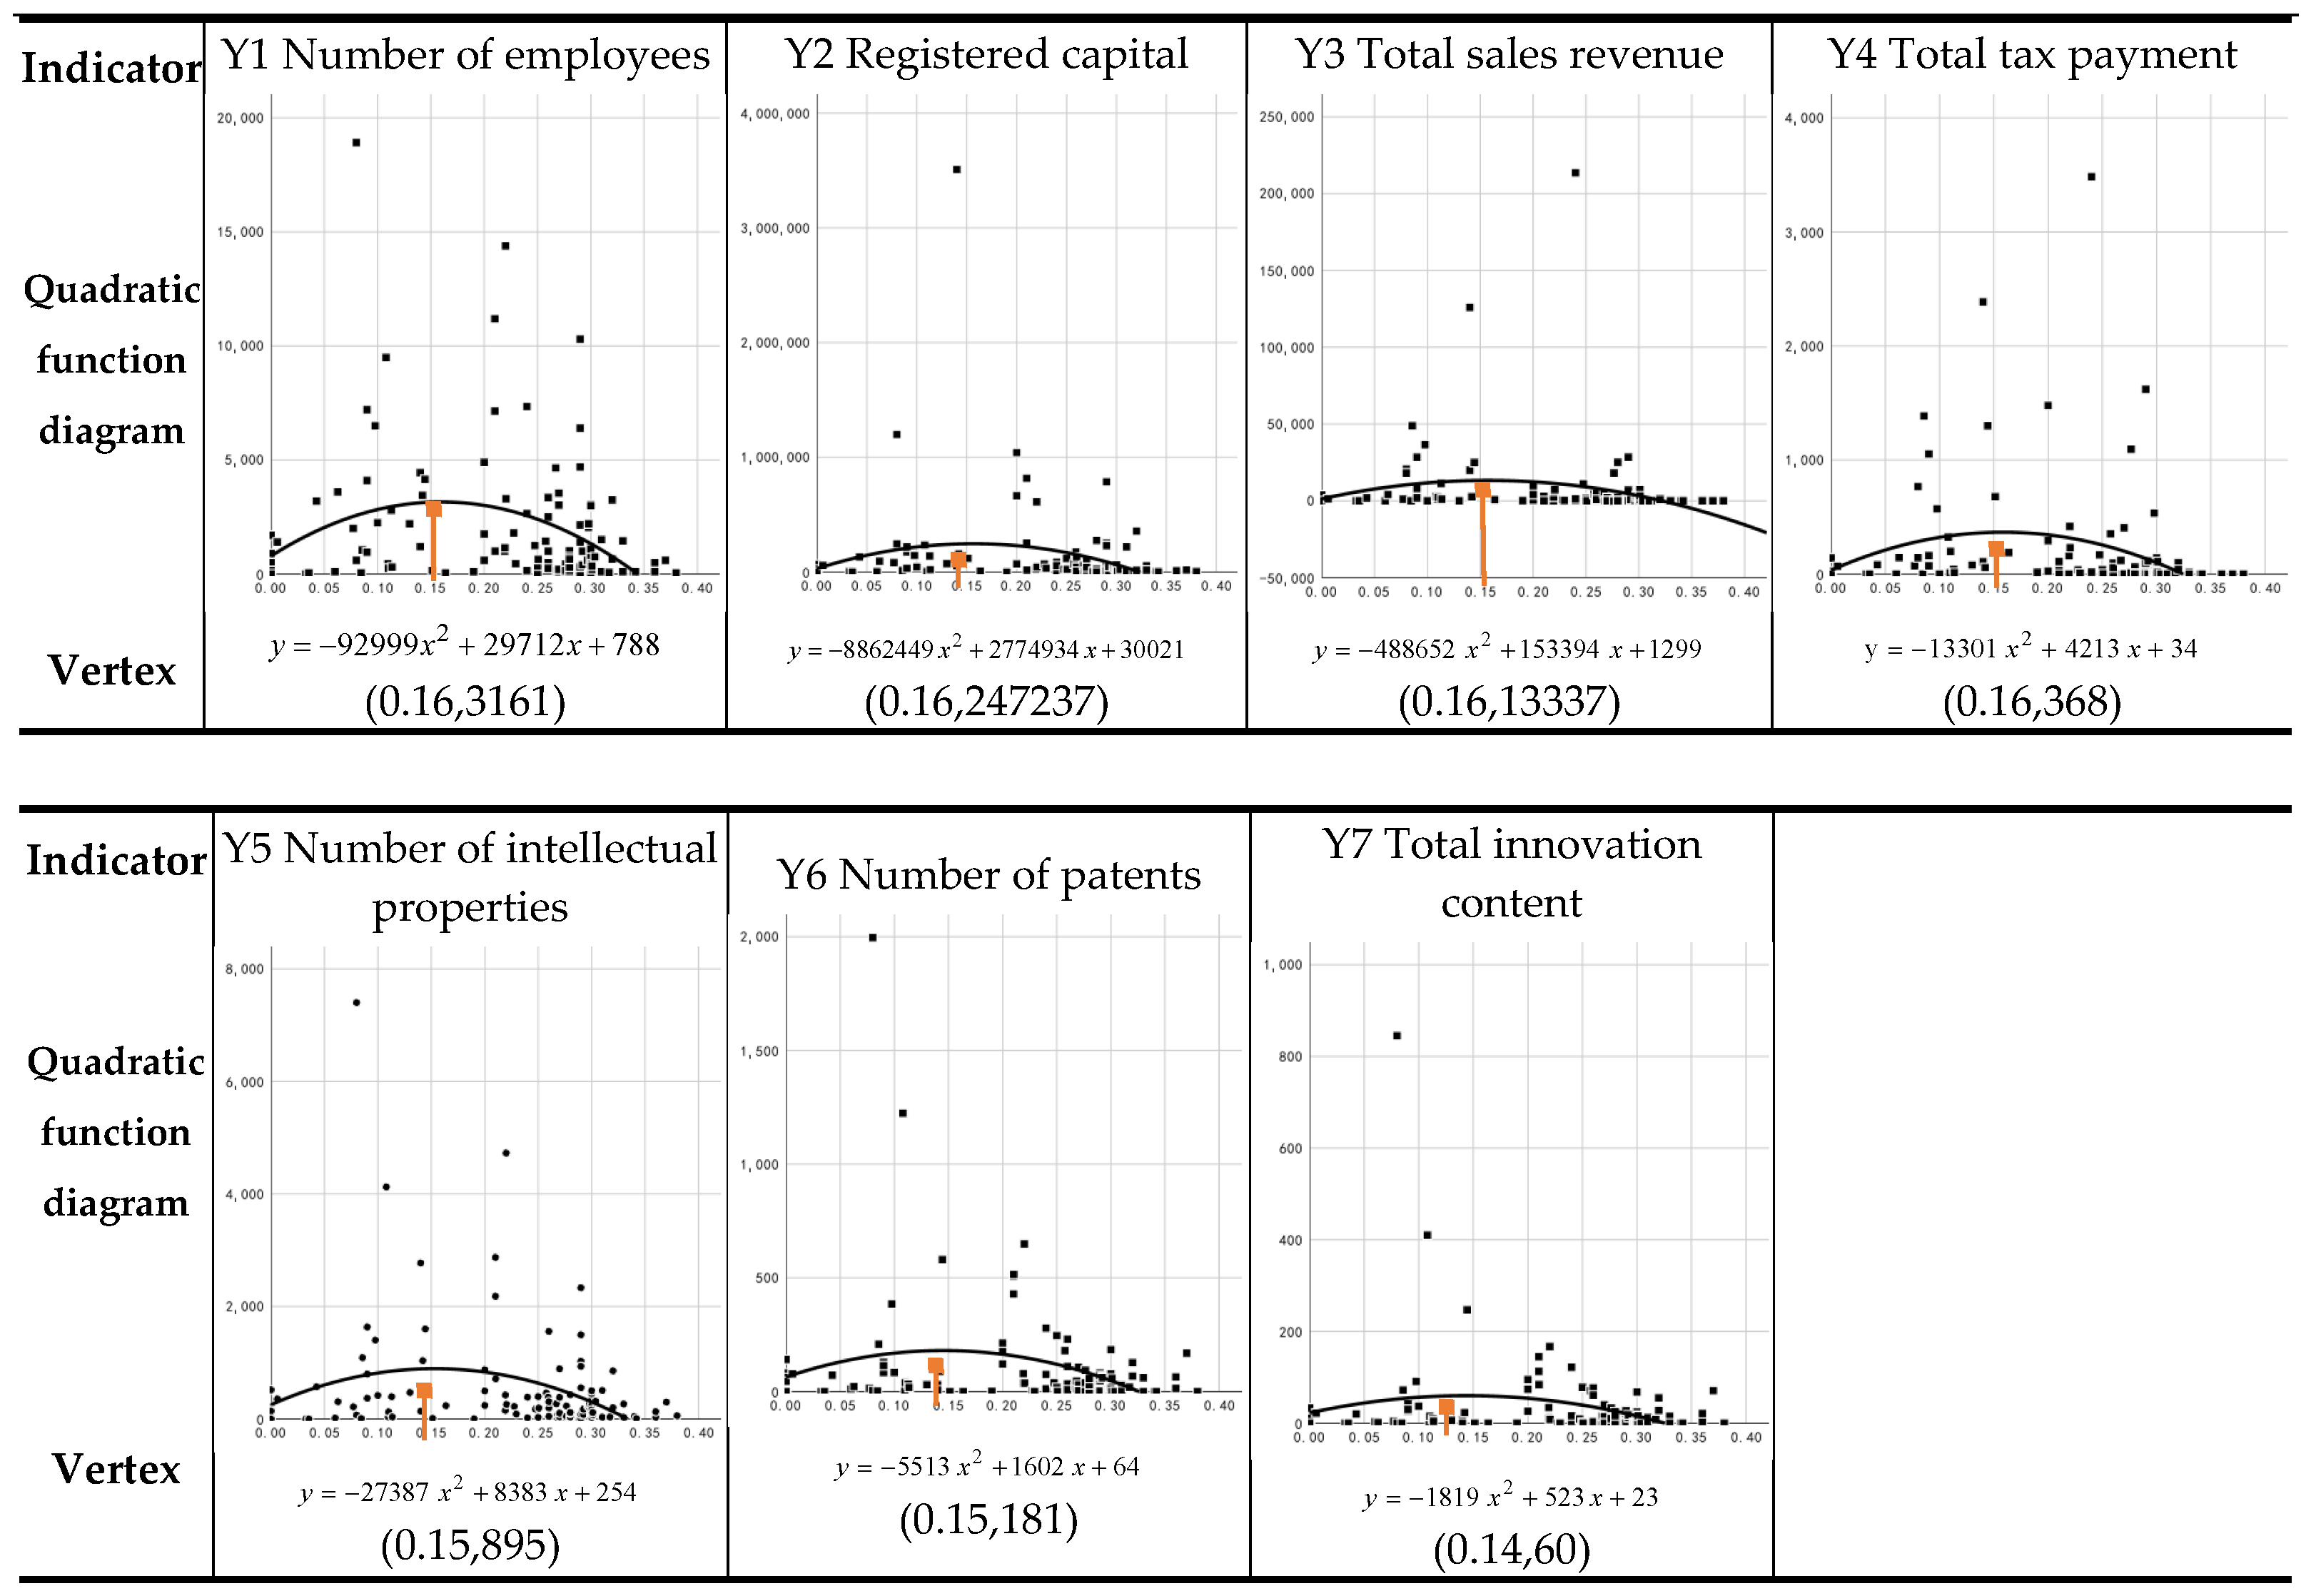
2.3.3. Quadratic Curve Regression

Based on previous research, it has been found that functional mixing promotes the development of STPs, showing an initial rise that reaches a certain peak before presenting a downward trend. Liu discusses the issue of balancing functional mixing in urban planning, pointing out that excessive functional mixing can lead to resource waste, uneven development, and social inequality [67]. Wu studied the relationship between mixed land use and urban vitality, pointing out that excessive mixing may intensify conflicts between urban functions, which could, in turn, be detrimental to the long-term development of the city [68]. Xiao found that excessive mixed land use leads to an uneven distribution of urban functions, which, in turn, affects the long-term socio-economic development of the city [69]. In addition, preliminary simulations using other models were also conducted based on the research data, including linear models, logarithmic models, and exponential models. The fitting results indicated that all of the indicators exhibited linear relationships, but the p-values were not statistically significant; some indicators showed exponential relationships. However, none of the indicators exhibited composite, power–law, exponential function, or logistic relationships. The specific data results are shown in Table 3. Therefore, a quadratic curve regression can be used to analyze the range of functional mixing that can promote the development of STPs, which is why this model was chosen as the research method.
Quadratic curve regression is a critical method for analyzing variables with nonlinear correlations. Transforming the nonlinear relationship into a linear expression allows for model fitting and ultimately facilitates the establishment of a regression model.
This study uses the quadratic curve regression method to examine the influence of the mixing of “industry–city–innovation” functions on the innovative development of STPs. The “industry–city–innovation” functional POI mixing degree is treated as the independent variable X, while seven indicators across three categories, used to measure the innovative development of STPs, are selected as the dependent variables Y. The specific steps are as follows:
  • Step 1: Using SPSS software (IBM SPSS Statistics 27), quadratic curve regression was performed on the independent variable X, representing the functional POI mixing degree, and the dependent variable Y, representing the indicators measuring the innovation and development of STPs. The resulting quadratic function formula is shown in Equation (2) as follows:
Y = a x 2 + b x + c
The coefficient a of the quadratic term determines the direction and width of the parabola’s opening. The coefficient b of the linear term influences the axis of the symmetry and the vertex’s position. The constant term c determines the vertical position of the function.
  • Step 2: The vertex coordinates can be determined using the results of the quadratic regression formula and the vertex coordinate formula for a quadratic function. Specifically, the goal is to calculate the value of the independent variable X at which the dependent variable Y reaches its maximum value. This X value represents the optimal functional mixing degree that is most conducive to enhancing the innovative development indicators of the STPs. Calculate the vertex coordinates of the seven quadratic functions individually to determine the value of X, at which the innovative development indicator Y of science and technology enterprises reaches its extreme value. The formula for calculating the vertex coordinates is provided below, as shown in Equation (3):
( X , Y ) = b 2 a , 4 a c b 2 4 a

2.3.4. Set Intersection

The intersection of sets has extensive applications in set theory, logical reasoning, probability, and statistics. It is commonly used to determine the inclusion relationships between sets and to derive various rules for the set operations. In this study, the intersection method is applied to calculate and identify the interval range of “industry–city–innovation” functional POI mixing values that holistically promote the innovative development of STPs. The formula is presented in Equation (4), as follows:
A 1 A 2 A n = { X | X A 1   a n d   X A 2   a n d a n d   X A n }

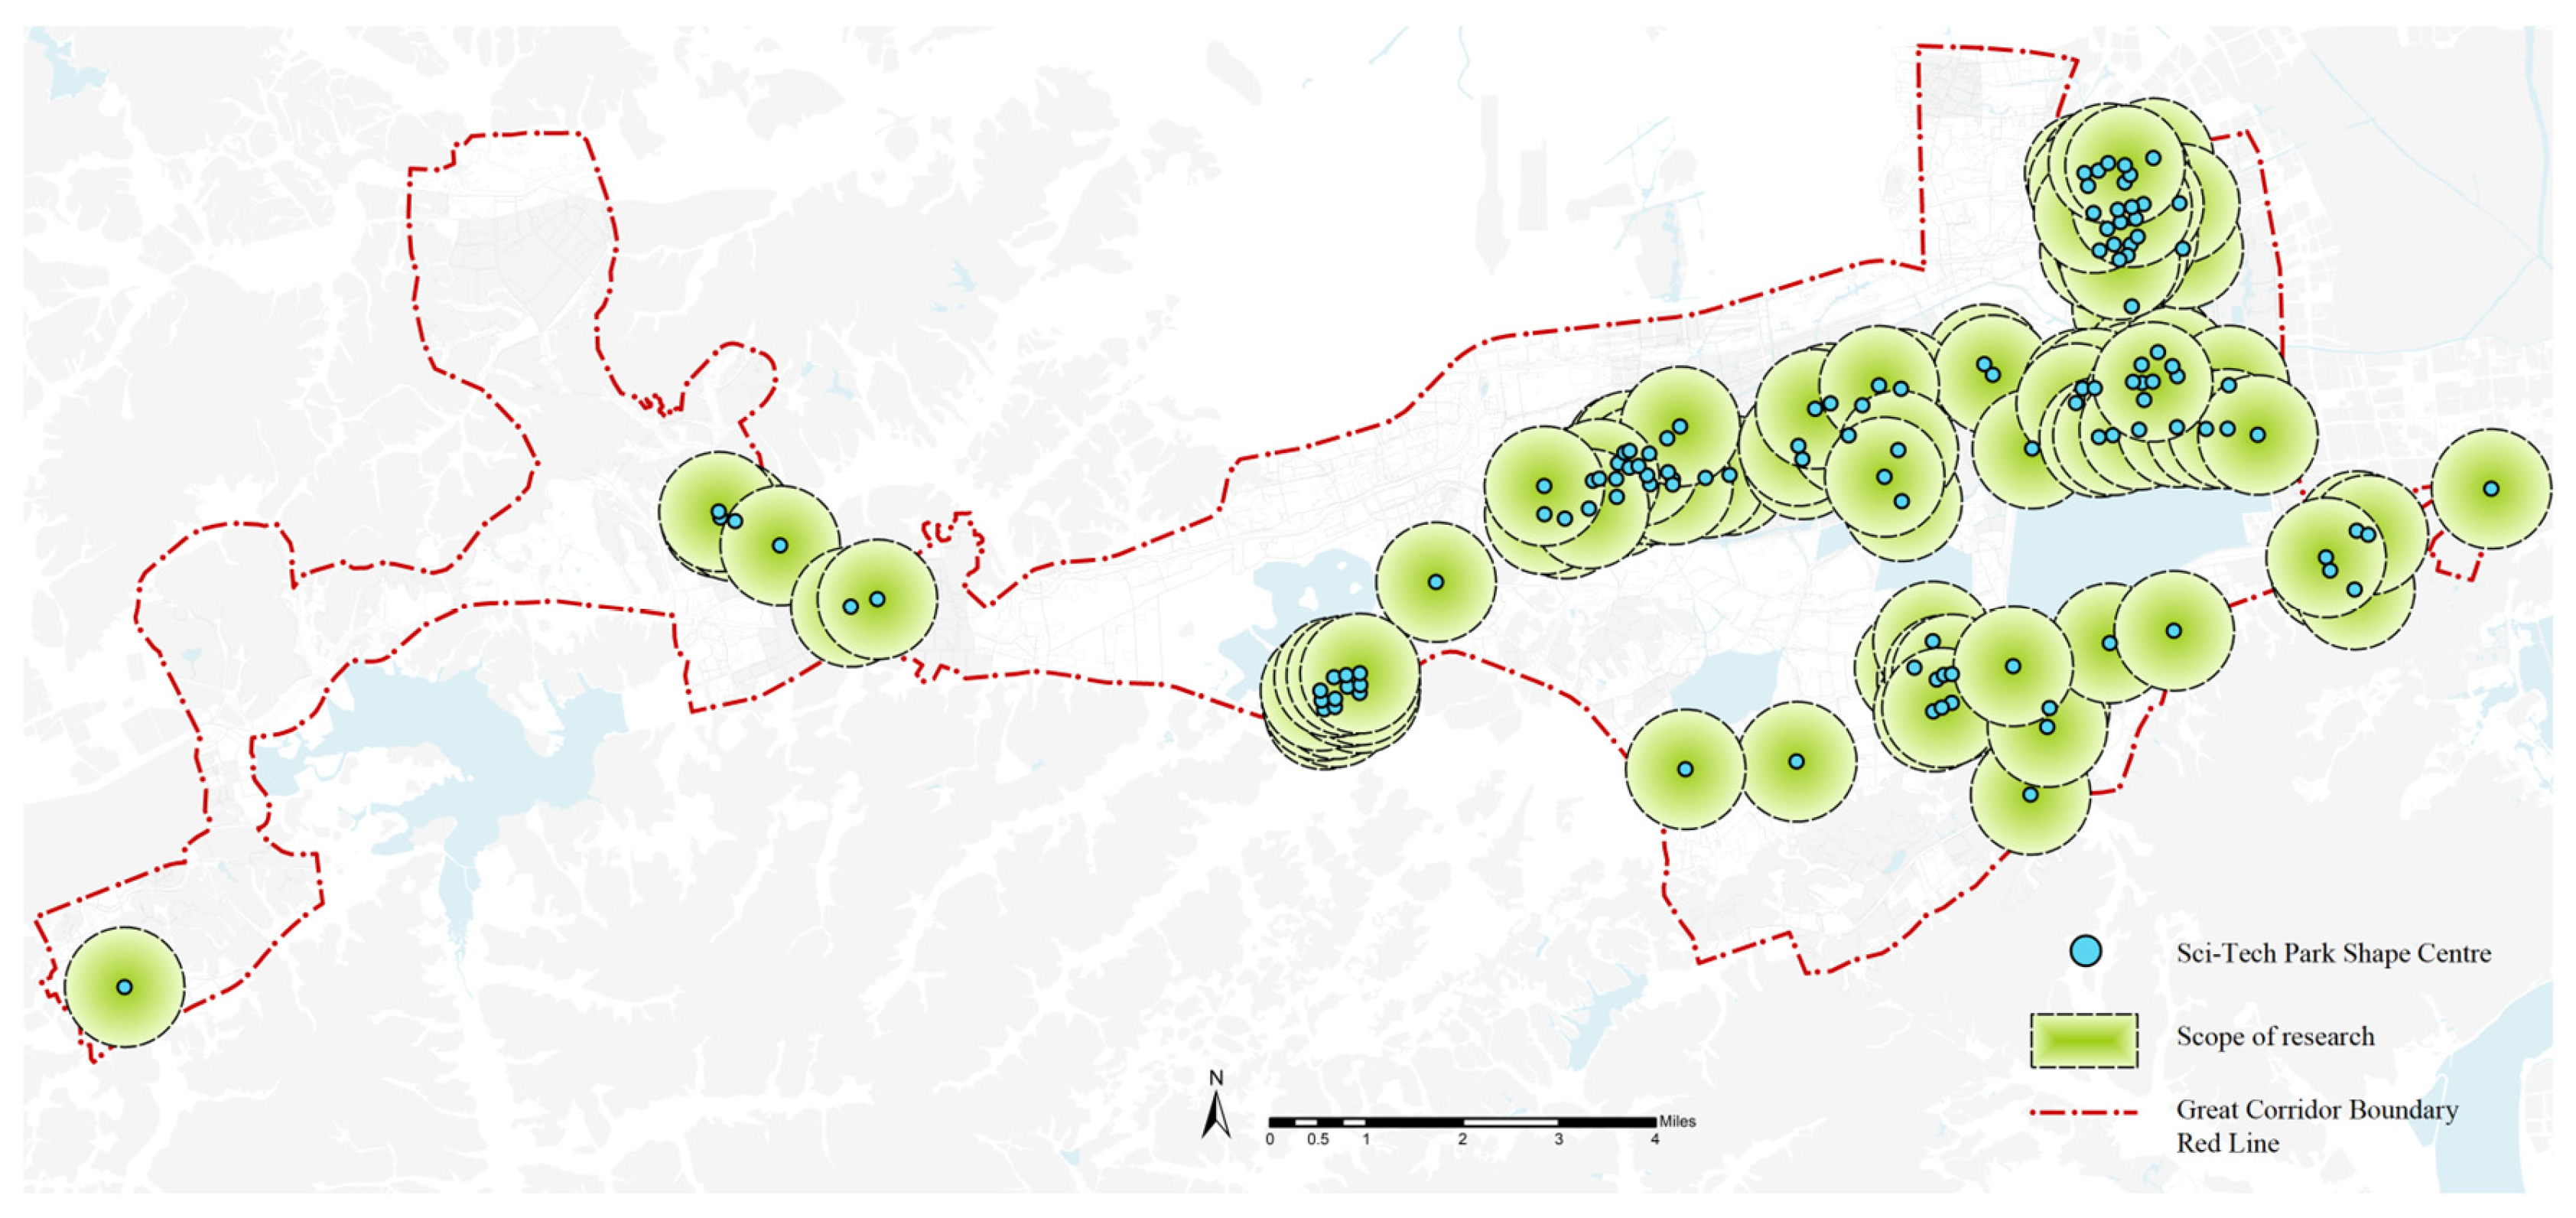
2.3.5. Methods for Selecting the Research Scope of STP Set Intersection

This study identified the land boundaries of 129 different types of STPs within the Corridor. A circle was drawn around each park to analyze the functional mixing at a finer scale, using the centroid of its land boundary as the center and a radius of 1 km as the sampling range (see Figure 4). Studying the functional mix within a 1-km radius around the STPs can allow for the effective analysis of the interaction between the park and its surrounding environment. A 1 km radius is a walkable or short-commute distance for most people [70]. If the surrounding area offers mixed functions, such as commerce, dining, leisure, and residential zones, it can meet the basic needs of employees, improve their quality of life, reduce commuting costs, and foster innovation and economic activity [71,72,73]. Moreover, the 1 km radius helps to understand the socio-economic impacts, such as land prices, rents, and employment, providing valuable data to support park planning and policy development. Since some STPs are located near the boundaries of the Corridor, the sampling range for these parks may extend beyond its limits. Considering only the POIs within the Corridor would lead to inaccurate measurements of the functional mixing degree for such STPs. To address this issue, the study expanded the research area by 3 km beyond the Corridor’s boundaries, enabling the calculation of functional POI mixing degrees for each sampling unit within the extended range.
This study assesses the functional mixing by measuring the “industry–city–innovation” functional POI mixing degree within a 1-km radius around the STPs. First, the number of “industry”, “city”, and “innovation” POIs within each sampling range is calculated, along with their respective proportions. Then, the Shannon entropy index method is employed to compute the functional mixing degree by incorporating the proportions of the three types of POIs into the formula.

3. Results

3.1. Analysis of the Mixing of “Industry–City–Innovation” Functions

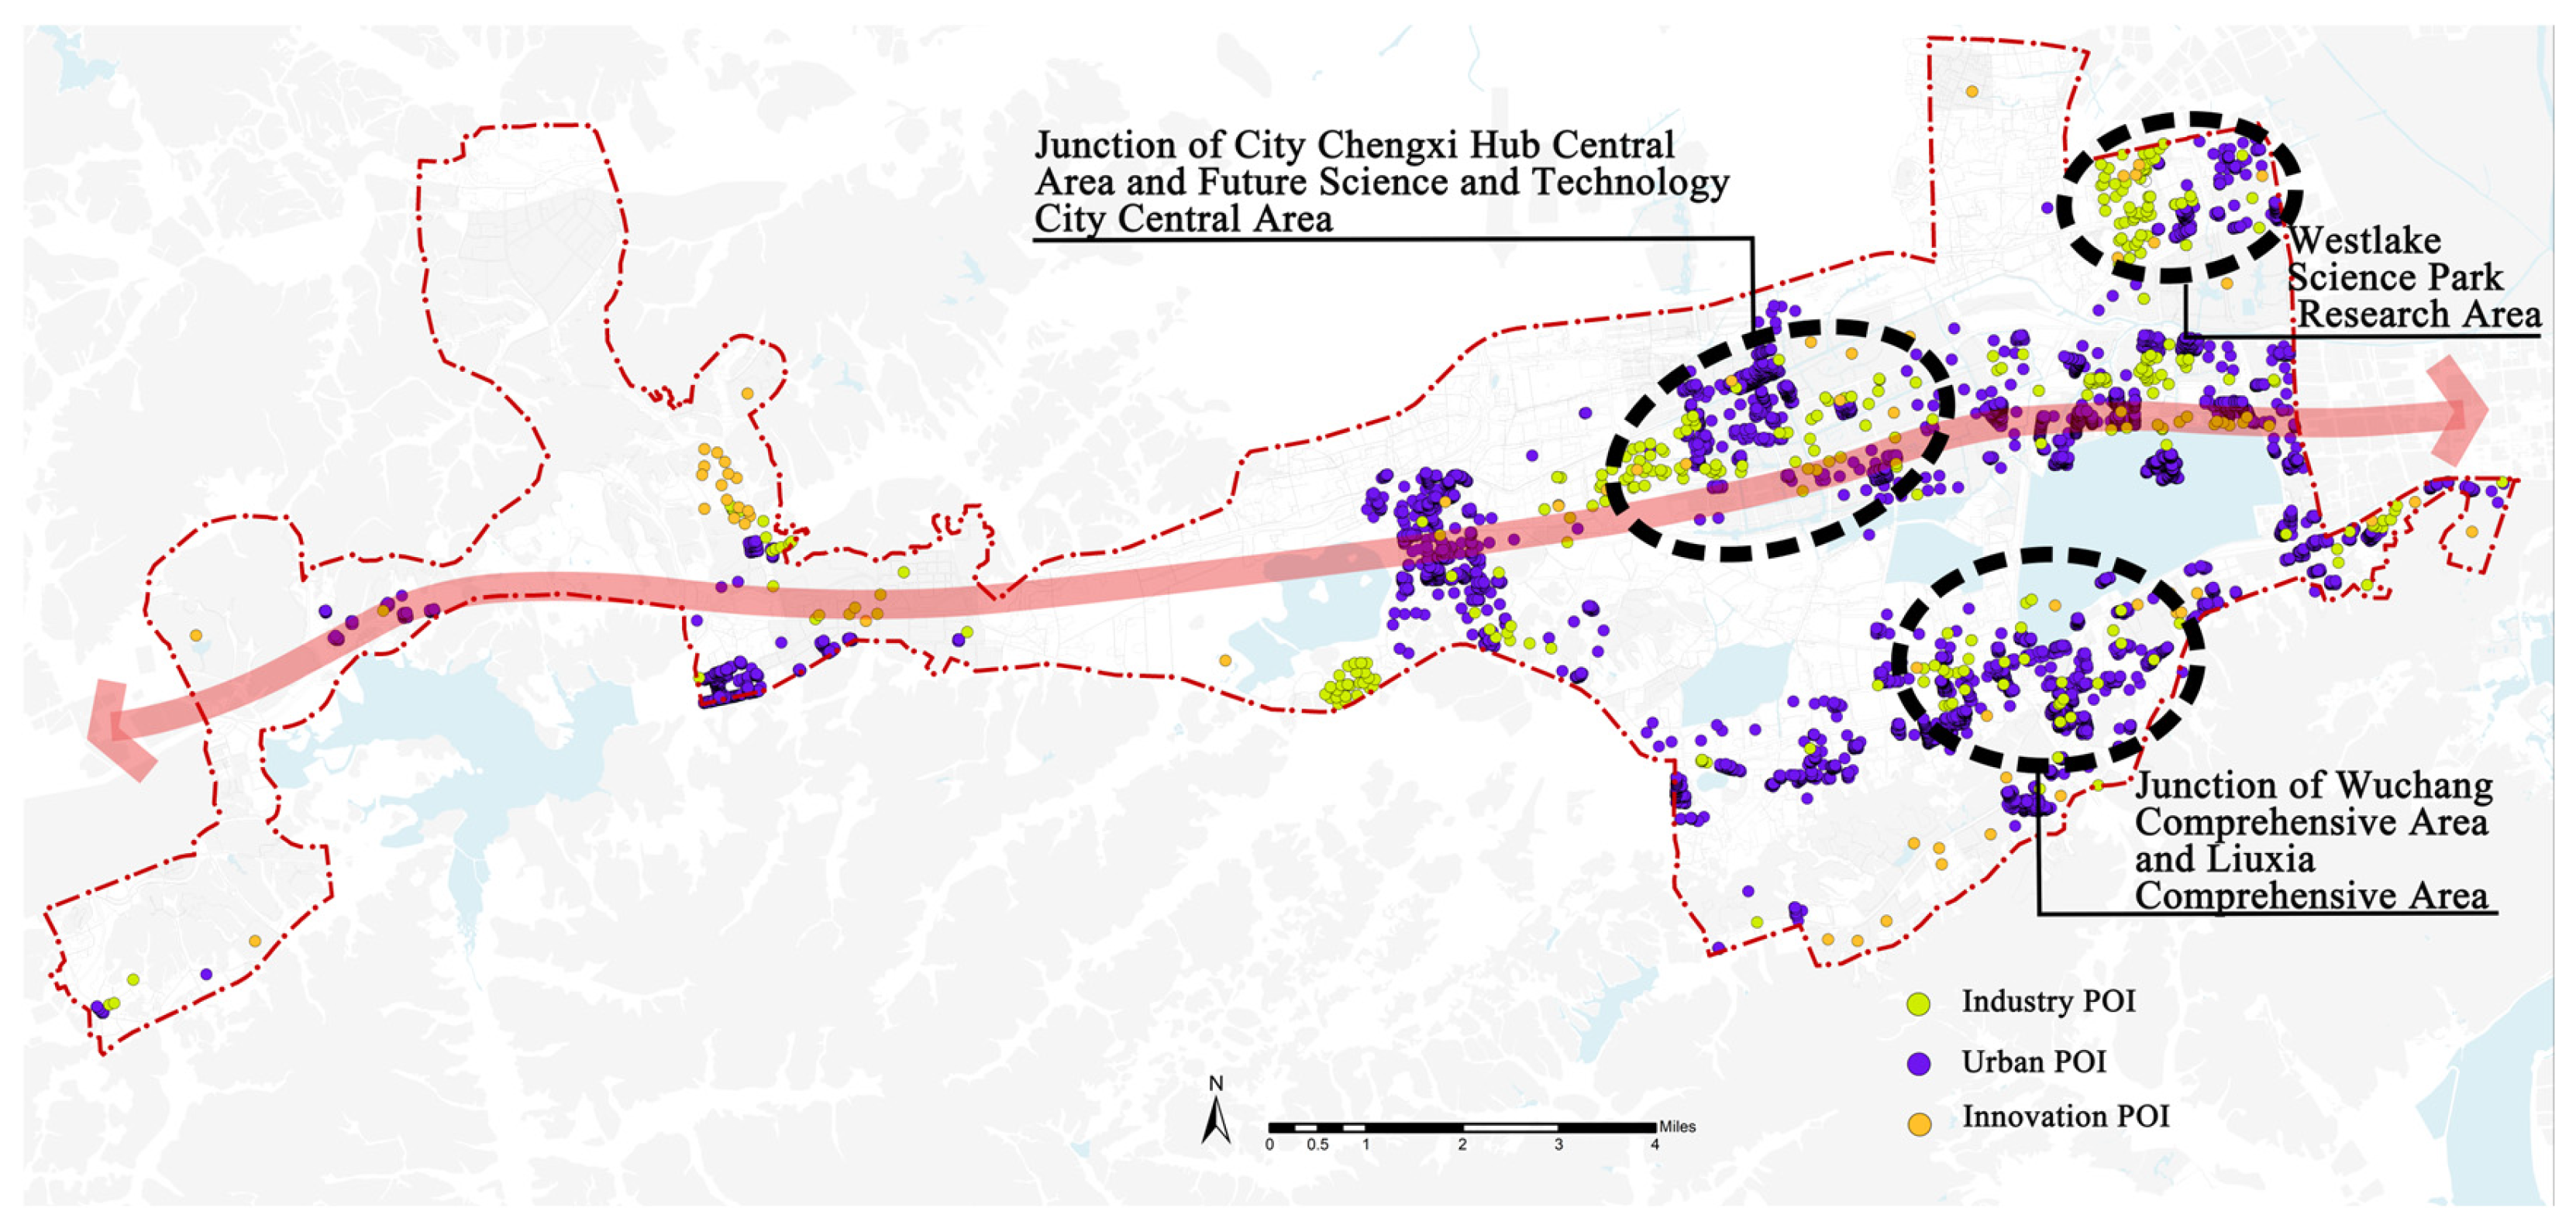
3.1.1. Spatial Distribution Characteristics of “Industry–City–Innovation” Functional POIs

The Corridor integrates high-quality innovation resources from Hangzhou and across Zhejiang Province, establishing a development model characterized by active innovation, entrepreneurship, and the mixing of “industry–city–innovation”. Its highly functional mixing of urban spaces and diverse types of STPs provide a robust sample base for this study.
Overall, the three types of “industry–city–innovation” POIs exhibit a characteristic pattern of “highly mixed, distributed along the main axis”, primarily concentrated along Wenyi West Road and the central–eastern region of the Corridor. This includes key areas such as the junction between the West City Hub Center and the Future Sci-Tech City Center, the intersection of the Wuchang Integrated Area and the Xiaojia Integrated Area, and the research area in the West Lake Sci-Tech Park (see Figure 5). The “industry” spaces are mainly located in the Future Sci-Tech City Center, Hangzhou University Town Higher Education Zone, Jiang Village Central District, and the research area of West Lake Sci-Tech Park (see Figure 6a). The “city” spaces are concentrated in the Future Sci-Tech City Center, Jiang Village Central District, Wuchang Integrated Area, and Old Yuhang Integrated Area (see Figure 6b). The “innovation” spaces are primarily found in Yun Manufacturing Town’s Research Zone, Future Sci-Tech City Center, Xiaohe Mountain Higher Education Zone, and the research area of the West Lake Sci-Tech Park (see Figure 6c).

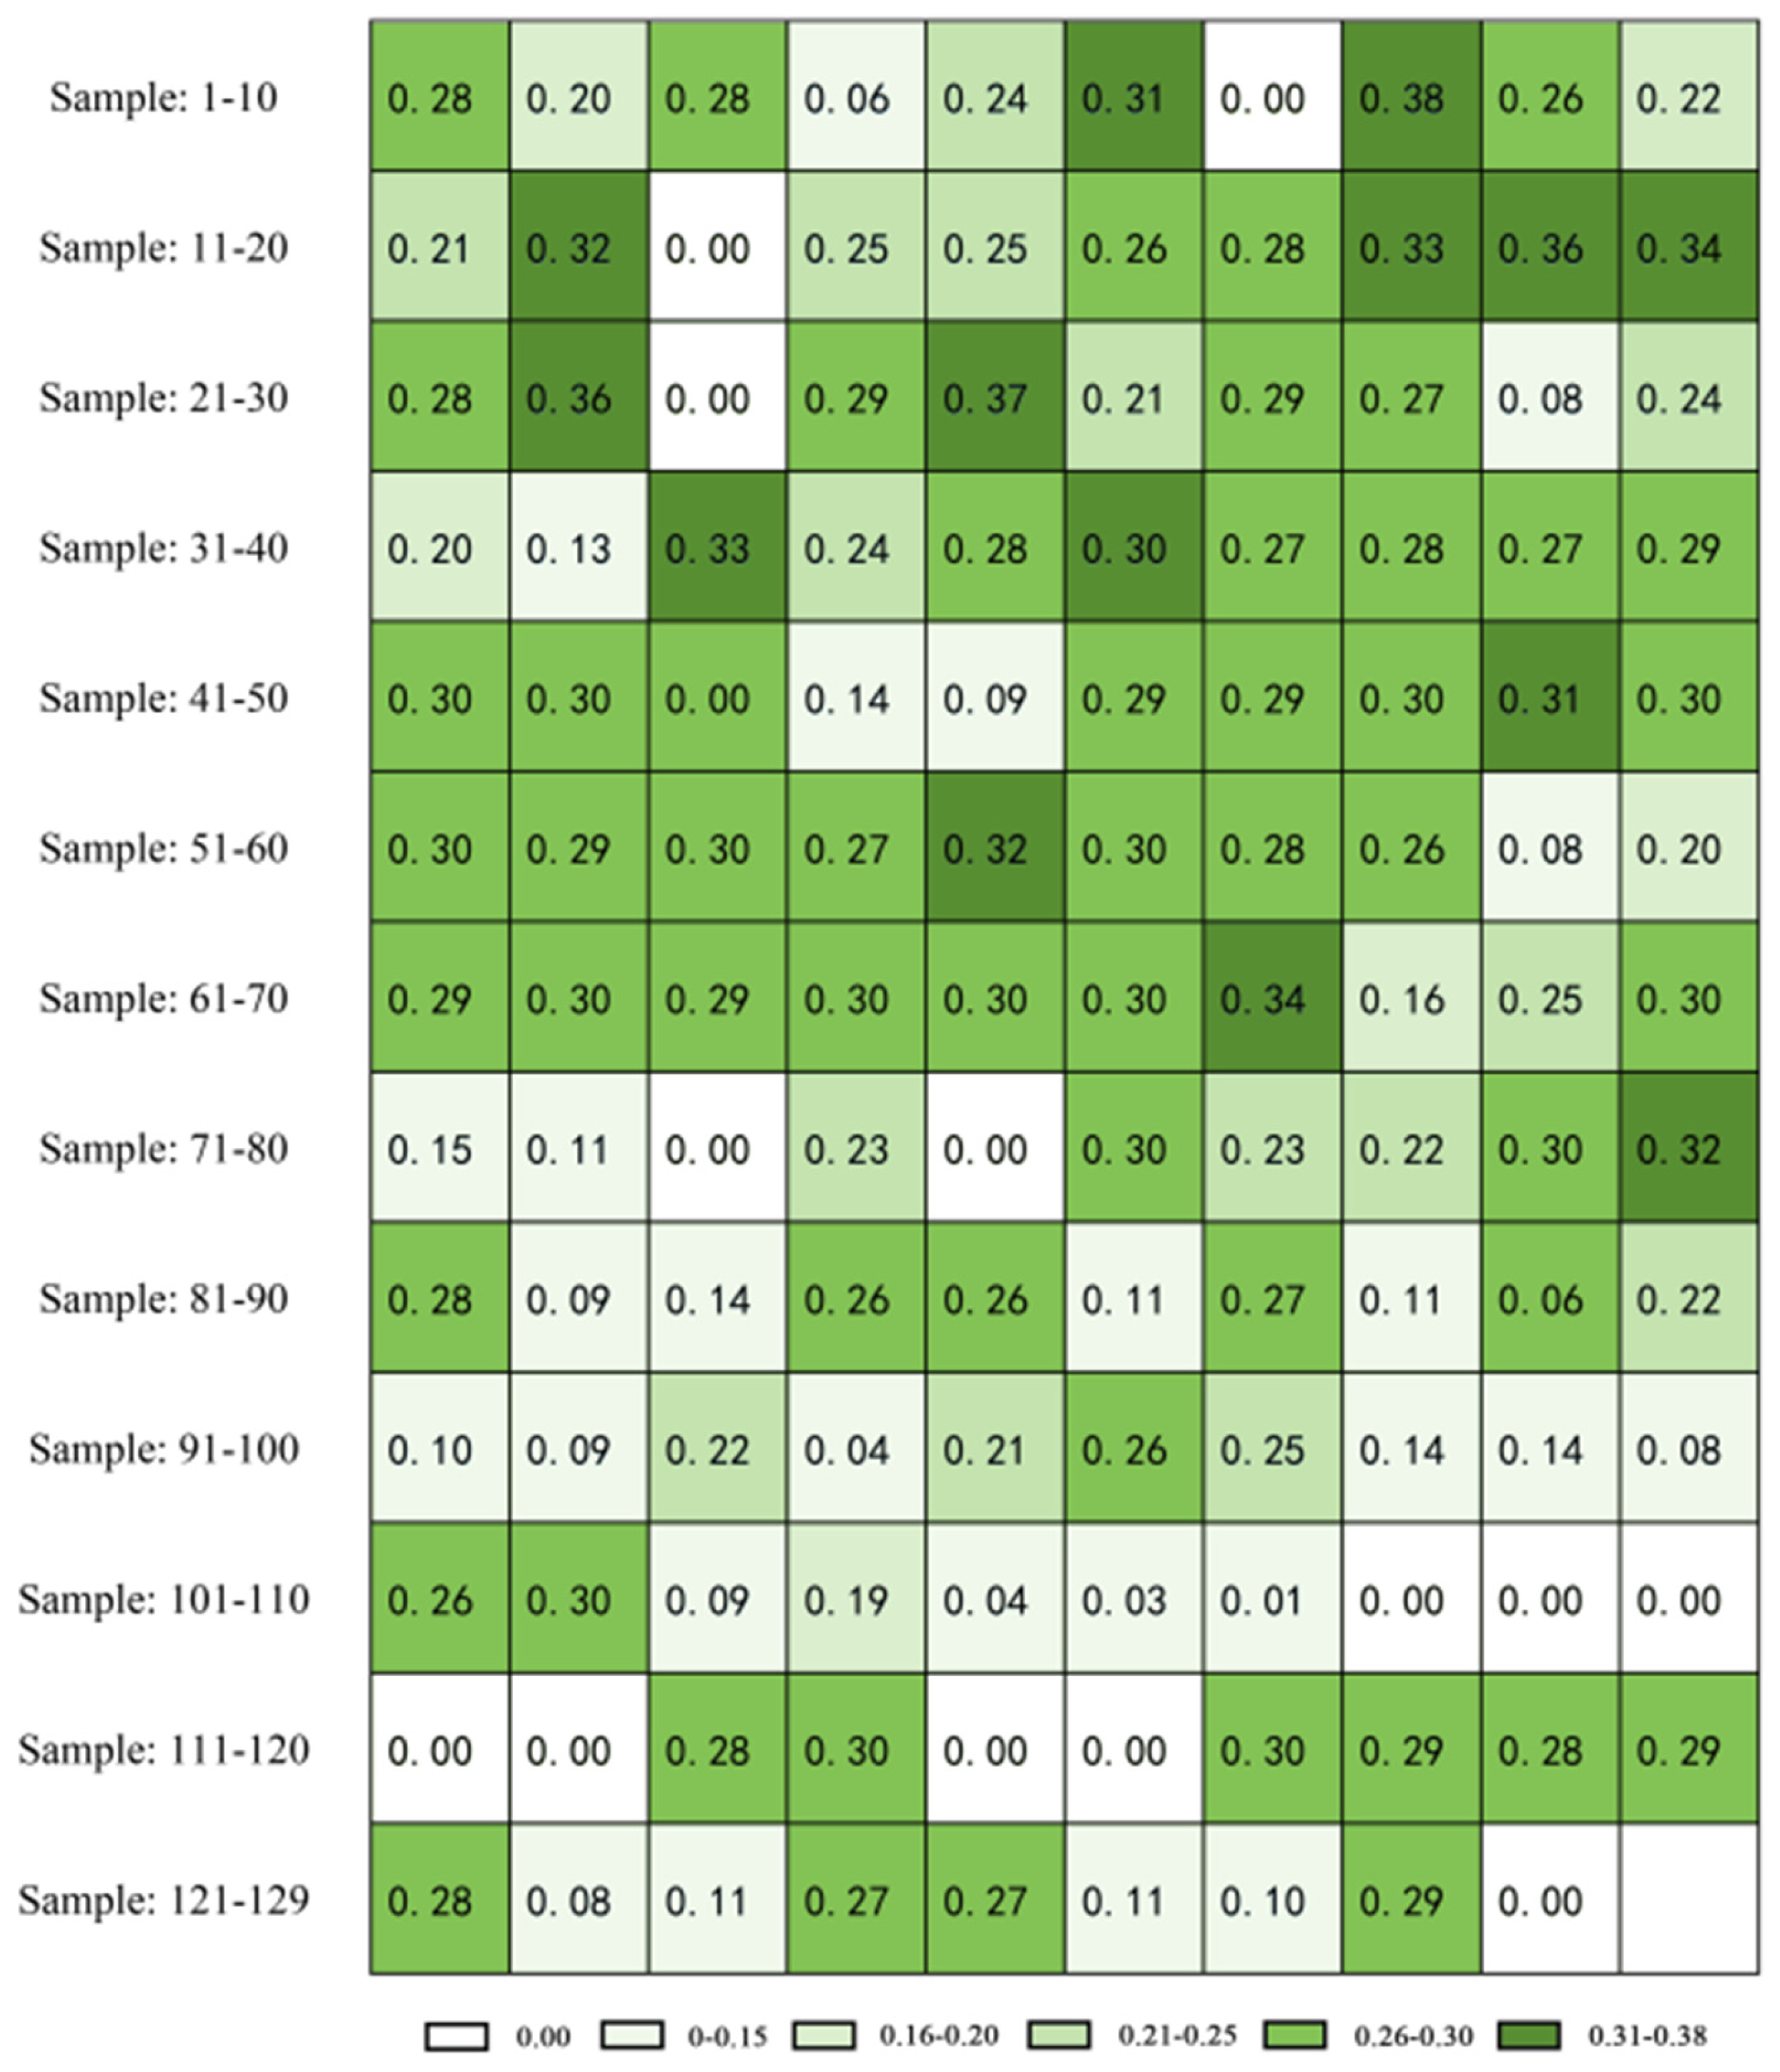
3.1.2. Measurement of “Industry–City–Innovation” Functional Mixing Degree

The results of the functional mixing analysis for the STPs are presented in Figure 6. Among the samples, 14 have a functional mixing degree of 0, with the maximum functional mixing degree being 0.38. The functional mixing degree is least in the range of 0.16–0.20, with 5 samples, and most in the range of 0.26–0.30, with 54 samples. This suggests that most of the science and technology parks exhibit a mixed mode of “industry–city–innovation” functions in their surrounding areas (see Figure 7).

3.2. Analysis of Innovative Development in STPs

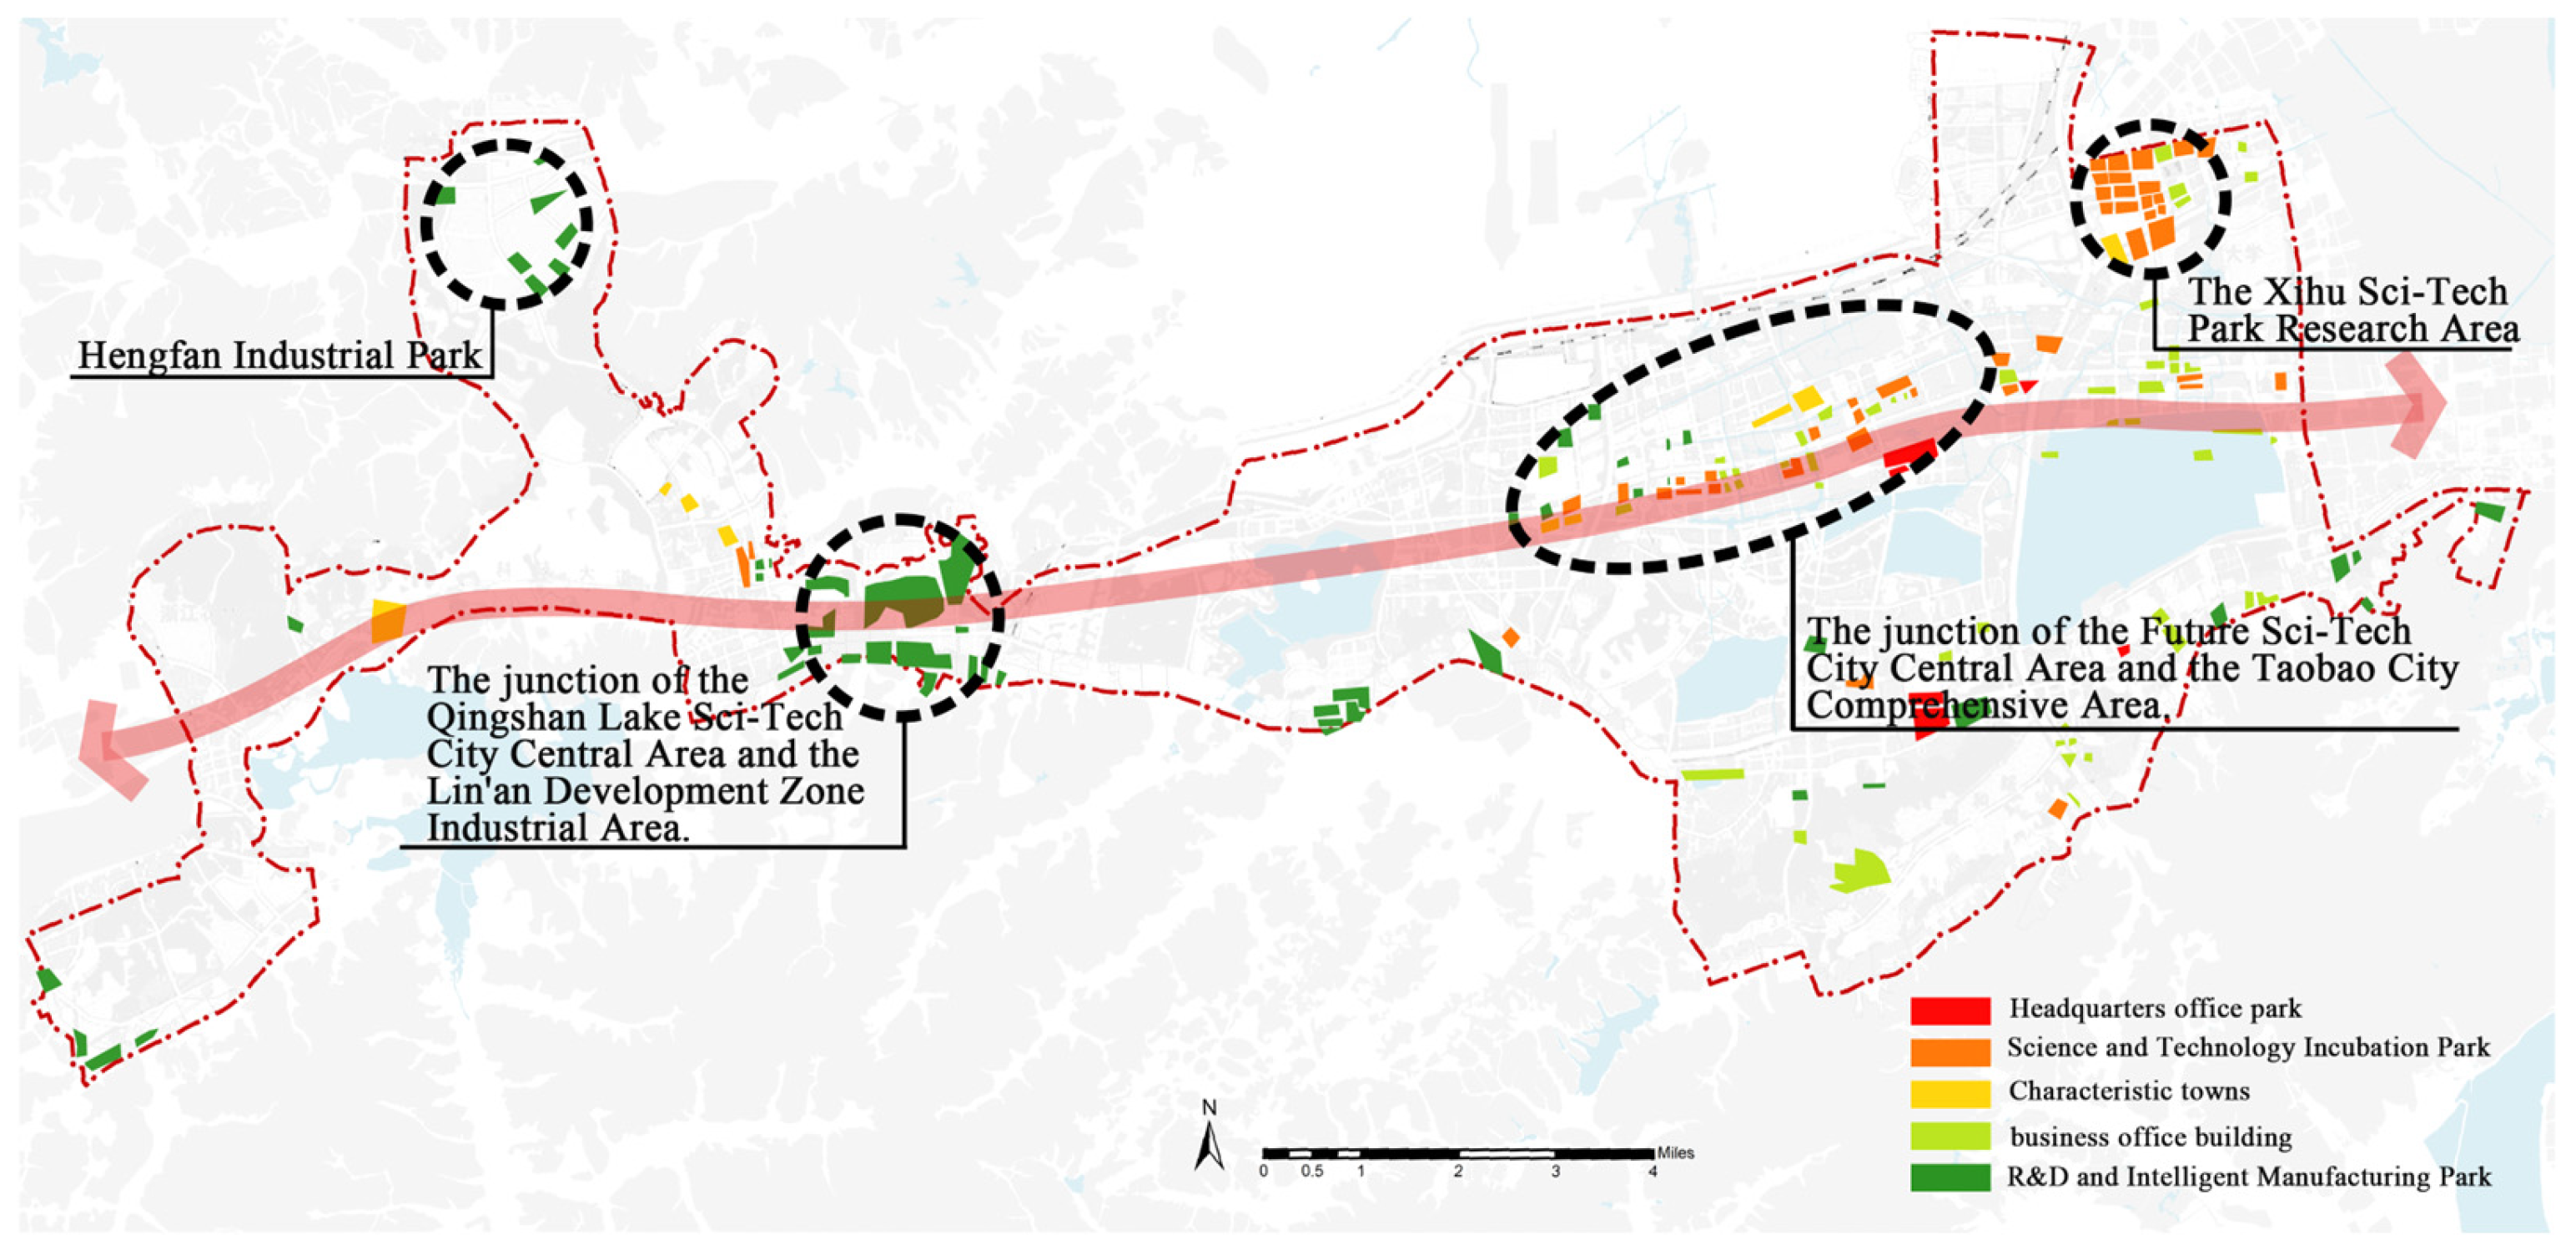
3.2.1. Spatial Types and Distribution of STPs

Within the Corridor, the STPs exhibit significant spatial diversity. For the classification of the STPs—which is based on the “International Guidelines for Industrial Parks” [74] issued by the United Nations Industrial Development Organization (UNIDO) in 2019—including factors such as industrial categories, spatial structures, building scales, and functional formats, they can be categorized into the following five main types: headquarters office areas, innovation incubation parks, characteristic towns, business office buildings, and R&D and intelligent manufacturing parks. These types encompass the key stages of sci-tech park development, including technological R&D, tech services, industrial incubation, pilot production, industrial upgrading, and achievement transformation. In terms of the spatial distribution, the STPs in the Corridor follow a pattern of “broad dispersion with localized clustering”, primarily concentrated in the Xihu Sci-Tech Park Research Area, the Future Sci-Tech City Central Area, the Qingshan Lake Sci-Tech City Central Area, and the Hengfan Industrial Area (see Figure 8). The mixed layout of these parks facilitates the formation of large-scale industrial clusters, enhancing their collective influence on regional innovation and economic development.

3.2.2. Analysis of Innovative Development Indicators in STPs

This study assesses the development status of STPs by analyzing the growth of technology innovation enterprises within the parks. Seven indicators were selected, covering the enterprise scale, financial performance, and innovation capacity. Using ArcGIS 10.8, kernel density analysis was performed on the development data from 16,504 innovation enterprises collected within the Corridor. In the resulting maps, darker colors represent higher kernel density values for the corresponding indicator in a given area (see Figure 9). Enterprise Scale: Mainly concentrated in the Xihu Sci-Tech Park Research Area, Jiangcun Central Area, and the junction of the Future Sci-Tech City Central Area and Hangzhou University Town Higher Education Area. Financial Performance: Primarily concentrated in the Xihu Sci-Tech Park Research Area, Jiangcun Central Area, Wuchang Comprehensive Area, and Taobao City Comprehensive Area. Innovation Capacity: Predominantly concentrated in the Xihu Sci-Tech Park Research Area, Zhejiang University Xixi Higher Education Area, the junction of Hangzhou University Town Higher Education Area and Future Sci-Tech City Central Area, and the Qingshan Lake Sci-Tech City Central Area.

3.3. Analysis of the Influence of “Industry–City–Innovation” Functional Mixing on the Innovative Development of STPs

3.3.1. Analysis of Quadratic Curve Regression Results

As shown in the table (see Table 4), the p-value results indicate statistically significant findings in the regression analysis across all of the metrics. Based on the quadratic function formula, with the coefficient a being negative, the function exhibits a downward-opening parabolic trend. This implies that, as the independent variable X increases, the dependent variable Y initially rises. However, once Y reaches its peak (the vertex of the parabola), further increases in X lead to a decline in Y.

3.3.2. Quadratic Function Vertex Coordinate Solution

As shown in Figure 10, the trend line of each indicator shows an overall trend of first rising and then declining, which means that each indicator will increase with the increase in the functional mixing degree, but will show a downward trend when it reaches the extreme value. When the functional mixing degree is 0.16, it can promote the expansion of the enterprise scale and the growth of the enterprise financial performance. When the mixing degree is 0.15, the innovation capacity is promoted in terms of the number of intellectual property rights and patents; when the mixing degree is 0.14, the innovation ability is promoted in terms of the total innovation content.

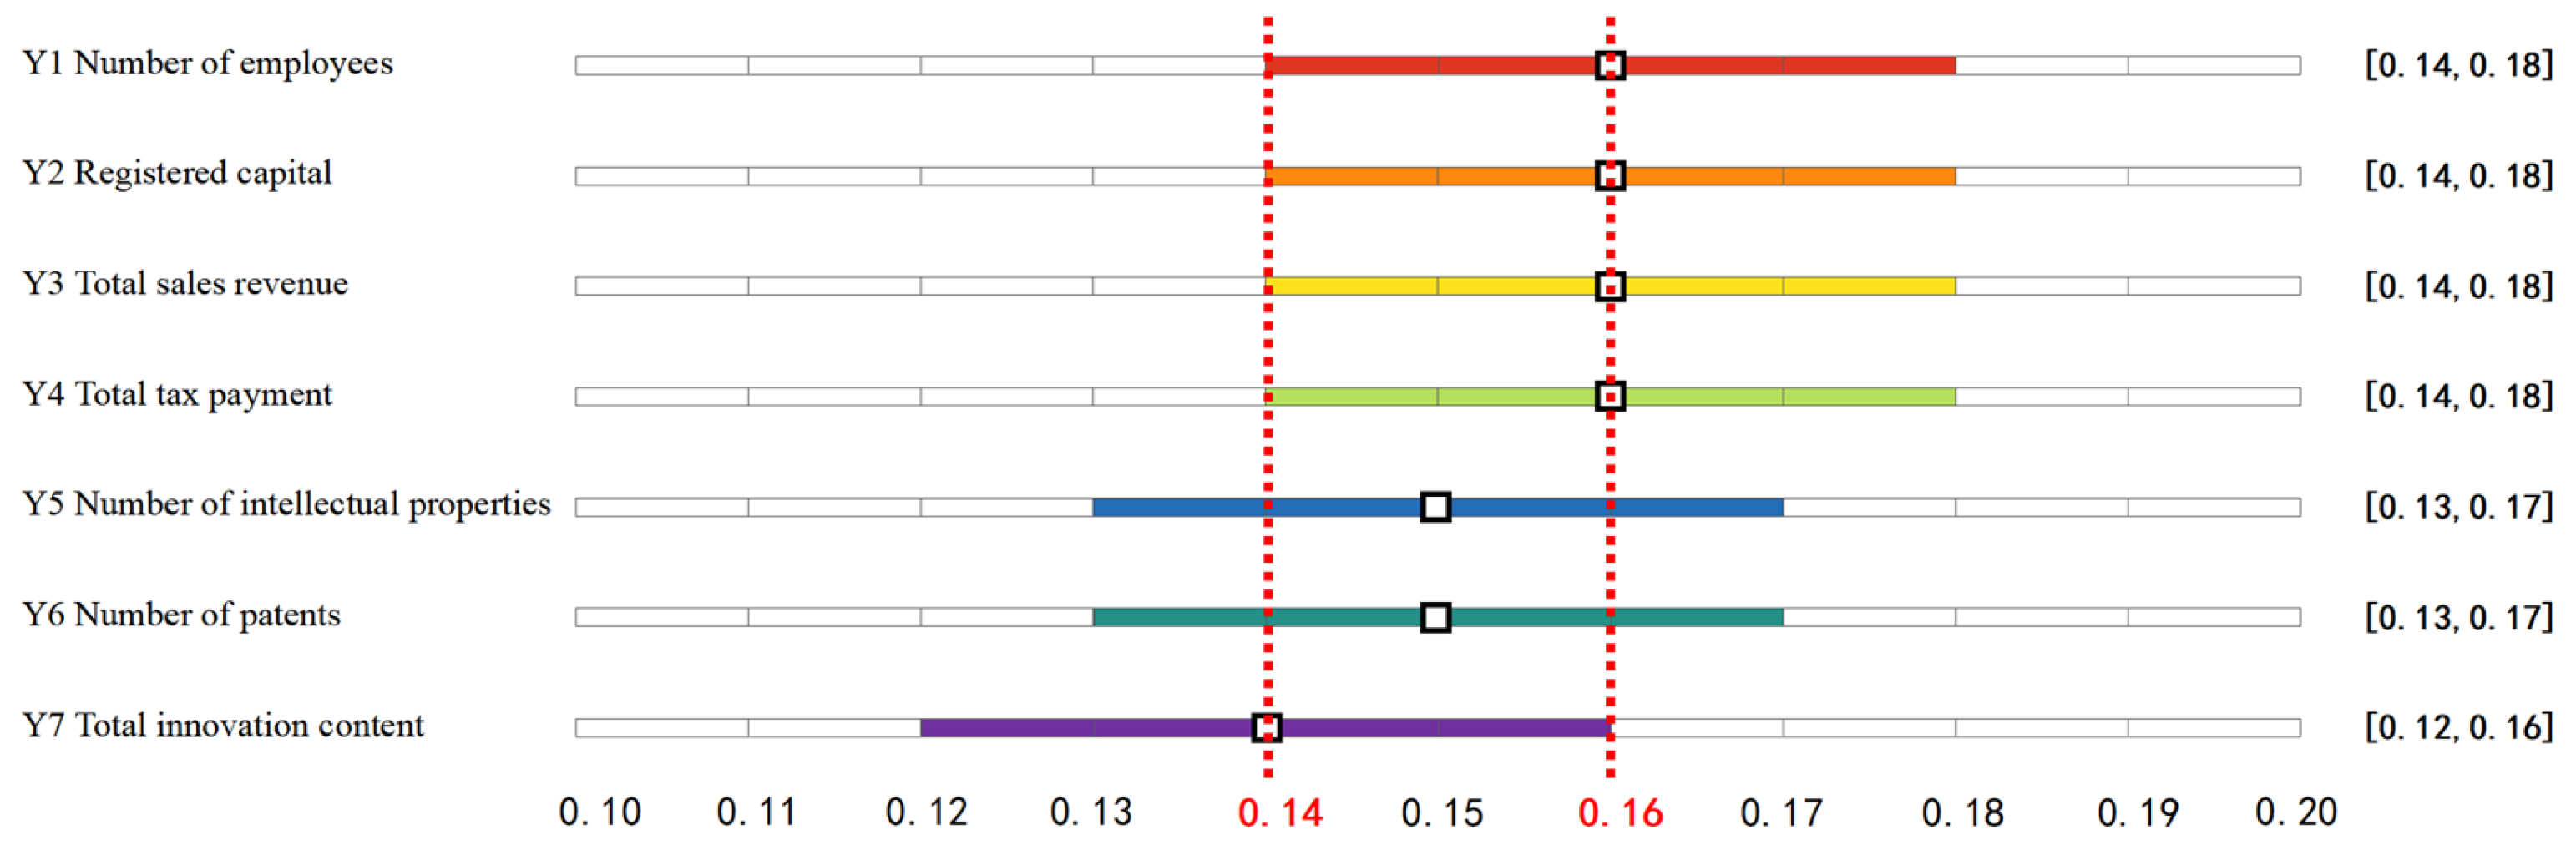
3.3.3. Identification of the Optimal Range for “Industry–City–Innovation” Functional POI Mixing Degree

To identify the optimal range of the “industry–city–innovation” functional POI mixing degree that promotes innovative development in the STPs, this study begins by determining the extreme point X-coordinates of the seven quadratic functions. A method is then applied, where ±0.01 units adjust the functional POI mixing degree X. The interval of the functional POI mixing degree is subsequently expanded, and the intersection of the seven functional POI mixing degree intervals is calculated using the set intersection method. If no intersection is found, the degree range is further expanded by another ±0.01 units, and the process is repeated until an intersection is obtained. The resulting intersection range is considered the optimal “industry–city–innovation” functional POI mixing degree for effectively promoting innovative development in the STPs. This study found that an intersection occurs when ±0.02 units adjust the “industry–city–innovation” functional POI mixing degree. The optimal range for the functional POI mixing degree is identified as [0.14, 0.16] (see Figure 11).
From an overall perspective, the “industry–city–innovation” functional POI mixing degree within the range of [0.14, 0.16] is most conducive to the comprehensive innovative development of the STPs. When considering the three aspects of innovative development, this study finds that the functional POI mixing degree range of [0.15, 0.17] is more favorable for increasing the number of employees, thereby reflecting enterprise scale growth. Similarly, the financial performance, including the growth of registered capital, total sales, and total tax payments, is better supported within the same range of [0.15, 0.17]. For the innovation capability, however, a slightly different range of [0.13, 0.16] is optimal for enhancing the number of intellectual property rights, patents, and the overall scientific and technological content within the park. These findings underscore the key intervals where the “industry–city–innovation” functional POI mixing degree most effectively drives the innovation and development of STPs across various dimensions, offering valuable guidance for optimizing functional integration strategies.

4. Discussion

Compared to previous studies, this research further confirms the crucial role of functional mixing in urban area development. Zhou Xinggang’s research demonstrated that mixing commercial–residential and industrial–residential functions can foster economic, social, and cultural growth [40]. Similarly, Hu Qiyu, through practical case studies, confirmed that spatial mixed-use is a vital approach to promoting urban development [47]. Previous studies generally believed that functional mixing could promote the innovative development of STPs [23,32,33].
Most research focuses on the role of functional mixing in driving innovation activities within the park [36,37], yet there is little clear quantifiable standards or theoretical frameworks on how to achieve functional mixing, which types of functions should be mixed, and to what extent. For example, some studies suggest that functional mixing can be achieved by integrating various functions, such as the production, R&D, and living spaces, but they have not deeply explored the mechanisms by which these functions intersect and interact. Furthermore, the optimal functional mixing degree has not been clearly defined. In addition, the existing literature lacks systematic empirical data to support the specific effect of functional mixing on improving the innovation performance of parks.
Based on previous research [32,35], this study further summarizes and proposes the importance of an appropriate mix of three functional types—industry, city, and innovation—for promoting the innovative development of science and technology parks. This study further reveals that a higher functional mixing degree is only sometimes advantageous. Beyond a certain threshold in the mixing of “industry–city–innovation” functions, the innovative development indicators of STPs may decrease as the mixing degree increases. Specifically, this study identifies that an “industry–city–innovation” functional POI mixing degree within the range of [0.14, 0.16] effectively promotes innovative development in STPs.
Building on previous research, this study not only explores the influence mechanism of functional mixing in the development of STPs but also quantitatively determines the “optimal range” for the mixing of “industry–city–innovation” functions, providing a deeper understanding of its role in fostering sustainable development.
Based on the conclusions of this study, the following recommendations are proposed for the future innovative development of STPs:
  • The planning and design of new city parks should particularly focus on the rational distribution and organic integration of the three core elements of “industry”, “city”, and “innovation”. Through scientifically sound spatial design, carefully plan functions for production, residential areas, research, and related services, strengthen the collaborative relationships between different functional zones, and create a diversified, multifunctional urban space. Such designs can not only effectively integrate multiple functions, such as production, living, commerce, and leisure, but also enhance the competitiveness of sci-tech parks in attracting high-end industries, high-tech enterprises, and top-tier talent, thereby laying a solid spatial foundation for the park’s sustainable innovation development.
  • In the spatial planning and design of STPs, the “industry–city–innovation” functions of surrounding areas should be reasonably configured, with the functional mixing degree controlled within the optimal range of 0.14 to 0.16 so to maximize the STP’s innovation vitality. If the functional mixing degree of the surrounding areas is too low, it will result in insufficient urban service facilities and innovation resource allocation, potentially leading to issues such as industrial–city separation, delayed industrial transformation, and difficulties in the commercialization of technological achievements. Conversely, if the functional mixing degree is too high, it may lead to an imperfect industrial chain, weaken the synergistic effects of industries, and hinder the overall development of the park. Therefore, the refined control of the functional mixing degree is key in STP planning and design, effectively preventing excessive resource dispersion and insufficient innovation support, and optimizing the spatial layout and developmental efficiency of the STPs.
  • The design of urban spatial layout should focus on the fine integration of the three elements of “industry”, “city”, and “innovation” at the mesoscopic scale. For the development of STPs, mid-scale design can better balance industrial functions with urban service functions, promoting the efficient flow of innovation resources. At the macroscopic scale, excessive functional mixing may lead to the fragmentation of “industry–city–innovation” functions, thereby reducing the urban operational efficiency. Meanwhile, at the microscopic scale, the excessive clustering of functions may affect the industrial agglomeration effect, thus impacting the production efficiency, urban environmental quality, and innovation collaboration. Therefore, a rational mid-scale spatial design not only maintains the integrity of the industrial ecosystem but also strengthens the connection between the STP and surrounding industrial chains, urban support services, and innovation resources, further promoting the STP’s sustainable innovation development. This design approach emphasizes detailed spatial planning to coordinate the roles and layouts of different functional areas, ensuring the STP’s high efficiency and sustainability.

5. Conclusions

This study focuses on the Hangzhou West Hi-Tech Corridor, analyzing the influence of the functional POI mixing degree around STPs on their innovative development. By conducting this analysis, the research identifies the optimal range of the “industry–city–innovation” functional POI mixing degree that promotes innovative growth in STPs. This study addresses the issue of single-function areas surrounding STPs, which are inconsistent with the development needs of the parks and the requirements of innovative talent. Additionally, it enriches the theoretical framework of STPs and “industry–city–innovation” integration, providing valuable insights for future urban practices and the innovative development of STPs. The main conclusions of the study are as follows:
  • The mix of “industry–city–innovation” functions promotes innovative development in STPs.
As the three key elements in STP development, the organic integration of “industry”, “city”, and “innovation” plays a powerful role in the spatial design and functional layout, driving the coordinated development of industry, urbanization, and innovation. Through the rational mixing of these functions, STPs can not only enhance the vitality and competitiveness of industrial functions, strengthening the STPs’ adaptability and risk resilience, but also optimize the resource allocation in urban spatial structure design, thus improving the overall operational efficiency and the convenience of daily life and production. By emphasizing the organic integration of production, residential, research, and service facilities in spatial planning, STPs provide better working and living conditions, thus attracting a large number of high-tech enterprises and top-tier talent. Furthermore, functional mixing promotes the flow of innovation elements, optimizes the distribution of technological innovation resources, accelerates the conversion of scientific achievements, and provides strong support for innovation activities. Through this comprehensive spatial design and functional mixing, STPs can establish a virtuous cycle of “industry revitalizing the city, the city promoting industry, and innovation driving development”, fostering the sustainable growth of innovation-driven economies, and further enhancing the park’s overall competitiveness and innovation capacity.
2.
A higher “industry–city–innovation” functional mixing degree is not always better; the range of 0.14 to 0.16 is more beneficial for innovative development in STPs.
The research results indicate that a higher “industry–city–innovation” functional mixing degree does not necessarily lead to better outcomes. Its rationality lies in the precise value range defined in its design. In the functional mixing design of STPs, a too-low functional mixing degree may lead to the fragmentation of functions, hindering the flow of elements and resource allocation within the STPs, thus restricting the overall improvement of the STPs’ innovation capacity. On the other hand, an excessively high functional mixing degree could result in overly complex functional overlaps, inhibiting the perfection of the industrial chain and the realization of synergies, ultimately affecting the STP’s operational efficiency. Therefore, designers should pay particular attention to the precise setting of the functional mixing degree, ensuring that it remains within the reasonable range of 0.14 to 0.16. Within this range, the interaction and synergy between the “industry–city–innovation” functions can be maintained effectively, allowing for the advantages of spatial integration design to be fully realized, thereby promoting the sustainable development of the STP’s innovation economy. If the mixing degree exceeds this range, it may lead to imbalanced spatial resource allocation, increased operational difficulty, and even a lack of innovation momentum. The reasonable setting of functional mixing degrees is a crucial component of park planning and design. Only within the appropriate functional mixing degree range can the efficient operation and sustainable innovation development of the park be ensured.
This study has certain limitations in terms of data collection and indicator selection. Firstly, due to the confidentiality of economic data, some companies’ annual reports were private, resulting in a lack of complete coverage of all companies within the Corridor in the data sample used to measure the innovative development indicators for the science and innovation enterprises. Additionally, when selecting the innovative development indicators for the STPs, the study primarily relied on previous research, relevant policies, regulations, and reports, and selected a subset of quantifiable indicators as analysis variables. This selection process may have influenced the research outcomes, as it may only partially capture some relevant aspects of the innovative development of STPs. These limitations suggest further research to expand the data sample and refine the selection of indicators to provide a more comprehensive and accurate analysis.
This study took the Hangzhou West Hi-Tech Corridor, a model representing the latest trends in “industry–city–innovation” integration within China’s STPs, as its research subject to explore the influence of functional mixing in the innovative development of such STPs. Future research could incorporate case studies of different types of STPs, conducting further qualitative analyses on aspects such as functional mixing types, scales, proportions, and distributions to validate the findings and summarize mixed-use models. Moreover, we can conduct comparative studies of STPs across different regions and countries to explore how the “industry–city–innovation” functional mixing degree affects innovation development under varying urban contexts. This would help to broaden our conclusions and provide new insights into the development of STPs, offering a basis for regional and national policymaking. Furthermore, attention can be given to the dynamic evolution of the functional mixing degree and its spatiotemporal distribution characteristics. This includes investigating how the functional mixing degree adjusts in response to the development stages of STPs and changes in the external environment, as well as analyzing how such adjustments impact the long-term innovation capacity. In response to the strategic development of STPs in the future, it is recommended that government agencies formulate integrated plans that span across departments and sectors to coordinate the spatial layout of industry, city, and innovation functions. Efforts should be made to promote mixed land use, improve public service facilities, and foster industrial agglomeration within the STPs. Emphasis should be placed on strengthening infrastructure and ecological environment construction, optimizing urban spatial design, and enhancing public services such as transportation, education, and healthcare to create a favorable atmosphere for innovation and entrepreneurship. It is also recommended to establish a policy system centered on “talent + platform + services” by introducing high-level scientific and technological talent, building shared incubation platforms, and improving supporting facilities for talent housing and living in order to enhance the overall innovation ecosystem of the STPs.

Author Contributions

Y.Y. was responsible for the conception and methodology of the research, and designed the research idea; Y.L. collected and processed the data, completed the calculation and analysis, and wrote the manuscript; Q.C. and S.D. provided data and made suggestions on the data processing method; Y.Y. is responsible for future questions from readers; Y.Y. is the corresponding author. All authors have read and agreed to the published version of the manuscript.

Funding

The National Natural Science Foundation of China (52408001); Young and Middle-aged Teachers Training Action of Anhui Province-Excellent Young Teachers Training Project (YQYB2024033); the Key Project of Natural Science Research in Universities of Anhui Province (KJ2021A0615); the Talent Introduction and PhD Start-up Fund Project of Anhui Jianzhu University (2022QDZ14); the Social Science Innovation and Development Research Project of Anhui (2023CX084); the Cultural and Tourism Research Project of Anhui (WL2023YB06).

Institutional Review Board Statement

Not applicable.

Informed Consent Statement

Not applicable.

Data Availability Statement

The original contributions presented in this study are included in the article; further inquiries can be directed to the corresponding author.

Acknowledgments

The authors are grateful for the support of the National Natural Science Foundation of China. The contents of this paper are solely the responsibility of the authors and do not represent the official views of the institutes and funding agencies.

Conflicts of Interest

The authors declare no conflicts of interest.

References

  1. Huang, Y.; Li, K.; Li, P. Innovation ecosystems and national talent competitiveness: A country-based comparison using fsQCA. Technol. Forecast. Soc. Change 2023, 194, 122733. [Google Scholar] [CrossRef]
  2. Tang, C.; Dou, J. Exploring the polycentric structure and driving mechanism of urban regions from the perspective of innovation network. Front. Phys. 2022, 10, 855380. [Google Scholar] [CrossRef]
  3. Xue, Y.; Tang, C.W.; Wu, H.; Liu, J.; Hao, Y. The emerging driving force of energy consumption in China: Does digital economy development matter? Energy Policy 2022, 165, 112997. [Google Scholar] [CrossRef]
  4. Wu, N.; Liu, Z. Higher education development, technological innovation and industrial structure upgrade. Technol. Forecast. Soc. Change 2021, 162, 120400. [Google Scholar] [CrossRef]
  5. Zhu, K.; Xu, J.; Wang, X. The evolution of urban innovation space and its spatial relationships with talents’ living demands: Evidence from Hangzhou, China. Int. J. Urban Sci. 2022, 27, 442–460. [Google Scholar] [CrossRef]
  6. Figueiredo, Y.D.d.; Prim, M.A.; Dandolini, G.A. Urban regeneration in the light of social innovation: A systematic integrative literature review. Land Use Policy 2021, 113, 105873. [Google Scholar] [CrossRef]
  7. Zhang, L.; He, X.; Jia, Z. Industrial agglomeration, public services and city size: Evidence from 286 cities in China. Land Use Policy 2023, 131, 106758. [Google Scholar] [CrossRef]
  8. Zuo, Y.; Yang, C.; Xin, G.; Wu, Y.; Chen, R. Driving Mechanism of Comprehensive Land Consolidation on Urban–Rural Development Elements Integration. Land 2023, 12, 2037. [Google Scholar] [CrossRef]
  9. Wei, M.; Dong, B.; Jin, P. Do Science Parks Promote Companies’ Innovative Performance? Micro Evidence from Shanghai Zhangjiang National Innovation Independent Demonstration Zone. Sustainability 2023, 15, 7936. [Google Scholar] [CrossRef]
  10. Bai, Y.; Li, X. Creative destruction path selection for industrial park transformation and upgrading under the concept of character town in the era of big data. Secur. Commun. Netw. 2022, 2022, 2110039. [Google Scholar] [CrossRef]
  11. Zhang, L.; Lin, G.; Lyu, X.; Su, W. Suppression or promotion: Research on the impact of industrial structure upgrading on urban economic resilience. Humanit. Soc. Sci. Commun. 2024, 11, 1–14. [Google Scholar] [CrossRef]
  12. Poonjan, A.; Tanner, A.N. The role of regional contextual factors for science and technology parks: A conceptual framework. Eur. Plan. Stud. 2020, 28, 400–420. [Google Scholar] [CrossRef]
  13. Zhao, C.; Qu, X.; Luo, S. Impact of the InnoCom program on corporate innovation performance in China: Evidence from Shanghai. Technol. Forecast. Soc. Change 2019, 146, 103–118. [Google Scholar] [CrossRef]
  14. Shi, Y.; Li, J.; Li, B.; Hang, T.T.T. A New Approach to Evaluate the Integrated Development of City and Industry: The Cases of Shanghai and the Kangqiao Industrial Park. Buildings 2022, 12, 1851. [Google Scholar] [CrossRef]
  15. Johnsson, M.; Börell, P. Key factors for STPs facilitating the establishment of an innovation- advising organization network to support SMEs in developing Industry 4.0 products/services. In Proceedings of the 36th IASP World Conference on Science Parks and Areas of Innovation, Nantes, France, 24–27 September 2019. [Google Scholar]
  16. Ribeiro, J.d.A.; Ladeira, M.B.; Faria, A.F.d.; Barbosa, M.W. A reference model for science and technology parks strategic performance management: An emerging economy perspective. J. Eng. Technol. Manag. 2021, 59, 101612. [Google Scholar] [CrossRef]
  17. Mondal, C. The Development of Science Parks and the Acquisition and use of New Knowledge by Technology Firms. Ph.D. Thesis, Kingston University, London, UK, September 2024. [Google Scholar]
  18. Makhdoom, I.; Lipman, J.; Abolhasan, M.; Challen, D.N.R. Science and Technology Parks: A Futuristic Approach. IEEE Access 2022, 10, 31981–32021. [Google Scholar] [CrossRef]
  19. Vidová, J. Industrial Parks—History, Present and its Influence to the Employment. Rev. Econ. Perspect. 2010, 10, 41. [Google Scholar] [CrossRef]
  20. Jia, K.; Kenney, M. The Chinese platform business group: An. alternative to the Silicon Valley model? J. Chin. Gov. 2021, 7, 58–80. [Google Scholar] [CrossRef]
  21. Zuo, L.; Lara, A.L. Shekou: New Modes of Development. Landsc. Archit. Front. 2014, 2, 143–153. [Google Scholar]
  22. Zou, T. Technological Innovation Promotes Industrial Upgrading: An Analytical Framework. Struct. Change Econ. Dyn. 2024, 70, 150–167. [Google Scholar] [CrossRef]
  23. Wang, W.; Hu, B.; Liu, J.; Yang, Z. Can antitrust policy promote enterprise innovation? Evidence from Zhongguancun science and Technology Park. Heliyon 2024, 10, e30341. [Google Scholar] [CrossRef] [PubMed]
  24. Shen, M.R.; Yang, F.; Tang, S.; Zhang, J.X. Research on the Supply and Governance of Industrial Land under the Guidance of Innovative Economic Development: A Perspective Based on the Transformation of “People-Industry-City” Characteristics. Urban Plan. 2021, 45, 74–83. [Google Scholar]
  25. Blanco Pastor, A.; Canniffe, E.; Rosa Jiménez, C.J. Learning from Letchworth and Welwyn Garden City: Garden cities’ policies for the development of existing settlements in the contemporary world. Land Use Policy 2023, 132, 106759. [Google Scholar] [CrossRef]
  26. Yang, L.; Majumdar, A.; Dam, K.H.v.; Zhang, L. Theories and practices for reconciling transport infrastructure, public space, and people—A review. In Proceedings of the Institution of Civil Engineers-Municipal Engineer; Thomas Telford Ltd.: London, UK, 2021; Volume 175, pp. 187–203. [Google Scholar] [CrossRef]
  27. Li, J.; Li, K.; Qiu, R. The Suburbanization and Revitalization of Industrial Land in Shanghai, China. Sustainability 2022, 14, 7062. [Google Scholar] [CrossRef]
  28. Peng, F.-l.; Qiao, Y.; Zhao, J.; Liu, K.; Li, J.-C. Planning and implementation of underground space in Chinese central business district (CBD): A case of Shanghai Hongqiao CBD. Tunn. Undergr. Space Technol. 2020, 95, 103176. [Google Scholar] [CrossRef]
  29. Gómez-Varo, I.; Delclòs-Alió, X.; Miralles-Guasch, C. Jane Jacobs reloaded: A contemporary operationalization of urban vitality in a district in Barcelona. Cities 2022, 123, 103565. [Google Scholar] [CrossRef]
  30. Pan, W. What type of mixed-use and open? A critical environmental analysis of three neighborhood types in China and insights for sustainable urban planning. Landsc. Urban Plan. 2021, 216, 104221. [Google Scholar]
  31. Nadeem, M.; Aziz, A.; Al-Rashid, M.A.; Tesoriere, G.; Asim, M.N.; Campisi, T. Scaling the Potential of Compact City Development: The Case of Lahore, Pakistan. Sustainability 2021, 13, 5257. [Google Scholar] [CrossRef]
  32. Stanislav, A.; Chin, J.T. Evaluating livability and perceived values of sustainable neighborhood design: New Urbanism and original urban suburbs. Sustain. Cities Soc. 2019, 47, 101517. [Google Scholar] [CrossRef]
  33. Liu, C.; Ren, L.; Wu, L.; Guo, M. Measuring the Smart Growth Pattern for Medium-Sized Cities. J. Urban Plan. Dev.-ASCE 2020, 146, 05020005. [Google Scholar] [CrossRef]
  34. Moore, J.F. The Death of Competition: Leadership and Strategy in the Age of Business Ecosystems; Wiley: Hoboken, NJ, USA, 1996. [Google Scholar]
  35. Leino, H.; Åkerman, M. The politics of making Finland an experimenting nation. Crit. Policy Stud. 2021, 16, 441–459. [Google Scholar] [CrossRef]
  36. Geyer, H.S. The theory and praxis of mixed-use development—An integrative literature review. Cities 2024, 147, 104774. [Google Scholar] [CrossRef]
  37. Zhou, Y.; Li, Z.Q.; Tao, X. Urban Mixed Use and its Impact on Energy Performance of Micro Gird System. Energy Procedia 2016, 103, 339–344. [Google Scholar] [CrossRef]
  38. Momeni, E.; Antipova, A. A micro-level analysis of commuting and urban land using the Simpson’s index and socio-demographic factors. Appl. Geogr. 2022, 145, 102755. [Google Scholar] [CrossRef]
  39. Motieyan, H.; Azmoodeh, M. Mixed-use distribution index: A novel bilevel measure to address urban land-use mix pattern (A case study in Tehran, Iran). Land Use Policy 2021, 109, 105724. [Google Scholar] [CrossRef]
  40. Zhou, X.; Yeh, A.G.; Yue, Y.; Li, W. Residential-employment mixed use and jobs-housing balance: A case study of Shenzhen, China. Land Use Policy 2022, 119, 106201. [Google Scholar] [CrossRef]
  41. Deng, P.; Huang, Q.; Liu, F.; Wang, Z.; Liu, M. The research on identification and spatial pattern of urban mixed land-use: A case study of Chengdu. Ecol. Indic. 2023, 154, 110891. [Google Scholar] [CrossRef]
  42. Fukui, S.; Anh Luong, D. Impact of diseconomy of mixed land-use on factory land redevelopment in large urban area: Evidence from Japan. Jpn. World Econ. 2024, 71, 101256. [Google Scholar] [CrossRef]
  43. Zhao, X.; Xia, N.; Li, M. 3-D multi-aspect mix degree index: A method for measuring land use mix at street block level. Comput. Environ. Urban Syst. 2023, 104, 102005. [Google Scholar] [CrossRef]
  44. Sohn, D.W. Do all commercial land uses deteriorate neighborhood safety?: Examining the relationship between commercial land-use mix and residential burglary. Habitat Int. 2016, 55, 148–158. [Google Scholar] [CrossRef]
  45. Turner, V.K. The environmental consequences of residential land tenure in single family neighborhoods. Land Use Policy 2022, 114, 105959. [Google Scholar] [CrossRef]
  46. Wandl, A.; Hausleitner, B. Investigating functional mix in Europe’s dispersed urban areas. Environ. Plan. B Urban Anal. City Sci. 2021, 48, 2862–2879. [Google Scholar] [CrossRef]
  47. Hu, Q.; Shen, W.; Yan, J.; Kong, W.; Li, W.; Zhang, Z. Does existing mixed land development promote the urban spatial composite function? Evidence from Beijing, China. Land Use Policy 2024, 143, 107212. [Google Scholar] [CrossRef]
  48. Wu, Y.; Gao, X. Can the establishment of eco-industrial parks promote urban green innovation? Evidence from China. J. Clean. Prod. 2022, 341, 130855. [Google Scholar] [CrossRef]
  49. Wu, Y.; Yang, Y.; Xu, W.; Chen, Q. The Influence of Innovation Resources in Higher Education Institutions on the Development of Sci-Tech Parks’ Enterprises in the Urban Innovative Districts at the Stage of Urbanization Transformation. Land 2020, 9, 396. [Google Scholar] [CrossRef]
  50. Wu, Y.; Yang, Y.; Chen, Q.; Xu, W. The Correlation between the Jobs–Housing Relationship and the Innovative Development of Sci-Tech Parks in New Urban Districts: A Case Study of the Hangzhou West Hi-Tech Corridor in China. ISPRS Int. J. Geo-Inf. 2020, 9, 762. [Google Scholar] [CrossRef]
  51. Zhou, J.; Li, W. The feasibility study of the complex infrastructure function of Science and Innovation Park. Archit. Cult. 2024, 7, 39–41. [Google Scholar]
  52. Weng, X.-H.; Zhu, Y.-M.; Song, X.-Y.; Ahmad, N. Identification of Key Success Factors for Private Science Parks Established from Brownfield Regeneration: A Case Study from China. Int. J. Environ. Res. Public Health 2019, 16, 1295. [Google Scholar] [CrossRef]
  53. Chung, Y.-S.; Huang, S.-J.; Ho, M.H.-C.; Liang, S.-W. A 4D Analysis Framework of Competitive Advantages and Development Strategies of Urban Science and Technology Parks: The Examples of Taipei Neihu Technology Park and Nankang Software Park. J. Internet Technol. 2021, 22, 1313–1333. [Google Scholar] [CrossRef]
  54. Yang, X.; Bo, S.; Wang, J. Classifying Urban Functional Zones by Integrating the Homogeneity and Structural Similarity of POIs. J. Urban Plan. Dev. 2024, 150, 04024052. [Google Scholar] [CrossRef]
  55. Hu, Y.; Han, Y.-k. Identification of Urban Functional Areas Based on POI Data: A Case Study of the Guangzhou Economic and Technological Development Zone. Sustainability 2019, 11, 1385. [Google Scholar] [CrossRef]
  56. Zhang, S.; Wang, X. Does innovative city construction improve the industry–university–research knowledge flow in urban China? Technol. Forecast. Soc. Change 2022, 174, 121200. [Google Scholar] [CrossRef]
  57. Ministry of Natural Resources. Guidelines for the Classification of National Territorial Spatial Survey, Planning, Utilization, and Control (Trial). The Ministry of Natural Resources of the People’s Republic of China, 17 Nov. 2020. Available online: https://www.gov.cn/zhengce/zhengceku/202311/content_6917279.htm (accessed on 3 April 2025).
  58. Anton-Tejon, M.; Barge-Gil, A.; Martinez, C.; Albahari, A. Science and technology parks and their heterogeneous effect on firm innovation. J. Eng. Technol. Manag. 2024, 73, 101820. [Google Scholar] [CrossRef]
  59. Li, S.; Wu, Y.; Yu, Q.; Chen, X. National Agricultural Science and Technology Parks in China: Distribution Characteristics, Innovation Efficiency, and Influencing Factors. Agriculture 2023, 13, 1459. [Google Scholar] [CrossRef]
  60. Araki, M.E.; Bennett, D.L.; Wagner, G.A. Regional innovation networks & high-growth entrepreneurship. Res. Policy 2024, 53, 104900. [Google Scholar]
  61. Lin, S.; Lin, R.; Sun, J.; Wang, F.; Wu, W. Dynamically evaluating technological innovation efficiency of high-tech industry in China: Provincial, regional and industrial perspective. Socio-Econ. Plan. Sci. 2020, 74, 100939. [Google Scholar] [CrossRef]
  62. Chen, J.-Q.; He, Y.; Cheng, Y.; Fournier-Viger, P.; Huang, J.Z. A multiple kernel-based kernel density estimator for multimodal probability density functions. Eng. Appl. Artif. Intell. 2024, 132, 107979. [Google Scholar] [CrossRef]
  63. Zheng, M.; Wang, H.; Shang, Y.; Zheng, X. Identification and prediction of mixed-use functional areas supported by POI data in Jinan City of China. Sci. Rep. 2023, 13, 2913. [Google Scholar] [CrossRef]
  64. Saraiva, P. On Shannon entropy and its applications. Kuwait J. Sci. 2023, 50, 194–199. [Google Scholar] [CrossRef]
  65. Rohm, K.; Solouki Bonab, V.; Manas-Zloczower, I. Quantitative evaluation of mixing using a refined Shannon entropy. Compos. Sci. Technol. 2020, 197, 108276. [Google Scholar] [CrossRef]
  66. Dewa, D.D.; Buchori, I.; Rudiarto, I.; Sejati, A.W.; Liu, Y. Spatiotemporal Variations of Urban Spatial Dispersion and Its Vegetation Degradation in Joglosemar’s Urban Growth Corridors, Indonesia. Aust. Geogr. 2024, 55, 179–201. [Google Scholar] [CrossRef]
  67. Liu, L.; Huang, H.; Yang, J. Enhancing Detailed Planning from Functional Mix Perspective with Spatial Analysis and Multiscale Geographically Weighted Regression: A Case Study in Shanghai Central Region. Land 2024, 13, 2154. [Google Scholar] [CrossRef]
  68. Wu, W.; Chen, W.Y.; Yun, Y.; Wang, F.D.; Gong, Z. Urban greenness, mixed land-use, and life satisfaction: Evidence from residential locations and workplace settings in Beijing. Landsc. Urban Plan. 2022, 224, 104428. [Google Scholar] [CrossRef]
  69. Xiao, R.; Yin, H.; Liu, R.; Zhang, Z.; Chinzorig, S.; Qin, K.; Tan, W.; Wan, Y.; Gao, Z.; Xu, C.; et al. Exploring the Relationship between Land Use Change Patterns and Variation in Environmental Factors within Urban Agglomeration. Sustain. Cities Soc. 2024, 108, 105447. [Google Scholar] [CrossRef]
  70. Wang, T.; Li, Y.; Chuang, I.-T.; Qiao, W.; Jiang, J.; Beattie, L. Evaluating the 15-minute city paradigm across urban districts: A mobility-based approach in Hamilton, New Zealand. Cities 2024, 151, 105147. [Google Scholar] [CrossRef]
  71. Kong, H.; Sui, D.Z.; Tong, X.; Wang, X. Paths to mixed-use development: A case study of Southern Changping in Beijing, China. Cities 2015, 44, 94–103. [Google Scholar] [CrossRef]
  72. Bertholdo, E.; Marins, K.R.d.C. Urban tech ecosystems: A framework for assessing the impact of development policies on startup clusters. J. Urban Manag. 2025. [Google Scholar] [CrossRef]
  73. Gao, T.; Lim, S. Socio-spatial integration in innovation districts: Singapore’s mixed-use experiment. Cities 2023, 140, 104405. [Google Scholar] [CrossRef]
  74. United Nations Industrial Development Organization (UNIDO). International Guidelines for Industrial Parks; UNIDO: Vienna, Austria, 2019. [Google Scholar]
Figure 1. The Corridor “One belt, three cities and more towns” spatial layout.
Sustainability 17 03715 g001
Figure 2. The Corridor functional group diagram.
Sustainability 17 03715 g002
Figure 3. Method flow chart.
Sustainability 17 03715 g003
Figure 4. Sampling range map.
Sustainability 17 03715 g004
Figure 5. Spatial distribution map of “industry¬–city–innovation” functional POIs.
Sustainability 17 03715 g005
Figure 6. Kernel density distribution map of the three types of “industry–city–innovation” functional POIs. (a) “Industry” POI classification; (b) “City” POI classification; (c) “Innovation” POI classification.
Sustainability 17 03715 g006
Figure 7. Functional POI mixing degree values for each sample.
Sustainability 17 03715 g007
Figure 8. Spatial types and distribution map of the STPs.
Sustainability 17 03715 g008
Figure 9. Kernel density analysis of innovative development indicators for science and technology enterprises. (a) Number of employees; (b) Registered capital; (c) Total sales revenue; (d) Total tax payment; (e) Number of intellectual properties; (f) Number of patents; (g) Total innovation content.
Sustainability 17 03715 g009
Figure 10. Quadratic function curve and vertex coordinates.
Sustainability 17 03715 g010
Figure 11. Schematic diagram of the optimal functional mixing degree intersection range.
Sustainability 17 03715 g011
Table 3. The regression analysis results.
Dependent
Variables
IndicatorRelationshipp-Values
Y1Number of employeesLinear/Logarithmicp = 0.277/p = 0.820
Y2Registered capitalLinear/Logarithmicp = 0.333/p = 0.746
Y3Total sales revenueLinearp = 0.417
Y4Total tax paymentLinearp = 0.341
Y5Number of intellectual propertiesLinearp = 0.169
Y6Number of patentsLinearp = 0.118
Y7Total innovation contentLinearp = 0.146
Table 4. Quadratic curve regression results.
IndicatorCoefficientUnstandardized
Coefficients
Standardized Coefficientstp
BStandard ErrorBeta
Y1
Number of employees
(Constant)788.162635.411 1.2400.217
a2−92,999.27824,921.676−1.251−3.7320.000
b29,712.2408694.8001.1453.4170.001
FormulaY = −92,999x2 + 29,712x + 788
Y2
Registered capital
(Constant)30,021.14380,805.131 0.3720.711
a2−8,862,449.3933,169,288.178−0.958−2.7960.006
b2,774,933.6251,105,717.2210.8602.5100.013
FormulaY = −8,862,449x2 + 2,774,934x + 30,021
Y3
Total sales revenue
(Constant)1298.6665198.580 0.2500.803
a2−488,652.055203,895.451−0.829−2.3970.018
b153,394.42471,136.0720.7462.1560.033
FormulaY = −488,652x2 + 153,394x + 1299
Y4
Total tax payment
(Constant)34.003104.434 0.3260.745
a2−13,301.3904096.054−1.102−3.2470.001
b4212.9391429.0521.0002.9480.004
FormulaY = −92,999x2 + 29,712x + 788
Y5
Number of intellectual properties
(Constant)253.555214.294 1.1830.239
a2−27,387.0398404.915−1.102−3.2580.001
b8382.5152932.3490.9672.8590.005
FormulaY = −27,387x2 + 8383x + 254
Y6
Number of patents
(Constant)64.22851.766 1.2410.217
a2−5512.7842030.335−0.927−2.7150.008
b1602.020708.3530.7722.2620.025
FormulaY = −5513x2 + 1602x + 64
Y7
Total innovation content
(Constant)22.58320.121 1.1220.264
a2−1818.9600789.192−0.794−2.3050.023
b22.904275.3370.6541.8990.060
FormulaY = −1819x2 + 523x + 23
The p-value is the probability of obtaining a result at least as extreme as the one observed, or an even more extreme result, assuming the null hypothesis is true. The smaller the p-value, the more significant the result (p = 0.01 is significant at the 0.01 level; p = 0.05 is significant at the 0.05 level; p = 0.1 is significant at the 0.1 level).
Disclaimer/Publisher’s Note: The statements, opinions and data contained in all publications are solely those of the individual author(s) and contributor(s) and not of MDPI and/or the editor(s). MDPI and/or the editor(s) disclaim responsibility for any injury to people or property resulting from any ideas, methods, instructions or products referred to in the content.

