
Spatiotemporal Evolution Characteristics and Prediction of Habitat Quality Changes in the Poyang Lake Region, China

 ,
,
Abstract
1. Introduction
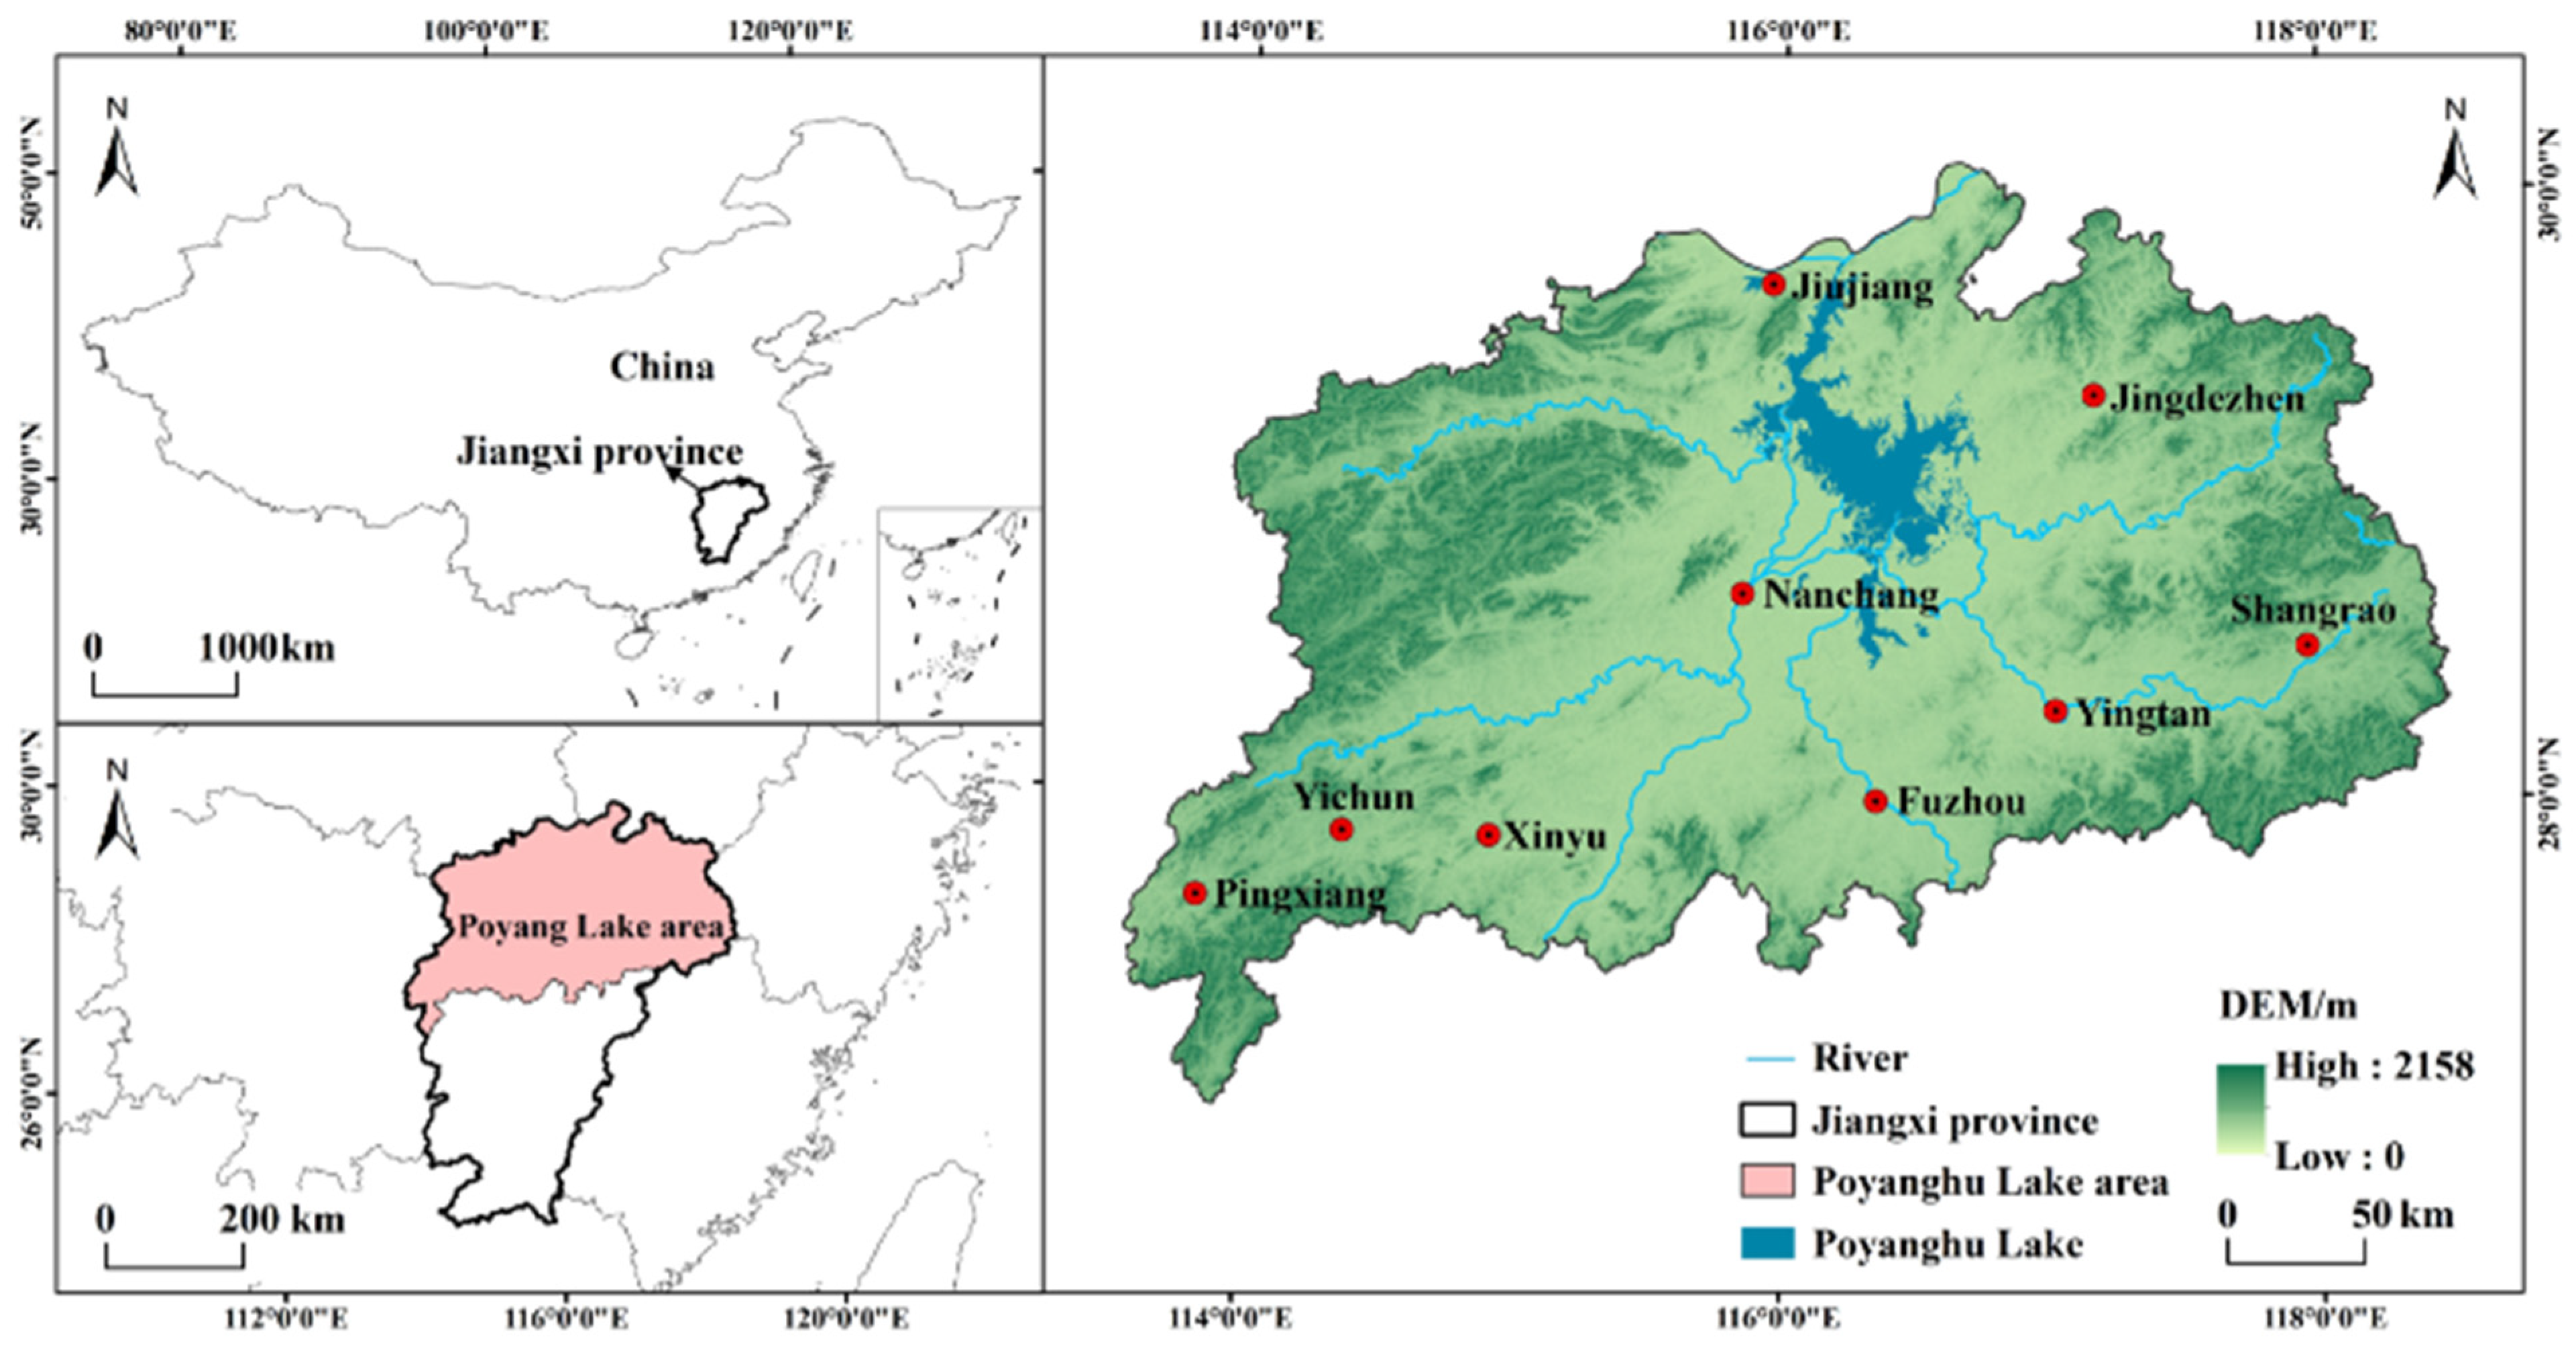
2. Study Area
3. Materials and Methods
3.1. Data Acquisition and Preprocessing
3.2. HQ Assessment
3.3. LU Prediction
3.3.1. LU Type Development Probability
3.3.2. Markov Model
3.3.3. CA Model
3.3.4. Accuracy Test
4. Results
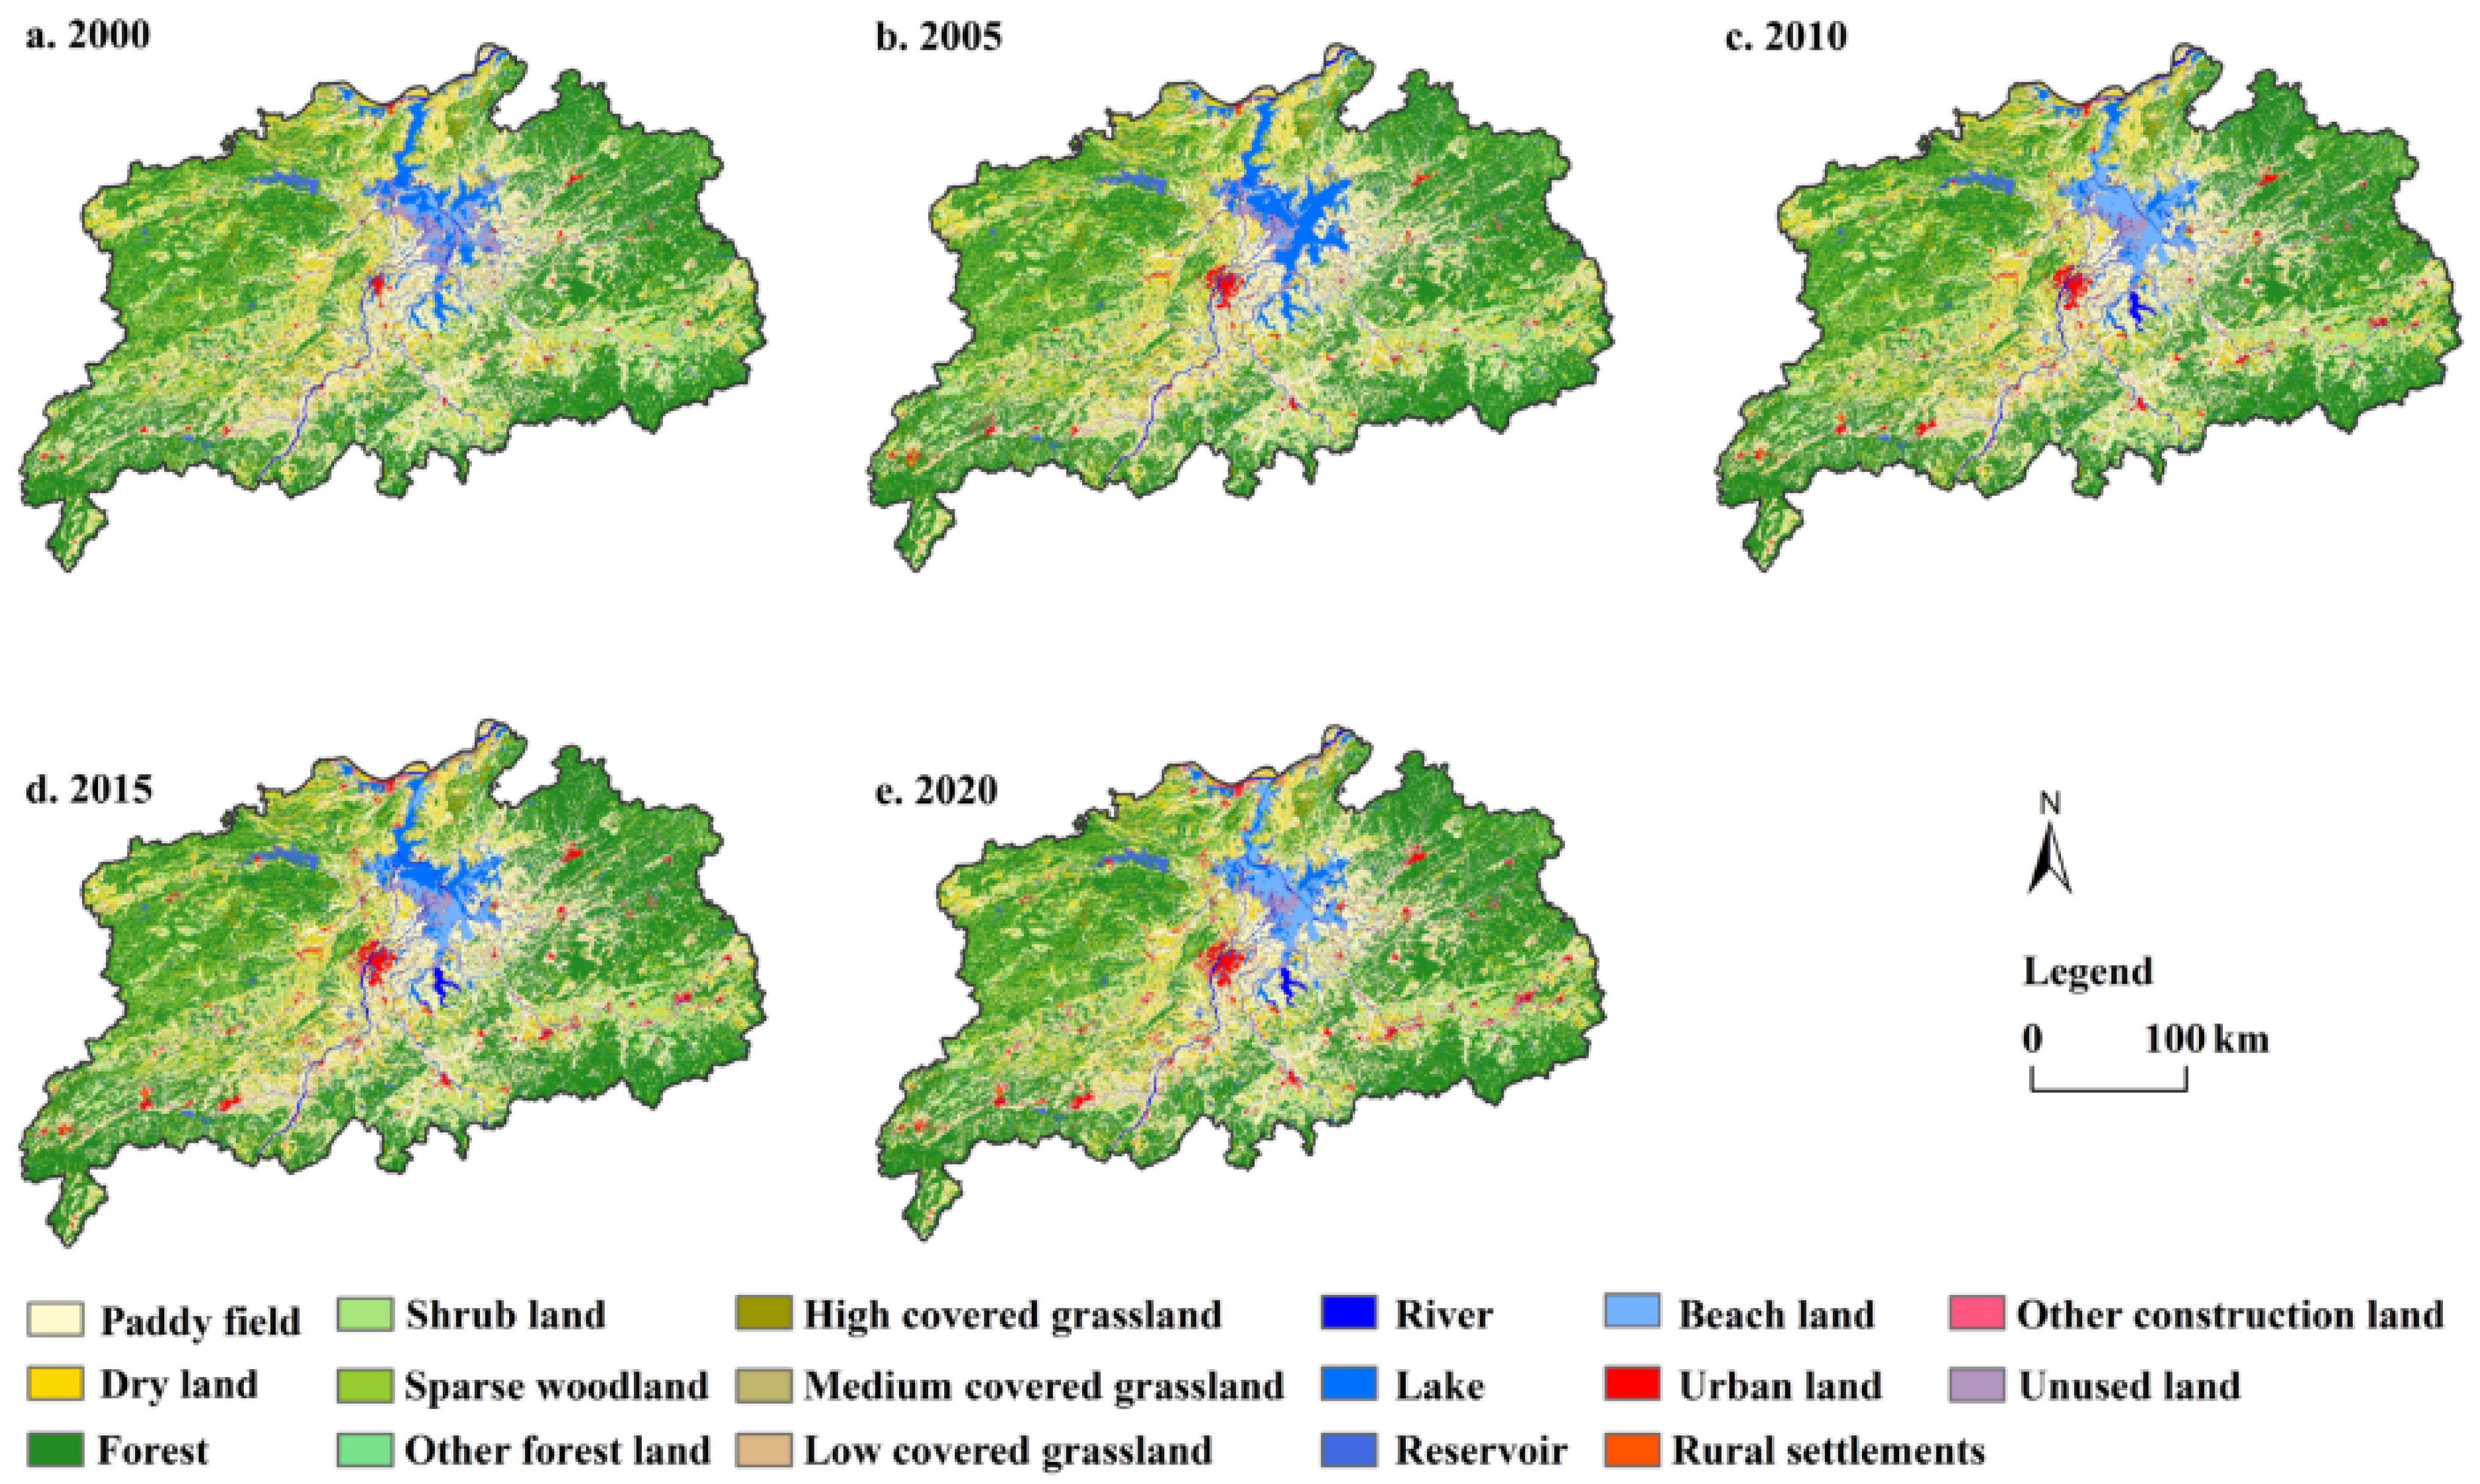
4.1. LU Spatiotemporal Dynamics
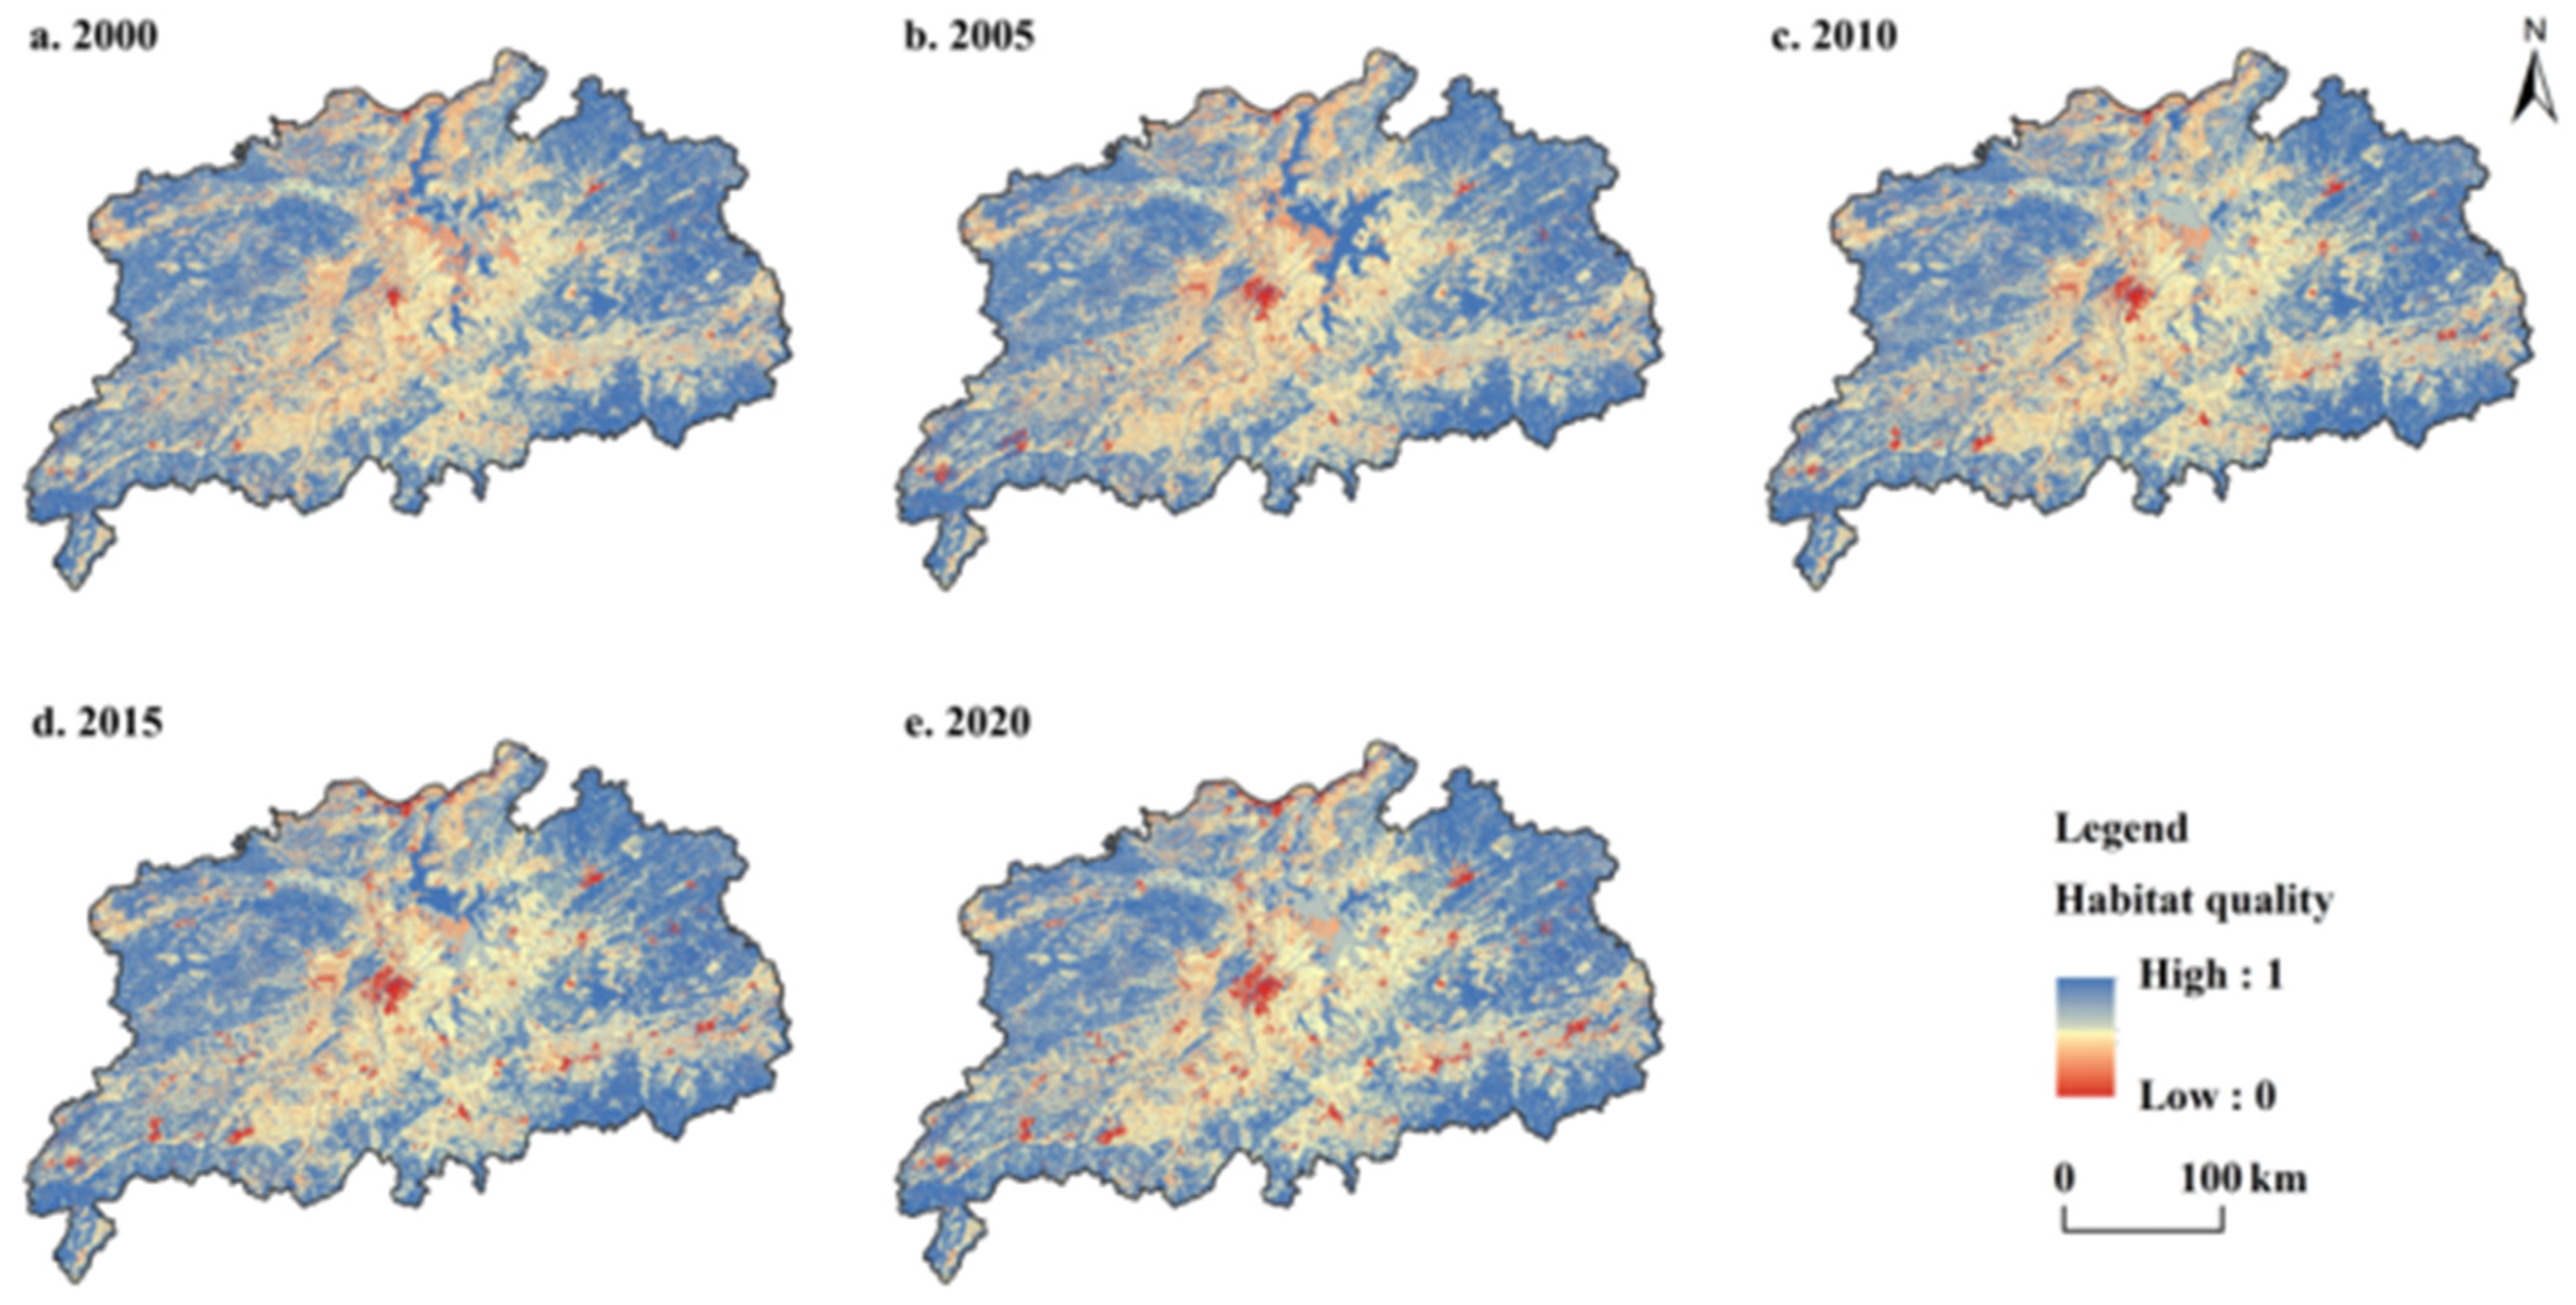
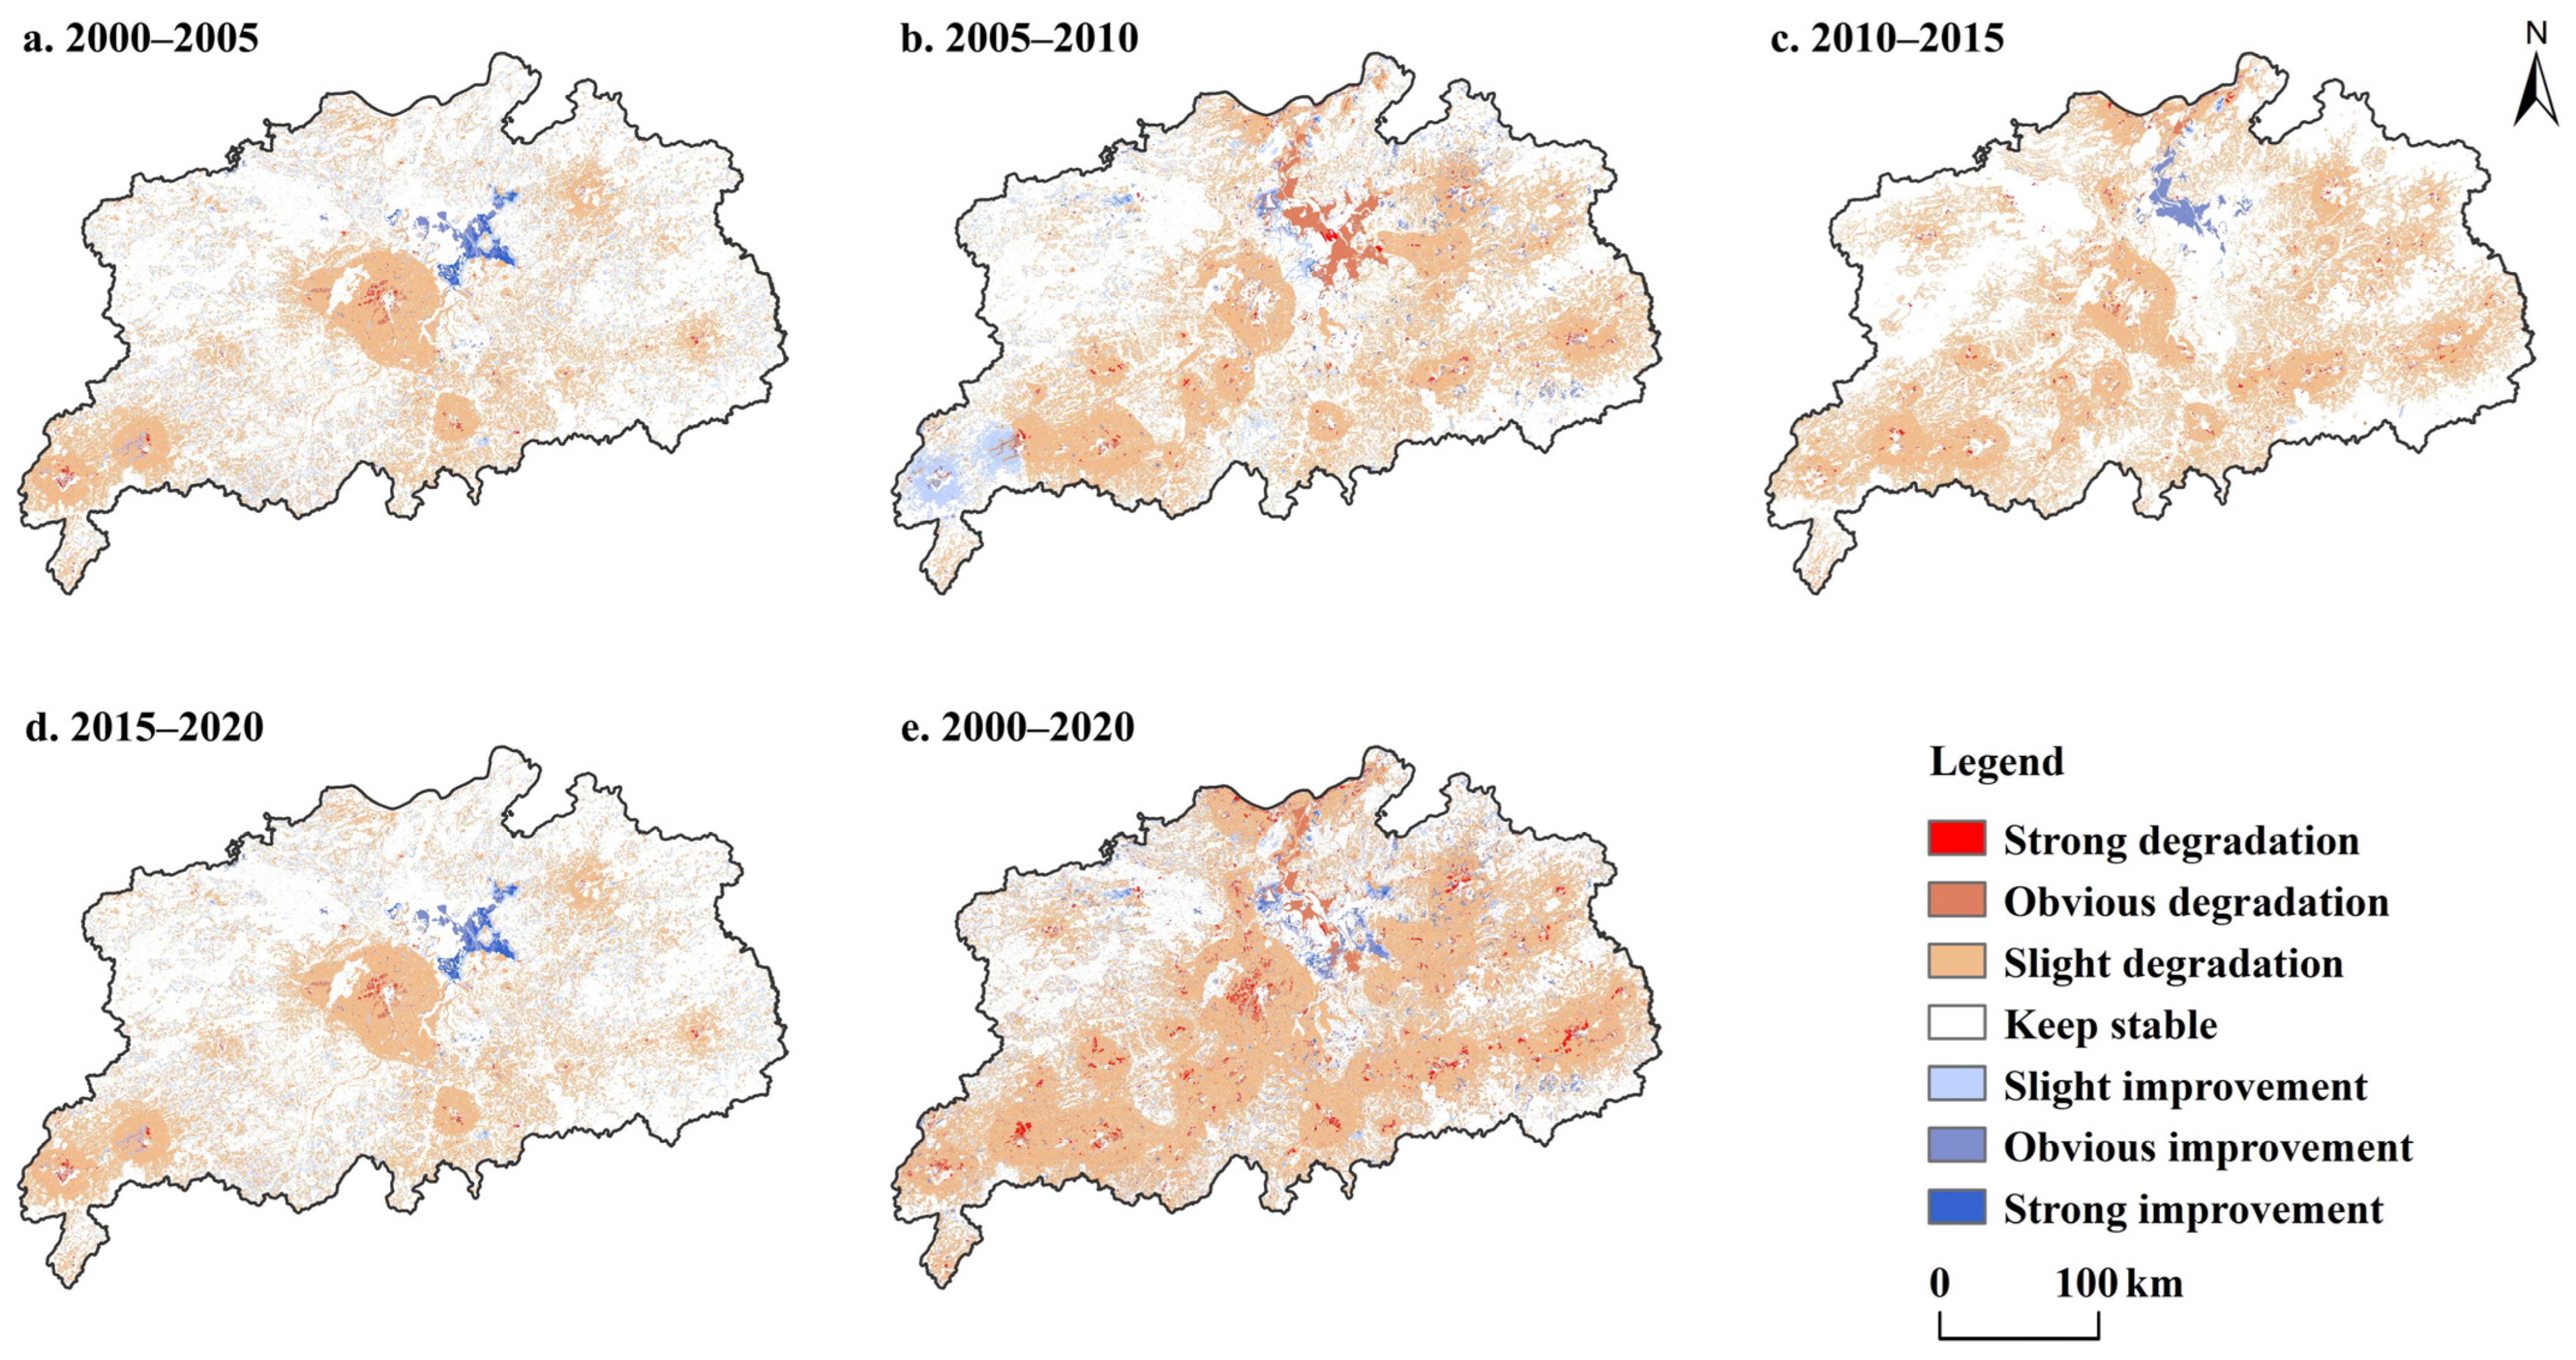
4.2. Spatial and Temporal Dynamics of HQ
4.3. Prediction of HQ
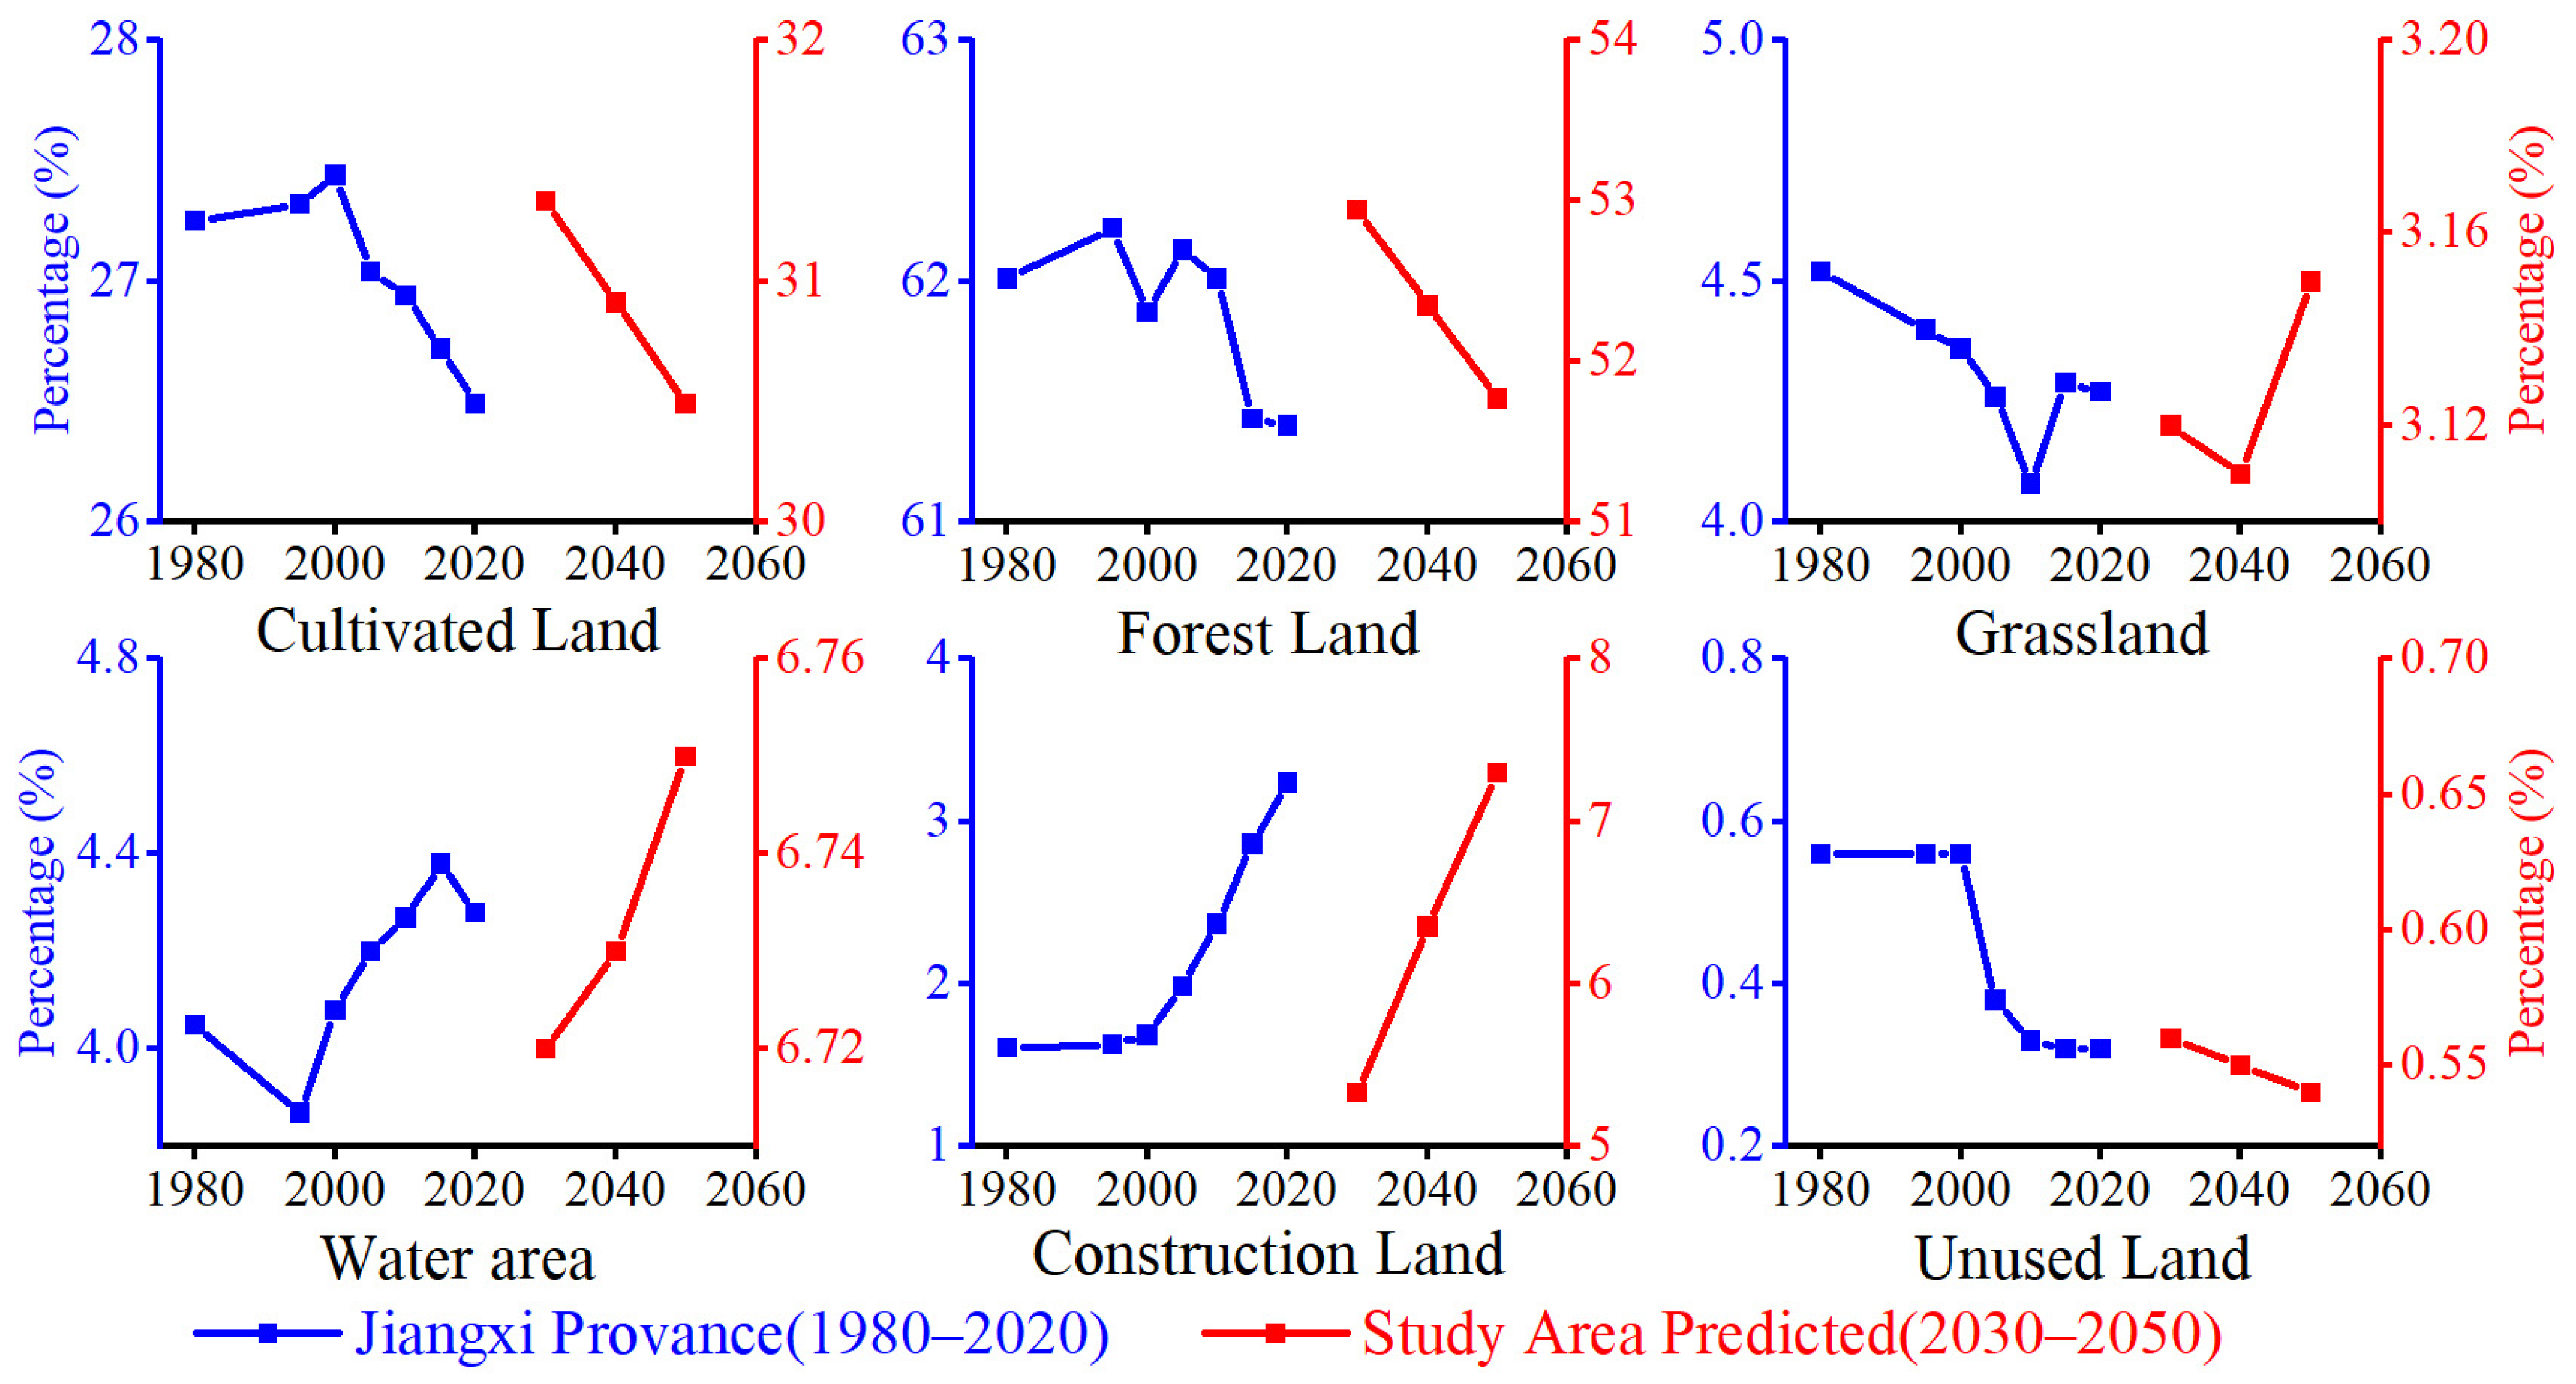
4.3.1. Prediction of LU
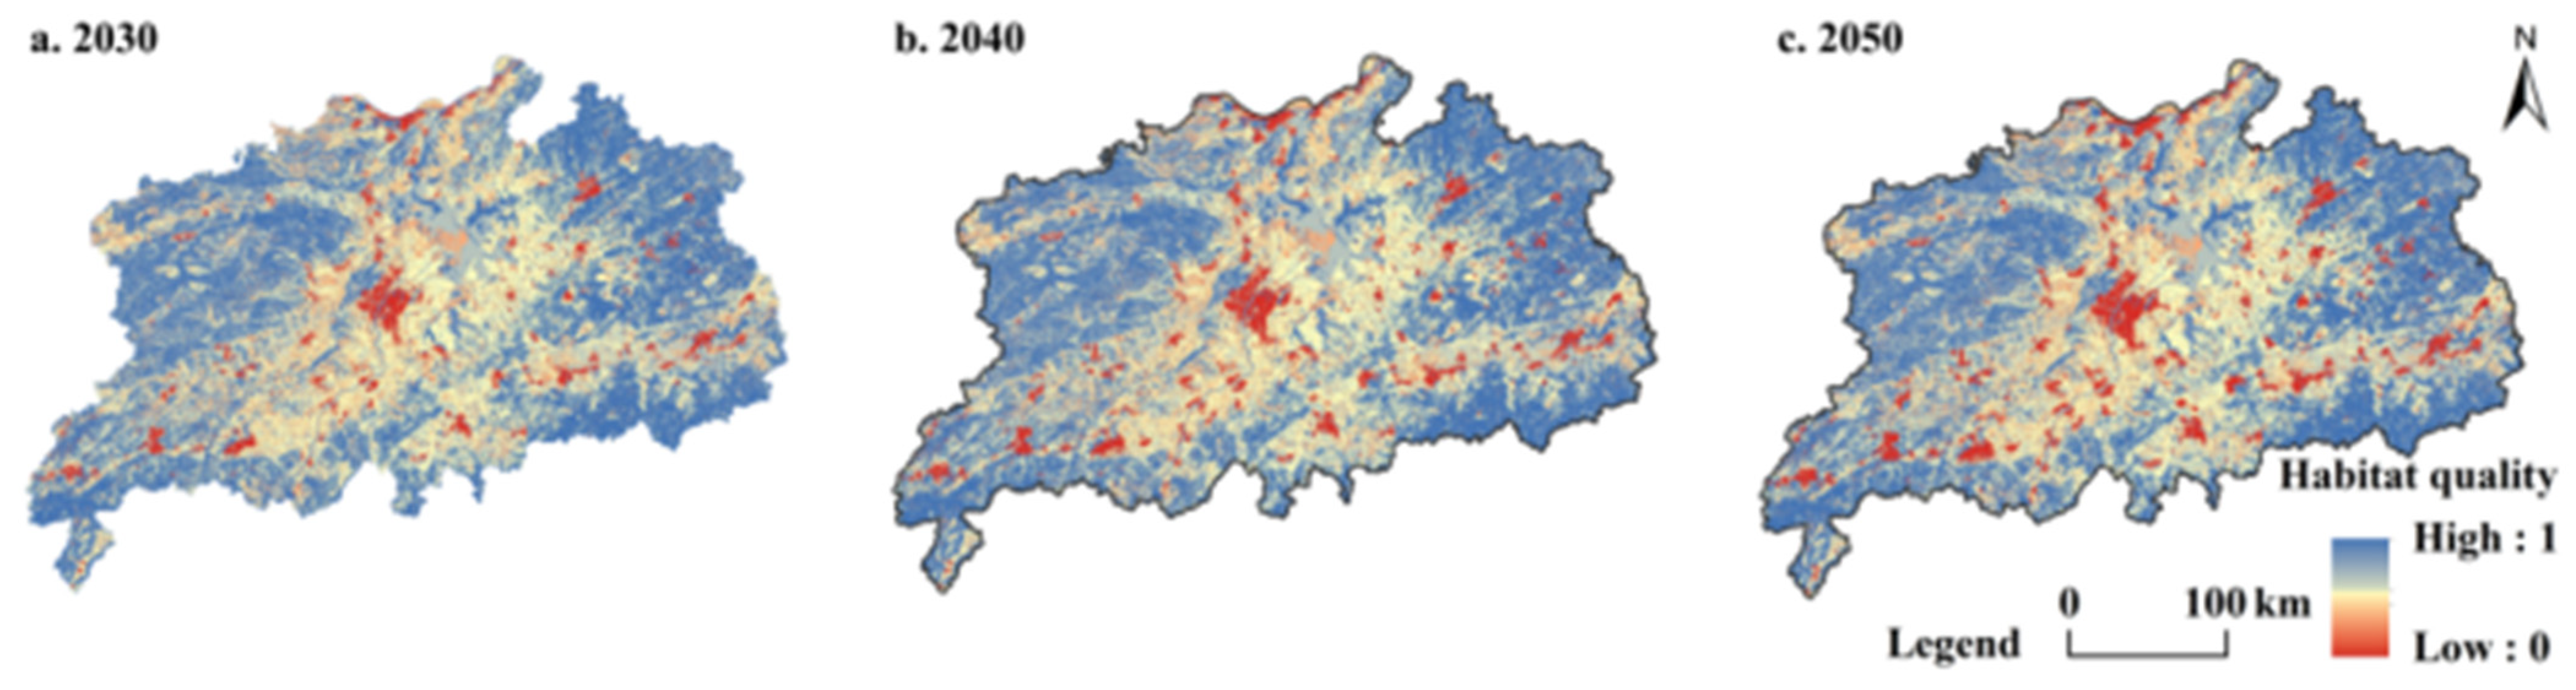
4.3.2. HQ Prediction Based on PLUS and InVEST
5. Discussion
6. Conclusions
Author Contributions
Funding
Institutional Review Board Statement
Informed Consent Statement
Data Availability Statement
Conflicts of Interest
References
- Qin, B.; Gao, G.; Zhu, G.; Zhang, Y.; Song, Y.; Tang, X.; Xu, H.; Deng, J. Lake eutrophication and its ecosystem response. Chin. Sci. Bull. 2013, 58, 961–970. [Google Scholar] [CrossRef]
- Wu, C.; Lin, Y.; Chiang, L.; Huang, T. Assessing highway’s impacts on landscape patterns and ecosystem services: A case study in Puli Township, Taiwan. Landsc. Urban Plan. 2014, 128, 60–71. [Google Scholar] [CrossRef]
- Gibbes, C.; Havlick, D.G.; Robb, J.R. Land use and land cover in a transitioning militarized landscape. J. Land Use Sci. 2017, 12, 182–196. [Google Scholar] [CrossRef]
- Feng, Y.; Zhang, W.; Yu, J.; Zhou, R. Optimization of land-use pattern based on suitability and trade-offs between land development and protection: A case study of the Hohhot-Baotou-Ordos (HBO) area in Inner Mongolia, China. J. Clean. Prod. 2024, 466, 142796. [Google Scholar] [CrossRef]
- De Rosa, M.; Vestergaard Odgaard, M.; Staunstrup, J.K.; Trydeman Knudsen, M.; Hermansen, J.E. Identifying land use and land-use changes (LULUC): A global LULUC matrix. Environ. Sci. Technol. 2017, 51, 7954–7962. [Google Scholar] [CrossRef]
- Gomes, E.; Abrantes, P.; Banos, A.; Rocha, J. Modelling future land use scenarios based on farmers’ intentions and a cellular automata approach. Land Use Policy 2019, 85, 142–154. [Google Scholar] [CrossRef]
- Brown, G. The relationship between social values for ecosystem services and global land cover: An empirical analysis. Ecosyst. Serv. 2013, 5, 58–68. [Google Scholar] [CrossRef]
- Sardar, P.; Samadder, S.R. Understanding the dynamics of landscape of greater Sundarban area using multi-layer perceptron Markov chain and landscape statistics approach. Ecol. Indic. 2021, 121, 106914. [Google Scholar] [CrossRef]
- Akhtar, M.; Zhao, Y.; Gao, G.; Gulzar, Q.; Hussain, A.; Samie, A. Assessment of ecosystem services value in response to prevailing and future land use/cover changes in Lahore, Pakistan. Reg. Sustain. 2020, 1, 37–47. [Google Scholar] [CrossRef]
- Cox, A.B.; Taylor, N.T.; Rebein, M.A.; Song, M.; Moran, M.D.; Mcclung, M.R. Land use changes from unconventional gas development in public lands of the Fayetteville Shale. Nat. Areas J. 2017, 37, 233–239. [Google Scholar] [CrossRef]
- Vergílio, M.; Fjøsne, K.; Nistora, A.; Calado, H. Carbon stocks and biodiversity conservation on a small island: Pico (the Azores, Portugal). Land Use Policy 2016, 58, 196–207. [Google Scholar] [CrossRef]
- Tao, J.; Fu, M.; Sun, J.; Zheng, X.; Zhang, J.; Zhang, D. Multifunctional assessment and zoning of crop production system based on set pair analysis-A comparative study of 31 provincial regions in mainland China. Commun. Nonlinear Sci. Numer. Simul. 2014, 19, 1400–1416. [Google Scholar] [CrossRef]
- Wang, J.; Liu, H.; Li, Y.; Zhang, H. Habitat quality of overwintering, red-crowned cranes based on ecological niche modeling. Arab. J. Geosci. 2019, 12, 750. [Google Scholar] [CrossRef]
- Upadhaya, S.; Dwivedi, P. Conversion of forestlands to blueberries: Assessing implications for habitat quality in Alabaha river watershed in Southeastern Georgia, United States. Land Use Policy 2019, 89, 104229. [Google Scholar] [CrossRef]
- Kviberg, K.; Craig, J. Woodhill Forest: A candidate for ecosystem management. J. R. Soc. N. Z. 2006, 36, 129–141. [Google Scholar] [CrossRef]
- Vollering, J.; Halvorsen, R.; Mazzoni, S. The MIAmaxent R package: Variable transformation and model selection for species distribution models. Ecol. Evol. 2019, 9, 12051–12068. [Google Scholar] [CrossRef] [PubMed]
- Degife, A.; Worku, H.; Gizaw, S.; Legesse, A. Land use land cover dynamics, its drivers and environmental implications in Lake Hawassa Watershed of Ethiopia. Remote Sens. Appl. Soc. Environ. 2019, 14, 178–190. [Google Scholar] [CrossRef]
- Sherrouse, B.C.; Semmens, D.J.; Clement, J.M. An application of social values for ecosystem services (SolVES) to three national forests in Colorado and Wyoming. Ecol. Indic. 2014, 36, 68–79. [Google Scholar] [CrossRef]
- Lin, Y.; Zhang, X.; Zhu, H.; Li, R. Spatiotemporal evolution and mechanisms of habitat quality in nature reserve land: A case study of 18 nature reserves in Hubei province. Land 2024, 13, 363. [Google Scholar] [CrossRef]
- Masayi, N.; Tsingalia, M.; Omondi, P. Land use Changes and Impacts on Livelihoods of the Communities Adjacent to Mt Elgon Forest Ecosystem. J. Geogr. Environ. Earth Sci. Int. 2020, 24, 1–12. [Google Scholar] [CrossRef]
- Twisa, S.; Kazumba, S.; Kurian, M.; Buchroithner, M.F. Evaluating and predicting the effects of land use changes on hydrology in Wami river basin, Tanzania. Hydrology 2020, 7, 17. [Google Scholar] [CrossRef]
- Ureta, J.C.; Clay, L.; Motallebi, M.; Ureta, J. Quantifying the landscape’s ecological benefits-an analysis of the effect of land cover change on ecosystem services. Land 2020, 10, 21. [Google Scholar] [CrossRef]
- Lovell, S.T.; Mendez, V.E.; Erickson, D.L.; Nathan, C.; Desantis, S.R. Extent, pattern, and multifunctionality of treed habitats on farms in Vermont, USA. Agrofor. Syst. 2010, 80, 153–171. [Google Scholar] [CrossRef]
- Xue, M.; Ma, S. Optimized land-use scheme based on ecosystem service value: Case study of Taiyuan, China. J. Urban Plan. Dev. 2018, 144, 4018016. [Google Scholar] [CrossRef]
- Rahnama, M.R. Simulation of land use land cover change in Melbourne metropolitan area from 2014 to 2030: Using multilayer perceptron neural networks and Markov chain model. Aust. Plan. 2021, 57, 36–49. [Google Scholar] [CrossRef]
- Liang, X.; Guan, Q.; Clarke, K.C.; Chen, G.; Guo, S.; Yao, Y. Mixed-cell cellular automata: A new approach for simulating the spatio-temporal dynamics of mixed land use structures. Landsc. Urban Plan. 2021, 205, 103960. [Google Scholar] [CrossRef]
- Bhagabati, N.K.; Ricketts, T.; Sulistyawan, T.B.S.; Conte, M.; Ennaanay, D.; Hadian, O.; Mckenzie, E.; Olwero, N.; Rosenthal, A.; Tallis, H. Ecosystem services reinforce Sumatran tiger conservation in land use plans. Biol. Conserv. 2014, 169, 147–156. [Google Scholar] [CrossRef]
- Di Febbraro, M.; Sallustio, L.; Vizzarri, M.; De Rosa, D.; De Lisio, L.; Loy, A.; Eichelberger, B.A.; Marchetti, M. Expert-based and correlative models to map habitat quality: Which gives better support to conservation planning? Glob. Ecol. Conserv. 2018, 16, e513. [Google Scholar] [CrossRef]
- Kim, T.; Song, C.; Lee, W.; Kim, M.; Lim, C.; Jeon, S.W.; Kim, J. Habitat quality valuation using invest model in Jeju Island. J. Korean Soc. Environ. Restor. Technol. 2015, 18, 1–11. [Google Scholar] [CrossRef]
- Berta Aneseyee, A.; Noszczyk, T.; Soromessa, T.; Elias, E. The invest habitat quality model associated with land use/cover changes: A qualitative case study of the Winike Watershed in the Omo-Gibe Basin, Southwest Ethiopia. Remote Sens. 2020, 12, 1103. [Google Scholar] [CrossRef]
- Ajeeb, R.; Aburas, M.M.; Baba, F.; Ali, A.; Alazaiza, M.Y. The prediction of urban growth trends and patterns using spatio-temporal CA-MC model in Seremban basin. In IOP Conference Series: Earth and Environmental Science, Proceedings of the 10th IGRSM International Conference and Exhibition on Geospatial & Remote Sensing, Kuala Lumpur, Malaysia, 20–21 October 2020; IOP Publishing: Bristol, UK, 2020. [Google Scholar]
- Kim, S.; Lim, H.; Park, G.; Park, M.; Kwon, H. Assessment of future climate change impact on dam inflow using slurp hydrologic model and CA-Markov technique. Korean J. Remote Sens. 2008, 24, 25–33. [Google Scholar]
- Leh, M.D.; Matlock, M.D.; Cummings, E.C.; Nalley, L.L. Quantifying and mapping multiple ecosystem services change in West Africa. Agric. Ecosyst. Environ. 2013, 165, 6–18. [Google Scholar] [CrossRef]
- Rashmi, M.K.; Lele, N. Spatial modeling and validation of forest cover change in Kanakapura region using GEOMOD. J. Indian Soc. Remote Sens. 2010, 38, 45–54. [Google Scholar] [CrossRef]
- Liang, X.; Liu, X.; Li, X.; Chen, Y.; Tian, H.; Yao, Y. Delineating multi-scenario urban growth boundaries with a CA-based FLUS model and morphological method. Landsc. Urban Plan. 2018, 177, 47–63. [Google Scholar] [CrossRef]
- Liu, X.; Wang, X.; Chen, K.; Li, D. Simulation and prediction of multi-scenario evolution of ecological space based on FLUS model: A case study of the Yangtze River Economic Belt, China. J. Geogr. Sci. 2023, 33, 373–391. [Google Scholar] [CrossRef]
- Çağlıyan, A.; Dağlı, D. Monitoring land use land cover changes and modelling of urban growth using a future land use simulation model (FLUS) in Diyarbakır, Turkey. Sustainability 2022, 14, 9180. [Google Scholar] [CrossRef]
- Dumitrașcu, M.; Kucsicsa, G.; Dumitrică, C.; Popovici, E.; Vrînceanu, A.; Mitrică, B.; Mocanu, I.; Șerban, P. Estimation of future changes in aboveground forest carbon stock in Romania. A prediction based on forest-cover pattern scenario. Forests 2020, 11, 914. [Google Scholar] [CrossRef]
- Zhao, B.; Li, S.; Liu, Z. Multi-scenario simulation and prediction of regional habitat quality based on a system dynamic and patch-generating land-use simulation coupling model-a case study of Jilin Province. Sustainability 2022, 14, 5303. [Google Scholar] [CrossRef]
- Sun, X.; Crittenden, J.C.; Li, F.; Lu, Z.; Dou, X. Urban expansion simulation and the spatio-temporal changes of ecosystem services, a case study in Atlanta Metropolitan area, USA. Sci. Total Environ. 2018, 622, 974–987. [Google Scholar] [CrossRef]
- Qiang, D.; Ning, W.; Lei, C. Forecasting China’s per capita carbon emissions under a new three-step economic development strategy. J. Resour. Ecol. 2015, 6, 318–323. [Google Scholar] [CrossRef]
- Zhao, N.; Liu, Y.; Cao, G.; Samson, E.L.; Zhang, J. Forecasting China’s GDP at the pixel level using nighttime lights time series and population images. GISci. Remote Sens. 2017, 54, 407–425. [Google Scholar] [CrossRef]
- Zong, S.; Xu, S.; Huang, J.; Ren, Y.; Song, C. Distribution patterns and driving mechanisms of land use spatial conflicts: Empirical analysis from counties in China. Habitat Int. 2025, 156, 103268. [Google Scholar] [CrossRef]
- Zhang, Y.; Zhan, Q. Ecological quality assessment of ecological economic zone in Poyang Lake based on remote sensing ecological index. Beijing Surv. Mapp. 2024, 38, 1166–1171. (In Chinese) [Google Scholar]
- Liu, H.; Zheng, L.; Huang, Y.; Wang, M. Spatial and temporal dynamics and its driving factors of vegetation cover before and after the establishment of Poyang Lake Eco-economic Zone. Chin. J. Ecol. 2024, 38, 1166–1171. (In Chinese) [Google Scholar]
- Chen, Y.; Guo, F.; Wang, J.; Cai, W.; Wang, C.; Wang, K. Provincial and gridded population projection for China under shared socioeconomic pathways from 2010 to 2100. Sci. Data 2020, 7, 83. [Google Scholar] [CrossRef]
- Sun, C.; Bao, Y.; Vandansambuu, B.; Bao, Y. Simulation and prediction of land use/cover changes based on CLUE-S and CA-Markov models: A case study of a typical pastoral area in Mongolia. Sustainability 2022, 14, 15707. [Google Scholar] [CrossRef]
- Xie, H.; Zou, J.; Peng, X. Spatial-temporal difference analysis of cultivated land use intensity based on emergy in Poyang Lake Eco-economic Zone. Acta Geogr. Sin. 2012, 67, 889–902. (In Chinese) [Google Scholar]
- Huang, M.; Gong, D.; Zhang, L.; Lin, H.; Chen, Y.; Zhu, D.; Xiao, C.; Altan, O. Spatiotemporal dynamics and forecasting of ecological security pattern under the consideration of protecting habitat: A case study of the Poyang Lake ecoregion. Int. J. Digit. Earth 2024, 17, 2376277. [Google Scholar] [CrossRef]
- Tian, Y.; Xu, D.; Song, J.; Guo, J.; You, X.; Jiang, Y. Impacts of land use changes on ecosystem services at different elevations in an ecological function area, northern China. Ecol. Indic. 2022, 140, 109003. [Google Scholar] [CrossRef]
- Chen, W.; Zeng, J.; Li, N. Change in land-use structure due to urbanisation in China. J. Clean. Prod. 2021, 321, 128986. [Google Scholar] [CrossRef]
- Can, H.; Min, S.; Anlu, Z. Dynamics of the eco-environmental quality in response to land use changes in rapidly urbanizing areas: A case study of Wuhan, China from 2000 to 2018. J. Geogr. Sci. 2023, 33, 245–265. [Google Scholar]
- Feng, X.; Li, Y.; Wang, X.; Yang, J.; Yu, E.; Wang, S.; Wu, N.; Xiao, F. Impacts of land use transitions on ecosystem services: A research framework coupled with structure, function, and dynamics. Sci. Total Environ. 2023, 901, 166366. [Google Scholar] [CrossRef] [PubMed]
- Zheng, L.; Wang, Y.; Li, J. Quantifying the spatial impact of landscape fragmentation on habitat quality: A multi-temporal dimensional comparison between the Yangtze River Economic Belt and Yellow River Basin of China. Land Use Policy 2023, 125, 106463. [Google Scholar] [CrossRef]
- Deng, C.; Liu, J.; Liu, Y.; Li, Z.; Nie, X.; Hu, X.; Wang, L.; Zhang, Y.; Zhang, G.; Zhu, D.; et al. Spatiotemporal dislocation of urbanization and ecological construction increased the ecosystem service supply and demand imbalance. J. Environ. Manag. 2021, 288, 112478. [Google Scholar] [CrossRef]
- Song, W.; Pijanowski, B.C.; Tayyebi, A. Urban expansion and its consumption of high-quality farmland in Beijing, China. Ecol. Indic. 2015, 54, 60–70. [Google Scholar] [CrossRef]
- Zhang, X.; Song, W.; Lang, Y.; Feng, X.; Yuan, Q.; Wang, J. Land use changes in the coastal zone of China’s Hebei Province and the corresponding impacts on habitat quality. Land Use Policy 2020, 99, 104957. [Google Scholar] [CrossRef]
- Ren, H.; Gao, L.; Hui, D.; Guo, Q. Converting farmlands to forests or forests to farmlands? Biol. Divers. 2024, 28, 9. [Google Scholar] [CrossRef]
- Yao, S.; Chen, C.; Chen, Q.; Zhang, J.; He, M. Combining process-based model and machine learning to predict hydrological regimes in floodplain wetlands under climate change. J. Hydrol. 2023, 626, 130193. [Google Scholar] [CrossRef]
- Yao, S.; Chen, C.; Chen, Q.; Zhang, J.; Li, Y. An integrated hydrodynamic and multicriteria evaluation Cellular Automata–Markov model to assess the effects of a water resource project on waterbird habitat in wetlands. J. Hydrol. 2022, 607, 127561. [Google Scholar] [CrossRef]
- Wang, H. Regional assessment of human-caused ecological risk in the Poyang Lake Eco-economic Zone using production–living–ecology analysis. PLoS ONE 2021, 16, e0246749. [Google Scholar] [CrossRef]
- Tian, B.; Gao, P.; Mu, X.; Zhao, G. Water area variation and river–lake interactions in the Poyang Lake from 1977–2021. Remote Sens. 2023, 15, 600. [Google Scholar] [CrossRef]
- Jiang, H.; Sun, Z.; Guo, H.; Weng, Q.; Du, W.; Xing, Q.; Cai, G. An assessment of urbanization sustainability in China between 1990 and 2015 using land use efficiency indicators. npj Urban Sustain. 2021, 1, 34. [Google Scholar] [CrossRef]
- Zheng, H.; Li, H. Spatial–temporal evolution characteristics of land use and habitat quality in Shandong Province, China. Sci. Rep. 2022, 12, 15422. [Google Scholar] [CrossRef]
- Wu, J.; Luo, J.; Zhang, H.; Qin, S.; Yu, M. Projections of land use change and habitat quality assessment by coupling climate change and development patterns. Sci. Total Environ. 2022, 847, 157491. [Google Scholar] [CrossRef]
- Hasan, S.S.; Zhen, L.; Miah, M.G.; Ahamed, T.; Samie, A. Impact of land use change on ecosystem services: A review. Environ. Dev. 2020, 34, 100527. [Google Scholar] [CrossRef]
- Ren, Q.; He, C.; Huang, Q.; Shi, P.; Zhang, D.; Güneralp, B. Impacts of urban expansion on natural habitats in global drylands. Nat. Sustain. 2022, 5, 869–878. [Google Scholar] [CrossRef]
- Lu, Y.; Liu, R. An empirical analysis of Jiangxi province’s financial development, economic growth, and environmental pollution. Wirel. Commun. Mob. Comput. 2022, 2022, 3327318. [Google Scholar] [CrossRef]
- Tian, Q.; Guo, L.; Zheng, L. Urbanization and rural livelihoods: A case study from Jiangxi province, China. J. Rural Stud. 2016, 47, 577–587. [Google Scholar] [CrossRef]
- Wang, J.; Wu, Y.; Gou, A. Habitat quality evolution characteristics and multi-scenario prediction in Shenzhen based on PLUS and InVEST models. Front. Environ. Sci. 2023, 11, 1146347. [Google Scholar] [CrossRef]
- Nie, X.; Li, X.; Lyu, C.; Su, Y.; Wang, H. Can ecological compensation based on the transfer of development rights (TDR) improve ecosystem service value? A multi-scenario simulation. Land Use Policy 2024, 138, 107024. [Google Scholar] [CrossRef]
- Huang, X.; Liu, Y.; Stouffs, R. Human-earth system dynamics in China’s land use pattern transformation amidst climate fluctuations and human activities. Sci. Total Environ. 2024, 954, 176013. [Google Scholar] [CrossRef] [PubMed]
- Zhang, X.; Wan, W.; Fan, H.; Dong, X.; Lv, T. Temporal and spatial responses of landscape patterns to habitat quality changes in the Poyang Lake region, China. J. Nat. Conserv. 2024, 77, 126546. [Google Scholar] [CrossRef]
- Gu, G.; Wu, B.; Lu, S.; Zhang, W.; Tian, Y.; Lu, R.; Feng, X.; Liao, W. Differential evolution of territorial space and effects on ecological environment quality in China’s border regions. J. Geogr. Sci. 2024, 34, 1109–1127. [Google Scholar] [CrossRef]
- Girardet, H. People and nature in an urban world. One Earth 2020, 2, 135–137. [Google Scholar] [CrossRef]
- Liang, X.; Guan, Q.; Clarke, K.C.; Liu, S.; Wang, B.; Yao, Y. Understanding the drivers of sustainable land expansion using a patch-generating land use simulation (PLUS) model: A case study in Wuhan, China. Comput. Environ. Urban Syst. 2021, 85, 101569. [Google Scholar] [CrossRef]
- Wang, B.; Oguchi, T.; Liang, X. Evaluating future habitat quality responding to land use change under different city compaction scenarios in Southern China. Cities 2023, 140, 104410. [Google Scholar] [CrossRef]
- Tran, V.N.; Ivanov, V.Y.; Huang, W.; Murphy, K.; Daneshvar, F.; Bednar, J.H.; Alexander, G.A.; Kim, J.; Wright, D.B. Connectivity in urbanscapes can cause unintended flood impacts from stormwater systems. Nat. Cities 2024, 1, 654–664. [Google Scholar] [CrossRef]
- Zhao, H.; Xu, X.; Tang, J.; Wang, Z.; Miao, C. Spatial pattern evolution and prediction scenario of habitat quality in typical fragile ecological region, China: A case study of the Yellow River floodplain area. Heliyon 2023, 9, e14430. [Google Scholar] [CrossRef]
- Tang, J.; Zhou, L.; Dang, X.; Hu, F.; Yuan, B.; Yuan, Z. Impacts and predictions of urban expansion on habitat quality in the densely populated areas: A case study of the Yellow River Basin, China. Ecol. Indic. 2023, 151, 110320. [Google Scholar] [CrossRef]


| Threat Factors | Max Distance of Influence (km) | Weight | Decay Type |
|---|---|---|---|
| Paddy field | 1.0 | 0.6 | Linear decay |
| Dry land | 1.0 | 0.6 | Linear decay |
| Urban land | 8.0 | 1.0 | Exponential decay |
| Rural settlements | 6.0 | 0.8 | Exponential decay |
| Other construction land | 5.0 | 0.6 | Exponential decay |
| Unused land | 3.0 | 0.5 | Linear decay |
| Land Use Types | Habitat | Paddy Field | Dry Land | Urban Land | Rural Settlements | Other Construction Land | Unused Land | |
|---|---|---|---|---|---|---|---|---|
| Cultivated Land | Paddy field | 0.5 | 0.0 | 0.0 | 0.8 | 0.7 | 0.6 | 0.4 |
| Dry land | 0.3 | 0.0 | 0.0 | 0.8 | 0.7 | 0.6 | 0.4 | |
| Forest land | Forest | 1.0 | 0.6 | 0.7 | 0.9 | 0.8 | 0.8 | 0.5 |
| Shrub | 0.8 | 0.6 | 0.7 | 0.8 | 0.6 | 0.7 | 0.5 | |
| Sparse woodland | 0.7 | 0.5 | 0.6 | 0.7 | 0.7 | 0.8 | 0.4 | |
| Other woodland | 0.6 | 0.5 | 0.6 | 0.7 | 0.7 | 0.8 | 0.4 | |
| Grassland | High covered grassland | 0.7 | 0.6 | 0.7 | 0.9 | 0.8 | 0.7 | 0.6 |
| Medium covered grassland | 0.6 | 0.5 | 0.6 | 0.9 | 0.8 | 0.7 | 0.6 | |
| Low covered grassland | 0.5 | 0.5 | 0.6 | 0.9 | 0.8 | 0.7 | 0.6 | |
| Water area | River | 0.9 | 0.4 | 0.5 | 0.9 | 0.8 | 0.7 | 0.3 |
| Lake | 1.0 | 0.4 | 0.5 | 0.9 | 0.8 | 0.6 | 0.3 | |
| Reservoir | 0.6 | 0.4 | 0.5 | 0.9 | 0.8 | 0.6 | 0.3 | |
| Beach land | 0.7 | 0.55 | 0.6 | 0.7 | 0.6 | 0.7 | 0.3 | |
| Construction Land | Urban land | 0.0 | 0.0 | 0.0 | 0.0 | 0.0 | 0.0 | 0.0 |
| Rural settlements | 0.0 | 0.0 | 0.0 | 0.0 | 0.0 | 0.0 | 0.0 | |
| Other construction land | 0.0 | 0.0 | 0.0 | 0.0 | 0.0 | 0.0 | 0.0 | |
| Unused land | Unused land | 0.3 | 0.3 | 0.4 | 0.5 | 0.4 | 0.5 | 0.0 |
| Land Use Types | Realm Weight | Land-Use Types | Realm Weight | Land-Use Types | Realm Weight |
|---|---|---|---|---|---|
| Paddy field | 1 | Dry land | 0.4478 | Forest | 0.8773 |
| Shrub | 0.3381 | Sparse woodland | 0.4346 | Other woodland | 0.0348 |
| High covered grassland | 0.1646 | Medium covered grassland | 0.0572 | Low covered grassland | 0 |
| River | 0.0682 | Lake | 0.2177 | Reservoir | 0.1774 |
| Beach land | 0.1701 | Other construction land | 0.1145 | Rural settlements | 0.1757 |
| Urban land | 0.7889 | Unused land | 0.0203 |
| LU Types | 2000 | 2005 | 2010 | 2015 | 2020 | ||||||
|---|---|---|---|---|---|---|---|---|---|---|---|
| Area | Pct | Area | Pct | Area | Pct | Area | Pct | Area | Pct | ||
| Cultivated Land | Paddy field | 22,846.9 | 24.8 | 22,583.9 | 24.5 | 22,554.7 | 24.5 | 22,338.1 | 24.2 | 22,167.0 | 24.1 |
| Dry land | 7337.2 | 8.0 | 7314.1 | 7.9 | 7245.3 | 7.9 | 7137.4 | 7.7 | 7063.6 | 7.7 | |
| Forest land | Forest | 33,307.9 | 36.1 | 33,330.1 | 36.2 | 34,226.6 | 37.1 | 33,993.1 | 36.9 | 33,918.5 | 36.8 |
| Shrub land | 6876.7 | 7.5 | 6825.9 | 7.4 | 6444.7 | 7.0 | 6421.3 | 7.0 | 6413.7 | 7.0 | |
| Sparse woodland | 9496.1 | 10.3 | 9442.1 | 10.2 | 8861.0 | 9.6 | 8738.9 | 9.5 | 8666.6 | 9.4 | |
| Other Forest Land | 365.9 | 0.4 | 396.4 | 0.4 | 364.8 | 0.4 | 378.2 | 0.4 | 376.3 | 0.4 | |
| Grassland | High covered grassland | 1716.2 | 1.9 | 1654.1 | 1.8 | 1523.0 | 1.7 | 1604.1 | 1.7 | 1602.3 | 1.7 |
| Medium covered grassland | 1381.9 | 1.5 | 1402.1 | 1.5 | 1275.2 | 1.4 | 1260.5 | 1.4 | 1248.9 | 1.4 | |
| Low covered grassland | 27.3 | 0.0 | 28.4 | 0.0 | 27.3 | 0.0 | 27.5 | 0.0 | 27.2 | 0.0 | |
| Water area | River | 988.5 | 1.1 | 907.7 | 1.0 | 1183.7 | 1.3 | 1183.6 | 1.3 | 1184.7 | 1.3 |
| Lake | 1947.7 | 2.1 | 2824.5 | 3.1 | 1080.9 | 1.2 | 1772.5 | 1.9 | 1188.2 | 1.3 | |
| Reservoir | 1392.7 | 1.5 | 1290.2 | 1.4 | 1316.9 | 1.4 | 1385.5 | 1.5 | 1404.8 | 1.5 | |
| Beach land | 1547.4 | 1.7 | 1055.6 | 1.2 | 2576.2 | 2.8 | 1840.5 | 2.0 | 2414.3 | 2.6 | |
| Construction Land | Urban land | 450.7 | 0.5 | 704.5 | 0.8 | 914.8 | 1.0 | 988.4 | 1.1 | 1023.6 | 1.1 |
| Rural settlements | 1440.7 | 1.6 | 1569.7 | 1.7 | 1624.1 | 1.8 | 1622.1 | 1.8 | 1625.5 | 1.8 | |
| Other construction land | 129.5 | 0.1 | 224.2 | 0.2 | 411.6 | 0.5 | 953.1 | 1.0 | 1316.2 | 1.4 | |
| Unused land | Unused land | 920.1 | 1.0 | 622.9 | 0.7 | 546.0 | 0.6 | 531.7 | 0.6 | 531.8 | 0.6 |
| HQ Changes | 2000–2005 | 2005–2010 | 2010–2015 | 2015–2020 | 2000–2020 | |||||
|---|---|---|---|---|---|---|---|---|---|---|
| Area | Pct | Area | Pct | Area | Pct | Area | Pct | Area | Pct | |
| Strong degradation | 183.76 | 0.20 | 373.11 | 0.40 | 321.05 | 0.35 | 183.76 | 0.20 | 1131.22 | 1.23 |
| Obvious degradation | 754.63 | 0.82 | 2313.16 | 2.51 | 507.75 | 0.55 | 754.63 | 0.82 | 3784.56 | 4.11 |
| Slight degradation | 23,281.87 | 25.27 | 30,166.68 | 32.74 | 33,543.58 | 36.40 | 23,281.87 | 25.27 | 42,889.95 | 46.55 |
| Keep stable | 61,407.44 | 66.64 | 53,136.41 | 57.66 | 56,269.58 | 61.06 | 61,407.44 | 66.64 | 36,754.01 | 39.89 |
| Slight improvement | 5293.22 | 5.74 | 4759.22 | 5.16 | 712.76 | 0.77 | 5293.22 | 5.74 | 4663.62 | 5.06 |
| Obvious improvement | 863.91 | 0.94 | 1290.09 | 1.40 | 782.68 | 0.85 | 863.91 | 0.94 | 2606.10 | 2.83 |
| Strong improvement | 363.36 | 0.39 | 112.25 | 0.12 | 14.33 | 0.02 | 363.36 | 0.39 | 311.31 | 0.34 |
| HQ Levels | 2030 | 2040 | 2050 | |||
|---|---|---|---|---|---|---|
| Area (km2) | Pct (%) | Area (km2) | Pct (%) | Area (km2) | Pct (%) | |
| Low (0–0.2) | 4910.82 | 5.33 | 5852.22 | 6.35 | 6734.95 | 7.31 |
| Poor (0.2–0.4) | 7447.14 | 8.08 | 7322.49 | 7.95 | 7207.52 | 7.82 |
| Medium (0.4–0.6) | 24,438.07 | 26.52 | 24,162.82 | 26.22 | 23,892.04 | 25.93 |
| Good (0.6–0.8) | 18,267.46 | 19.83 | 18,075.06 | 19.62 | 17,950.73 | 19.48 |
| High (0.8–1.0) | 37,076.16 | 40.24 | 36,725.90 | 39.86 | 36,353.25 | 39.46 |
Disclaimer/Publisher’s Note: The statements, opinions and data contained in all publications are solely those of the individual author(s) and contributor(s) and not of MDPI and/or the editor(s). MDPI and/or the editor(s) disclaim responsibility for any injury to people or property resulting from any ideas, methods, instructions or products referred to in the content. |
© 2025 by the authors. Licensee MDPI, Basel, Switzerland. This article is an open access article distributed under the terms and conditions of the Creative Commons Attribution (CC BY) license (https://creativecommons.org/licenses/by/4.0/).
Share and Cite
Liu, Y.; Zhou, J.; Liu, C.; Liu, N.; Fei, B.; Wang, Q.; Zou, J.; Wu, Q. Spatiotemporal Evolution Characteristics and Prediction of Habitat Quality Changes in the Poyang Lake Region, China. Sustainability 2025, 17, 3708. https://doi.org/10.3390/su17083708
Liu Y, Zhou J, Liu C, Liu N, Fei B, Wang Q, Zou J, Wu Q. Spatiotemporal Evolution Characteristics and Prediction of Habitat Quality Changes in the Poyang Lake Region, China. Sustainability. 2025; 17(8):3708. https://doi.org/10.3390/su17083708
Chicago/Turabian StyleLiu, Yu, Junxin Zhou, Chenggong Liu, Ning Liu, Bingqiang Fei, Qi Wang, Jiaxiu Zou, and Qiong Wu. 2025. "Spatiotemporal Evolution Characteristics and Prediction of Habitat Quality Changes in the Poyang Lake Region, China" Sustainability 17, no. 8: 3708. https://doi.org/10.3390/su17083708
APA StyleLiu, Y., Zhou, J., Liu, C., Liu, N., Fei, B., Wang, Q., Zou, J., & Wu, Q. (2025). Spatiotemporal Evolution Characteristics and Prediction of Habitat Quality Changes in the Poyang Lake Region, China. Sustainability, 17(8), 3708. https://doi.org/10.3390/su17083708