Article

Enhancing Sustainability in Power Systems: A High-Capacity Testing System Based on a Power System

Gansu Electric Apparatus Research Institute, Tianshui 741000, China
*
Author to whom correspondence should be addressed.
Sustainability 2025, 17(8), 3679; https://doi.org/10.3390/su17083679
Submission received: 7 March 2025 / Revised: 2 April 2025 / Accepted: 7 April 2025 / Published: 18 April 2025

Abstract

:
In the context of global sustainability goals and the integration of renewable energy sources, the efficient and reliable performance of medium- and high-voltage power equipment is critical. This paper presents a high-capacity testing system based on power supply, which significantly enhances the sustainability of power systems by addressing the challenges of low testing efficiency, poor reproducibility, and safety hazards in traditional methods. By proposing a standardized test circuit configuration and an automated monitoring and control system, this study aims to improve the efficiency, safety, and consistency of testing, thereby supporting the reliable operation and integration of renewable energy sources into power grids. The system achieves complete automation in test parameter selection, circuit connection, and data acquisition, reducing human intervention and ensuring the accuracy of test data. Through simulations and physical tests, the feasibility and accuracy of the standardized test circuit design method have been verified. These improvements contribute to sustainable development by reducing resource consumption and environmental impact, and enhancing the reliability and stability of power supply. This research provides a technical foundation for the sustainable operation of power systems, supporting global efforts to achieve carbon neutrality and energy transitions.

1. Introduction

In recent years, power systems, as critical infrastructure supporting socio-economic development and global sustainability goals, have experienced rapid growth and profound technological innovations driven by renewable energy integration and smart grid advancements [1,2]. With the global energy structure transitioning toward decarbonization and electricity demand continuously increasing amid climate change mitigation efforts, the scale and complexity of power systems have grown significantly, leading to higher requirements for the performance and reliability of key equipment to enable grid resilience and sustainable energy transitions [3]. As a critical component of power systems, the high-voltage switchgear performs functions such as circuit breaking, circuit making, protection, and control, directly influencing the safe and stable operation of power systems. High-capacity testing stations, as essential facilities for evaluating and validating the performance of the high-voltage switchgear, play an irreplaceable role in ensuring the reliable operation of power systems [4,5]. The global energy structure transition has facilitated the large-scale integration of renewable energy sources, such as wind and solar power, which are classified as clean energy [6]. The advent of smart grid technology has imposed stricter requirements on the performance of high-voltage equipment. The high-voltage switchgear must now feature faster circuit-breaking speeds, higher voltage ratings, stronger arc extinguishing capabilities, and longer service lifespans to meet the demands of smart grids regarding power system reliability and economic efficiency [7]. Additionally, as power systems continue to expand, the operational environment of the high-voltage switchgear becomes increasingly complex, requiring stable performance under harsh conditions such as high voltage, large currents, and strong electromagnetic interference. These factors further underscore the importance of high-capacity testing stations [8].
The ongoing global energy transition, characterized by the large-scale integration of renewable energy sources (e.g., wind and solar power), has imposed stricter demands on grid stability and reliability. Concurrently, the emergence of smart grid technologies has increased system complexity and intelligence, further elevating performance requirements for high-voltage equipment and underscoring the significance of high-capacity testing stations [9,10,11]. High capacity refers to the ability of medium/high-voltage circuit breakers and other equipment to withstand high-voltage and high-current loads, validated through short-circuit testing.
While the construction and operation of high-capacity testing stations have achieved substantial progress globally, challenges persist in high-current testing environments. Current limitations include complex procedures, multi-step operations, and high costs in high-voltage/high-current testing laboratories, which constrain testing efficiency [12,13,14,15]. To address these issues, developing an integrated monitoring and control system for full-process testing is imperative. Such systems could significantly reduce human and material resource inputs, mitigate potential system risks caused by non-standardized workflows, and enhance the operational efficiency of high-capacity testing infrastructure [16,17,18,19].
Reference [20] discusses a high-capacity testing control system. It features intelligent main circuit control, system integration, and user-friendly customer support, which improves test efficiency and service levels. However, efforts are needed to address issues such as security, reliability, and maintainability. Reference [21] proposes the application of a computer-aided analysis system in high-capacity laboratories. It includes functions such as test operation ticket management, test circuit diagram management, simulation calculation, and networking. The establishment of this system ensures the standardization and unity of tests and initially realizes the standardization of test circuits. Reference [22] focuses on high-capacity laboratories using short-circuit generators as power sources. It analyzes the operating conditions of the generator and test requirements, as well as its system composition, and constructs a control system based on S7-300, covering hardware design and configuration, and software design (including main programs, human–machine interfaces, etc.). Practice has proven that this system is flexible, reliable, and highly automated. However, the paper does not discuss high-capacity testing systems based on power system power sources. Reference [23] presents a 550 kV/80 kA test circuit based on a short-circuit generator, which can meet the requirements of multiple test standards, and some of the circuits are more economical and safer. However, it does not fully discuss the secondary control, monitoring, data acquisition, and other systems of the test system. Reference [14] puts forward types of high-capacity testing stations, some key test circuits, and test equipment, and finally analyzes and discusses the principles and techniques of high-capacity short-circuit tests. The content in this article provides a reference and basis for implementing, developing, and researching high-capacity short-circuit-breaking test technologies.
To address challenges in high-capacity testing stations—such as complex testing procedures, insufficient safety, and incomplete secondary control/data acquisition systems—this study makes the following contributions:
  • Testing design and system optimization: It proposes standardized methods for high-capacity testing, ring-network monitoring topologies, and integrated automated workflow solutions to enhance testing efficiency and data reliability, resolving issues of low system integration and inadequate automation. This includes standardized test circuit design methods, ring-network topologies for testing monitoring and control, systematic solutions covering data acquisition, signal monitoring, and control schemes, as well as optimized high-capacity short-circuit testing procedures.
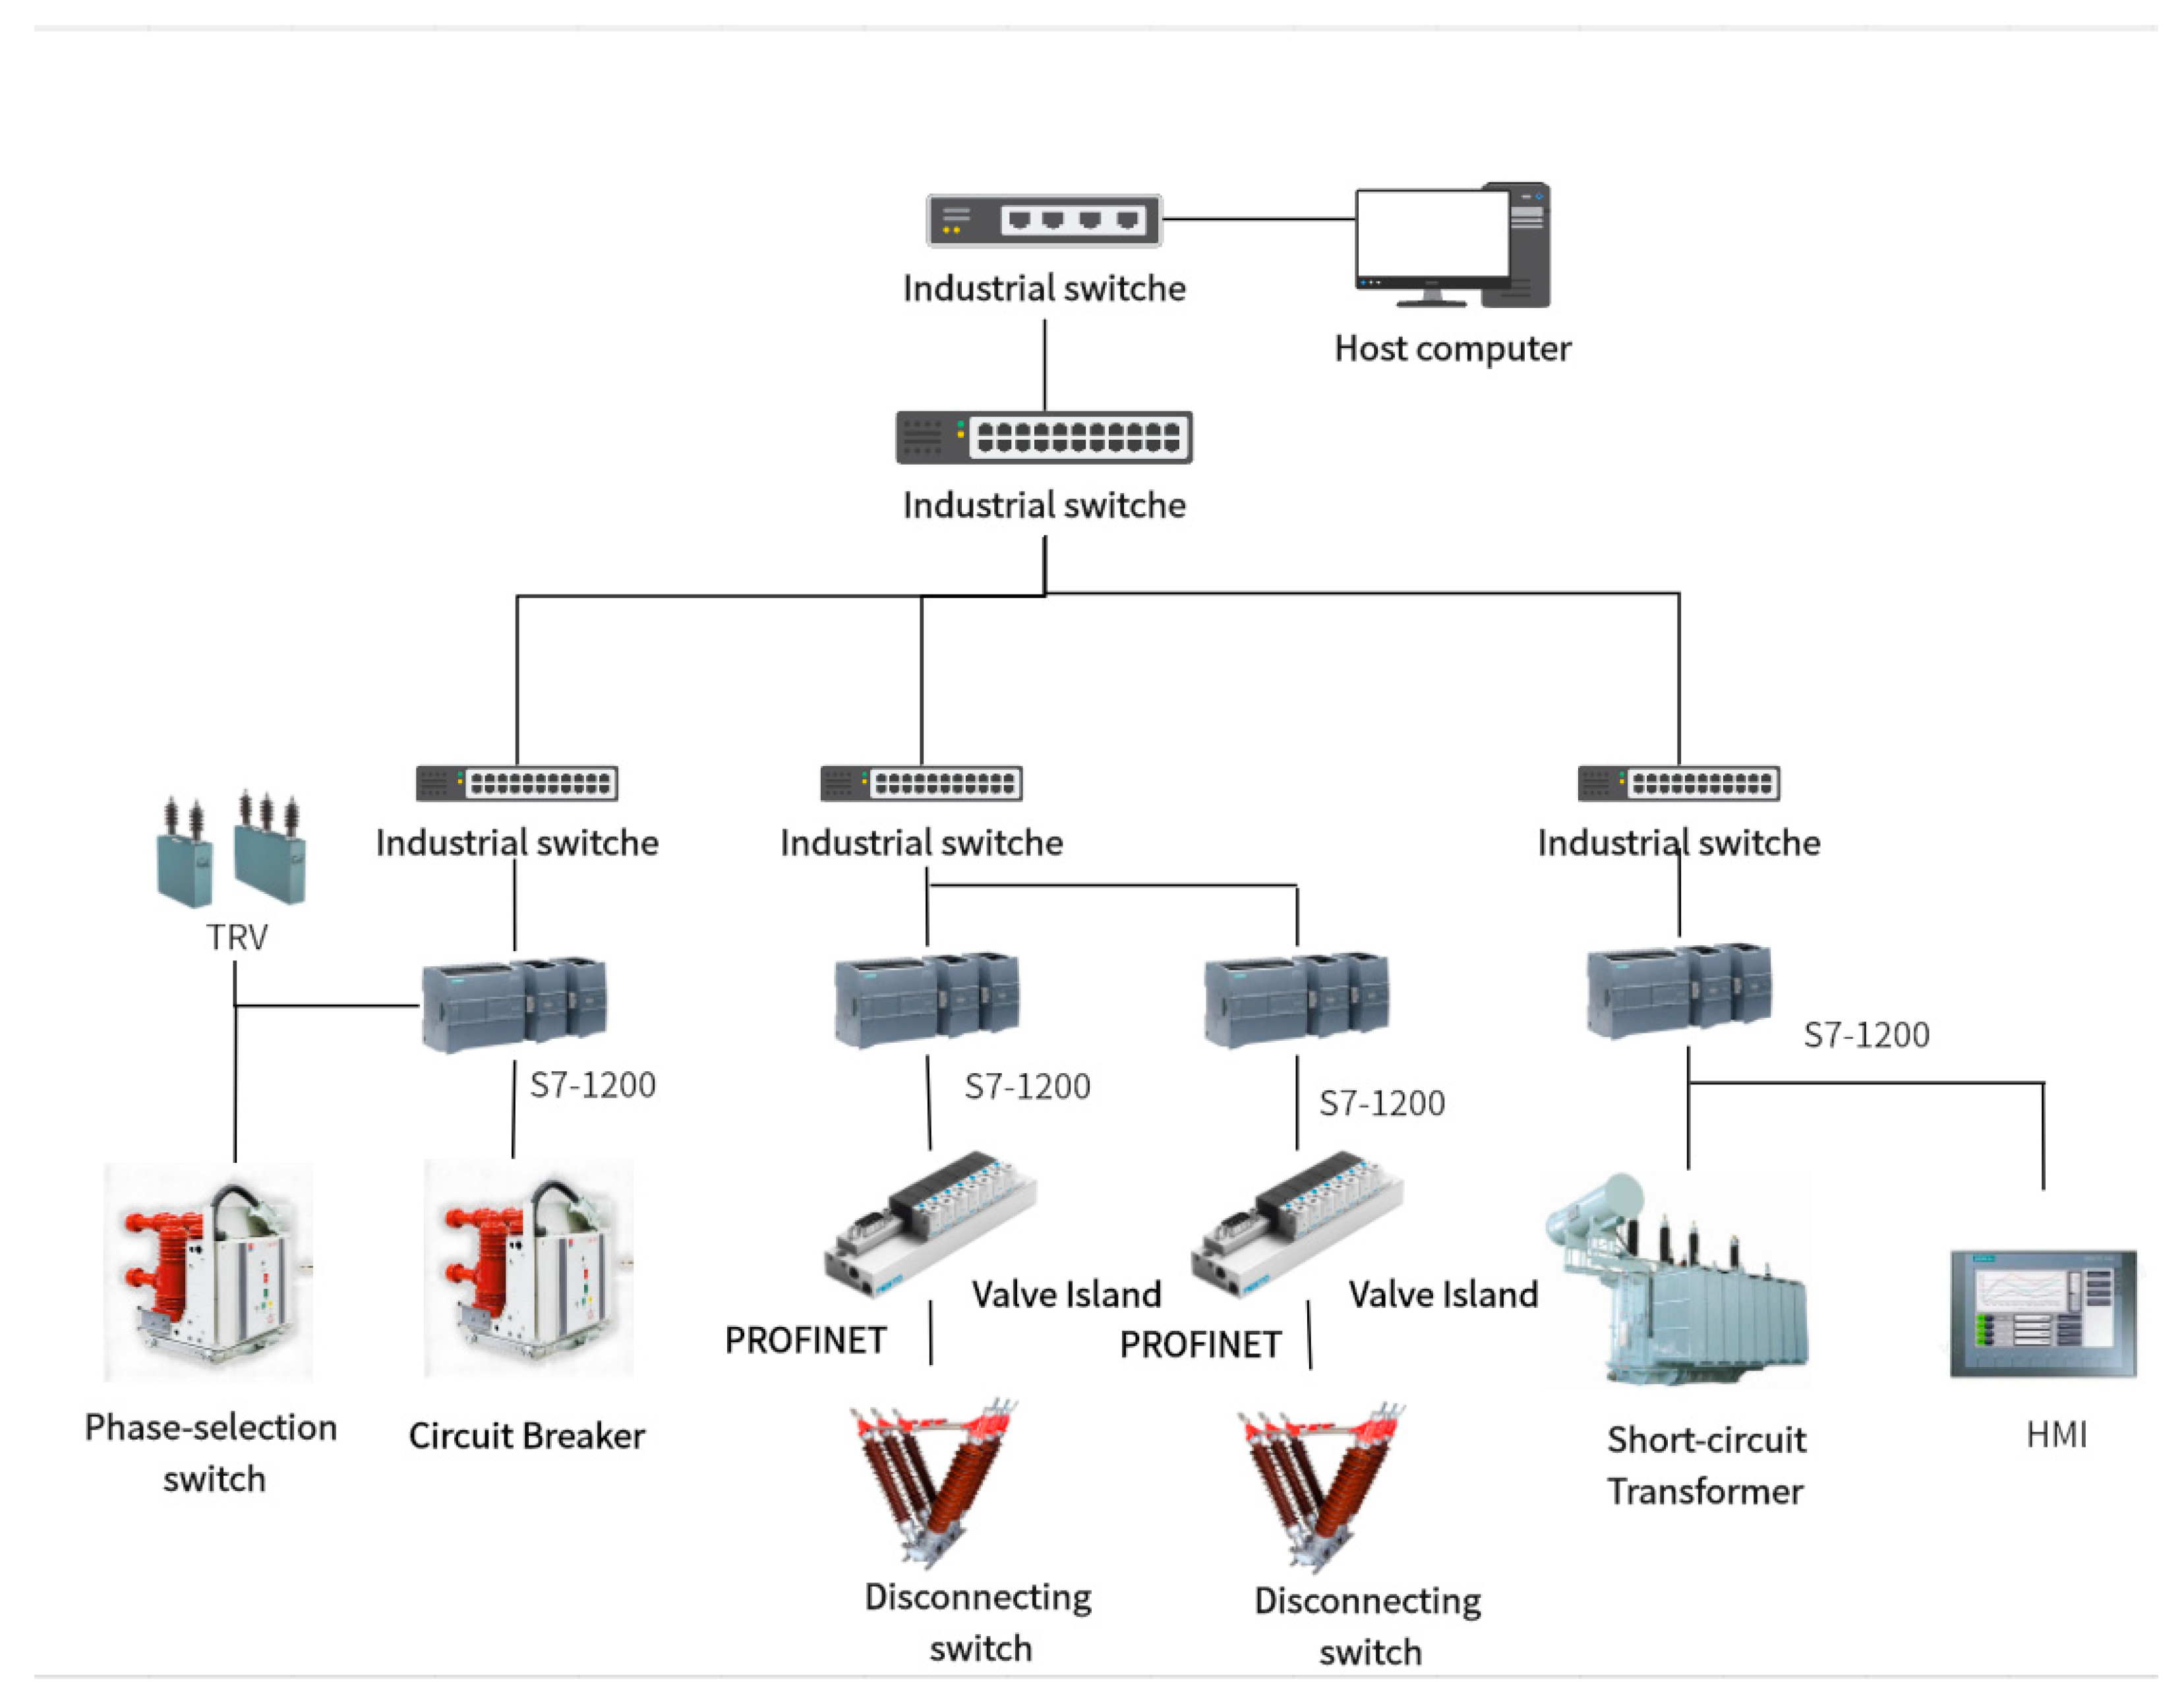
  • Automated monitoring system construction: It designs an automated monitoring and control system based on a ring-shaped PROFINET network, achieving full-process automation for high-capacity testing. By integrating PLCs, valve islands, coaxial cables, and optical fibers, it effectively isolates interference from complex electromagnetic environments. Sequential control technology precisely manages equipment action sequences, reducing human intervention and enhancing test repeatability and consistency.
  • Method validation and effects: It verifies the feasibility and accuracy of the standardized test circuit design method through MATLAB 2024a/Simulink simulations and physical experiments. The results show that short-circuit current and TRV parameter errors fall within the standard permissible range, proving that this automated design and standardized method significantly improve the efficiency and safety of high-capacity testing, ensuring the consistency and reliability of the test results.

2. Power-System-Based High-Capacity Testing Circuit

2.1. Main Test Circuit Architecture

The high-capacity testing circuit utilizing the power system network as its test power supply comprises the following key equipment: short-circuit transformer, protective circuit breaker, operating circuit breaker, phase selection switch, disconnector, reactor, resistor, capacitor, and transient recovery voltage (TRV) equipment.

2.1.1. Dual-Voltage Test Circuit Configuration (12 kV/40.5 kV)

As shown in Figure 1, the 12 kV test circuit delivers power to test chamber 1 or 2 through the following sequential components:
  • Short-circuit transformer (TM) (see Figure 2a);
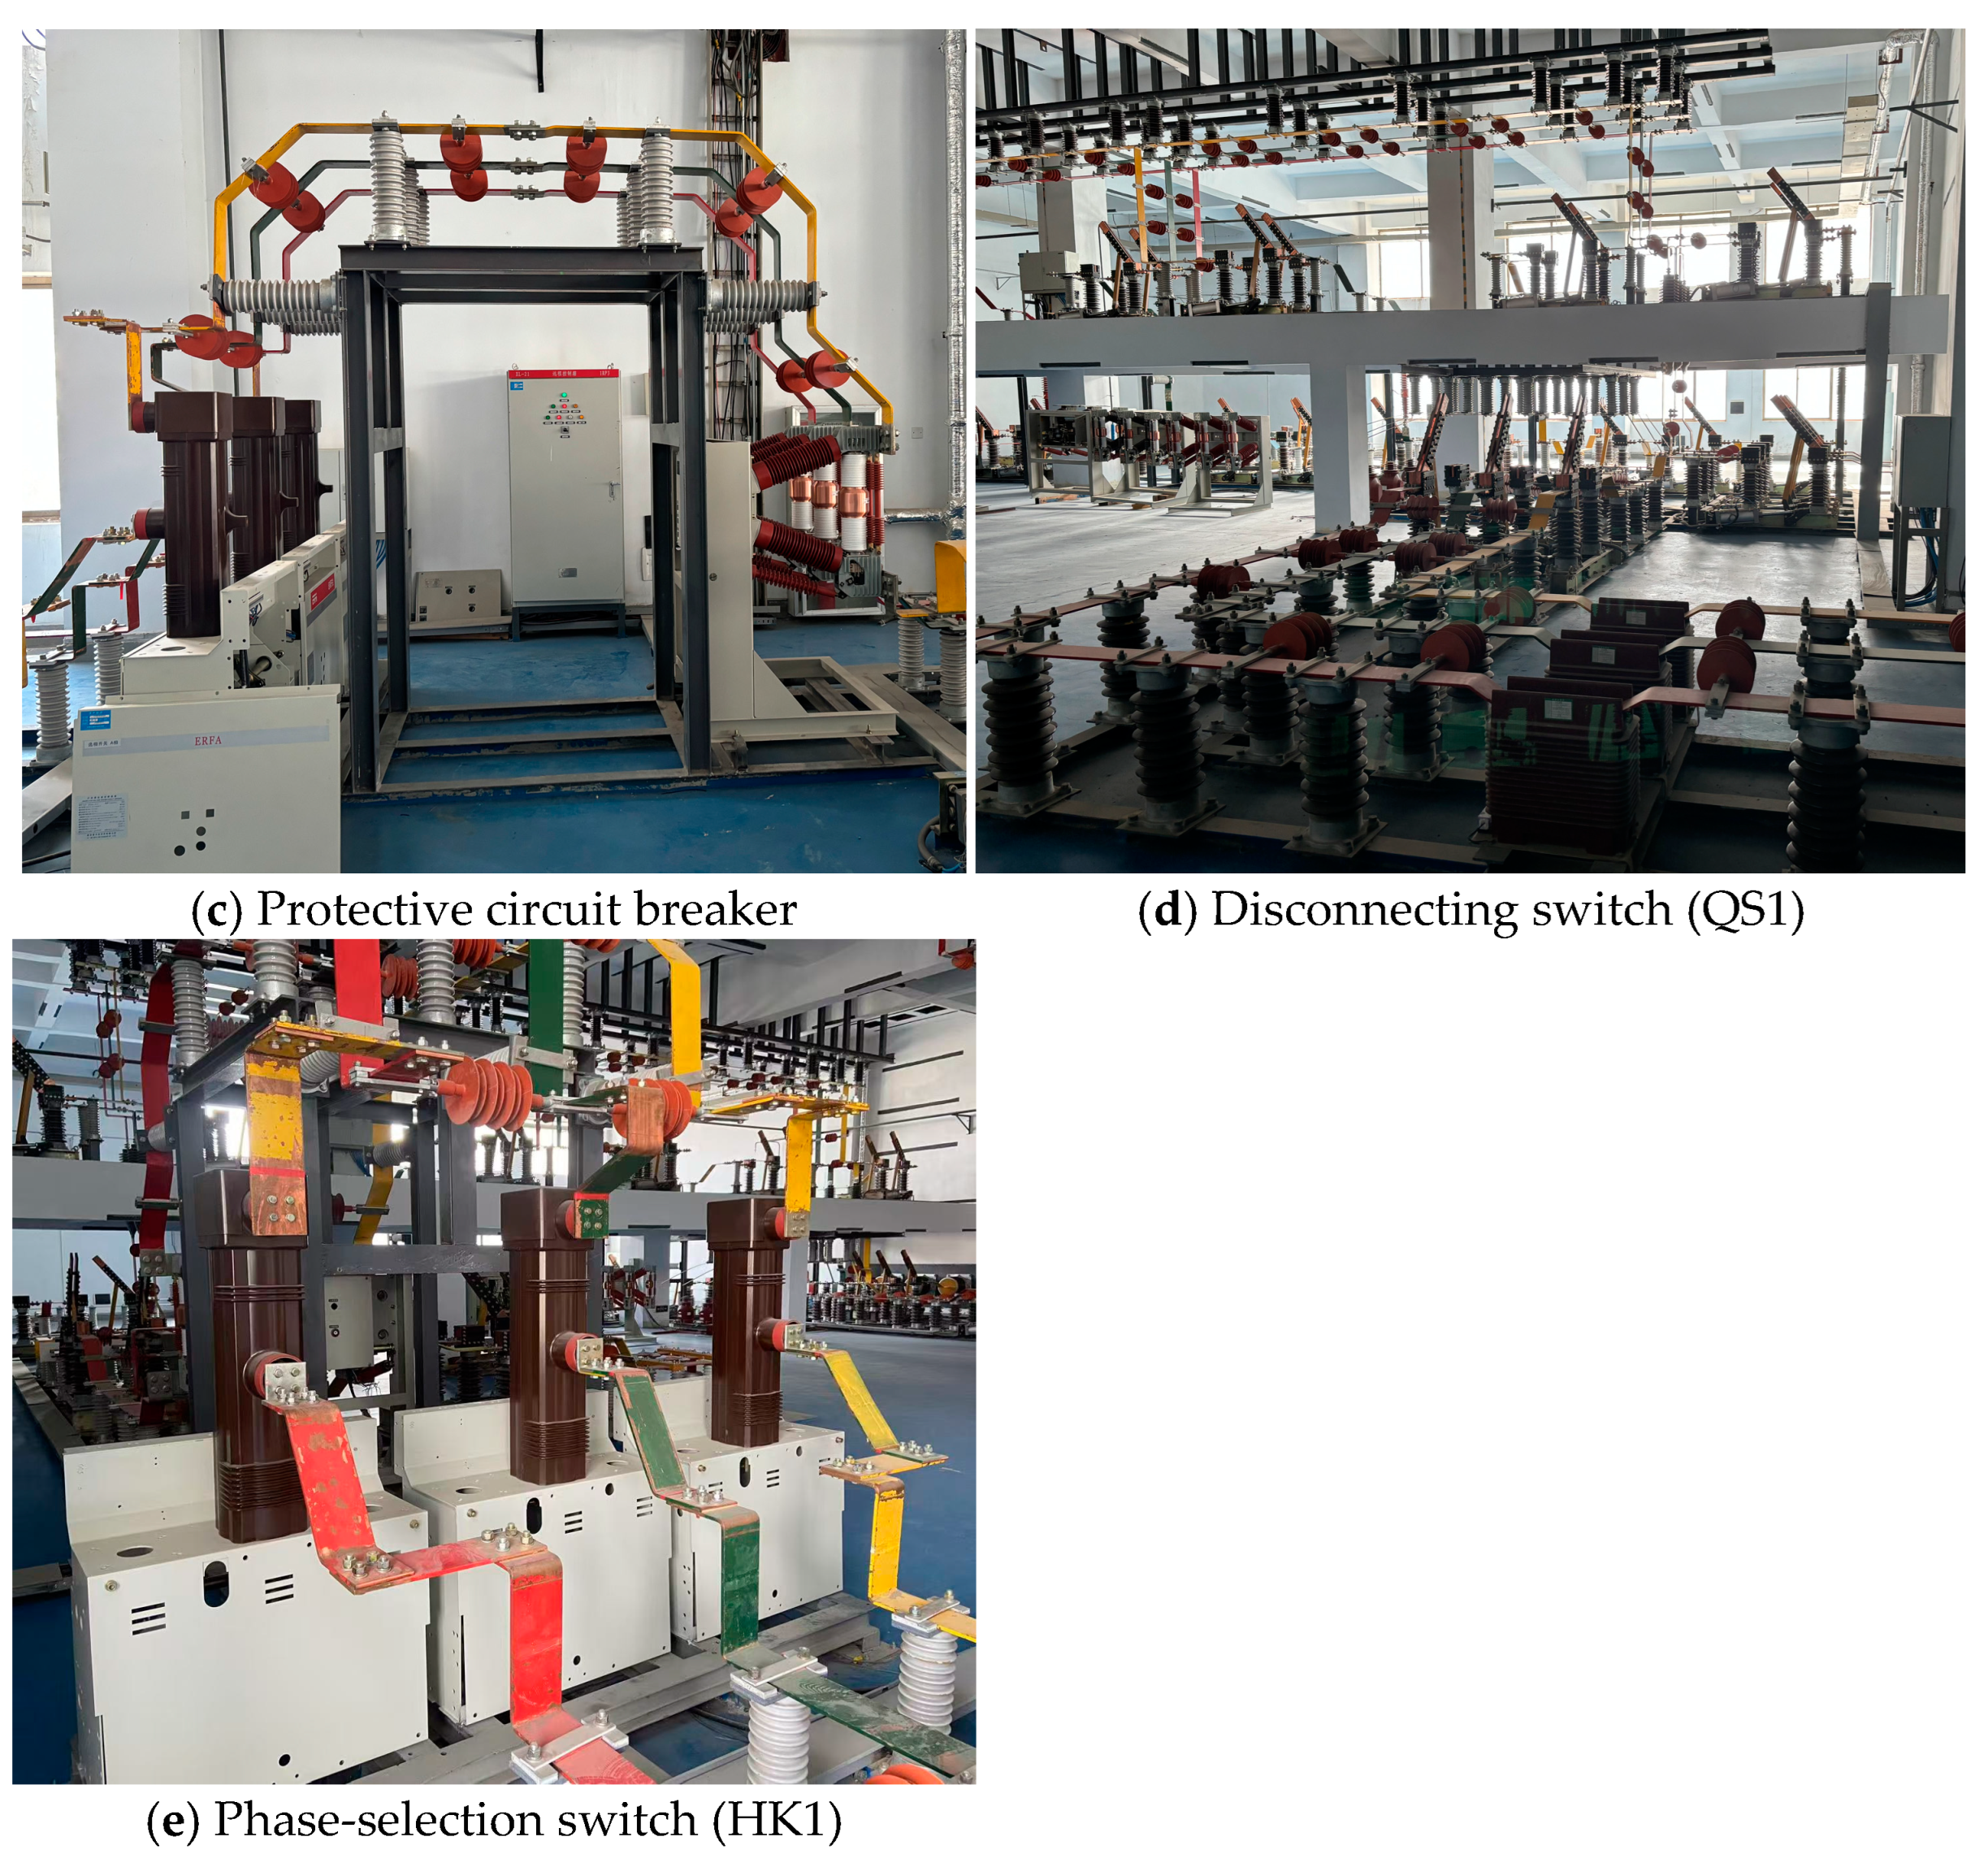
  • Busbar system (see Figure 2c,d);
  • Disconnecting switch (QS1) (see Figure 2b,d);
  • Protective circuit breaker (QF1) (see Figure 2c);
  • Operating circuit breaker (QF2) (see Figure 2c);
  • Phase-selection switch (HK1) (see Figure 2e);
  • Adjustable reactor (L3) (see Figure 2b).
Figure 1. Diagram of the primary test circuit system (QS1–QS17: disconnecting switches, TM: short-circuit transformer, L1–L3: reactors, HK1–HK2: phase selection switches, QF1–QF4: protective circuit breakers).
Sustainability 17 03679 g001
Figure 2. Key components and connection configuration of 12 kV test circuit.
Sustainability 17 03679 g002aSustainability 17 03679 g002b
For test voltages ≤ 12 kV, this circuit operates with a current range of 31.5–80 kA, enabling short-circuit-making/breaking tests for the switchgear (e.g., circuit breakers, switch cabinets) rated ≤ 12 kV. Key system specifications include the following:
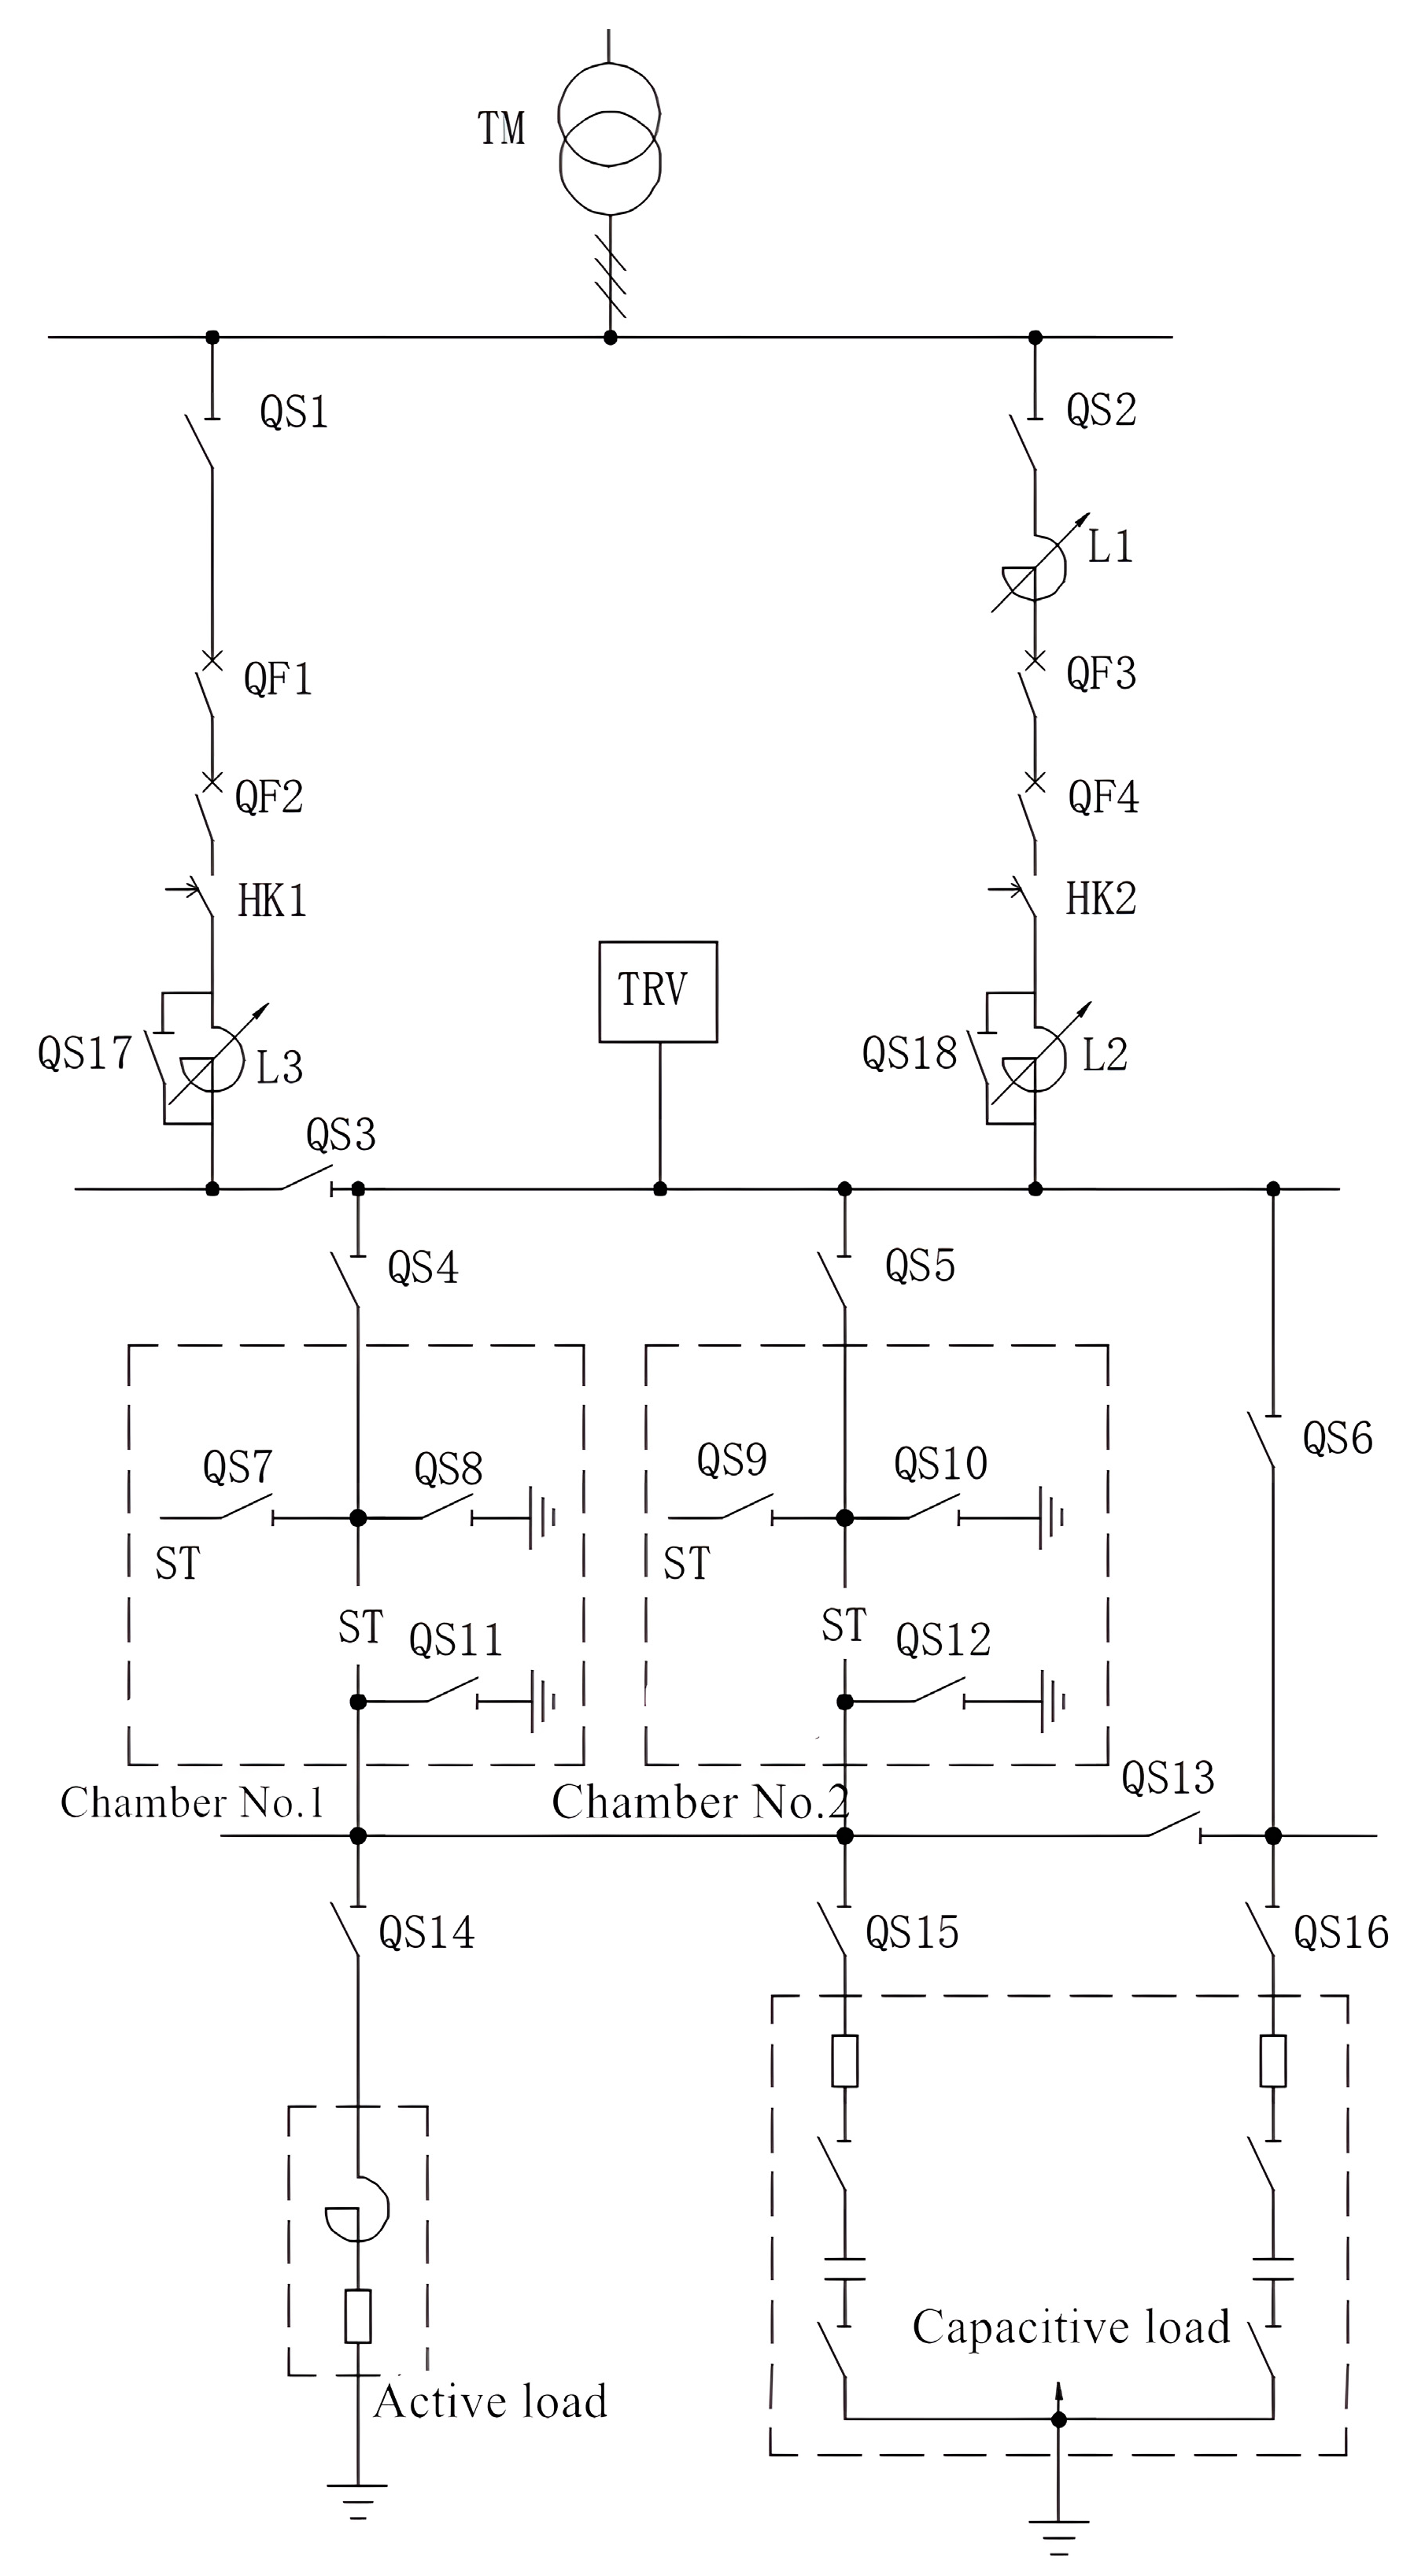
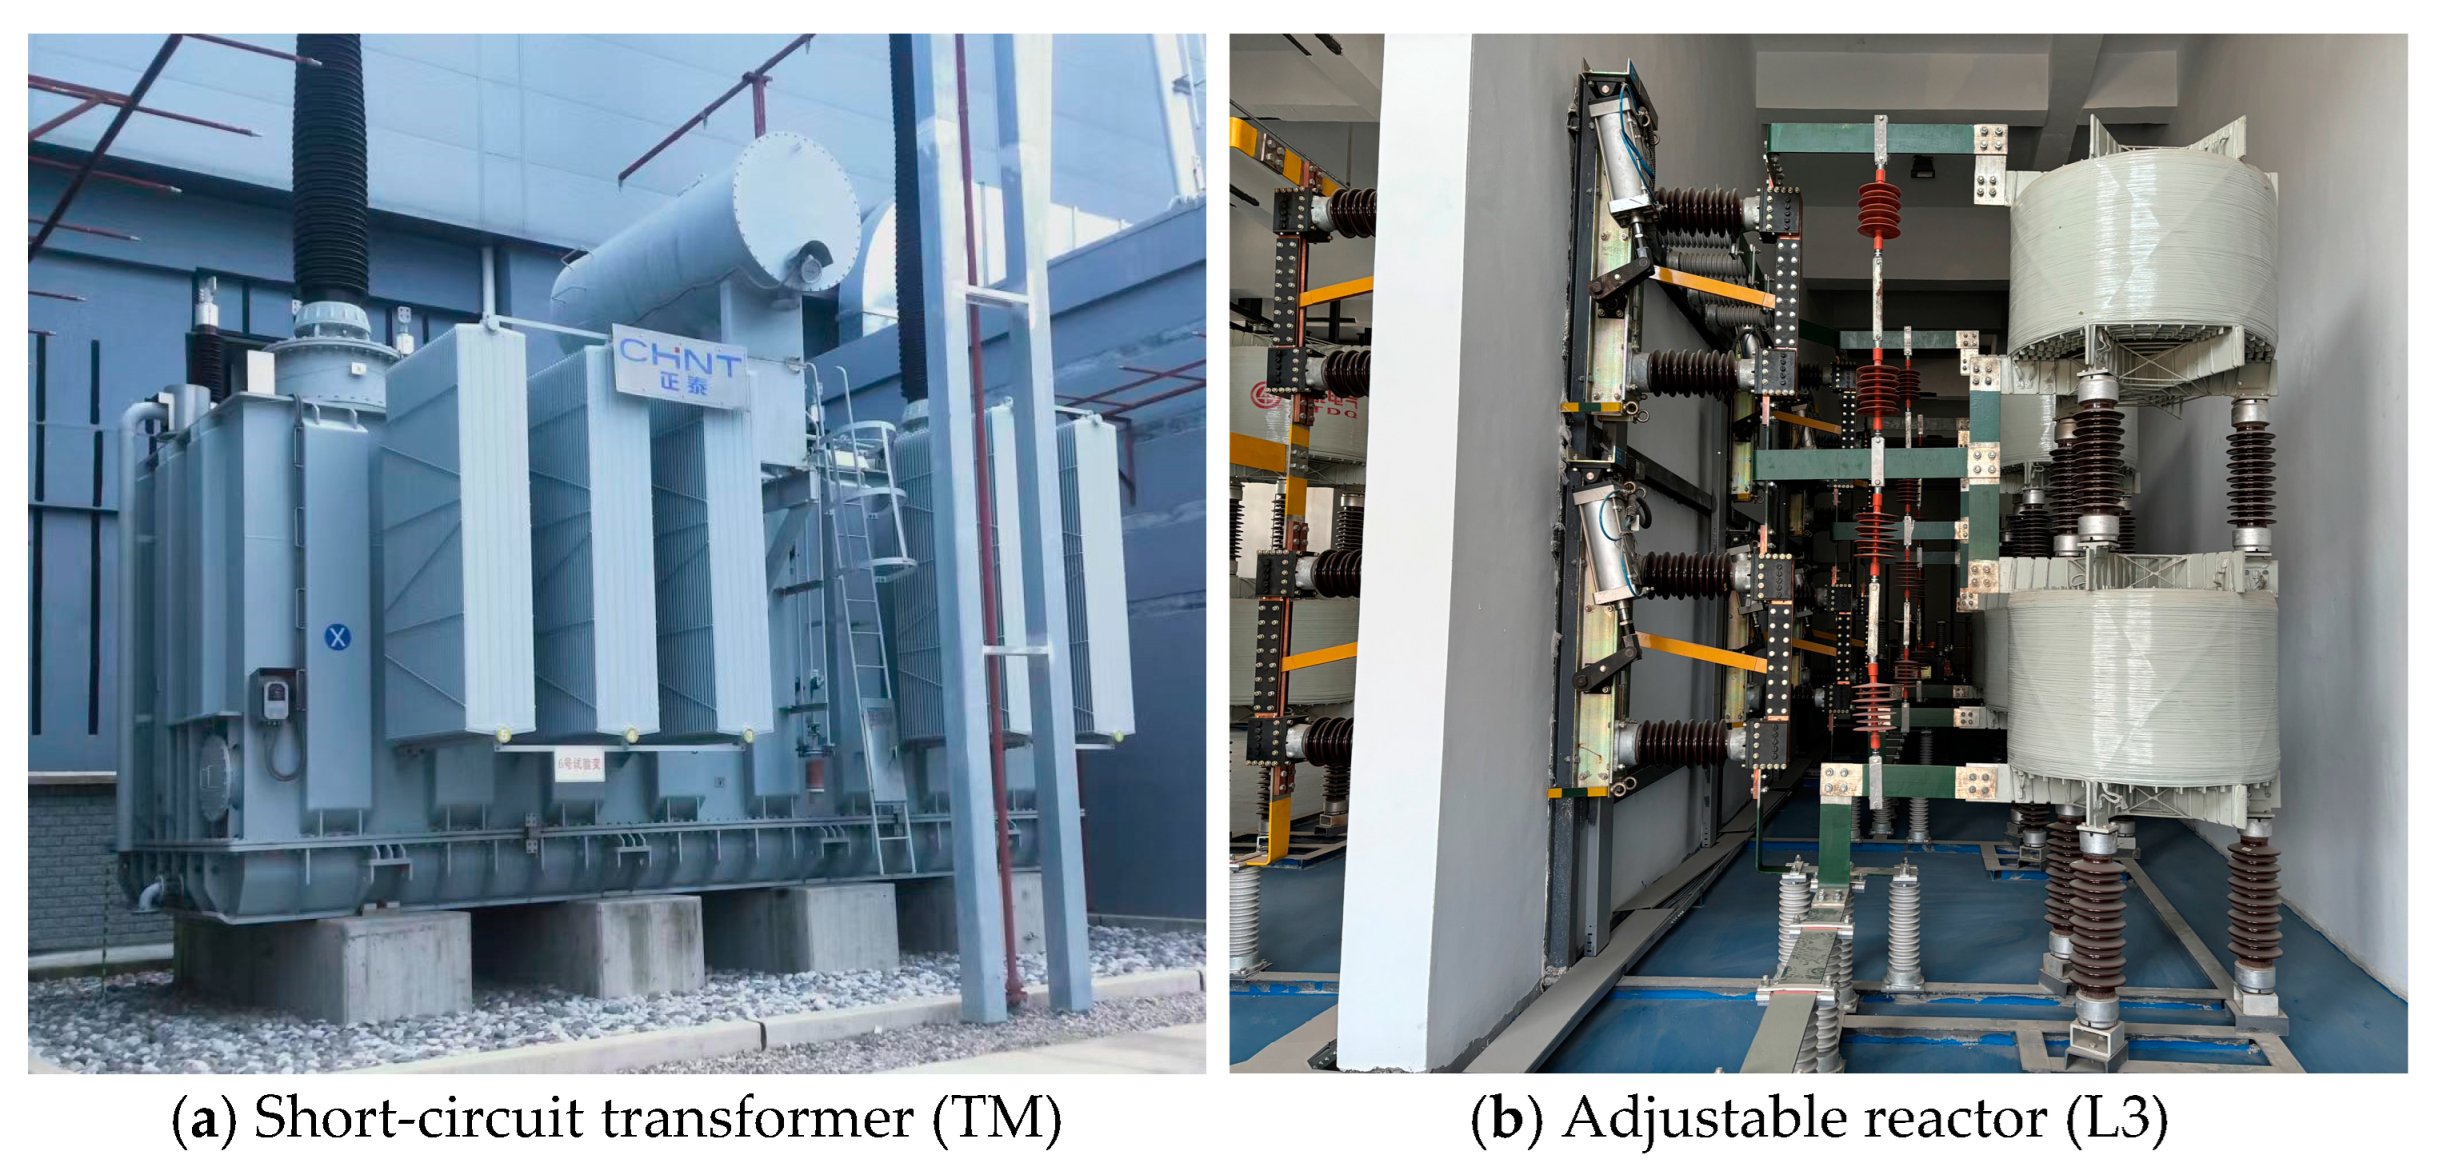
  • Three-phase short-circuit capacity of 330 kV busbar: 7111 MVA;
  • Short-circuit transformer: Composed of three single-phase transformers, with specific parameters detailed in Table 1.
Similarly, the 40.5 kV test circuit (Figure 1) feeds test chamber 1 or 2 through an analogous configuration with modified components:
  • Short-circuit transformer (TM);
  • Busbar system;
  • Disconnecting switch (QS2);
  • Current-limiting reactor (L1);
  • Protective circuit breaker (QF3);
  • Operating circuit breaker (QF4);
  • Phase-selection switch (HK2);
  • Adjustable reactor (L2).
This circuit supports operational currents of 1.6–31.5 kA, designed for short-circuit-making/breaking tests on a switchgear rated at 40.5 kV and 24 kV.

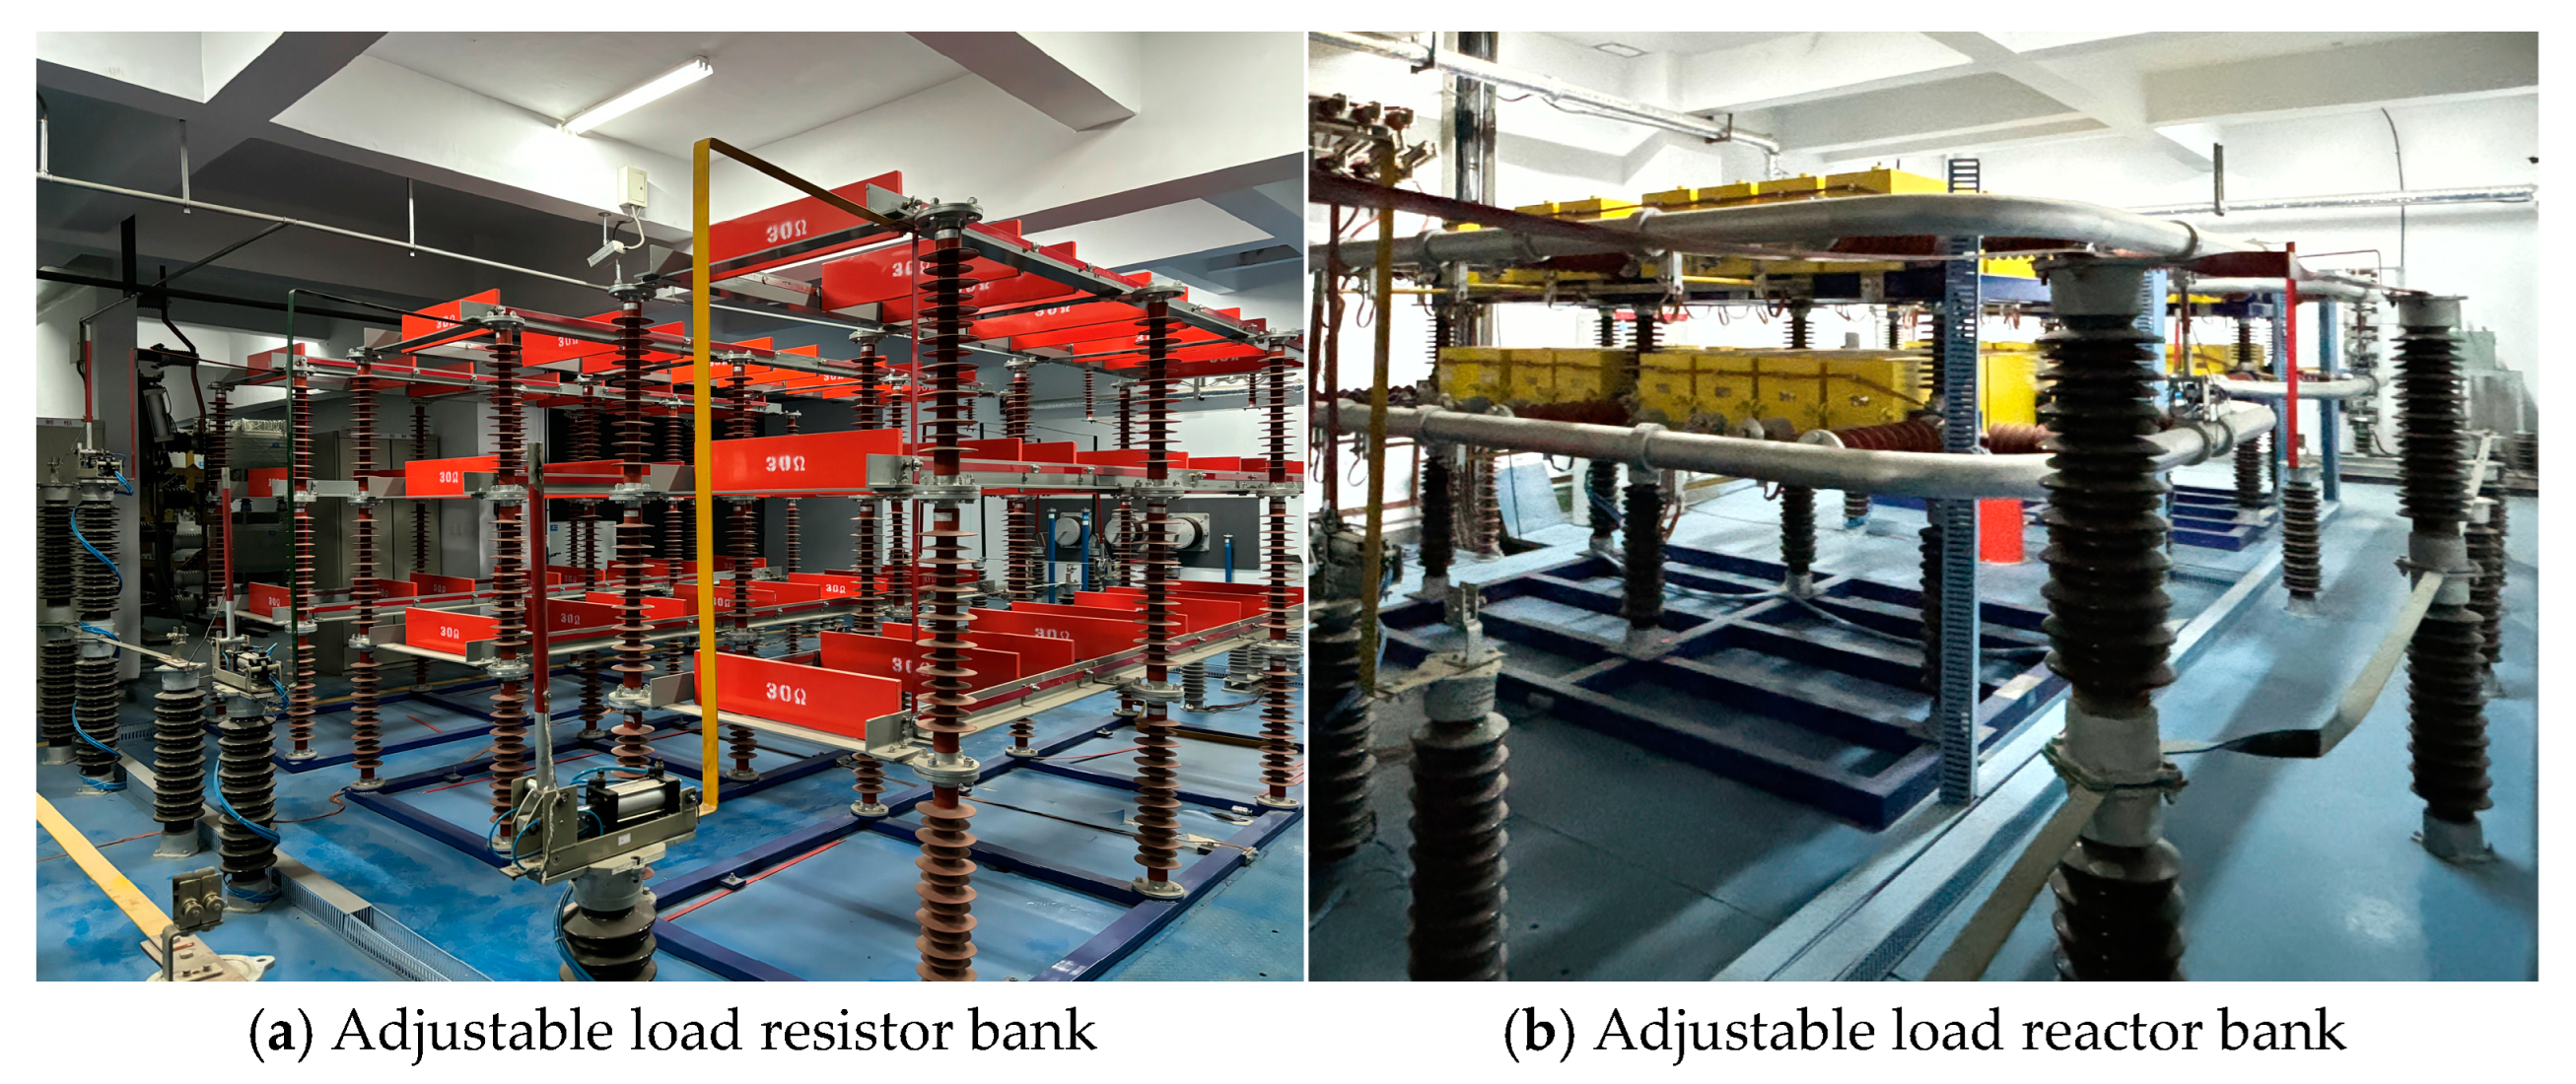
2.1.2. Active Load and Capacitive Load

A programmable active load system is configured downstream of test chamber 1, comprising the following:
  • Load resistor bank (adjustable) (see Figure 3a);
  • Load reactor bank (adjustable) (see Figure 3b).
This system enables precise regulation of the test current (range: 31.5–1000 A) and power factor (PF: 0.3–1.0), supporting active load testing for the following devices rated ≤ 40.5 kV:
  • Load switches;
  • Fuses;
  • AC contactors.
A capacitive current switching test platform is installed downstream of test chamber 2, featuring the following:
  • Two 40.5 kV back-to-back capacitor banks;
  • Continuous current rating: 1–1000 A.
This configuration meets IEC 62271-103:2011 [24] requirements for single-phase or three-phase capacitive current switching tests on the following:
  • High-voltage AC circuit breakers;
  • High-voltage AC load switches.
Applicable test parameters:
  • Rated voltage range: 3.6–40.5 kV;
  • Capacitive current range: 1–1000 A.

2.1.3. TRV Equipment

Transient recovery voltage (TRV) is a critical parameter significantly influencing the short-circuit-breaking capability of circuit breakers. TRV waveform characteristics include the amplitude (Uc), rise rate (dUc/dt), and natural oscillation frequency (f0). According to IEC 62271-100:2021 [25], TRV parameters are essential rated parameters for high-voltage circuit breakers, with strict specifications (two-parameter or four-parameter methods) to ensure performance and reliability. In high-capacity testing, proper TRV equipment operation is crucial to obtain waveforms compliant with standards [26,27].
As shown in Figure 1, the TRV equipment is typically connected in parallel to the busbar at the test chamber outlet. The frequency-tuning circuit, comprising capacitors (C0) and resistors (R0), adjusts TRV frequency and damping characteristics based on test requirements. High-speed data acquisition systems are employed to record and analyze TRV waveforms, ensuring accurate parameter extraction. Here, several important TRV parameters are explained. Uc (Peak voltage) is the maximum voltage peak reached by the TRV. t3 (Peak time) is the time interval from the current zero-crossing point to the moment when the TRV reaches the peak voltage Uc. td (Fall time) is the time it takes for the TRV to drop from the peak voltage Uc to a certain reference value.
During a fault at the outgoing line terminal, the TRV waveform is determined by the inductance and capacitance on the power supply side, and its rise rate (du/dt) and peak value (Uc) directly affect the dielectric recovery rate of the circuit breaker. For example, the TRV rise rate in a cable system is relatively low (about 0.5 kV/μs), while it can reach 3 kV/μs in a line system. It is necessary to match the rise rate and peak value of the TRV, such as for a circuit breaker of S2 class, which must pass the T100s test (simulating the interruption of 100% short-circuit current). During a close-in fault, the TRV on the line side undergoes high-frequency oscillation due to wave impedance (Z) and fault distance.

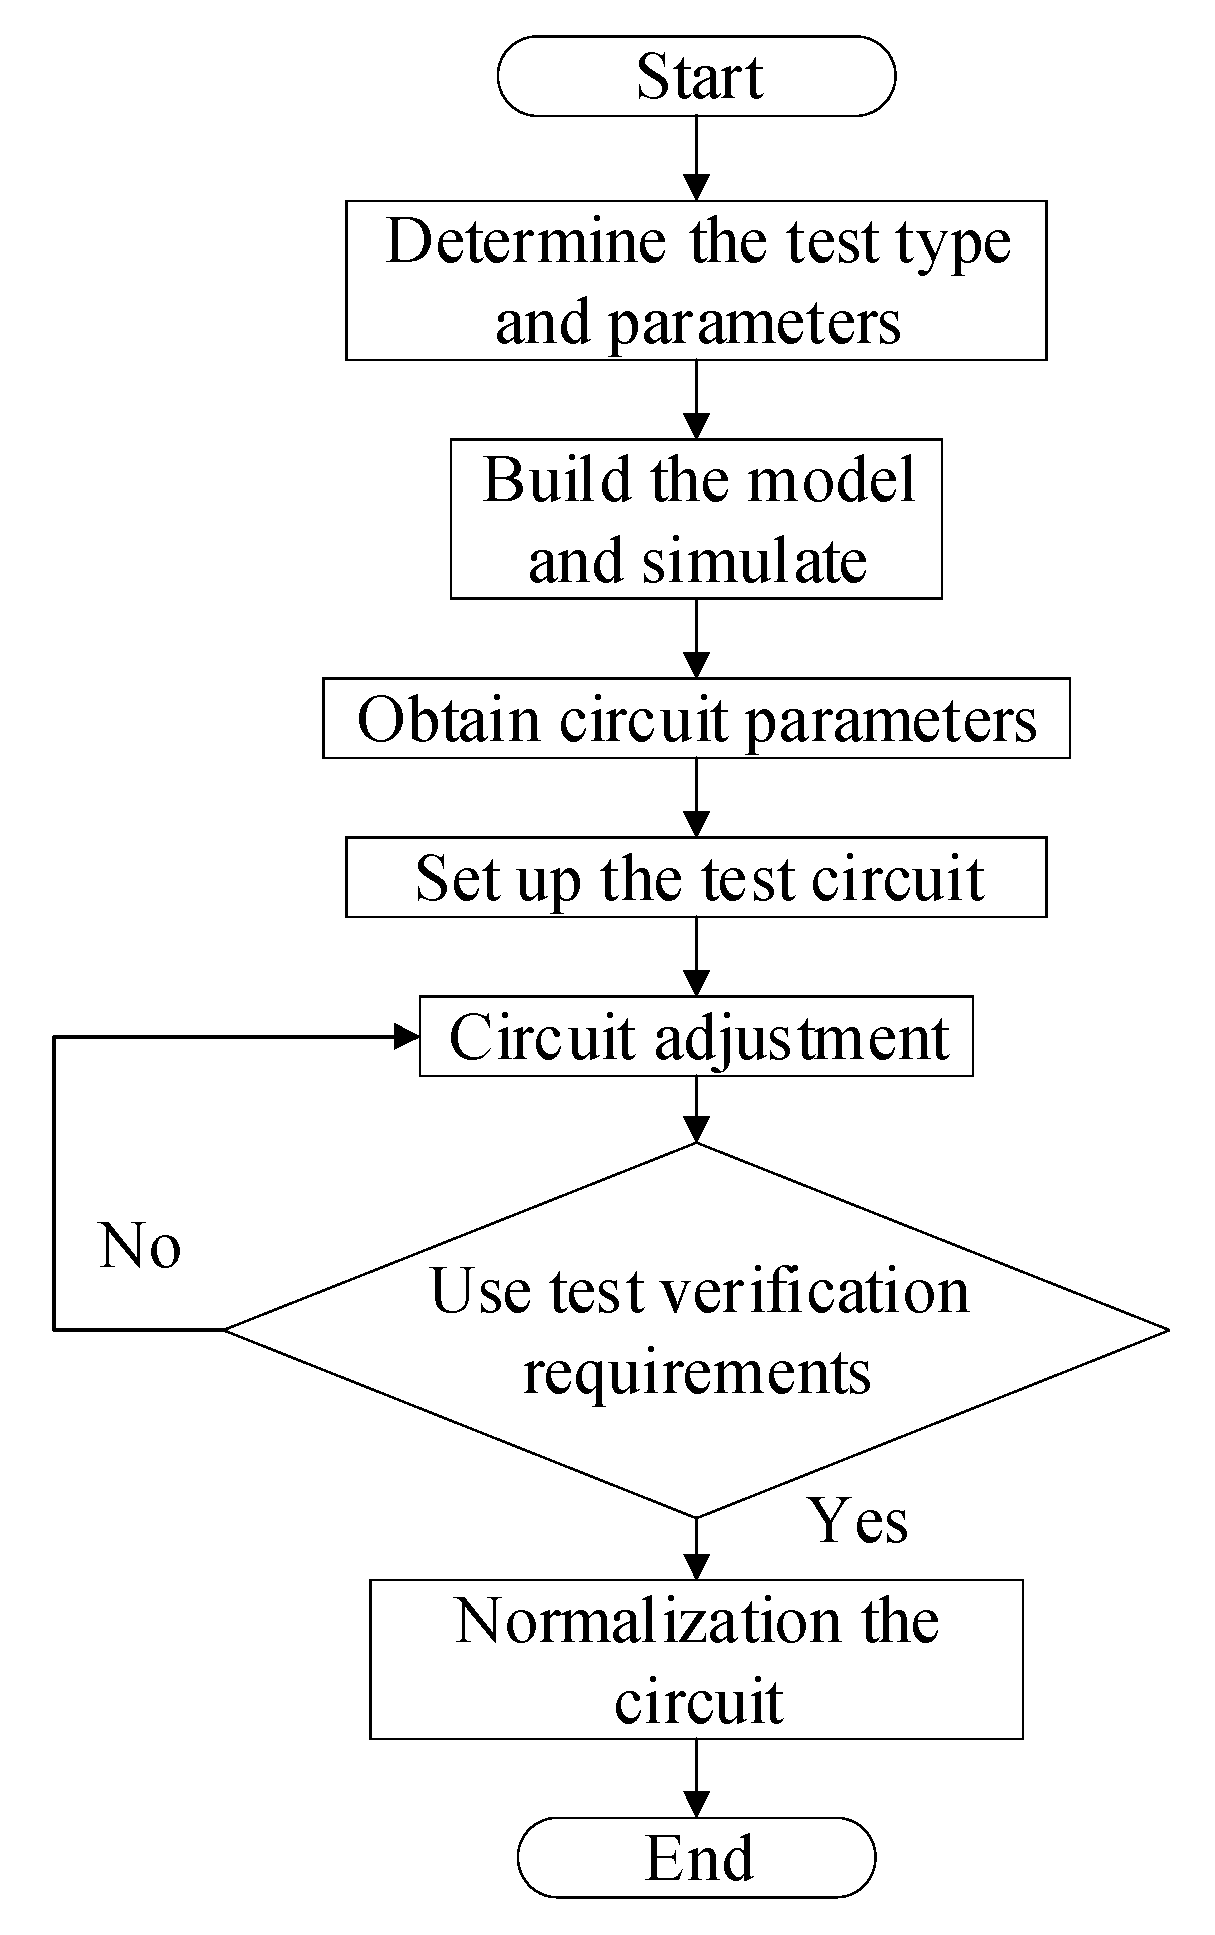
2.2. Standardization of Test Circuits
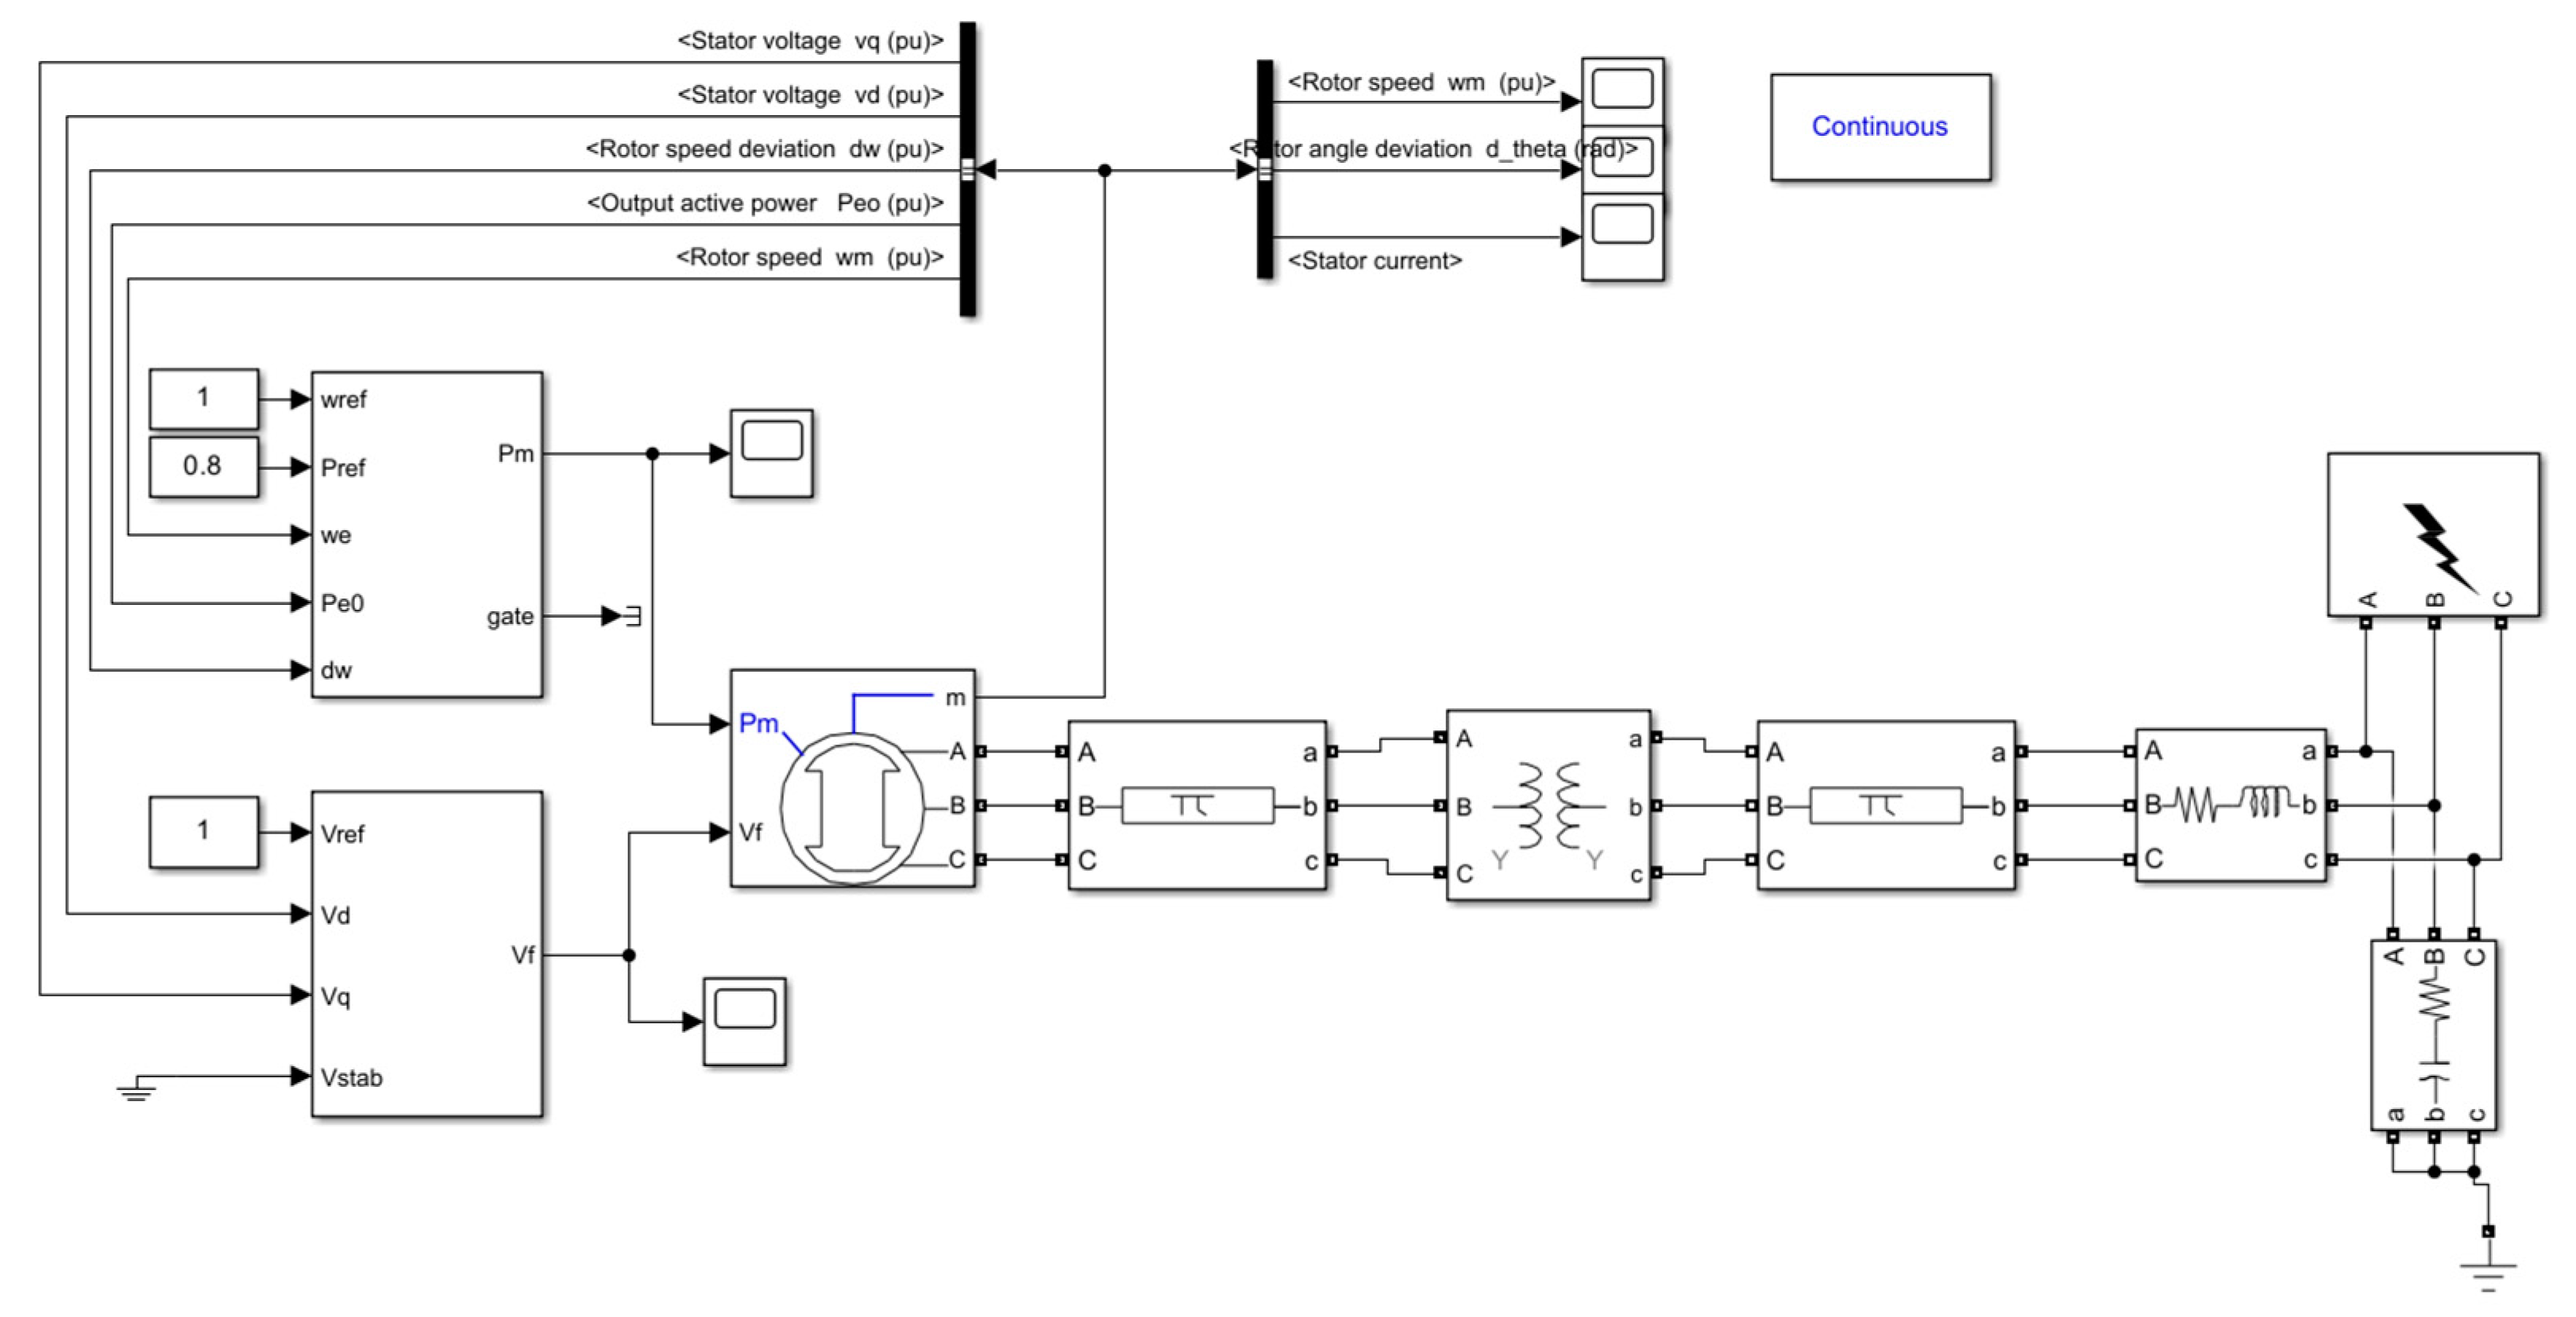
The standardization of high-capacity testing circuits is crucial for ensuring the repeatability and consistency of tests. Standardization encompasses parameter unification, process optimization, and compliance with industry standards, providing a scientific basis for verifying the performance of electrical equipment. By unifying parameters and optimizing processes, standardized test circuits address the dual challenges of efficiency and safety. Table 2 summarizes the differences between traditional and existing standardized circuits to clearly highlight the novelty of this work.
Table 2 systematically demonstrates the advantages of standardized test circuits across six dimensions: automated parameter configuration minimizes human errors for consistent equipment validation; optimized processes reduce resource consumption and testing cycles; full-process automation enhances efficiency for rapid renewable energy equipment verification; automated data acquisition ensures accuracy for grid safety; and anti-interference designs maintain stability in complex smart grid scenarios. Figure 4 is a standardization flowchart for test circuits based on a parameter library and automated configuration, which generates configuration schemes by automatically calling standard parameters according to test requirements and verifies them through simulation to improve testing efficiency and consistency.

2.2.1. Simulation

(1)
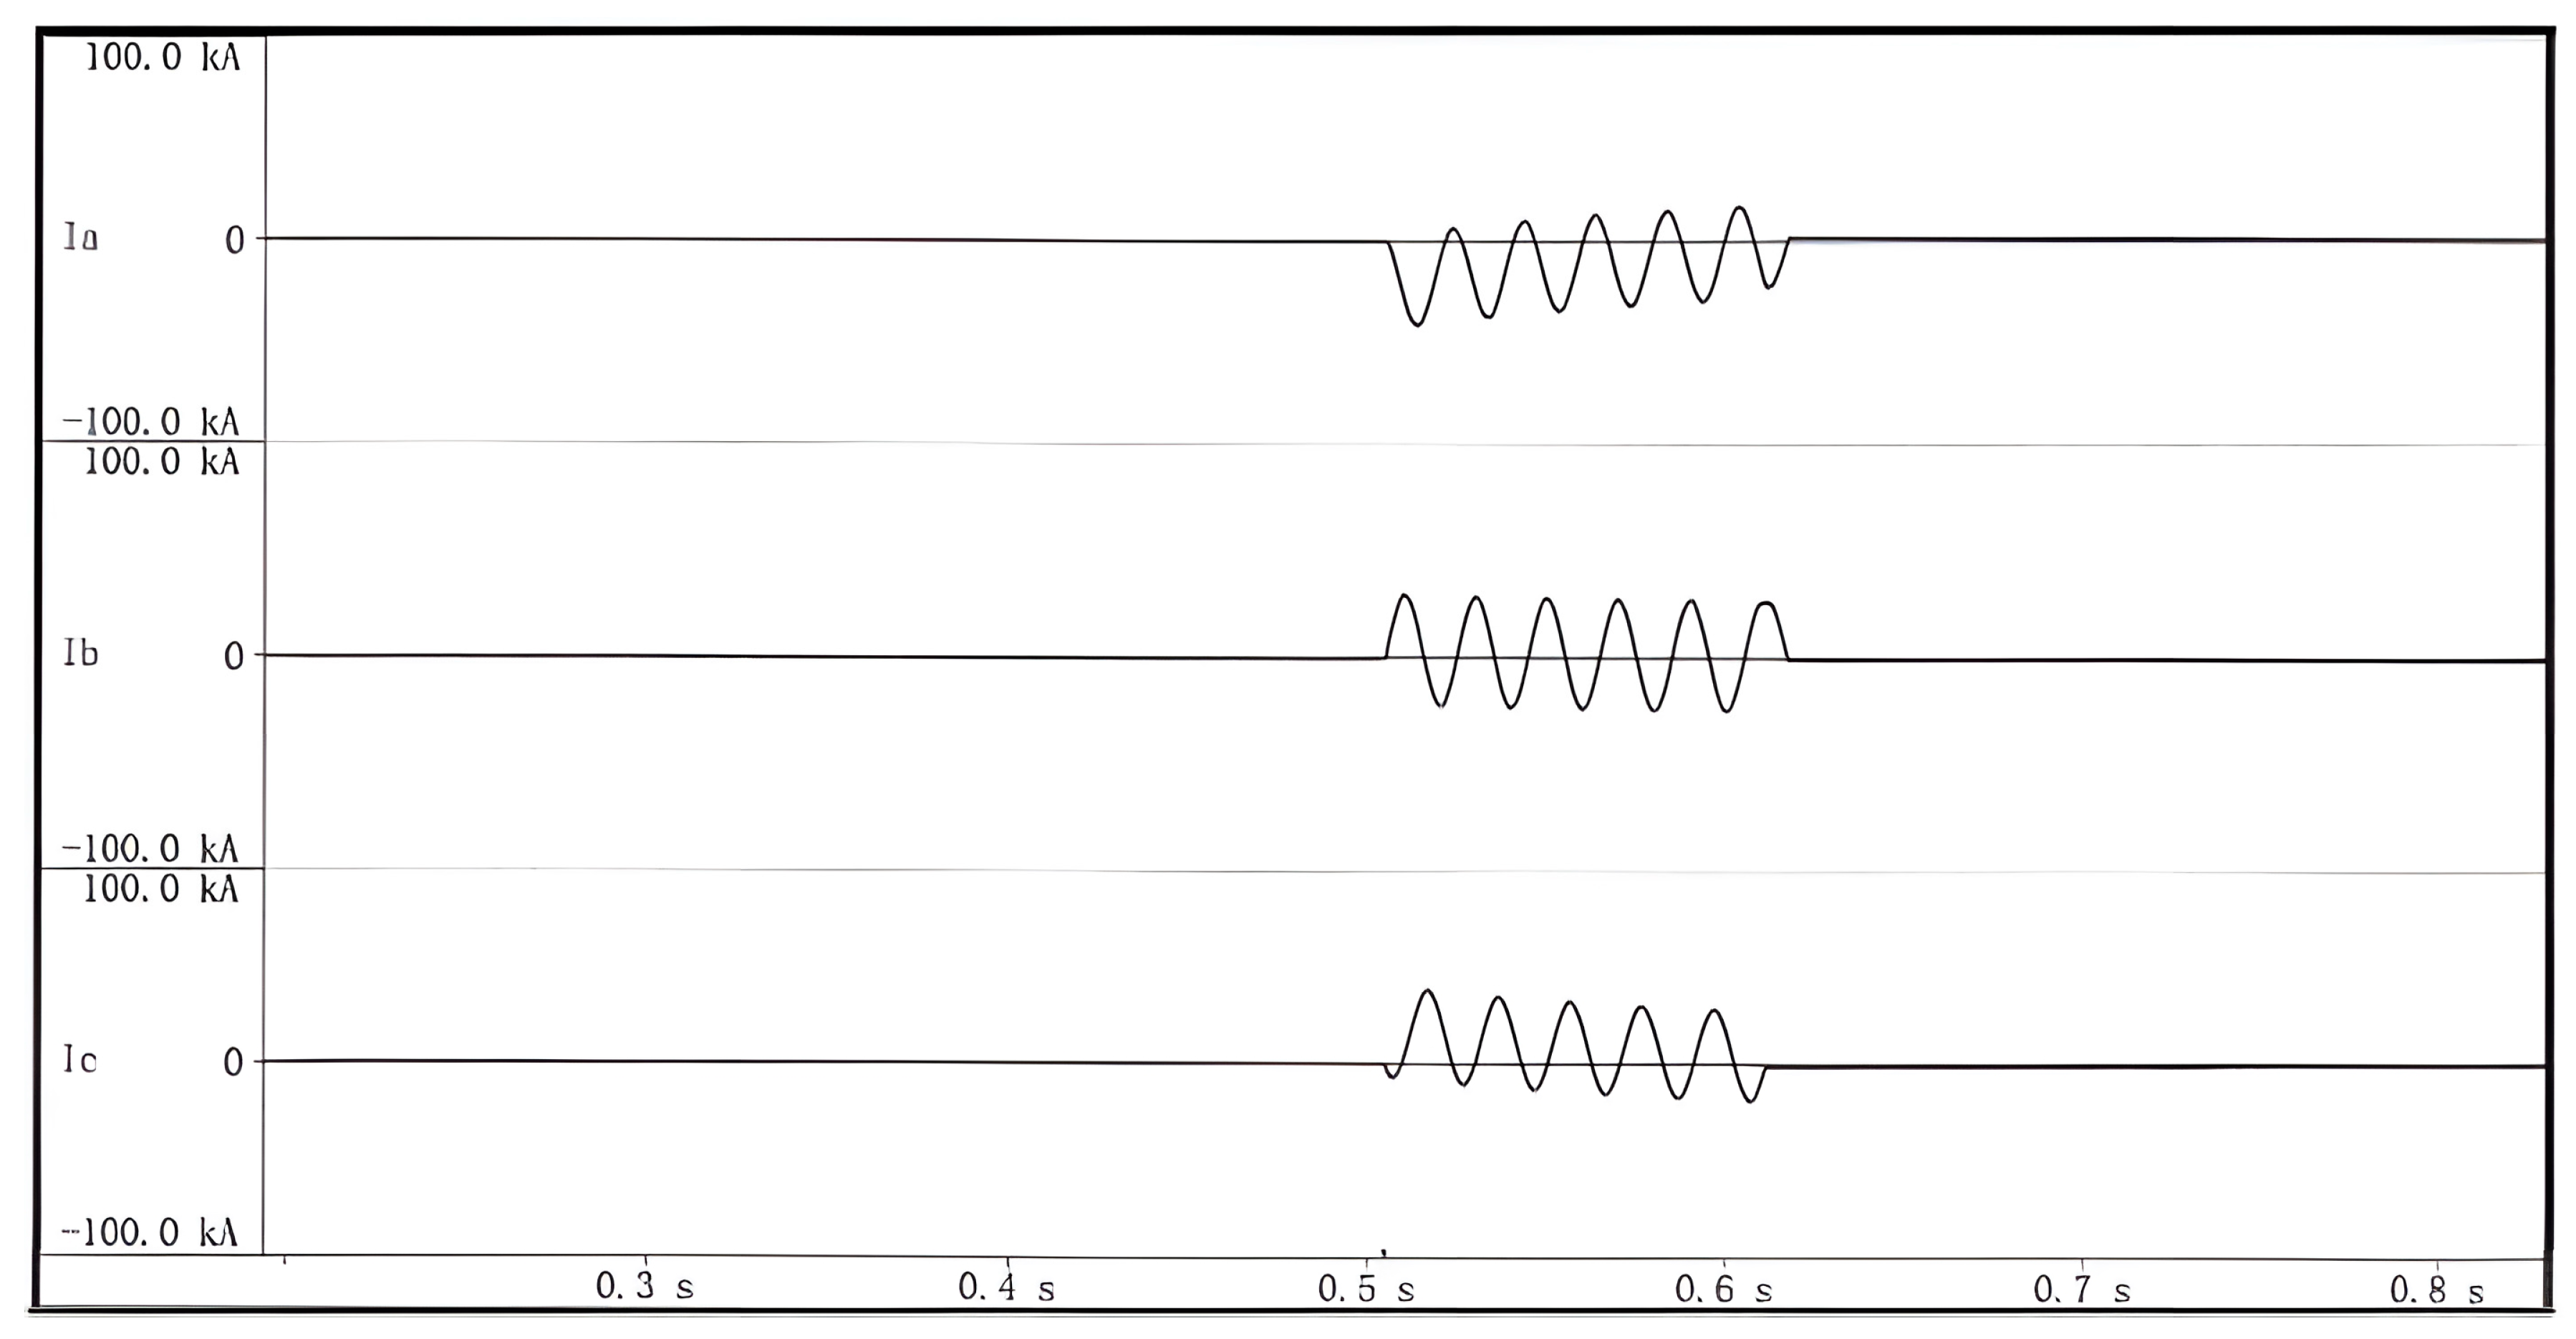
High-capacity testing circuit and short-circuit current simulation
In order to obtain the parameters of the test circuit and standardize the test circuit, a simulation model of the main test circuit in Figure 1 is now established using MATLAB/Simulink. As shown in Figure 5, the simulation model is based on the short-circuit test of a 12 kV high-voltage vacuum circuit breaker, with detailed system parameters set, including a rated power of 3200 MVA, a line voltage of 12,000 Vrms, and a frequency of 50 Hz. Reactance parameters (e.g., Xd = 0.5 pu, Xd′ = 0.08 pu) and time constants (e.g., Td′ = 1.3201 s, Td″ = 0.023 s) are configured accurately according to the actual testing requirements. The simulation assumes a single-machine infinite-bus system to simplify the model and focus on key dynamic behaviors. A three-phase fault module is used to simulate the short-circuit closing and opening processes of the circuit breaker, ensuring that the simulation results accurately reflect actual testing conditions. All simulation parameters are consistent with physical tests to verify the accuracy and reliability of the model. A simulation model of the main test circuit is established using MATLAB/Simulink, and waveform diagrams are analyzed to obtain key parameters such as supply voltage, contact voltage, short-circuit current, and its DC component. The simulation results are validated through physical tests to ensure errors are within the standard permissible range.
Take the T60 test method of the basic short-circuit test for a 12 kV indoor high-voltage vacuum circuit breaker as an example. A simulation model is established based on the 12 kV test circuit in 2.1. The short-circuit time is set to 0.1 s. The resistance of the power-supply-side circuit is 0.6 Ω and the inductance is 0.0375 H. The TRV parameters are set as a resistance of 81 Ω and a capacitance of 26 nF. The power supply voltage and the voltage across the breaker contacts are shown in Figure 6a, and the short-circuit current waveform is shown in Figure 6b. The measured interrupting currents are 19.0 kA, 18.9 kA, and 19.1 kA, respectively, and the DC components of the short-circuit current are 3.1%, 8.3%, and 5.2%, respectively.
(2)
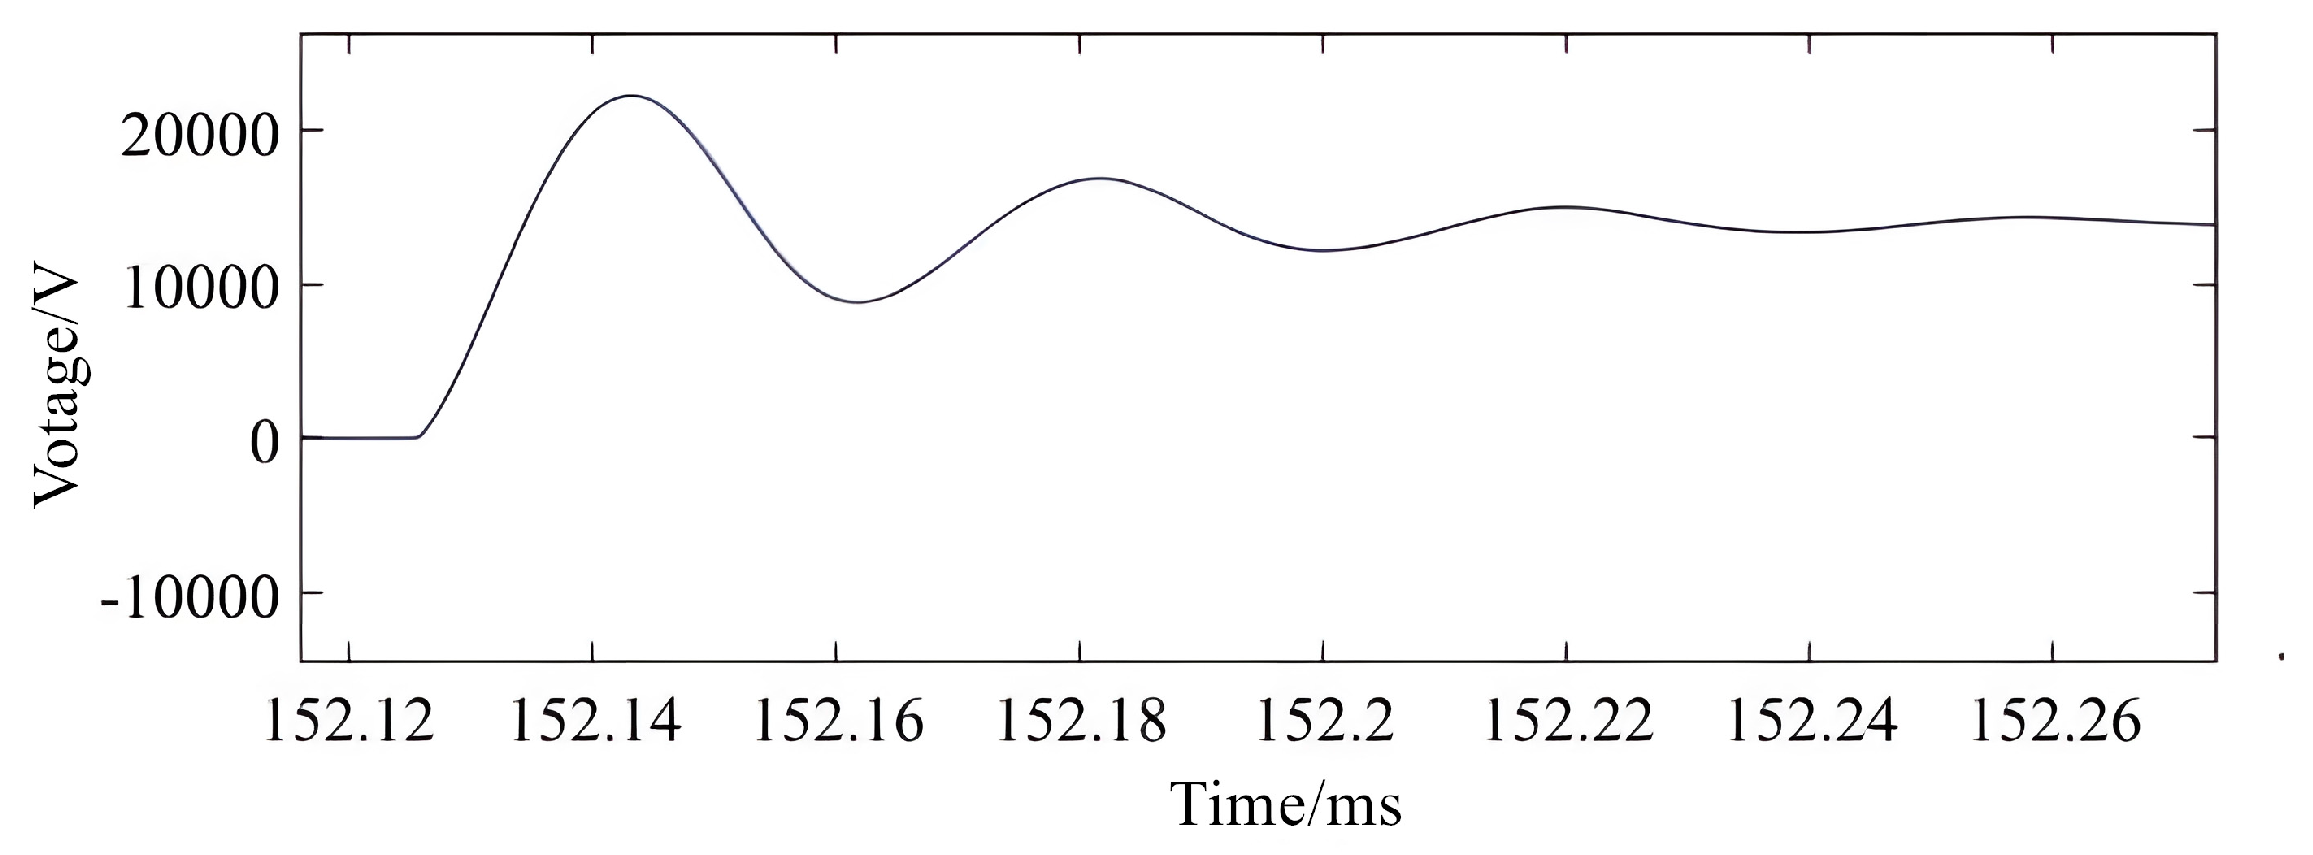
TRV characteristic simulation
The rise time in the TRV (transient recovery voltage) waveform is usually very short, generally ranging from a few microseconds to dozens of microseconds. The TRV waveform is typically complex and may contain multiple oscillation and attenuation processes, which makes the analysis and prediction of TRV difficult. Here, the simulation waveform of TRV can be obtained through magnifying the C-phase in Figure 6a, and the TRV waveform as shown in Figure 7 can be obtained. Using the methods in references [24,25], the TRV parameters are measured as Uc: 20.2 kV, t3: 23 μs, and td: 3 μs.

2.2.2. Experimental Validation
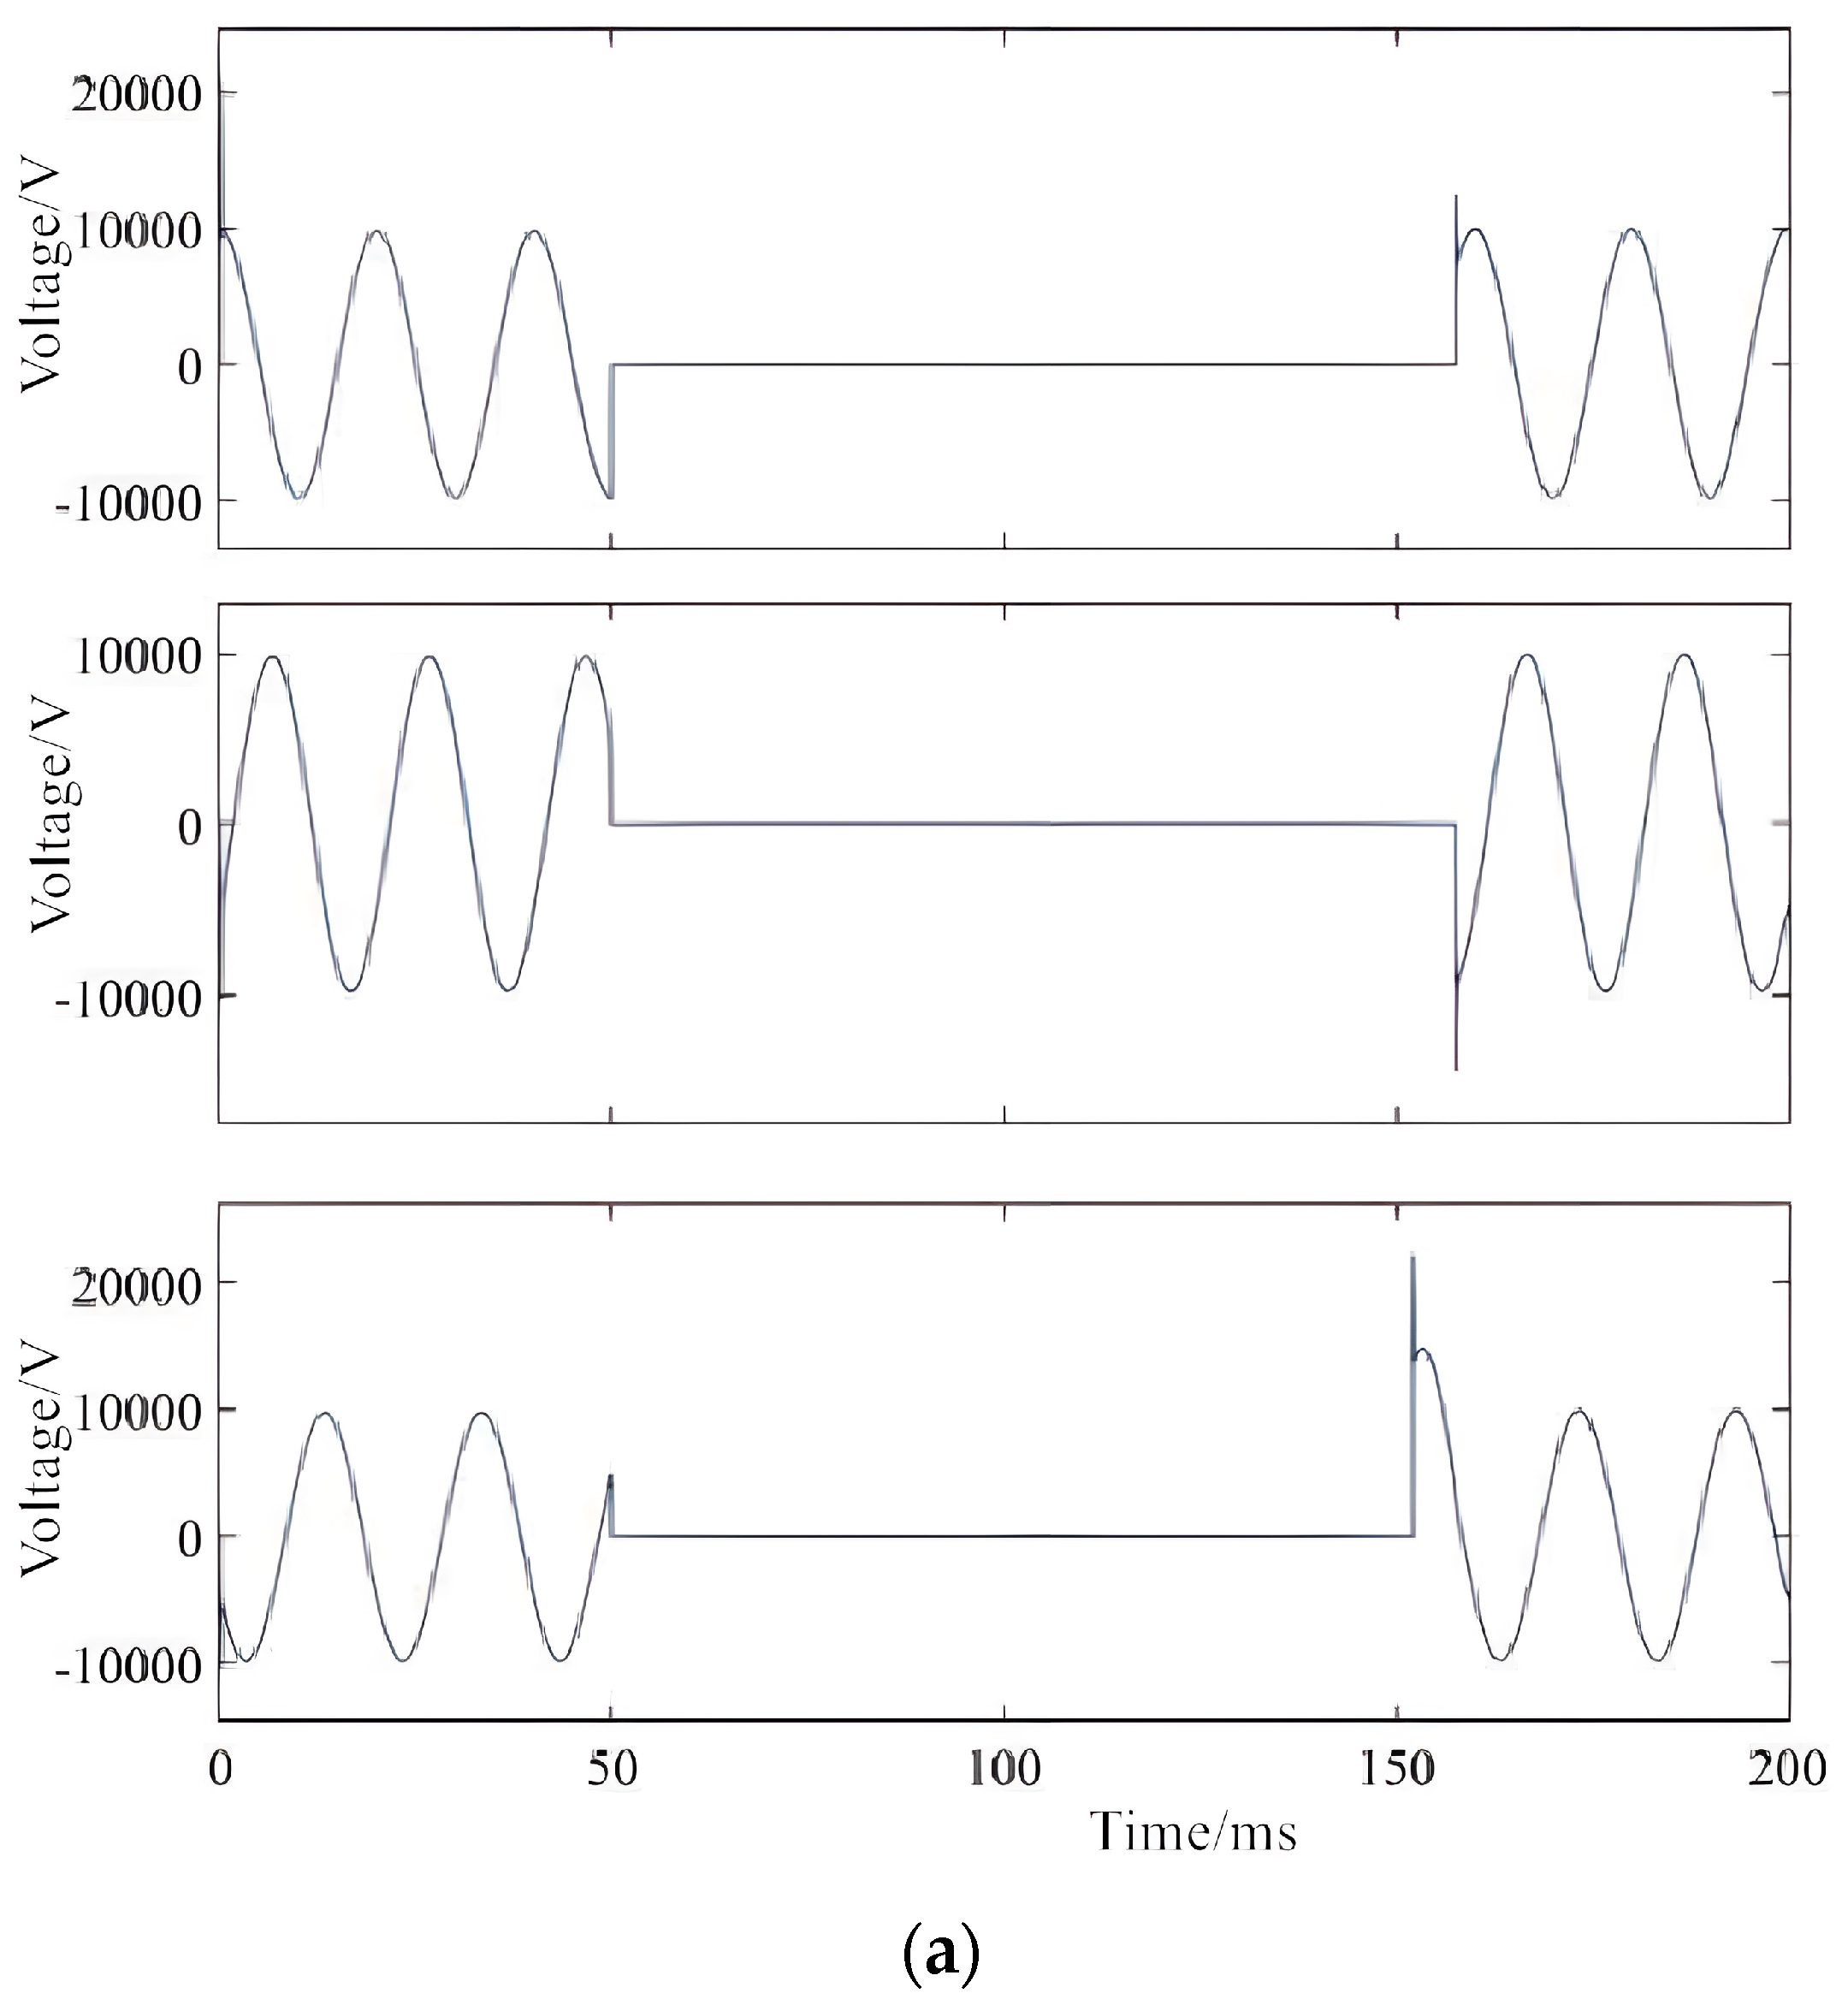
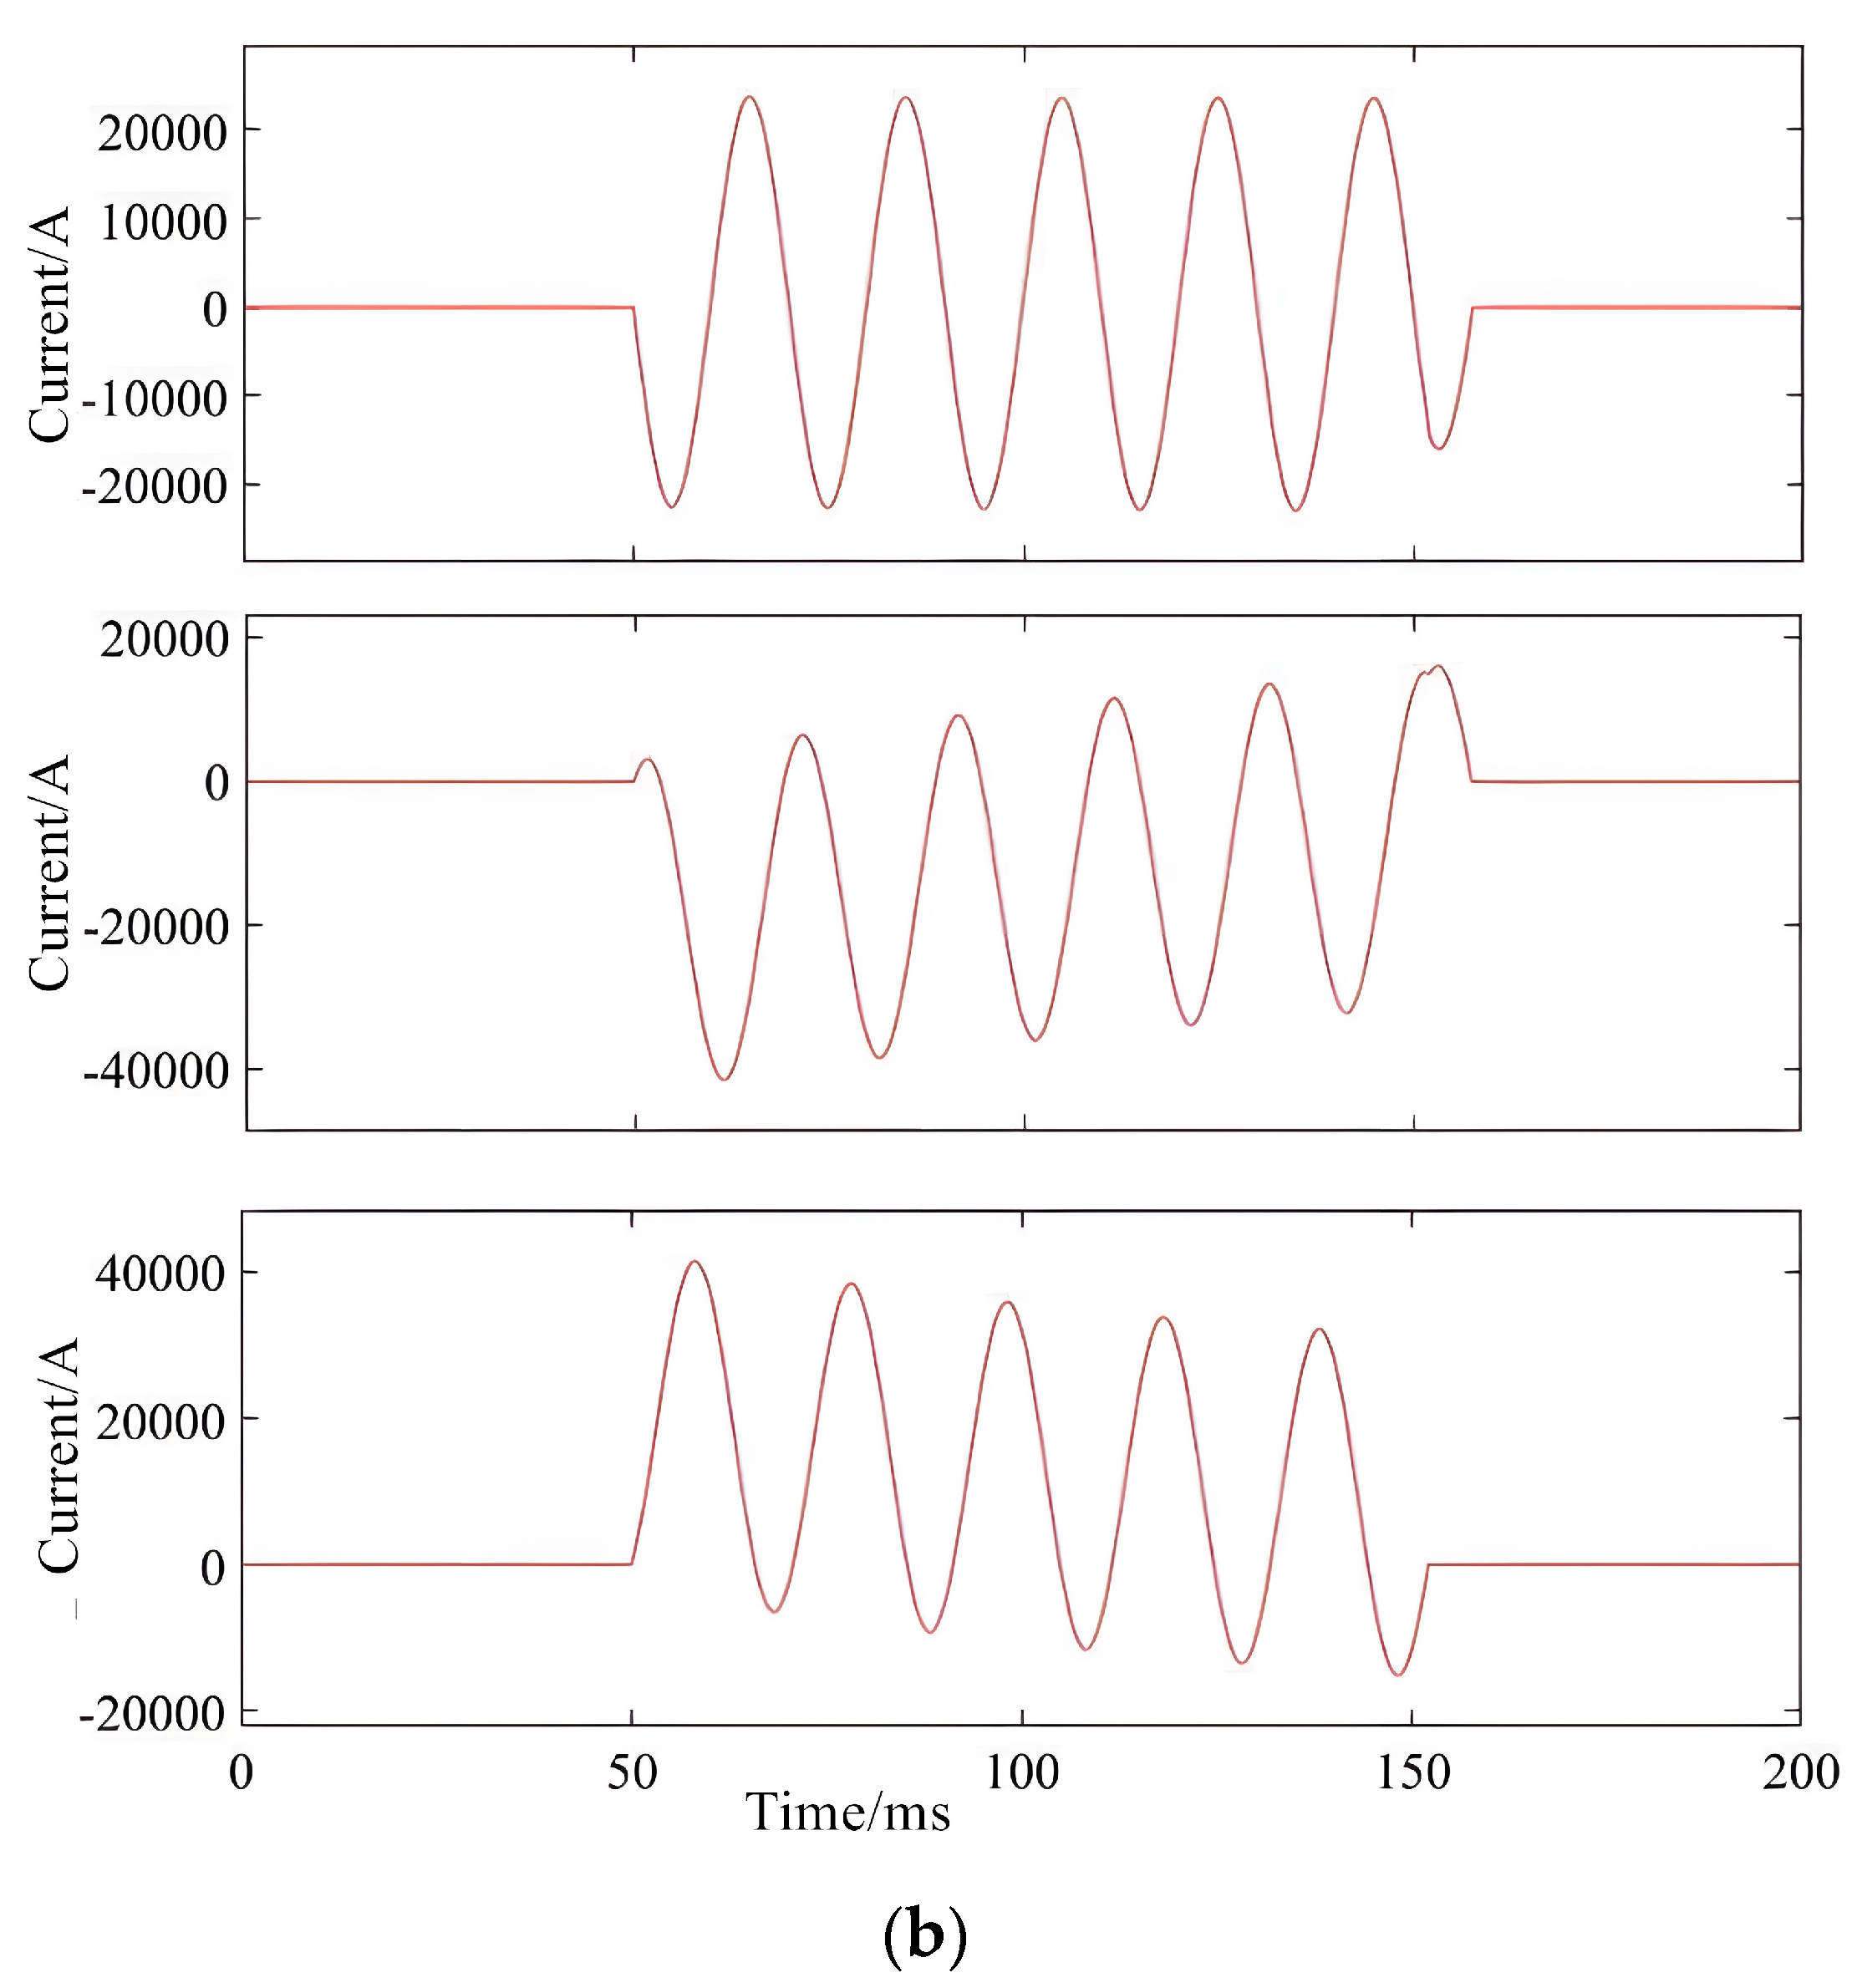
(1)
Verification of short-circuit current simulation
In the high-capacity testing laboratory, a high-capacity testing circuit is built according to the simulation parameters. The parameters are set as follows: the resistance of the power-supply-side circuit is 0.6 Ω, the inductance is 0.0375 H, and for TRV, the resistance is 81 Ω and the capacitance is 26 nF. Based on the above-mentioned parameter circuit, the basic short-circuit test of the T60 test method is carried out for the 12 kV indoor vacuum circuit breaker. The power supply voltage and the voltage across the breaker contacts are shown in Figure 8, and the short-circuit current is shown in Figure 9. The interrupting currents obtained are 19.0 kA, 18.9 kA, and 19.1 kA, and the DC components of the short-circuit current are 7.3%, 2.6%, and 6.9%, respectively. By comparing the current and DC-component parameters, it can be seen that they are lower than the error specified by the standard.
(2)
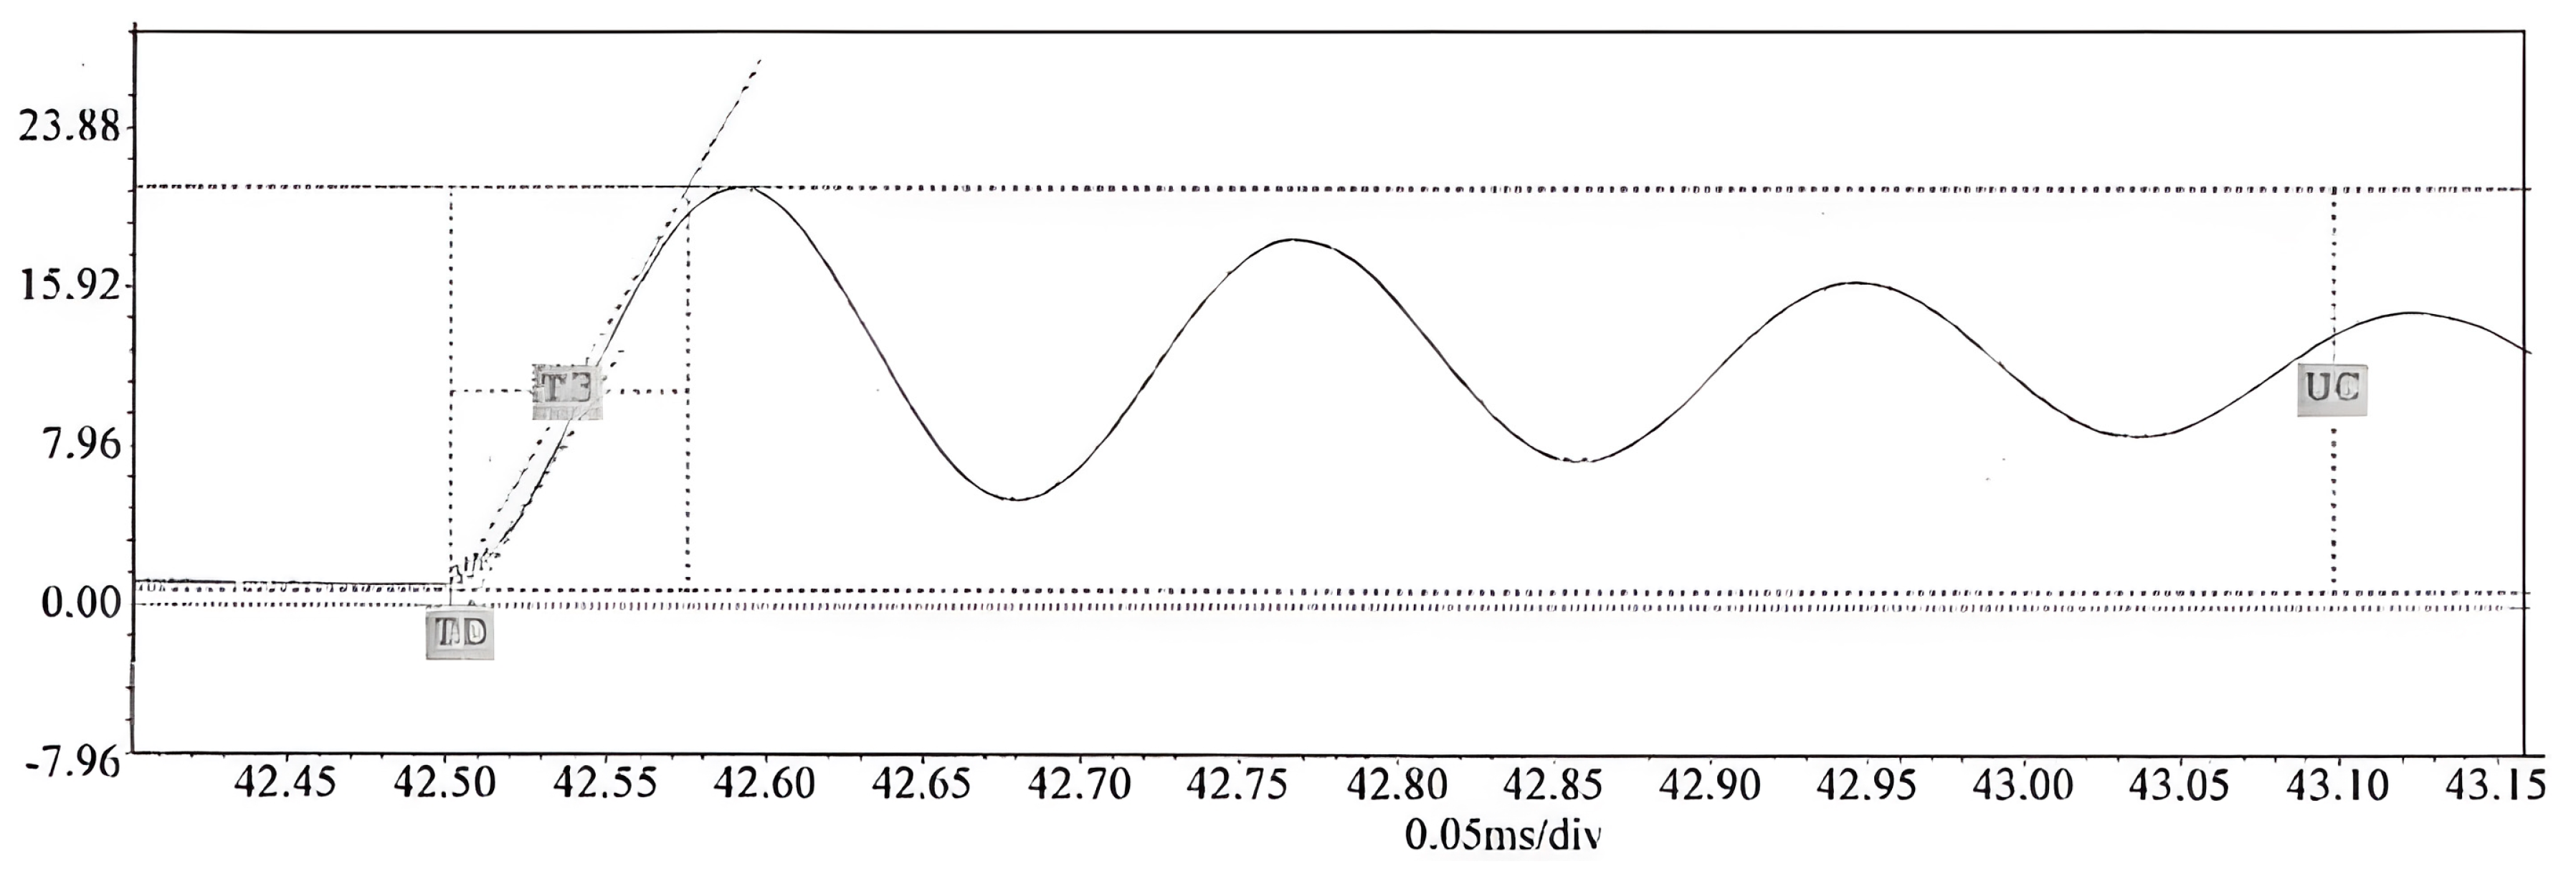
Verification of TRV characteristics
When conducting the basic short-circuit test of the T60 test method for the 12 kV indoor vacuum circuit breaker in the high-capacity testing circuit built, the TRV parameters of the oscillogram in Figure 10 can be obtained, where Uc: 20.6 kV, t3: 26 μs, and td: 4 μs.

2.2.3. Comparison and Discussion

The simulation and test results for both short-circuit testing and TRV characteristics were systematically compared. As shown in Table 3, the TRV parameters obtained from simulations (Uc: 20.2 kV, t3: 23 μs, td: 3 μs) closely align with the test values (Uc: 20.6 kV, t3: 26 μs, td: 4 μs). The minor discrepancies in amplitude and timing (e.g., t3 increased by 13% and td by 33%) fall within the acceptable tolerance range specified by IEC 62271-100:2021, confirming the validity of the simulation model. These deviations may arise from factors such as transient electromagnetic interference, component aging, or slight variations in parameter settings during physical testing.
For short-circuit current analysis (Table 4), the interrupting currents in both simulation and tests were nearly identical (19.0–19.1 kA), demonstrating high consistency. However, the DC component proportions exhibited phase-specific variations. For example, in Phase B, the simulated DC component was 8.3%, while the test value dropped to 2.6%, likely due to differences in arc quenching dynamics or asymmetrical current distribution in the actual test circuit. These results highlight the necessity of incorporating real-world operational variability into simulation models to enhance their predictive accuracy.
The Uc, t3, and td values in Table 3 and Table 4, as well as the DC component errors of the short-circuit current, are assessed according to clause 7.104 of IEC 62271-100:2021 and meet the standard requirements.

3. Test Monitoring Control System

This system uses pneumatic isolation switches and a ring-shaped PROFINET network to achieve electrical isolation between the primary circuit and secondary system, resisting electromagnetic interference. Through PLC control, sequential control technology, and fiber-optic data acquisition, it precisely manages equipment action sequences and closing phase angles, reducing human intervention and ensuring test repeatability. Multi-channel fiber-optic transmission and anti-interference algorithms guarantee high-precision (≥20 MHz) and secure data acquisition for high-voltage (40.5 kV) systems, significantly improving testing efficiency and data reliability.

3.1. Secondary Monitoring and Control

3.1.1. Secondary Signal Monitoring and Control

To achieve electrical isolation between the secondary system and primary circuit during high-capacity testing while eliminating electromagnetic-interference-induced switch malfunctions, the test circuit connection employs valve-island-controlled pneumatic isolation switches. These switches enable remote actuation and feedback of open/closed status signals.
As shown in Figure 11, a PROFINET network integrates valve islands, PLCs, industrial switches, switching devices, the host computer, and HMI touchscreens for real-time data interaction. This network ensures robust communication with multimode optical fiber cabling to enhance anti-interference capabilities and extend transmission distances.
For secondary circuit monitoring and control:
  • PLCs handle digital signal processing (e.g., door status, transformer measurements, breaker operations) and execute control commands (alarms, indicators, switching sequences).
  • HMIs provide an intuitive visualization of analog/digital parameters (e.g., transformer oil temperature) for field personnel.

3.1.2. TRV Device Monitoring and Control

The TRV device contains multiple sets of capacitors and resistors. The capacitors in the TRV device serve to store and release electrical energy, while the resistors limit current and dissipate energy, stabilizing voltage and current during the TRV process. Depending on the actual test requirements, parameters such as Uc of the TRV must meet the specified standards. To achieve this, the values of capacitors and resistors in the TRV need to be adjusted to achieve precise control of the transient voltage process at the ports during high-capacity testing. The adjustment of capacitor and resistor values in the TRV is realized through the opening and closing of small isolating switches, which have feedback signals for their open and closed states and are pneumatically controlled via PLC, as shown in Figure 11.

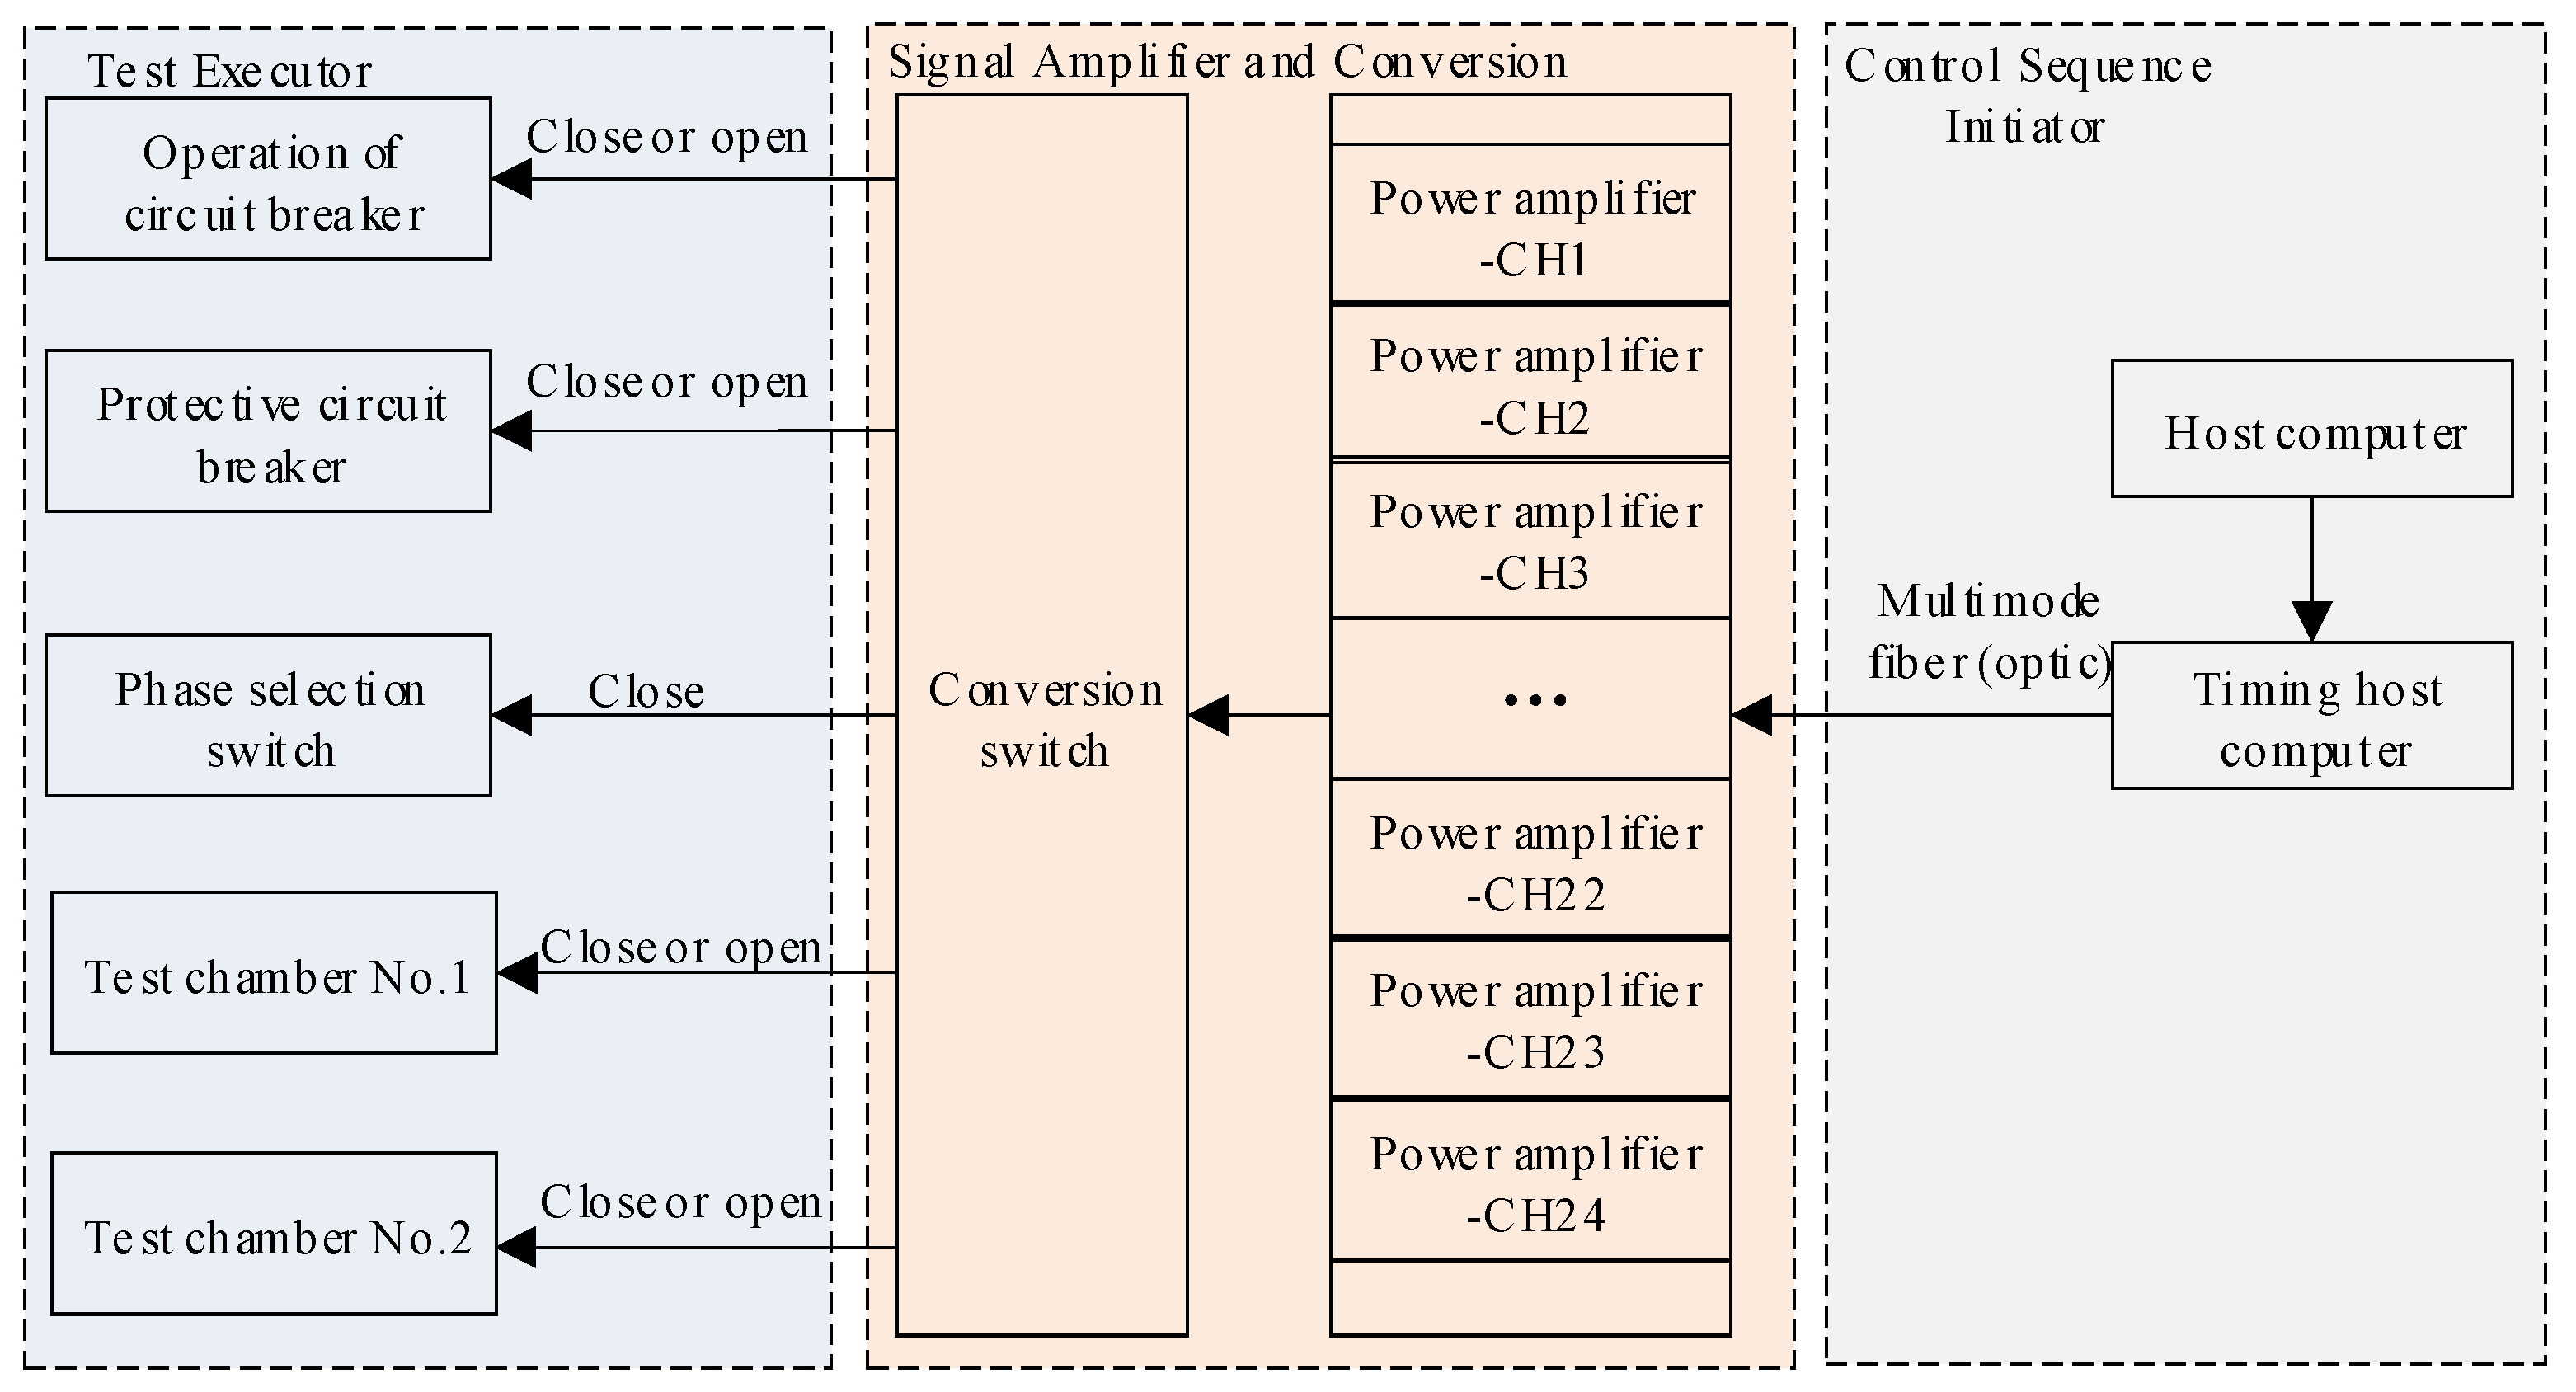
3.1.3. Sequential Control

Sequential control is a crucial technology to ensure that each step in high-capacity testing proceeds correctly and orderly. It controls the sequential actions of circuit breakers and other devices in the test circuit and accurately selects the closing phase angle, enabling automated operation of circuit breakers, switches, test samples, and data acquisition, thereby reducing human intervention and improving the repeatability and consistency of tests. Through rigorous sequential control, tests conducted at different times or by different operators can be highly repeatable. As shown in Figure 12, during testing, the upper computer sets the control sequence and time interval length for circuit breakers, switches, and test samples on the timing host. The power amplifier amplifies the control signal power. When the sequential control system is activated, it sends control signals in chronological order to control the actions of circuit breakers, switches, and test samples, completing the high-capacity testing.

3.2. Test Data Acquisition System

The test data acquisition system is designed to efficiently and accurately collect and analyze various data during high-capacity testing, including parameters such as voltage, current, and switch travel. The system features high sampling rates, high precision, and multi-channel input capabilities, meeting the requirements for precise measurement of multiple parameters in high-capacity testing.

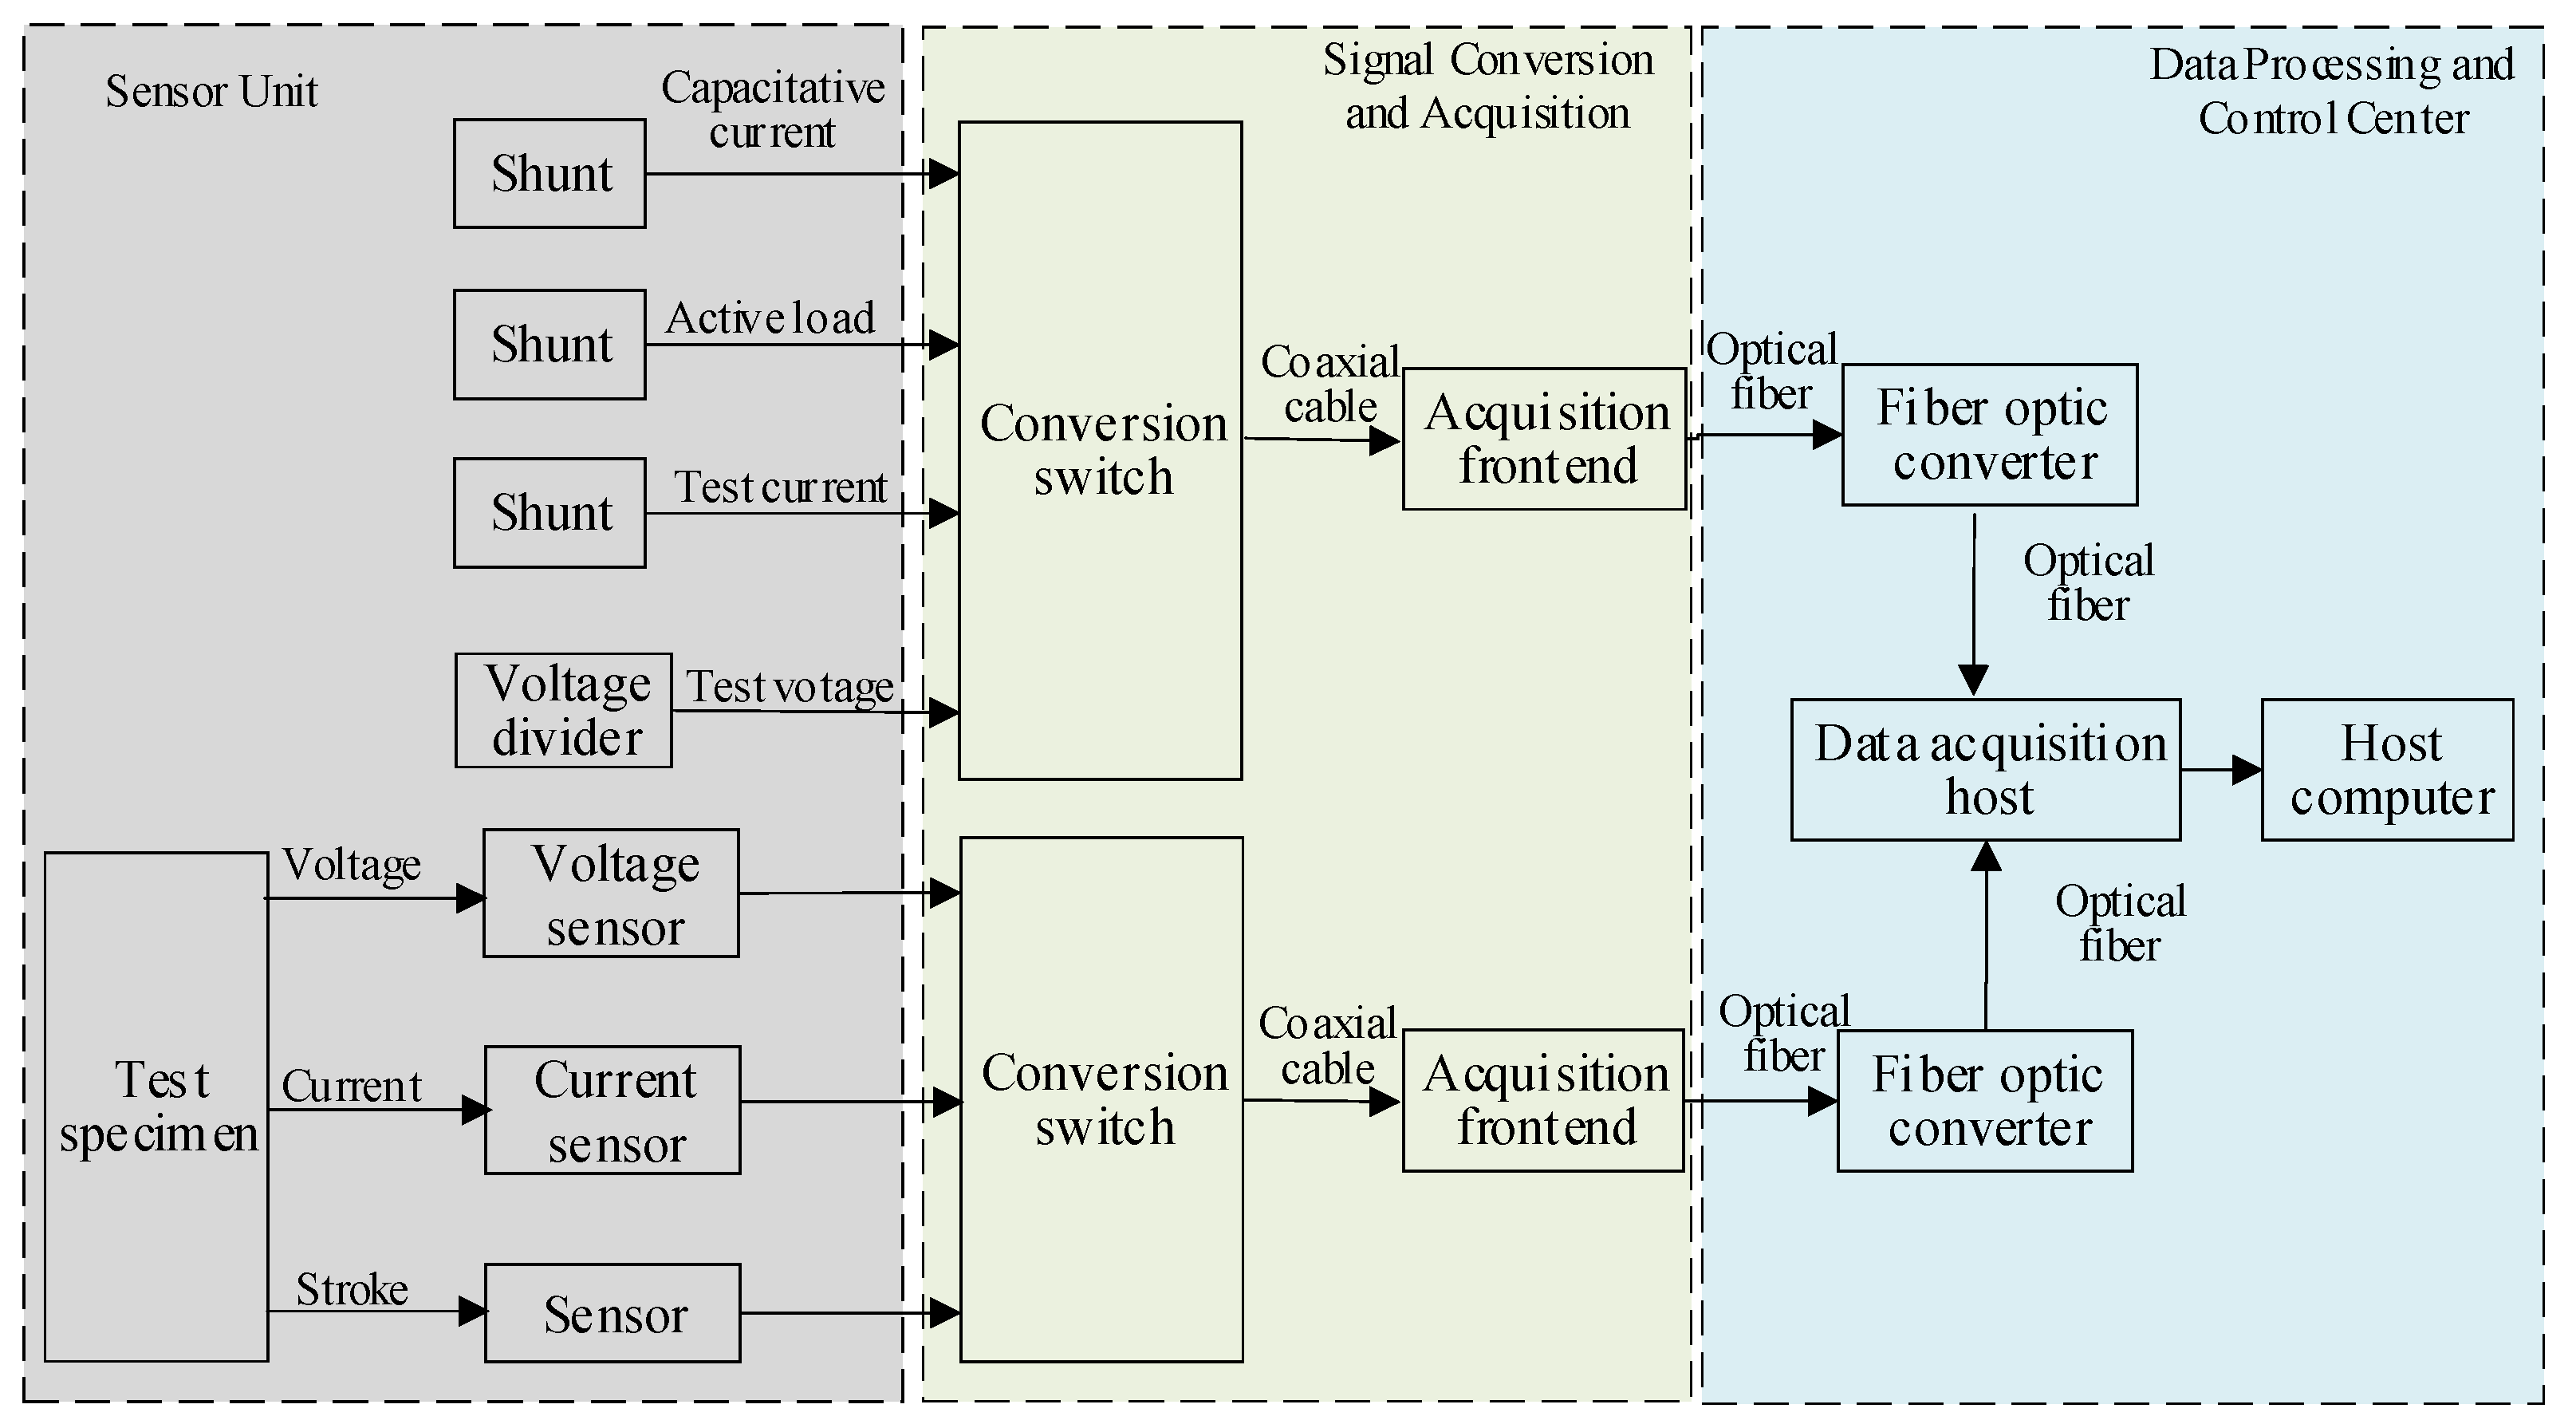
3.2.1. System Composition

The system includes voltage sensors, current sensors, and switch travel sensors, which are used to collect test data in real-time. It is responsible for converting analog signals collected by sensors into digital signals. It is used for storing and preliminarily processing the collected data. It provides functions for data storage, transmission, analysis, and processing.

3.2.2. System Functions

The system supports high sampling rates (≥20 MHz), ensuring the accuracy and reliability of the data. It supports multi-channel input, enabling the simultaneous collection of data from multiple parameters. Data transmission is carried out via multimode optical fibers, reducing electromagnetic interference and ensuring the stability and security of the data.

3.2.3. System Advantages

The system incorporates anti-interference algorithms to effectively reduce electromagnetic interference and ensure the accuracy of data collection. Voltage isolation is achieved through reasonable sensor selection and connection optimization, ensuring personnel safety. The system can rapidly process large amounts of data, providing real-time analysis and processing capabilities to support quick decision making.

3.2.4. System Integration

Figure 13 shows the hierarchical architecture of the high-voltage test data acquisition system. Data transmission is carried out via multimode optical fibers, reducing electromagnetic interference and ensuring the stability and security of the data. The data acquisition front-end and front-end transfer cabinet are located in the test sample room, while the data acquisition host and PC host computer are centrally located in a remote control room, with data transmission via multimode optical fibers.

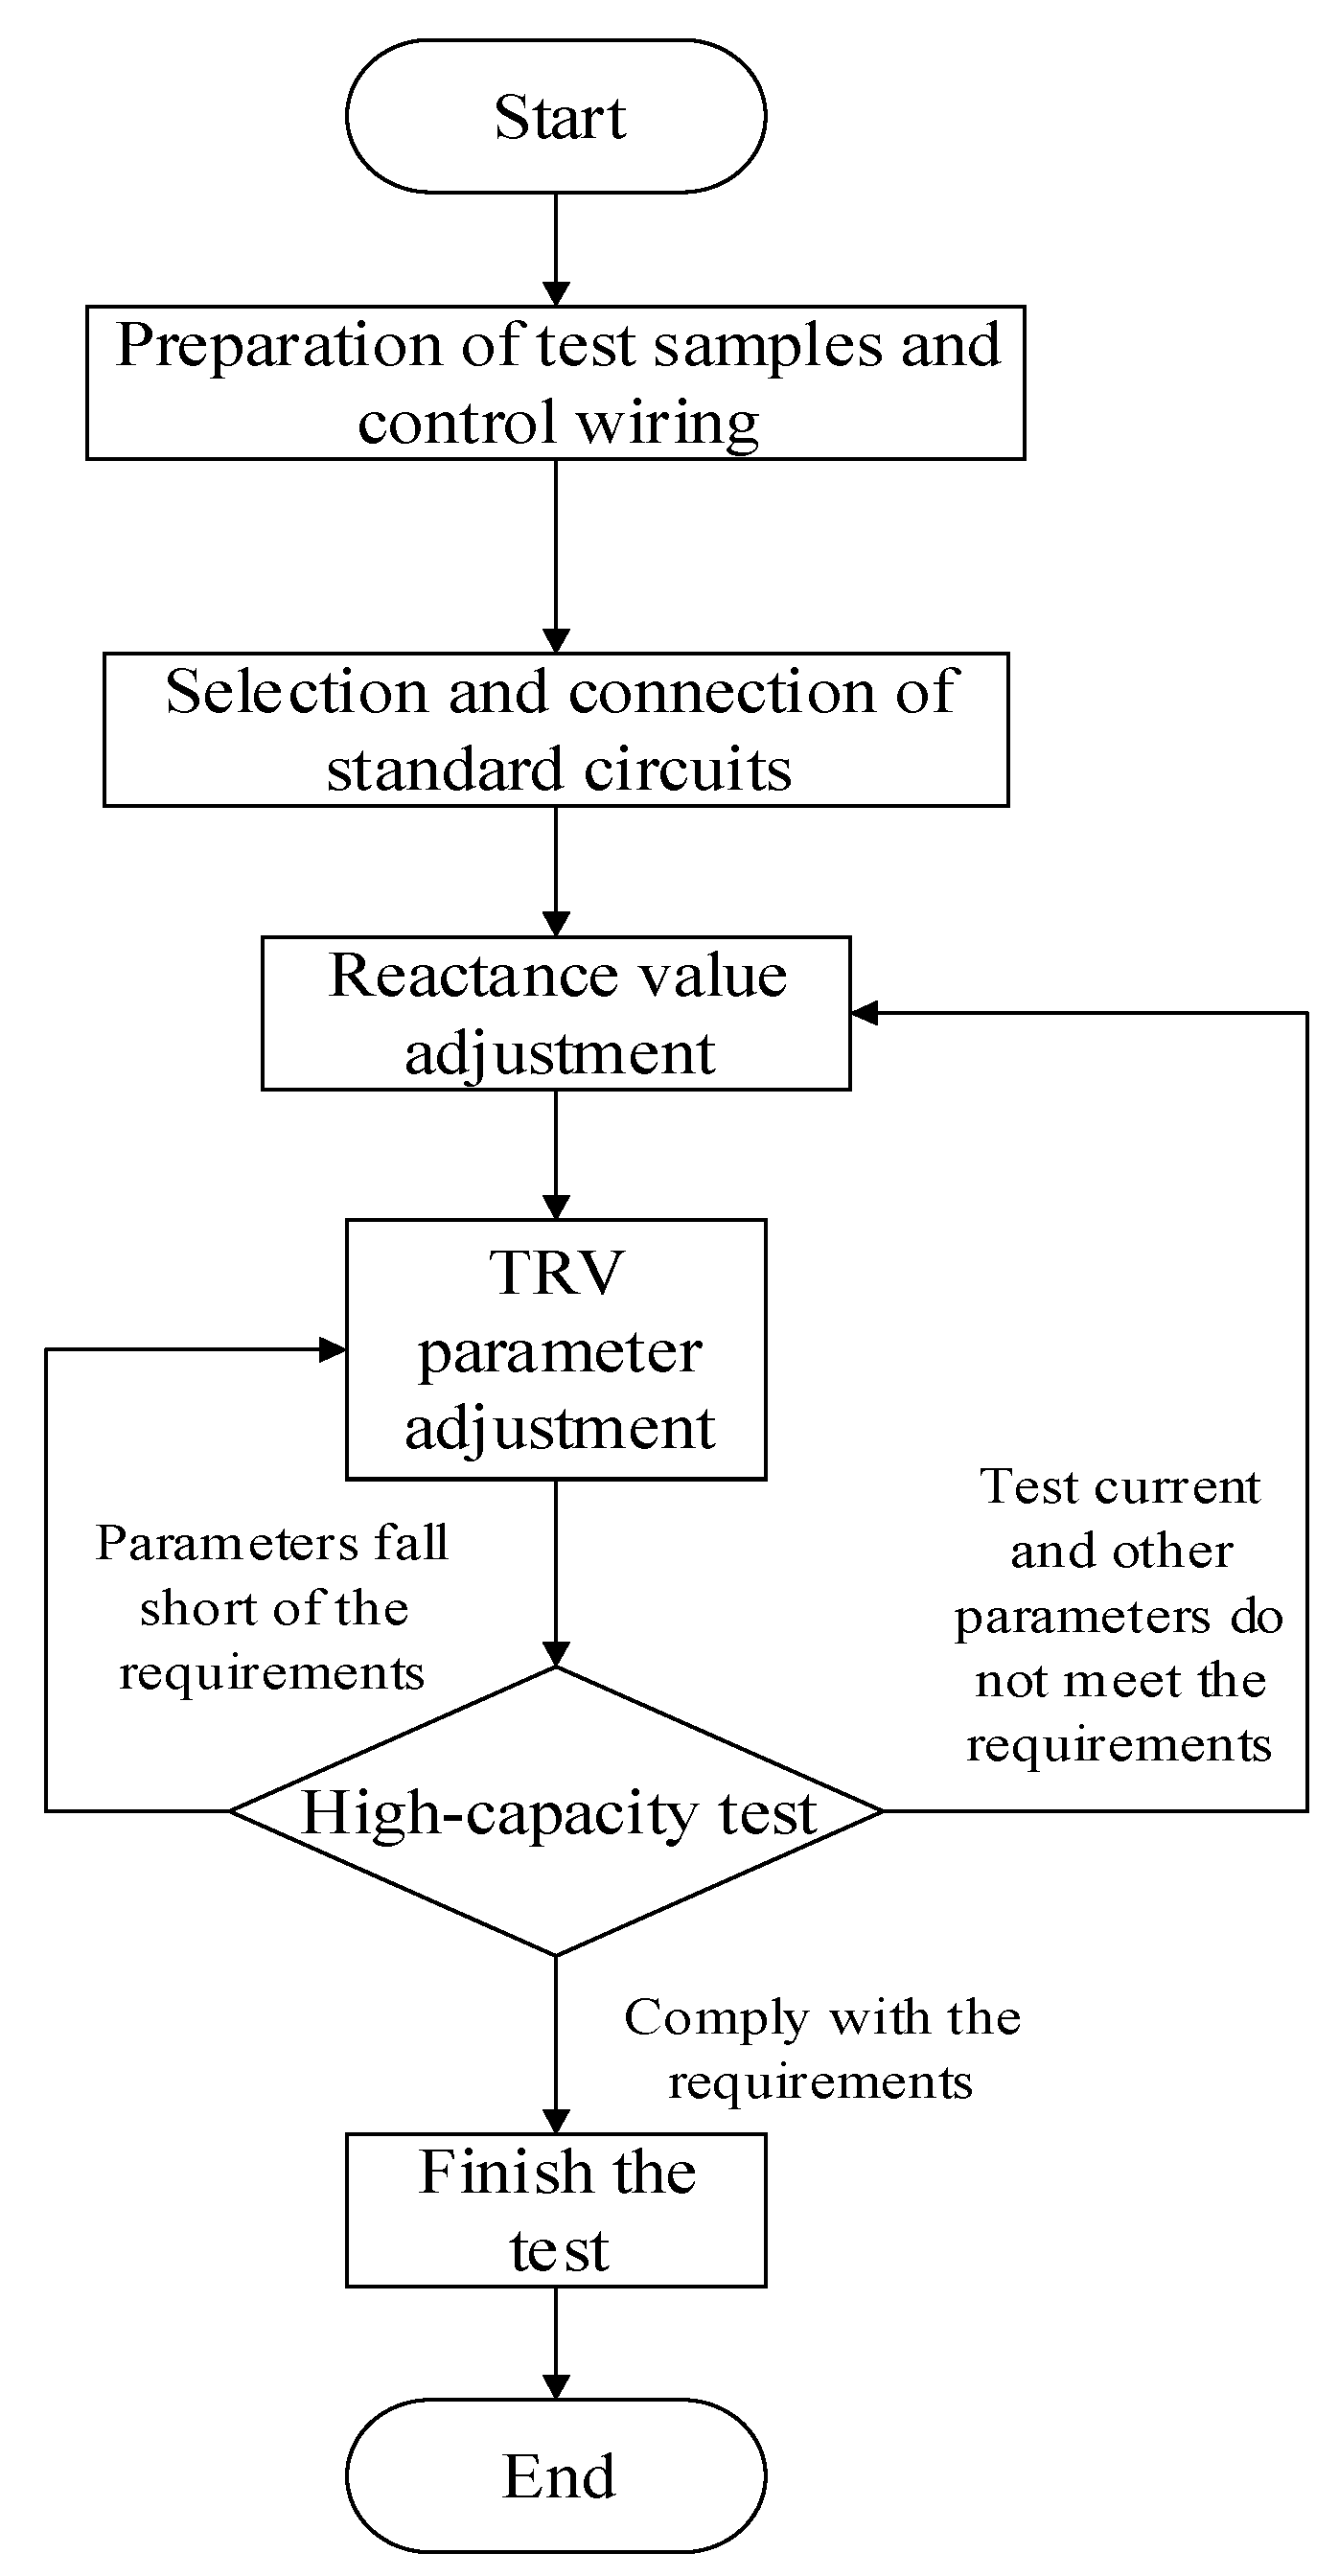
4. High-Capacity Testing Process Control

The process control of high-capacity testing is a complex and critical procedure involving multiple stages and steps to ensure the smooth execution of the test and the accuracy of the results. Specific workflow details are shown in Figure 14. Through this structured process control, each step of the high-capacity testing can be carried out in sequence, thereby improving the efficiency of the test and the reliability of the results.

5. Conclusions

This paper systematically investigates the primary test circuit and its measurement and control system scheme for a high-capacity testing system based on network power, and draws the following conclusions:
(1).
Standardization of test circuits
Through the analysis of the constructed test circuit, a standardization method for test circuits is proposed. The feasibility and accuracy of this method are validated using MATLAB simulation technology. The circuit configurations for different types of tests are standardized, and key circuit parameters are determined through simulation. This provides a reference for the standardization of test procedures.
(2).
Automation of test monitoring and control systems
The automated design of the test monitoring and control system, including test data acquisition, signal monitoring, and control schemes, achieves full-process automated control for high-capacity testing. By integrating PLCs, valve islands, coaxial cables, and optical fibers, the system effectively mitigates interference from complex electromagnetic environments on the monitoring and control systems. It also isolates high-voltage intrusion into the test monitoring and control systems during test failures, significantly enhancing the efficiency, reliability, and safety of the tests.
(3).
Practitioners implement standard frameworks
Practitioners can drive iterative framework improvements by accessing the pre-configured parameter calculation and risk assessment modules in the GitHub 23.07.180256 open-source repository (https://github.com/cgpcx/Github, accessed on 6 March 2025), and submitting localized enhancement proposals through industry conferences.

Author Contributions

Conceptualization, G.C.; formal analysis, J.W.; funding acquisition, G.C.; methodology, G.C.; project administration, G.C.; resources, Y.L. (Yong Li) and Y.L. (Yuan Luo); software, H.C.; supervision, Y.L. (Yuan Luo); writing—review and editing, G.C. All authors will be updated in each stage of manuscript processing, including submission, revision, and revision reminder, via emails from our system or the assigned Assistant Editor. All authors have read and agreed to the published version of the manuscript.

Funding

Gansu Province, Tianshui city science and technology support plan project: “Research and application of sequential control technology for high and low voltage switch short-circuit testing system”, project number: ts-stk-2024a-282, funded by the Tianshui municipal government.

Institutional Review Board Statement

Not applicable.

Informed Consent Statement

Not applicable.

Data Availability Statement

Data are contained within the article.

Conflicts of Interest

The authors declare no conflicts of interest. The funders had no role in the design of the study; in the collection, analyses, or interpretation of the data; in the writing of the manuscript; or in the decision to publish the results.

References

  1. Bing, J. Building a new power system for 30·60 goals: Thoughts on China’s power 4.0. Glob. Energy Interconnect. 2021, 4, 534–541. [Google Scholar]
  2. Voropai, N.; Podkovalnikov, S.; Chudinova, L. The evolution of interstate power grid formation. Glob. Energy Interconnect. 2021, 4, 335–353. [Google Scholar] [CrossRef]
  3. Sheng, G.H.; Qian, Y.; Luo, L.G.; Song, H.; Liu, Y.; Jiang, X. Key technologies and application prospects for operation and maintenance of power equipment in new power systems. High Volt. Eng. 2021, 47, 3072–3084. [Google Scholar]
  4. Chen, J.; Wang, Y.; Huang, H.; Liu, J. Application research on live detection of partial discharge in 10kV switchgear based on multi-dimensional diagnosis technology. Distrib. Util. 2016, 33, 64–68. [Google Scholar]
  5. Li, L. Application of intelligent monitoring and automation technology in power systems. Electron. Technol. 2024, 53, 328–329. [Google Scholar]
  6. Falcone, P.M. Sustainable energy policies in developing countries: A review of challenges and opportunities. Energies 2023, 16, 6682. [Google Scholar] [CrossRef]
  7. Zhang, Q.; Wei, L.; Su, W.; Li, H.; Wang, L. Commissioning of intelligent switchgear based on IEC61850 message simulation and analysis technology. High Volt. Appar. 2014, 50, 91–95, 101. [Google Scholar]
  8. Li, G.; Yao, S.L.; Du, W.; Sun, M.; Cheng, Y.; Wang, P.R.; Wang, C.J. Research on the capacity test circuit of uhv circuit breakers. High Volt. Appar. 2013, 49, 6–11. [Google Scholar]
  9. Dai, Q.; Ma, S.Q.; Ye, H.P.; Li, S.; Sun, S.H.; Wang, W. Current status and development trends of on-line insulation monitoring technology for high-voltage switchgear. High Volt. Appar. 2023, 59, 1–11. [Google Scholar]
  10. Zhen, J.Y.; Ding, Z.D.; Teng, C.L.; Gong, R.F.; Sun, P.H.; Zhang, Y. Caculation and analysis of influence of impact load from low voltage apparatus test station with large-capacity on power system. Low Volt. Appar. 2011, 19, 6–9. [Google Scholar]
  11. Kang, Z. Design of control system for high-voltage high-capacity laboratory. Electr. Eng. Electron. 2017, 11, 74–76. [Google Scholar]
  12. Dai, J.Z.; Zhang, S.C.; Shen, J.M.; Tao, C.C.; Tao, J.G.; Chen, Y.T.; Wu, X.; Wu, Y.F. Research on modeling method and one-click sequential control scheme for high-capacity test system. Glob. Energy Interconnect. 2023, 6, 660–669. [Google Scholar]
  13. Chen, H.; Lin, J.; Luo, Y. Research on synchronous control system for synthetic testing. Electr. Drive Autom. 2017, 39, 56–58. [Google Scholar]
  14. Li, G.; Gao, X.X.; Liu, H.J.; Huang, S.; Zhang, J.B.; Dong, W. High power short-circuit breaking and making tests technique of the high voltage AC circuit breakers. High Volt. Appar. 2018, 54, 69–75. [Google Scholar]
  15. Wang, Y.; Zhang, J.; Pan, C.; Yuan, X.; Wu, X.; Zhu, Y.; Jing, R.; Wang, Z.; Kang, L. Review of research on multi-dimensional performance evaluation indexes for integrated smart energy. Glob. Energy Interconnect. 2021, 4, 207–225. [Google Scholar]
  16. Chen, G.P.; Guo, W.K. Application of valve island technology in high-voltage high-capacity laboratory. Autom. Instrum. 2015, 36, 33–36. [Google Scholar]
  17. Wu, Z.Y.; Hu, J.T.; Zhou, Z.F.; Xing, W.T. Operational Impacts and Accident Analysis of High-Capacity High-Current Switch Test Stations. Electr. Appl. 2017, 36, 74–79. [Google Scholar]
  18. Gao, X.X.; Ji, X.Z.; Ma, J.; Liu, H.J.; Huang, S.; Dong, W.; Wang, W. Analysis and discussion on short-circuit test procedures for high-capacity generator circuit breakers. High Volt. Appar. 2017, 53, 172–177. [Google Scholar]
  19. Bai, Y.; Li, P.; Guan, Y.; Fang, C.; Guo, J.; Wang, Z.; Quan, H. Research on TRV breaking characteristics and suppression measures of high-capacity generator circuit breakers. High Volt. Appar. 2024, 60, 92–100. [Google Scholar]
  20. Liu, Z.; Zhao, Q.B.; Huang, S.; Yuan, J. Brief overview of the control system in high power laboratories. High Volt. Appar. 2018, 54, 237–241. [Google Scholar]
  21. Cao, L.; Zhu, X.; Wang, S. Research of computer aided analysis system in high power Lab. High Volt. Appar. 2002, 2, 32–34. [Google Scholar]
  22. Chen, G.P.; Guo, W.K. Development of control system for impulse generator set based on s7-300. Electr. Autom. 2015, 37, 87–89. [Google Scholar]
  23. Jiang, Z.Y.; Yan, D.F.; Wang, P.R.; Liu, P.; Zhe, Y.X. Research on High power test circuit for 550 kV/80 kA circuit-breaker. High Volt. Appar. 2023, 59, 200–206. [Google Scholar]
  24. IEC 62271-103:2011; High-Voltage Switchgear and Controlgear—Part 103: Switches for Rated Voltages Above 1 kV up to and Including 52 kV. International Electrotechnical Commission: Geneva, Switzerland, 2011.
  25. IEC 62271-100:2021; High-Voltage Switchgear and Controlgear—Part 100: Alternating-Current Circuit-Breakers. International Electrotechnical Commission: Geneva, Switzerland, 2021.
  26. Huang, S.; Gao, X.X.; Liu, H.J.; Yao, S.L.; Dong, W.; Li, G.; Hu, X. Calculation of current zero di/dt and trv peak uc for asymmetric current interruption test t100a. High Volt. Appar. 2015, 51, 163–167. [Google Scholar]
  27. Zhou, X.M.; Lin, Z.L.; Liu, C.X.; Miao, B.J.; He, D.S. Calculation of the envelope of transient recovery voltage waveform using the successive approximation method. High Volt. Appar. 2018, 54, 159–163. [Google Scholar]
Figure 3. Active load and capacitive load.
Sustainability 17 03679 g003
Figure 4. Standardization process flowchart for test circuits based on parameter library and automated configuration.
Sustainability 17 03679 g004
Figure 5. Simulation model of high-capacity experimental system.
Sustainability 17 03679 g005
Figure 6. Simulation diagram of short-circuit test for indoor high-voltage vacuum circuit breaker: (a) waveform diagram of power supply voltage and circuit breaker voltage; (b) waveform diagram of short-circuit current.
Sustainability 17 03679 g006aSustainability 17 03679 g006b
Figure 7. Simulation diagram of TRV waveform for indoor high-voltage vacuum circuit breaker.
Sustainability 17 03679 g007
Figure 8. A voltage oscilloscope diagram of the basic short-circuit T60 test method for an indoor vacuum circuit breaker in actual testing.
Sustainability 17 03679 g008
Figure 9. A current oscilloscope diagram of the basic short-circuit T60 test method for an indoor vacuum circuit breaker in actual testing.
Sustainability 17 03679 g009
Figure 10. Oscilloscope diagram of TRV for indoor high-voltage vacuum circuit breaker in actual testing.
Sustainability 17 03679 g010
Figure 11. Topology of test circuit control and TRV device monitoring system based on ring-shaped PROFINET network.
Sustainability 17 03679 g011
Figure 12. Block diagram of sequential control principle for automated high-capacity testing.
Sustainability 17 03679 g012
Figure 13. Hierarchical architecture of high-voltage test data acquisition system.
Sustainability 17 03679 g013
Figure 14. Flowchart of full-process automated control for high-capacity testing.
Sustainability 17 03679 g014
Table 1. Short-circuit transformer parameters.
No.Technical ParameterNumerical Value
1Voltage ratio330/(2 × 60 + 2 × 12.5) kV
2Rated capacity8000 kVA
3Impedance voltage (Uk)0.4%
4Rated primary-side voltage330 kV
5Rated secondary-side voltage12 kV; 24 kV; 40.5 kV
6Maximum short-circuit capacity1828 MVA
Table 2. Comparison between traditional and standardized methods.
No.Comparison ItemTraditional MethodStandardized Method
1Parameter ConfigurationManual configuration of circuit parameters leads to inconsistent results.Automated configuration using predefined parameter libraries ensures uniformity and consistent results.
2Process OptimizationComplex testing processes with multiple steps result in low efficiency.Optimized processes through simulation and experimentation improve efficiency and consistency.
3Testing EfficiencyLow testing efficiency with poor repeatability and significant human intervention.Automated processes significantly enhance testing efficiency and repeatability.
4Data ReliabilityLow data reliability due to manual operation errors.Automated data acquisition and analysis ensure high accuracy and reliability.
5Resource ConsumptionHigh resource consumption requiring significant human and material inputs.Reduced resource consumption through automated processes.
6Environmental AdaptabilityUnstable performance in complex electromagnetic environments.Stable performance and strong anti-interference capabilities in complex electromagnetic environments.
Table 3. TRV parameters for the T60 testing method of indoor vacuum circuit breakers.
Uct3td
Simulation results20.2 kV23 μs3 μs
Test results20.6 kV26 μs4 μs
Table 4. Short-circuit current parameters for the T60 testing method of indoor vacuum circuit breakers.
Phase A CurrentPhase B CurrentPhase C CurrentProportion of DC Component in Phase A CurrentProportion of DC Component in Phase B CurrentProportion of DC Component in Phase C Current
19.0 kA18.9 kA19.1 kA3.1%8.3%5.2%
19.0 kA18.9 kA19.1 kA7.3%2.6%6.9%
Disclaimer/Publisher’s Note: The statements, opinions and data contained in all publications are solely those of the individual author(s) and contributor(s) and not of MDPI and/or the editor(s). MDPI and/or the editor(s) disclaim responsibility for any injury to people or property resulting from any ideas, methods, instructions or products referred to in the content.

