Article

Global Climate Risk Perception and Its Dynamic Impact on the Clean Energy Market: New Evidence from Contemporaneous and Lagged R2 Decomposition Connectivity Approaches

1
School of Economics & Management, Changsha University of Science & Technology, Changsha 410114, China
2
Economic College, Hunan Agricultural University, Changsha 410125, China
*
Author to whom correspondence should be addressed.
Sustainability 2025, 17(8), 3596; https://doi.org/10.3390/su17083596
Submission received: 28 February 2025 / Revised: 11 April 2025 / Accepted: 13 April 2025 / Published: 16 April 2025

Abstract

:
The acceleration of global climate change presents unprecedented challenges to market stability and sustainable social development. Understanding how market dynamics are impacted by perceptions of climate risk is essential to creating risk management plans that work. Current research frequently concentrates on static evaluations of how climate risk is perceived, ignoring its dynamic influence on clean energy markets and the intricate channels via which these risks spread. To examine the dynamic influence of climate risk perceptions on clean energy markets, this study builds a spillover network model. We determine the main risk transmission pathways and their temporal variations by looking at changes in market connection over time. Our results demonstrate that climate risk perceptions have a substantial direct and indirect impact on the volatility of clean energy markets. Specifically, the ‘Risk Concern Index (GCTC and GCPC) → Clean Energy Market Index → Climate Policy Uncertainty Index (CPU) → Risk Indices (GCTRI and GCPRI)’ pathway highlights how public and policymaker concerns about climate risk significantly influence market behavior and overall dynamics. Furthermore, the dynamic analysis demonstrates that market spillovers are significantly amplified by economic and geopolitical events, highlighting the necessity of taking external shocks into account when designing policies. This study offers fresh perspectives on how climate risk perception affects clean energy markets, serves as a useful resource for investors and policymakers, and encourages the creation of robust risk management plans and market mechanisms.

1. Introduction

The impact of climate change, one of the most challenging issues of the twenty-first century, has reached all socio-economic levels and poses a major threat to the stability of financial markets and the quality of human life. According to the Intergovernmental Panel on Climate Change’s (IPCC’s) most recent report, global temperatures could rise by 3.2 °C by the end of the century, even with extensive carbon reduction measures [1]. The pace of industrialization has significantly enriched nations, but it has also contributed to a surge in greenhouse gas emissions. The implications of these emissions, such as rising sea levels and an increase in extreme weather events, as well as ecosystem imbalances, constitute a serious challenge to the global economy and the sustainable development of human communities [2].
From a socioeconomic standpoint, addressing climate change has emerged as a major issue that nations everywhere must take immediate action to resolve. The market for clean energy is essential to this process because it propels the shift to a low-carbon, sustainable economy [3]. Changes in global climate risk perceptions are profoundly reshaping the clean energy market landscape. The shift in public and policymaker perceptions of climate risk is a key driver of the clean energy market transformation. Take the bias theory in behavioral economics as an example [4]. Research shows that individuals may have a variety of cognitive biases, such as representativeness bias or overconfidence when confronted with hazards. These biases typically have a direct impact on investors’ decision making in the clean energy market. Risk perception theory in environmental psychology further explains how individuals perceive climate risk and translate this perception into actual social behaviors, such as adjusting consumption patterns or supporting specific policy directions [5]. These theories provide solid theoretical underpinnings for understanding how climate risk perceptions influence investment decisions in the clean energy market.
On the other hand, international agreements reflect a global consensus and the commitment of countries around the globe to address climate change. This has been the case since 1992, when the United Nations Framework Convention on Climate Change first established a framework for international cooperation to address global warming [6]. The 1997 Kyoto Protocol legally bound participating countries to reduce greenhouse gas emissions. To achieve net-zero global emissions in the second half of the century [7], the 2015 Paris Agreement aimed to reduce global temperatures to below 2 °C above pre-industrial levels by the year 2100 [8]. In 2018, the implementation guidelines of the Paris Agreement were officially adopted, clarifying corresponding measures from supervision mechanisms, financial support, technological development, and support [9]. These established international agreements provide a policy framework for this study, which aims to quantify the impact of climate risk perception on the clean energy market, particularly its spillover effects on asset pricing, and explore its potential implications for policymaking and investment strategies.
The existing literature has quantified climate risk perception and explored its relationship with financial markets, underscoring the importance of understanding the economic and financial impacts of climate change on investment decisions and policy formulation in the clean energy industry [10,11]. However, there is still a dearth of relevant studies focusing on clean energy markets, and the existing literature often fails to fully analyze the specific mechanisms of spillover dynamics between climate risk perceptions and market returns. As a result, this study investigates the contagion pathways through which shifts in perceptions of climate risk impact the volatility of the clean energy market. It also examines the distinct reactions of various clean energy markets to climate change and the consequences of this heterogeneous relationship for policies about clean energy investments. Our specific research questions include: How do changes in climate risk perceptions affect the contagion pathways of clean energy market volatility? Do different clean energy markets respond differently to climate change? And what does this heterogeneous relationship imply for policies related to clean energy investments?
The present study employs the R2 decomposition framework to capture the multidimensional nature of climate risk perceptions and their spillover effects on clean energy markets. By combining this approach with a spillover network model, we analyze the transmission paths between climate risk perceptions and market dynamics. Specifically, we examine how policy adjustments influence financial flows and market volatility in clean energy sectors across different periods. This methodological approach facilitates the analysis of the immediate and lagged effects of policy changes, thereby providing insights into market responses and the efficacy of interventions. Unlike traditional vector autoregression (VAR) models, R2 decomposition offers a more precise visualization of how climate risk perceptions drive market connectivity over time.
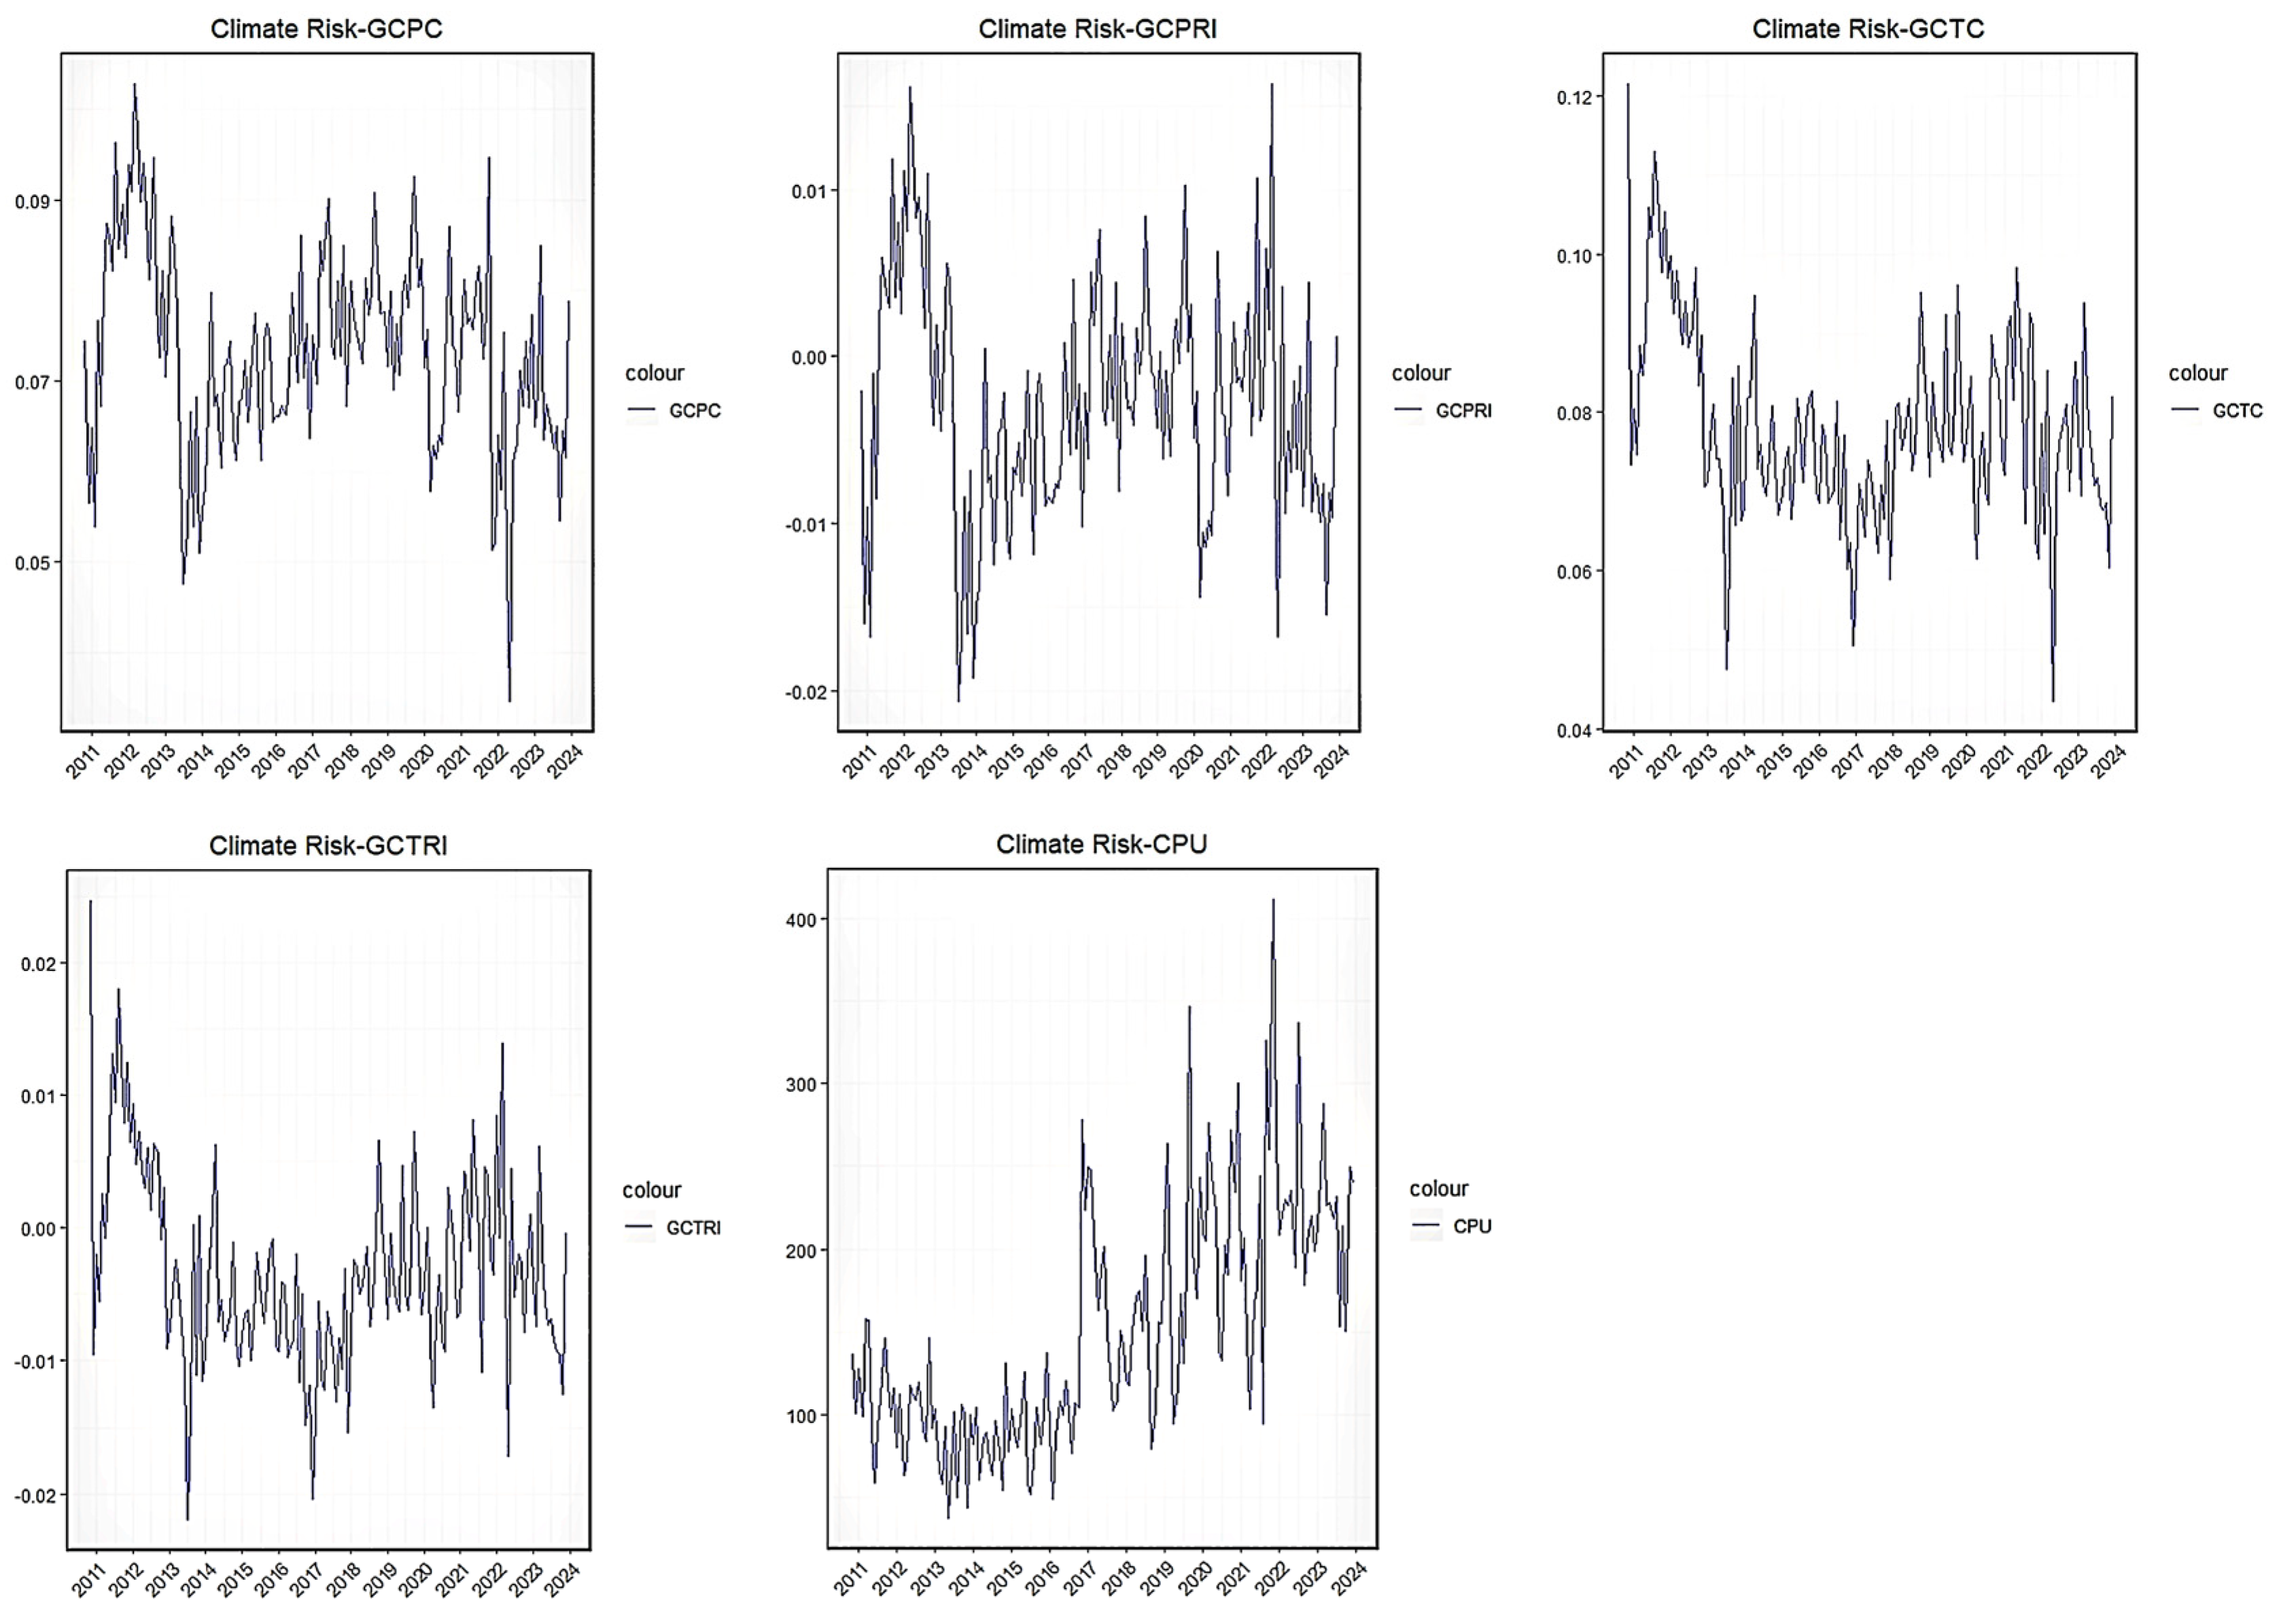
This study demonstrates the clean energy market’s susceptibility to abrupt climate change, suggesting that market dynamics are more responsive to the impacts of the present than the past. The Energy Management Index (EMI), Advanced Materials Index (AMI), and Developer Index (DOI), as primary transmitters of spillovers, and the Global Climate Physical Risk Index (GCPRI), Fuel cell Index (FCI), Climate Policy Uncertainty Index (CPU), and Global Climate Transition Risk Index (GCTRI), as primary recipients, highlight the asymmetry in the propagation of market shocks. The market’s dynamic reaction to the perception of climate risk highlights the substantial impact of geopolitical and economic events on market behavior and demonstrates the time-varying nature of spillover effects. Moreover, climate risk perception plays a key role in the risk spillover mechanism; in particular, the Global Climate Transition Concern Index (GCTC) and the Global Climate Physical Concern Index (GCPC) significantly influence the pathways through which market risks are transmitted.
This study makes the following novel contributions to the body of literature. First, it offers a methodical examination of the dynamic influence of perceived climate risk on the clean energy market, exposing the relative insensitivity of the market to past events and its sensitivity to current events. Second, methodologically, it employs the contemporaneous and lagged R2 decomposition connectivity method, an advanced analytical tool for uncovering significant spillover effects and highlighting the importance of considering climate risk in policy and investment decisions between climate risk perception indices and clean energy sub-sectors, thereby enhancing the precision of the research findings and overcoming the limitations of traditional index methods. Based on empirical analyses, these findings not only offer a fresh viewpoint on the complexities of climate risk perception in the financial sector but also provide policymakers and market regulators with useful references and insights. In conclusion, the findings of this study not only contribute to the body of knowledge in academia but also serve as a guide in the real world, especially with regard to creating effective risk management plans and promoting the sustainable expansion of the clean energy sector.
This article has the following structure. Section 2 examines pertinent literature; Section 3 introduces the research methodology; Section 4 explains the creation of the data and index; Section 5 presents the empirical findings; and Section 6 summarizes the findings and suggestions of the study.

2. Literature Review

2.1. Methods for Quantifying Climate Risk

The escalating issue of global warming necessitates the accurate quantification of climate risk, which is pivotal for devising effective response strategies. Solomon and Perera suggested employing big data and machine learning techniques to gauge public and business perceptions of climate risk, but these fail to integrate the complexity of policy–market interactions [12,13]. Yalew broadened the discourse by examining climate change vulnerability and its repercussions on energy production and cost structures through global and regional scenario analyses, but this study did not delve into risk transmission mechanisms [14]. The academic community predominantly utilizes static analysis methods driven by climate data to quantify climate risk, encompassing detailed forecasts of rainfall, temperature, sea-level rise, and the frequency of natural disasters. However, these approaches are not able to capture dynamic changes in risk perception. By linking climate variables with commodity prices and financial stability, Flori demonstrated the wide-ranging effects of climate risk on the economy, but she fails to discern between short-term swings and long-term patterns [15]. Sautner leveraged machine learning to analyze corporate earnings reports, uncovering the corporate sector’s climate risk perception through discussions of climate change therein, but his study focuses on text mining rather than market dynamics [16]. Therefore, this study makes up for the inadequacy of the traditional methods used in the analysis of dynamic perception and transmission paths by introducing multidimensional climate risk perception indices in combination with a time-varying network model.

2.2. Economic Impacts of Climate Change

Climate finance issues have become an important topic in the global economy’s response to the challenges posed by climate change. Giglio discussed the wide-ranging impact of climate risk on economic activity, emphasizing the danger that climate change poses to both the natural environment and economic growth. However, he did not specify how it influences markets [17]. Research conducted by Guo, Gong, and Liao also showed that, despite the lack of a dynamic analysis of policy uncertainty, climate change risks have a significant influence on investor decision-making and the long-term stability of the financial and economic system [18,19]. Nordhaus, as a pioneer in the field, laid the foundation for subsequent work on how climate change affects the economy [20]. A thorough examination of the economic effects of extreme weather events by Newman and Noy showed that they seriously damaged renewable energy infrastructure and affected market prices, but they neglected to take public trust into account [21]. This study reveals how the dynamic interaction of climate risk perceptions and policy uncertainty affects market volatility through spillover network modeling. By combining these components, the study offers a more thorough comprehension of how climate change affects the economy, emphasizing the significance of considering both direct and indirect effects when developing investment plans and policies.

2.3. Climate Risk Perception and Market Dynamics

Numerous studies have highlighted the intricate relationship between climate risk perception and the clean energy market. Increased volatility in clean energy pricing is directly caused by climate change, especially its effects on renewable energy infrastructure, such as wind and hydroelectric output. Pham demonstrated that extreme weather, climate events, or government policies can significantly influence investors’ perceptions of climate risk, thereby altering market financial returns [22]. Venturini noted that market investors pay special attention to extreme climate events, public awareness, and government policies when assessing climate risk [23]. Shen affirmed the strong correlation between market mood and the effects of extreme climate occurrences on asset values [24]. However, these scholars do not distinguish between direct and indirect effects. Dong examined the risk spillover between the carbon, energy and financial markets, extreme weather, and uncertain policy. He clarified the intricate interrelationships between these domains and emphasized the significance of determining how they are interconnected, even though his model might not fully capture the complex impacts of policy uncertainty and extreme weather on market dynamics [25]. Dutta found a strong association between increased climate risk and the valuation of clean energy investments after examining the effects of the Climate Policy Uncertainty Index on the returns and volatility of green energy assets [26]. The study conducted by Lee demonstrated that, in situations where socioeconomic conditions are developed and conducive to sustainable development, climate risk considerably reduces the efficacy of green finance [27]. However, neither scholar linked extreme climate events to public concern and market confidence. However, this study analyzes the multidimensional risk transmission paths and the impact of external shocks through a spillover network model.

2.4. Application of the R2 Method in the Analysis of Market Spillover Effects

The existing literature on market spillover effects primarily employs various advanced econometric models.
Since Diebold and Yilmaz’s groundbreaking work, the connectivity technique has grown in importance as a tool for researching how information moves between markets [28,29]. Many subsequent researchers such as Demirer, Antonakakis and Gabauer have focused on quantifying these transmission processes through different types of VAR models [30,31,32,33]. However, such approaches are usually limited to analyzing contemporaneous spillovers and fail to adequately account for lagged effects in the series.
To overcome these limitations, Baur and Hoang proposed a two-step procedure to distinguish between simultaneous and lagged effects [34]. Nonetheless, the method still suffers from the shortcoming of only being able to compute the FROM total directional connectivity metric. Subsequently, Zhang proposed an improved program to try to address these issues, but this new approach also faced some challenges [35].
Eventually, based on the theoretical framework of Gabauer’s research, Balli proposed the R2 decomposition of connectivity approach, which effectively standardizes the breakdown of market spillovers into contemporaneous and lagged effects, providing a more precise tool for cross-market analysis [36].
In addition, a range of other methods have been introduced into the field. Among these is the time-varying parameter vector autoregression (TVP-VAR) model that Ren, Wu, and Liu employed to capture the dynamic relationships between variables’ time-varying features [37,38]. Chen adopted the GARCH-MIDAS approach to explore financial market volatility and its associated risk management issues [39]. This area was also explored by Xu, who examined the volatility features of the Chinese stock market using the Markov regime switching (MRS) technique [40]. Yu utilized the copula approach to explore the structural issues associated with asset portfolio risk [41]. Dong suggested a quantitative analysis strategy [25] and He developed a TVP-VAR-DY model to gain a better understanding of market connectivity [42].
In summary, this study adopts Balli’s R2 decomposition framework combined with a time-varying network model, to distinguish between simultaneous and lagged effects and accurately quantify the immediate and long-term impacts of extreme weather on market volatility. It conducts multidimensional risk integration, incorporating them into the same framework, and analyzes their dynamic interactions. Finally, it reveals the nonlinear impacts of economic events on market confidence by means of dynamic connectivity indicators [36].

2.5. Theoretical Contribution

According to our review of the pertinent literature, while previous research has made great strides in measuring the perception of climate risk and its impact on financial markets, giving this study a strong theoretical basis, we can still gain a better understanding of the dynamic shifts in the clean energy market, especially when taking into account the multifaceted nature of climate risk perception. This study aims to improve the theoretical and empirical research in this field by introducing multidimensional climate risk perception indicators and using the R2 decomposition connectivity analysis framework to quantify the spillover effects of these indicators on the clean energy market, given the limitations of previous research.

3. Data

3.1. Climate Risk Perception

This study introduces a comprehensive climate risk perception index system covering the following five core indices (shown in Table A1; detailed descriptions for Table A1 are shown in Appendix A), including CPU, GCPRI, GCTRI, GCPC, and GCTC. These indices were chosen based on their ability to capture different dimensions of climate risk perception as discussed in the literature [18,43].
The data are based on authoritative scientific literature and news archives from November 2010 to December 2023, with rigorous screening of authoritative texts. The raw data are normalized and aggregated by month to obtain 158 monthly observations to ensure temporal consistency. The search terms listed in Table A2 (Detailed data for Table A2 are shown in Appendix A) were used in conjunction with machine learning algorithms to screen and categorize the relevant articles, ensuring high precision and recall and improving the transparency and replicability of the study.
The research conducted by Bua et al. identifies physical risk and transition risk as the two main categories of climate risk [43]. Physical risks are shown by the GCPC and GCPRI indexes, which show the direct financial effects of extreme weather events. Transition risks, represented by the GCTC and GCTRI indices, embody risks affecting financial market stability through factors such as policy changes, technological innovation, and investor sentiment [44].
According to the methodology described by Guo et al., the CPU is determined by dividing the total number of articles per month by the relative frequency of articles pertaining to climate policy uncertainty [18]. The GCPRI uses information from climate databases and financial reports to quantify the direct financial implications of extreme weather events, such as disruptions in energy output and damage to coastal infrastructure. Similarly, the GCTRI measures risks arising from policy changes, technological innovation, and shifts in investor sentiment, drawing on policy announcements, patent filings, and market sentiment analyses. In addition, the GCPC quantifies the level of public concern about physical risks, such as the density of media coverage of extreme weather events, and the GCTC reflects market concerns about transition risks, such as the fervor with which policy changes are discussed in the media [43].
In the context of clean energy financialization, heightened climate risk perception, as captured by the GCPC and GCTC indices, significantly impacts investor sentiment. Media coverage of extreme weather events (reflected in the GCPC index) and policy shifts (reflected in the GCTC index) triggers speculative trading and herd behavior in the market. This, in turn, causes clean energy asset prices to deviate from their fundamental values, creating both opportunities and risks for market participants.
Figure 1 illustrates the dynamic changes in the five climate risk perception indices from 2010 to 2023. The long-term upward trend of the CPU index peaks in 2022, coinciding with increased policy debates at the COP27 summit and the US enactment of the Inflation Reduction Act. Short-term fluctuations in the GCPRI and GCPC indices correlate with specific extreme weather events, such as Hurricane Sandy in 2012 and the European heatwaves in 2020. In contrast, the GCTRI and GCTC indices show volatility linked to policy announcements, such as the EU’s Green Deal in 2019 and the global surge in renewable energy investments post-2020.

3.2. Clean Energy Market

This study procured daily data from 11 major global clean energy stock indices, spanning the period from January 2010 to December 2023. Utilizing the classification system of Pham, the indices include the Bio/Clean Fuels Index (BCI), Solar Index (SI), Wind Index (WI), Geothermal Index (GI), Fuel Cell Index (FCI), Developer Index (DOI), Energy Storage Index (ESI), Smart Grid Index (SGI), Green IT Index (GITI), Energy Management Index (EMI), and Advanced Materials Index (AMI) [22]. These indices are correlated with global climate risk perception indicators to assess the market impact [45]. The information comes from the Wind Database.
To ensure analytical precision, all data underwent Z-score normalization to mitigate dimensionality effects and bolster model stability. The selection of variables was informed by their established correlation with climate risk perception as documented in prior literature. Daily data were consolidated and averaged to form monthly datasets, and logarithmic returns were computed using the following formula:
r i , t = ln P i , t ln P i , t 1
where r i , t is the logarithmic rate of commodity i in month t and P i , t is the price of commodity i in month t .
Figure 2 displays the price volatility of the 11 clean energy markets during the sampling period. Since 2019, the volatility of the Fuel Cell Index (FCI) has increased significantly; this is potentially attributable to the rapid expansion of the electric vehicle market, which had a significant influence on the demand and pricing dynamics of fuel cell technology. Additionally, all clean energy commodities exhibited a notable downward trend in 2022, which may be related to macroeconomic factors or industry-specific challenges of that year. Even while monthly data provide enough time series information for research, cyclical swings and long-term trends could not be fully captured by short-term market movements.

3.3. Descriptive Statistics

To facilitate empirical research, Table A3 (Detailed data for Table A3 are shown in Appendix A) presents a thorough summary of the descriptive statistics for the gathered dataset. The light positive skewness in the monthly returns suggests a marginal propensity for the market to favor higher returns. The standard deviation indicates considerable fluctuation in market volatility across various periods, signifying the dynamic nature of market risk. Specifically, the GCTRI records the lowest mean, indicating a general downward trend, while the GCPRI and CPU exhibit positive means, denoting a tendency towards positive returns. The pronounced variability within the GCTRI is further emphasized by its broad range and substantial standard deviation, pointing to heightened volatility relative to other indices. A skewness analysis reveals that the clean energy market series, except the Fuel Cell Index (FCI), generally follow right-skewed distributions, hinting at a longer tail on the higher returns side. Conversely, the climate risk perception series, except for the GCPRI and GCTRI, lean towards left-skewed distributions, suggesting a longer tail on the lower returns side. This divergence in skewness underscores the distinct distributional properties between market and perception indices. The results of the Jarque–Bera (JB) test show that, with the exception of SI, WI, and ESI, the return distributions of all variables do not violate the normality assumption, which is crucial for subsequent statistical analysis. Furthermore, at the 1% significance level, the Dickey–Fuller (ADF) and Phillips–Perron (PP) tests verify the stationarity of all variables, further ensuring the accuracy of the time series analysis.
This statistical insight into risk and market volatility offers a strong basis for further time series research and model building. Through careful data analysis, this study aims to clarify the dynamic relationship between the clean energy market and climate risk perception, offering factual support for relevant policy decisions.

4. Methodology

We measure the impact of climate risk perceptions on clean energy markets using Balli’s R2 decomposition connectivity analysis framework [36]. This strategy is used because it expands on Diebold and Yilmaz’s fundamental technique by differentiating between contemporaneous and lagged spillovers, enabling a more sophisticated comprehension of market dynamics [28]. A Vector Autoregression (VAR (p)) model is used in this framework to determine the connection measures and clarify the connection between the goodness-of-fit indicator and the Generalized Forecast Error Variance Decomposition (GFEVD). Leveraging the insights from Koop, Pesaran and Shin, this approach facilitates a more nuanced interpretation of connectivity beyond the confines of model-based assumptions [46,47]. Finding the optimal lag length (p) using information criteria such as the Bayesian Information Criterion (BIC) or the Akaike Information Criterion (AIC) ensures the parsimony and predictive accuracy of the VAR model. The goodness-of-fit of the model is evaluated and refined to improve the model’s explanatory power. The robustness of the model is rigorously tested using cross-validation techniques and by incorporating potential confounding variables to account for omitted variable bias.
This study uses the Vector Autoregression (VAR (p)) model, with the number of lags set to p = 1 , due to the dynamic interaction between climate risk perception and the clean energy market, which may involve the interdependence of various time series variables. An analysis of the dynamic interaction between renewable energy markets and climate risk perceptions is made possible when using this approach. We are able to analyze the direction and strength of interactions in depth without imposing structural constraints, thus identifying the specific impacts of policy changes on market connectivity and financial flows, and providing an empirical basis for policymakers:
y t = i = 0 p B i y t i + u t             u t ~ N 0 ,  
In this model, y t , y t i , and u t represent a K × 1 dimensional vector of demeaned variables at time t . The matrices B i and are K × K dimensional, with the diagonal elements of B i constrained to zero, ensuring that the variable on the left is not included in the predictors on the right. It is crucial to emphasize that the VAR model reduces to the contemporaneous R2 decomposed connectedness framework when its order ( B i ) reaches zero, as proposed by Balli. The model can also be expressed in a matrix form as follows: y k , t = b k x t + u k , t . In this formula, x t = y t , y t 1 , , y t i , , y t p and b k are vectors with K p + 1 × 1 dimensions and 1 × K p + 1 dimensions and zero on the k t h position, respectively.
The goodness-of-fit measure of R2 from multiple linear regression (MLR) is frequently consistent with the sum of R2 contributions from binary linear regressions (BLRs), provided that all of the right-hand-side variables (RHS) are uncorrelated with one another. The key to addressing this problem is figuring out a transformation that converts the correlated series—where x k , t is similar to x t but lacks the left-hand side (LHS) variable—into a set of orthogonal series. Principal component analysis (PCA) is an effective tool for achieving this transformation since it uses several latent factors corresponding to the count of RHS variables. Consequently, the R2 decomposition of an MLR is calculated as follows:
R x x = V Λ V = C C
C = V Λ 1 / 2 V  
R 2 , d = C 2 C 1 R y x 2  
In this framework, V ,   Λ = d i a g λ 1 ,   ,   λ k p + 1 1 and R x x illustrate the eigenvector, eigenvalue and the Pearson correlation matrices of K p + 1 1 × K p + 1 1 , respectively. Additionally, R y x and R 2 , d denote the Pearson correlation and R2 contribution vectors of K p + 1 1 × 1 , respectively.
Specifically, R y x denotes the Pearson correlation coefficients between variables on the left-hand side (LHS), while R x x denotes the Pearson correlation coefficient between variables on the right-hand side (RHS) and those placed on the LHS. The initial K 1 values of R 2 , d at the beginning indicate the contemporaneous R2 contribution, while the subsequent values at the end emphasize the lagged R2 contribution.
Because of this, the goodness-of-fit of the multiple linear regression (MLR) R2 is equal to the sum of the vector R 2 , d . To create the K × K p + 1 dimensional R 2 , d decomposition matrix, we combine the R 2 , d contributions from the total of the KMLRs. Here,   R 0 2 , d ; ;   R i 2 , d   ; ; R p 2 , d   . Whereas the lagged spillovers are represented by the cumulative lagged values R L 2 , d = R 1 2 , d + + R i 2 , d + + R p 2 , d , R 0 2 , d can be seen as contemporaneous spillovers, represented by R C 2 , d .
In Diebold and Yilmaz’s connectedness approach, the scaled GFEVD matrix is substituted with R C 2 , d and R L 2 , d [28,29]. According to this calculation, the total connectedness index (TCI) implies that the average R2 of the k multivariate linear regressions (MLRs) is equal to:
T C I = 1 K k = 1 K R k 2
TCI also lies within the same range as R k 2 , which means that the connectivity normalization issue is avoided [32]. With the help of our suggested methodology, we can look at the contemporaneous and lagged TCI:
T C I = 1 K k = 1 K R k 2 = 1 K k = 1 K j = 1 K R C , k , j 2 , d + 1 K k = 1 K j = 1 K R L , k , j 2 , d = T C I C + T C I L
where T C I C and T C I L represent the contemporaneous and lagged T C I , respectively.
Ultimately, this conceptual framework can be extended to assess gross directed connectivity, both emanating TO and directed FROM other entities, and to quantify gross net directed connectivity. This extension allows for a comprehensive assessment of the systemic influences and interdependencies in the network of variables under investigation:
T O j = k = 1 K R C , k , j 2 , d + k = 1 K R L , k , j 2 , d = T O j C + T O j L
F R O M j = k = 1 K R C , j , k 2 , d + k = 1 K R L , j , k 2 , d = F R O M j C + F R O M j L
N E T j C = T O j C F R O M j C
N E T j L = T O j L F R O M j L
N E T j = N E T j C + N E T j L
In this study, total directional connectedness ( T O j   ( T O j C T O j L )) expresses how much of the change in the variables on the left-hand side (LHS) that is contemporaneous or lagged can be explained by series j . Conversely, the degree to which series j explains the overall (contemporaneous/lagged) variation in the variables on the right-hand side (RHS) is indicated by the total directional connectedness of F R O M j ( F R O M j C F R O M j L ), which is equivalent to the R2 of the k multivariate linear regression (MLR). Series j is classified as a net transmitter (receiver) when the N E T j > 0   ( N E T j < 0 ) , meaning that it can explain more (fewer) changes in other series than other series, and vice versa. The idea aligns with how both contemporaneous and lagged association degrees are interpreted.

5. Empirical Analysis and Discussion

5.1. Static Spillover Effect Analysis

5.1.1. Assessment of Overall, Contemporaneous, and Lagged Spillover Effects

This study employs the average connectivity measure method to examine the overall spillover effects based on the data presented in Table A4 (Detailed data for Table A4 are shown in Appendix A), further differentiating between contemporaneous and lagged effects in parentheses. The results indicate that the total spillover index stands at 84.25%, implying that inter-market spillover effects are the main factor influencing market risk perception. The contemporaneous spillover effect, at 69.15%, is significantly higher than the lagged spillover effect at 14.53%, highlighting the pronounced influence of immediate market fluctuations on overall connectivity. This immediacy demonstrates the ability of markets to react quickly to policy changes and climate risk events. By analyzing changes in market connectivity over time, we can better understand how policy adjustments affect financial flows in clean energy markets. Moreover, among the climate risk perception indices, GCPC and GCTC, demonstrate the most pronounced spillover effects in the total spillover (TO) measurements, recording 82.29% and 82.25%, respectively. This indicates their substantial influence on other markets in the transmission of market information.
The analysis reveals that the contemporaneous FROM and TO connectivities are generally more significant than lagged connectivities, again suggesting a swifter market response to immediate climate risk perceptions. Exceptions are observed for the GCPRI and CPU indices, highlighting the complex interplay between immediate and lagged effects and emphasizing the importance of considering temporal dynamics when assessing shock transmission between systems. Specifically, the contemporaneous FROM measurement for GCPRI is 30.86%, slightly lower than the lagged FROM measurement (38.78%), while the contemporaneous TO measurement is 19.18%, slightly lower than the lagged TO measurement (25.25%). The CPU index also shows a similar trend, with a contemporaneous FROM measurement (32.87%) slightly lower than the lagged FROM measurement (36.37%), and a contemporaneous TO measurement (23.19%) slightly lower than the lagged TO measurement (33.32%). These results reveal the distinct function of climate risk perception indices in market network shock transmission.
Moreover, a comparative analysis of net spillover effects further reveals EMI’s primary role as a shock transmitter, with a significant value of 12.78%, followed by the Advanced Materials Index (AMI) (11.24%) and Developer Index (DOI) (10.78%), reflecting the role of policy support (e.g., subsidies for R&D on green technologies) in boosting market confidence. In contrast, GCPRI is the main shock receiver, with a net reception value of −25.21%, followed by the Fuel Cell Index (FCI) (−14.91%) and CPU (−12.74%), suggesting that the current policy framework may not adequately mitigate market shocks from physical climate risks and that the design of adaptive policies needs to be further strengthened. This asymmetry underscores the complexity of market interactions and the importance of distinguishing between different markets.
The perception of climate risk has a major short-term impact on market trends, even while macroeconomic considerations and changes in the supply and demand balance have a longer-term influence on the pricing dynamics of the clean energy market. Changes in real climate catastrophes and public awareness of climate issues have the potential to quickly shift investor opinion and cause price volatility. Our initial hypothesis regarding the spillover influence of climate risk perception on the clean energy market is supported by the study’s static analytic point of view. It supports the results of Pham, who discovered significant differences in the relationship between oil prices and clean energy stocks across different clean energy market subsectors [22].

5.1.2. Spillover Effect Analysis of Key Indices: The Connection Between GCTC, GCPC, and the Clean Energy Market

Further analysis elucidates the dynamic interactions between GCTC and GCPC relative to the clean energy market. The comparative figures in Table 1 show a near-equilibrium in their reciprocal influence, with GCTC impacting GCPC by 34.84%, while GCPC’s influence on GCTC is 35.92%, indicating a dynamic balance between them with a minimal net displacement. The GCTC’s positive spillover effect on GCTRI is 3.02%, and its net contribution to GITI is 1.37%, revealing the market’s anticipatory response to future policy or technological advancements. Additionally, GCPC significantly influences the Fuel Cell Index (FCI) by 2.20%, yet it exhibits a slight net negative effect on the Energy Management Index (EMI) by −0.88%. This divergence underscores the intricate dynamics at play between distinct market sectors. The positive spillover effect of GCPC on the Fuel Cell Index (FCI) implies a positive linkage between climate transition concerns and associated risks, while the slight negative correlation with EMI may indicate the market’s specific response to certain energy sub-sectors.
Additionally, Table 2 further illustrates how interconnected these indices are within a complex system, highlighting the unique patterns in the temporal dynamics of these interrelationships. The majority of contemporaneous FROM and TO connectedness indicators exhibit a significant decline in comparison to their lagged counterparts. For instance, GCPC emerges as a significant contributor to the lagged TO indicator, with a score of −10.90%, slightly exceeding CPU’s contribution at −10.96%. This comparison underscores a notable transition in the spillover dynamics from immediate to lagged effects.
This study offers a new perspective on market dynamics and an empirical foundation for developing pertinent market strategies and policies by clearly stratifying the indices from contemporaneous to lagged effects. This allows for insights into the variability of the interactions between climate risk and the clean energy market.

5.1.3. Spillover Effect Analysis of Key Indices: The Relationship Between GCTRI, GCPRI, and the Clean Energy Market

This research delves into the interplay between GCTRI, GCPRI, and the clean energy market. The comparative analysis in Table 3 shows that GCTRI has a positive influence of 5.04% on GCPRI, while the reverse influence is 3.28%, culminating in a net positive effect of 1.76%. Furthermore, GCTRI’s negative impact on GCTC is 3.02%, possibly reflecting an increased market recognition of climate transition risks; GCPRI is significantly negatively affected by CPU at 8.39%, possibly indicating that various actual climate disasters lead to increasing uncertainty regarding climate policies among nations.
Table 4 reveals the temporal dynamics between the indices. Notably, the CPU index has a significant impact on the lagged FROM indicator of GCTRI, with a difference as high as −9.82%, followed by GCTC at −1.98% and the DOI at −1.30%. These results demonstrate how sensitive the market is to climate-related concerns and the need for sophisticated investment and policy approaches. This analysis deepens our understanding of the market’s response to physical and transitional climate risks in the clean energy financial environment, emphasizing the complex reaction mechanisms of the market to these risk factors.

5.2. Dynamic Spillover Effect Analysis

5.2.1. Analysis of Overall, Contemporaneous, and Lagged Dynamic Connectivity

This study employs dynamic connectivity graphs to further analyze the connections between climate risk and the clean energy market. These graphs illustrate the temporal evolution of this connection, providing a more nuanced perspective.
Figure 3 presents the variation in the overall effect over time, highlighting significant trends and fluctuations during the research period. The analysis indicates that markets are notably affected during periods of frequent policy changes, which may be associated with market participants’ expectations of new policies and their impact on market prospects. For example, China’s advocacy for an “energy revolution” and the increased focus on clean energy programs worldwide may be the cause of the overall spillover index’s rising trend from 2015 to 2016. The rise from 2016 to 2018 may be positively influenced by the Paris Agreement, marking a global commitment to climate action and clean energy development. Additionally, there has been a discernible rise in spillover effects since the COVID-19 pandemic started in early 2020. Global energy issues and geopolitical tensions, such as the Russia–Ukraine conflict, coincide with the peak in 2022. These results highlight the significant influence of economic and political shifts on stock market volatility. Yu’s research highlighted how sensitive financial markets are to macroeconomic and geopolitical developments, which is consistent with the study’s findings regarding the greater influence of policy changes on the clean energy market [41].
Figure 4 displays the temporal fluctuations in contemporaneous and lagged connectivity measures, showing an enhanced market response to immediate events in 2020. The dynamics of market risk are made clearer by this temporal analysis, which is crucial for understanding how market participants respond to current information and adjust to the influence of historical events, a trend that has become more pronounced since 2020. By highlighting the significance of quick market responses and the dynamic character of risk transmission across time, these dynamic connectivity measures help us better understand the relationship between climate risk and the clean energy sector. This indicates that markets are more sensitive to these risk factors during periods of macroeconomic and geopolitical instability.

5.2.2. Dynamic Interactions Between GCTC, GCPC, and the Clean Energy Market

With an emphasis on time-varying behavior, this study explores the dynamic connection metrics between GCTC, GCPC, and the clean energy market. These metrics, which are derived from time-series analysis, provide information about how perceptions of climate risk and market behavior change over time.
Figure 5 illustrates the temporal dynamics of the “TO” connection measurements by showing the total, contemporaneous, and delayed changes. Declines in the overall spillover effect and both contemporaneous and lagged spillover effects were observed in 2017, which may be attributed to factors such as increased market maturity, policy stability, and technological advancements that collectively contribute to the optimization of investor structures and the stability of the global economic environment. The peak in GCTC’s spillover effect in June 2018 coincides with the release of the IPCC’s special report on global warming of 1.5 °C, which intensified global concerns about climate change. Notably, the OPEC+ production cuts initiated in January 2019 had a substantial influence on traditional energy prices and a cascading effect on the market for clean energy, as is reflected in the decline in the GCTC and GCPC TO connectivity measures in 2019. The COVID-19 pandemic’s impact on the world’s energy demand in the first few months of 2020 caused GCTC spillover measures to decline, whereas GCPC measures rose and peaked at the end of 2020. This suggests that, although the global economic slowdown temporarily reduced emissions, the subsequent economic recovery may have driven emission levels back up. As the global economy recovered, OPEC+ gradually adjusted its production-cut policies. Following the U.S. government’s installation of countermeasures, TO connectivity measures for GCTC and GCPC dropped after the Russia–Ukraine conflict escalated in February 2022. Throughout the observation period, the contemporaneous and lagged values of the TO connectivity measures showed a high degree of correlation, indicating a strong relationship between immediate market reactions and their delayed effects. These changes may be due to adjustments in market expectations, increased policy support, accelerated technological breakthroughs, and the rise in ESG investing, which increased market volatility and confidence in long-term trends, enhancing market responses to immediate information and reducing reliance on historical lagged information.
Figure 6 displays the dynamic trends of the “FROM” connectivity measurements. These trends are generally in line with the “TO” measures, although there are notable variations during important events such as the Russia–Ukraine conflict in 2022 and the Paris Agreement in 2015.
Ottonelli emphasized the revolutionary effect of the Paris Agreement on the global clean energy industry, pointing out that it has become a major driver of the industry’s growth and transformation, significantly advancing clean energy technology and market expansion [48].
Figure 7 focuses on the time-varying dynamics of the “NET” connectivity indicator, showing an overall negative connectivity and indicating complex interplays among influencing factors. Before 2017 and during the period from 2019–2023, GCTC’s lagged connectivity measures exceeded contemporaneous values; in contrast, lagged values were more pronounced before 2017, but, after 2022, the situation reversed, with GCPC’s contemporaneous connectivity significantly surpassing the lagged values.

5.2.3. A Dynamic Interaction Between GCTRI, GCPRI, and the Clean Energy Market

Figure 8 focuses on the dynamic connectivity between the GCTRI, GCPRI, and the clean energy market, revealing significant temporal patterns. The “TO” connectivity measure for GCPRI increased from 2017 to 2019, which is likely associated with the intensification of global extreme weather events. Similarly, the “TO” connectivity measure for GCTRI showed an upward trend in 2020, possibly indicating the COVID-19 pandemic’s impact on global carbon emissions and the frequency of extreme weather events. The peak in GCTRI connectivity in 2022 corresponds with the global energy crisis and geopolitical tensions between Russia and Ukraine, indicating that geopolitical events can significantly influence market behavior.
Figure 9 reveals the fluctuations in the “FROM” connectivity measures, including overall, contemporaneous, and lagged spillover effects. For GCTRI, lagged interdependencies exceeded contemporaneous ones until 2017, after which the lagged values began to decline, especially from 2020 onwards, when contemporaneous interdependencies became more pronounced. This shift suggests that the market’s reaction to climate risk indices is becoming increasingly immediate, with less influence from historical trends. On the other hand, the interdependencies between contemporaneous and lagged values for GCPRI continued until August 2021, after which lagged interdependencies became more evident, indicating a complex and evolving relationship between market behavior and climate risks.
Figure 10 focuses on the time-varying patterns of the “NET” connection measurements, including overall, contemporaneous, and lagged spillover effects. The overall connectivity measures are generally negative, indicating complex interactions among market forces. From 2019 to 2023, the lagged connectivity measures for GCTRI were more significant than the contemporaneous ones, suggesting a delayed market response to changes in clean technology preparedness. In contrast, the lagged connectivity measures for GCPRI only became more pronounced after 2021, after which contemporaneous spillover effects became more important, highlighting the increasing sensitivity of the market to current climate risk events.
Policymakers and investors can use this information to help them decide how best to move forward strategically in the light of market dynamics and climate risk. These analyses provide a comprehensive understanding of the long-term interactions between the clean energy market and various climate risk indices. The results highlight how crucial it is to keep an eye on both the immediate and delayed impacts of climate hazards on market behavior, as well as how these linkages must evolve as a result of world events and policy shifts.

5.2.4. Dynamic Interconnectivity Analysis Between CPU and the Clean Energy Market

The focus of this study is the measurement of dynamic connections between CPU and the clean energy market. Based on time-series research, these metrics provide information about how the connection between market behavior and policy uncertainty changes over time.
Figure 11 presents the overall, contemporaneous, and lagged “TO” connectivity measures, highlighting their temporal variation characteristics. From 2014 to 2017, the overall and contemporaneous spillover effects declined, while lagged spillover effects increased, which may be attributed to factors such as increased market maturity, policy stability, and technological advancements that collectively contribute to the optimization of investor structures and the stability of the global economic environment. The total spillover effect rose from 2017 to 2019, reflecting factors such as market expectation adjustments, strengthened policy support, and rapid technological progress. The reduction in the CPU’s “TO” connectivity metrics in 2019 is indicative of the indirect effects of the January 2019 OPEC+ production cutbacks on the clean energy market, as well as traditional energy prices. CPU’s “TO” connection measures increased in 2020 as a result of the worldwide energy demand declining due to the COVID-19 pandemic. As the global economy recovered, OPEC+ gradually adjusted its production-cut policies. CPU’s “TO” connection measures peaked in February 2022 as a result of the Russia–Ukraine crisis, followed by a decline due to countermeasures implemented by the U.S. government.
Figure 12 and Figure 13 further reveal the “FROM” and “NET” connectivity measures between the CPU and the clean energy market, showing a trend where contemporaneous connectivity is higher than lagged connectivity. These results highlight how crucial it is to take temporal dynamics into account when analyzing the intricate interactions between the CPU and the clean energy market, particularly during times of technological advancement and worldwide crises.

5.3. Overflow Network Analysis

This study employs network analysis to visualize the complex interdependencies between climate risk perception and the clean energy market, providing a structured examination of volatility spillover effects. Within this framework, nodes represent individual indices, while edges denote directional spillover relationships. Larger nodes indicate greater centrality in the network, and node size is related to the net spillover magnitude. Arrows denote the direction of spillover propagation, where blue nodes represent spillover transmitters and yellow nodes represent spillover receivers.

5.3.1. Key Findings from the Network Visualization

The network diagrams (Figure 14) reveal distinct patterns in spillover dynamics.
For climate risk perception indices, GCPRI, GCTRI, and CPU act as primary receivers of spillover effects. Meanwhile, GCTC and GCPC emerge as dominant transmitters, highlighting their role in propagating market risks.
For clean energy market indices, the Fuel Cell Index (FCI), Green IT Index (GITI) and Geothermal Index (GI) are identified as significant receivers of spillover effects, underscoring their vulnerability to risk transmission from upstream nodes.

5.3.2. Spillover Pathways and Mechanisms

This study offers insights into the mechanics of risk transmission by identifying specific spillover paths within the network of the clean energy market and climate risk perception. The analysis categorizes key indices into four groups: risk perception indices (GCTC and GCPC), risk indices (GCTRI and GCPRI), the Climate Policy Uncertainty Index (CPU), and clean energy market indices. These indices interact through the following pathways:
  • Initiation by Risk Perception Indices:
The risk perception indices (GCTC and GCPC) act as initiators of spillover effects. These indices reflect public and market sensitivity to climate-related risks, which propagate downstream clean energy market indices by increasing market volatility and sensitivity.
2.
Market-to-Policy Feedback:
Clean energy market indices transmit spillover effects to the Climate Policy Uncertainty Index (CPU). This pathway highlights the bidirectional relationship between market behavior and policy uncertainty, where market dynamics influence policy decisions and vice versa.
3.
Policy-to-Risk Amplification:
The CPU further propagates spillover effects to the risk indices (GCTRI and GCPRI). This amplifies systemic risk across the network, as policy uncertainty exacerbates risk perception in both markets and broader economic systems.

5.3.3. Contextualization Within the Scholarly Literature

These results are consistent with other research showing the influence of market mood and policy uncertainty on risk propagation routes [49,50]. Notably, the central role of GCTC and GCPC in spillover transmission corroborates recent work on the amplifying effects of public concern on market volatility [51]. Specifically, the ‘Risk Concern Index (GCTC and GCPC) → Clean Energy Market Index → Climate Policy Uncertainty Index (CPU) → Risk Indices (GCTRI and GCPRI)’ pathway highlights how public and policymaker concerns about climate risk significantly influence market behavior and overall dynamics. By integrating these insights, this study extends existing frameworks by demonstrating how climate risk perception indices mediate spillover effects between policy, market, and technological domains.

5.4. Discussions

The findings of this study’s correlation analyses indicate that views of climate danger and renewable energy markets have a substantial impact on one another. These results have significant ramifications for both theoretical comprehension and real-world implementation.
The examination of contemporaneous effects demonstrates that the clean energy market is immediately and significantly impacted by perceived climate risk. This indicates that investors and market participants are highly sensitive to short-term climate-related news and events, and that this sensitivity can be attributed to market participants’ desire to respond to rising uncertainty by quickly adjusting their strategies. For example, announcements of extreme weather events or new climate policies can lead to rapid changes in market sentiment and asset prices. This finding underscores the importance of the real-time monitoring of climate risk perceptions to inform timely adjustments in policy and investment strategies.
The analysis of lagged effects suggests that the influence of perceived climate risk extends over longer periods. This implies that the market’s response to climate risk is not instantaneous but evolves over time. This long-term impact is attributable to the “path dependence” of climate risk, whereby market participants progressively assimilate climate information into their long-term expectations, thereby influencing portfolio rebalancing decisions. Policymakers should therefore consider the gradual market response to policy changes when designing climate policies, ensuring stability and predictability.
The decomposition of R2 indicates that perceived climate risk accounts for a significant amount of the variation in clean energy market returns. This emphasizes how crucial it is to take climate risk into account when formulating investment plans and determining public policy. The spillover dynamics suggest that climate risk affects the clean energy market not only directly but also indirectly through its impact on other market segments and economic variables. Investors are thus encouraged to comprehensively evaluate both the direct and indirect impacts of climate risk when constructing portfolios to optimize risk management and return expectations.
The correlation network analysis confirms the interconnected nature of climate risk perception and the clean energy market, highlighting the key role that specific indices play in driving market dynamics. Central nodes, such as GCPRI, GCTRI, and CPU, which receive spillovers in the network, significantly influence market dynamics. Investors and governments can make more informed judgments about risk management and investment strategies by identifying these important determinants.

6. Conclusions and Policy Recommendations

6.1. Main Conclusions

This study reveals the significant impact of policy adjustments on capital flows and market dynamics in the clean energy market by analyzing changes in market connectivity over different time periods. By employing the contemporaneous and lagged R2 decomposition linkage, we find significant spillover effects and emphasize the importance of considering climate risk in policy and investment decisions, providing an empirical basis for policymakers to develop more targeted policy interventions. This leads to the adoption of a sophisticated network technique to analyze the risk contagion path and build a spillover network model. Our work makes useful suggestions for those involved in the renewable energy industry and adds to the expanding corpus of research on climate finance. The following are the primary findings from the study:
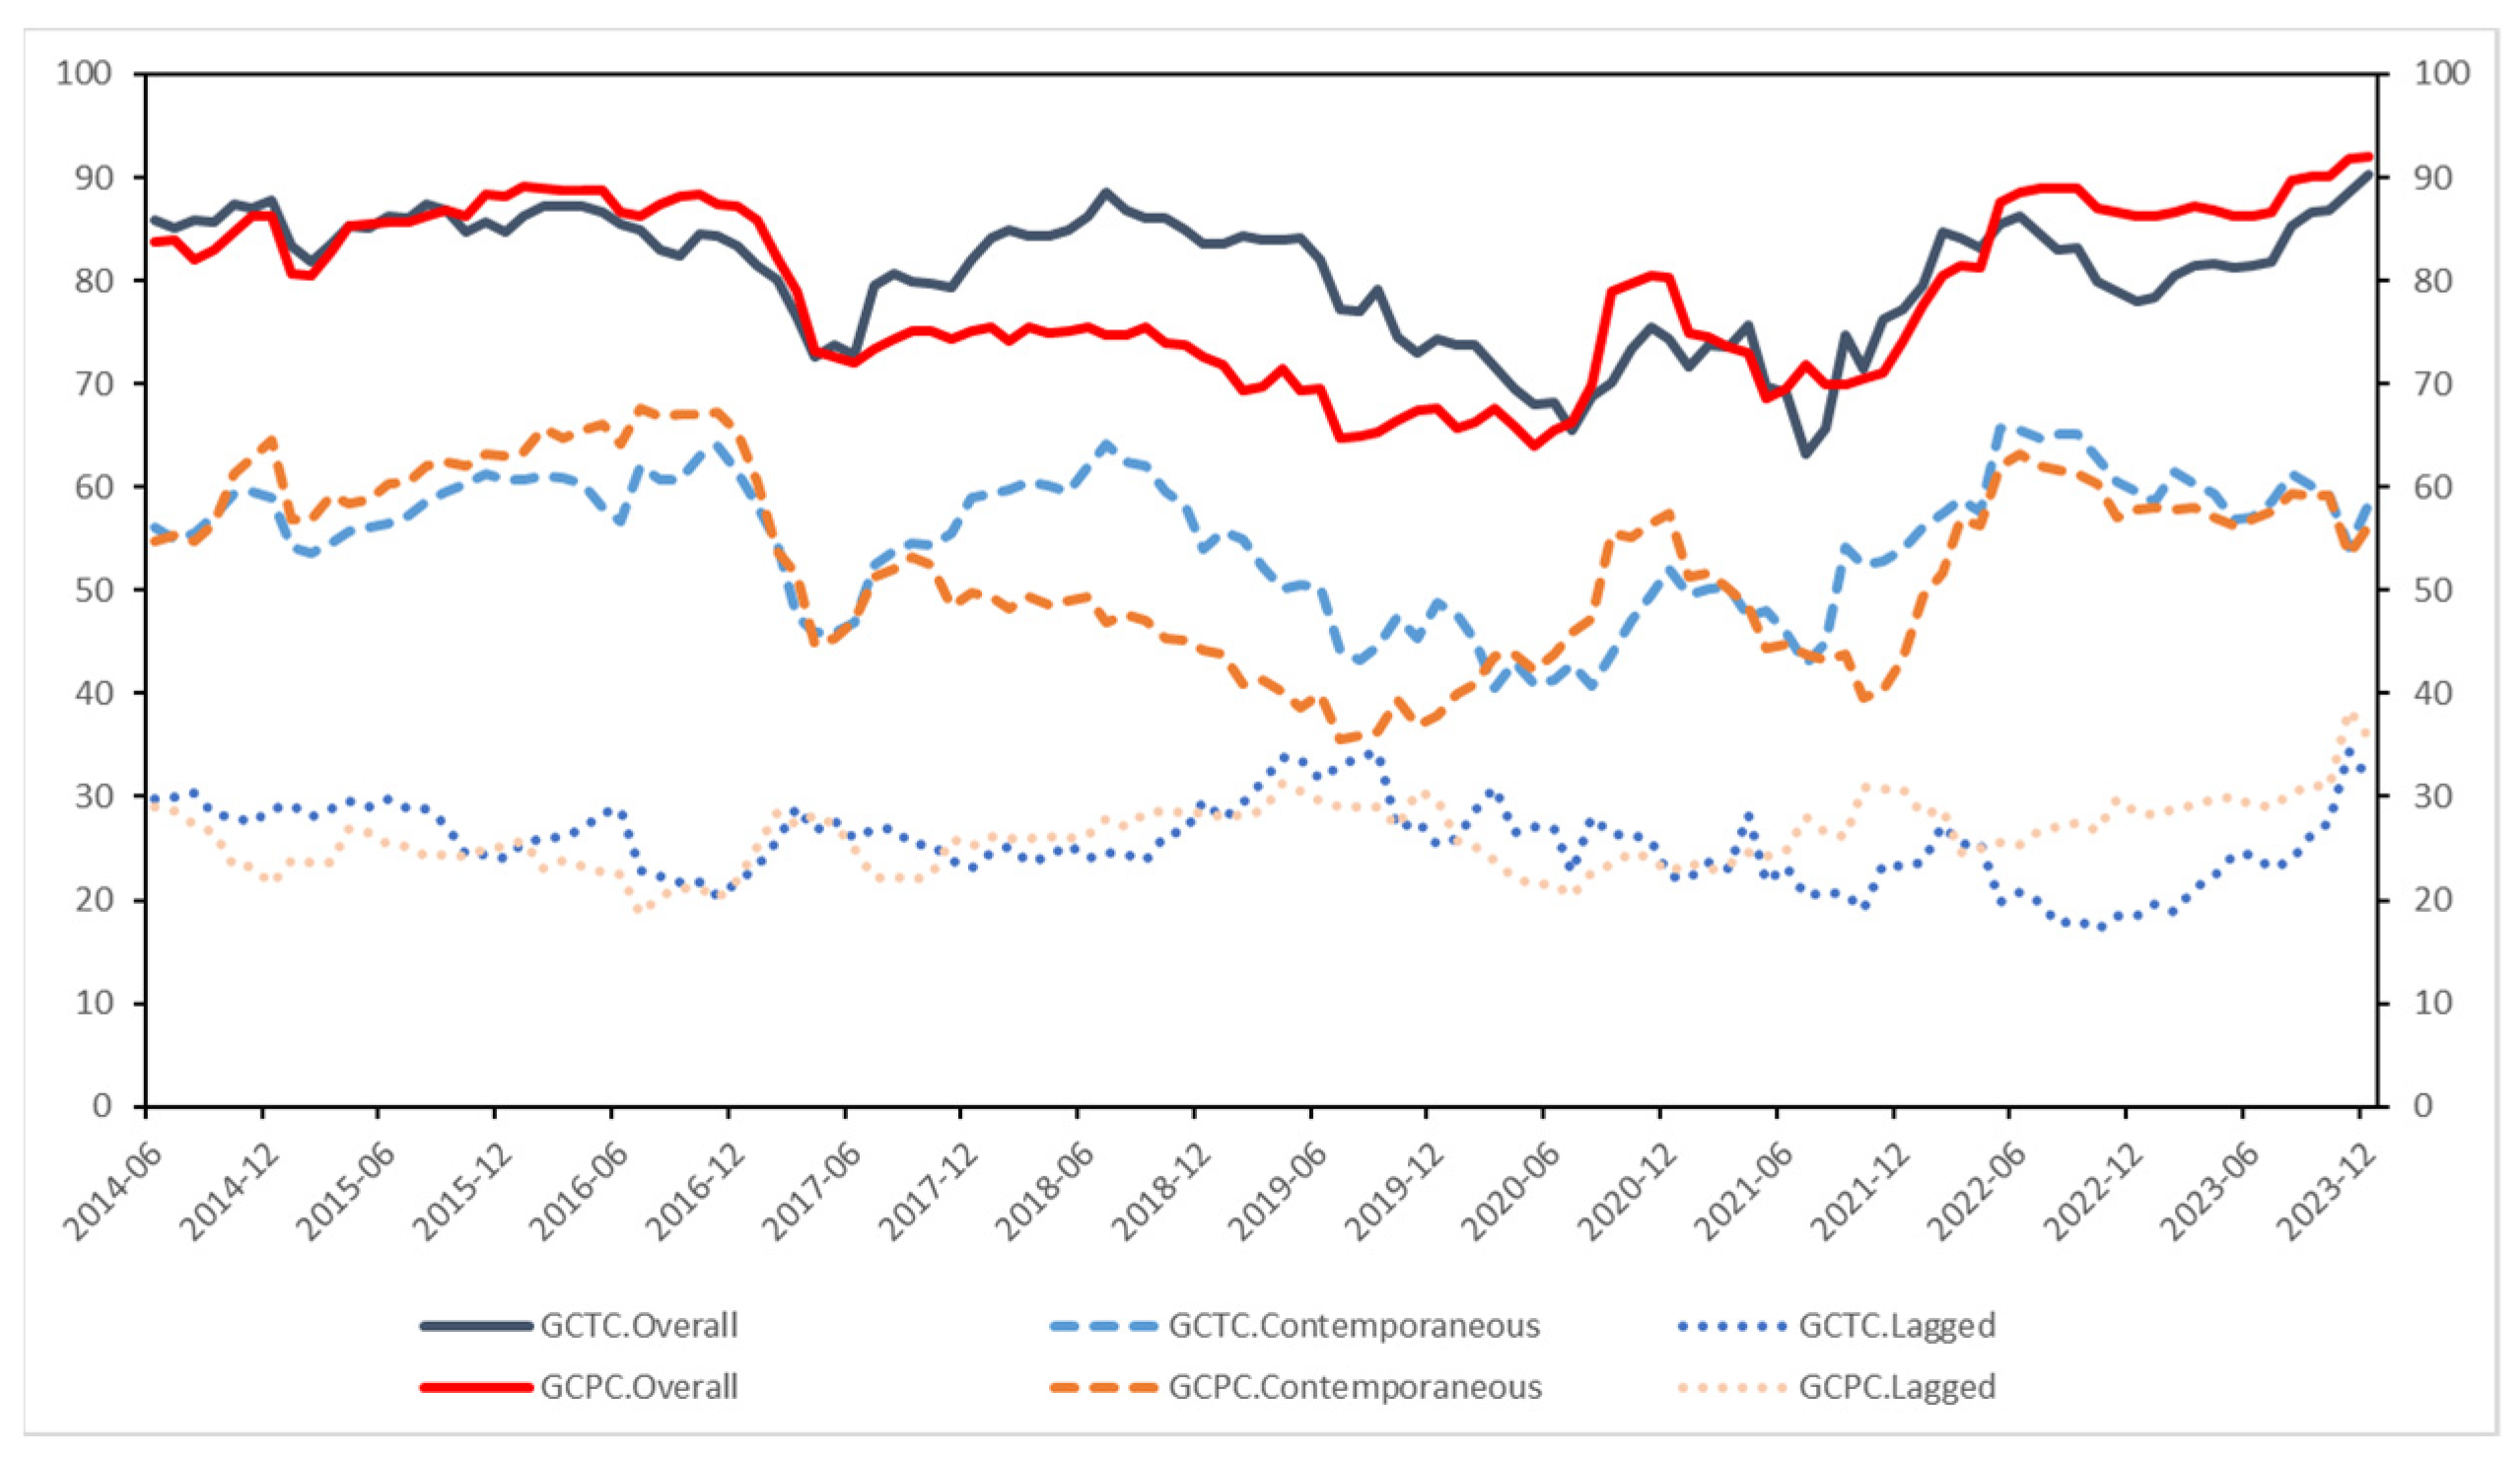
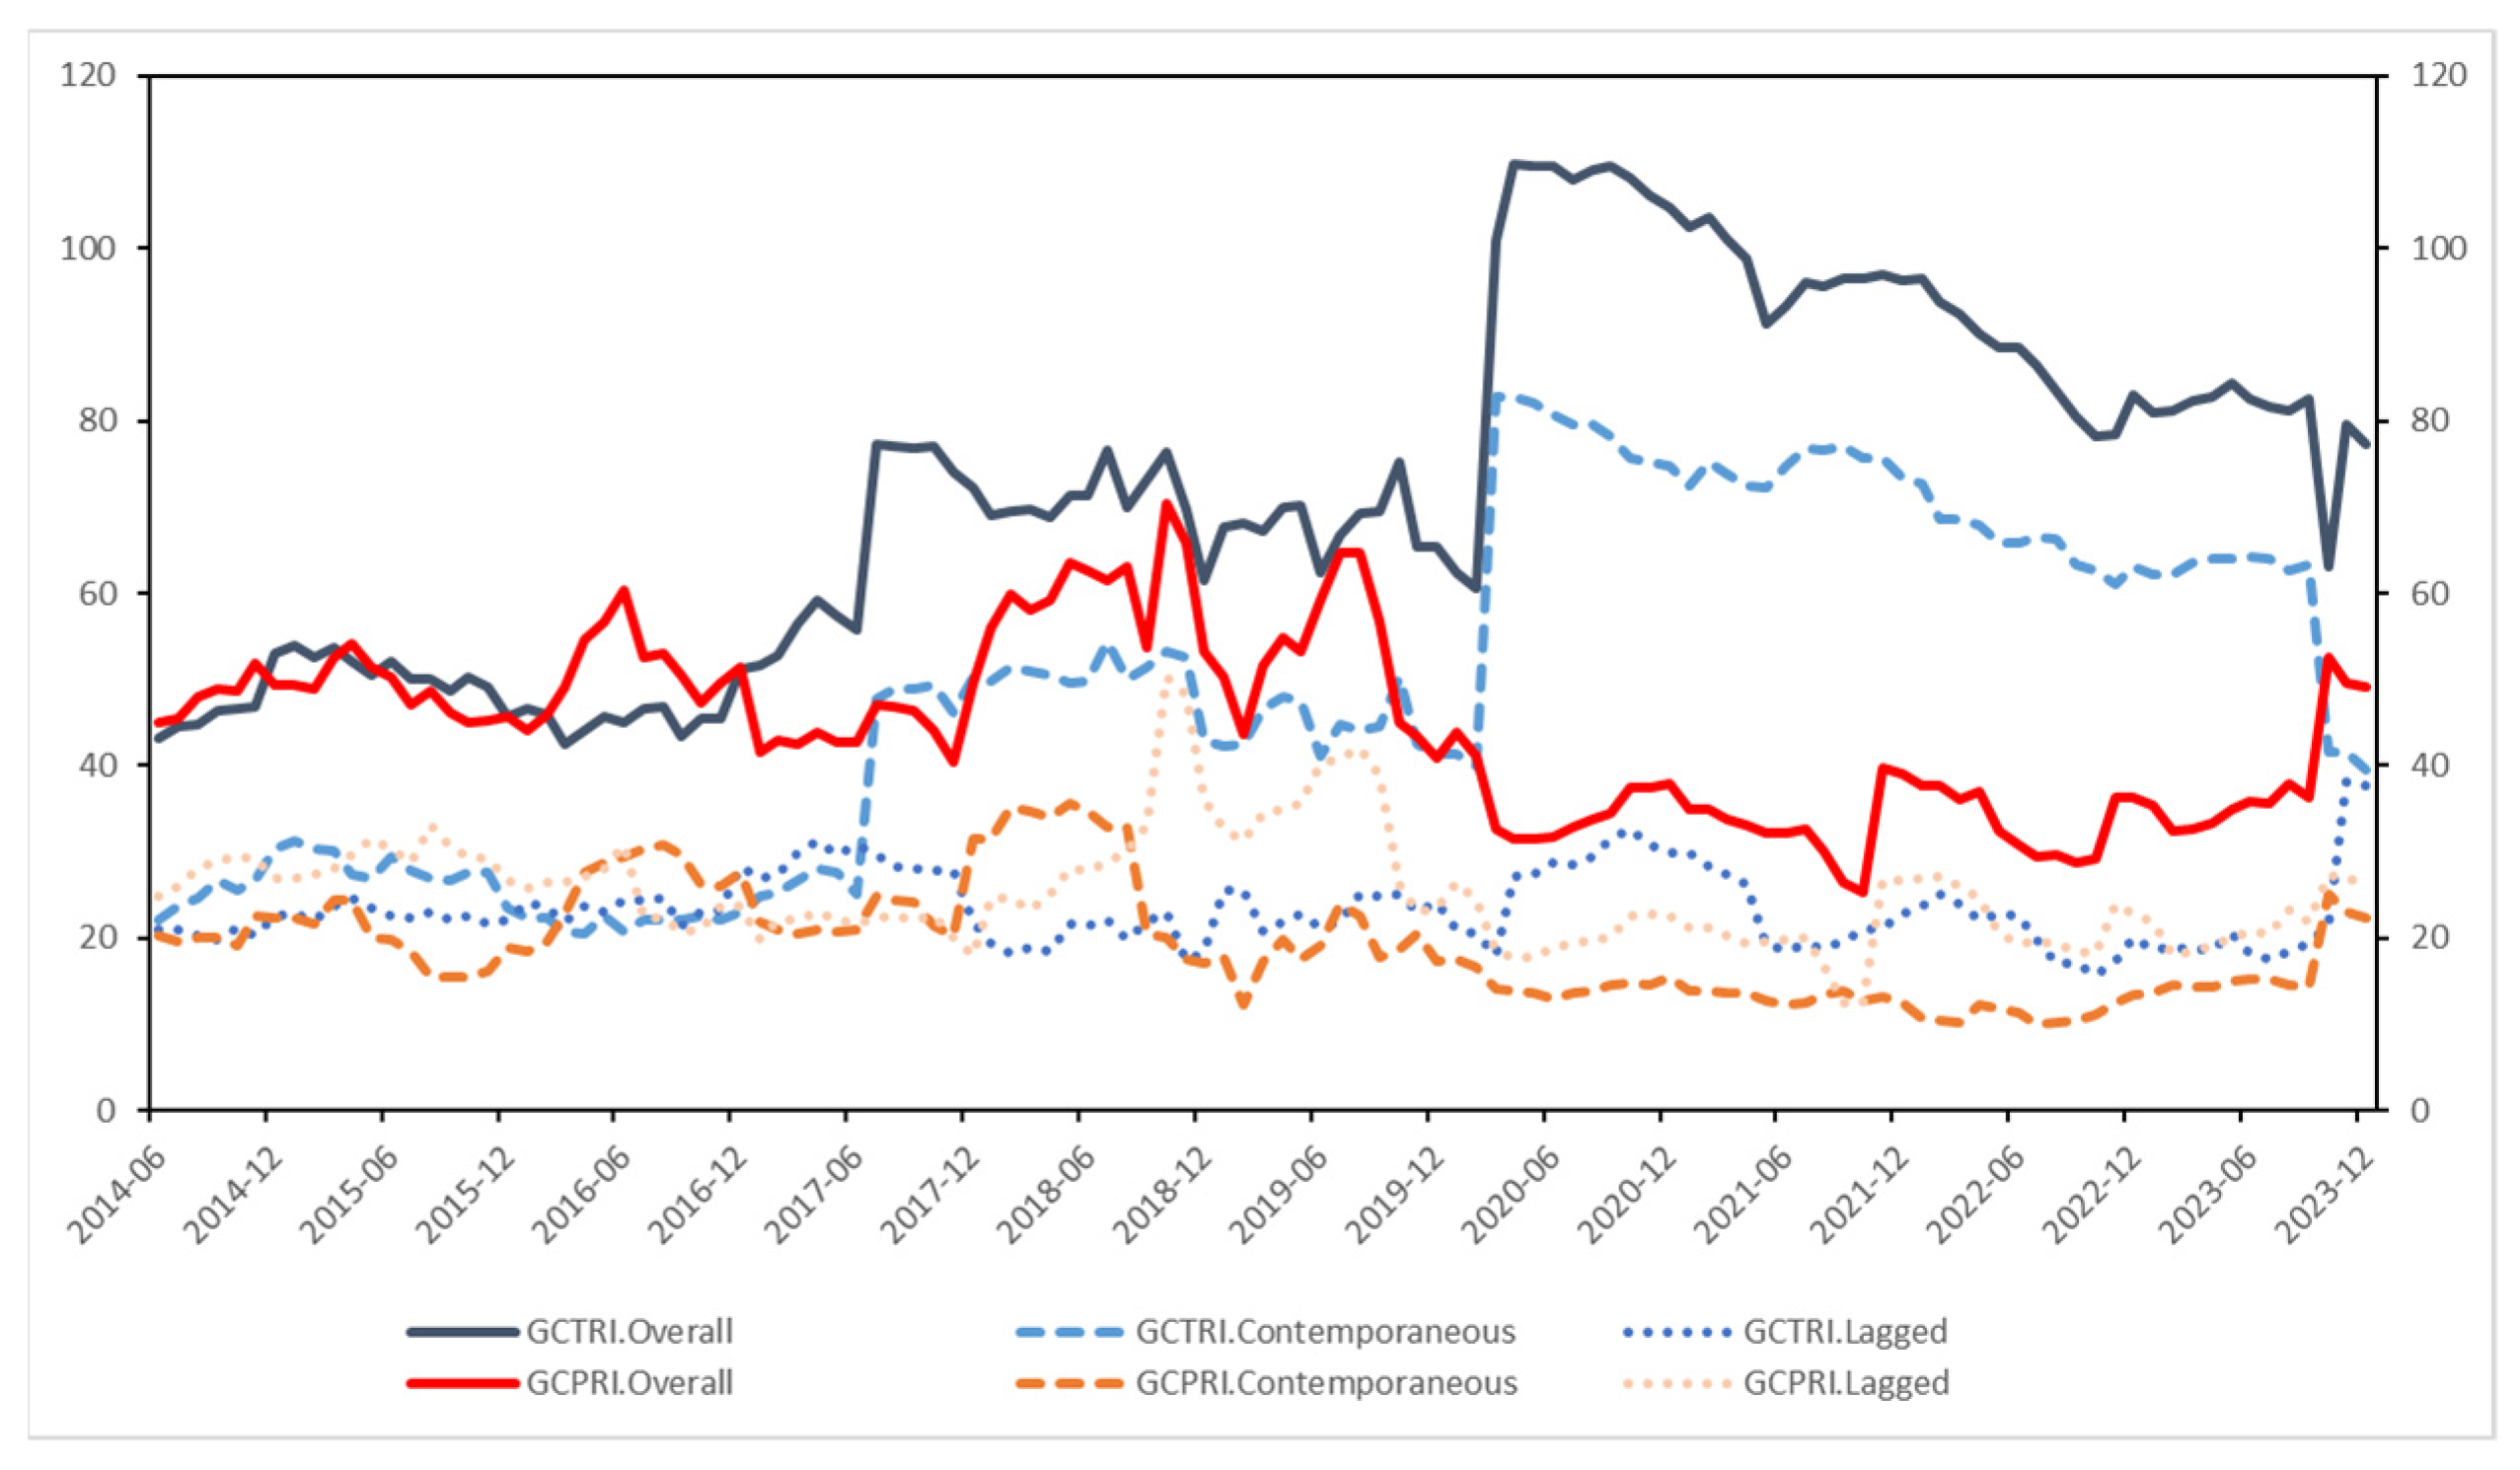
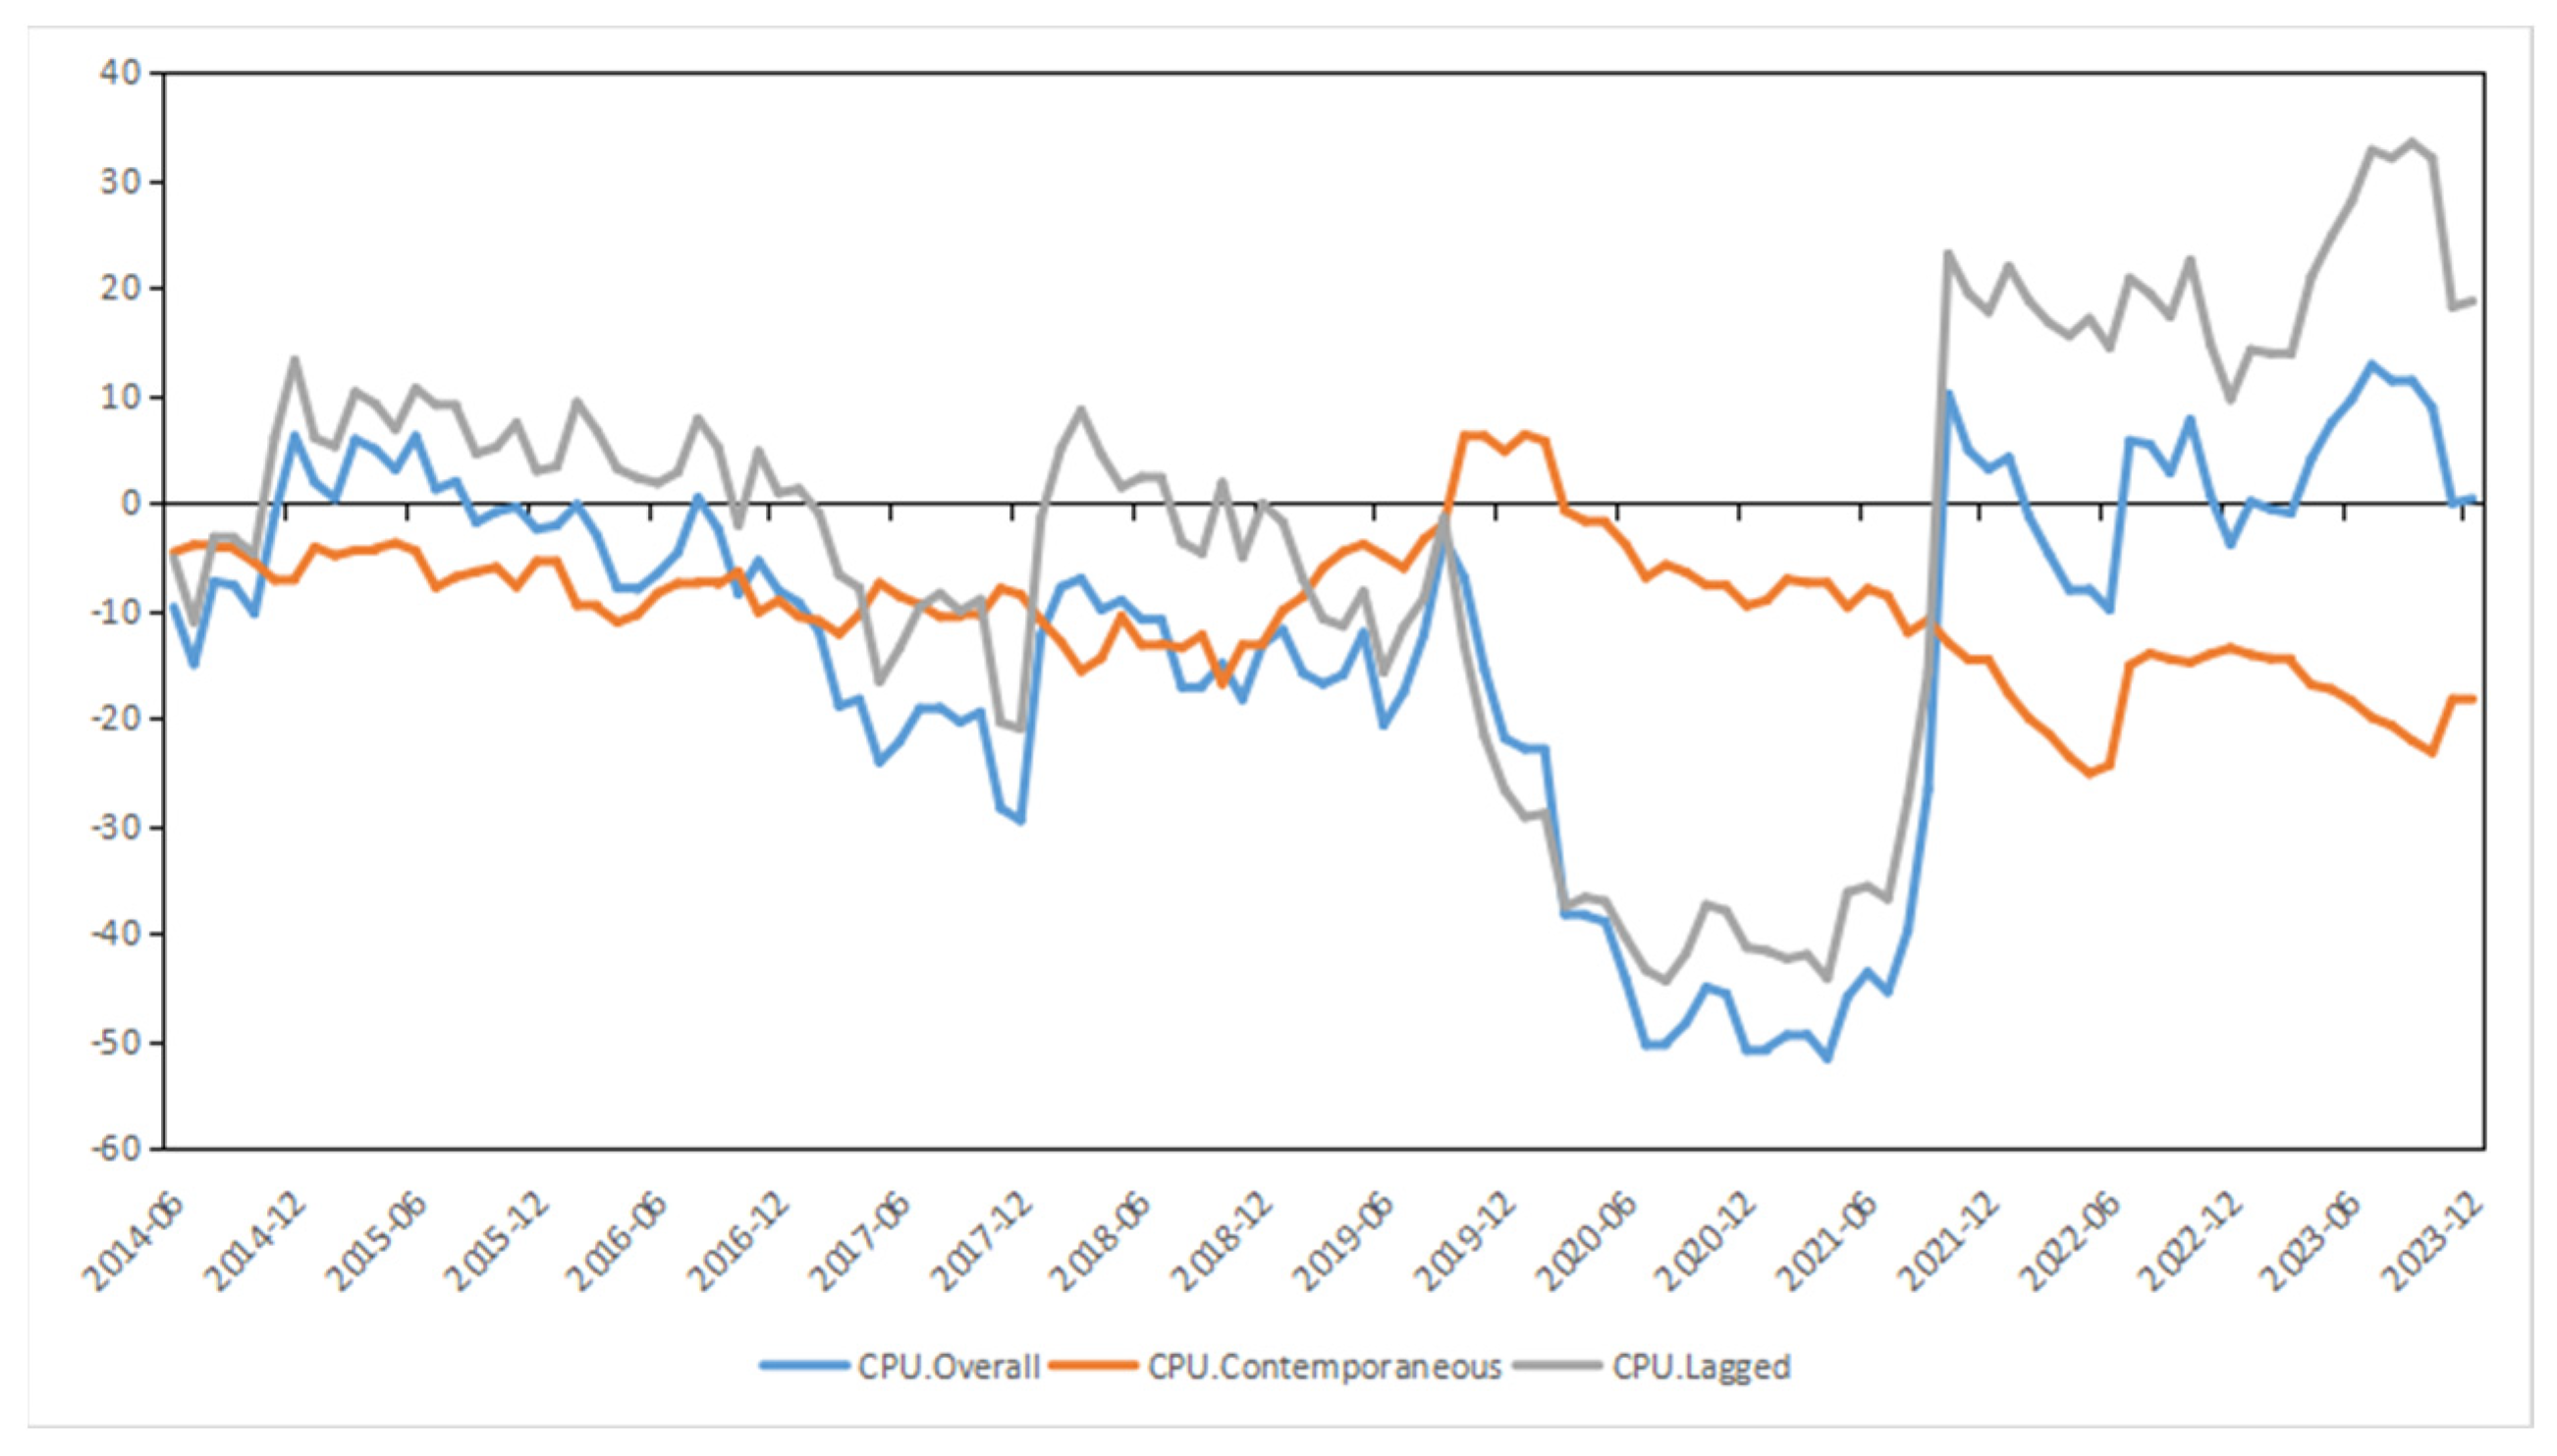
First, the dominance of contemporaneous effects indicates that immediate market dynamics have a significant impact on overall connectivity. Second, we detected asymmetry in shock transmission, with the Advanced Materials Index (AMI), Developer Index (DOI) and Energy Management Index (EMI) being the main shock transmitters and GCPRI, FCI, CPU, and GCTRI being the main receivers. Third, a special and nuanced function for climate risk perception exists in the dynamic process of market shock transmission. Similar spillover effects exist between GCTRI and GCPRI, as well as GCTC and GCPC, and the risk attention indices (GCTC and GCPC) significantly influence the transmission pathways of market risks. Finally, the connection metrics exhibit temporal variability, which is a result of the influence of economic events. This is especially noticeable during moments of global crises and technological progress.
In comparison with extant studies, this study addresses the limitations of existing static models (e.g., VAR) in the analysis of dynamic risk transmission mechanisms by introducing a time-varying network model and the R2 decomposition framework, with a particular emphasis on the interactive effects of climate risk perception and policy uncertainty. In comparison with traditional methods, this study not only distinguishes between simultaneous and lagged effects but also integrates the dynamic interaction of multidimensional risk factors.
However, there are some limitations to this study. It does not fully account for behavioral elements that could affect market behavior, because it mainly employs statistical models and quantitative indices to assess how climate risk perceptions affect renewable energy markets. Future research could incorporate a behavioral economics perspective to further explore the complex interplay between climate risk perceptions and market dynamics. Additionally, the study is limited by the geographic scope and period of the data. Future research could address these limitations by expanding the geographical range, including more diverse markets, and extending the period to encompass long-term trends. In the long run, this would assist in formulating better investment and policy strategies by further confirming the universality and stability of the study’s findings; it would also provide deeper insights into climate risk management and global clean energy investment.

6.2. Policy Recommendations

After a careful analysis of the connection between the clean energy market and climate risk perception, the following policy recommendations are made.
First, the standardization and implementation of climate risk assessment methods in the financial sector should be promoted. It is incumbent upon policymakers to fortify climate risk assessment and incorporate it into financial decision making, risk management practices, and financial information disclosure. This will make the financial system more resilient. The establishment of a unified climate risk assessment framework and a data-sharing platform is imperative to ensuring the consistency and reliability of assessment methodologies.
Second, intervention strategies must target both net transmitters and net receivers. It is imperative to identify and support the main net transmitters (the Advanced Materials Index (AMI), Developer Index (DOI) and Energy Management Index (EMI)) and net receivers (GCPRI, FCI, and CPU). The enhancement of their resilience to market shocks should be facilitated through the implementation of financial incentives, risk sharing mechanisms, or technical support. To this end, the implementation of tax credits for net senders or targeted loans for net receivers, with the aim of enhancing their resilience, is recommended.
Third, investment in clean energy infrastructure and innovative technologies should be encouraged. In order to reduce the adverse consequences of climate change and the risks associated with transition, governments should encourage investment in clean energy infrastructure, research, and development through tax breaks, subsidies, and public–private partnerships. For instance, tax credits and special funding can be made available for research and development of clean energy technologies.
Fourth, the formulation and implementation of adaptive economic policies is imperative. The introduction of flexible pricing mechanisms and long-term stable subsidy policies is recommended to promote the healthy development of the clean energy market. To enhance market efficiency, policymakers should consider the development of differentiated incentives based on the characteristics of different regions and industries. The establishment of a policy environment that encourages sustainable growth and investment in the clean energy sector is especially crucial during times of global crisis and technological transformation. One potential approach involves the establishment of a dedicated fund to support clean energy projects in affected regions, ensuring policy continuity and stability.

Author Contributions

D.Y.: writing—review and editing, supervision, resources, project administration, data curation, and conceptualization. S.L.: writing—review and editing, methodology, investigation, formal analysis, and data curation. J.Y.: writing—original draft, methodology, and formal analysis. All authors have read and agreed to the published version of the manuscript.

Funding

National Natural Science Foundation of China: (No. 72404038, No. 72203059); National Natural Science Foundation of Hunan Province: No. 2023JJ40336; Humanities and Social Science Project of the Ministry of Education: (No. 22YJCZH221, No. 22YJCZH078); Research Foundation of Education Bureau of Hunan Province (No. 21B0341).

Institutional Review Board Statement

Not applicable.

Informed Consent Statement

Not applicable.

Data Availability Statement

The datasets used and analyzed during the current study are available from the author on reasonable request.

Conflicts of Interest

The authors declare no conflicts of interest.

Appendix A. Datasets

Table A1. Detailed descriptions for each index.
Primary TypesIndicator NamesDefinitionsDescriptionsSources
Policy UncertaintyCPUThe Climate Policy Uncertainty IndexCPU is calculated as the relative frequency of articles related to climate policy uncertainty compared to the total number of articles per month.Guo et al. (2023) [18].
physical riskGCPCThe Global Climate Physical Concern IndexGCPC quantifies the level of public concern about physical risks, such as the density of media coverage of extreme weather events.Bua et al. (2024) [43].
GCPRIThe Global Climate Physical Risk IndexGCPRI quantifies the direct financial impacts of extreme weather events, such as damage to coastal infrastructure and disruptions in energy production, using data from climate databases and financial reports.Bua et al. (2024) [43].
transition riskGCTCThe Global Climate Transition Concern IndexGCTC reflects market concerns about transition risks, such as the fervor with which policy changes are discussed in the media.Bua et al. (2024) [43].
GCTRIThe Global Climate Transition Risk IndexGCTRI) measures risks arising from policy changes, technological innovation, and shifts in investor sentiment, drawing on policy announcements, patent filings, and market sentiment analyses.Bua et al. (2024) [43].
Table A2. Search terms for the climate transition risk and climate physical risk indices.
Index NameKeywords
Climate Physical Risk IndexRepresentative Concentration Pathway/Intergovernmental Panel on Climate Change/Sea Level Rise/Coupled Model Intercomparison Project/GreenHouse Gases/Summary for Policymakers/General Circulation Models/El Nino/Greenhouse gas Emissions/Millimeter per Year/Hadley Centre Coupled Model/Sea Surface Temperature/Representative Concentration Pathway scenarios/(El) Nino/Global Mean Sea Level/Net Primary Production/United Nations Framework Convention on Climate Change/GtCO2/Gigatonnes of carbon dioxide/El Nino Southern Oscillation
Climate Transition Risk IndexHydrofluorocarbon/Greenhouse gas/Hydrochlorofluorocarbon/Exajoules/Intergovernmental Panel on Climate Change/Exajoules per year/Greenhouse gas emissions/Gigatonne of carbon/Carbon dioxide Capture and Storage/Equivalent/Megatonne of carbon/Chlorofluorocarbon/Tonne of carbon/Photovoltaics/Product Carbon Footprints/Levelized cost of electricity/Gigajoules/Ozone-depleting substances/Technology and Economic Assessment Panel/United Nations Environment Programme/Intergovernmental Panel on Climate Change special/Kilowatt hours/United States Dollars/Kilowatt hours/Terawatt hours/year/Bioenergy with Carbon dioxide Capture and Storage/United Nations Framework Convention on Climate Change/Life cycle climate performance/Megatonne of carbon equivalent/Parts per million by volume/Technology and Economic Assessment Panel special/Equivalent per year/Enhanced Oil Recovery/Global Mean Surface Temperature/Integrated assessment models/Global Warming Potential or Gross World Product/Integrated Gasification Combined Cycle/Metered Dose Inhalers/United States Dollars/Gigajoules/Total Equivalent Warming Impact/World Energy Outlook/Sustainable Development Goals/Carbon dioxide Capture and Storage systems/International Energy Agency Greenhouse gas/Carbon dioxide removal/Chlorofluorocarbons Hydrochlorofluorocarbon/Representative Concentration Pathway/lifecycle Greenhouse gas/Agriculture, Forestry and Other Land Use/Gigatonne of carbon equivalent/Tonne of carbon equivalent/Life cycle assessment/Photovoltaic systems/Assesment Report/kiloton per year/Business As Usual/Lower heating value
The data presented in our tables are sourced from the website (https://www.policyuncertainty.com/climate_uncertainty.html, accessed on 10 April 2025), and our analysis is conducted following the robust methodology outlined by Guo et al. [18].
Table A3. Description of each variable.
VariableNMeanMinMaxVarianceS. DSkewnessKurtosisJB TestADF TestPP Test
GCTC1580.01−0.400.640.020.150.571.2119.29 ***−6.29 ***−172.76 ***
GCTRI158−12.87−1927.4017.9723,522.79153.37−12.31150.68157,457.38 ***−5.07 ***−156.52 ***
GCPC1580.01−0.460.760.020.150.593.1175.95 ***−5.6 ***−195.8 ***
GCPRI1580.09−43.0539.5436.516.04−0.4427.305050.61 ***−5.1 ***−163.72 ***
CPU1580.08−0.612.430.190.431.715.63295.63 ***−6.6 ***−195.27 ***
BCI1580.00−0.390.170.010.07−0.943.94130.41 ***−5 ***−101.84 ***
SI1580.01−0.260.200.010.08−0.25−0.011.74−4.04 ***−122.88 ***
WI1580.01−0.170.150.010.07−0.26−0.322.36−4.85 ***−108.78 ***
GI1580.00−0.330.270.000.07−0.395.16186.57 ***−6.51 ***−120.92 ***
FCI1580.00−0.360.550.020.140.711.5129.92 ***−3.81**−96.71 ***
DOI1580.00−0.170.120.000.04−0.772.1147.05 ***−5.38 ***−122.08 ***
ESI1580.00−0.190.170.000.06−0.150.301.32−4.18 ***−129.07 ***
SGI1580.01−0.270.140.000.05−1.145.45238.42 ***−5.25 ***−106.9 ***
GITI1580.01−0.200.110.000.05−0.771.9241.92 ***−5.06 ***−122.64 ***
EMI1580.01−0.270.130.000.05−1.164.74190.77 ***−5.69 ***−115.68 ***
AMI1580.00−0.260.170.000.06−0.923.2194.19 ***−4.83 ***−120.66 ***
(***) Denote significance at 1% significance level, while values in parentheses represent p-values.
Table A4. Averaged connectedness table for overall (contemporaneous, lagged) effect.
GCTCGCTRIGCPCGCPRICPUBCISIWIGIFCIDOIESISGIGITIEMIAMIFROM
GCTC6.64 (0,6.64)7.88 (5.67,2.21)35.92 (32.74,3.18)4.15 (0.9,3.25)5.61 (2.39,3.22)2.32 (1,1.32)2.03 (1.13,0.91)3.34 (1.38,1.97)2.63 (1.11,1.52)1.76 (0.82,0.93)2.64 (1.05,1.58)2.24 (1.15,1.09)2 (1.02,0.97)2.79 (1.7,1.09)2.28 (1.24,1.04)3.11 (1.76,1.35)80.69 (55.05,25.63)
GCTRI10.9 (6.13,4.77)0.91 (0,0.91)5.85 (3.15,2.71)3.28 (2.29,1)4.06 (1.21,2.85)5.88 (4.16,1.72)5.09 (2.91,2.17)4.64 (3.07,1.57)4.3 (2.9,1.41)3.28 (1.83,1.45)6.59 (5.19,1.4)5.56 (2.67,2.88)6.68 (5.3,1.38)6.34 (4.97,1.37)6.17 (4.31,1.86)5.69 (4.01,1.69)84.32 (54.08,30.23)
GCPC34.84 (30,4.84)5.42 (3.03,2.39)10.9 (0,10.9)3.6 (1.36,2.23)4.38 (2.29,2.09)3.06 (1.69,1.37)2.42 (1.37,1.05)2.59 (1.16,1.43)2.52 (1.19,1.33)2.37 (1.27,1.1)2.69 (1.17,1.53)3.22 (2.17,1.05)3.46 (1.74,1.71)2.84 (1.39,1.44)2.79 (1.63,1.16)2.85 (1.39,1.46)79.04 (52.86,26.18)
GCPRI4.82 (1.42,3.4)5.04 (2.99,2.05)4.66 (2.25,2.4)0.69 (0,0.69)12.74 (1.46,11.28)3.86 (2.68,1.18)3.56 (1.76,1.81)3.73 (2,1.73)4.8 (3.1,1.7)2.88 (1.48,1.4)4.7 (1.7,3)3.91 (2.13,1.78)4.02 (2.25,1.77)3.67 (1.65,2.01)3.22 (1.78,1.44)4.02 (2.2,1.82)69.64 (30.86,38.78)
CPU5.94 (3.17,2.77)3.64 (1.41,2.24)4.9 (3.38,1.52)4.35 (1.56,2.79)10.96 (0,10.96)5.34 (1.51,3.83)3.93 (2.49,1.44)4.57 (2.73,1.85)3.61 (1.34,2.27)3.92 (2.17,1.75)4.6 (2.74,1.86)6.51 (2.64,3.87)3.48 (1.71,1.77)5.17 (2.02,3.15)4.1 (1.89,2.21)5.19 (2.14,3.04)69.24 (32.87,36.37)
BCI2.41 (0.94,1.47)4.78 (3.74,1.04)4.04 (1.49,2.55)3.48 (1.64,1.83)2.68 (0.96,1.72)2.51 (0,2.51)5.68 (4.12,1.55)5.34 (3.77,1.56)6.36 (5.13,1.23)5.82 (4.5,1.32)5.81 (4.63,1.18)11.54 (9.43,2.11)8.77 (6.48,2.28)5.07 (3.68,1.39)7.25 (5.56,1.69)7.76 (4.9,2.85)86.78 (60.99,25.79)
SI1.65 (0.87,0.78)3.57 (2.44,1.13)2.15 (1.2,0.95)2.4 (0.91,1.5)3.24 (1.7,1.54)5.17 (4.07,1.11)2.11 (0,2.11)11.41 (9.65,1.76)5.85 (4.35,1.5)7.72 (5.84,1.88)6.65 (5.35,1.3)8.26 (6.6,1.65)6.95 (5.54,1.4)6.23 (4.82,1.41)7.49 (5.69,1.8)8.08 (5.99,2.09)86.82 (65.03,21.79)
WI1.83 (1.16,0.68)3.59 (2.55,1.04)1.82 (1.03,0.79)2.34 (1.1,1.25)3.7 (1.87,1.84)5.73 (3.85,1.88)11.28 (9.95,1.34)2.15 (0,2.15)5.14 (3.37,1.77)3.98 (3.12,0.87)16.87 (15.41,1.46)7.07 (5.22,1.85)6.99 (5.73,1.26)5 (4.12,0.88)6.38 (4.99,1.39)6.18 (4.78,1.4)87.92 (68.24,19.68)
GI3.6 (1.15,2.45)5.39 (2.66,2.73)2.36 (1.21,1.15)4.46 (2.3,2.16)1.68 (0.94,0.74)6.96 (5.43,1.54)6.33 (4.61,1.72)6.43 (3.55,2.88)2.09 (0,2.09)6.62 (5.58,1.04)8.85 (6.72,2.13)6.13 (4.58,1.55)5.96 (4.52,1.44)4.56 (3.33,1.23)6.18 (4.06,2.12)5.37 (2.96,2.41)80.9 (53.6,27.3)
FCI2.63 (0.98,1.66)3.22 (1.69,1.54)4.57 (1.53,3.05)2.8 (1.06,1.74)4.67 (1.85,2.82)6.16 (4.77,1.39)8.12 (6.24,1.88)5.41 (3.21,2.19)8.04 (5.4,2.64)1.72 (0,1.72)8.75 (5.26,3.49)8.7 (7.16,1.54)6.11 (4.51,1.59)4.13 (2.85,1.28)4.83 (3.36,1.47)5.05 (2.75,2.3)83.19 (52.61,30.57)
DOI1.85 (0.9,0.95)5.37 (4.51,0.86)2.5 (1.09,1.41)1.99 (0.88,1.12)3.21 (2.04,1.16)5.63 (4.59,1.04)8.15 (5.48,2.67)16.72 (15.64,1.08)7.36 (6.45,0.9)5.74 (4.9,0.84)0.91 (0,0.91)4.31 (3.28,1.03)7.43 (6.36,1.07)5.36 (4,1.36)5.93 (4.77,1.16)6.85 (5.75,1.1)88.4 (70.64,17.75)
ESI2.55 (0.96,1.58)2.78 (2.06,0.72)3.66 (1.98,1.67)2.46 (1.05,1.4)2.94 (1.66,1.28)10.52 (9.34,1.18)8.09 (6.52,1.58)6.78 (5.25,1.53)5.24 (4.04,1.19)8.17 (6.87,1.3)4.5 (3.24,1.26)1.71 (0,1.71)6.9 (5.9,1)6.93 (5.24,1.69)10 (8.92,1.08)8.38 (7.18,1.2)89.87 (70.21,19.66)
SGI1.43 (0.62,0.81)5.6 (4.69,0.91)2.32 (1.4,0.92)2.23 (1.15,1.08)1.76 (0.86,0.91)7.68 (6.46,1.22)6.74 (5.59,1.15)6.41 (5.28,1.13)5.11 (3.79,1.32)5.12 (4.17,0.95)7.56 (6.36,1.2)7.31 (5.97,1.34)1.53 (0,1.53)8.14 (7.13,1.01)14.58 (13.4,1.17)9.94 (8.16,1.78)91.93 (75.04,16.89)
GITI4.01 (1.76,2.25)6.26 (4.5,1.76)3.22 (1.44,1.78)2.59 (0.9,1.69)2.06 (1.5,0.57)5.6 (3.83,1.77)7.52 (5.07,2.45)5.75 (4.13,1.61)4.14 (3.13,1.01)4.01 (2.61,1.4)5.62 (3.98,1.64)6.75 (5.58,1.17)8.61 (7.28,1.32)1.78 (0,1.78)12.31 (10.83,1.48)9.12 (7.83,1.29)87.58 (64.38,23.2)
EMI1.44 (0.82,0.62)4.23 (3.54,0.68)1.91 (1.29,0.62)2.17 (0.76,1.42)1.54 (0.98,0.57)6.74 (5.59,1.14)6.93 (5.7,1.24)6.02 (4.65,1.37)4.51 (3.56,0.95)3.51 (2.95,0.56)6.32 (4.73,1.59)10.04 (9.18,0.86)14.4 (13.52,0.88)11.67 (10.79,0.88)0.88 (0,0.88)11.94 (11.15,0.78)93.35 (79.2,14.15)
AMI2.34 (1.53,0.81)5.41 (3.43,1.98)2.42 (1.25,1.17)2.13 (1.33,0.8)2.22 (1.49,0.74)6.14 (4.96,1.18)8.02 (6.06,1.96)5.71 (4.54,1.17)3.56 (2.58,0.99)3.37 (2.44,0.93)7.04 (5.82,1.22)8.87 (7.42,1.45)9.45 (8.39,1.06)8.97 (7.73,1.24)12.61 (11.41,1.2)1.44 (0,1.44)88.27 (70.36,17.91)
TO82.25 (52.39,29.86)72.18 (48.9,23.28)82.29 (56.43,25.86)44.43 (19.18,25.25)56.51 (23.19,33.32)86.8 (63.94,22.86)93.9 (68.99,24.92)94.85 (70.02,24.83)73.15 (51.44,21.71)68.27 (50.55,17.72)99.18 (73.33,25.85)100.41 (75.19,25.22)101.2 (80.27,20.93)86.86 (65.43,21.43)106.14 (83.84,22.3)99.51 (72.96,26.55)1347.93 (956.03,391.9)
NET1.56 (−2.66,4.22)−12.14 (−5.19,−6.95)3.25 (3.57,−0.32)−25.21 (−11.68,−13.52)−12.74 (−9.68,−3.05)0.03 (2.95,−2.93)7.08 (3.96,3.13)6.93 (1.78,5.15)−7.75 (−2.16,−5.59)−14.91 (−2.06,−12.85)10.78 (2.69,8.1)10.54 (4.98,5.56)9.27 (5.24,4.03)−0.72 (1.05,−1.77)12.78 (4.63,8.15)11.24 (2.59,8.64)89.86/84.25 (59.75,24.49)

References

  1. Intergovernmental Panel On Climate Change (IPCC). Climate Change 2021–The Physical Science Basis: Working Group I Contribution to the Sixth Assessment Report of the Intergovernmental Panel on Climate Change, 1st ed.; Cambridge University Press: Cambridge, UK, 2023. [Google Scholar] [CrossRef]
  2. Lee, C.-C.; Wang, T. The Impact of Renewable Energy Policies on the Energy Transition—An Empirical Analysis of Chinese Cities. Energy Econ. 2024, 138, 107838. [Google Scholar] [CrossRef]
  3. Iyke, B.N. Climate Change, Energy Security Risk, and Clean Energy Investment. Energy Econ. 2024, 129, 107225. [Google Scholar] [CrossRef]
  4. Ida, T.; Ushifusa, Y. Behavioral Economics and Its Applications for Energy Consumption. In Present and Future of Evolutionary Economics; Yagi, K., Shiozawa, Y., Aruka, Y., Nishibe, M., Isogai, A., Eds.; Evolutionary Economics and Social Complexity Science; Springer Nature: Singapore, 2024; Volume 31, pp. 169–183. [Google Scholar]
  5. Bradley, G.L.; Babutsidze, Z.; Chai, A.; Reser, J.P. The Role of Climate Change Risk Perception, Response Efficacy, and Psychological Adaptation in pro-Environmental Behavior: A Two Nation Study. J. Environ. Psychol. 2020, 68, 101410. [Google Scholar] [CrossRef]
  6. UNFCCC. United Nations Framework Convention on Climate Change (UNFCCC); UNFCCC Secretariat: Bonn, Germany, 1992. [Google Scholar]
  7. UNFCCC. Kyoto Protocol to the United Nations Framework Convention on Climate Change; United Nations Framework Convention on Climate Change (UNFCCC) Legal Instruments; UNFCCC Secretariat: Kyoto, Japan, 1997. [Google Scholar]
  8. Parties to the Paris Agreement. Paris Agreement under the United Nations Framework Convention on Climate Change; UNFCCC Secretariat: New York, NA, USA, 2015. [Google Scholar]
  9. IPCC. Global Warming of 1.5 °C: An IPCC Special Report on the Impacts of Global Warming of 1.5 °C Above Pre-Industrial Levels and Related Global Greenhouse Gas Emission Pathways, in the Context of Strengthening the Global Response to the Threat of Climate Change, Sustainable Development, and Efforts to Eradicate Poverty; IPCC Special Reports; IPCC: Geneva, Switzerland, 2018. [Google Scholar]
  10. Meneses Cerón, L.Á.; Van Klyton, A.; Rojas, A.; Muñoz, J. Climate Risk and Its Impact on the Cost of Capital—A Systematic Literature Review. Sustainability 2024, 16, 10727. [Google Scholar] [CrossRef]
  11. Liu, J.; Julaiti, J.; Gou, S. Decomposing Interconnectedness: A Study of Cryptocurrency Spillover Effects in Global Financial Markets. Financ. Res. Lett. 2024, 61, 104950. [Google Scholar] [CrossRef]
  12. Solomon, D.H. Selective Publicity and Stock Prices. J. Financ. 2012, 67, 599–638. [Google Scholar] [CrossRef]
  13. Perera, A.T.D.; Nik, V.M.; Chen, D.; Scartezzini, J.-L.; Hong, T. Quantifying the Impacts of Climate Change and Extreme Climate Events on Energy Systems. Nat. Energy 2020, 5, 150–159. [Google Scholar] [CrossRef]
  14. Yalew, S.G.; Van Vliet, M.T.H.; Gernaat, D.E.H.J.; Ludwig, F.; Miara, A.; Park, C.; Byers, E.; De Cian, E.; Piontek, F.; Iyer, G.; et al. Impacts of Climate Change on Energy Systems in Global and Regional Scenarios. Nat. Energy 2020, 5, 794–802. [Google Scholar] [CrossRef]
  15. Flori, A. Commodity Prices Co-Movements and Financial Stability: A Multidimensional Visibility Nexus with Climate Conditions. J. Financ. Stab. 2021, 54, 100876. [Google Scholar] [CrossRef]
  16. Sautner, Z.; Van Lent, L.; Vilkov, G.; Zhang, R. Firm-Level Climate Change Exposure. J. Financ. 2023, 78, 1449–1498. [Google Scholar] [CrossRef]
  17. Giglio, S.; Kelly, B.T.; Stroebel, J. Climate Finance; National Bureau of Economic Research: Cambridge, MA, USA, 2020. [Google Scholar]
  18. Guo, K.; Li, Y.; Zhang, Y.; Ji, Q.; Zhao, W. How Are Climate Risk Shocks Connected to Agricultural Markets? J. Commod. Mark. 2023, 32, 100367. [Google Scholar] [CrossRef]
  19. Gong, X.; Liao, Q. Physical Climate Risk Attention and Dynamic Volatility Connectedness among New Energy Stocks. Energy Econ. 2024, 136, 107711. [Google Scholar] [CrossRef]
  20. Nordhaus, W.D. Economic Growth and Climate: The Carbon Dioxide Problem. Am. Econ. Rev. 1977, 67, 341–346. [Google Scholar]
  21. Newman, R.; Noy, I. The Global Costs of Extreme Weather That Are Attributable to Climate Change. Nat. Commun. 2023, 14, 6103. [Google Scholar] [CrossRef]
  22. Pham, L. Do All Clean Energy Stocks Respond Homogeneously to Oil Price? Energy Econ. 2019, 81, 355–379. [Google Scholar] [CrossRef]
  23. Venturini, A. Climate Change, Risk Factors and Stock Returns: A Review of the Literature. Int. Rev. Financ. Anal. 2022, 79, 101934. [Google Scholar] [CrossRef]
  24. Shen, Y.; Sun, X.; Ji, Q.; Zhang, D. Climate Events Matter in the Global Natural Gas Market. Energy Econ. 2023, 125, 106887. [Google Scholar] [CrossRef]
  25. Dong, F.; Li, Z.; Huang, Z.; Liu, Y. Extreme Weather, Policy Uncertainty, and Risk Spillovers between Energy, Financial, and Carbon Markets. Energy Econ. 2024, 137, 107761. [Google Scholar] [CrossRef]
  26. Dutta, A. Climate Risk and Green Investments: New Evidence. Energy 2023, 265, 126376. [Google Scholar] [CrossRef]
  27. Lee, C.-C.; Song, H.; An, J. The Impact of Green Finance on Energy Transition: Does Climate Risk Matter? Energy Econ. 2024, 129, 107258. [Google Scholar] [CrossRef]
  28. Diebold, F.X.; Yilmaz, K. Better to Give than to Receive: Predictive Directional Measurement of Volatility Spillovers. Int. J. Forecast. 2012, 28, 57–66. [Google Scholar] [CrossRef]
  29. Diebold, F.X.; Yılmaz, K. On the Network Topology of Variance Decompositions: Measuring the Connectedness of Financial Firms. J. Econom. 2014, 182, 119–134. [Google Scholar] [CrossRef]
  30. Demirer, M.; Diebold, F.X.; Liu, L.; Yilmaz, K. Estimating Global Bank Network Connectedness. J. Appl. Econom. 2018, 33, 1–15. [Google Scholar] [CrossRef]
  31. Antonakakis, N.; Chatziantoniou, I.; Gabauer, D. Refined Measures of Dynamic Connectedness Based on Time-Varying Parameter Vector Autoregressions. J. Risk Financ. Manag. 2020, 13, 84. [Google Scholar] [CrossRef]
  32. Gabauer, D. Dynamic Measures of Asymmetric & Pairwise Connectedness within an Optimal Currency Area: Evidence from the ERM I System. J. Multinatl. Financ. Manag. 2021, 60, 100680. [Google Scholar]
  33. Gabauer, D.; Chatziantoniou, I.; Stenfors, A. Model-Free Connectedness Measures. Financ. Res. Lett. 2023, 54, 103804. [Google Scholar] [CrossRef]
  34. Baur, D.G.; Hoang, L.T. The Importance of Spillovers. SSRN 2021. [CrossRef]
  35. Zhang, X.; Yang, X.; Li, J.; Hao, J. Contemporaneous and noncontemporaneous idiosyncratic risk spillovers in commodity futures markets: A novel network topology approach. J. Futures Mark. 2023, 43, 705–733. [Google Scholar] [CrossRef]
  36. Balli, F.; Balli, H.O.; Dang, T.H.N.; Gabauer, D. Contemporaneous and Lagged R 2 Decomposed Connectedness Approach: New Evidence from the Energy Futures Market. Financ. Res. Lett. 2023, 57, 104168. [Google Scholar] [CrossRef]
  37. Wu, R.; Liu, B.-Y. Do Climate Policy Uncertainty and Investor Sentiment Drive the Dynamic Spillovers among Green Finance Markets? J. Environ. Manag. 2023, 347, 119008. [Google Scholar] [CrossRef]
  38. Ren, X.; Xiao, Y.; Duan, K.; Urquhart, A. Spillover Effects between Fossil Energy and Green Markets: Evidence from Informational Inefficiency. Energy Econ. 2024, 131, 107317. [Google Scholar] [CrossRef]
  39. Chen, Y.; Feng, A.; Mi, J.J. Does Climate Policy Uncertainty Drive the Extreme Spillovers of Carbon-Energy-Shipping Markets? J. Environ. Manag. 2024, 366, 121737. [Google Scholar] [CrossRef] [PubMed]
  40. Xu, W.; Ma, F.; Chen, W.; Zhang, B. Asymmetric Volatility Spillovers between Oil and Stock Markets: Evidence from China and the United States. Energy Econ. 2019, 80, 310–320. [Google Scholar] [CrossRef]
  41. Yu, L.; Zha, R.; Stafylas, D.; He, K.; Liu, J. Dependences and Volatility Spillovers between the Oil and Stock Markets: New Evidence from the Copula and VAR-BEKK-GARCH Models. Int. Rev. Financ. Anal. 2020, 68, 101280. [Google Scholar] [CrossRef]
  42. He, Z.; Dong, T.; Qian, W.; Xu, W. Dynamic Interactions among Trade Policy Uncertainty, Climate Policy Uncertainty, and Crude Oil Prices. Int. Rev. Econ. Financ. 2024, 95, 103479. [Google Scholar] [CrossRef]
  43. Bua, G.; Kapp, D.; Ramella, F.; Rognone, L. Transition versus Physical Climate Risk Pricing in European Financial Markets: A Text-Based Approach. Eur. J. Financ. 2024, 30, 2076–2110. [Google Scholar] [CrossRef]
  44. Hassan, Q.; Viktor, P.; Al-Musawi, T.J.; Mahmood Ali, B.; Algburi, S.; Alzoubi, H.M.; Khudhair Al-Jiboory, A.; Zuhair Sameen, A.; Salman, H.M.; Jaszczur, M. The Renewable Energy Role in the Global Energy Transformations. Renew. Energy Focus 2024, 48, 100545. [Google Scholar] [CrossRef]
  45. Kou, M. Energy Finance Research: What Happens beneath the Literature? Int. Rev. Financ. Anal. 2024, 95, 103402. [Google Scholar] [CrossRef]
  46. Koop, G.; Pesaran, M.H.; Potter, S.M. Impulse Response Analysis in Nonlinear Multivariate Models. J. Econom. 1996, 74, 119–147. [Google Scholar] [CrossRef]
  47. Pesaran, H.H.; Shin, Y. Generalized Impulse Response Analysis in Linear Multivariate Models. Econ. Lett. 1998, 58, 17–29. [Google Scholar] [CrossRef]
  48. Ottonelli, J.; Lazaro, L.L.B.; Andrade, J.C.S.; Abram, S. Do Solar Photovoltaic Clean Development Mechanism Projects Contribute to Sustainable Development in Latin America? Prospects for the Paris Agreement. Energy Policy 2023, 174, 113428. [Google Scholar] [CrossRef]
  49. Wang, F.; Mbanyele, W.; Muchenje, L. Economic Policy Uncertainty and Stock Liquidity: The Mitigating Effect of Information Disclosure. Res. Int. Bus. Financ. 2022, 59, 101553. [Google Scholar] [CrossRef]
  50. Mohammed, K.S.; Obeid, H.; Oueslati, K.; Kaabia, O. Investor Sentiments, Economic Policy Uncertainty, US Interest Rates, and Financial Assets: Examining Their Interdependence over Time. Financ. Res. Lett. 2023, 57, 104180. [Google Scholar] [CrossRef]
  51. Tong, C.; Huang, Z.; Wang, T.; Zhang, C. The Effects of Economic Uncertainty on Financial Volatility: A Comprehensive Investigation. J. Empir. Financ. 2023, 73, 369–389. [Google Scholar] [CrossRef]
Figure 1. Percentage changes of climate risks.
Sustainability 17 03596 g001
Figure 2. Price fluctuations of clean energy markets during the period 2010–2024.
Sustainability 17 03596 g002
Figure 3. Overall total dynamic connectedness.
Sustainability 17 03596 g003
Figure 4. Dynamic contemporaneous and lagged connectedness.
Sustainability 17 03596 g004
Figure 5. The time-varying overall, contemporaneous, and lagged TO connectedness measures between GCTC and GCPC.
Sustainability 17 03596 g005
Figure 6. The time-varying overall, contemporaneous, and lagged FROM connectedness measures between GCTC and GCPC.
Sustainability 17 03596 g006
Figure 7. The time-varying overall, contemporaneous, and lagged NET connectedness measures between GCTC and GCPC.
Sustainability 17 03596 g007
Figure 8. The time-varying overall, contemporaneous, and lagged TO connectedness measures between GCTRI and GCPRI.
Sustainability 17 03596 g008
Figure 9. The time-varying overall, contemporaneous, and lagged FROM connectedness measures between GCTRI and GCPRI.
Sustainability 17 03596 g009
Figure 10. The time-varying overall, contemporaneous, and lagged NET connectedness measures between GCTRI and GCPRI.
Sustainability 17 03596 g010
Figure 11. The overall, contemporaneous, and lagged TO connectedness measures (based on CPU).
Sustainability 17 03596 g011
Figure 12. The overall, contemporaneous, and lagged FROM connectedness measures (based on CPU).
Sustainability 17 03596 g012
Figure 13. The overall, contemporaneous, and lagged NET connectedness measures (based on CPU).
Sustainability 17 03596 g013
Figure 14. The overflow network diagram of net spillovers from overall, contemporaneous, and lagged effects.
Sustainability 17 03596 g014
Table 1. The interconnectedness between climate risk perceptions and clean energy stock markets (based on GCTC and GCPC).
Rank (Overall)MarketsGCTC TOMarketsGCPC TOMarketsGCTC FROMMarketsGCPC FROMMarketsGCTC NETMarketsGCPC NET
1GCPC34.84GCTC35.92GCPC35.92GCTC34.84GCTRI3.02FCI2.2
2GCTRI10.9GCTRI5.85GCTRI7.88GCTRI5.42GITI1.37GCTC1.08
3CPU5.94CPU4.9CPU5.61CPU4.38GI0.81GCPRI1.06
4GCPRI4.82GCPRI4.66GCPRI4.15GCPRI3.6ESI0.79BCI0.98
5GITI4.01FCI4.57SI3.34SGI3.46GCPRI0.67CPU0.52
6GI3.6BCI4.04BCI3.11ESI3.22CPU0.33ESI0.44
7FCI2.63ESI3.66GI2.79BCI3.06FCI0.31GCTRI0.43
8ESI2.55GITI3.22GITI2.64AMI2.85DOI−0.15GITI0.38
9BCI2.41DOI2.5AMI2.63GITI2.84AMI−0.29GI−0.16
10AMI2.34AMI2.42FCI2.32EMI2.79WI−0.45DOI−0.19
11DOI1.85GI2.36WI2.28DOI2.69SGI−0.6SI−0.27
12WI1.83SGI2.32EMI2.24WI2.59BCI−0.7AMI−0.43
13SI1.65SI2.15SGI2.03GI2.52EMI−0.8WI−0.77
14EMI1.44EMI1.91DOI2SI2.42GCPC−1.08EMI−0.88
15SGI1.43WI1.82ESI1.76FCI2.37SI−1.69SGI−1.14
Table 2. The ranks for the difference between contemporaneous and lagged connectedness measures (based on GCTC and GCPC).
RankCPTC TOC-LGCPC TOC-LCPTC FROMC-LGCPC FROMC-L
1GCPRI−1.98FCI−1.52GCPRI−2.35GCTC−6.64
2GI−1.3BCI−1.06CPU−0.83GCPRI−2.35
3FCI−0.68GITI−0.34WI−0.59CPU−0.83
4ESI−0.62DOI−0.32DOI−0.53WI−0.59
5BCI−0.53GCPRI−0.15GI−0.41DOI−0.53
6GITI−0.49GI0.06BCI−0.32GI−0.41
7SGI−0.19AMI0.08FCI−0.11BCI−0.32
8DOI−0.05WI0.24SGI0.05FCI−0.11
9SI0.09SI0.25ESI0.06SGI0.05
10EMI0.2ESI0.31EMI0.2ESI0.06
11CPU0.4GCTRI0.44SI0.22EMI0.2
12WI0.48SGI0.48AMI0.41SI0.22
13AMI0.72EMI0.67GITI0.61AMI0.41
14GCTRI1.36CPU1.86GCTRI3.46GITI0.61
15GCPC25.16GCTC29.56GCPC29.56GCTRI3.46
Table 3. The interconnectedness between climate risk perceptions and clean energy stock markets (based on GCTRI and GCPRI).
Rank (Overall)MarketsGCTRI TOMarketsGCPRI TOMarketsGCTRI FROMMarketsGCPRI FROMMarketsGCTRI NETMarketsGCPRI NET
1GCTC7.88GI4.46GCTC10.9CPU12.74GCPRI1.76FCI−0.08
2GITI6.26CPU4.35SGI6.68GCTRI5.04GI1.09GI−0.34
3SGI5.6GCTC4.15DOI6.59GCTC4.82FCI−0.06BCI−0.38
4GCPC5.42GCPC3.6GITI6.34GI4.8GITI−0.08GCTC−0.67
5AMI5.41BCI3.48EMI6.17DOI4.7AMI−0.28EMI−1.05
6GI5.39GCTRI3.28BCI5.88GCPC4.66CPU−0.42GCPC−1.06
7DOI5.37FCI2.8GCPC5.85SGI4.02GCPC−0.43GITI−1.08
8GCPRI5.04GITI2.59AMI5.69AMI4.02WI−1.05SI−1.16
9BCI4.78ESI2.46ESI5.56ESI3.91SGI−1.08WI−1.39
10EMI4.23SI2.4SI5.09BCI3.86BCI−1.1ESI−1.45
11CPU3.64WI2.34WI4.64WI3.73DOI−1.22GCTRI−1.76
12WI3.59SGI2.23GI4.3GITI3.67SI−1.52SGI−1.79
13SI3.57EMI2.17CPU4.06SI3.56EMI−1.94AMI−1.89
14FCI3.22AMI2.13GCPRI3.28EMI3.22ESI−2.78DOI−2.71
15ESI2.78DOI1.99FCI3.28FCI2.88GCTC−3.02CPU−8.39
Table 4. The ranks for the difference between contemporaneous and lagged connectedness measures (based on GCTRI and GCPRI).
RankCPTRI TOC-LGCPRI TOC-LCPTRI FROMC-LGCPRI FROMC-L
1CPU−1.38GCTC−2.35GCTC−6.64CPU−9.82
2FCI−0.05CPU−1.23GCPRI−2.35GCTC−1.98
3GI0.5GCPC−0.87CPU−0.83DOI−1.3
4ESI0.66GITI−0.79WI−0.59GITI−0.36
5GCPC0.8FCI−0.68DOI−0.53GCPC−0.15
6SI0.94EMI−0.66GI−0.41SI−0.05
7WI1.3SI−0.59BCI−0.32FCI0.08
8BCI1.91ESI−0.35FCI−0.11WI0.27
9EMI2.12DOI−0.24SGI0.05EMI0.34
10GCPRI2.3BCI−0.19ESI0.06ESI0.35
11GCTC2.42WI−0.15EMI0.2AMI0.38
12AMI2.63SGI0.07SI0.22SGI0.48
13GITI2.81GI0.14AMI0.41GCTRI0.94
14DOI3.39AMI0.53GITI0.61GI1.4
15SGI3.61GCTRI1.29GCPC29.56BCI1.5
Disclaimer/Publisher’s Note: The statements, opinions and data contained in all publications are solely those of the individual author(s) and contributor(s) and not of MDPI and/or the editor(s). MDPI and/or the editor(s) disclaim responsibility for any injury to people or property resulting from any ideas, methods, instructions or products referred to in the content.

